Embed Size (px)
Citation preview

Delocation and European Integration: Is Structural
Spending Justified?
Henry Overman
LSE
8th June 2004

Outline
1. Scenarios for development of the EU’s economic geography
2. The role of policy• Evidence• Conjecture
• Transport infrastructure• State aids
3. Lessons for policy

Part 1
The Economic Geographyof the EU
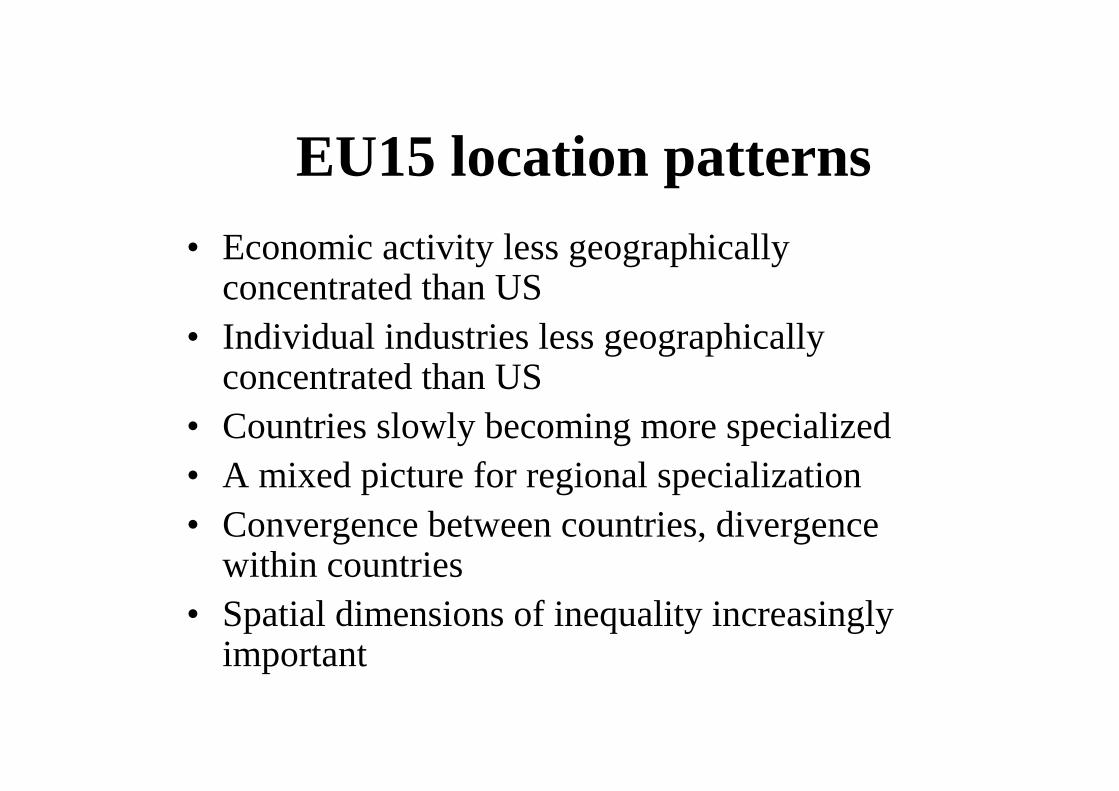
EU15 location patterns• Economic activity less geographically
concentrated than US• Individual industries less geographically
concentrated than US• Countries slowly becoming more specialized• A mixed picture for regional specialization• Convergence between countries, divergence
within countries• Spatial dimensions of inequality increasingly
important
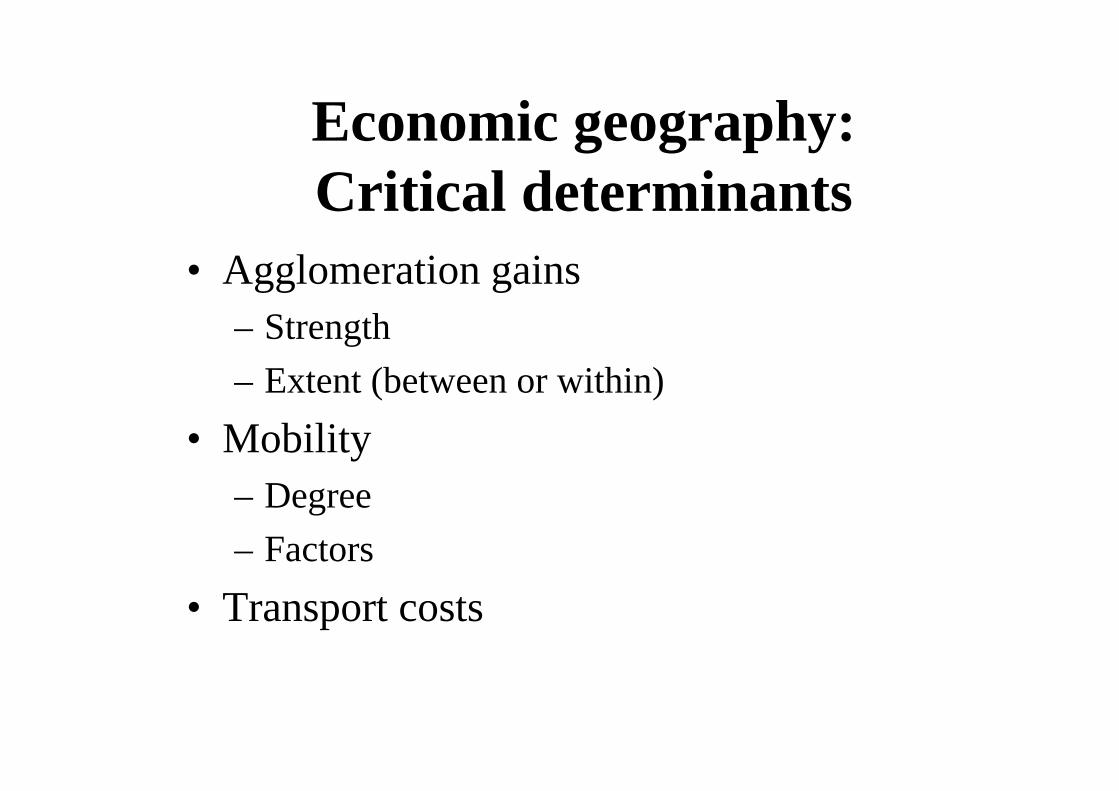
Economic geography:Critical determinants
• Agglomeration gains– Strength
– Extent (between or within)
• Mobility– Degree
– Factors
• Transport costs
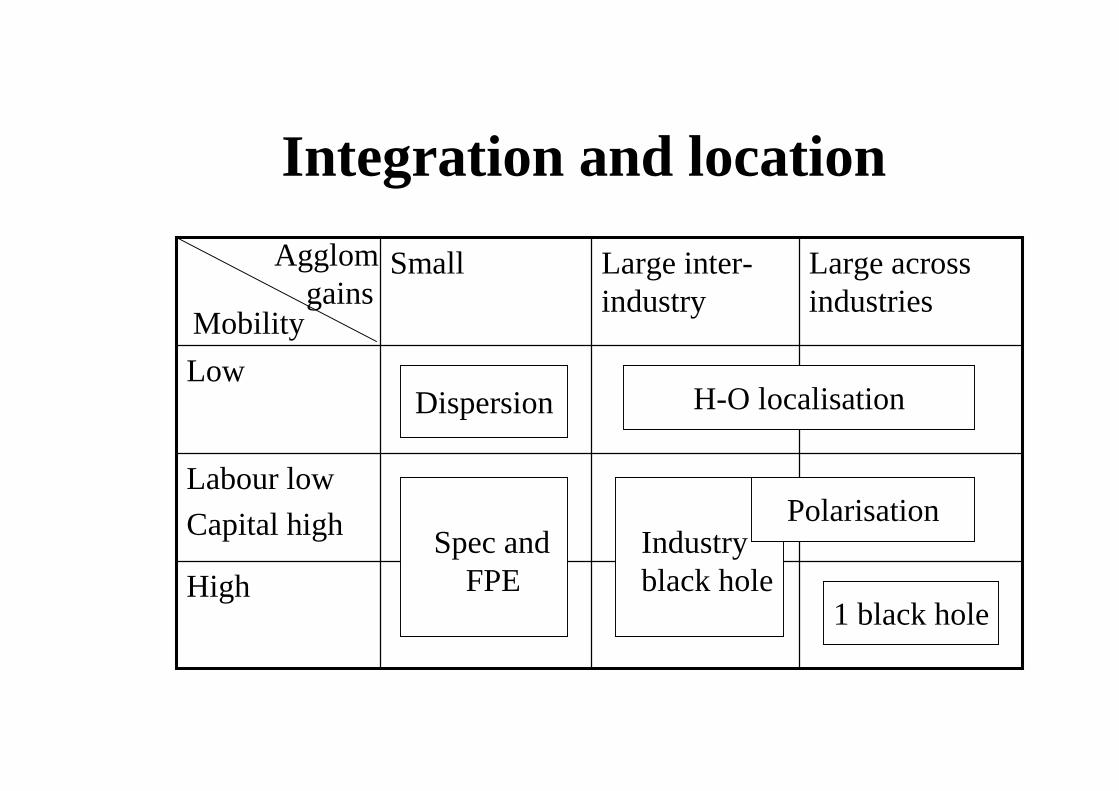
Integration and location
High
Labour low
Capital high
Low
Large across industries
Large inter-industry
SmallAgglomgains
Mobility
Spec andFPE
H-O localisationDispersion
Industryblack hole
Polarisation
1 black hole
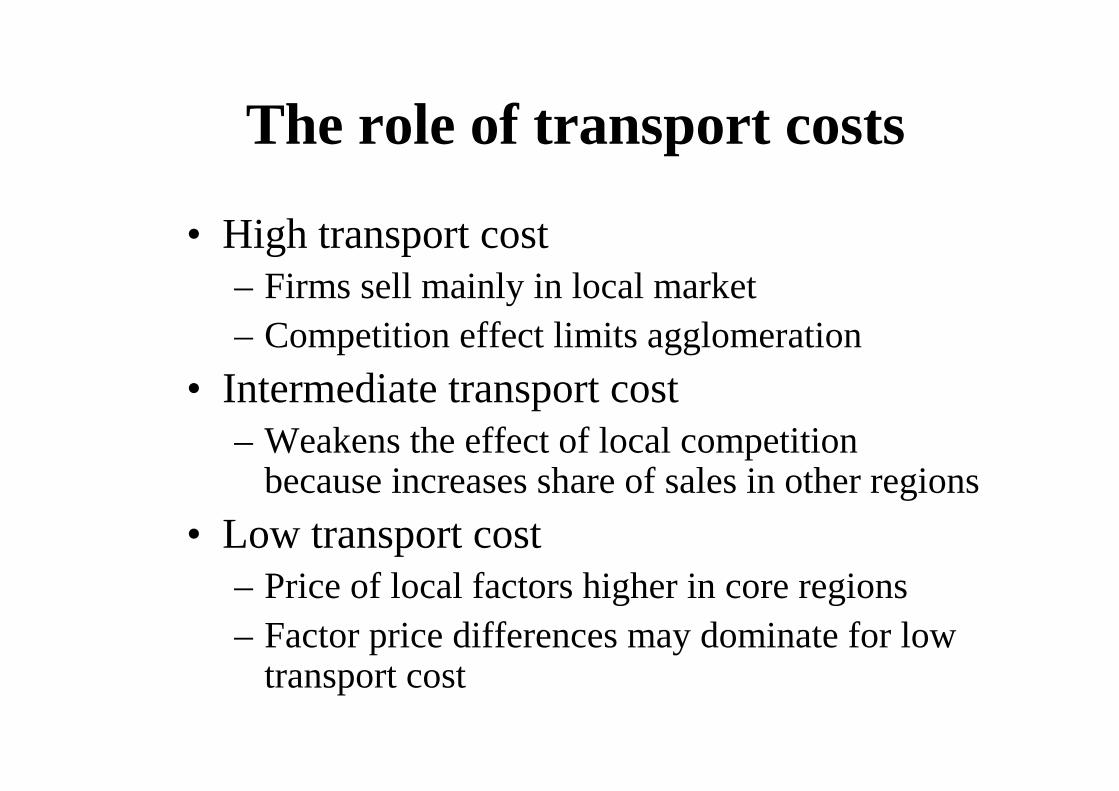
The role of transport costs
• High transport cost– Firms sell mainly in local market– Competition effect limits agglomeration
• Intermediate transport cost– Weakens the effect of local competition
because increases share of sales in other regions
• Low transport cost– Price of local factors higher in core regions– Factor price differences may dominate for low
transport cost

Part 2
The role of policy: evidence & conjecture

The returns to development funds
• Some evidence of differing returns for different types of EU expenditures– Infrastructure returns small
– Business support returns small
– Investment in education and human capital has medium term positive significant effects
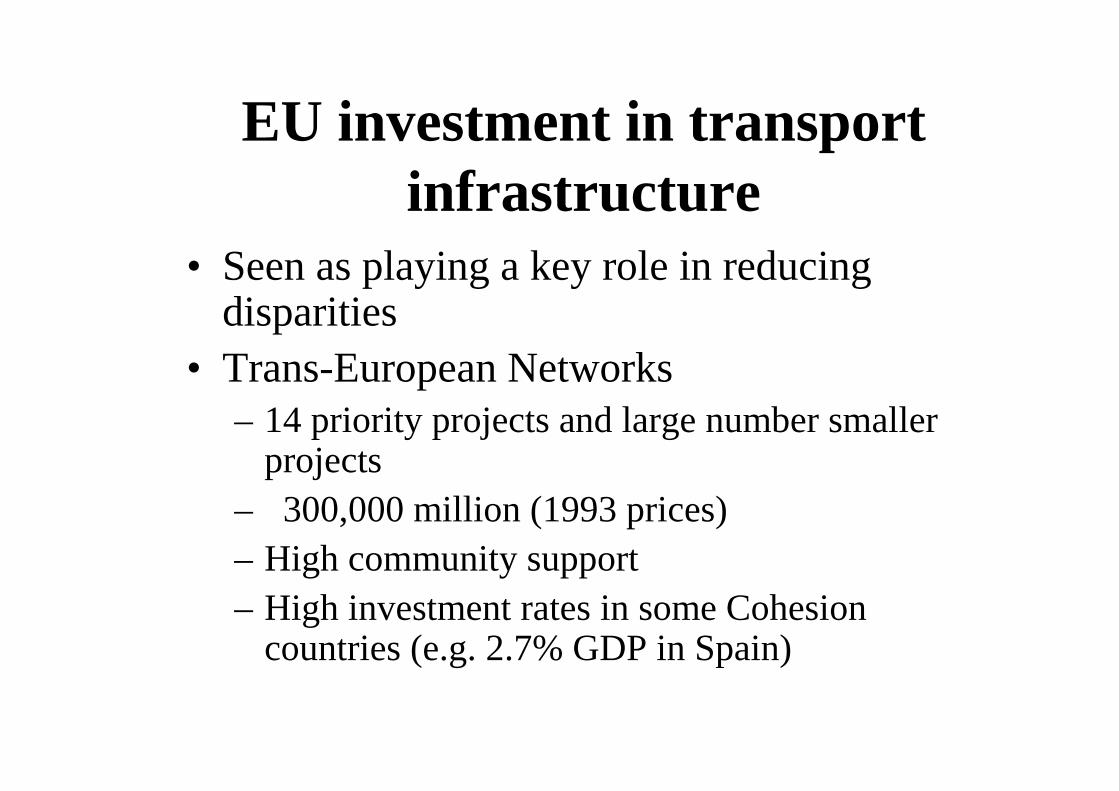
EU investment in transport infrastructure
• Seen as playing a key role in reducing disparities
• Trans-European Networks– 14 priority projects and large number smaller
projects– 300,000 million (1993 prices)– High community support– High investment rates in some Cohesion
countries (e.g. 2.7% GDP in Spain)
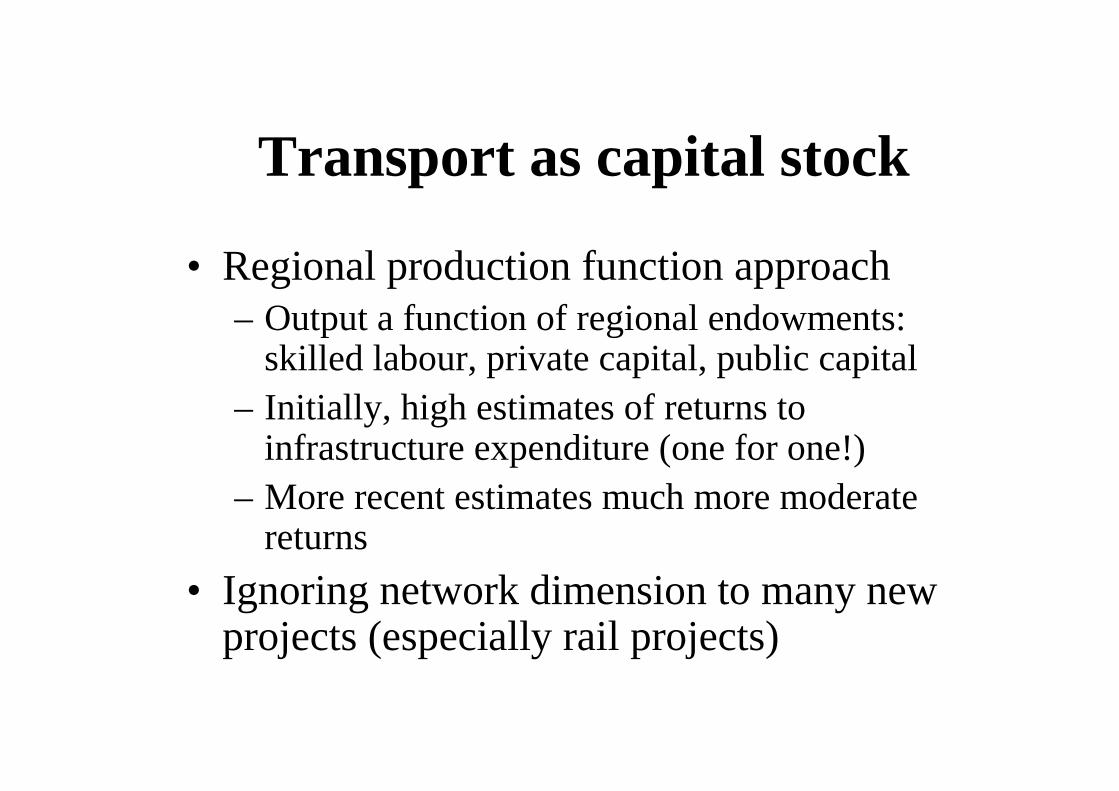
Transport as capital stock
• Regional production function approach– Output a function of regional endowments:
skilled labour, private capital, public capital– Initially, high estimates of returns to
infrastructure expenditure (one for one!)– More recent estimates much more moderate
returns
• Ignoring network dimension to many new projects (especially rail projects)
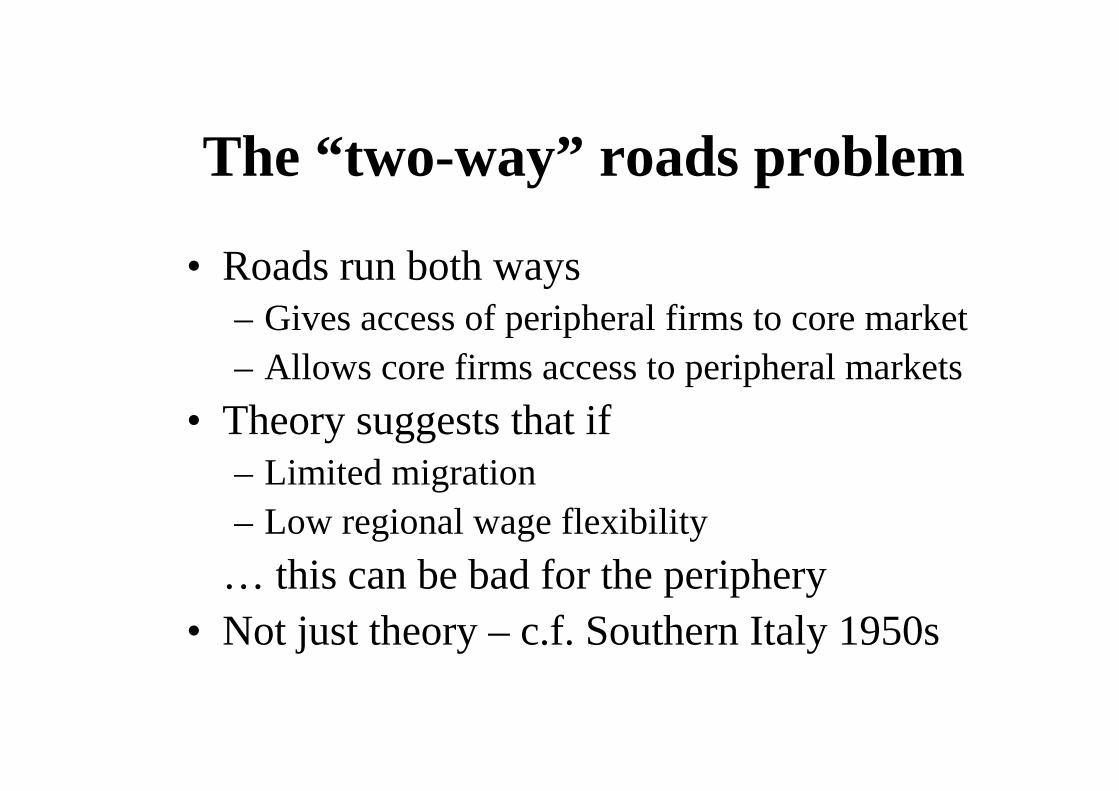
The “two-way” roads problem
• Roads run both ways– Gives access of peripheral firms to core market– Allows core firms access to peripheral markets
• Theory suggests that if– Limited migration– Low regional wage flexibility
… this can be bad for the periphery• Not just theory – c.f. Southern Italy 1950s
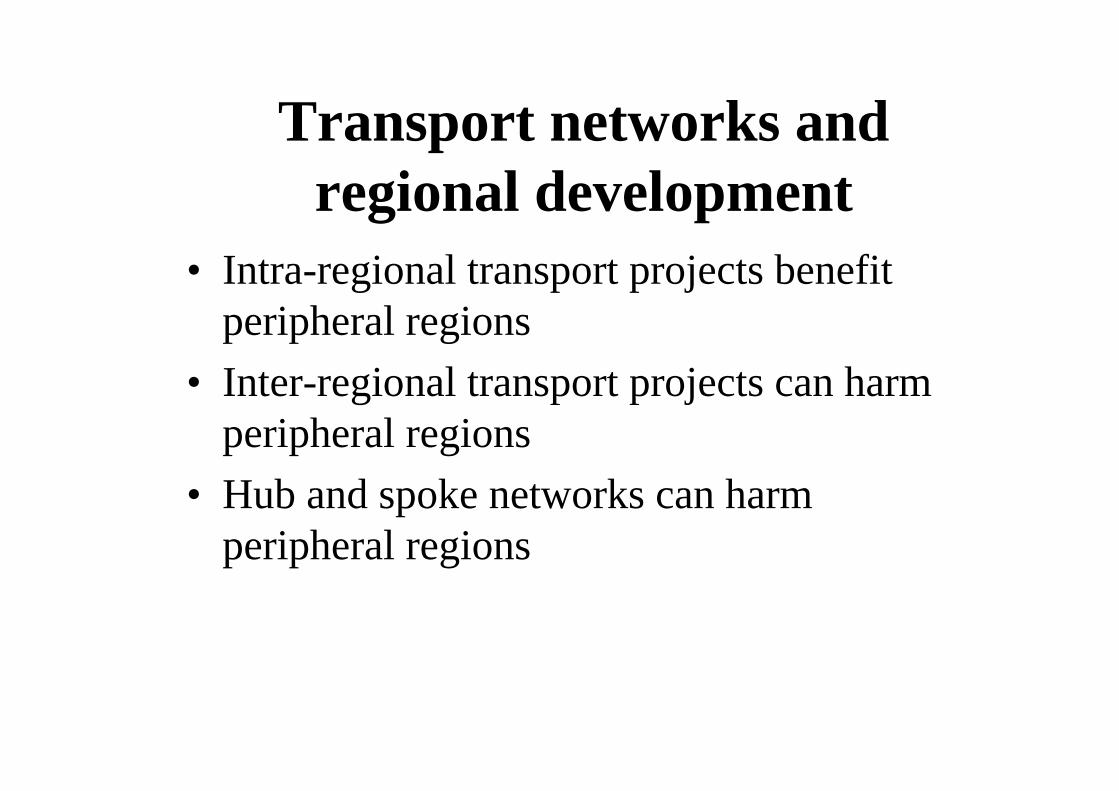
Transport networks and regional development
• Intra-regional transport projects benefit peripheral regions
• Inter-regional transport projects can harm peripheral regions
• Hub and spoke networks can harm peripheral regions
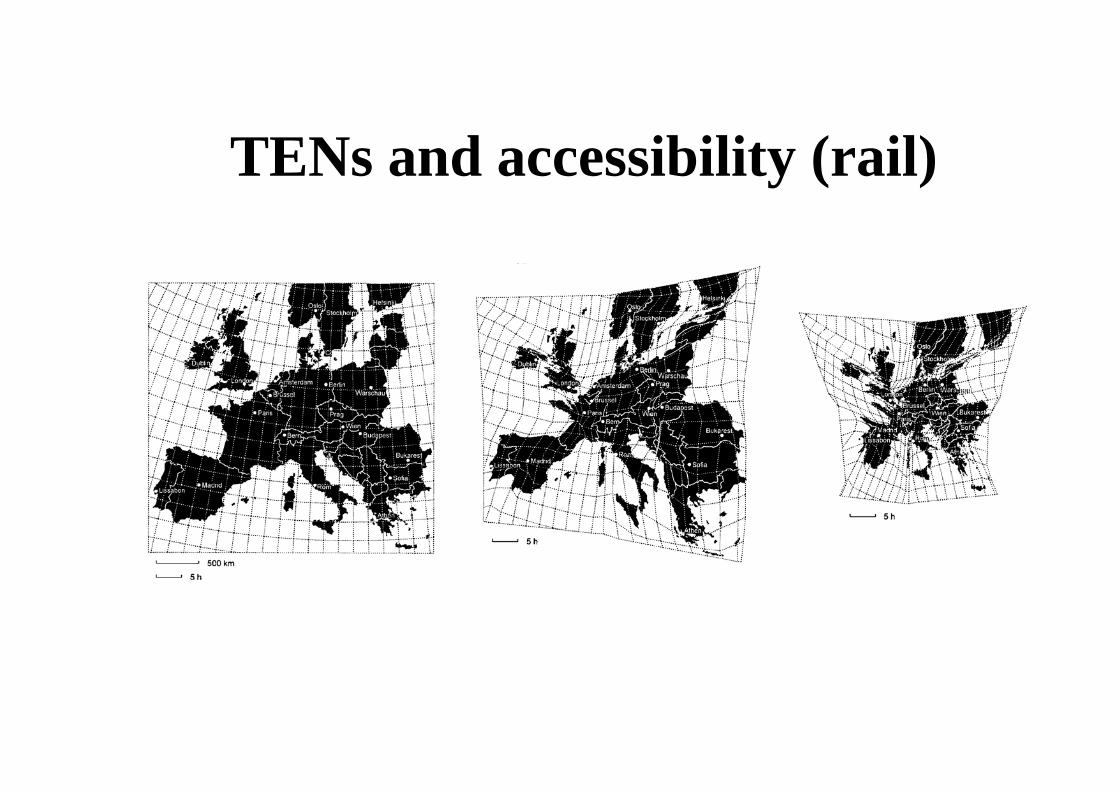
TENs and accessibility (rail)
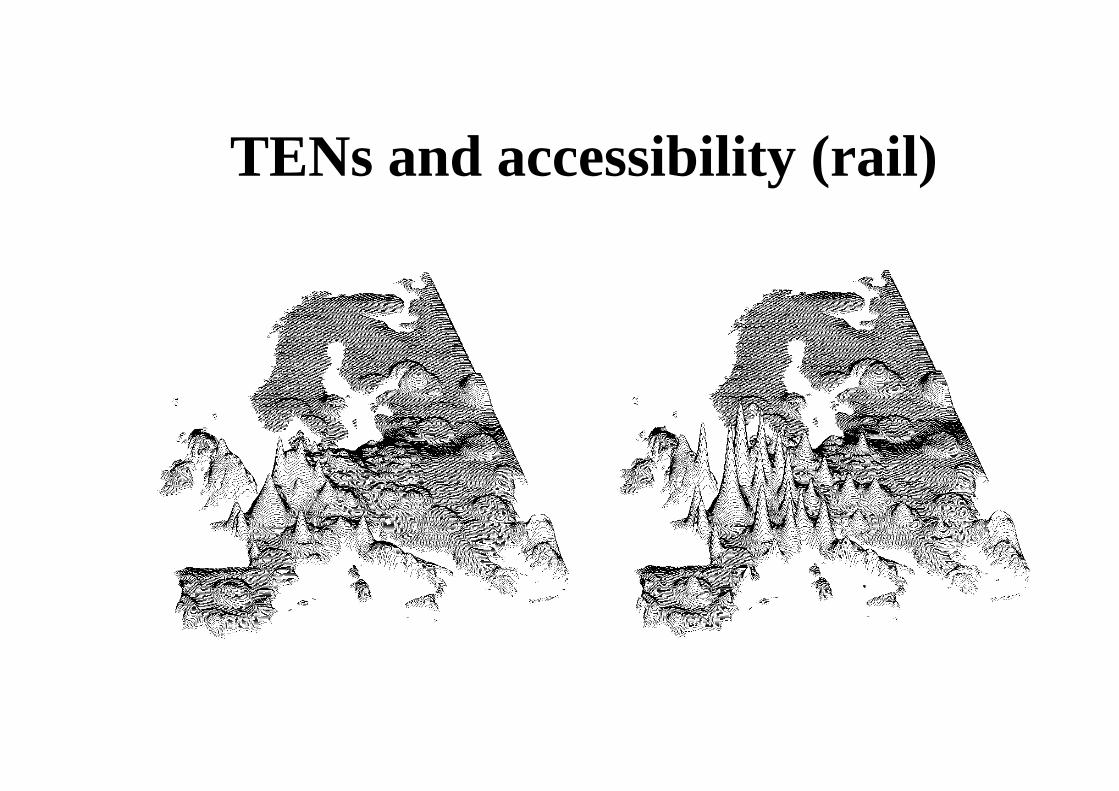
TENs and accessibility (rail)
From accessibility to activity
• Work for the Cohesion Fund highlights the idea that:– Some projects can benefit a wide number of
regions (e.g. Madrid ring road)
– Some projects can benefit a limited number of regions (e.g. Rias Bajas Motorway)
– Some projects can benefit one region to the detriment of other regions (e.g. Tagus crossing)

CBAs and the role of transport infrastructure in development
• Cost benefit analysis looks at activities closely related to project
• Assumptions– Distortions and market failures not significant
so that private and public valuations close
– Induced changes in activity fade fairly quickly as we move away from close activities
• NEG suggests these conditions not met

The role of business support
• Role of EU regional aid in changing industrial structure of regions– Attracts low IRS activities– No effect on skill intensive activities– Attracts R&D intensive activities
• At national level changing endowments of medium skill do not attract medium skill intensive activities
The regional problem?
• Regional polarization
• Possibility that increasing medium skill endowments not attracting industry
• Government policy being used to attract high-tech activities counter to comparative advantage
• Specialisation is good– 30 Objective 1 regions: 10 winners, 20 losers
– 8 out of 10 winners became more specialised
Part 3
Lessons for Regional Policy
Transport policies
• Need to think about the network effect of individual transport policies
• Transport policies plus regional flexibility can encourage firms in to the periphery
• High costs in peripheral regions can mean transport policies have negative effect

State aid
• Can be used to attract high tech activities
• Usually runs counter to comparative advantage
• Theoretical possibility to create “technopoles” –self reinforcing agglomerations of high tech activity
• Econometric analysis suggest that on average this policy just doesn’t improve regional GDP
• Successful projects are outliers

Specialisation and training
• Workers will need help during adjustment period.
• Trade off when designing training programmes– Sector specific skills will help deepen
comparative advantage and protect against temporary shocks
– General skills will help with permanent shocks
The role of skills
• Appropriately skilled labour allows regions to develop comparative advantage in sectors that use that sector
• The only development policy that on average seems to show positive returns
Skills and mobility
• Skilled people are more likely to move
• Is regional policy about developing the GDP of a region or the well being of the people that live in that region?
• Even if newly “skilled” workers move it can still be good for the region if it reduces unemployment (GDP per capita will rise)
Firm mobility
• Bribing firms to move appears to have some effect on industrial structure, but a weak effect on GDP
• Large movements of firms needed to overcome cumulative advantage of existing centres– Allows core to tax higher if it wants to (harmonizing
taxes hurts periphery)
• Biggest incentive will usually be low wage costs in the periphery
Wage differentials and adjustments
• Large amount of opposition to allowing nominal wage differentials to emerge– Nominal wage differentials contribute to
regional development by attracting firms
– Firms need lower wage costs to offset disadvantage of periphery
– Unemployment worse than low wages?
– Real wages tend to be higher in the periphery!
Encouraging mobility
• Worst regional outcomes occur when firms are mobile and workers aren’t
• Encouraging mobility out of peripheral areas may be the best way to– Maximize aggregate income
– Minimize adverse affects of peripherality

Key messages
• Regional flexibility and deeper integration are the key economic mechanisms that will help deal with problem regions
• Governmental role should be to– Ensure flexibility
– Support business and training programmes appropriate to regional characteristics
– Encourage worker mobility
Appendix 1EU location patterns (evidence)
Based on:
Combes and Overman (2004) “Spatial Distribution of Economic Activities in the European Union” Forthcoming, Handbook of Urban and Regional Economics (volume 4)
Midelfart and Overman (2002) “Delocation and European Integration: Is Structural Spending Justified?” Economic Policy, 35.
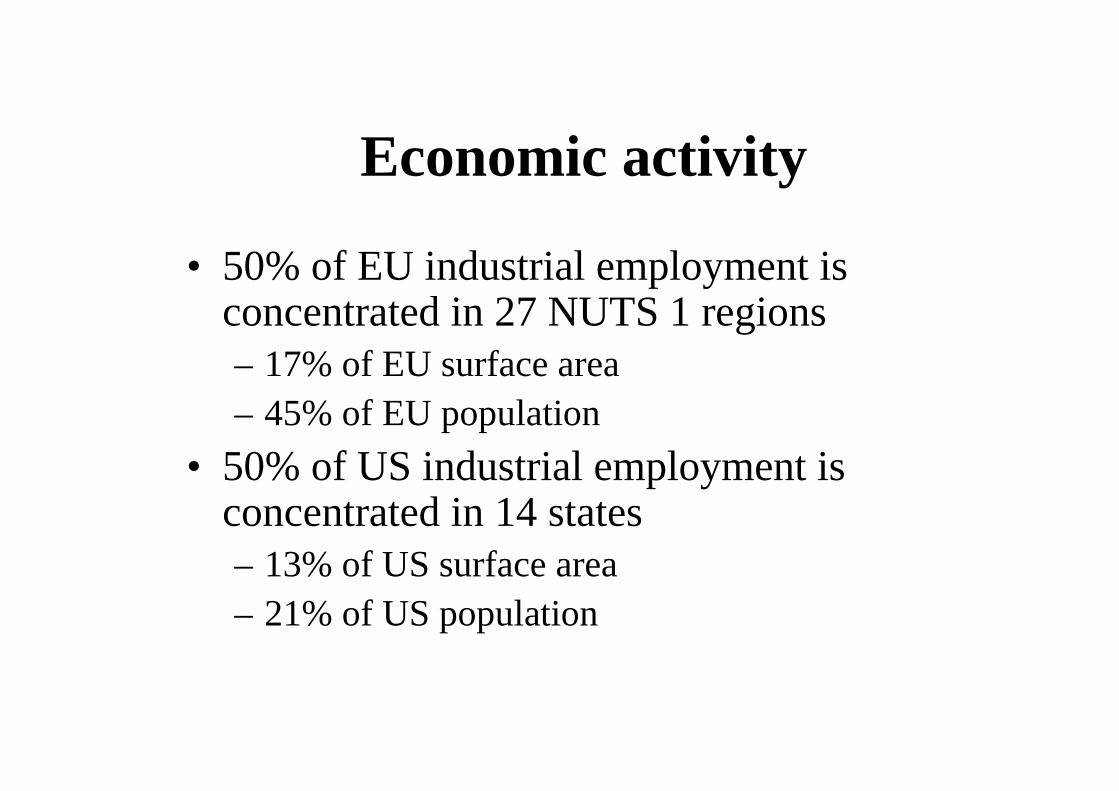
Economic activity
• 50% of EU industrial employment is concentrated in 27 NUTS 1 regions– 17% of EU surface area– 45% of EU population
• 50% of US industrial employment is concentrated in 14 states– 13% of US surface area– 21% of US population
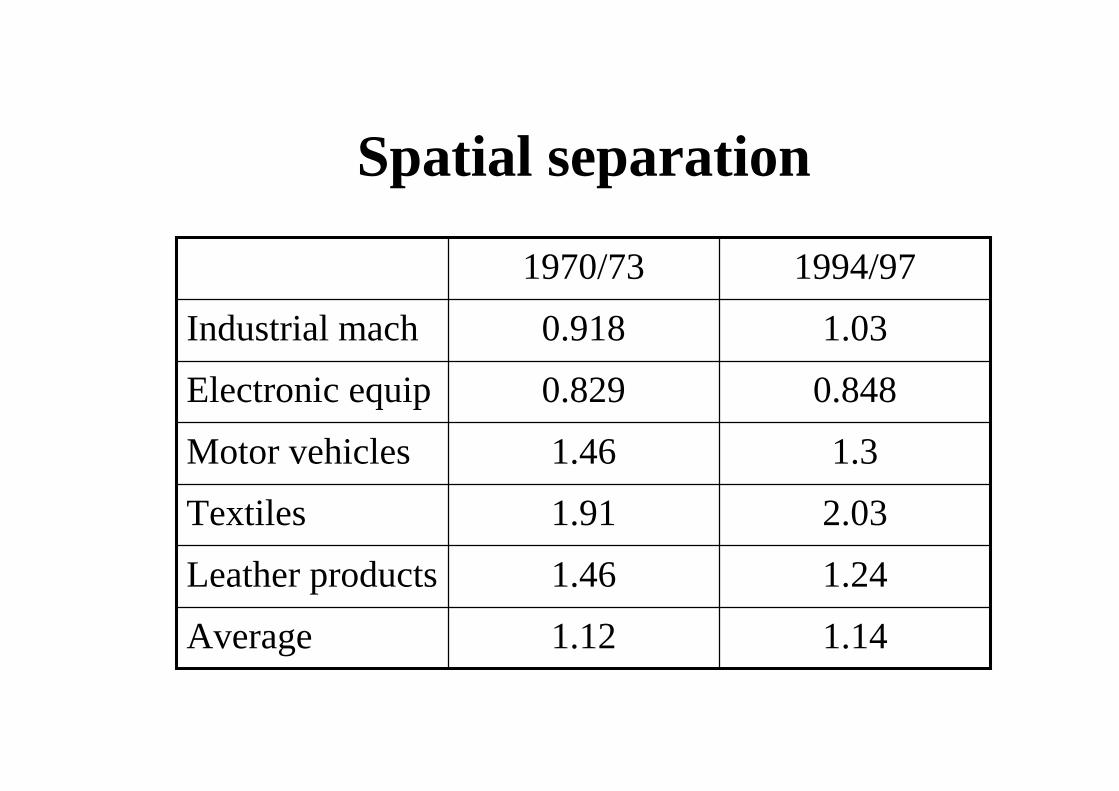
Spatial separation
1.141.12Average
1.241.46Leather products
2.031.91Textiles
1.31.46Motor vehicles
0.8480.829Electronic equip
1.030.918Industrial mach
1994/971970/73
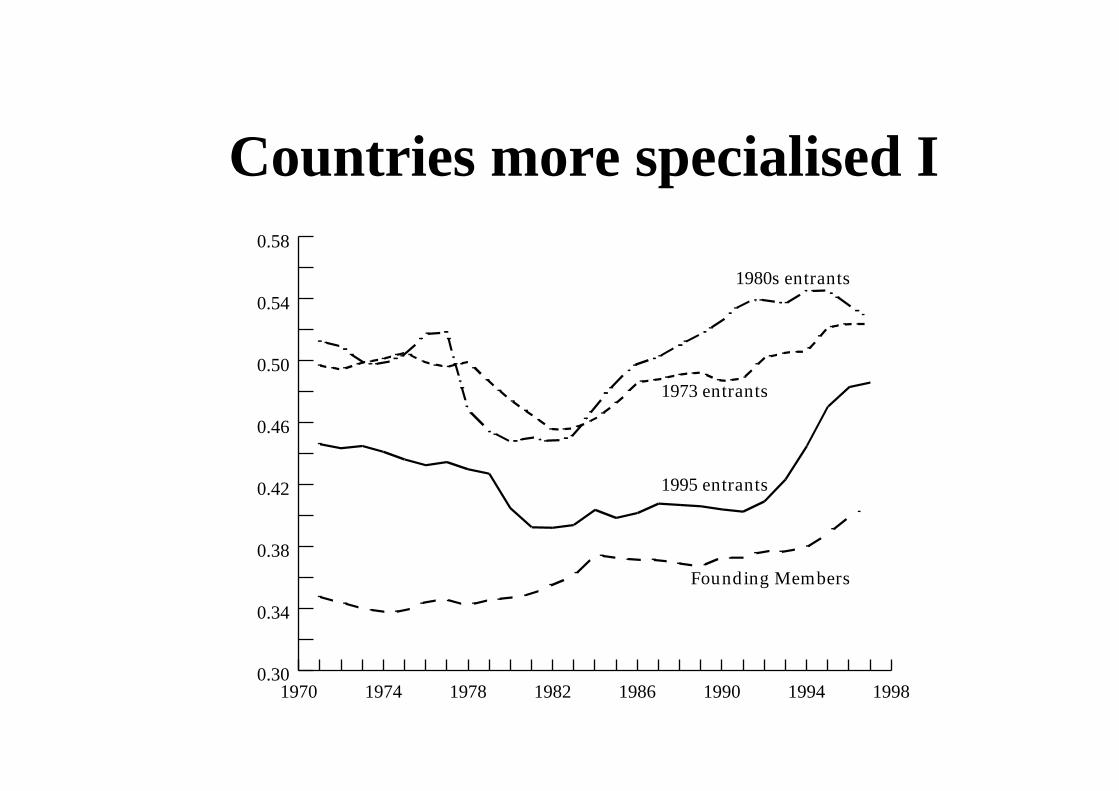
Countries more specialised I
1973 entrants
Founding Members
1995 entrants
1980s entrants
1970 1974 1978 1982 1986 1990 1994 19980.30
0.34
0.38
0.42
0.46
0.50
0.54
0.58
Countries more specialised II
• Of EU 15 all countries more specialised in 1990s than 1970s (except Netherlands)
• Often an unravelling of specialisation patterns just before integration and then increased specialisation after
• Jump in specialisation on entry even if part of EFTA previously
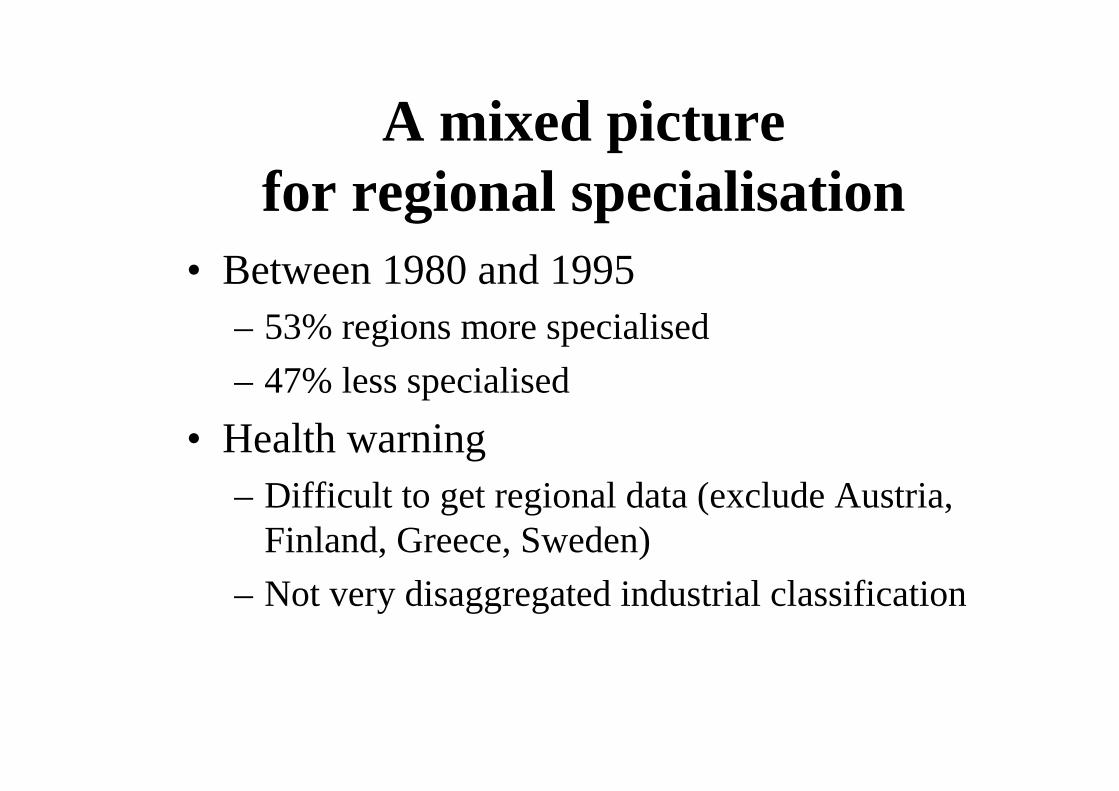
A mixed picture for regional specialisation
• Between 1980 and 1995– 53% regions more specialised
– 47% less specialised
• Health warning– Difficult to get regional data (exclude Austria,
Finland, Greece, Sweden)
– Not very disaggregated industrial classification
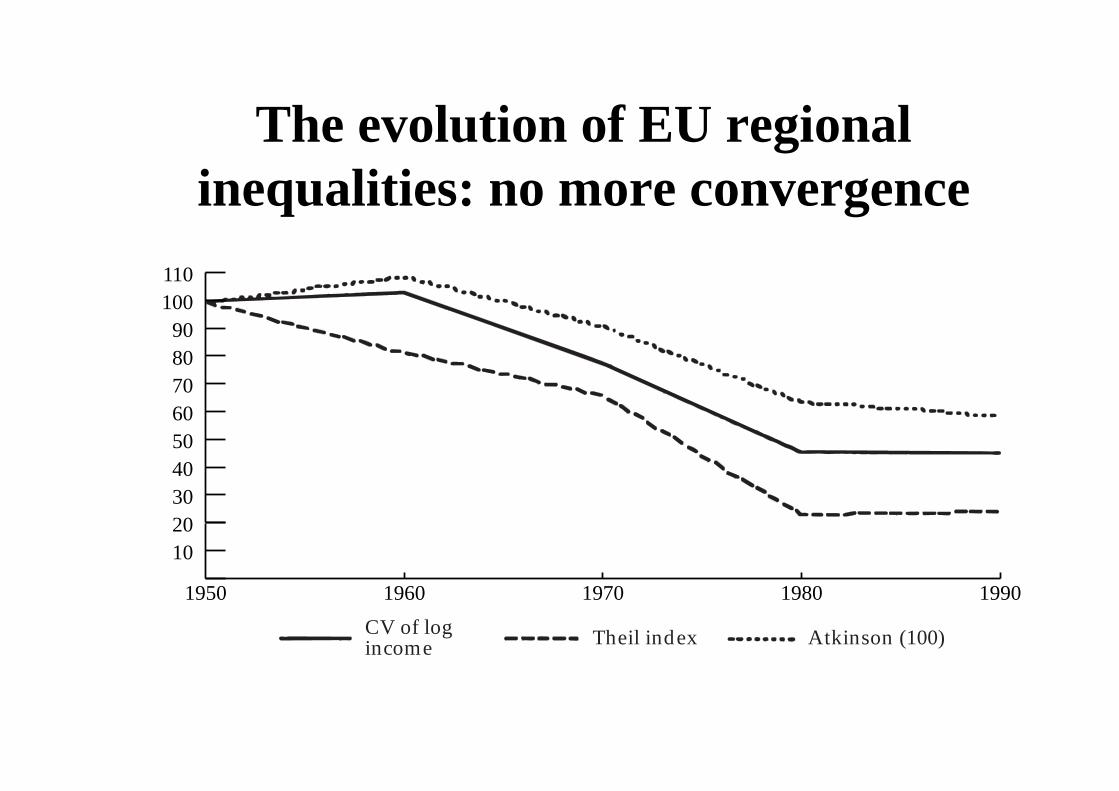
The evolution of EU regional inequalities: no more convergence
1950 1960 1970 1980 1990
10
CV of logincome Theil index Atkinson (100)
2030405060708090
100110
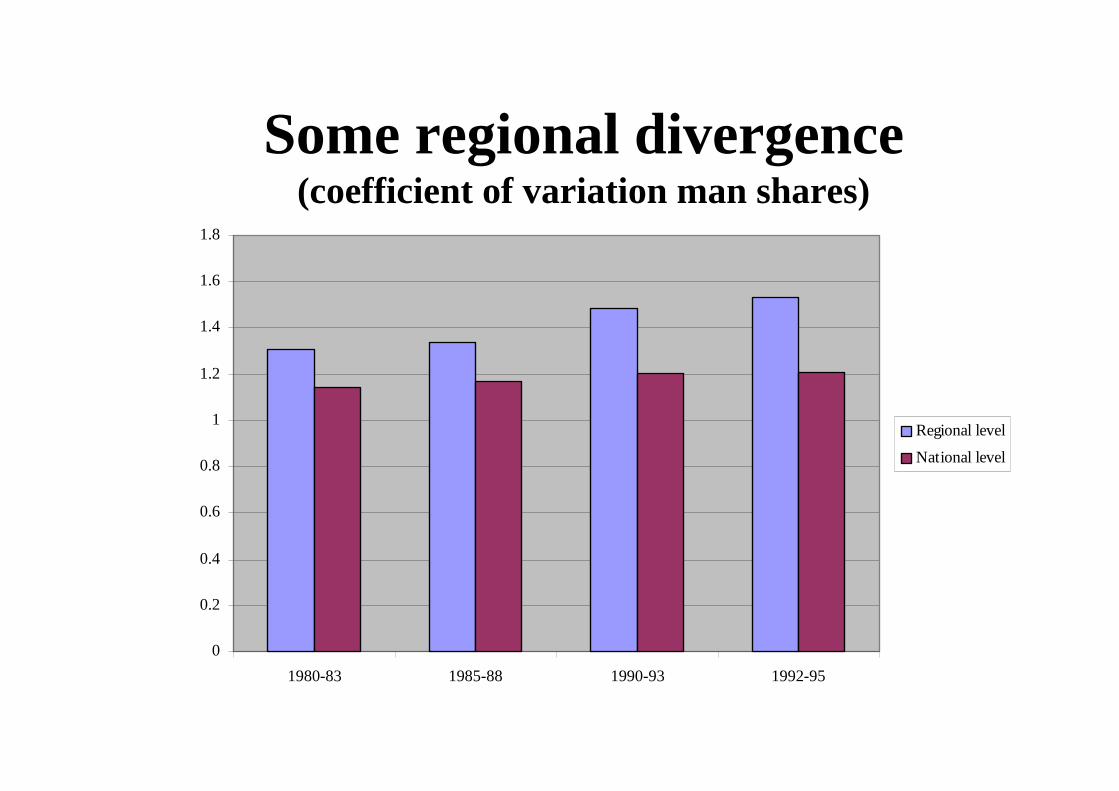
Some regional divergence (coefficient of variation man shares)
0
0.2
0.4
0.6
0.8
1
1.2
1.4
1.6
1.8
1980-83 1985-88 1990-93 1992-95
Regional level
National level
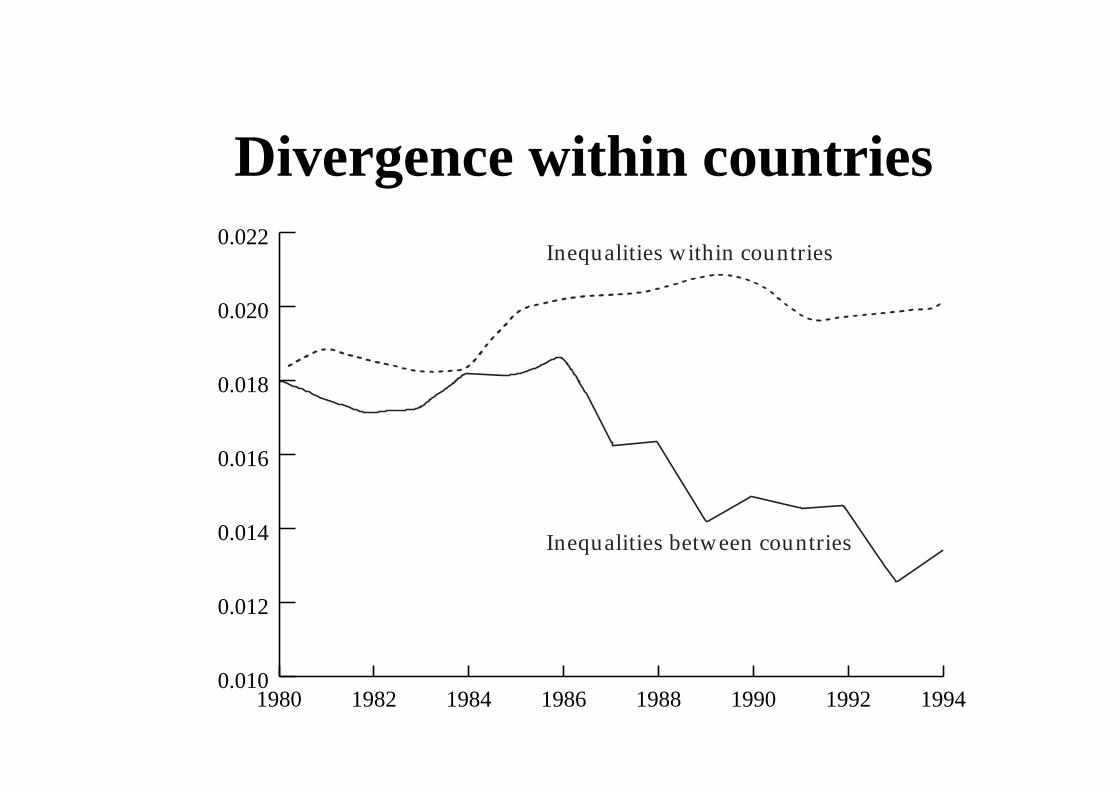
Divergence within countries
1980 1982 1984 1986 1988 1990 1992 19940.010
0.012
0.014
0.016
0.018
0.020
0.022Inequalities within countries
Inequalities between countries
Spatial dimensions
• Spatial dimension to polarisation of both GDP and unemployment
• Regions move with neighbours (even when control for type of industry, availability of skills, national institutions)
• Blurring of national boundaries
Appendix 2EU location patterns (theory)
Based on:
Midelfart and Overman (2002) “Delocation and European Integration: Is Structural Spending Justified?” Economic Policy, 35.
Puga (2002) “European Regional Policies in light of recent theories”, Journal of Economic Geography, 2(4)
Comparative advantage and specialisation
• Traditional models of comparative advantage help us understand some increasing specialisation with integration
• CA provides weak explanation of spatial concentration of activity
• Need increasing returns to scale to explain uneven distribution across areas with similar endowments
The Krugman-Venables core periphery model
• Two regions (core & periphery)• Two factors of production (mobile across
sectors but immobile across regions)• Core has larger endowments (60%) but the
same relative endowments (no CA)• One CRS sector, freely traded (agriculture)• One IRS sector, differentiated goods, costs
to trade (manufacturing)

The home market effect
• Would expect core region to have more manufacturing
• The surprise is that the core gets a more than proportionate share
• Core exports manufactures – “the home market effect”
• Core firms have better access to larger markets. Larger sales of firms in core � larger profits (IRS) � firms enter in response to profits
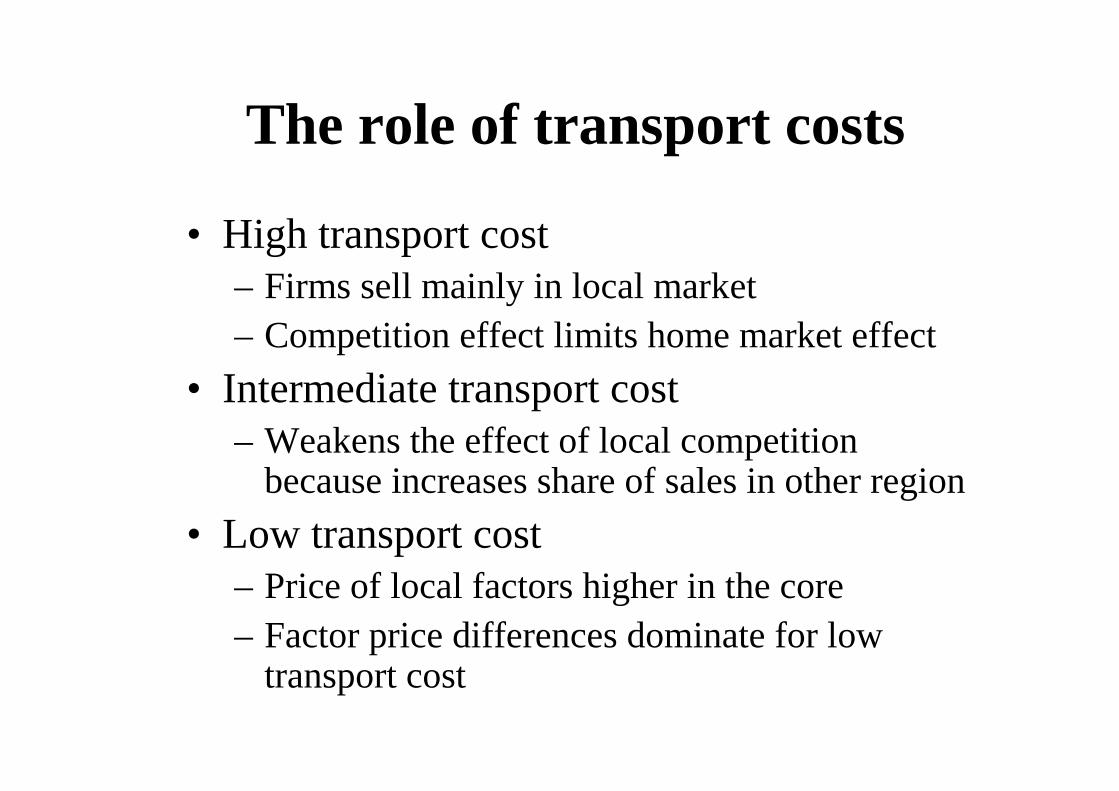
The role of transport costs
• High transport cost– Firms sell mainly in local market– Competition effect limits home market effect
• Intermediate transport cost– Weakens the effect of local competition
because increases share of sales in other region
• Low transport cost– Price of local factors higher in the core– Factor price differences dominate for low
transport cost
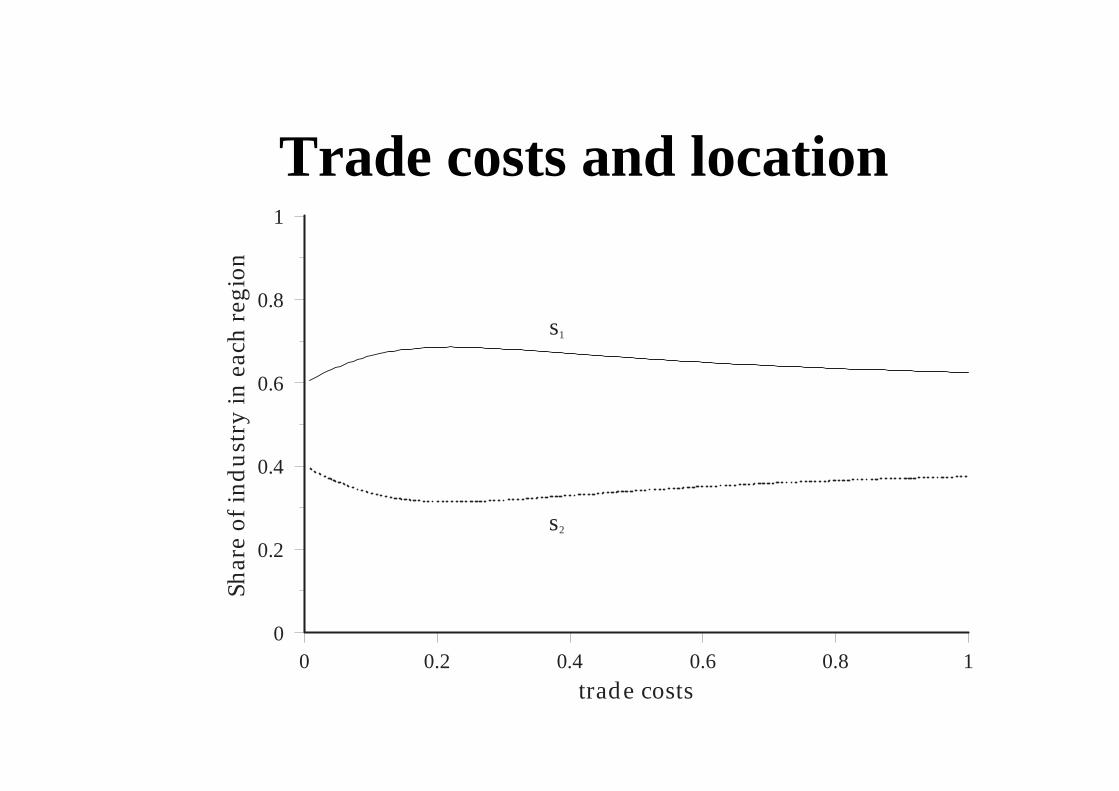
Trade costs and location
s2
s1
0 0.2 0.4 0.6 0.8 10
0.2
0.4
0.6
0.8
1
trade costs
Shar
e of
ind
ustr
y in
eac
h re
gion
Mobility & endogenous geography• If some factors mobile between regions,
eases pressure due to concentration
• Start from symmetric equilibrium and imagine effect on profits of firm moving– Product and labour market competition
– No migration � end of story
– Fall price index, rise wages attracts workers
– Increase local expenditure and eases pressure in labour market
European mobility
• Mobility of workers low within and between countries– High average unemployment rates reduce
incentives– Institutional barriers
• Social housing (within countries)• Pensions/social security (between countries)
– Government regulations that reduce regional wage differentials
The role of regional wage differentials
• Impact depends on whether or not agglomeration happens anyhow
• If agglomerate: – Labour demand will be lower in the periphery � high unemployment, low regional income
– Lack of wage effect can actually reinforce agglomeration
– Subsidies to firms to offset locational disadvantage will need to be ongoing
Input-output linkages
• Linkages between firms are sufficient to drive agglomeration even when labour is immobile (good access to suppliers and customers)
• Two forces moderate agglomeration– Wage differences
– Lack of cumulative effect from migrating workers
• At low transport costs wage differences can drive relocation to periphery (an inverted U)
Using the models
• US more agglomerated than EU because workers are more mobile
• Convergence between countries if wages reflect differences between countries
• Divergence within countries if institutional structures prevent wage differentials
• Spatial dimension to development• What about specialisation patterns?
Agglomeration and specialisation
• Specialisation driven by comparative advantage
• Agglomeration effects can reinforce or counter specialisation– Externalities/linkages intra-industry will
reinforce specialisation
– Externalities/linkages inter-industry will promote diversification

Appendix 3Accessibility: Road
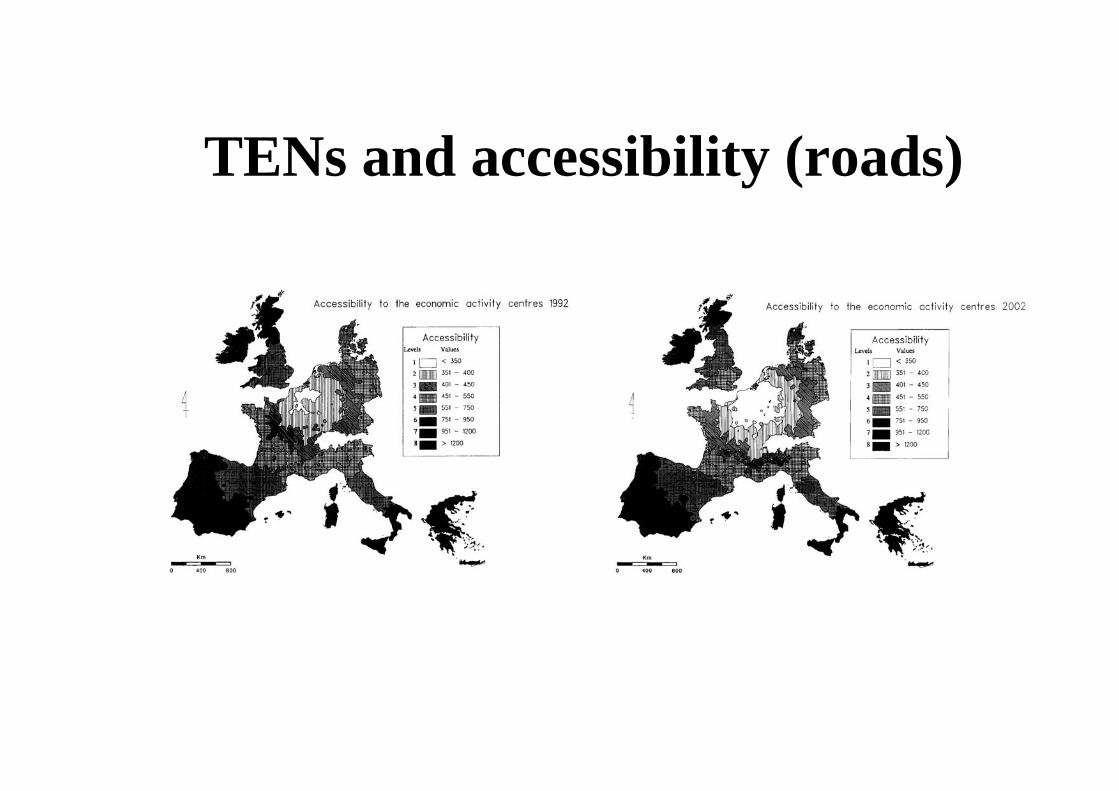
TENs and accessibility (roads)


![Structural Integration · Rolfing and Physical Reality by Healing Arts Press (Rochester, Vermont).] Structural Integration / July 2018 3 INSTITUTE NEWS ANNOUNCING AN UPGRADE TO THE](https://img.pdfslide.net/doc/110x75/5ea5e6c9a2df4f5e4a099100/structural-integration-rolfing-and-physical-reality-by-healing-arts-press-rochester.jpg)