Embed Size (px)
Citation preview
ASHE 2014 Annual Status of Higher Education of
States and UTs in India, 2014
1 Annual Status of Higher Education in States and UTs 2014
Contents
Foreword ...................................................................................................................................................................................................................................... 3
Part I - National perspective on Higher Education ...................................................................................................................................................................... 7
FDI in Indian Higher Education: Tapping its full potential ......................................................................................................................................................... 15
Incentivizing Institutional Performance ...................................................................................................................................................................................... 21
Mandatory Accreditation in Higher Education ........................................................................................................................................................................... 26
Private sector and RUSA by Shalini S. Sharma(CII) ................................................................................................................................................................. 37
‘Knowledge Direction’ by Garima Thakur (Intern at CII)…………………………………………………………………………………………………………………..42
Part II - India, State and UT Profiles on Higher Education ....................................................................................................................................................... 58
India………................................................................................................................................................................................................................................. 59
Andhra Pradesh (AP) ................................................................................................................................................................................................................. 65
Arunachal Pradesh (ARU) ......................................................................................................................................................................................................... 69
Assam (ASM) ............................................................................................................................................................................................................................. 73
Bihar (BIH) ................................................................................................................................................................................................................................. 77
Chhattisgarh (CHT) .................................................................................................................................................................................................................... 81
Goa (GOA)……. ......................................................................................................................................................................................................................... 85
Gujarat (GUJ) ............................................................................................................................................................................................................................. 89
Haryana (HAR) .......................................................................................................................................................................................................................... 93
Himachal Pradesh (HP) ............................................................................................................................................................................................................. 97
Jammu & Kashmir (J&K) ......................................................................................................................................................................................................... 101
Jharkhand (JHK) ...................................................................................................................................................................................................................... 105
Karnataka (KTK) ...................................................................................................................................................................................................................... 109
Kerala (KER) ............................................................................................................................................................................................................................ 113
Maharashtra (MAH) ................................................................................................................................................................................................................. 117
Manipur (MAN) ......................................................................................................................................................................................................................... 121
Meghalaya (MEG) .................................................................................................................................................................................................................... 125
Mizoram (MIZ) .......................................................................................................................................................................................................................... 129
Madhya Pradesh (MP) ............................................................................................................................................................................................................. 133
Nagaland (NAG) ...................................................................................................................................................................................................................... 137
Odisha (ODI) ............................................................................................................................................................................................................................ 141
Punjab (PUN) ........................................................................................................................................................................................................................... 145
Rajasthan (RAJ) ....................................................................................................................................................................................................................... 149
Sikkim (SIK) ............................................................................................................................................................................................................................. 153
Tamil Nadu (TN) ...................................................................................................................................................................................................................... 157
Tripura (TRI)............................................................................................................................................................................................................................. 161
Uttarakhand (UKT) ................................................................................................................................................................................................................... 165
2 Annual Status of Higher Education in States and UTs 2014
Uttar Pradesh (UP) .................................................................................................................................................................................................................. 169
West Bengal (WB) ................................................................................................................................................................................................................... 173
Andaman & Nicobar Islands (A&N) ......................................................................................................................................................................................... 177
Chandigarh (CHD) ................................................................................................................................................................................................................... 180
Daman & Diu (D&D) ................................................................................................................................................................................................................. 184
Dadra & Nagar Haveli (D&N) ................................................................................................................................................................................................... 187
Delhi (DEL) ............................................................................................................................................................................................................................... 190
Puducherry (PDY) .................................................................................................................................................................................................................... 194
About CII .................................................................................................................................................................................................................................. 198
About Deloitte........................................................................................................................................................................................................................... 199
Glossary ................................................................................................................................................................................................................................... 200
Bibliography ............................................................................................................................................................................................................................. 202
3 Annual Status of Higher Education in States and UTs 2014
Foreword
The Ministry of Human Resource Development (MHRD) is a vibrant and dynamic organisation which is engaged in the
task of nation building through various initiatives and schemes aimed at improving equity, access and excellence in higher
education. In keeping with the objectives of the 12th Five Year Plan of making the Indian higher education system globally
competitive and strong by focusing on state higher education system, the ministry launched the Rashtriya Uchchatar
Shiksha Abhiyan (RUSA) as a Centrally sponsored scheme in October 2013. With this the ministry has completed the
journey which started with Sarva Shiksha Abhiyan for universal elementary education and graduated to Rashtriya
Madhyamik Shiksha Abhiyan for universal secondary education.
The scheme has so far covered only one year and it is early days to gauge its impact on ground. But till August this year, a
total of 17 states had received preparatory grants as also the grants for management, monitoring, research and evaluation
(MMER), totalling approximately ₹ 268 crore. This is a good start and substantial progress is expected in the coming few
months.
Since funding under RUSA is linked to academic, administrative and governance reforms in state higher education
systems, qualitative assessment of progress made in each state is essential at regular intervals. This is where the role of
independent organisations such as Confederation of Indian Industry (CII) becomes important. CII started mapping the
higher education systems of states and Union territories separately in 2012 in the form of the ASHE report. Since then this
report has made significant contributions in providing a holistic picture of the state higher education systems.
I commend this effort in making our higher education system more lucid, more comprehensible and more responsive to
the needs of a nation in transition. This third edition of ASHE report is informative and insightful. I hope in years to come it
will make significant contributions to evaluating the performance of states in higher education and help them in achieving
their plans.
Shashi Prakash Goyal
Joint-Secretary (Higher Education)
Ministry of Human Resource Development
4 Annual Status of Higher Education in States and UTs 2014
Foreword
The Rashtriya Uchchtar Shiksha Abhiyan (RUSA) is a significant initiative of the Ministry of Human Resource
Development, Government of India. The focus on state higher education systems through this scheme is crucial since a
majority of the students are enrolled in institutions that come under the jurisdiction of state governments. These institutes
need resources to respond to the requirements of an expanding population and changing demographics. RUSA funding
will help them do that.
I am happy that Confederation of Indian Industry (CII) has been able to create and sustain this annual mapping of the
states’ performance in higher education in the Annual Status of Higher Education (ASHE) in states and Union territories. In
the third year of this endeavor we have successfully moved away from depending on information provided by states
directly to the government. This has been possible because of improvements in the Ministry’s own information
dissemination system. A significant amount of information, though not entirely so, related to RUSA and state higher
education plans is available on the Ministry’s website; in addition, the Ministry has been very helpful in sharing insights
and information on the implementation of the scheme. ASHE 2014 contains information, which is not available in the
public domain so far. I thank them for this support.
The most important stakeholders in this entire scheme of things, the state governments, have started thinking differently
because of RUSA and that is a very welcome change. I am happy to see that 17 states have already received funds for
making preparations and to put monitoring and research systems in place. This is an excellent start to this new process of
funding and improving the quality of higher education in our states and Union territories.
A special thanks to Deloitte India, which has helped us put this report together for a second year.
Dr Naushad Forbes
Vice-President, CII
Chairman, CII National Committee on Higher Education &
Director, Forbes Marshall
5 Annual Status of Higher Education in States and UTs 2014
Foreword
India’s higher education sector, amongst the largest in the world, has experienced unprecedented growth & increased
investor focus over the past two decades. Yet, as it stands at the threshold of continued transformation, the sector needs
to shift gears and evolve with the changing times. Despite its size and scope, the Gross Enrolment Ratio (GER) in Indian
higher education continues to be far below the global average. The rapid growth witnessed in the higher education sector
has generated numerous challenges with the key ones being maintaining quality, improving equity and providing access to
each and every student based in any part of the country. In terms of global exposure and achieving internationalisation,
our country has a long way to go.
Gauging the need to catapult this sector to the next level, the governments in the recent past have conceptualized a
number of reforms specifically addressed to iron out some of the pressing issues and also prepare our academic
institutions to embrace the future. Unfortunately, most of these reforms are yet to see the light of the day. Given the
renewed emphasis placed by the new government, we expect the government to roll out some of these reforms in the
near future.
In this context, taking stock of the higher education scenario in India, ‘Annual Status of Higher Education in States and
UTs 2014’ aims to provide an overview of the higher education status in India, the key challenges it faces and reforms
which are at various stages of conceptualization or implementation. Deloitte had partnered with MHRD and CII last year to
release 2013 version of this report. In this version, we have made a deliberate effort to highlight the steps being taken by
the Central & State Governments to implement RUSA, India’s flagship program focused on reforming higher education
sector. Approved by the Cabinet in October 2013, the RUSA is a landmark initiative to completely overhaul higher
education infrastructure of public sponsored universities. Like last year, the report also provides a detailed overview of
higher education status in Indian states and union territories based on certain vital indicators.
The private sector’s role till date has been instrumental in the growth of India’s higher education sector and given the
government’s intent to increase our GER to 30% by 2020, we expect the role of private sector to multiply manifolds.
Increased private sector participation however would need to be given special impetus by taking steps to simplify
prevailing regulatory framework and overall higher education ecosystem. Fortunately, RUSA envisages an increased
participation of the private sector to achieve a sustained growth in the next decade and therefore advocates enactment of
new policies/regulations to encourage investment.
Further, with its burgeoning workforce and the inevitable need for global acceptance, internationalisation of higher
education has become a critical factor for India’s growth. Participation of foreign institutions is now not only limited to
developed economies but have extended to third-world countries, especially India, China and Singapore. In our opinion,
the multiplier effect that foreign higher education institutions can have in conjunction with Indian institutions can transform
the higher education landscape of the country.
The Government has already taken the initial steps to make a strong case for acceptance of Indian educational institutions
globally by making accreditation mandatory. Although, a bill to make accreditation mandatory in higher education was
introduced however it could not receive the parliamentary accord. It was then decided to notify regulations to make
accreditation mandatory for universities, colleges and technical institutions in the country. The inclusion of India as a
permanent signatory of the prestigious Washington Accord this year is been viewed as one of the achievements of the
Government after taking such a progressive step. This recognition would result in acceptance of Indian degrees globally
besides opening up doors for employment for engineering graduates overseas.
6 Annual Status of Higher Education in States and UTs 2014
This report would be covering all the aspects discussed in brief above amongst others. We would like to express our
sincere gratitude to MHRD and CII for their generous support and cooperation in preparation of this report.
Deloitte Education Sector Team
7 Annual Status of Higher Education in States and UTs 2014
Part I
National perspective on Higher
Education
8 Annual Status of Higher Education in States and UTs 2014
Current Status of RUSA
Implementation in India
Introduction
Improving Quality, Access & Equity in higher education— is a vision that the Government of India overall, and the Ministry
of Human Resource Development (MHRD) in particular, has been trying to achieve since Independence. However, in
recent times, with the rapid growth and technical revolution that education in the country has witnessed, the benchmark
has been raised higher than ever before.
The general education mainly consists of higher education courses in arts, commerce and science, the technical
education on the other hand comprises of programmes of education, research and training in engineering technology,
architecture, town planning, management, pharmacy and applied arts and crafts. Professional education includes courses
in medical education, law and other specialized fields.
RUSA: born from a golden vision It is with this vision in mind that the government launched its centrally sponsored scheme, the Rashtriya Uchchatar
Shiksha Abhiyan (RUSA). Keeping in view the Planning Commission’s recommendations around addressing the
challenges plaguing higher education and to effectively utilise central funds, RUSA was approved in October 2013. RUSA
is an integral part of the twelfth five year plan’s education sector objectives, in line with the larger endeavour to transform
the Indian higher education sector into a global knowledge hub.
Proposed by MHRD, the RUSA is aimed at providing strategic funding to eligible state higher educational institutions, at
facilitating holistic planning at the state level through the efficient allocation of funds for state institutions — to be spread
across the two plan periods (XII and XIII).
Integral to the RUSA is the objective of creating new universities through up gradation of existing autonomous institutes of
excellence operating across the country. It also intends to lend support to aided educational institutions for improvement of
infrastructure, faculty recruitment procedures and leadership development of educational administrators. Reforming,
restructuring and building the capacity of institutions in participating states also falls under the purview of the RUSA. The
scheme additionally has a separate component to encourage greater synergy between vocational education and higher
education.
As the nodal agency for administering RUSA program, the MHRD oversees and reviews the budgetary targets of
participating states. Funding under the RUSA (65:35 for general-category states and 90:10 for special-category states) is
norm-based and outcome-dependent. Funding flows from the central ministry through the state governments/union
territories to the State Higher Education Councils (SHECs) before finally reaching the identified institutions. Funding is
granted based on critical evaluation of the State Higher Education Plans (SHEPs), wherein each state’s strategy to
address issues of equity, access and excellence in higher education are assessed thoroughly.
This chapter is an attempt to understand and decode the various components of the scheme and the progress
that has been made with respect to the implementation of RUSA funds across the country. In addition, this
chapter seeks to highlight preliminary achievements of the program and provide an insight into future initiatives.
9 Annual Status of Higher Education in States and UTs 2014
The RUSA has adopted a merit based approach for improving the quality of higher education being offered in
various state government universities. The program incentivises institutions with higher fund allocation on the
basis of their performance, which is measured based on clearly defined norms.
RUSA’s Institutional Structure
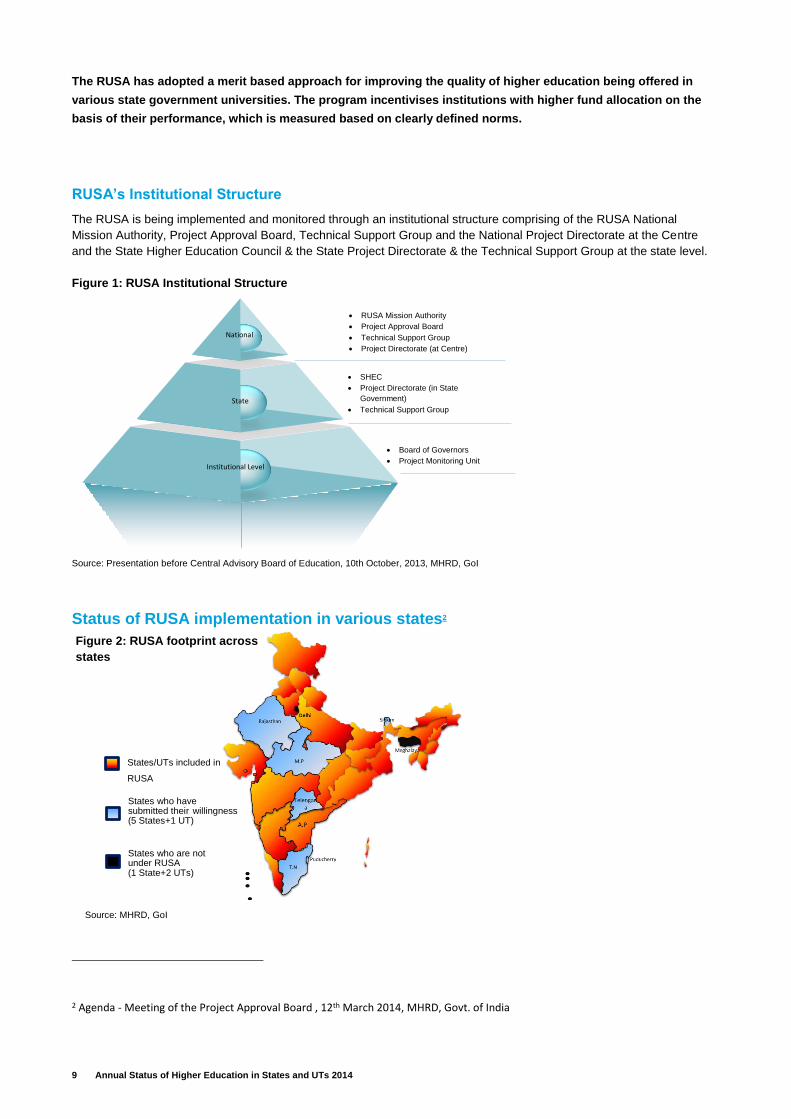
The RUSA is being implemented and monitored through an institutional structure comprising of the RUSA National
Mission Authority, Project Approval Board, Technical Support Group and the National Project Directorate at the Centre
and the State Higher Education Council & the State Project Directorate & the Technical Support Group at the state level.
Figure 1: RUSA Institutional Structure
Source: Presentation before Central Advisory Board of Education, 10th October, 2013, MHRD, GoI
Status of RUSA implementation in various states2
2 Agenda - Meeting of the Project Approval Board , 12th March 2014, MHRD, Govt. of India
RUSA Mission Authority
Project Approval Board
Technical Support Group
Project Directorate (at Centre)
National
State
Institutional Level
Board of Governors
Project Monitoring Unit
SHEC
Project Directorate (in State
Government)
Technical Support Group
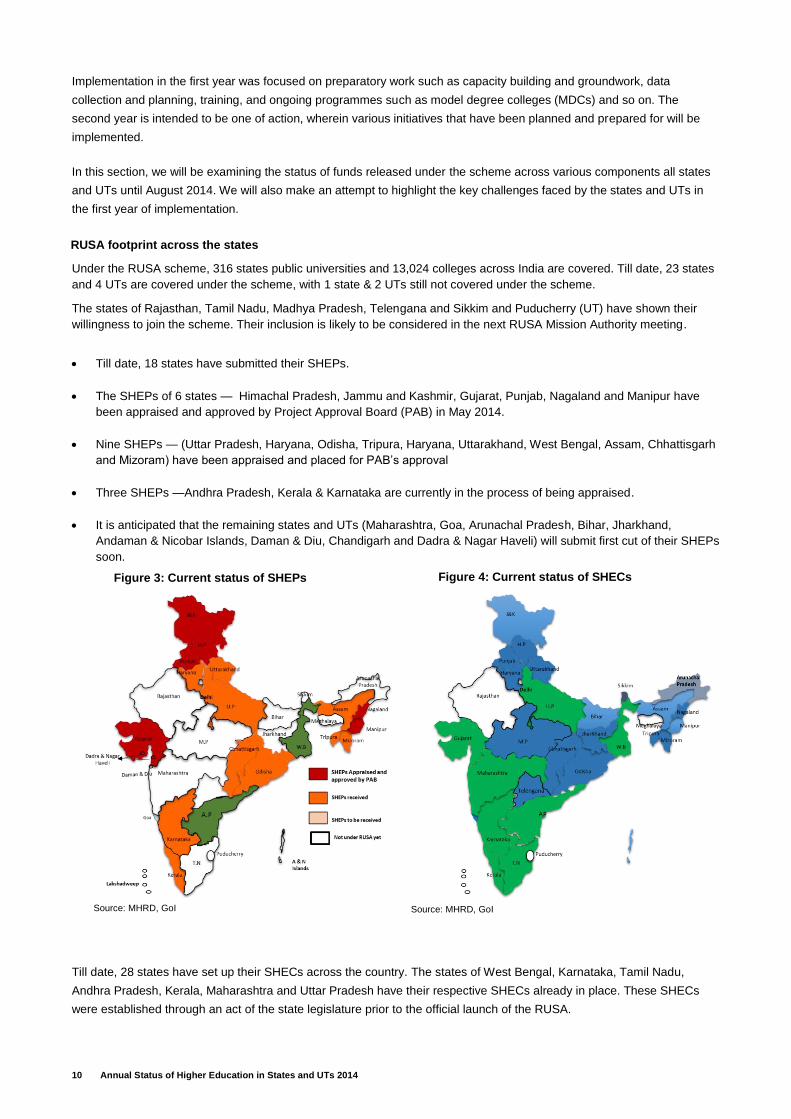
Figure 2: RUSA footprint across
states
Source: MHRD, GoI
States who are not under RUSA (1 State+2 UTs)
States/UTs included in
RUSA
(23 States+4UTs) States who have submitted their willingness (5 States+1 UT)
10 Annual Status of Higher Education in States and UTs 2014
Implementation in the first year was focused on preparatory work such as capacity building and groundwork, data
collection and planning, training, and ongoing programmes such as model degree colleges (MDCs) and so on. The
second year is intended to be one of action, wherein various initiatives that have been planned and prepared for will be
implemented.
In this section, we will be examining the status of funds released under the scheme across various components all states
and UTs until August 2014. We will also make an attempt to highlight the key challenges faced by the states and UTs in
the first year of implementation.
RUSA footprint across the states
Under the RUSA scheme, 316 states public universities and 13,024 colleges across India are covered. Till date, 23 states
and 4 UTs are covered under the scheme, with 1 state & 2 UTs still not covered under the scheme.
The states of Rajasthan, Tamil Nadu, Madhya Pradesh, Telengana and Sikkim and Puducherry (UT) have shown their
willingness to join the scheme. Their inclusion is likely to be considered in the next RUSA Mission Authority meeting.
Till date, 18 states have submitted their SHEPs.
The SHEPs of 6 states — Himachal Pradesh, Jammu and Kashmir, Gujarat, Punjab, Nagaland and Manipur have
been appraised and approved by Project Approval Board (PAB) in May 2014.
Nine SHEPs — (Uttar Pradesh, Haryana, Odisha, Tripura, Haryana, Uttarakhand, West Bengal, Assam, Chhattisgarh
and Mizoram) have been appraised and placed for PAB’s approval
Three SHEPs —Andhra Pradesh, Kerala & Karnataka are currently in the process of being appraised.
It is anticipated that the remaining states and UTs (Maharashtra, Goa, Arunachal Pradesh, Bihar, Jharkhand,
Andaman & Nicobar Islands, Daman & Diu, Chandigarh and Dadra & Nagar Haveli) will submit first cut of their SHEPs
soon.
Till date, 28 states have set up their SHECs across the country. The states of West Bengal, Karnataka, Tamil Nadu,
Andhra Pradesh, Kerala, Maharashtra and Uttar Pradesh have their respective SHECs already in place. These SHECs
were established through an act of the state legislature prior to the official launch of the RUSA.
Source: MHRD, GoI Source: MHRD, GoI
Figure 3: Current status of SHEPs Figure 4: Current status of SHECs
11 Annual Status of Higher Education in States and UTs 2014
Gujarat also has set up the Gujarat Knowledge Consortia (instead of SHEC) through an executive order.
After the launch of RUSA, the states of Arunachal Pradesh, Manipur, Assam, Odisha, Chhattisgarh, Punjab, Himachal
Pradesh, Jammu and Kashmir, Andaman and Nicobar, Goa, Mizoram, Nagaland, Bihar, Haryana, Tripura, Jharkhand,
Sikkim, Madhya Pradesh, Uttarakhand and Telangana have formed their respective SHECs via an executive order.
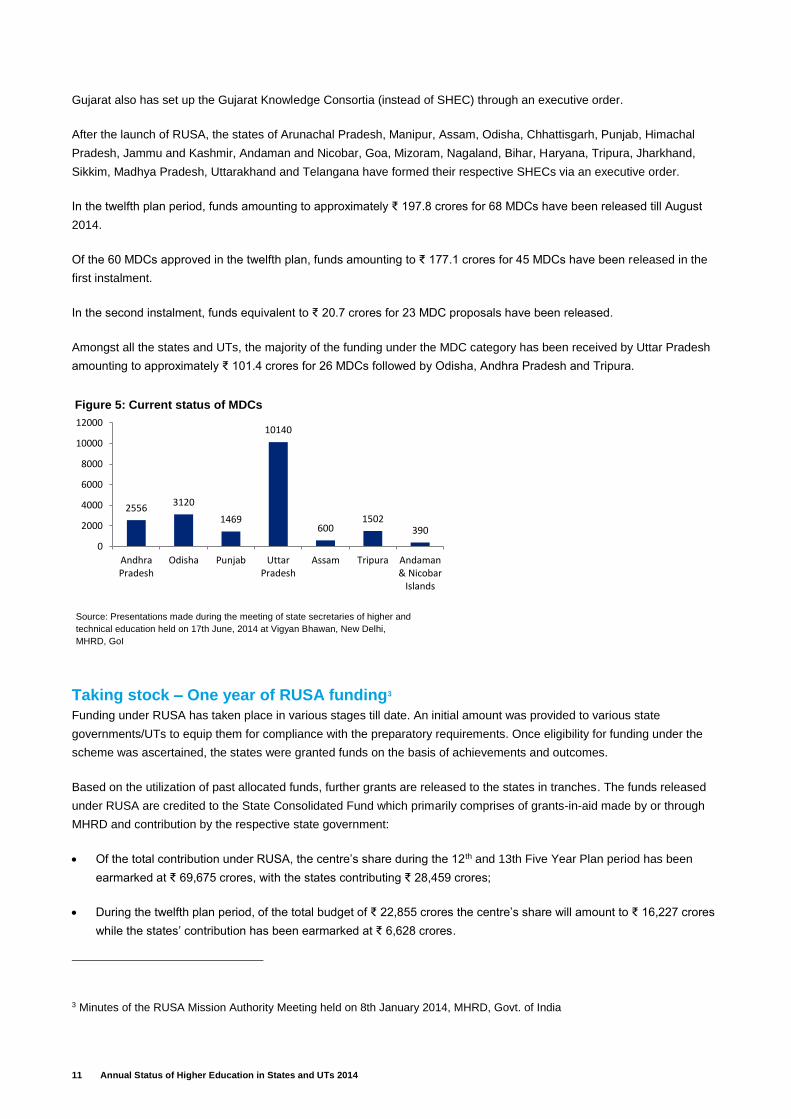
In the twelfth plan period, funds amounting to approximately ₹ 197.8 crores for 68 MDCs have been released till August
2014.
Of the 60 MDCs approved in the twelfth plan, funds amounting to ₹ 177.1 crores for 45 MDCs have been released in the
first instalment.
In the second instalment, funds equivalent to ₹ 20.7 crores for 23 MDC proposals have been released.
Amongst all the states and UTs, the majority of the funding under the MDC category has been received by Uttar Pradesh
amounting to approximately ₹ 101.4 crores for 26 MDCs followed by Odisha, Andhra Pradesh and Tripura.
Taking stock – One year of RUSA funding3
Funding under RUSA has taken place in various stages till date. An initial amount was provided to various state
governments/UTs to equip them for compliance with the preparatory requirements. Once eligibility for funding under the
scheme was ascertained, the states were granted funds on the basis of achievements and outcomes.
Based on the utilization of past allocated funds, further grants are released to the states in tranches. The funds released
under RUSA are credited to the State Consolidated Fund which primarily comprises of grants-in-aid made by or through
MHRD and contribution by the respective state government:
Of the total contribution under RUSA, the centre’s share during the 12th and 13th Five Year Plan period has been
earmarked at ₹ 69,675 crores, with the states contributing ₹ 28,459 crores;
During the twelfth plan period, of the total budget of ₹ 22,855 crores the centre’s share will amount to ₹ 16,227 crores
while the states’ contribution has been earmarked at ₹ 6,628 crores.
3 Minutes of the RUSA Mission Authority Meeting held on 8th January 2014, MHRD, Govt. of India
Figure 5: Current status of MDCs
25563120
1469
10140
6001502
390
0
2000
4000
6000
8000
10000
12000
AndhraPradesh
Odisha Punjab UttarPradesh
Assam Tripura Andaman& Nicobar
Islands
Source: Presentations made during the meeting of state secretaries of higher and
technical education held on 17th June, 2014 at Vigyan Bhawan, New Delhi,
MHRD, GoI
12 Annual Status of Higher Education in States and UTs 2014
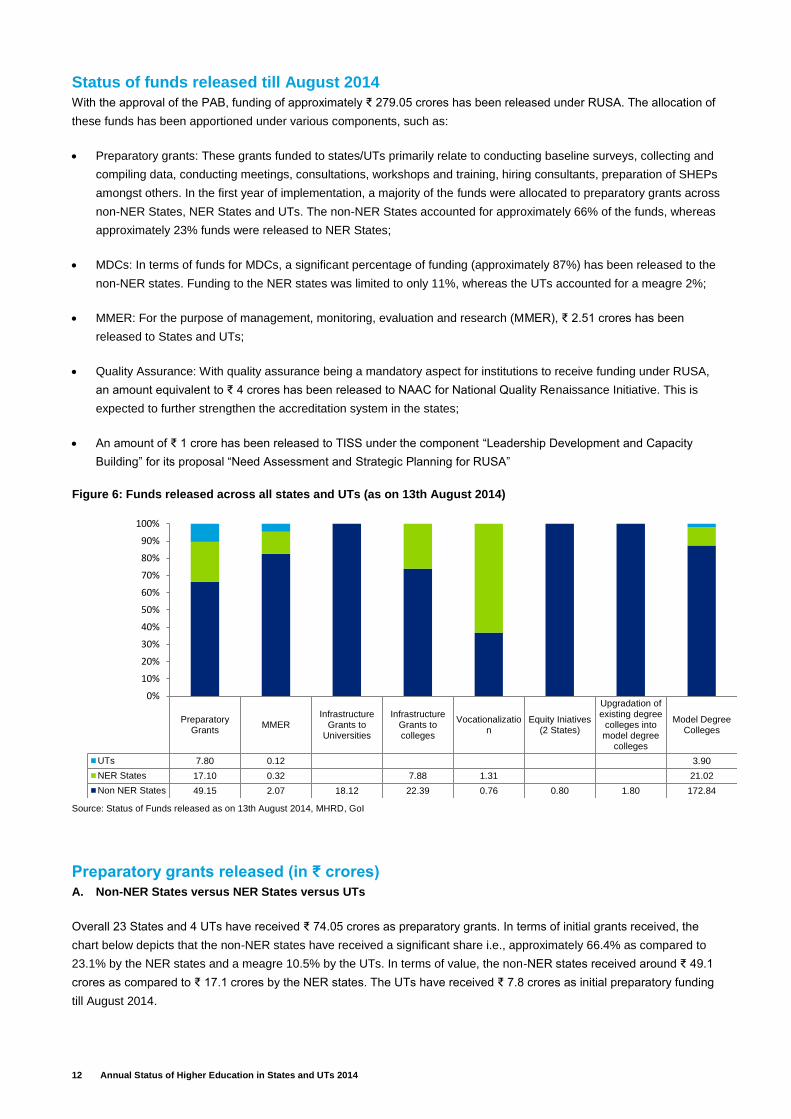
Status of funds released till August 2014
With the approval of the PAB, funding of approximately ₹ 279.05 crores has been released under RUSA. The allocation of
these funds has been apportioned under various components, such as:
Preparatory grants: These grants funded to states/UTs primarily relate to conducting baseline surveys, collecting and
compiling data, conducting meetings, consultations, workshops and training, hiring consultants, preparation of SHEPs
amongst others. In the first year of implementation, a majority of the funds were allocated to preparatory grants across
non-NER States, NER States and UTs. The non-NER States accounted for approximately 66% of the funds, whereas
approximately 23% funds were released to NER States;
MDCs: In terms of funds for MDCs, a significant percentage of funding (approximately 87%) has been released to the
non-NER states. Funding to the NER states was limited to only 11%, whereas the UTs accounted for a meagre 2%;
MMER: For the purpose of management, monitoring, evaluation and research (MMER), ₹ 2.51 crores has been
released to States and UTs;
Quality Assurance: With quality assurance being a mandatory aspect for institutions to receive funding under RUSA,
an amount equivalent to ₹ 4 crores has been released to NAAC for National Quality Renaissance Initiative. This is
expected to further strengthen the accreditation system in the states;
An amount of ₹ 1 crore has been released to TISS under the component “Leadership Development and Capacity
Building” for its proposal “Need Assessment and Strategic Planning for RUSA”
Figure 6: Funds released across all states and UTs (as on 13th August 2014)
Source: Status of Funds released as on 13th August 2014, MHRD, GoI
Preparatory grants released (in ₹ crores)
A. Non-NER States versus NER States versus UTs
Overall 23 States and 4 UTs have received ₹ 74.05 crores as preparatory grants. In terms of initial grants received, the
chart below depicts that the non-NER states have received a significant share i.e., approximately 66.4% as compared to
23.1% by the NER states and a meagre 10.5% by the UTs. In terms of value, the non-NER states received around ₹ 49.1
crores as compared to ₹ 17.1 crores by the NER states. The UTs have received ₹ 7.8 crores as initial preparatory funding
till August 2014.
PreparatoryGrants
MMERInfrastructure
Grants toUniversities
InfrastructureGrants tocolleges
Vocationalization
Equity Iniatives(2 States)
Upgradation ofexisting degree
colleges intomodel degree
colleges
Model DegreeColleges
UTs 7.80 0.12 3.90
NER States 17.10 0.32 7.88 1.31 21.02
Non NER States 49.15 2.07 18.12 22.39 0.76 0.80 1.80 172.84
0%
10%
20%
30%
40%
50%
60%
70%
80%
90%
100%
13 Annual Status of Higher Education in States and UTs 2014
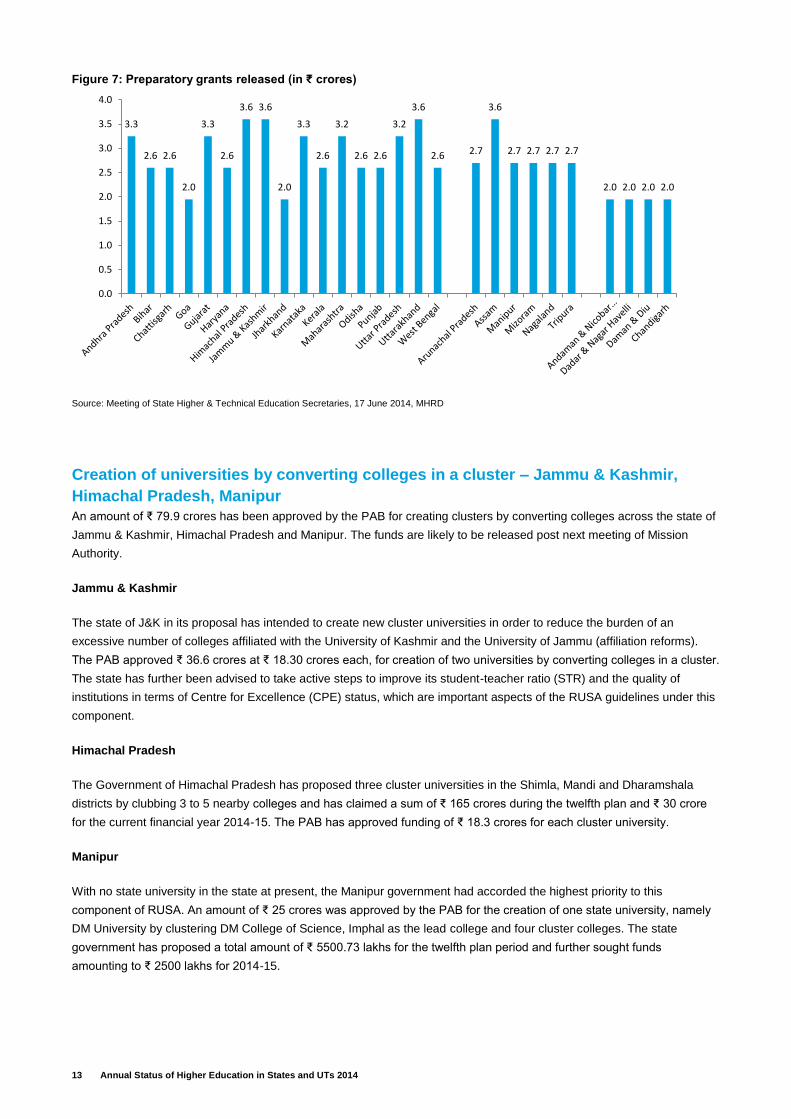
Figure 7: Preparatory grants released (in ₹ crores)
Source: Meeting of State Higher & Technical Education Secretaries, 17 June 2014, MHRD
Creation of universities by converting colleges in a cluster – Jammu & Kashmir,
Himachal Pradesh, Manipur
An amount of ₹ 79.9 crores has been approved by the PAB for creating clusters by converting colleges across the state of
Jammu & Kashmir, Himachal Pradesh and Manipur. The funds are likely to be released post next meeting of Mission
Authority.
Jammu & Kashmir
The state of J&K in its proposal has intended to create new cluster universities in order to reduce the burden of an
excessive number of colleges affiliated with the University of Kashmir and the University of Jammu (affiliation reforms).
The PAB approved ₹ 36.6 crores at ₹ 18.30 crores each, for creation of two universities by converting colleges in a cluster.
The state has further been advised to take active steps to improve its student-teacher ratio (STR) and the quality of
institutions in terms of Centre for Excellence (CPE) status, which are important aspects of the RUSA guidelines under this
component.
Himachal Pradesh
The Government of Himachal Pradesh has proposed three cluster universities in the Shimla, Mandi and Dharamshala
districts by clubbing 3 to 5 nearby colleges and has claimed a sum of ₹ 165 crores during the twelfth plan and ₹ 30 crore
for the current financial year 2014-15. The PAB has approved funding of ₹ 18.3 crores for each cluster university.
Manipur
With no state university in the state at present, the Manipur government had accorded the highest priority to this
component of RUSA. An amount of ₹ 25 crores was approved by the PAB for the creation of one state university, namely
DM University by clustering DM College of Science, Imphal as the lead college and four cluster colleges. The state
government has proposed a total amount of ₹ 5500.73 lakhs for the twelfth plan period and further sought funds
amounting to ₹ 2500 lakhs for 2014-15.
3.3
2.6 2.6
2.0
3.3
2.6
3.6 3.6
2.0
3.3
2.6
3.2
2.6 2.6
3.2
3.6
2.6 2.7
3.6
2.7 2.7 2.7 2.7
2.0 2.0 2.0 2.0
0.0
0.5
1.0
1.5
2.0
2.5
3.0
3.5
4.0
14 Annual Status of Higher Education in States and UTs 2014
Way forward / Outlook – A step forward
Drawing on the experience gathered by the states/UTs and the National Project Directorate while implementing RUSA, the
PAB has proposed to constitute a committee for evaluating improved implementation methodologies for executing the
various schemes and initiatives of the UGC, the All India council for Technical Education (AICTE) and the Association of
Indian Universities (AIU).
The board has further proposed to set up a committee to assess the various schemes of vocalisation of higher education.
The committee would also provide recommendations on synergizing these schemes, which could lead to the optimal use
of resources. Another proposal is to set up a committee to be responsible for evaluating the programmatic norms of the
Centrally Sponsored Scheme (CSS) and then recommend amendments on these norms, if any. The recommendations
would be provided to the RUSA Mission Authority for its consideration.
RUSA: the road ahead
After SSA and RMSA, the inception of a higher education focussed government program completes the entire lifecycle of
a student’s formal education needs. RUSA has the potential of becoming a major a critical milestone in our nation’s
journey of reforming the higher education sector. Yet, given its huge potential, the question on everyone’s mind is will this
program make a significant difference in the lives of our youth?
Since its first year of implementation till date, the RUSA has seen some progress with respect to preparations, groundwork
and compliance including submission of state plans. However, it has also started experiencing its share of challenges and
roadblocks. The states/UTs’ comprehension and adherence to the guidelines laid out in the RUSA document is one such
challenge, and a fundamental one.
At this stage, to build a strong foundation for RUSA implementation, the government needs to focus primarily on
monitoring and utilizing funds across the programme’s various components. Further strong emphasis needs to be laid on
the formation of SHECs and project directorates in line with the benchmarks and guidelines defined in the RUSA scheme.
The states/UTs also need to accelerate the submission of the SHEPs.
Rather than focusing on fund allocation, the need of the hour is to stress on the effective utilisation of the funds at the state
level. Further, close coordination and two-way communication between the centre and the states/UTs will play a critical
role in the successful implementation of the scheme.
RUSA is indeed a mission with a difference, holding significant promise in its potential to transform the Indian education
landscape. However, the eventual mission of the RUSA can only be considered as accomplished when adherence and
compliance becomes the norm, when implementation becomes a reality on the ground and when positive outcomes start
appearing in the years to come. When India becomes globally renowned as a strong, high-quality and accessible
knowledge hub of higher education, RUSA would have achieved its ultimate goal.
15 Annual Status of Higher Education in States and UTs 2014
FDI in Indian Higher Education
Tapping its full potential
Introduction
As the third largest education system in the world, in terms of enrolment, and the largest by total number of academic
institutions the India higher education sector is considered by many as a ‘sunrise sector’ for investment. Indeed, the
country has taken significant strides over the years in higher education. In FY14, the size of this market has been
estimated well above ₹3.83 trillion (US$62.34 billion) with over 38,000 formal degree/diploma granting higher education
institutes4.
Higher education: a high-potential growth hub
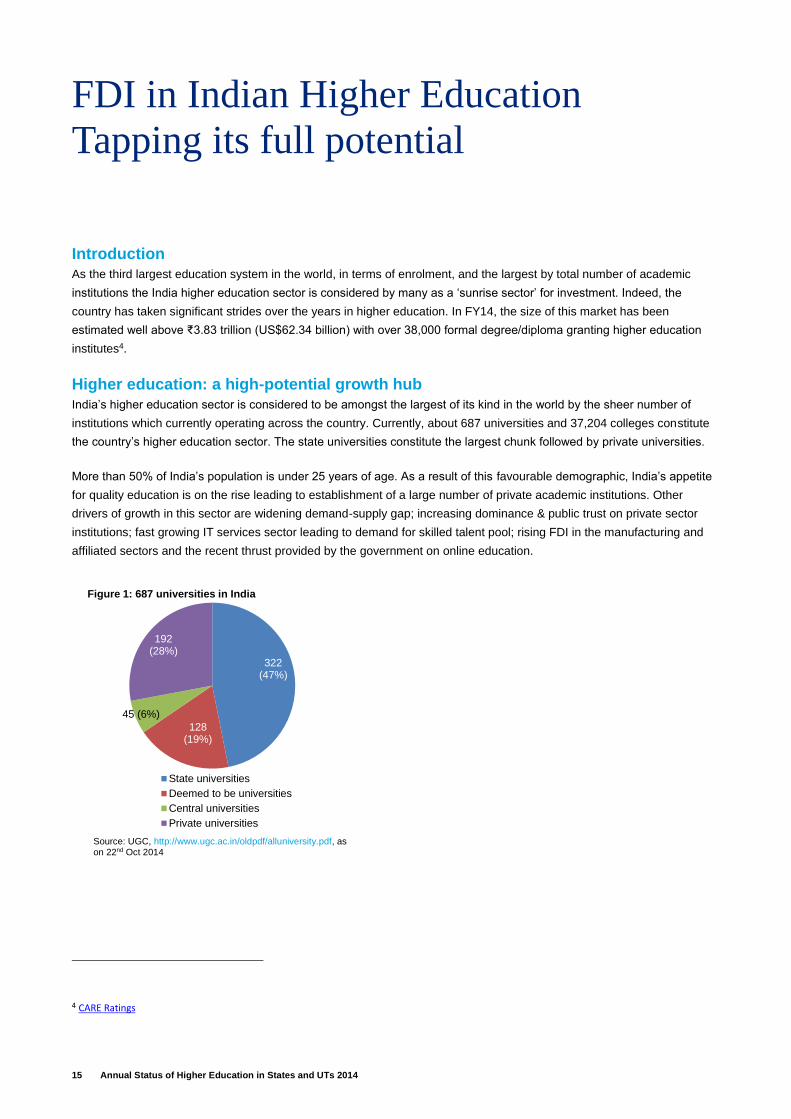
India’s higher education sector is considered to be amongst the largest of its kind in the world by the sheer number of
institutions which currently operating across the country. Currently, about 687 universities and 37,204 colleges constitute
the country’s higher education sector. The state universities constitute the largest chunk followed by private universities.
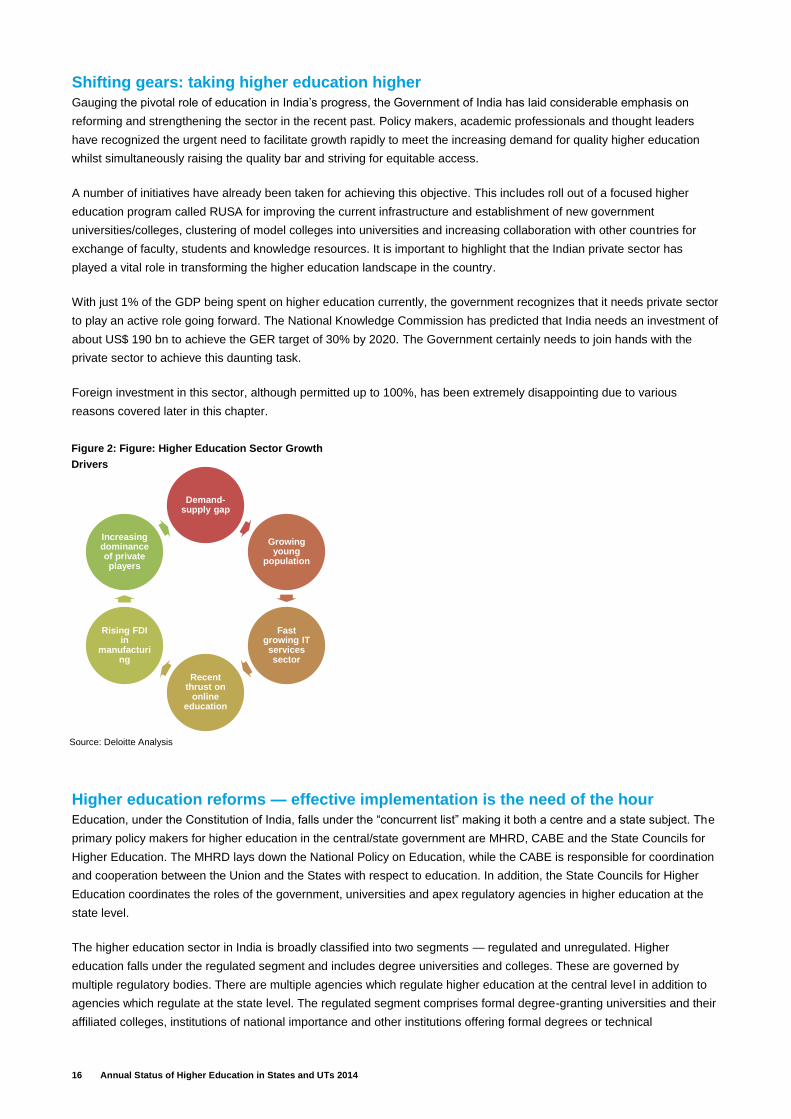
More than 50% of India’s population is under 25 years of age. As a result of this favourable demographic, India’s appetite
for quality education is on the rise leading to establishment of a large number of private academic institutions. Other
drivers of growth in this sector are widening demand-supply gap; increasing dominance & public trust on private sector
institutions; fast growing IT services sector leading to demand for skilled talent pool; rising FDI in the manufacturing and
affiliated sectors and the recent thrust provided by the government on online education.
4 CARE Ratings
322 (47%)
128 (19%)
45 (6%)
192 (28%)
Figure 1: 687 universities in India
State universities
Deemed to be universities
Central universities
Private universities
Source: UGC, http://www.ugc.ac.in/oldpdf/alluniversity.pdf, as on 22nd Oct 2014
16 Annual Status of Higher Education in States and UTs 2014
Shifting gears: taking higher education higher
Gauging the pivotal role of education in India’s progress, the Government of India has laid considerable emphasis on
reforming and strengthening the sector in the recent past. Policy makers, academic professionals and thought leaders
have recognized the urgent need to facilitate growth rapidly to meet the increasing demand for quality higher education
whilst simultaneously raising the quality bar and striving for equitable access.
A number of initiatives have already been taken for achieving this objective. This includes roll out of a focused higher
education program called RUSA for improving the current infrastructure and establishment of new government
universities/colleges, clustering of model colleges into universities and increasing collaboration with other countries for
exchange of faculty, students and knowledge resources. It is important to highlight that the Indian private sector has
played a vital role in transforming the higher education landscape in the country.
With just 1% of the GDP being spent on higher education currently, the government recognizes that it needs private sector
to play an active role going forward. The National Knowledge Commission has predicted that India needs an investment of
about US$ 190 bn to achieve the GER target of 30% by 2020. The Government certainly needs to join hands with the
private sector to achieve this daunting task.
Foreign investment in this sector, although permitted up to 100%, has been extremely disappointing due to various
reasons covered later in this chapter.
Higher education reforms — effective implementation is the need of the hour
Education, under the Constitution of India, falls under the “concurrent list” making it both a centre and a state subject. The
primary policy makers for higher education in the central/state government are MHRD, CABE and the State Councils for
Higher Education. The MHRD lays down the National Policy on Education, while the CABE is responsible for coordination
and cooperation between the Union and the States with respect to education. In addition, the State Councils for Higher
Education coordinates the roles of the government, universities and apex regulatory agencies in higher education at the
state level.
The higher education sector in India is broadly classified into two segments — regulated and unregulated. Higher
education falls under the regulated segment and includes degree universities and colleges. These are governed by
multiple regulatory bodies. There are multiple agencies which regulate higher education at the central level in addition to
agencies which regulate at the state level. The regulated segment comprises formal degree-granting universities and their
affiliated colleges, institutions of national importance and other institutions offering formal degrees or technical
Demand-supply gap
Growing young
population
Fast growing IT services sector
Recent thrust on
online education
Rising FDI in
manufacturing
Increasing dominance of private players
Figure 2: Figure: Higher Education Sector Growth
Drivers
Source: Deloitte Analysis
17 Annual Status of Higher Education in States and UTs 2014
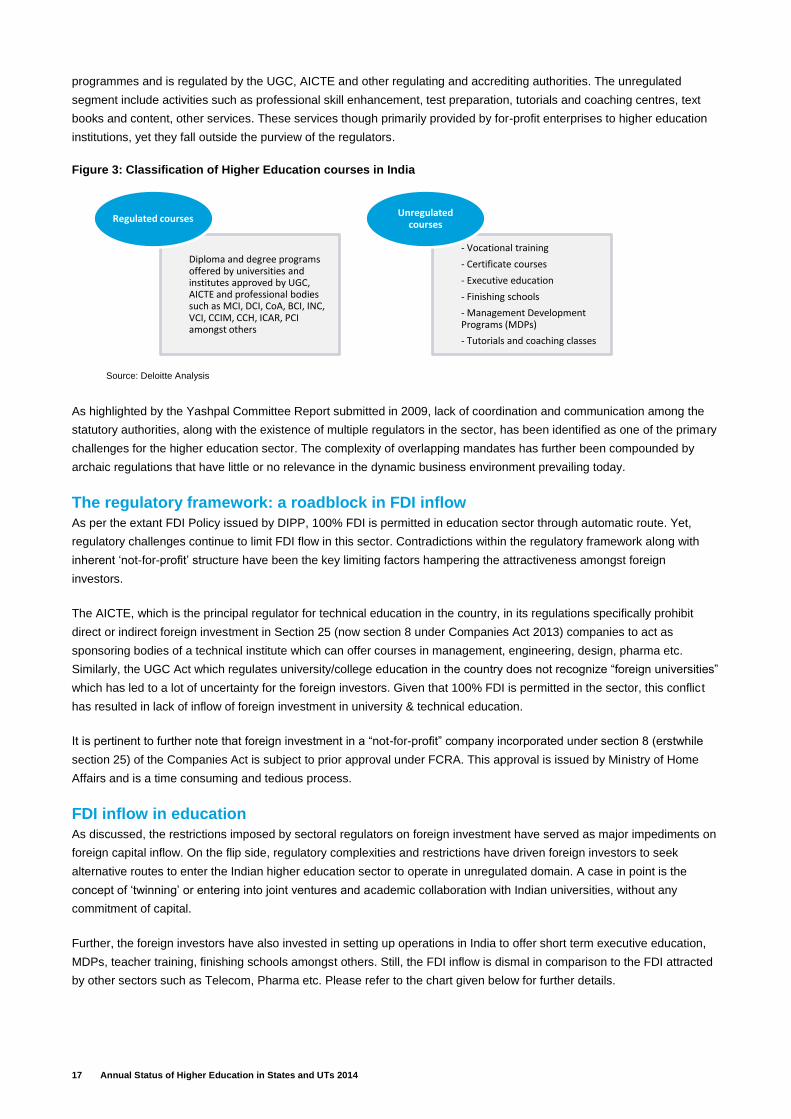
programmes and is regulated by the UGC, AICTE and other regulating and accrediting authorities. The unregulated
segment include activities such as professional skill enhancement, test preparation, tutorials and coaching centres, text
books and content, other services. These services though primarily provided by for-profit enterprises to higher education
institutions, yet they fall outside the purview of the regulators.
Figure 3: Classification of Higher Education courses in India
As highlighted by the Yashpal Committee Report submitted in 2009, lack of coordination and communication among the
statutory authorities, along with the existence of multiple regulators in the sector, has been identified as one of the primary
challenges for the higher education sector. The complexity of overlapping mandates has further been compounded by
archaic regulations that have little or no relevance in the dynamic business environment prevailing today.
The regulatory framework: a roadblock in FDI inflow
As per the extant FDI Policy issued by DIPP, 100% FDI is permitted in education sector through automatic route. Yet,
regulatory challenges continue to limit FDI flow in this sector. Contradictions within the regulatory framework along with
inherent ‘not-for-profit’ structure have been the key limiting factors hampering the attractiveness amongst foreign
investors.
The AICTE, which is the principal regulator for technical education in the country, in its regulations specifically prohibit
direct or indirect foreign investment in Section 25 (now section 8 under Companies Act 2013) companies to act as
sponsoring bodies of a technical institute which can offer courses in management, engineering, design, pharma etc.
Similarly, the UGC Act which regulates university/college education in the country does not recognize “foreign universities”
which has led to a lot of uncertainty for the foreign investors. Given that 100% FDI is permitted in the sector, this conflict
has resulted in lack of inflow of foreign investment in university & technical education.
It is pertinent to further note that foreign investment in a “not-for-profit” company incorporated under section 8 (erstwhile
section 25) of the Companies Act is subject to prior approval under FCRA. This approval is issued by Ministry of Home
Affairs and is a time consuming and tedious process.
FDI inflow in education
As discussed, the restrictions imposed by sectoral regulators on foreign investment have served as major impediments on
foreign capital inflow. On the flip side, regulatory complexities and restrictions have driven foreign investors to seek
alternative routes to enter the Indian higher education sector to operate in unregulated domain. A case in point is the
concept of ‘twinning’ or entering into joint ventures and academic collaboration with Indian universities, without any
commitment of capital.
Further, the foreign investors have also invested in setting up operations in India to offer short term executive education,
MDPs, teacher training, finishing schools amongst others. Still, the FDI inflow is dismal in comparison to the FDI attracted
by other sectors such as Telecom, Pharma etc. Please refer to the chart given below for further details.
Source: Deloitte Analysis
Diploma and degree programs offered by universities and institutes approved by UGC, AICTE and professional bodies such as MCI, DCI, CoA, BCI, INC, VCI, CCIM, CCH, ICAR, PCI amongst others
Regulated courses
- Vocational training
- Certificate courses
- Executive education
- Finishing schools
- Management Development Programs (MDPs)
- Tutorials and coaching classes
Unregulated courses
18 Annual Status of Higher Education in States and UTs 2014
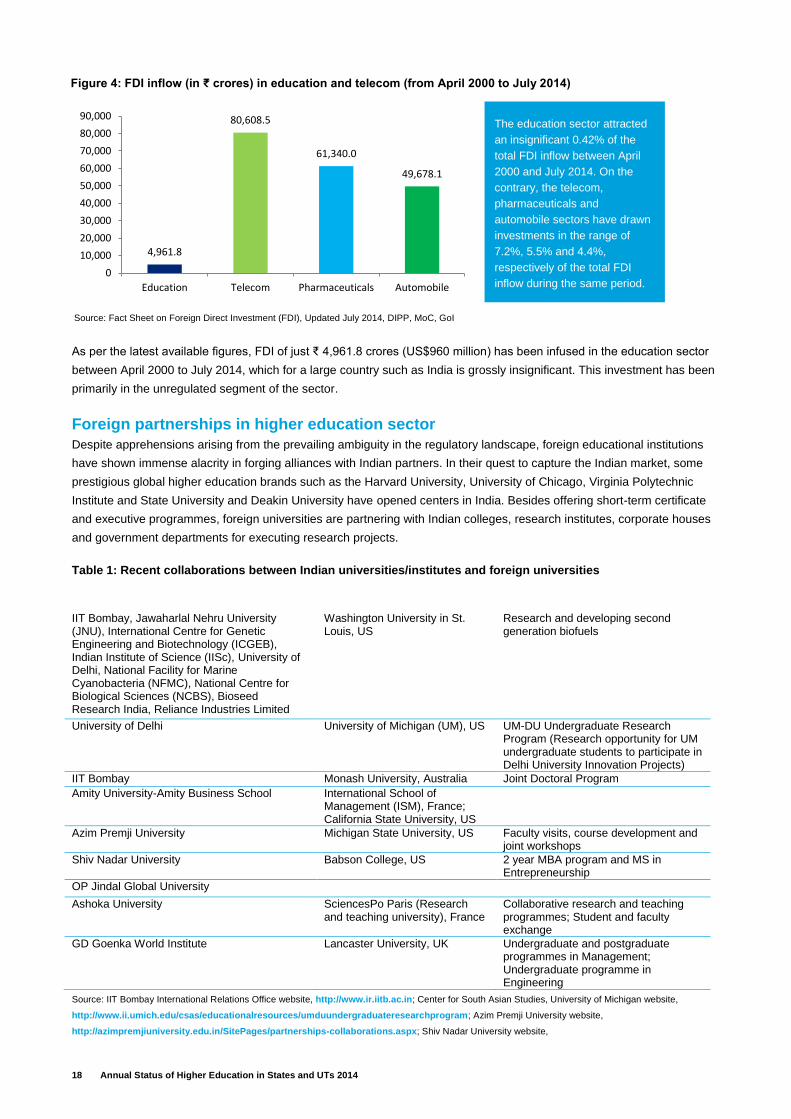
As per the latest available figures, FDI of just ₹ 4,961.8 crores (US$960 million) has been infused in the education sector
between April 2000 to July 2014, which for a large country such as India is grossly insignificant. This investment has been
primarily in the unregulated segment of the sector.
Foreign partnerships in higher education sector
Despite apprehensions arising from the prevailing ambiguity in the regulatory landscape, foreign educational institutions
have shown immense alacrity in forging alliances with Indian partners. In their quest to capture the Indian market, some
prestigious global higher education brands such as the Harvard University, University of Chicago, Virginia Polytechnic
Institute and State University and Deakin University have opened centers in India. Besides offering short-term certificate
and executive programmes, foreign universities are partnering with Indian colleges, research institutes, corporate houses
and government departments for executing research projects.
Table 1: Recent collaborations between Indian universities/institutes and foreign universities
Indian universities/institutes Foreign universities/institutes Program/area of collaborations
IIT Bombay, Jawaharlal Nehru University (JNU), International Centre for Genetic Engineering and Biotechnology (ICGEB), Indian Institute of Science (IISc), University of Delhi, National Facility for Marine Cyanobacteria (NFMC), National Centre for Biological Sciences (NCBS), Bioseed Research India, Reliance Industries Limited
Washington University in St. Louis, US
Research and developing second generation biofuels
University of Delhi University of Michigan (UM), US UM-DU Undergraduate Research Program (Research opportunity for UM undergraduate students to participate in Delhi University Innovation Projects)
IIT Bombay Monash University, Australia Joint Doctoral Program
Amity University-Amity Business School International School of Management (ISM), France; California State University, US
Azim Premji University Michigan State University, US Faculty visits, course development and joint workshops
Shiv Nadar University Babson College, US 2 year MBA program and MS in Entrepreneurship
OP Jindal Global University
Ashoka University SciencesPo Paris (Research and teaching university), France
Collaborative research and teaching programmes; Student and faculty exchange
GD Goenka World Institute Lancaster University, UK Undergraduate and postgraduate programmes in Management; Undergraduate programme in Engineering
Source: IIT Bombay International Relations Office website, http://www.ir.iitb.ac.in; Center for South Asian Studies, University of Michigan website,
http://www.ii.umich.edu/csas/educationalresources/umduundergraduateresearchprogram; Azim Premji University website,
http://azimpremjiuniversity.edu.in/SitePages/partnerships-collaborations.aspx; Shiv Nadar University website,
The education sector attracted
an insignificant 0.42% of the
total FDI inflow between April
2000 and July 2014. On the
contrary, the telecom,
pharmaceuticals and
automobile sectors have drawn
investments in the range of
7.2%, 5.5% and 4.4%,
respectively of the total FDI
inflow during the same period.
4,961.8
80,608.5
61,340.0
49,678.1
0
10,000
20,000
30,000
40,000
50,000
60,000
70,000
80,000
90,000
Education Telecom Pharmaceuticals Automobile
Figure 4: FDI inflow (in ₹ crores) in education and telecom (from April 2000 to July 2014)
Source: Fact Sheet on Foreign Direct Investment (FDI), Updated July 2014, DIPP, MoC, GoI
19 Annual Status of Higher Education in States and UTs 2014
http://snu.edu.in/admission/partner_programs.aspx; Ashoka University website, http://ashoka.edu.in/About-Us/Collaborations; Amity Business School
website, http://www.amity.edu/abs/Collaborations.asp; GD Goenka World Institute website, http://gdgwi.gdgoenka.com/lancaster-
university/collaboration-gdgwi
Note: The above is only a representative list of academic collaborations. The above websites were accessed on 26 October
2014.
At present, the AICTE has permitted only 11 institutions to conduct programmes in collaboration with foreign universities
or institutions. Further, 13 Indian institutions have been running technical courses with foreign collaborators without AICTE
approval.
Besides twinning arrangements and innovative collaborations within the regulated sector, the last five years have seen the
introduction of several bills aimed at addressing some pressing challenges — such as opening the sector to foreign
universities, overarching regulator, universities for research and innovation, prohibition of unfair practices and tribunals
amongst others. All of these bills have been tabled in the Parliament and have now either lapsed or withdrawn. One such
landmark bill that has been a subject of great interest is the Foreign Educational Institutions Bill which was aimed at
regulating entry & operation of foreign campuses in the country.
The Foreign Education Bill: its essence and current status
When the government announced the Foreign Educational Institutions (Regulation of Entry and Operations) Bill in 2010, it
generated tremendous excitement, especially amongst foreign institutions that have been keen to establish their physical
presence in the country. If passed, the legislation would have allowed access to quality higher education at affordable
costs and transformed the entire landscape of higher education system in the country. Intended to regulate the entry and
operations of foreign education providers, this bill was expected to make a significant impact on the higher education
landscape of the country. It was also anticipated that foreign institutions would introduce best practices for teaching,
curriculum, research and others to improve the current state of education. With none of the Indian higher education
institutions figuring in the Top 200 list, academicians were hoping that this move could prove to be a game changer.
The legislation would have enabled foreign universities to set up their own campuses and offer their host degrees to
students in India. The bill had placed certain conditions such as a minimum corpus of ₹ 500 million and restriction on
ploughing back of profits on foreign universities planning to set up a campus in India.
Last year, in a bid to avoid the Parliamentary approval route, the MHRD promulgated a separate regulation to regulate
entry and operation of foreign universities in the country under the aegis of UGC. This regulation sought to achieve the
same objective as defined in the foreign education bill through an
executive order. As per the press release issued by MHRD, foreign
educational institutions (FEIs) were permitted to set up campuses in
India once the FEIs have been notified as foreign education
provider (FEPs) by the UGC. Additional eligibility conditions issued
for FEIs were:
Ranking of FEIs to be among the top 400 universities of the world as per the ranking published by Times Higher
Education, Quacquarelli Symonds (QS) or the Academic Ranking of World Universities (ARWU);
FEIs to establish campus through an association to be registered as a company under section 25 (now section 8) of the
Companies Act, 1956 (now Companies Act, 2013);
FEIs need to be not-for-profit legal entities, with existence for at least twenty years;
FEIs to maintain a corpus of not less than rupees twenty five crores.
With education experts voicing their opinion both in favour of and against allowing foreign universities campuses in India,
this may be the opportune time for the government to consider bringing in a consensus on this subject. Many foreign
universities at present are operating in India either through partnerships with local universities or through local
representative offices promoting their universities in the country. At this stage, it has become important for the government
Key foreign investors in the education sector in India
Pearson Plc
Gems Education
Skillsoft Limited
Granite Hill Capital Partners
Laureate
20 Annual Status of Higher Education in States and UTs 2014
to clear its stand on the entry of foreign universities i.e., rolling-out an unambiguous comprehensive policy to set campus
in India.
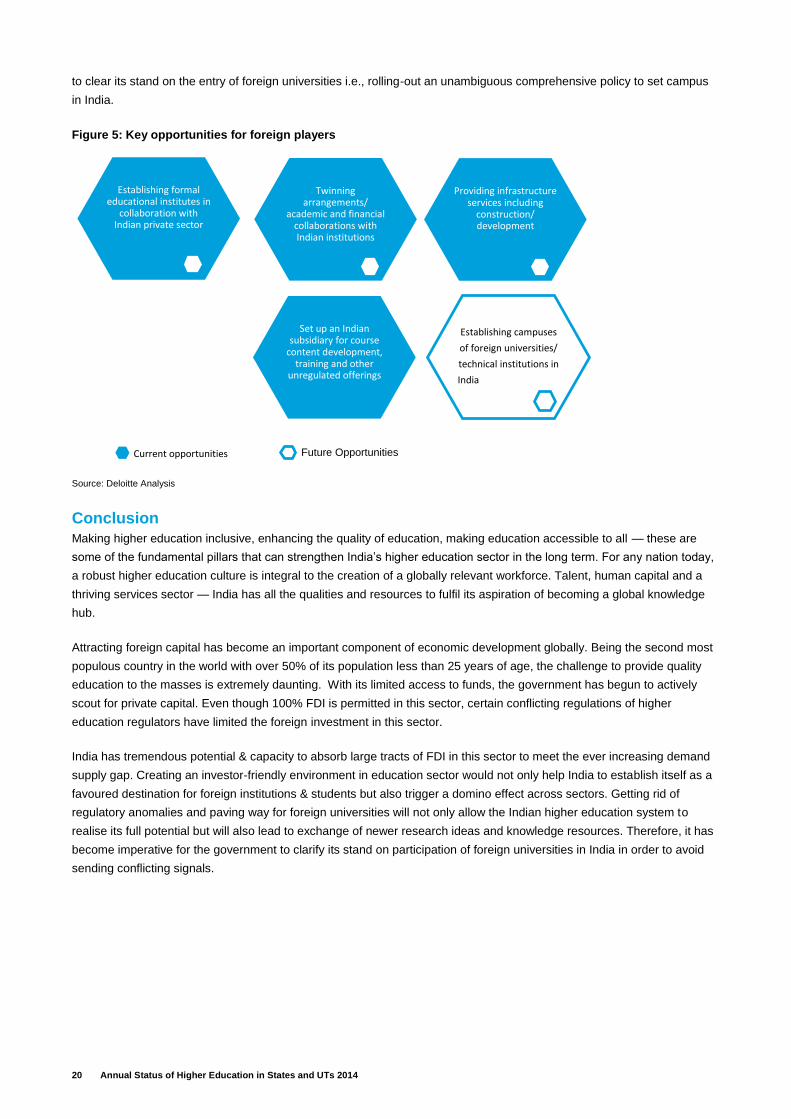
Figure 5: Key opportunities for foreign players
Source: Deloitte Analysis
Conclusion
Making higher education inclusive, enhancing the quality of education, making education accessible to all — these are
some of the fundamental pillars that can strengthen India’s higher education sector in the long term. For any nation today,
a robust higher education culture is integral to the creation of a globally relevant workforce. Talent, human capital and a
thriving services sector — India has all the qualities and resources to fulfil its aspiration of becoming a global knowledge
hub.
Attracting foreign capital has become an important component of economic development globally. Being the second most
populous country in the world with over 50% of its population less than 25 years of age, the challenge to provide quality
education to the masses is extremely daunting. With its limited access to funds, the government has begun to actively
scout for private capital. Even though 100% FDI is permitted in this sector, certain conflicting regulations of higher
education regulators have limited the foreign investment in this sector.
India has tremendous potential & capacity to absorb large tracts of FDI in this sector to meet the ever increasing demand
supply gap. Creating an investor-friendly environment in education sector would not only help India to establish itself as a
favoured destination for foreign institutions & students but also trigger a domino effect across sectors. Getting rid of
regulatory anomalies and paving way for foreign universities will not only allow the Indian higher education system to
realise its full potential but will also lead to exchange of newer research ideas and knowledge resources. Therefore, it has
become imperative for the government to clarify its stand on participation of foreign universities in India in order to avoid
sending conflicting signals.
Establishing formal educational institutes in
collaboration with Indian private sector
Providing infrastructure services including
construction/ development
Twinning arrangements/
academic and financial collaborations with Indian institutions
Set up an Indian subsidiary for course
content development, training and other
unregulated offerings
Establishing campuses
of foreign universities/
technical institutions in
India and students) and
other innovative service
Current opportunities Future Opportunities
21 Annual Status of Higher Education in States and UTs 2014
Incentivizing Institutional Performance
Introduction
Improving the performance of higher education institutes has long been a challenge facing administrators and other key
stakeholders of education systems the world over. In India, the higher education system is in the midst of a period of
significant transition, with rapid growth in the number of institutions accompanied by policy measures aimed at addressing
key challenges relating to access, equity and, significantly, quality. This note looks at how performance is defined in the
context of higher education institutes as well as the types of performance incentives. It highlights the need for incentivizing
institutes to improve performance in India how RUSA aims to address some of the requirements in this respect. It also
presents some learning from international experiences in incentivizing institutional performance, which can be considered
in the Indian context.
Defining institutional performance
Higher educational institutions typically have a wide range of objectives ranging from contributing to the knowledge-base
in the country, equipping students with employable skills, undertaking research and development, promoting social values,
etc. As a result, defining and measuring quality and performance at an institutional level is a complex task. A common
approach is through the use of a set of indicators or parameters for performance, which may vary across institutions.
These would typically include a combination of input and output based indicators that seek to measure the performance of
the institute in alignment to its goals and objectives.
For the purpose of comparison of performance across institutes, institutional rankings have become a common feature,
which include a number of performance indicators, accreditation and other qualitative assessments of institutional quality.
On a global scale, several world rankings of higher education institutes are published on an annual basis that serve as a
proxy for assessing institutional performance. Some of the parameters that they consider in their evaluation methodologies
can hence serve as a useful benchmark for defining institutional performance. The Times Higher Education rankings rank
universities based on 13 parameters in four key segments—industry income, teaching-learning environment, research,
and international outlook. The Quacquarelli Symonds (QS) World University Rankings rate universities on four broad
areas of research, teaching, employability and internationalization. In India, the Government of India plans to develop its
own national ranking framework which, in addition to considering some of these parameters, will also reflect some of the
objectives and considerations for higher education institutes from an Indian context and perspective.
In addition to rankings, one of the most common forms of quality assessment for an institution is through the process of
accreditation, which typically consists of a self-evaluation by the institution, a study visit by a team of evaluators, and an
examination by an accreditation committee. The value framework of India’s National Assessment and Accreditation
Council (NAAC) identifies five core values for institutions of higher education, as goals of their activities - Contributing to
National Development; Fostering Global Competencies among Students; Inculcating a Value System in Students and
Promoting the Use of Technology and; Quest for Excellence5. NAAC rates institutes on parameters aligned to these goals
using an Institutional Cumulative Grade Point Average (I-CGPA) system on a four point scale resulting in grades ranging
from “A” (Very Good–Accredited) to “D” (failure to receive accreditation).
5 Best Practise in Quality Management in Higher Education, National Assessment and Accreditation Council (NAAC), 2005
22 Annual Status of Higher Education in States and UTs 2014
Types of performance incentives
Performance incentives for institutes can be in the nature of funding based and non-funding based incentives, though in
practice they are often linked to financial incentives. Funding linked incentives have proved to be an effective approach in
several international contexts and is considered an important mechanism to incentivize performance from institutions. A
key aspect of this approach is the accountability that is placed on institutes to meet the criteria for receiving funds. It also
encourages institutes to be innovative in the pursuit of quality improvement.
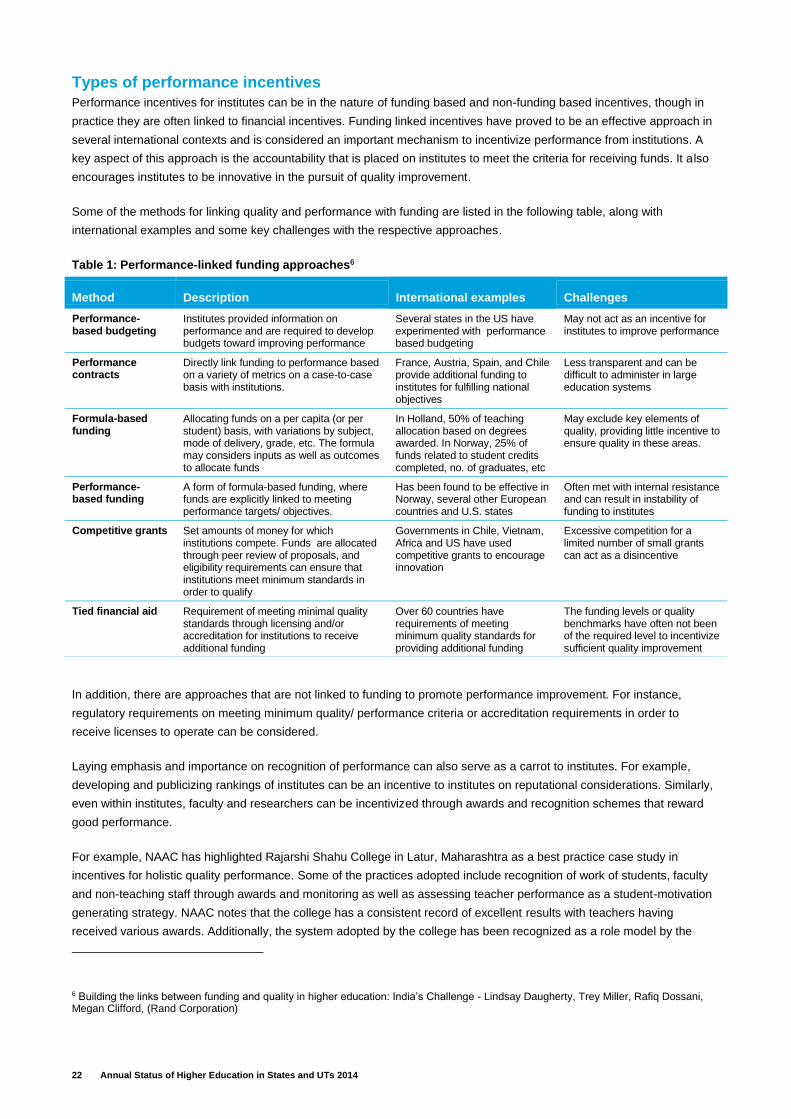
Some of the methods for linking quality and performance with funding are listed in the following table, along with
international examples and some key challenges with the respective approaches.
Table 1: Performance-linked funding approaches6
Method Description International examples Challenges
Performance-based budgeting
Institutes provided information on performance and are required to develop budgets toward improving performance
Several states in the US have experimented with performance based budgeting
May not act as an incentive for institutes to improve performance
Performance contracts
Directly link funding to performance based on a variety of metrics on a case-to-case basis with institutions.
France, Austria, Spain, and Chile provide additional funding to institutes for fulfilling national objectives
Less transparent and can be difficult to administer in large education systems
Formula-based funding
Allocating funds on a per capita (or per student) basis, with variations by subject, mode of delivery, grade, etc. The formula may considers inputs as well as outcomes to allocate funds
In Holland, 50% of teaching allocation based on degrees awarded. In Norway, 25% of funds related to student credits completed, no. of graduates, etc
May exclude key elements of quality, providing little incentive to ensure quality in these areas.
Performance-based funding
A form of formula-based funding, where funds are explicitly linked to meeting performance targets/ objectives.
Has been found to be effective in Norway, several other European countries and U.S. states
Often met with internal resistance and can result in instability of funding to institutes
Competitive grants Set amounts of money for which institutions compete. Funds are allocated through peer review of proposals, and eligibility requirements can ensure that institutions meet minimum standards in order to qualify
Governments in Chile, Vietnam, Africa and US have used competitive grants to encourage innovation
Excessive competition for a limited number of small grants can act as a disincentive
Tied financial aid Requirement of meeting minimal quality standards through licensing and/or accreditation for institutions to receive additional funding
Over 60 countries have requirements of meeting minimum quality standards for providing additional funding
The funding levels or quality benchmarks have often not been of the required level to incentivize sufficient quality improvement
In addition, there are approaches that are not linked to funding to promote performance improvement. For instance,
regulatory requirements on meeting minimum quality/ performance criteria or accreditation requirements in order to
receive licenses to operate can be considered.
Laying emphasis and importance on recognition of performance can also serve as a carrot to institutes. For example,
developing and publicizing rankings of institutes can be an incentive to institutes on reputational considerations. Similarly,
even within institutes, faculty and researchers can be incentivized through awards and recognition schemes that reward
good performance.
For example, NAAC has highlighted Rajarshi Shahu College in Latur, Maharashtra as a best practice case study in
incentives for holistic quality performance. Some of the practices adopted include recognition of work of students, faculty
and non-teaching staff through awards and monitoring as well as assessing teacher performance as a student-motivation
generating strategy. NAAC notes that the college has a consistent record of excellent results with teachers having
received various awards. Additionally, the system adopted by the college has been recognized as a role model by the
6 Building the links between funding and quality in higher education: India’s Challenge - Lindsay Daugherty, Trey Miller, Rafiq Dossani, Megan Clifford, (Rand Corporation)
23 Annual Status of Higher Education in States and UTs 2014
community and the State government with the practice having come to be known popularly as Shahu Pattern/ Latur
Pattern.
Need for incentivizing institutional performance in India
While India has made important strides towards improving its higher education system, which is amongst the largest in the
world, there remain significant challenges to be addressed. Access to higher education has increased over the years, but
enrolment rates are still well short of developed countries. Shortage of faculty is a key issue, which is more acutely felt
with the rapid growth in the number of higher education institutes. Several institutes suffer from a lack of adequate
infrastructure and equipment, while there are quality related concerns with inadequate focus on research in higher
education, low employability and skills of students and low level of industry-academia interactions oft cited as key issues
facing the higher education system in the country.
These issues have been reflected in the performance of Indian higher education institutes in international rankings. For
example, only four institutions from the country making it to the top 400 and none to the top 200 in the Times Higher
Education (THE) World University Ranking for 2014-15. Additionally, no Indian institutions featured in the top 200 in the
QS World University Rankings. While there have been arguments questioning the applicability of some of the rating
criteria and parameters to Indian institutes, these figures do highlight the quality related challenges facing higher education
in India, and illustrate the requirement for improving performance at an institutional level.
From a policy perspective, this also gives rise to the question of how to incentivize institutions to improve performance.
Improving quality has been prioritised in the country's 12th Five Year Plan, which also calls for an increase in funding for
quality related initiatives to align funding with the new priorities for quality improvement.
Provisions under RUSA for incentivizing institutions
Towards addressing the challenges in higher education in India, the most significant response by the Government of India
in recent years has been the launch of Rashtriya Uchchatar Shiksha Abhiyan (RUSA), a centrally sponsored scheme for
higher education which will focus on state higher educational institutions and be spread over the 12th and 13th Five Year
Plan periods. RUSA aims to improve access, equity and quality in higher education through planned development of
higher education at the state level.
With specific reference to incentivizing performance, under RUSA ‘Incentivizing and disincentivizing’ as well as
‘Performance based outlays and outcome based reimbursements’ constitute two of the guiding principles of the scheme.
The RUSA National Higher Education Mission document details these principles as follows:
“The cornerstone around which RUSA is designed is that the states and state institutions will be funded on the basis of
their performance against mutually agreed targets to between the states and the center. The funds given to a state will be
linked with the outcomes it can achieve in the higher education sector. These results and parameters of performance will
be defined through norms that will focus on key areas of equity, access and excellence.
RUSA will also be using the principles of incentivizing desirable actions of states and institutions and dis-incentivizing
undesirable actions. Not only will compliance to rules, regulations and fulfillment of norms be supported by incentives,
non-performance or non-fulfillment of prerequisites and norms will invite sanctions/penalties/reduced allocations for states
and institutions. This is intended to make these scheme not only demand driven, but also competitive. The states and
institutions will be encouraged to compete with each other in order to reap benefits of competition based formulaic grants.”
24 Annual Status of Higher Education in States and UTs 2014
Thus performance-linked funding and promotion of competition between institutions are key drivers for quality
improvement under the RUSA scheme. While grants will be prioritized on the basis of factors aimed at increasing access
and addressing infrastructure requirements, such as improving facilities for female students and support services for
disabled students and minority groups, funding will also be more impact and result oriented, and with greater focus on
quality related aspects such as research and innovation. Requirements for upgrading to university status include
accreditation NAAC at no less than an ‘A’ grade. Colleges will also need to demonstrate “credible research capacity”,
“must be multi-faculty” and “should have a healthy student-teacher ratio (20:1)”.
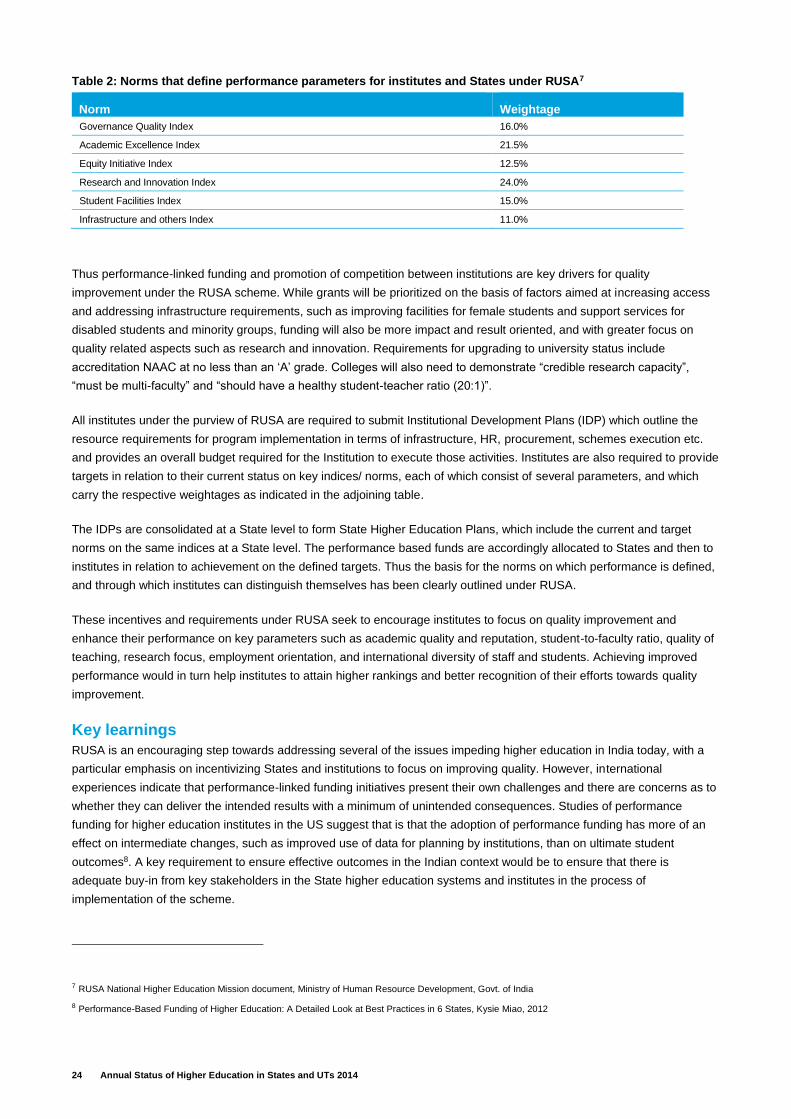
All institutes under the purview of RUSA are required to submit Institutional Development Plans (IDP) which outline the
resource requirements for program implementation in terms of infrastructure, HR, procurement, schemes execution etc.
and provides an overall budget required for the Institution to execute those activities. Institutes are also required to provide
targets in relation to their current status on key indices/ norms, each of which consist of several parameters, and which
carry the respective weightages as indicated in the adjoining table.
The IDPs are consolidated at a State level to form State Higher Education Plans, which include the current and target
norms on the same indices at a State level. The performance based funds are accordingly allocated to States and then to
institutes in relation to achievement on the defined targets. Thus the basis for the norms on which performance is defined,
and through which institutes can distinguish themselves has been clearly outlined under RUSA.
These incentives and requirements under RUSA seek to encourage institutes to focus on quality improvement and
enhance their performance on key parameters such as academic quality and reputation, student-to-faculty ratio, quality of
teaching, research focus, employment orientation, and international diversity of staff and students. Achieving improved
performance would in turn help institutes to attain higher rankings and better recognition of their efforts towards quality
improvement.
Key learnings
RUSA is an encouraging step towards addressing several of the issues impeding higher education in India today, with a
particular emphasis on incentivizing States and institutions to focus on improving quality. However, international
experiences indicate that performance-linked funding initiatives present their own challenges and there are concerns as to
whether they can deliver the intended results with a minimum of unintended consequences. Studies of performance
funding for higher education institutes in the US suggest that is that the adoption of performance funding has more of an
effect on intermediate changes, such as improved use of data for planning by institutions, than on ultimate student
outcomes8. A key requirement to ensure effective outcomes in the Indian context would be to ensure that there is
adequate buy-in from key stakeholders in the State higher education systems and institutes in the process of
implementation of the scheme.
7 RUSA National Higher Education Mission document, Ministry of Human Resource Development, Govt. of India
8 Performance-Based Funding of Higher Education: A Detailed Look at Best Practices in 6 States, Kysie Miao, 2012
Table 2: Norms that define performance parameters for institutes and States under RUSA7
Norm Weightage
Governance Quality Index 16.0%
Academic Excellence Index 21.5%
Equity Initiative Index 12.5%
Research and Innovation Index 24.0%
Student Facilities Index 15.0%
Infrastructure and others Index 11.0%
25 Annual Status of Higher Education in States and UTs 2014
As such, the use of incentives to encourage institutional performance is likely to be more effective than dis-incentives to
discourage non-performance. Research also supports similar findings - for instance, accreditation has been found to be
more successful when positive incentives are linked to accreditation rather than punitive measures9.
Given the emphasis on performance measures, indicators and targets which are linked to funding, a critical requirement
for the country is to implement a robust and effective data collection and monitoring mechanism. This dimension
constitutes a key component of RUSA, and its success will have a significant impact on the overall outcome of the
scheme.
Measures such as the move towards developing an Indian framework for ranking of institutes could also encourage
competition amongst institutes to improve performance in order to feature prominently on these measures, while funding
for competitive grants can be used to incentivise research and development in institutes. With improved policy and funding
support through RUSA, it is hoped that that several Indian universities and institutes eventually feature among the leading
institutes in international rankings and performance measures as well.
Finally, frequent evaluation of the effectiveness of the measures under RUSA for incentivizing institutional performance is
essential. As it is a relatively new scheme that seeks to significantly transform the planning, funding, governance and
evaluation processes in higher education in India, institutes are likely to encounter unexpected challenges towards
understanding the mechanisms involved and achieving certain performance targets. Additionally, institutions producing
results that already meet or exceed national standards may also find it difficult to achieve continued progress over time. As
such periodic reviews will help to identify bottlenecks and make adjustments in aspects such as performance measures
and incentives.
9 The Growing Accountability Agenda in Tertiary Education: Progress or Mixed Blessing?, J. Salmi,, The World Bank, 2009
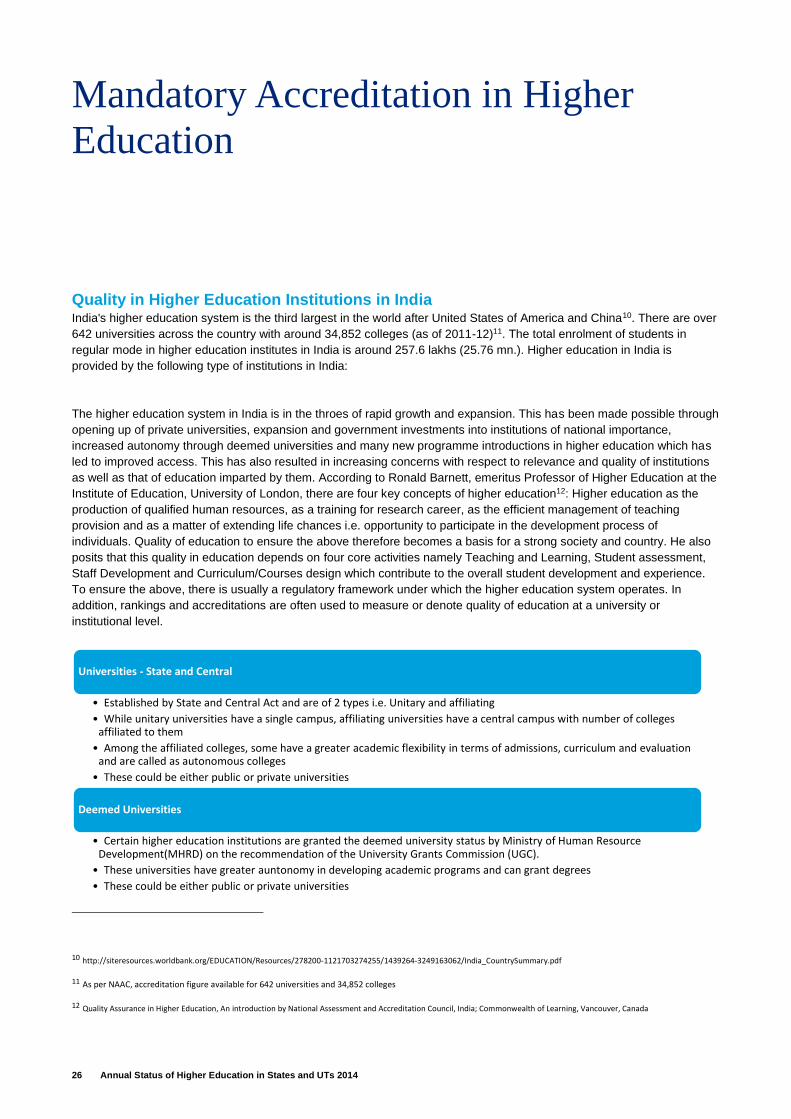
26 Annual Status of Higher Education in States and UTs 2014
Universities - State and Central
• Established by State and Central Act and are of 2 types i.e. Unitary and affiliating
• While unitary universities have a single campus, affiliating universities have a central campus with number of colleges affiliated to them
• Among the affiliated colleges, some have a greater academic flexibility in terms of admissions, curriculum and evaluation and are called as autonomous colleges
• These could be either public or private universities
Deemed Universities
• Certain higher education institutions are granted the deemed university status by Ministry of Human Resource Development(MHRD) on the recommendation of the University Grants Commission (UGC).
• These universities have greater auntonomy in developing academic programs and can grant degrees
• These could be either public or private universities
Mandatory Accreditation in Higher
Education
Quality in Higher Education Institutions in India India's higher education system is the third largest in the world after United States of America and China10. There are over
642 universities across the country with around 34,852 colleges (as of 2011-12)11. The total enrolment of students in
regular mode in higher education institutes in India is around 257.6 lakhs (25.76 mn.). Higher education in India is
provided by the following type of institutions in India:
The higher education system in India is in the throes of rapid growth and expansion. This has been made possible through
opening up of private universities, expansion and government investments into institutions of national importance,
increased autonomy through deemed universities and many new programme introductions in higher education which has
led to improved access. This has also resulted in increasing concerns with respect to relevance and quality of institutions
as well as that of education imparted by them. According to Ronald Barnett, emeritus Professor of Higher Education at the
Institute of Education, University of London, there are four key concepts of higher education12: Higher education as the
production of qualified human resources, as a training for research career, as the efficient management of teaching
provision and as a matter of extending life chances i.e. opportunity to participate in the development process of
individuals. Quality of education to ensure the above therefore becomes a basis for a strong society and country. He also
posits that this quality in education depends on four core activities namely Teaching and Learning, Student assessment,
Staff Development and Curriculum/Courses design which contribute to the overall student development and experience.
To ensure the above, there is usually a regulatory framework under which the higher education system operates. In
addition, rankings and accreditations are often used to measure or denote quality of education at a university or
institutional level.
10 http://siteresources.worldbank.org/EDUCATION/Resources/278200-1121703274255/1439264-3249163062/India_CountrySummary.pdf
11 As per NAAC, accreditation figure available for 642 universities and 34,852 colleges
12 Quality Assurance in Higher Education, An introduction by National Assessment and Accreditation Council, India; Commonwealth of Learning, Vancouver, Canada
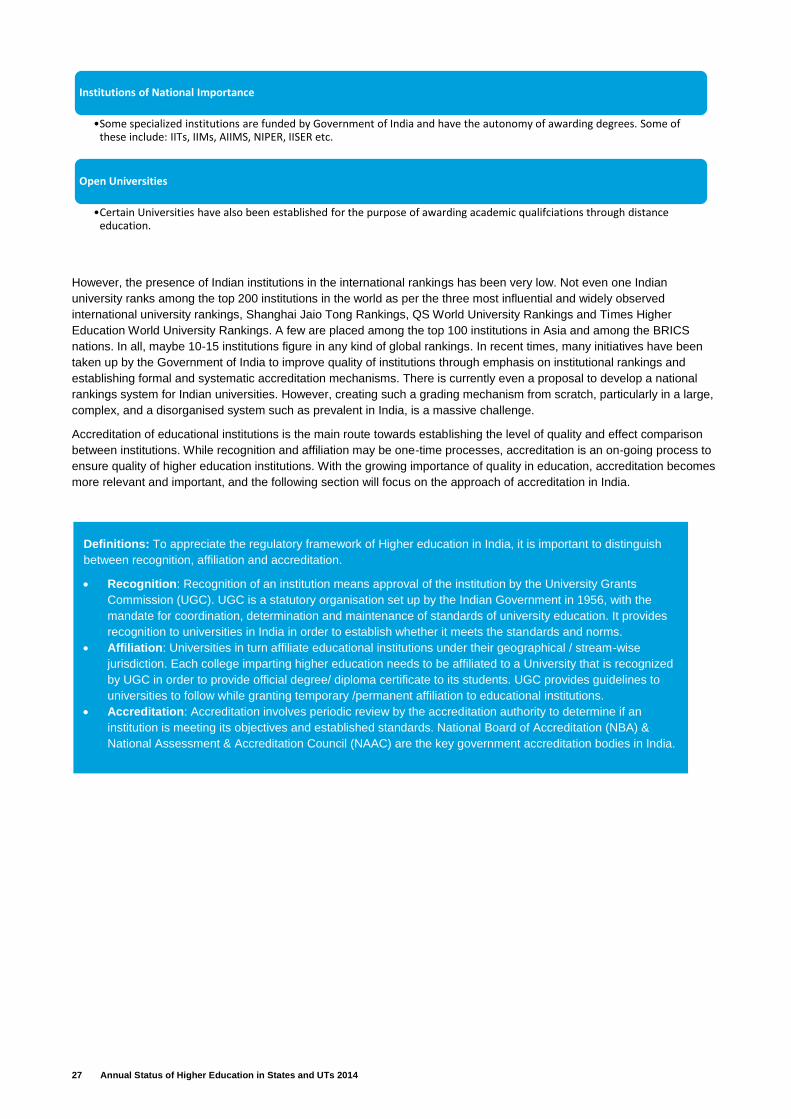
27 Annual Status of Higher Education in States and UTs 2014
Institutions of National Importance
•Some specialized institutions are funded by Government of India and have the autonomy of awarding degrees. Some of these include: IITs, IIMs, AIIMS, NIPER, IISER etc.
Open Universities
•Certain Universities have also been established for the purpose of awarding academic qualifciations through distance education.
However, the presence of Indian institutions in the international rankings has been very low. Not even one Indian
university ranks among the top 200 institutions in the world as per the three most influential and widely observed
international university rankings, Shanghai Jaio Tong Rankings, QS World University Rankings and Times Higher
Education World University Rankings. A few are placed among the top 100 institutions in Asia and among the BRICS
nations. In all, maybe 10-15 institutions figure in any kind of global rankings. In recent times, many initiatives have been
taken up by the Government of India to improve quality of institutions through emphasis on institutional rankings and
establishing formal and systematic accreditation mechanisms. There is currently even a proposal to develop a national
rankings system for Indian universities. However, creating such a grading mechanism from scratch, particularly in a large,
complex, and a disorganised system such as prevalent in India, is a massive challenge.
Accreditation of educational institutions is the main route towards establishing the level of quality and effect comparison
between institutions. While recognition and affiliation may be one-time processes, accreditation is an on-going process to
ensure quality of higher education institutions. With the growing importance of quality in education, accreditation becomes
more relevant and important, and the following section will focus on the approach of accreditation in India.
Definitions: To appreciate the regulatory framework of Higher education in India, it is important to distinguish
between recognition, affiliation and accreditation.
Recognition: Recognition of an institution means approval of the institution by the University Grants
Commission (UGC). UGC is a statutory organisation set up by the Indian Government in 1956, with the
mandate for coordination, determination and maintenance of standards of university education. It provides
recognition to universities in India in order to establish whether it meets the standards and norms.
Affiliation: Universities in turn affiliate educational institutions under their geographical / stream-wise
jurisdiction. Each college imparting higher education needs to be affiliated to a University that is recognized
by UGC in order to provide official degree/ diploma certificate to its students. UGC provides guidelines to
universities to follow while granting temporary /permanent affiliation to educational institutions.
Accreditation: Accreditation involves periodic review by the accreditation authority to determine if an
institution is meeting its objectives and established standards. National Board of Accreditation (NBA) &
National Assessment & Accreditation Council (NAAC) are the key government accreditation bodies in India.
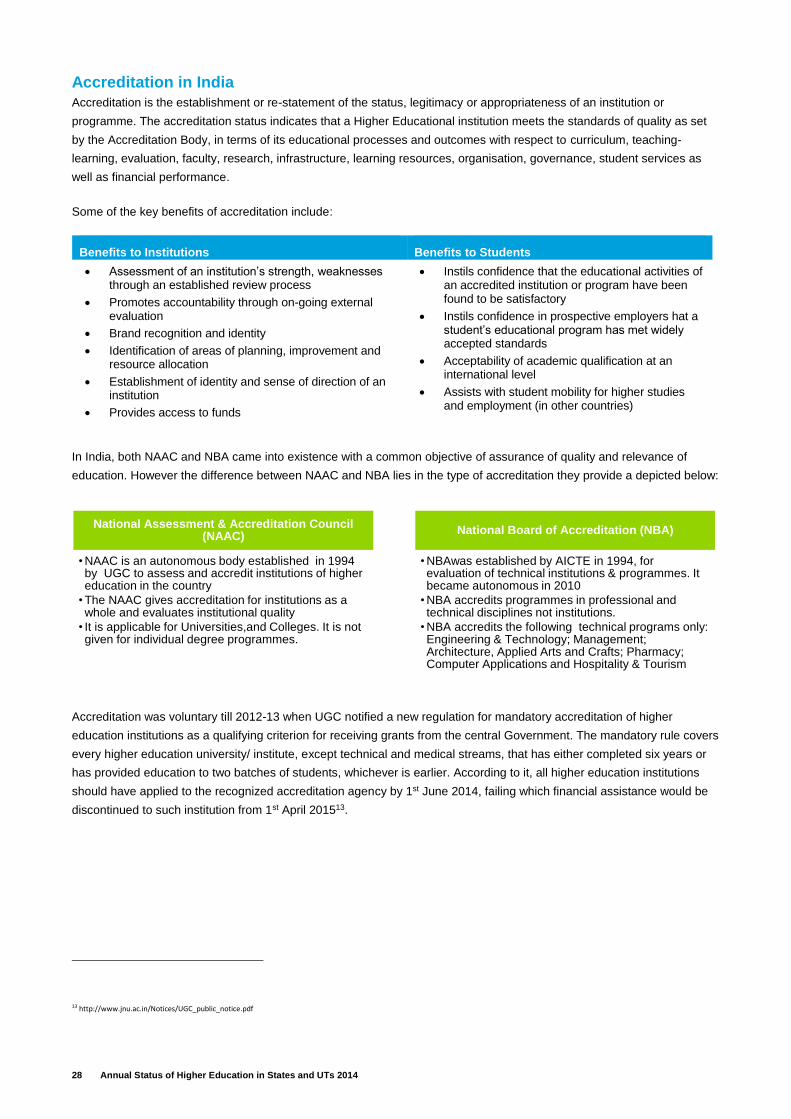
28 Annual Status of Higher Education in States and UTs 2014
National Assessment & Accreditation Council (NAAC)
• NAAC is an autonomous body established in 1994 by UGC to assess and accredit institutions of higher education in the country
• The NAAC gives accreditation for institutions as a whole and evaluates institutional quality
• It is applicable for Universities,and Colleges. It is not given for individual degree programmes.
National Board of Accreditation (NBA)
• NBAwas established by AICTE in 1994, for evaluation of technical institutions & programmes. It became autonomous in 2010
• NBA accredits programmes in professional and technical disciplines not institutions.
• NBA accredits the following technical programs only: Engineering & Technology; Management; Architecture, Applied Arts and Crafts; Pharmacy; Computer Applications and Hospitality & Tourism
Accreditation in India
Accreditation is the establishment or re-statement of the status, legitimacy or appropriateness of an institution or
programme. The accreditation status indicates that a Higher Educational institution meets the standards of quality as set
by the Accreditation Body, in terms of its educational processes and outcomes with respect to curriculum, teaching-
learning, evaluation, faculty, research, infrastructure, learning resources, organisation, governance, student services as
well as financial performance.
Some of the key benefits of accreditation include:
Benefits to Institutions Benefits to Students
Assessment of an institution’s strength, weaknesses through an established review process
Promotes accountability through on-going external evaluation
Brand recognition and identity
Identification of areas of planning, improvement and resource allocation
Establishment of identity and sense of direction of an institution
Provides access to funds
Instils confidence that the educational activities of an accredited institution or program have been found to be satisfactory
Instils confidence in prospective employers hat a student’s educational program has met widely accepted standards
Acceptability of academic qualification at an international level
Assists with student mobility for higher studies and employment (in other countries)
In India, both NAAC and NBA came into existence with a common objective of assurance of quality and relevance of
education. However the difference between NAAC and NBA lies in the type of accreditation they provide a depicted below:
Accreditation was voluntary till 2012-13 when UGC notified a new regulation for mandatory accreditation of higher
education institutions as a qualifying criterion for receiving grants from the central Government. The mandatory rule covers
every higher education university/ institute, except technical and medical streams, that has either completed six years or
has provided education to two batches of students, whichever is earlier. According to it, all higher education institutions
should have applied to the recognized accreditation agency by 1st June 2014, failing which financial assistance would be
discontinued to such institution from 1st April 201513.
13 http://www.jnu.ac.in/Notices/UGC_public_notice.pdf
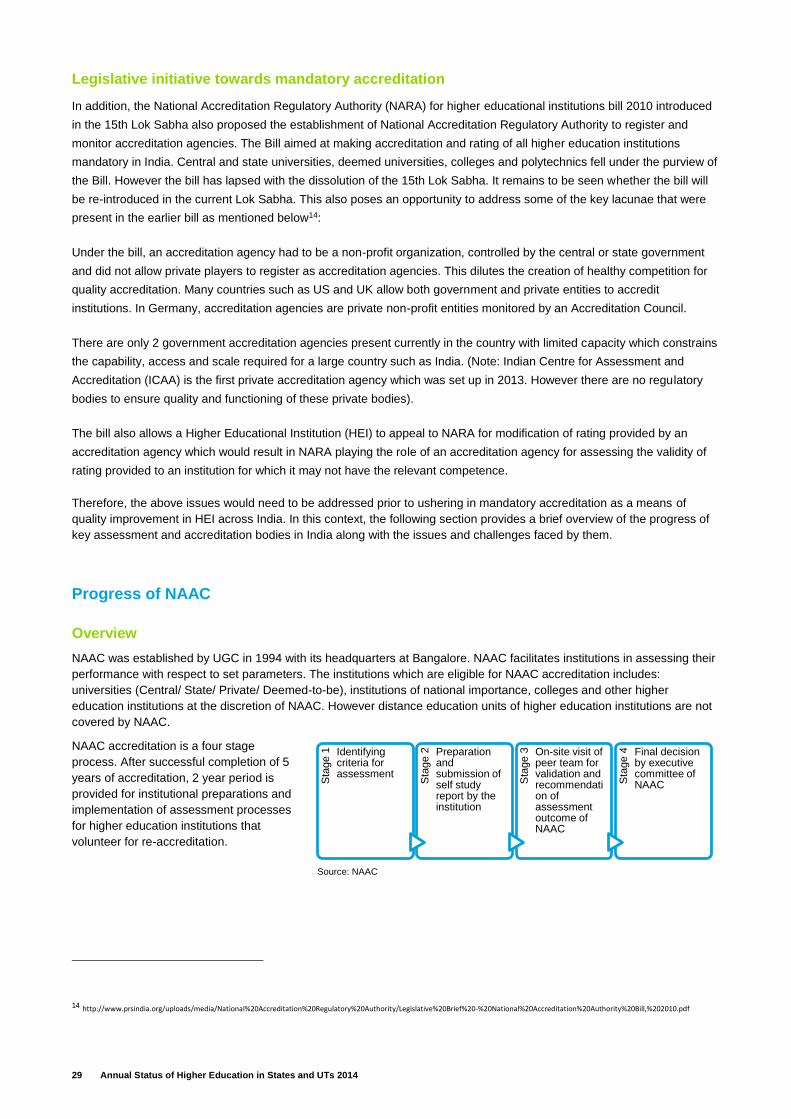
29 Annual Status of Higher Education in States and UTs 2014
Sta
ge 1 Identifying
criteria for assessment
Sta
ge 2 Preparation
and submission of self study report by the institution
Sta
ge 3 On-site visit of
peer team for validation and recommendation of assessment outcome of NAAC
Sta
ge 4 Final decision
by executive committee of NAAC
Legislative initiative towards mandatory accreditation
In addition, the National Accreditation Regulatory Authority (NARA) for higher educational institutions bill 2010 introduced
in the 15th Lok Sabha also proposed the establishment of National Accreditation Regulatory Authority to register and
monitor accreditation agencies. The Bill aimed at making accreditation and rating of all higher education institutions
mandatory in India. Central and state universities, deemed universities, colleges and polytechnics fell under the purview of
the Bill. However the bill has lapsed with the dissolution of the 15th Lok Sabha. It remains to be seen whether the bill will
be re-introduced in the current Lok Sabha. This also poses an opportunity to address some of the key lacunae that were
present in the earlier bill as mentioned below14:
Under the bill, an accreditation agency had to be a non-profit organization, controlled by the central or state government
and did not allow private players to register as accreditation agencies. This dilutes the creation of healthy competition for
quality accreditation. Many countries such as US and UK allow both government and private entities to accredit
institutions. In Germany, accreditation agencies are private non-profit entities monitored by an Accreditation Council.
There are only 2 government accreditation agencies present currently in the country with limited capacity which constrains
the capability, access and scale required for a large country such as India. (Note: Indian Centre for Assessment and
Accreditation (ICAA) is the first private accreditation agency which was set up in 2013. However there are no regulatory
bodies to ensure quality and functioning of these private bodies).
The bill also allows a Higher Educational Institution (HEI) to appeal to NARA for modification of rating provided by an
accreditation agency which would result in NARA playing the role of an accreditation agency for assessing the validity of
rating provided to an institution for which it may not have the relevant competence.
Therefore, the above issues would need to be addressed prior to ushering in mandatory accreditation as a means of
quality improvement in HEI across India. In this context, the following section provides a brief overview of the progress of
key assessment and accreditation bodies in India along with the issues and challenges faced by them.
Progress of NAAC
Overview
NAAC was established by UGC in 1994 with its headquarters at Bangalore. NAAC facilitates institutions in assessing their
performance with respect to set parameters. The institutions which are eligible for NAAC accreditation includes:
universities (Central/ State/ Private/ Deemed-to-be), institutions of national importance, colleges and other higher
education institutions at the discretion of NAAC. However distance education units of higher education institutions are not
covered by NAAC.
NAAC accreditation is a four stage
process. After successful completion of 5
years of accreditation, 2 year period is
provided for institutional preparations and
implementation of assessment processes
for higher education institutions that
volunteer for re-accreditation.
14 http://www.prsindia.org/uploads/media/National%20Accreditation%20Regulatory%20Authority/Legislative%20Brief%20-%20National%20Accreditation%20Authority%20Bill,%202010.pdf
Source: NAAC
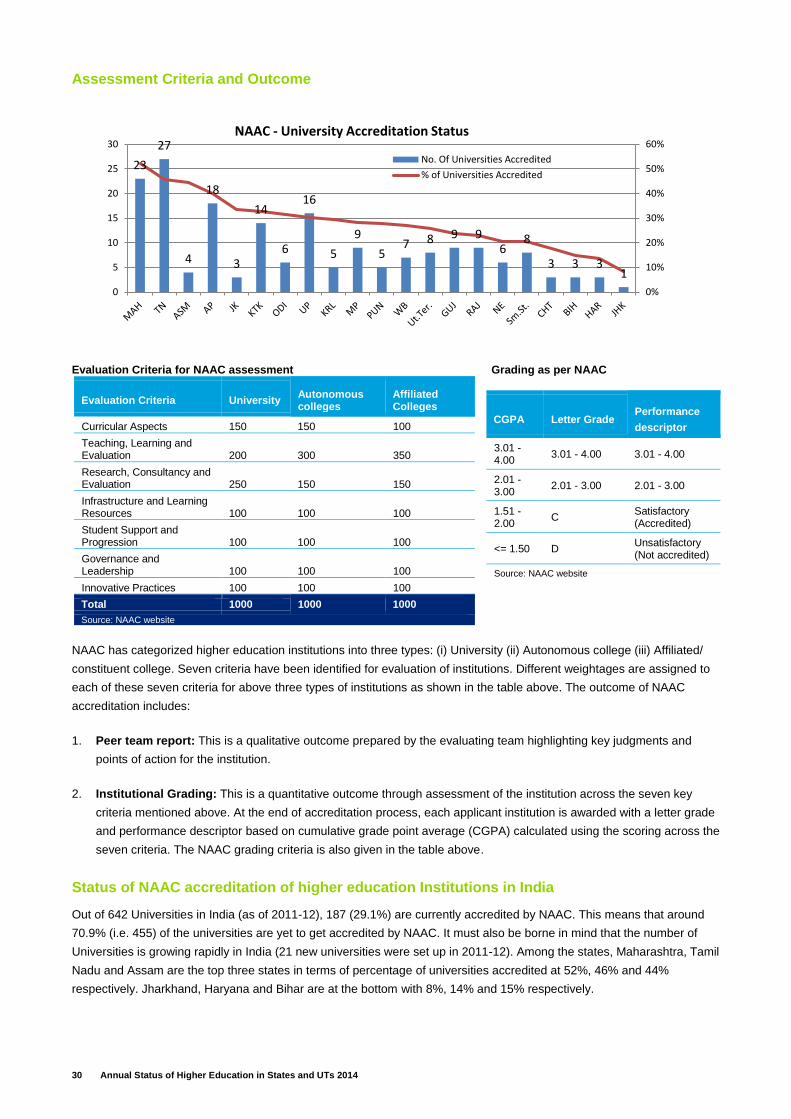
30 Annual Status of Higher Education in States and UTs 2014
Assessment Criteria and Outcome
Evaluation Criteria for NAAC assessment
Evaluation Criteria University Autonomous colleges
Affiliated Colleges
Curricular Aspects 150 150 100
Teaching, Learning and Evaluation 200 300 350
Research, Consultancy and Evaluation 250 150 150
Infrastructure and Learning Resources 100 100 100
Student Support and Progression 100 100 100
Governance and Leadership 100 100 100
Innovative Practices 100 100 100
Total 1000 1000 1000
Source: NAAC website
Grading as per NAAC
CGPA Letter Grade Performance
descriptor
3.01 - 4.00
3.01 - 4.00 3.01 - 4.00
2.01 - 3.00
2.01 - 3.00 2.01 - 3.00
1.51 - 2.00
C Satisfactory (Accredited)
<= 1.50 D Unsatisfactory (Not accredited)
Source: NAAC website
NAAC has categorized higher education institutions into three types: (i) University (ii) Autonomous college (iii) Affiliated/
constituent college. Seven criteria have been identified for evaluation of institutions. Different weightages are assigned to
each of these seven criteria for above three types of institutions as shown in the table above. The outcome of NAAC
accreditation includes:
1. Peer team report: This is a qualitative outcome prepared by the evaluating team highlighting key judgments and
points of action for the institution.
2. Institutional Grading: This is a quantitative outcome through assessment of the institution across the seven key
criteria mentioned above. At the end of accreditation process, each applicant institution is awarded with a letter grade
and performance descriptor based on cumulative grade point average (CGPA) calculated using the scoring across the
seven criteria. The NAAC grading criteria is also given in the table above.
Status of NAAC accreditation of higher education Institutions in India
Out of 642 Universities in India (as of 2011-12), 187 (29.1%) are currently accredited by NAAC. This means that around
70.9% (i.e. 455) of the universities are yet to get accredited by NAAC. It must also be borne in mind that the number of
Universities is growing rapidly in India (21 new universities were set up in 2011-12). Among the states, Maharashtra, Tamil
Nadu and Assam are the top three states in terms of percentage of universities accredited at 52%, 46% and 44%
respectively. Jharkhand, Haryana and Bihar are at the bottom with 8%, 14% and 15% respectively.
23
27
4
18
3
14
6
16
5
9
57 8 9 9
68
3 3 31
0%
10%
20%
30%
40%
50%
60%
0
5
10
15
20
25
30NAAC - University Accreditation Status
No. Of Universities Accredited
% of Universities Accredited
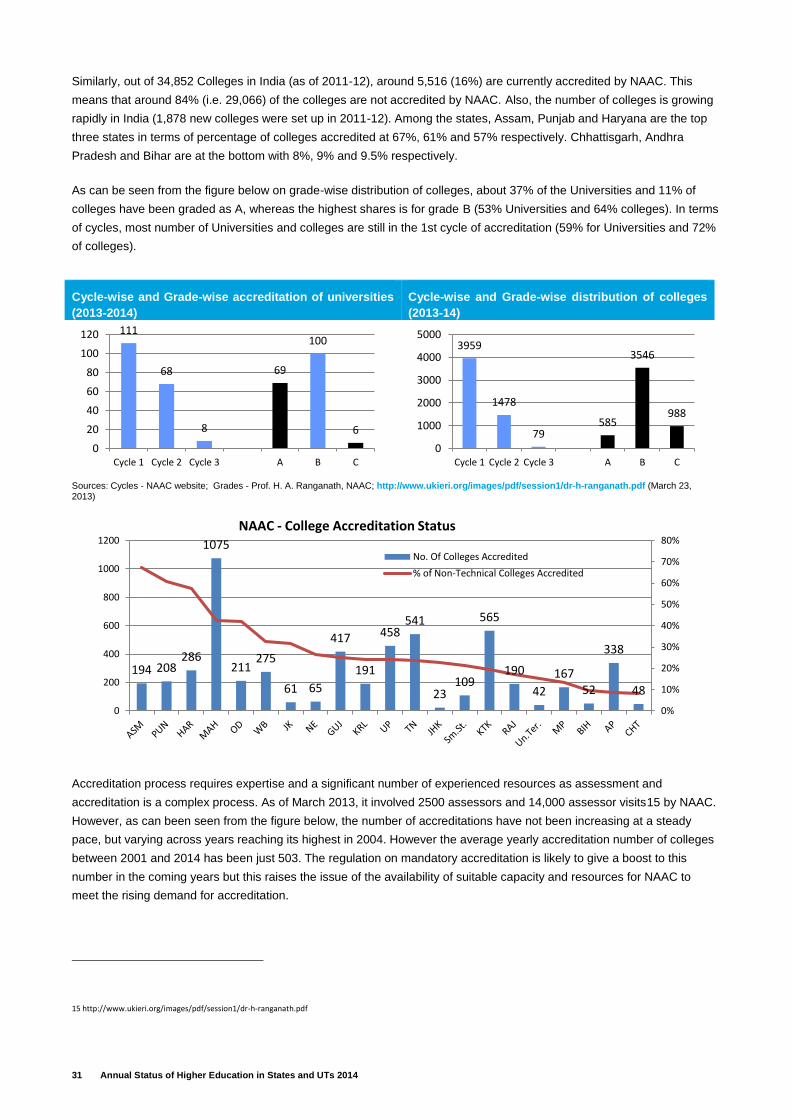
31 Annual Status of Higher Education in States and UTs 2014
Similarly, out of 34,852 Colleges in India (as of 2011-12), around 5,516 (16%) are currently accredited by NAAC. This
means that around 84% (i.e. 29,066) of the colleges are not accredited by NAAC. Also, the number of colleges is growing
rapidly in India (1,878 new colleges were set up in 2011-12). Among the states, Assam, Punjab and Haryana are the top
three states in terms of percentage of colleges accredited at 67%, 61% and 57% respectively. Chhattisgarh, Andhra
Pradesh and Bihar are at the bottom with 8%, 9% and 9.5% respectively.
As can be seen from the figure below on grade-wise distribution of colleges, about 37% of the Universities and 11% of
colleges have been graded as A, whereas the highest shares is for grade B (53% Universities and 64% colleges). In terms
of cycles, most number of Universities and colleges are still in the 1st cycle of accreditation (59% for Universities and 72%
of colleges).
Accreditation process requires expertise and a significant number of experienced resources as assessment and
accreditation is a complex process. As of March 2013, it involved 2500 assessors and 14,000 assessor visits15 by NAAC.
However, as can been seen from the figure below, the number of accreditations have not been increasing at a steady
pace, but varying across years reaching its highest in 2004. However the average yearly accreditation number of colleges
between 2001 and 2014 has been just 503. The regulation on mandatory accreditation is likely to give a boost to this
number in the coming years but this raises the issue of the availability of suitable capacity and resources for NAAC to
meet the rising demand for accreditation.
15 http://www.ukieri.org/images/pdf/session1/dr-h-ranganath.pdf
Cycle-wise and Grade-wise accreditation of universities
(2013-2014)
Cycle-wise and Grade-wise distribution of colleges
(2013-14)
Sources: Cycles - NAAC website; Grades - Prof. H. A. Ranganath, NAAC; http://www.ukieri.org/images/pdf/session1/dr-h-ranganath.pdf (March 23, 2013)
111
68
8
69
100
6
0
20
40
60
80
100
120
Cycle 1 Cycle 2 Cycle 3 A B C
3959
1478
79585
3546
988
0
1000
2000
3000
4000
5000
Cycle 1 Cycle 2 Cycle 3 A B C
194 208286
1075
211275
61 65
417
191
458541
23109
565
190
42
16752
338
48
0%
10%
20%
30%
40%
50%
60%
70%
80%
0
200
400
600
800
1000
1200NAAC - College Accreditation Status
No. Of Colleges Accredited
% of Non-Technical Colleges Accredited
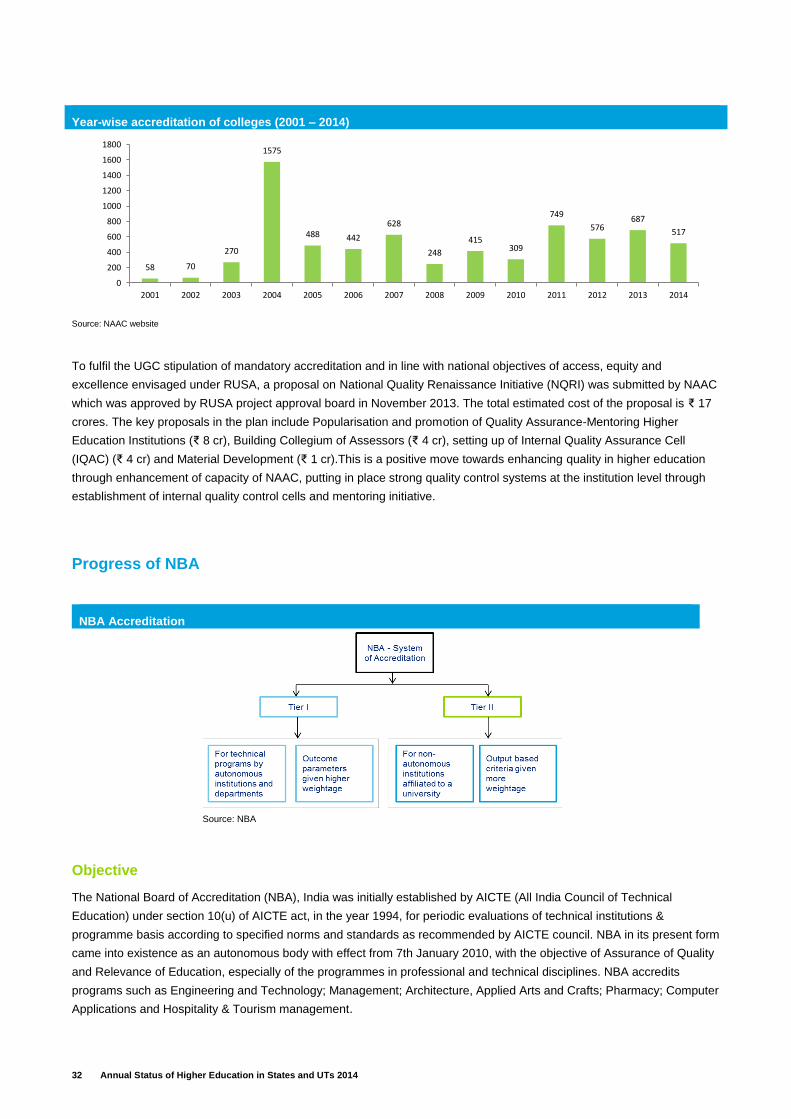
32 Annual Status of Higher Education in States and UTs 2014
58 70
270
1575
488 442
628
248
415309
749
576687
517
0
200
400
600
800
1000
1200
1400
1600
1800
2001 2002 2003 2004 2005 2006 2007 2008 2009 2010 2011 2012 2013 2014
Year-wise accreditation of colleges (2001 – 2014)
Source: NAAC website
To fulfil the UGC stipulation of mandatory accreditation and in line with national objectives of access, equity and
excellence envisaged under RUSA, a proposal on National Quality Renaissance Initiative (NQRI) was submitted by NAAC
which was approved by RUSA project approval board in November 2013. The total estimated cost of the proposal is ₹ 17
crores. The key proposals in the plan include Popularisation and promotion of Quality Assurance-Mentoring Higher
Education Institutions (₹ 8 cr), Building Collegium of Assessors (₹ 4 cr), setting up of Internal Quality Assurance Cell
(IQAC) (₹ 4 cr) and Material Development (₹ 1 cr).This is a positive move towards enhancing quality in higher education
through enhancement of capacity of NAAC, putting in place strong quality control systems at the institution level through
establishment of internal quality control cells and mentoring initiative.
Progress of NBA
Objective
The National Board of Accreditation (NBA), India was initially established by AICTE (All India Council of Technical
Education) under section 10(u) of AICTE act, in the year 1994, for periodic evaluations of technical institutions &
programme basis according to specified norms and standards as recommended by AICTE council. NBA in its present form
came into existence as an autonomous body with effect from 7th January 2010, with the objective of Assurance of Quality
and Relevance of Education, especially of the programmes in professional and technical disciplines. NBA accredits
programs such as Engineering and Technology; Management; Architecture, Applied Arts and Crafts; Pharmacy; Computer
Applications and Hospitality & Tourism management.
NBA Accreditation
Source: NBA
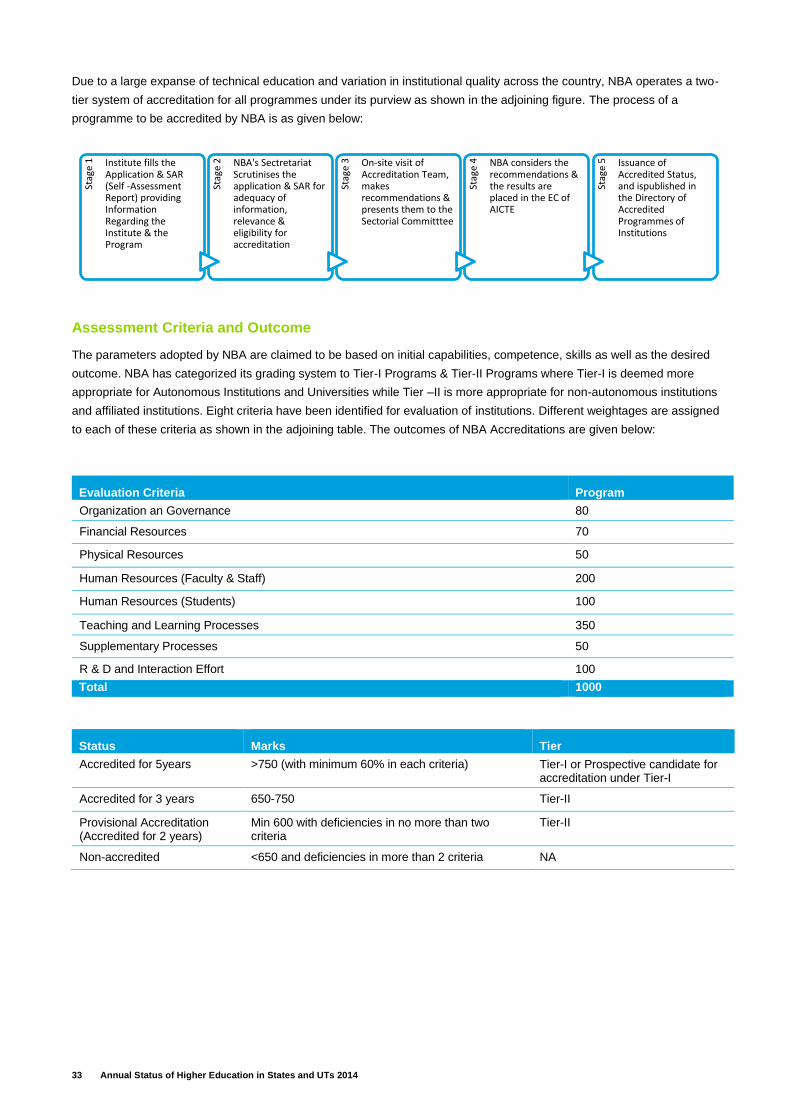
33 Annual Status of Higher Education in States and UTs 2014
Stag
e 1 Institute fills the
Application & SAR (Self -Assessment Report) providing Information Regarding the Institute & the Program
Stag
e 2 NBA's Sectretariat
Scrutinises the application & SAR for adequacy of information, relevance & eligibility for accreditation
Stag
e 3 On-site visit of
Accreditation Team, makes recommendations & presents them to the Sectorial Committtee
Stag
e 4 NBA considers the
recommendations & the results are placed in the EC of AICTE
Stag
e 5 Issuance of
Accredited Status, and ispublished in the Directory of Accredited Programmes of Institutions
Due to a large expanse of technical education and variation in institutional quality across the country, NBA operates a two-
tier system of accreditation for all programmes under its purview as shown in the adjoining figure. The process of a
programme to be accredited by NBA is as given below:
Assessment Criteria and Outcome
The parameters adopted by NBA are claimed to be based on initial capabilities, competence, skills as well as the desired
outcome. NBA has categorized its grading system to Tier-I Programs & Tier-II Programs where Tier-I is deemed more
appropriate for Autonomous Institutions and Universities while Tier –II is more appropriate for non-autonomous institutions
and affiliated institutions. Eight criteria have been identified for evaluation of institutions. Different weightages are assigned
to each of these criteria as shown in the adjoining table. The outcomes of NBA Accreditations are given below:
Evaluation Criteria Program
Organization an Governance 80
Financial Resources 70
Physical Resources 50
Human Resources (Faculty & Staff) 200
Human Resources (Students) 100
Teaching and Learning Processes 350
Supplementary Processes 50
R & D and Interaction Effort 100
Total 1000
Status Marks Tier
Accredited for 5years >750 (with minimum 60% in each criteria) Tier-I or Prospective candidate for accreditation under Tier-I
Accredited for 3 years 650-750 Tier-II
Provisional Accreditation (Accredited for 2 years)
Min 600 with deficiencies in no more than two criteria
Tier-II
Non-accredited <650 and deficiencies in more than 2 criteria NA
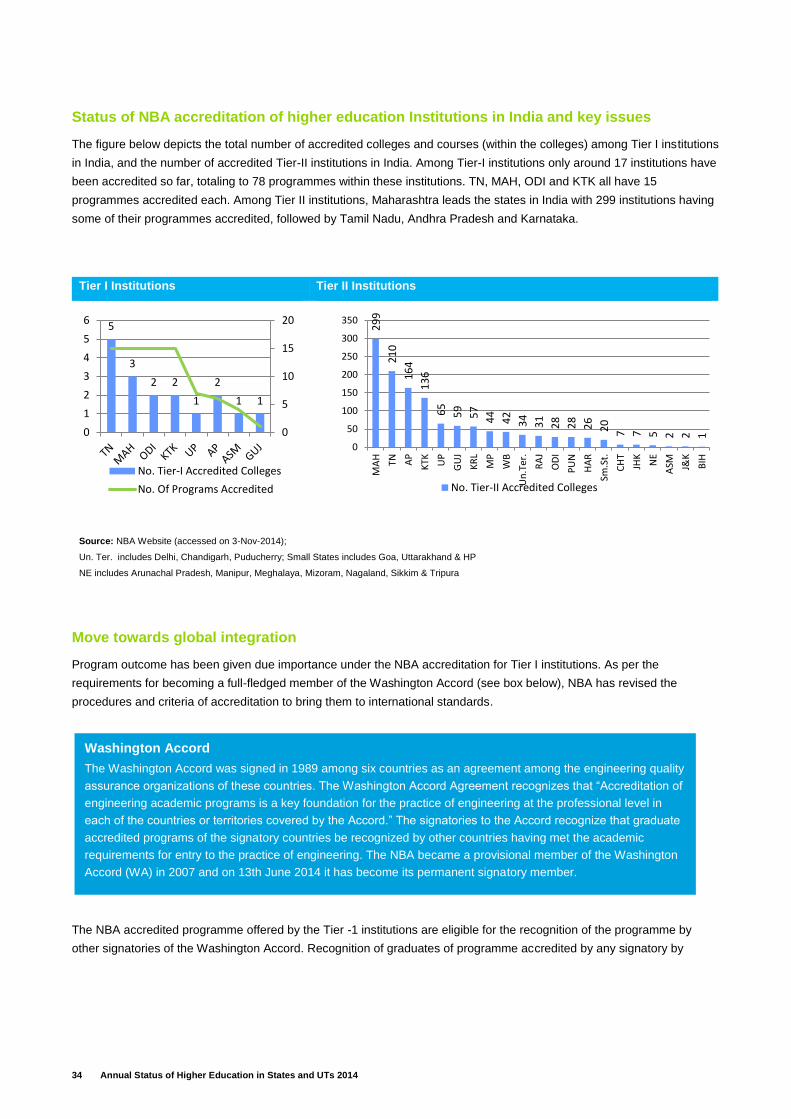
34 Annual Status of Higher Education in States and UTs 2014
Status of NBA accreditation of higher education Institutions in India and key issues
The figure below depicts the total number of accredited colleges and courses (within the colleges) among Tier I institutions
in India, and the number of accredited Tier-II institutions in India. Among Tier-I institutions only around 17 institutions have
been accredited so far, totaling to 78 programmes within these institutions. TN, MAH, ODI and KTK all have 15
programmes accredited each. Among Tier II institutions, Maharashtra leads the states in India with 299 institutions having
some of their programmes accredited, followed by Tamil Nadu, Andhra Pradesh and Karnataka.
Tier I Institutions Tier II Institutions
Source: NBA Website (accessed on 3-Nov-2014);
Un. Ter. includes Delhi, Chandigarh, Puducherry; Small States includes Goa, Uttarakhand & HP
NE includes Arunachal Pradesh, Manipur, Meghalaya, Mizoram, Nagaland, Sikkim & Tripura
Move towards global integration
Program outcome has been given due importance under the NBA accreditation for Tier I institutions. As per the
requirements for becoming a full-fledged member of the Washington Accord (see box below), NBA has revised the
procedures and criteria of accreditation to bring them to international standards.
The NBA accredited programme offered by the Tier -1 institutions are eligible for the recognition of the programme by
other signatories of the Washington Accord. Recognition of graduates of programme accredited by any signatory by
5
3
2 2
1
2
1 1
0
5
10
15
20
0
1
2
3
4
5
6
No. Tier-I Accredited Colleges
No. Of Programs Accredited
29
9
21
0
16
4
13
6
65
59
57
44
42
34
31
28
28
26
20
7 7 5 2 2 1
0
50
100
150
200
250
300
350
MA
H
TN AP
KTK U
P
GU
J
KR
L
MP
WB
Un
.Ter
.
RA
J
OD
I
PU
N
HA
R
Sm.S
t.
CH
T
JHK
NE
ASM J&
K
BIH
No. Tier-II Accredited Colleges
Washington Accord
The Washington Accord was signed in 1989 among six countries as an agreement among the engineering quality
assurance organizations of these countries. The Washington Accord Agreement recognizes that “Accreditation of
engineering academic programs is a key foundation for the practice of engineering at the professional level in
each of the countries or territories covered by the Accord.” The signatories to the Accord recognize that graduate
accredited programs of the signatory countries be recognized by other countries having met the academic
requirements for entry to the practice of engineering. The NBA became a provisional member of the Washington
Accord (WA) in 2007 and on 13th June 2014 it has become its permanent signatory member.
35 Annual Status of Higher Education in States and UTs 2014
registering or licensing bodies in other signatory jurisdictions is subject to the following restriction: The graduate must have
completed the programme16:
After the date of acquiring the signatory status, i.e., 13th June 2014.
During the period of validity of the accreditation (which may have commenced prior to the date of admission)
Accreditation status under Washington Accord would be given to Tier I programs that are NBA accredited. As per data
available on NBA website (as of 30th October 2014), only 15 programs across 6 Tier-1 institutions of NBA were covered
under Washington Accord.
First moves towards private accreditation
While across the world, private accreditation agencies are operating and providing vital information to the key stakeholders
in higher education, there is no such recognition for private agencies to operate in the accreditation space in India.
However, despite this hurdle, the Indian Centre for Assessment and Accreditation (ICAA) is the first private accreditation
body which was set up in May 2013. It is registered as a non-profit council with T V Mohandas Pai, from Manipal
University, as chairman and Arun Nigavekar, former chairman of University Grants Commission (UGC) and founder
director of NAAC, as the chief advisor. Currently, it is orienting its efforts towards associating with international rating
agencies to launch 'Top Indian University Rankings', a first of-its-kind ranking of Indian universities. However, the
regulatory bar for private accreditation agencies in India as well as absence of incentives such as UGC funding based on
rating other than NAAC prevent demand for accreditation by private bodies like ICAA. Therefore it is vital that the
legislative framework for operations of private bodies in the accreditation space must be created with a revision of the
earlier NARA bill. This will help in expansion of accreditation to reach more universities and colleges across India, with
monitoring and assessing in line with India’s objectives and best of international expectations.
Key Takeaways
India is moving towards increased application and use of accreditation which is definitely a positive move towards
ensuring consistency in quality of higher education. The signing of the Washington accord has opened the potential for
education by Indian institutions and universities being recognized globally. The benefits of accreditation are varied as it is
not only important for institutions in availing various incentives and funding but also serves as a criteria for students and
parents in selection of colleges as well as employers in recruitment of candidates. However, the feasibility of mandatory
accreditation of all higher education institutions within a given time frame remains a concern with respect to the number of
government accreditation bodies and their existing scale of operations. The current capacity and reach of existing
accreditation bodies is inadequate given the sheer scale, size and pace of growth of higher educational institutes in India.
Therefore, the approach to mandatory accreditation needs to be revisited. With regard to accreditation, some of the key
points of deliberation are highlighted below:
1. Accreditation has to be a continuous and highly credible process and not just a one-time effort to ensure improvement
of quality of higher education imparted by institutions. Given the dynamic nature of education and the rapid pace of
innovations (e.g. Use of ICT4E, MOOCs, Blended learning etc.), the system of accreditation should be
continuously reviewed to enhance its validity, reliability and usability and keep it on par with international
standards. It is vital to establish high levels of credibility in the design, processes, implementation and regularity at all
points of the accreditation exercise.
2. There is need for the Government to design appropriate legislation, clear policies and pragmatic norms
concerning accreditation. This could encompass issues such as need for more institutions, their level, scope,
functions, institutional mechanism, processes etc. , whether there is need for geographic or stream wise accreditation
16 http://www.nbaind.org/En/1033-washington-accord.aspx
36 Annual Status of Higher Education in States and UTs 2014
bodies, structure of accreditation bodies (government, private, not-for-profit etc.). Given the scale of HEI in India,
there may also be a case for specialized agencies or expert divisions within existing accreditation agencies to focus
on particular stream such as Medical, Law, Architecture, Nursing etc.
3. The success of accreditation depends upon the competence, sincerity and integrity of the experts and
assessors17.With the rapid expansion of number of institutions seeking accreditation, there would be a significant
shortage of assessors across the country if the pool is limited to VCs, Professors and Principals. If the
accreditation process is to be scaled up and opened up to other accreditation bodies, capacity of accreditation
agencies needs to be augmented manifold. A step towards this has already been taken through the NQRI initiative
which aims at strengthening quality control mechanisms at the institution level as well as increasing the human
resources and assessors for meeting the demand. An alternative approach may be that a pool of professionals from
suitable backgrounds may be trained in the accreditation methodology and tools. A structured certification based
programme may need to be designed and implemented for the same. This pool of professionals may then be
assigned to assist the accreditation team in carrying out their work.
4. The objective of accreditation is to improve the overall quality of HEI in all parts of the country. However, many current
HEI especially in the remote and backward parts of the country suffer from poor quality and are further constrained by
their inability to raise resources or charge student fees. Many such institutions find it difficult to clear the initial
screening process to be eligible for getting accredited. For such institutions, additional support (maybe through
RUSA funds) will be required to help them to improve their quality even prior to their applying for accreditation.
Otherwise, such institutions will fall further behind in terms of quality.
5. Even if the capacities of existing bodies are raised, there is definitely a need for more such independent agencies
considering the large number of government and private institutions, professional programs etc. As discussed in
earlier sections, only 29% of the Universities and 16% of the colleges have been accredited by NAAC. Coverage of
NBA is also quite small. Given the globalization of education, it is imperative that best practices from other countries
be studied and implemented in the Indian context. Countries such as the US, UK and Germany allow both public and
private entities to accredit institutions. ICAA has been established in 2013 as the first private accreditation agency in
India. The Higher education bill which proposes the establishment of NARA as a regulatory body for accreditation
agencies must be modified to allow private accreditation bodies and specify the regulatory framework to
encourage private participation. Appropriate regulatory agency will be needed to regulate all accreditation
agencies.
6. Since feedback is an important aspect of any good quality improvement initiative, the learnings from assessments
must also inform future policy. Apart from best practices dissemination, another key source would be the vast
amount of data collected during the assessment process including self-study reports and peer assessment reports.
Such data can be analyzed through focused research and analytical studies to come out with geographic, stream
wise and historic trends, using modern data analytic tools and techniques.
17 M Anandakrishnan, Chairman, Board of Governors, IIT-Kanpur - http://digitallearning.eletsonline.com/2014/04/dawn-of-a-new-era-of-
accreditation/#sthash.cfSvheIQ.dpuf – April 2014
37 Annual Status of Higher Education in States and UTs 2014
Private sector and RUSA
RUSA is essentially a funding scheme for state government universities and institutions which have so far remained
untouched by the benevolence of Central largesse. Institutes of national importance and central universities get generous
funding for infrastructure and resources. This helps them expand their scope of reach, add new infrastructure, bring new
equipment as well as maintain overall quality. They are able to attract high quality students and faculty which in turn leads
to good quality output as well. State universities on the other hand suffer from bloated structures and little or no money for
expansion and modernization. It is this anomaly which RUSA aims to correct since a large chunk of student population, up
to 40 per cent, is enrolled in state government universities.
By its very design, RUSA precludes any kind of support for private institutions. The guidelines of the mission specify that
while “state Plans should include information on all government, government aided and private institutions across
disciplines, support will only be provided to government and government aided institutions. These would include all
government and aided colleges including engineering, professional and agricultural, except medical colleges.”
This exclusion of private institutions in RUSA is ironical because 64 per cent of the total number of higher education
institutions in the country are private. According to CII-Deloitte ASHE 2013, the number of private higher education
institutions increased by more than 60 per cent during 2007 and 2012. This number was 29,662 in 2012, as against
16,547 institutions under state governments comprising 36 per cent of the total and Central institutes number 221 in all – a
miniscule 0.5 per cent of the total number of institutes. Private institutions cater to a large number of the 28.5 million
students enrolled in higher education. In percentage terms, this figure is 59 per cent, according to CII-Deloitte ASHE 2013.
Central and state institutes on the other hand account for 2.6 per cent and 38.6 per cent of the total enrolments,
respectively.
The government’s rationale, however, is easy to understand. It wants to spend its money on improving the quality of its
own institutions first. In a way it is washing its hands off the responsibility of private institutions. This may be fine for all
purposes but as far as research funding is concerned, the exclusion of private institutions from the ambit of Central
funding is not correct.
Private institutions are set up by philanthropists and corporates with funds which they earmark for corporate social
responsibility initiatives. Since education is a charitable activity and profit-making is not allowed in this field, the motive of
private players in setting up educational institutions is to promote knowledge creation and improve the quality of human
resource, for their own as well as for others’ benefit. And since private players who set up educational institutions are not
bound by any compulsion but are driven by their own desire, it is assumed that they have adequate funds to do so.
This article has been authored by Shalini S. Sharma, Head of Higher Education at Confederation of Indian Industry (CII)
38 Annual Status of Higher Education in States and UTs 2014
Funds crunch in private institutes
But, not all private institutions have the wherewithal to expand the way they want or undertake the kind of research
activities they want to. Setting up an institute is one thing and running it and expanding it is another. There are several
private institutions which were set up as one-time acts of philanthropy several decades back but are today struggling to
generate resources for expansion and improvement.
Assuming that the fee generated by the institute is sufficient to meet staff costs and other maintenance expenses, it still
requires considerable amount of funds to build research competencies. Not all private promoters who have set up
institutes may have such funds at their disposal all the time.
Dearth of adequate resources for faculty improvement and quality upgradation is therefore as rampant in private
institutions as it is in government-run. At times it is out of compulsion, at times out of choice. Whatever the motivation may
be, the brunt of such inadequacies is borne by students. Even the fee which is collected by educational institutions,
whether government or private, comes from the pockets of parents. Public institutions are also funded by the money of the
exchequer – from the 2 per cent education cess which the government collects from tax payers every year. It is these
parents who spend close to US $6 billion every year on sending their children abroad for good quality education in the
absence of adequate opportunities within the country. Raising the overall quality of institutions therefore, irrespective of
their lineage, is going to have a huge economic benefit as well.
Government needs private funds
Even while RUSA excludes private institutes from the ambit of funding, it stresses on states mobilizing private money to
fulfill their share of the required funding in every project. It says “states would be free to mobilize private sector
participation (including donations and philanthropic grants) through innovative means, limited to a ceiling of 50 per cent of
the state share.” The dichotomous stand of the government is clear from the fact that while on one hand it says, “support
will only be provided to government and government aided institutions”, the RUSA vision document says, “It is the
commitment of RUSA to encourage private participation in higher education, but with necessary caution to be exercised
against profit objectives or commercialization. It will be possible for the state to mobilize 50 per cent of the state
contribution through private participation or contributions / donations etc.” Even while the government has no intention of
funding institutes set up by private players, it encourages states to mobilise private support to fulfill its own obligations.
The Centre‐ state funding ratio under RUSA is 90:10 for north‐ eastern states, Sikkim, J&K, Himachal Pradesh and
Uttarakhand and 65:35 for other states and Union territories (UTs). Funding is provided for government‐ aided institutions
for permitted activities, based on certain norms and parameters, in a ratio of 50:50. It is to meet the 10 per cent and 35 per
cent share of funding that RUSA exhorts states to seek private help.
Government schemes in the areas of education and healthcare often stress on utilization of the corporate social
responsibility (CSR) funds of companies. RUSA also talks of the following ways in which private investment can be
sought:
Philanthropic contributions
Donations / grants from private companies / trusts / NRIs
Establishing chairs / schools / departments
Public private partnerships
Knowledge parks / innovation centers / centers of excellence
2 per cent corporate social responsibility funds
Viability gap funding
39 Annual Status of Higher Education in States and UTs 2014
Rural Infrastructure Development Fund
Innovative debt instruments
Specific research grants with IPR sharing.
The problem with this view is that one, CSR funds of companies go in various fields – healthcare, elementary education,
water, sanitation and now, on building toilets and they are not adequate for the purpose of higher education. Two, even
apart from the CSR money, private sector is anyway investing heavily in higher education, in setting up institutions which
are under its control and where it can impart education the way it wants, take quick decisions, remain free of bureaucracy
and red tape. RUSA, on the other hand, envisages private funding in public institutions. This is something which has not
happened so far on a large scale. But it can happen provided state governments take certain steps and proactively
facilitate private investment to upgrade the quality of its institutions.
Components of funding under RUSA
The mission outlines the following 18 heads under which funding will be provided to state governments:
1. Creation of universities through upgradation of existing autonomous colleges: 45 autonomous colleges (autonomy
granted by University Grants Commission at least in 2008 or earlier) that have necessary infrastructural facilities,
antiquity, teaching strength and quality will be considered for up‐ gradation to universities.
2. Creation of universities by conversion of colleges in a cluster: 35 new cluster universities would be created during the
12th Plan period with an average allocation of ₹ 55 crore per university and 65 during the next Plan period through the
clustering of existing affiliated government and government‐ aided colleges. These universities will be created by
pooling the resources of three to five existing colleges that have adequate academic, physical and technical
infrastructural facilities.
3. Infrastructure grants to universities: These grants shall be utilized for meeting critical infrastructural needs that would
lead to immediate quality gains such as upgrading of libraries, laboratories, equipment, hostels, toilets etc. Total 150
public universities will be given a grant of ₹ 20 crore each during the 12th Plan period.
4. New model colleges (general): Districts that are listed as educationally backward under the existing 374 model
college scheme and have not been supported so far would be considered for funding. Total 60 new model colleges
will be sanctioned during the 12th Plan period.
5. Upgradation of existing degree colleges to model degree colleges: Out of the 640 districts in the country, 288 districts
would be covered under the new model college scheme. Funds will be provided for upgradation of 54 colleges in the
12th Plan period.
6. New colleges (professional): Grants will be provided for establishing new professional colleges in each of the 22
states having gross enrolment ratio (GER) below national average in technical education. The number of colleges for
each state will be based on the evaluation of the proposals submitted by the states. Total 40 new engineering
colleges would be sanctioned in the 12th Plan period. States which are over‐ saturated in terms of institutional density
and vacant seats will not be considered for grants.
7. Infrastructure grants to colleges: Infrastructure grants can be utilized by colleges to address critical needs in
institutional infrastructure, especially for creating / upgrading laboratories, libraries, hostels, toilets etc. Total 3500
colleges will be given grant of ₹ 2 crore each during 12th Plan.
8. Research, innovation and quality improvement: During 12th Plan period, 10 states will receive funds under this
component to facilitate research and innovations.
9. Equity initiatives: During 12th Plan, 20 states will receive funds under this component. All state universities will be
eligible to receive grants for equity initiatives. Innovative approach / schemes to ensure greater inclusion will be
40 Annual Status of Higher Education in States and UTs 2014
considered on priority.
10. Faculty recruitment support
11. Faculty improvement
12. Vocationalisation of higher education
13. Leadership development of educational administrators
14. Institutional restructuring and reforms
15. Capacity building and preparation, data collection and planning
16. Management information system
17. Support to polytechnics
18. Management monitoring evaluation and research (MMER)
Public-private partnerships
The private sector can logically play any role in RUSA in only about four out of the 18 heads listed above. These include
setting up of new model colleges (general); setting up of new colleges (professional); research, innovation and quality
improvement and vocationalisation of higher education. Public-private partnerships (PPP) have been mentioned in the
RUSA document as one of the ways in which private sector can be involved in this scheme. Theoretically this view is fine
but in practice PPPs have been found to have few takers in private sector. This is because of two reasons: the
government’s definition of private sector is at variance with industry’s definition of private sector. While industry views all
non-government entities as private, the government tends to see only manufacturing companies as private sector. It does
not consider service providers, including education service providers, as industry or as an entity fit enough to become a
party in a PPP. This narrows down considerably the number of eligible industry players who can enter in a PPP with
government.
The entities which the government sees as fit to come and partner with it, do not have the time or resources to run
educational institutes. They prefer remaining in advisory positions and not get involved in the nitty-gritty of running
institutions. This, often, is not acceptable to the government and it insists on the corporates taking full responsibility of
running the institutes for which they enter into PPPs. This leads to many a times private players preferring to stay away
from such adventures. The sooner the government starts accepting the fact that institutes can only be run by professional
players, the better it will be for PPPs. Partnerships could then be entered into in a consortium mode with industry giving
advice and service providers doing the actual job of implementation.
The second deterrent in PPPs for private players at present is the fact that the government tends to dither giving full
autonomy and control to private players and prefers having a dominating role in the partnership. Private players want
freedom to run the institutes the way they want, to hire the people they deem fit and frame the rules as per their vision and
choice. Being a domineering partner in a PPP, the government rarely tends to give that freedom to private players.
Scope for improvement
There is no denying the fact that private sector has vast resources and its partnership and support to the government in
quality improvement under RUSA can do wonders for state universities. At present, almost the entire private investment in
higher education is going in setting up of technical institutes. Every corporate wants its own brand of college and university
to carry forward its name and legacy. Several corporate leaders give huge sums of money to foreign private universities
such as Harvard, Stanford and Yale, to set up chairs in their names. Such a thing rarely happens with our own public
universities. This is so because our public institutions have not yet mastered the art of seeking funds and befriending
corporates. They rarely maintain alumni records, rarely organize get-togethers with famous pass-outs or plan public
41 Annual Status of Higher Education in States and UTs 2014
felicitations of successful alumni. Wherever corporates or alumni do give funds to their alma mater, there is tardiness in
utilisation of funds for the purpose for which they were intended. This leads to frustration among corporates which proves
counter-productive in the long run.
States can change this scenario and elicit more support from private players by using innovative means such as naming
departments after the donors, cutting red tape for those wanting to give funds, providing easy and single window
mechanisms for investments, giving easy access to information for investment avenues and working out state-level
strategies to garner private funds. Until that happens, private investment will continue to go in one direction and there will
never be a point where public universities / colleges and private investment will meet. At the same time the government
should also think in terms of making private institutions eligible to vie for research grants on competitive basis.
42 Annual Status of Higher Education in States and UTs 2014
‘Knowledge Direction’:Improving the
economic status of Indian states through
proper harnessing of educational
resources A state-wise study on the possibility of improving the economic benefits of an education system without
further investment in the education sector
Introduction
The positive impacts of a well-educated youth on the economy of a region have long been understood. Indeed, the
development of human resources through education remains a primary focus for all economies seeking to make the
transition from being dominated by the primary or secondary sectors to the tertiary. However, it is not always possible for
developing economies to greatly increase their investment in education. In India, for example, with states allocating ever-
increasing proportions of their budget to education and reaching a maximum of 21.1% in Assam (2012-13), the scope for
increase remains painfully small.
This study will therefore examine the possibility of increasing the economic status of Indian states without further
investment in education, simply through proper harnessing of existing knowledge resources, henceforth termed as
‘knowledge direction’.
Knowledge direction, for the purposes of this study, is ‘the act of channeling and redirecting knowledge in all forms,
whether technical, experimental, practical, or academic, to the right people in order to achieve a desired outcome’. In the
case of Indian states, such knowledge direction would form the link between education and the economy. Improper
knowledge direction would therefore be the reason why educational improvements may not be adequately translating into
economic improvements.
Thus, this study will assess the education systems and economic status of several Indian states using a varied, all-
encompassing range of indicators. The knowledge direction levels of states will be similarly assessed. The results will then
be compared, in order to examine whether a higher level of knowledge direction does indeed correlate to a higher
economic status.
This paper has been authored by Garima Thakur, a student studying Chemical and Bio-Molecular Engineering at the Hong Kong
University of Science and Technology. She interned at the CII – Science Technology Innovation and Higher Education Department in
New Delhi for a period of two months in the summer of 2014. This paper was an outcome of this internship.
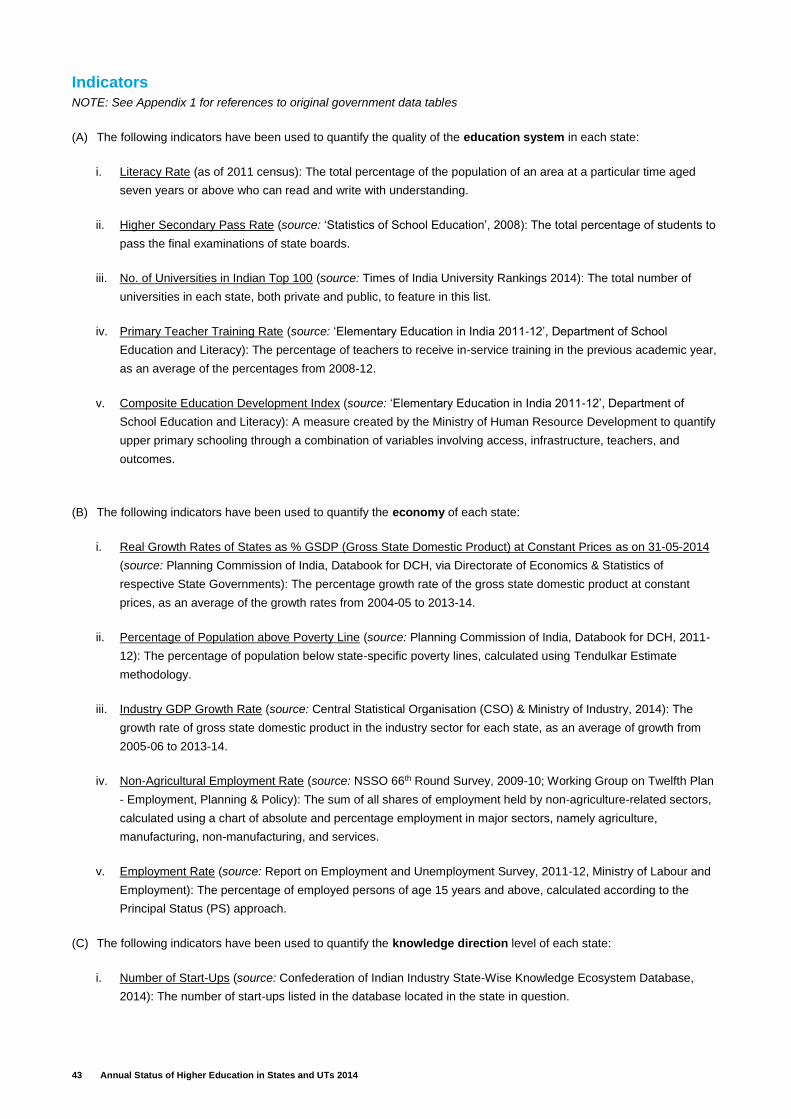
43 Annual Status of Higher Education in States and UTs 2014
Indicators
NOTE: See Appendix 1 for references to original government data tables
(A) The following indicators have been used to quantify the quality of the education system in each state:
i. Literacy Rate (as of 2011 census): The total percentage of the population of an area at a particular time aged
seven years or above who can read and write with understanding.
ii. Higher Secondary Pass Rate (source: ‘Statistics of School Education’, 2008): The total percentage of students to
pass the final examinations of state boards.
iii. No. of Universities in Indian Top 100 (source: Times of India University Rankings 2014): The total number of
universities in each state, both private and public, to feature in this list.
iv. Primary Teacher Training Rate (source: ‘Elementary Education in India 2011-12’, Department of School
Education and Literacy): The percentage of teachers to receive in-service training in the previous academic year,
as an average of the percentages from 2008-12.
v. Composite Education Development Index (source: ‘Elementary Education in India 2011-12’, Department of
School Education and Literacy): A measure created by the Ministry of Human Resource Development to quantify
upper primary schooling through a combination of variables involving access, infrastructure, teachers, and
outcomes.
(B) The following indicators have been used to quantify the economy of each state:
i. Real Growth Rates of States as % GSDP (Gross State Domestic Product) at Constant Prices as on 31-05-2014
(source: Planning Commission of India, Databook for DCH, via Directorate of Economics & Statistics of
respective State Governments): The percentage growth rate of the gross state domestic product at constant
prices, as an average of the growth rates from 2004-05 to 2013-14.
ii. Percentage of Population above Poverty Line (source: Planning Commission of India, Databook for DCH, 2011-
12): The percentage of population below state-specific poverty lines, calculated using Tendulkar Estimate
methodology.
iii. Industry GDP Growth Rate (source: Central Statistical Organisation (CSO) & Ministry of Industry, 2014): The
growth rate of gross state domestic product in the industry sector for each state, as an average of growth from
2005-06 to 2013-14.
iv. Non-Agricultural Employment Rate (source: NSSO 66th Round Survey, 2009-10; Working Group on Twelfth Plan
- Employment, Planning & Policy): The sum of all shares of employment held by non-agriculture-related sectors,
calculated using a chart of absolute and percentage employment in major sectors, namely agriculture,
manufacturing, non-manufacturing, and services.
v. Employment Rate (source: Report on Employment and Unemployment Survey, 2011-12, Ministry of Labour and
Employment): The percentage of employed persons of age 15 years and above, calculated according to the
Principal Status (PS) approach.
(C) The following indicators have been used to quantify the knowledge direction level of each state:
i. Number of Start-Ups (source: Confederation of Indian Industry State-Wise Knowledge Ecosystem Database,
2014): The number of start-ups listed in the database located in the state in question.
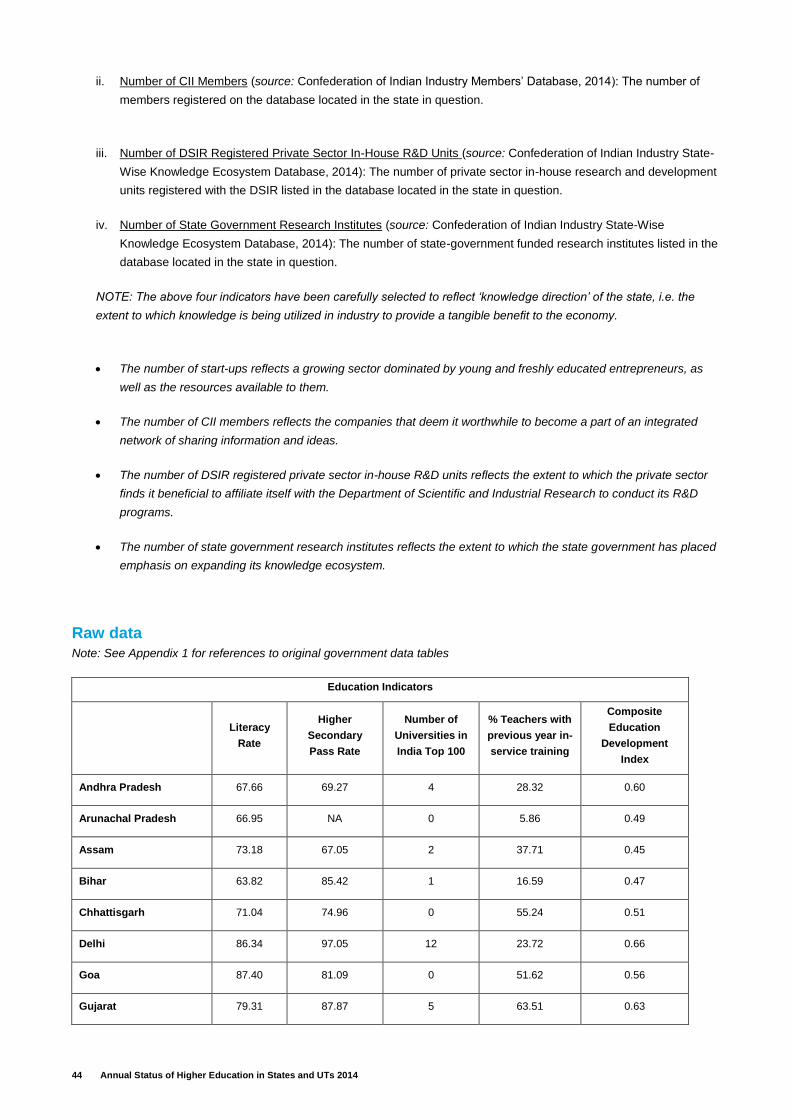
44 Annual Status of Higher Education in States and UTs 2014
ii. Number of CII Members (source: Confederation of Indian Industry Members’ Database, 2014): The number of
members registered on the database located in the state in question.
iii. Number of DSIR Registered Private Sector In-House R&D Units (source: Confederation of Indian Industry State-
Wise Knowledge Ecosystem Database, 2014): The number of private sector in-house research and development
units registered with the DSIR listed in the database located in the state in question.
iv. Number of State Government Research Institutes (source: Confederation of Indian Industry State-Wise
Knowledge Ecosystem Database, 2014): The number of state-government funded research institutes listed in the
database located in the state in question.
NOTE: The above four indicators have been carefully selected to reflect ‘knowledge direction’ of the state, i.e. the
extent to which knowledge is being utilized in industry to provide a tangible benefit to the economy.
The number of start-ups reflects a growing sector dominated by young and freshly educated entrepreneurs, as
well as the resources available to them.
The number of CII members reflects the companies that deem it worthwhile to become a part of an integrated
network of sharing information and ideas.
The number of DSIR registered private sector in-house R&D units reflects the extent to which the private sector
finds it beneficial to affiliate itself with the Department of Scientific and Industrial Research to conduct its R&D
programs.
The number of state government research institutes reflects the extent to which the state government has placed
emphasis on expanding its knowledge ecosystem.
Raw data
Note: See Appendix 1 for references to original government data tables
Education Indicators
Literacy
Rate
Higher
Secondary
Pass Rate
Number of
Universities in
India Top 100
% Teachers with
previous year in-
service training
Composite
Education
Development
Index
Andhra Pradesh 67.66 69.27 4 28.32 0.60
Arunachal Pradesh 66.95 NA 0 5.86 0.49
Assam 73.18 67.05 2 37.71 0.45
Bihar 63.82 85.42 1 16.59 0.47
Chhattisgarh 71.04 74.96 0 55.24 0.51
Delhi 86.34 97.05 12 23.72 0.66
Goa 87.40 81.09 0 51.62 0.56
Gujarat 79.31 87.87 5 63.51 0.63
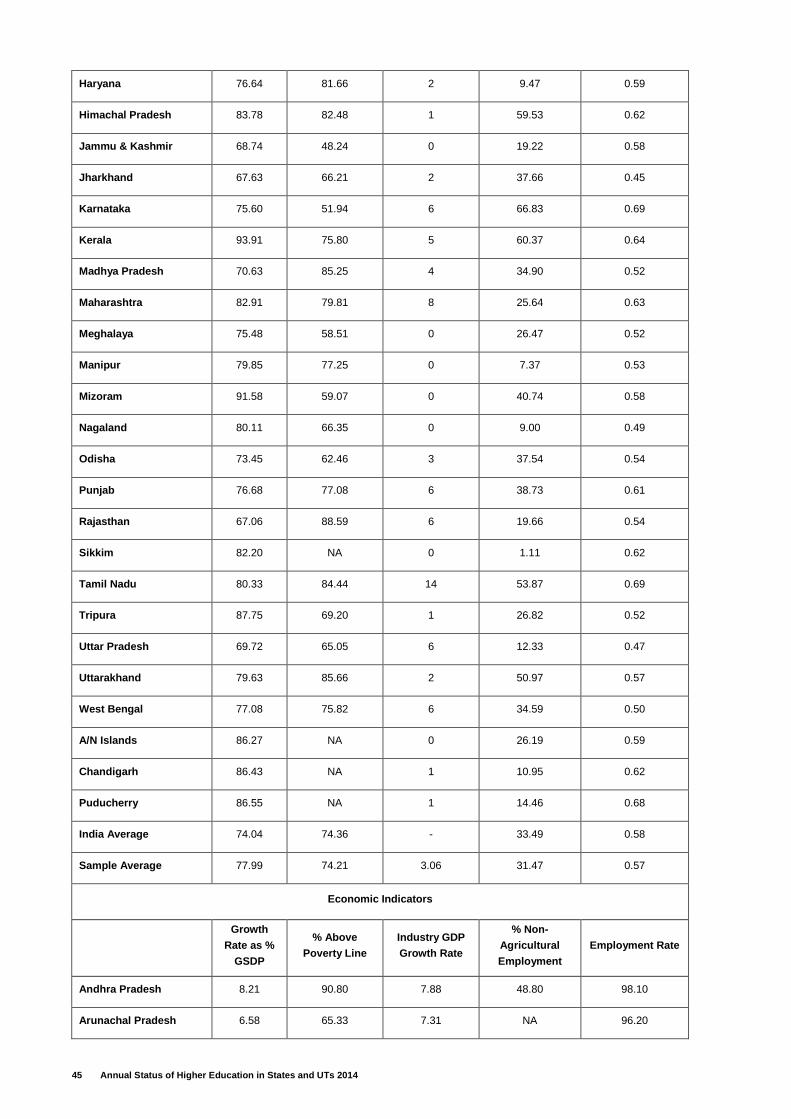
45 Annual Status of Higher Education in States and UTs 2014
Haryana 76.64 81.66 2 9.47 0.59
Himachal Pradesh 83.78 82.48 1 59.53 0.62
Jammu & Kashmir 68.74 48.24 0 19.22 0.58
Jharkhand 67.63 66.21 2 37.66 0.45
Karnataka 75.60 51.94 6 66.83 0.69
Kerala 93.91 75.80 5 60.37 0.64
Madhya Pradesh 70.63 85.25 4 34.90 0.52
Maharashtra 82.91 79.81 8 25.64 0.63
Meghalaya 75.48 58.51 0 26.47 0.52
Manipur 79.85 77.25 0 7.37 0.53
Mizoram 91.58 59.07 0 40.74 0.58
Nagaland 80.11 66.35 0 9.00 0.49
Odisha 73.45 62.46 3 37.54 0.54
Punjab 76.68 77.08 6 38.73 0.61
Rajasthan 67.06 88.59 6 19.66 0.54
Sikkim 82.20 NA 0 1.11 0.62
Tamil Nadu 80.33 84.44 14 53.87 0.69
Tripura 87.75 69.20 1 26.82 0.52
Uttar Pradesh 69.72 65.05 6 12.33 0.47
Uttarakhand 79.63 85.66 2 50.97 0.57
West Bengal 77.08 75.82 6 34.59 0.50
A/N Islands 86.27 NA 0 26.19 0.59
Chandigarh 86.43 NA 1 10.95 0.62
Puducherry 86.55 NA 1 14.46 0.68
India Average 74.04 74.36 - 33.49 0.58
Sample Average 77.99 74.21 3.06 31.47 0.57
Economic Indicators
Growth
Rate as %
GSDP
% Above
Poverty Line
Industry GDP
Growth Rate
% Non-
Agricultural
Employment
Employment Rate
Andhra Pradesh 8.21 90.80 7.88 48.80 98.10
Arunachal Pradesh 6.58 65.33 7.31 NA 96.20
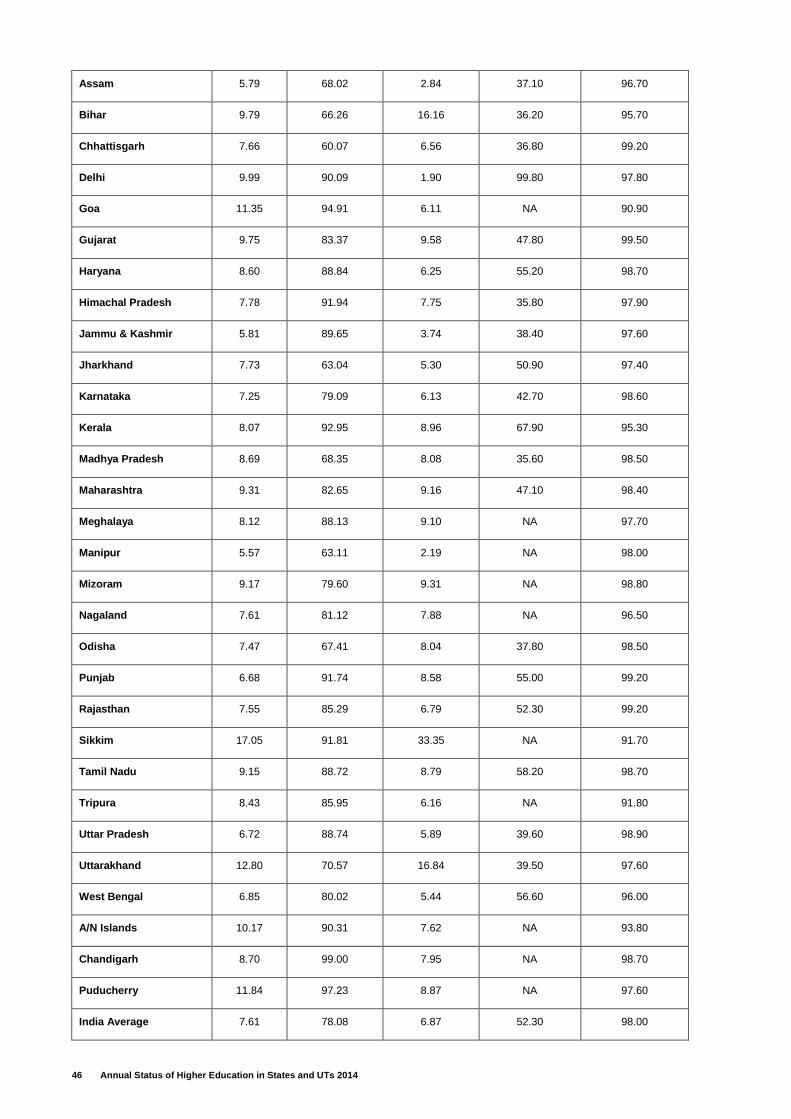
46 Annual Status of Higher Education in States and UTs 2014
Assam 5.79 68.02 2.84 37.10 96.70
Bihar 9.79 66.26 16.16 36.20 95.70
Chhattisgarh 7.66 60.07 6.56 36.80 99.20
Delhi 9.99 90.09 1.90 99.80 97.80
Goa 11.35 94.91 6.11 NA 90.90
Gujarat 9.75 83.37 9.58 47.80 99.50
Haryana 8.60 88.84 6.25 55.20 98.70
Himachal Pradesh 7.78 91.94 7.75 35.80 97.90
Jammu & Kashmir 5.81 89.65 3.74 38.40 97.60
Jharkhand 7.73 63.04 5.30 50.90 97.40
Karnataka 7.25 79.09 6.13 42.70 98.60
Kerala 8.07 92.95 8.96 67.90 95.30
Madhya Pradesh 8.69 68.35 8.08 35.60 98.50
Maharashtra 9.31 82.65 9.16 47.10 98.40
Meghalaya 8.12 88.13 9.10 NA 97.70
Manipur 5.57 63.11 2.19 NA 98.00
Mizoram 9.17 79.60 9.31 NA 98.80
Nagaland 7.61 81.12 7.88 NA 96.50
Odisha 7.47 67.41 8.04 37.80 98.50
Punjab 6.68 91.74 8.58 55.00 99.20
Rajasthan 7.55 85.29 6.79 52.30 99.20
Sikkim 17.05 91.81 33.35 NA 91.70
Tamil Nadu 9.15 88.72 8.79 58.20 98.70
Tripura 8.43 85.95 6.16 NA 91.80
Uttar Pradesh 6.72 88.74 5.89 39.60 98.90
Uttarakhand 12.80 70.57 16.84 39.50 97.60
West Bengal 6.85 80.02 5.44 56.60 96.00
A/N Islands 10.17 90.31 7.62 NA 93.80
Chandigarh 8.70 99.00 7.95 NA 98.70
Puducherry 11.84 97.23 8.87 NA 97.60
India Average 7.61 78.08 6.87 52.30 98.00
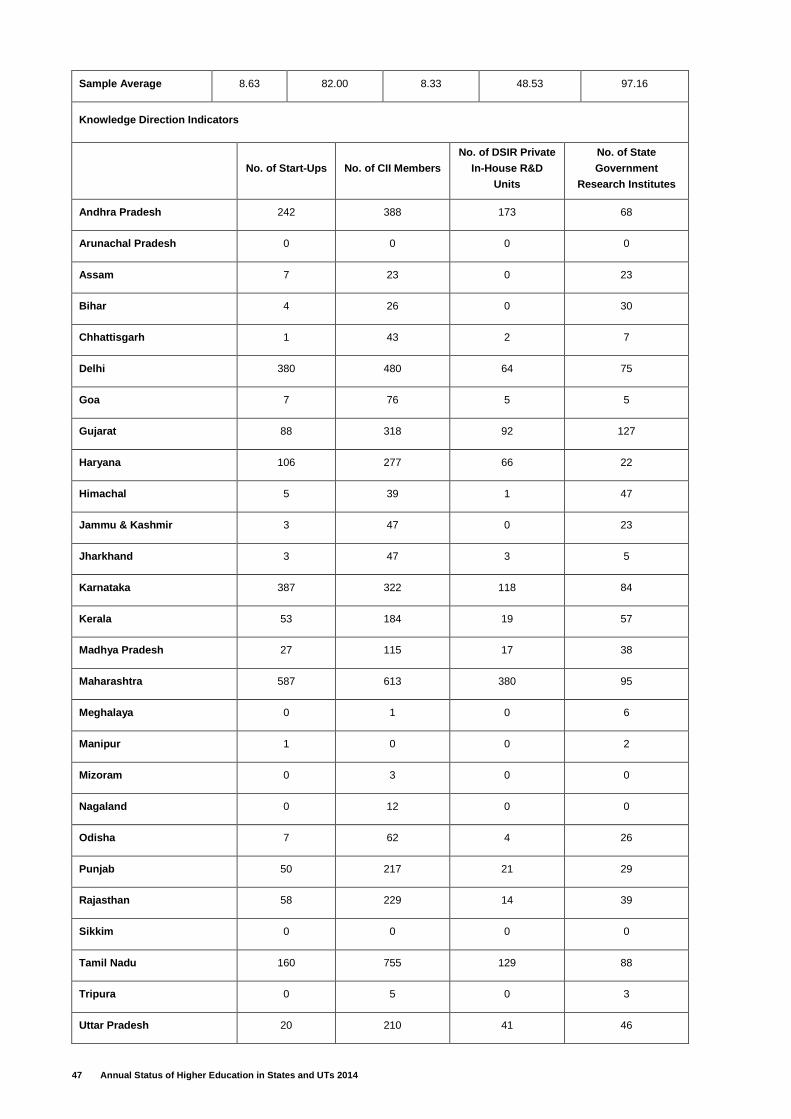
47 Annual Status of Higher Education in States and UTs 2014
Sample Average 8.63 82.00 8.33 48.53 97.16
Knowledge Direction Indicators
No. of Start-Ups No. of CII Members
No. of DSIR Private
In-House R&D
Units
No. of State
Government
Research Institutes
Andhra Pradesh 242 388 173 68
Arunachal Pradesh 0 0 0 0
Assam 7 23 0 23
Bihar 4 26 0 30
Chhattisgarh 1 43 2 7
Delhi 380 480 64 75
Goa 7 76 5 5
Gujarat 88 318 92 127
Haryana 106 277 66 22
Himachal 5 39 1 47
Jammu & Kashmir 3 47 0 23
Jharkhand 3 47 3 5
Karnataka 387 322 118 84
Kerala 53 184 19 57
Madhya Pradesh 27 115 17 38
Maharashtra 587 613 380 95
Meghalaya 0 1 0 6
Manipur 1 0 0 2
Mizoram 0 3 0 0
Nagaland 0 12 0 0
Odisha 7 62 4 26
Punjab 50 217 21 29
Rajasthan 58 229 14 39
Sikkim 0 0 0 0
Tamil Nadu 160 755 129 88
Tripura 0 5 0 3
Uttar Pradesh 20 210 41 46
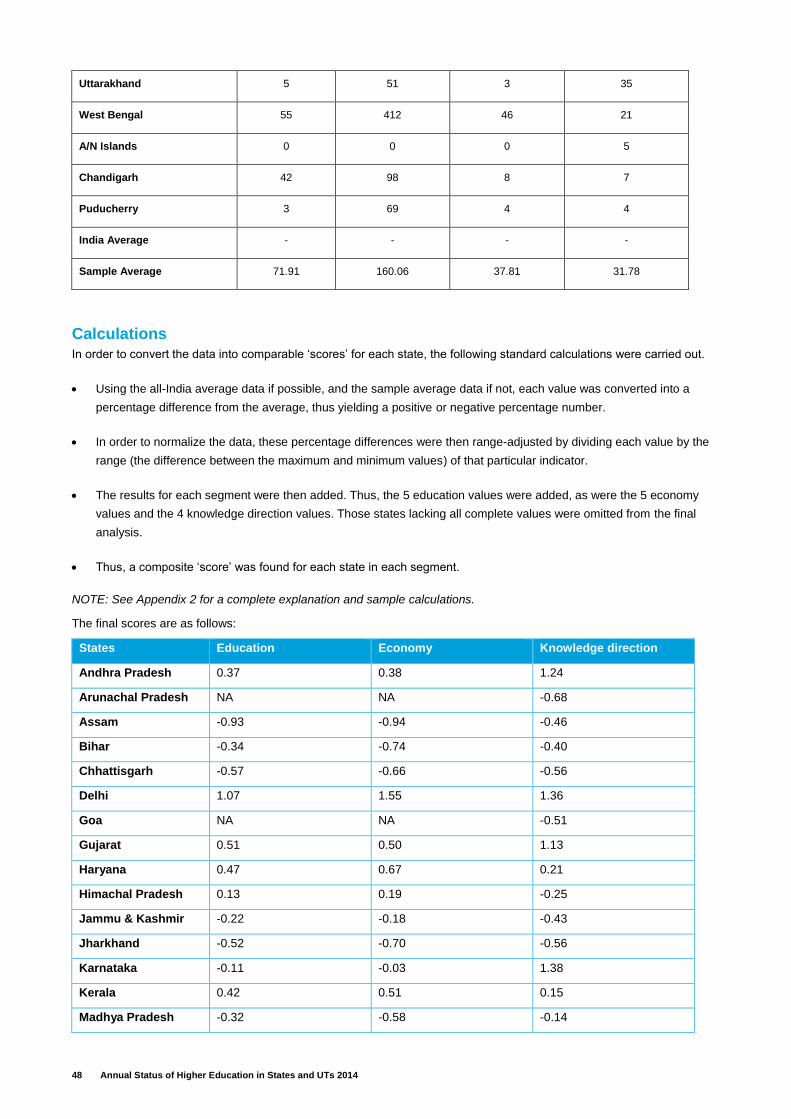
48 Annual Status of Higher Education in States and UTs 2014
Uttarakhand 5 51 3 35
West Bengal 55 412 46 21
A/N Islands 0 0 0 5
Chandigarh 42 98 8 7
Puducherry 3 69 4 4
India Average - - - -
Sample Average 71.91 160.06 37.81 31.78
Calculations
In order to convert the data into comparable ‘scores’ for each state, the following standard calculations were carried out.
Using the all-India average data if possible, and the sample average data if not, each value was converted into a
percentage difference from the average, thus yielding a positive or negative percentage number.
In order to normalize the data, these percentage differences were then range-adjusted by dividing each value by the
range (the difference between the maximum and minimum values) of that particular indicator.
The results for each segment were then added. Thus, the 5 education values were added, as were the 5 economy
values and the 4 knowledge direction values. Those states lacking all complete values were omitted from the final
analysis.
Thus, a composite ‘score’ was found for each state in each segment.
NOTE: See Appendix 2 for a complete explanation and sample calculations.
The final scores are as follows:
States Education Economy Knowledge direction
Andhra Pradesh 0.37 0.38 1.24
Arunachal Pradesh NA NA -0.68
Assam -0.93 -0.94 -0.46
Bihar -0.34 -0.74 -0.40
Chhattisgarh -0.57 -0.66 -0.56
Delhi 1.07 1.55 1.36
Goa NA NA -0.51
Gujarat 0.51 0.50 1.13
Haryana 0.47 0.67 0.21
Himachal Pradesh 0.13 0.19 -0.25
Jammu & Kashmir -0.22 -0.18 -0.43
Jharkhand -0.52 -0.70 -0.56
Karnataka -0.11 -0.03 1.38
Kerala 0.42 0.51 0.15
Madhya Pradesh -0.32 -0.58 -0.14
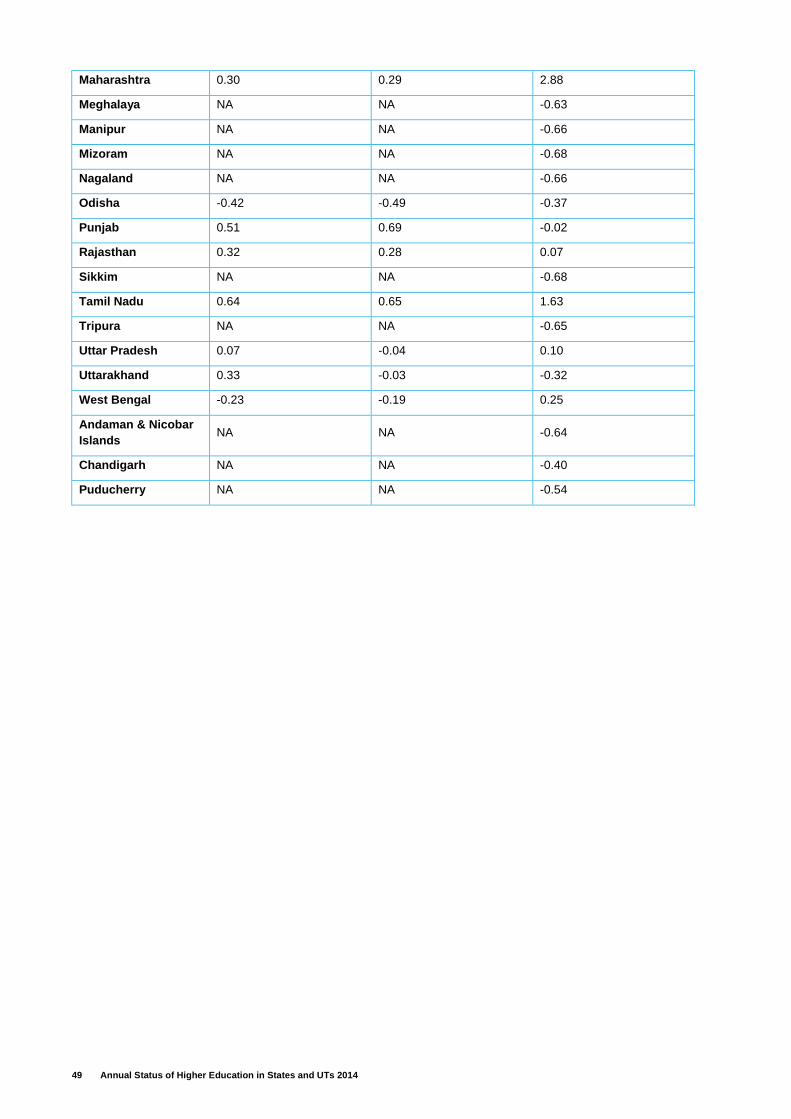
49 Annual Status of Higher Education in States and UTs 2014
Maharashtra 0.30 0.29 2.88
Meghalaya NA NA -0.63
Manipur NA NA -0.66
Mizoram NA NA -0.68
Nagaland NA NA -0.66
Odisha -0.42 -0.49 -0.37
Punjab 0.51 0.69 -0.02
Rajasthan 0.32 0.28 0.07
Sikkim NA NA -0.68
Tamil Nadu 0.64 0.65 1.63
Tripura NA NA -0.65
Uttar Pradesh 0.07 -0.04 0.10
Uttarakhand 0.33 -0.03 -0.32
West Bengal -0.23 -0.19 0.25
Andaman & Nicobar
Islands NA NA -0.64
Chandigarh NA NA -0.40
Puducherry NA NA -0.54
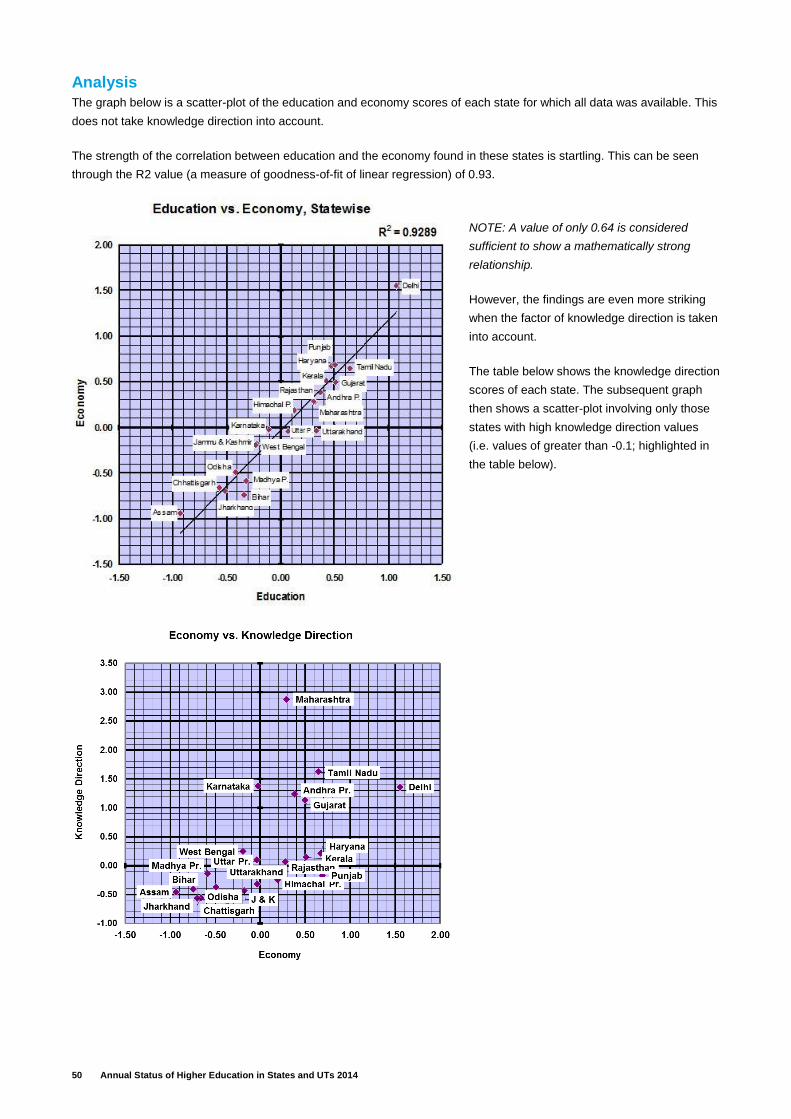
50 Annual Status of Higher Education in States and UTs 2014
Analysis
The graph below is a scatter-plot of the education and economy scores of each state for which all data was available. This
does not take knowledge direction into account.
The strength of the correlation between education and the economy found in these states is startling. This can be seen
through the R2 value (a measure of goodness-of-fit of linear regression) of 0.93.
NOTE: A value of only 0.64 is considered
sufficient to show a mathematically strong
relationship.
However, the findings are even more striking
when the factor of knowledge direction is taken
into account.
The table below shows the knowledge direction
scores of each state. The subsequent graph
then shows a scatter-plot involving only those
states with high knowledge direction values
(i.e. values of greater than -0.1; highlighted in
the table below).
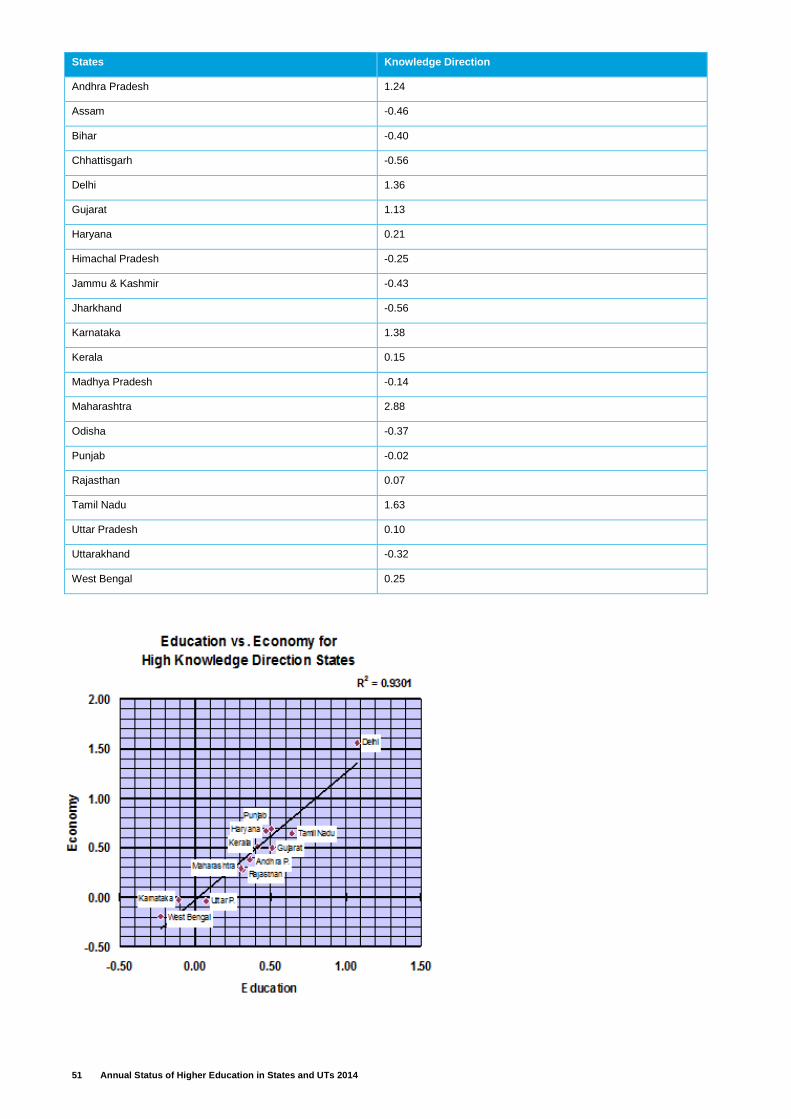
51 Annual Status of Higher Education in States and UTs 2014
States Knowledge Direction
Andhra Pradesh 1.24
Assam -0.46
Bihar -0.40
Chhattisgarh -0.56
Delhi 1.36
Gujarat 1.13
Haryana 0.21
Himachal Pradesh -0.25
Jammu & Kashmir -0.43
Jharkhand -0.56
Karnataka 1.38
Kerala 0.15
Madhya Pradesh -0.14
Maharashtra 2.88
Odisha -0.37
Punjab -0.02
Rajasthan 0.07
Tamil Nadu 1.63
Uttar Pradesh 0.10
Uttarakhand -0.32
West Bengal 0.25
52 Annual Status of Higher Education in States and UTs 2014
The above graph is remarkable in that nine of the twelve states lie in the upper half of the graph, with their economies
staying firmly in the positive range. This implies that those states with superior knowledge direction have, in general,
superior economies.
The three exceptions in the graph above are Karnataka, West Bengal, and Uttar Pradesh, which have slightly negative
economic scores of -0.03, -0.19 and -0.04 respectively. A possible explanation for these anomalies lies in the fact that
they all contain cities that rank in the top fifteen in India with regards to population; namely Bengaluru (Karnataka), Kolkata
(West Bengal), and Kanpur and Lucknow (Uttar Pradesh). Thus, their high knowledge direction scores may be a direct
result of the presence of these megacities, which would skew certain indicators, such as the number of CII members and
the number of start-ups, in their favor. However, these factors are likely concentrated within the megacities, without having
much of a trickle-down effect on the remaining areas of the state. Since the economy has been measured by indicators
that encompass the entire state, such as the employment rate and gross state domestic product, it is likely that such a
discrepancy would arise. This is especially likely in those states where there is a notable gap between the economies of
the cities and the state as a whole. Thus, for example, even though Maharashtra contains Mumbai, India’s economic hub
and largest city, it has not become an anomaly because the remainder of the state is quite economically strong as well.
Similarly, Delhi is not an anomaly despite its extremely high scores as it has negligible rural areas surrounding the
megacity at its center.
However, thus far, all that has been established is that a superior education system correlates with a superior economy.
The importance of knowledge direction in itself has not yet been determined.
Interestingly, though those states with high knowledge direction have better education systems, there is no discernible
correlation between the scores themselves. This is shown by the following graph.
The lack of correlation suggests that it is very possible to improve knowledge direction without significantly improving
education. Though a linear correlation does not exist, those states with higher knowledge direction have already been
seen to have superior economies. Thus, while the relationship cannot be quantified in a linear fashion, it appears that
those states with comparably higher knowledge direction levels have been more successful at translating the quality of
their education systems into tangible economic benefits. It further suggests that there are several states which, despite
having superior education systems, do not possess superior knowledge direction. This indicates a waste of educational
resources, as, without high knowledge direction levels, educational benefits cannot translate adequately into economic
benefits.
Conclusion
There are two major conclusions of this study.
The first is the decisive relationship that has been found to exist between the quality of the education system of a state
and its economy.
The second is that there are several states which are not properly harnessing the educational infrastructure and resources
that they already possess, as shown by their low knowledge direction scores, as well as the lack of correlation in general
between education and knowledge direction. Furthermore, those states with high knowledge direction levels are, without
exception, high-level economies.
This is quite compelling in the context of a developing country like India, where it is often difficult to allocate more
resources to the education sector. It suggests that it is likely that efforts put into improving knowledge direction would
significantly improve the economic status of Indian states. Such a possibility is notable because there would be no need
for additional investment into education. Instead, policies supporting knowledge direction would be required, few of which
are high-cost.
53 Annual Status of Higher Education in States and UTs 2014
Such policies may include:
Establishing entrepreneur-academia links by: - creating alumni networks - encouraging open software - databasing angel investor contacts - promoting academic blogs - developing expert directories - establishing professional support services - establishing experimental labs in universities open to entrepreneurs - encouraging dual degrees in business and technology - promoting mentor-apprentice relationships - hosting innovation competitions - promoting rapid-prototyping shops - encouraging universities to nurture start-ups with the aid of grants and concessions - including entrepreneurial skills in university curricula
- Hosting summits and think-tanks between government, industry, and academia to encourage the formation of an information and contact network, as well as encouraging membership in organizations such as the CII.
- Establishing start-up hubs and incubators with enabling conditions including access to data, research, technology, licenses, rapid prototyping shops, and tax concessions.
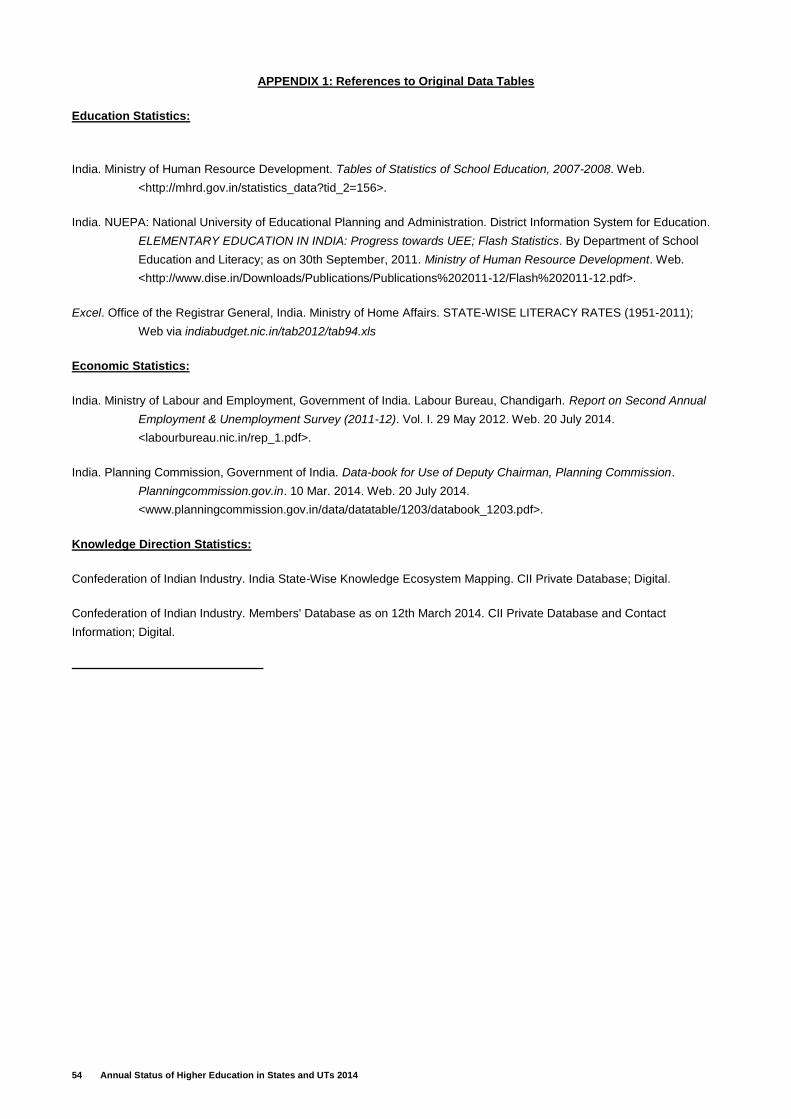
54 Annual Status of Higher Education in States and UTs 2014
APPENDIX 1: References to Original Data Tables
Education Statistics:
India. Ministry of Human Resource Development. Tables of Statistics of School Education, 2007-2008. Web.
<http://mhrd.gov.in/statistics_data?tid_2=156>.
India. NUEPA: National University of Educational Planning and Administration. District Information System for Education.
ELEMENTARY EDUCATION IN INDIA: Progress towards UEE; Flash Statistics. By Department of School
Education and Literacy; as on 30th September, 2011. Ministry of Human Resource Development. Web.
<http://www.dise.in/Downloads/Publications/Publications%202011-12/Flash%202011-12.pdf>.
Excel. Office of the Registrar General, India. Ministry of Home Affairs. STATE-WISE LITERACY RATES (1951-2011);
Web via indiabudget.nic.in/tab2012/tab94.xls
Economic Statistics:
India. Ministry of Labour and Employment, Government of India. Labour Bureau, Chandigarh. Report on Second Annual
Employment & Unemployment Survey (2011-12). Vol. I. 29 May 2012. Web. 20 July 2014.
<labourbureau.nic.in/rep_1.pdf>.
India. Planning Commission, Government of India. Data-book for Use of Deputy Chairman, Planning Commission.
Planningcommission.gov.in. 10 Mar. 2014. Web. 20 July 2014.
<www.planningcommission.gov.in/data/datatable/1203/databook_1203.pdf>.
Knowledge Direction Statistics:
Confederation of Indian Industry. India State-Wise Knowledge Ecosystem Mapping. CII Private Database; Digital.
Confederation of Indian Industry. Members' Database as on 12th March 2014. CII Private Database and Contact
Information; Digital.
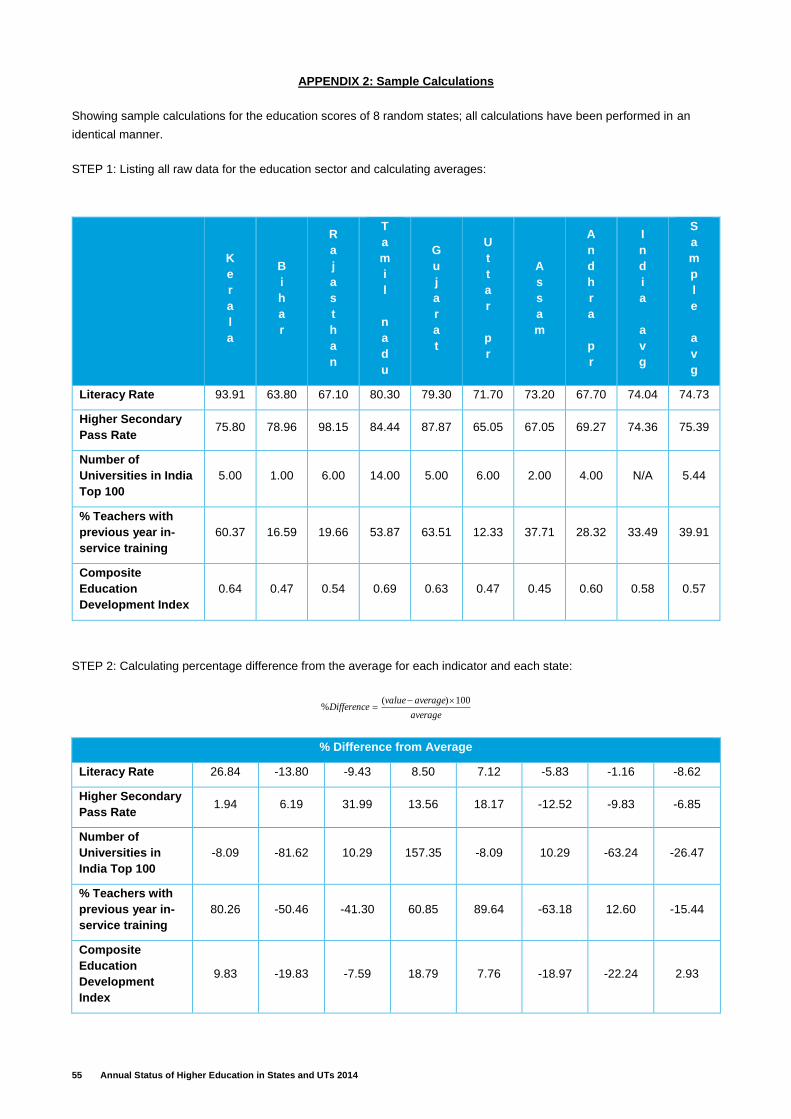
55 Annual Status of Higher Education in States and UTs 2014
APPENDIX 2: Sample Calculations
Showing sample calculations for the education scores of 8 random states; all calculations have been performed in an
identical manner.
STEP 1: Listing all raw data for the education sector and calculating averages:
K
e
r
a
l
a
B
i
h
a
r
R
a
j
a
s
t
h
a
n
T
a
m
i
l
n
a
d
u
G
u
j
a
r
a
t
U
t
t
a
r
p
r
A
s
s
a
m
A
n
d
h
r
a
p
r
I
n
d
i
a
a
v
g
S
a
m
p
l
e
a
v
g
Literacy Rate 93.91 63.80 67.10 80.30 79.30 71.70 73.20 67.70 74.04 74.73
Higher Secondary
Pass Rate 75.80 78.96 98.15 84.44 87.87 65.05 67.05 69.27 74.36 75.39
Number of
Universities in India
Top 100
5.00 1.00 6.00 14.00 5.00 6.00 2.00 4.00 N/A 5.44
% Teachers with
previous year in-
service training
60.37 16.59 19.66 53.87 63.51 12.33 37.71 28.32 33.49 39.91
Composite
Education
Development Index
0.64 0.47 0.54 0.69 0.63 0.47 0.45 0.60 0.58 0.57
STEP 2: Calculating percentage difference from the average for each indicator and each state:
average
averagevalueDifference
100)(%
% Difference from Average
Literacy Rate 26.84 -13.80 -9.43 8.50 7.12 -5.83 -1.16 -8.62
Higher Secondary
Pass Rate 1.94 6.19 31.99 13.56 18.17 -12.52 -9.83 -6.85
Number of
Universities in
India Top 100
-8.09 -81.62 10.29 157.35 -8.09 10.29 -63.24 -26.47
% Teachers with
previous year in-
service training
80.26 -50.46 -41.30 60.85 89.64 -63.18 12.60 -15.44
Composite
Education
Development
Index
9.83 -19.83 -7.59 18.79 7.76 -18.97 -22.24 2.93
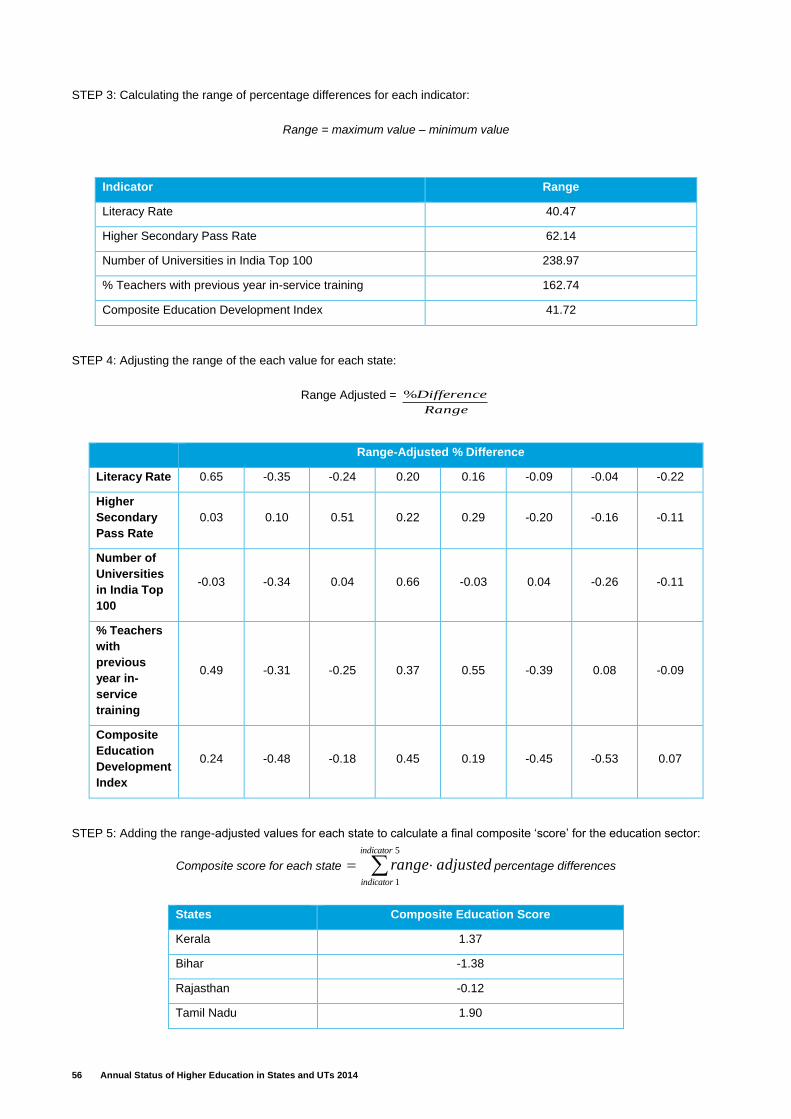
56 Annual Status of Higher Education in States and UTs 2014
STEP 3: Calculating the range of percentage differences for each indicator:
Range = maximum value – minimum value
Indicator Range
Literacy Rate 40.47
Higher Secondary Pass Rate 62.14
Number of Universities in India Top 100 238.97
% Teachers with previous year in-service training 162.74
Composite Education Development Index 41.72
STEP 4: Adjusting the range of the each value for each state:
Range Adjusted =
Range
Difference%
Range-Adjusted % Difference
Literacy Rate 0.65 -0.35 -0.24 0.20 0.16 -0.09 -0.04 -0.22
Higher
Secondary
Pass Rate
0.03 0.10 0.51 0.22 0.29 -0.20 -0.16 -0.11
Number of
Universities
in India Top
100
-0.03 -0.34 0.04 0.66 -0.03 0.04 -0.26 -0.11
% Teachers
with
previous
year in-
service
training
0.49 -0.31 -0.25 0.37 0.55 -0.39 0.08 -0.09
Composite
Education
Development
Index
0.24 -0.48 -0.18 0.45 0.19 -0.45 -0.53 0.07
STEP 5: Adding the range-adjusted values for each state to calculate a final composite ‘score’ for the education sector:
Composite score for each state adjustedrangeindicator
indicator
5
1
percentage differences
States Composite Education Score
Kerala 1.37
Bihar -1.38
Rajasthan -0.12
Tamil Nadu 1.90
57 Annual Status of Higher Education in States and UTs 2014
Gujarat 1.16
Uttar Pradesh -1.09
Assam -0.92
Andhra Pradesh -0.47
NOTE 1: The scores do not match those used in the report because the averages and ranges of only these 8 states were
used to show the progression of the calculations. In the report, averages and ranges of all the states were used, leading to
different numbers.
NOTE 2: Identical calculations were carried out to calculate the states’ composite scores for economy and knowledge
direction as well.
58 Annual Status of Higher Education in States and UTs 2014
Part II
India, State and UT Profiles on Higher
Education
Notes: 1. The data in this chapter has been taken from the All India Survey of Higher Education, 2011-12, MHRD unless otherwise stated.
2. Information on Lakshadweep is not publically available. Hence, it has not been included in this report.
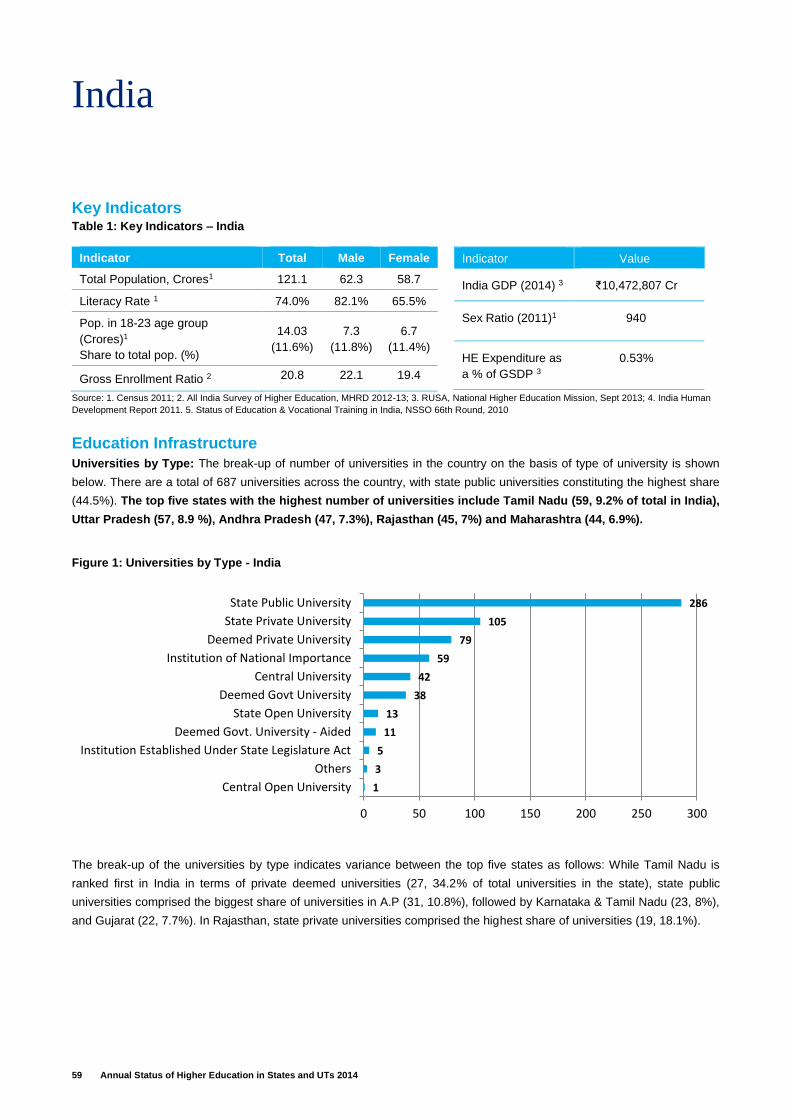
59 Annual Status of Higher Education in States and UTs 2014
India
Key Indicators Table 1: Key Indicators – India
Indicator Total Male Female
Total Population, Crores1 121.1 62.3 58.7
Literacy Rate 1 74.0% 82.1% 65.5%
Pop. in 18-23 age group
(Crores)1
Share to total pop. (%)
14.03
(11.6%)
7.3
(11.8%)
6.7
(11.4%)
Gross Enrollment Ratio 2 20.8 22.1 19.4
Indicator Value
India GDP (2014) 3 ₹10,472,807 Cr
Sex Ratio (2011)1 940
HE Expenditure as
a % of GSDP 3
0.53%
Source: 1. Census 2011; 2. All India Survey of Higher Education, MHRD 2012-13; 3. RUSA, National Higher Education Mission, Sept 2013; 4. India Human
Development Report 2011. 5. Status of Education & Vocational Training in India, NSSO 66th Round, 2010
Education Infrastructure
Universities by Type: The break-up of number of universities in the country on the basis of type of university is shown
below. There are a total of 687 universities across the country, with state public universities constituting the highest share
(44.5%). The top five states with the highest number of universities include Tamil Nadu (59, 9.2% of total in India),
Uttar Pradesh (57, 8.9 %), Andhra Pradesh (47, 7.3%), Rajasthan (45, 7%) and Maharashtra (44, 6.9%).
The break-up of the universities by type indicates variance between the top five states as follows: While Tamil Nadu is
ranked first in India in terms of private deemed universities (27, 34.2% of total universities in the state), state public
universities comprised the biggest share of universities in A.P (31, 10.8%), followed by Karnataka & Tamil Nadu (23, 8%),
and Gujarat (22, 7.7%). In Rajasthan, state private universities comprised the highest share of universities (19, 18.1%).
1
3
5
11
13
38
42
59
79
105
286
0 50 100 150 200 250 300
Central Open University
Others
Institution Established Under State Legislature Act
Deemed Govt. University - Aided
State Open University
Deemed Govt University
Central University
Institution of National Importance
Deemed Private University
State Private University
State Public University
Figure 1: Universities by Type - India
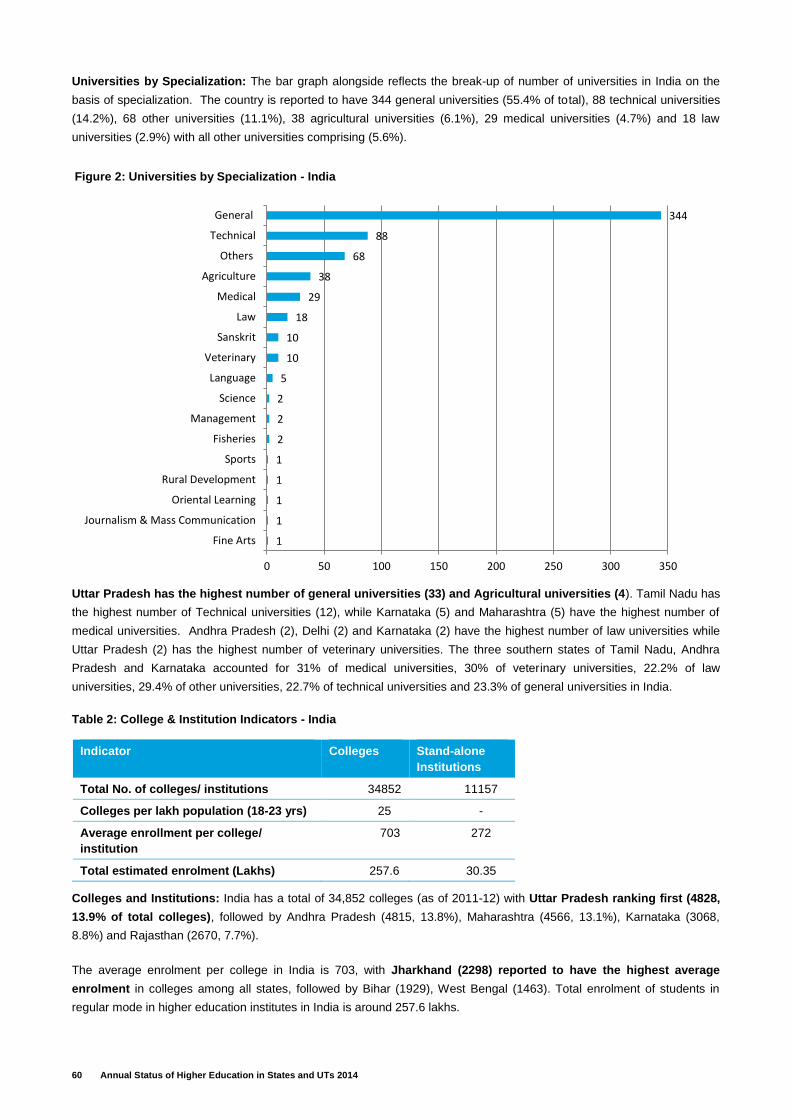
60 Annual Status of Higher Education in States and UTs 2014
Universities by Specialization: The bar graph alongside reflects the break-up of number of universities in India on the
basis of specialization. The country is reported to have 344 general universities (55.4% of total), 88 technical universities
(14.2%), 68 other universities (11.1%), 38 agricultural universities (6.1%), 29 medical universities (4.7%) and 18 law
universities (2.9%) with all other universities comprising (5.6%).
Uttar Pradesh has the highest number of general universities (33) and Agricultural universities (4). Tamil Nadu has
the highest number of Technical universities (12), while Karnataka (5) and Maharashtra (5) have the highest number of
medical universities. Andhra Pradesh (2), Delhi (2) and Karnataka (2) have the highest number of law universities while
Uttar Pradesh (2) has the highest number of veterinary universities. The three southern states of Tamil Nadu, Andhra
Pradesh and Karnataka accounted for 31% of medical universities, 30% of veterinary universities, 22.2% of law
universities, 29.4% of other universities, 22.7% of technical universities and 23.3% of general universities in India.
Table 2: College & Institution Indicators - India
Colleges and Institutions: India has a total of 34,852 colleges (as of 2011-12) with Uttar Pradesh ranking first (4828,
13.9% of total colleges), followed by Andhra Pradesh (4815, 13.8%), Maharashtra (4566, 13.1%), Karnataka (3068,
8.8%) and Rajasthan (2670, 7.7%).
The average enrolment per college in India is 703, with Jharkhand (2298) reported to have the highest average
enrolment in colleges among all states, followed by Bihar (1929), West Bengal (1463). Total enrolment of students in
regular mode in higher education institutes in India is around 257.6 lakhs.
Indicator Colleges Stand-alone
Institutions
Total No. of colleges/ institutions 34852 11157
Colleges per lakh population (18-23 yrs) 25 -
Average enrollment per college/
institution
703 272
Total estimated enrolment (Lakhs) 257.6 30.35
1
1
1
1
1
2
2
2
5
10
10
18
29
38
68
88
344
0 50 100 150 200 250 300 350
Fine Arts
Journalism & Mass Communication
Oriental Learning
Rural Development
Sports
Fisheries
Management
Science
Language
Veterinary
Sanskrit
Law
Medical
Agriculture
Others
Technical
General
Figure 2: Universities by Specialization - India
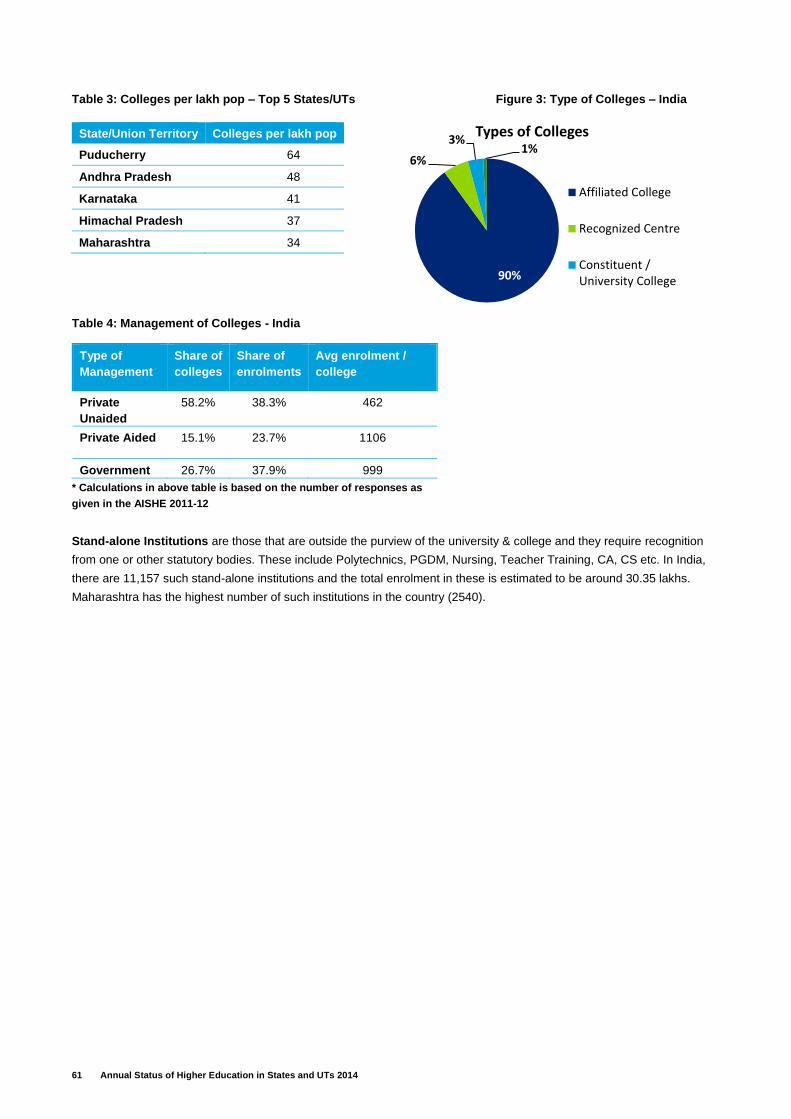
61 Annual Status of Higher Education in States and UTs 2014
Table 3: Colleges per lakh pop – Top 5 States/UTs Figure 3: Type of Colleges – India
Table 4: Management of Colleges - India
* Calculations in above table is based on the number of responses as
given in the AISHE 2011-12
Type of
Management
Share of
colleges
Share of
enrolments
Avg enrolment /
college
Private
Unaided
58.2% 38.3% 462
Private Aided 15.1% 23.7% 1106
Government 26.7% 37.9% 999
Stand-alone Institutions are those that are outside the purview of the university & college and they require recognition
from one or other statutory bodies. These include Polytechnics, PGDM, Nursing, Teacher Training, CA, CS etc. In India,
there are 11,157 such stand-alone institutions and the total enrolment in these is estimated to be around 30.35 lakhs.
Maharashtra has the highest number of such institutions in the country (2540).
State/Union Territory Colleges per lakh pop
Puducherry 64
Andhra Pradesh 48
Karnataka 41
Himachal Pradesh 37
Maharashtra 34
90%
6%
3%1%
Types of Colleges
Affiliated College
Recognized Centre
Constituent /University College
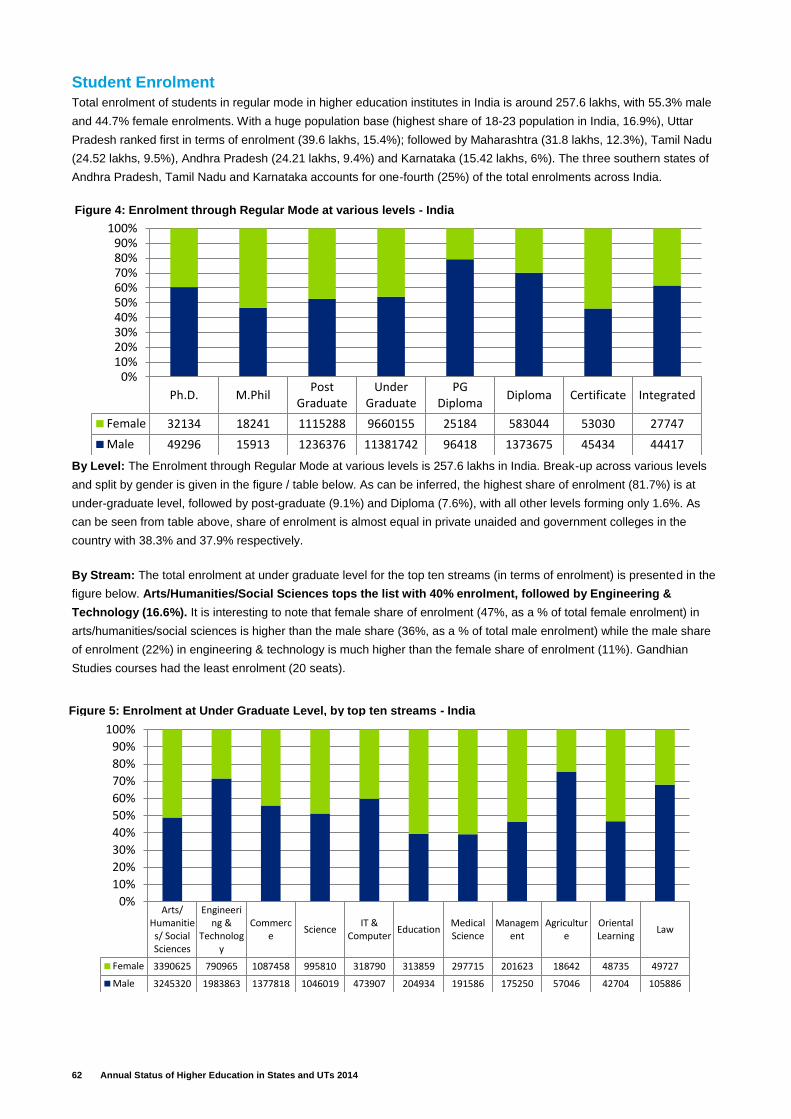
62 Annual Status of Higher Education in States and UTs 2014
Student Enrolment
Total enrolment of students in regular mode in higher education institutes in India is around 257.6 lakhs, with 55.3% male
and 44.7% female enrolments. With a huge population base (highest share of 18-23 population in India, 16.9%), Uttar
Pradesh ranked first in terms of enrolment (39.6 lakhs, 15.4%); followed by Maharashtra (31.8 lakhs, 12.3%), Tamil Nadu
(24.52 lakhs, 9.5%), Andhra Pradesh (24.21 lakhs, 9.4%) and Karnataka (15.42 lakhs, 6%). The three southern states of
Andhra Pradesh, Tamil Nadu and Karnataka accounts for one-fourth (25%) of the total enrolments across India.
By Level: The Enrolment through Regular Mode at various levels is 257.6 lakhs in India. Break-up across various levels
and split by gender is given in the figure / table below. As can be inferred, the highest share of enrolment (81.7%) is at
under-graduate level, followed by post-graduate (9.1%) and Diploma (7.6%), with all other levels forming only 1.6%. As
can be seen from table above, share of enrolment is almost equal in private unaided and government colleges in the
country with 38.3% and 37.9% respectively.
By Stream: The total enrolment at under graduate level for the top ten streams (in terms of enrolment) is presented in the
figure below. Arts/Humanities/Social Sciences tops the list with 40% enrolment, followed by Engineering &
Technology (16.6%). It is interesting to note that female share of enrolment (47%, as a % of total female enrolment) in
arts/humanities/social sciences is higher than the male share (36%, as a % of total male enrolment) while the male share
of enrolment (22%) in engineering & technology is much higher than the female share of enrolment (11%). Gandhian
Studies courses had the least enrolment (20 seats).
Ph.D. M.PhilPost
GraduateUnder
GraduatePG
DiplomaDiploma Certificate Integrated
Female 32134 18241 1115288 9660155 25184 583044 53030 27747
Male 49296 15913 1236376 11381742 96418 1373675 45434 44417
0%10%20%30%40%50%60%70%80%90%
100%
Figure 4: Enrolment through Regular Mode at various levels - India
Arts/Humanities/ SocialSciences
Engineering &
Technology
Commerce
ScienceIT &
ComputerEducation
MedicalScience
Management
Agriculture
OrientalLearning
Law
Female 3390625 790965 1087458 995810 318790 313859 297715 201623 18642 48735 49727
Male 3245320 1983863 1377818 1046019 473907 204934 191586 175250 57046 42704 105886
0%
10%
20%
30%
40%
50%
60%
70%
80%
90%
100%
Figure 5: Enrolment at Under Graduate Level, by top ten streams - India
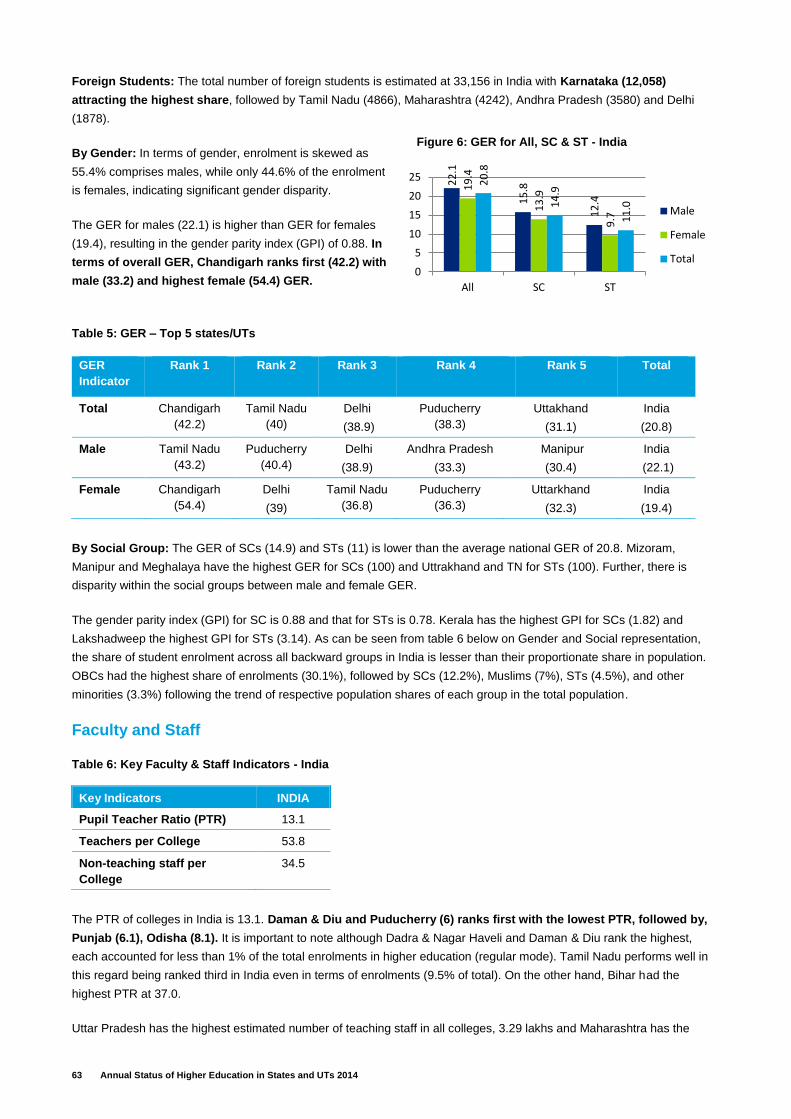
63 Annual Status of Higher Education in States and UTs 2014
Foreign Students: The total number of foreign students is estimated at 33,156 in India with Karnataka (12,058)
attracting the highest share, followed by Tamil Nadu (4866), Maharashtra (4242), Andhra Pradesh (3580) and Delhi
(1878).
By Gender: In terms of gender, enrolment is skewed as
55.4% comprises males, while only 44.6% of the enrolment
is females, indicating significant gender disparity.
The GER for males (22.1) is higher than GER for females
(19.4), resulting in the gender parity index (GPI) of 0.88. In
terms of overall GER, Chandigarh ranks first (42.2) with
male (33.2) and highest female (54.4) GER.
Table 5: GER – Top 5 states/UTs
By Social Group: The GER of SCs (14.9) and STs (11) is lower than the average national GER of 20.8. Mizoram,
Manipur and Meghalaya have the highest GER for SCs (100) and Uttrakhand and TN for STs (100). Further, there is
disparity within the social groups between male and female GER.
The gender parity index (GPI) for SC is 0.88 and that for STs is 0.78. Kerala has the highest GPI for SCs (1.82) and
Lakshadweep the highest GPI for STs (3.14). As can be seen from table 6 below on Gender and Social representation,
the share of student enrolment across all backward groups in India is lesser than their proportionate share in population.
OBCs had the highest share of enrolments (30.1%), followed by SCs (12.2%), Muslims (7%), STs (4.5%), and other
minorities (3.3%) following the trend of respective population shares of each group in the total population.
Faculty and Staff
Table 6: Key Faculty & Staff Indicators - India
The PTR of colleges in India is 13.1. Daman & Diu and Puducherry (6) ranks first with the lowest PTR, followed by,
Punjab (6.1), Odisha (8.1). It is important to note although Dadra & Nagar Haveli and Daman & Diu rank the highest,
each accounted for less than 1% of the total enrolments in higher education (regular mode). Tamil Nadu performs well in
this regard being ranked third in India even in terms of enrolments (9.5% of total). On the other hand, Bihar had the
highest PTR at 37.0.
Uttar Pradesh has the highest estimated number of teaching staff in all colleges, 3.29 lakhs and Maharashtra has the
GER
Indicator
Rank 1 Rank 2 Rank 3 Rank 4 Rank 5 Total
Total Chandigarh
(42.2)
Tamil Nadu
(40)
Delhi
(38.9)
Puducherry
(38.3)
Uttakhand
(31.1)
India
(20.8)
Male Tamil Nadu
(43.2)
Puducherry
(40.4)
Delhi
(38.9)
Andhra Pradesh
(33.3)
Manipur
(30.4)
India
(22.1)
Female Chandigarh
(54.4)
Delhi
(39)
Tamil Nadu
(36.8)
Puducherry
(36.3)
Uttarkhand
(32.3)
India
(19.4)
Key Indicators INDIA
Pupil Teacher Ratio (PTR) 13.1
Teachers per College 53.8
Non-teaching staff per
College
34.5
22
.1
15
.8
12
.4
19
.4
13
.9
9.7
20
.8
14
.9
11
.0
0
5
10
15
20
25
All SC ST
Male
Female
Total
Figure 6: GER for All, SC & ST - India
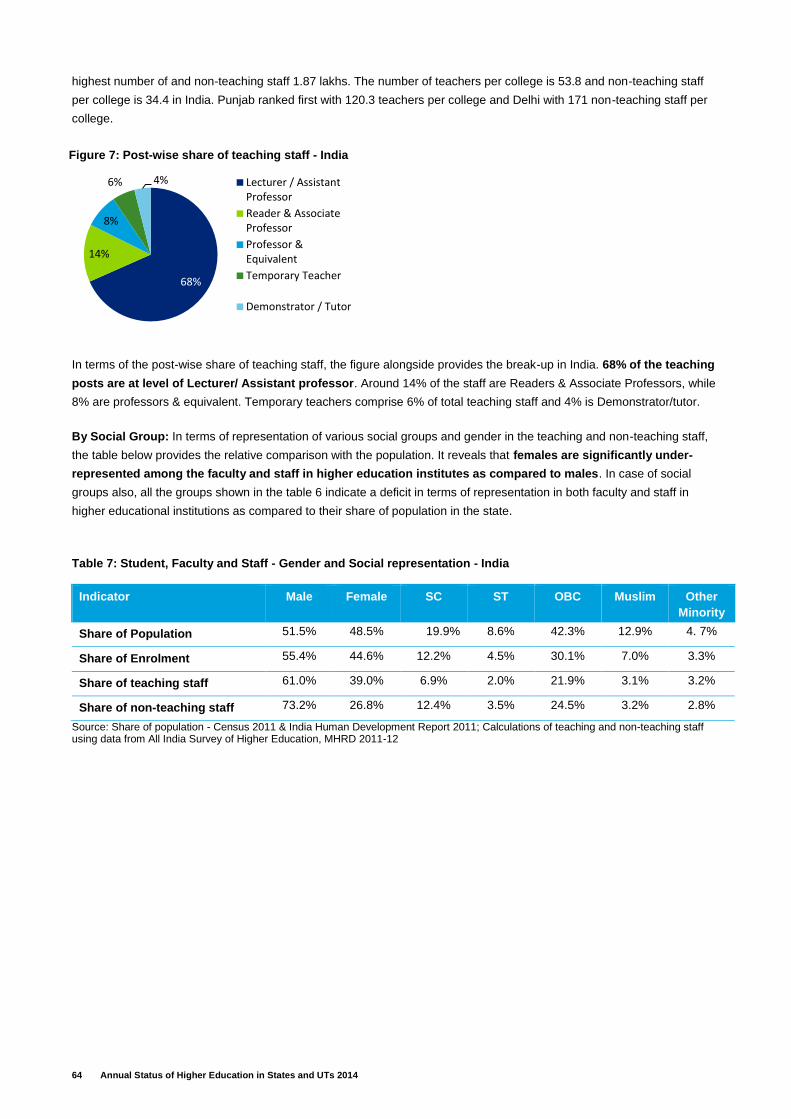
64 Annual Status of Higher Education in States and UTs 2014
highest number of and non-teaching staff 1.87 lakhs. The number of teachers per college is 53.8 and non-teaching staff
per college is 34.4 in India. Punjab ranked first with 120.3 teachers per college and Delhi with 171 non-teaching staff per
college.
In terms of the post-wise share of teaching staff, the figure alongside provides the break-up in India. 68% of the teaching
posts are at level of Lecturer/ Assistant professor. Around 14% of the staff are Readers & Associate Professors, while
8% are professors & equivalent. Temporary teachers comprise 6% of total teaching staff and 4% is Demonstrator/tutor.
By Social Group: In terms of representation of various social groups and gender in the teaching and non-teaching staff,
the table below provides the relative comparison with the population. It reveals that females are significantly under-
represented among the faculty and staff in higher education institutes as compared to males. In case of social
groups also, all the groups shown in the table 6 indicate a deficit in terms of representation in both faculty and staff in
higher educational institutions as compared to their share of population in the state.
Table 7: Student, Faculty and Staff - Gender and Social representation - India
Indicator Male Female SC ST OBC Muslim Other
Minority
Share of Population 51.5% 48.5% 19.9% 8.6% 42.3% 12.9% 4. 7%
Share of Enrolment 55.4% 44.6% 12.2% 4.5% 30.1% 7.0% 3.3%
Share of teaching staff 61.0% 39.0% 6.9% 2.0% 21.9% 3.1% 3.2%
Share of non-teaching staff 73.2% 26.8% 12.4% 3.5% 24.5% 3.2% 2.8%
Source: Share of population - Census 2011 & India Human Development Report 2011; Calculations of teaching and non-teaching staff using data from All India Survey of Higher Education, MHRD 2011-12
68%
14%
8%
6% 4% Lecturer / AssistantProfessor
Reader & AssociateProfessor
Professor &Equivalent
Temporary Teacher
Demonstrator / Tutor
Figure 7: Post-wise share of teaching staff - India
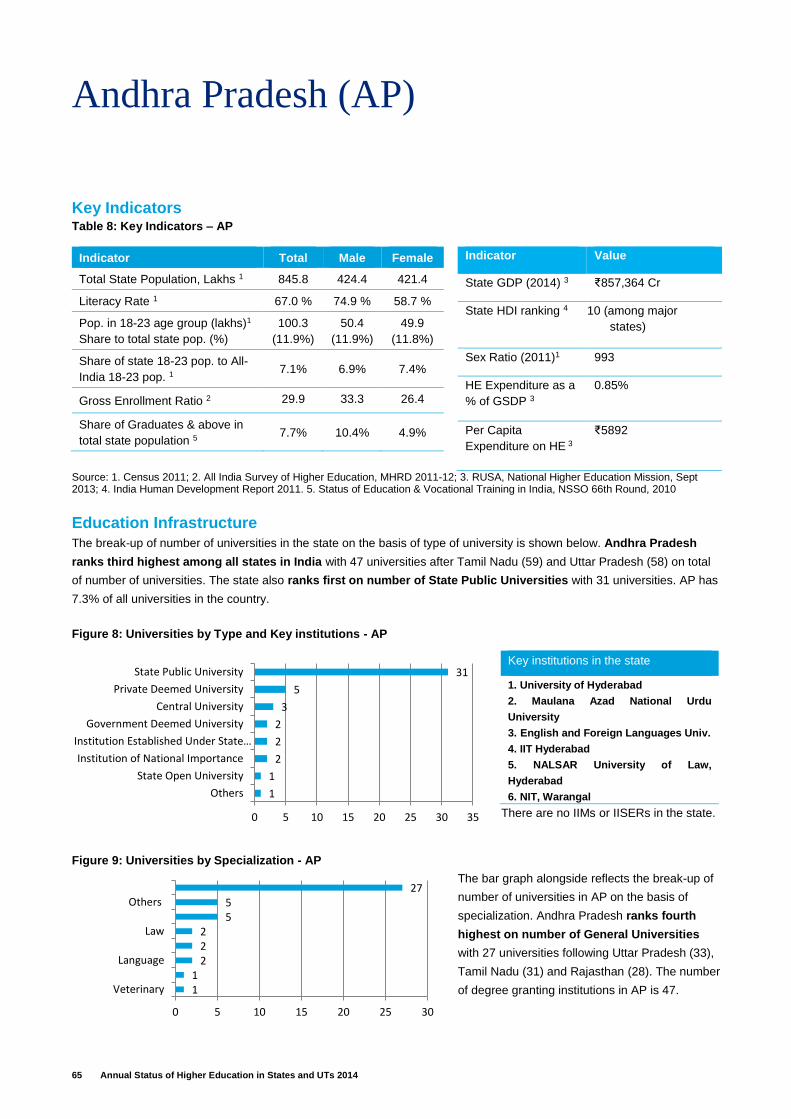
65 Annual Status of Higher Education in States and UTs 2014
Andhra Pradesh (AP)
Key Indicators Table 8: Key Indicators – AP
Indicator Total Male Female
Total State Population, Lakhs 1 845.8 424.4 421.4
Literacy Rate 1 67.0 % 74.9 % 58.7 %
Pop. in 18-23 age group (lakhs)1
Share to total state pop. (%)
100.3
(11.9%)
50.4
(11.9%)
49.9
(11.8%)
Share of state 18-23 pop. to All-
India 18-23 pop. 1 7.1% 6.9% 7.4%
Gross Enrollment Ratio 2 29.9 33.3 26.4
Share of Graduates & above in
total state population 5 7.7% 10.4% 4.9%
Indicator Value
State GDP (2014) 3 ₹857,364 Cr
State HDI ranking 4 10 10 (among major
states)
Sex Ratio (2011)1 993
HE Expenditure as a
% of GSDP 3
0.85%
Per Capita
Expenditure on HE 3
₹5892
Source: 1. Census 2011; 2. All India Survey of Higher Education, MHRD 2011-12; 3. RUSA, National Higher Education Mission, Sept 2013; 4. India Human Development Report 2011. 5. Status of Education & Vocational Training in India, NSSO 66th Round, 2010
Education Infrastructure
The break-up of number of universities in the state on the basis of type of university is shown below. Andhra Pradesh
ranks third highest among all states in India with 47 universities after Tamil Nadu (59) and Uttar Pradesh (58) on total
of number of universities. The state also ranks first on number of State Public Universities with 31 universities. AP has
7.3% of all universities in the country.
There are no IIMs or IISERs in the state.
Key institutions in the state
1. University of Hyderabad
2. Maulana Azad National Urdu
University
3. English and Foreign Languages Univ.
4. IIT Hyderabad
5. NALSAR University of Law,
Hyderabad
6. NIT, Warangal
The bar graph alongside reflects the break-up of
number of universities in AP on the basis of
specialization. Andhra Pradesh ranks fourth
highest on number of General Universities
with 27 universities following Uttar Pradesh (33),
Tamil Nadu (31) and Rajasthan (28). The number
of degree granting institutions in AP is 47.
Figure 8: Universities by Type and Key institutions - AP
11
222
55
27
0 5 10 15 20 25 30
Veterinary
Language
Law
Others
Figure 9: Universities by Specialization - AP
1
1
2
2
2
3
5
31
0 5 10 15 20 25 30 35
Others
State Open University
Institution of National Importance
Institution Established Under State…
Government Deemed University
Central University
Private Deemed University
State Public University
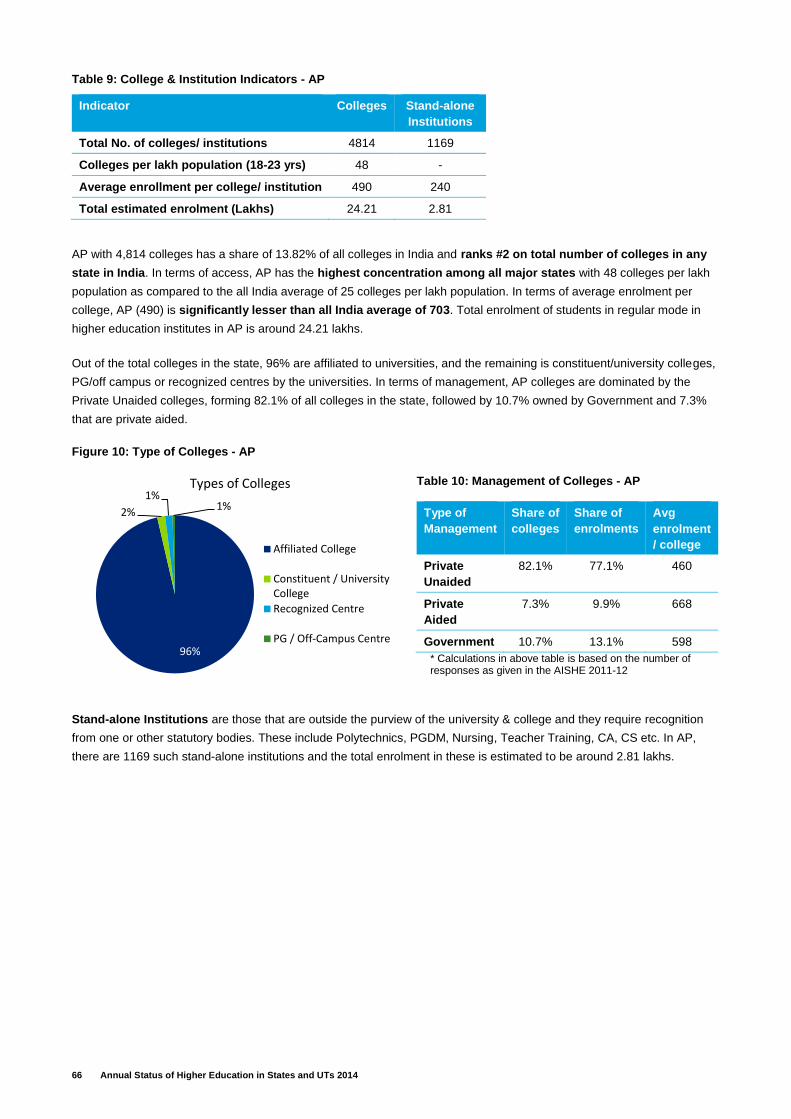
66 Annual Status of Higher Education in States and UTs 2014
Table 9: College & Institution Indicators - AP
AP with 4,814 colleges has a share of 13.82% of all colleges in India and ranks #2 on total number of colleges in any
state in India. In terms of access, AP has the highest concentration among all major states with 48 colleges per lakh
population as compared to the all India average of 25 colleges per lakh population. In terms of average enrolment per
college, AP (490) is significantly lesser than all India average of 703. Total enrolment of students in regular mode in
higher education institutes in AP is around 24.21 lakhs.
Out of the total colleges in the state, 96% are affiliated to universities, and the remaining is constituent/university colleges,
PG/off campus or recognized centres by the universities. In terms of management, AP colleges are dominated by the
Private Unaided colleges, forming 82.1% of all colleges in the state, followed by 10.7% owned by Government and 7.3%
that are private aided.
Figure 10: Type of Colleges - AP
Table 10: Management of Colleges - AP
Type of
Management
Share of
colleges
Share of
enrolments
Avg
enrolment
/ college
Private
Unaided
82.1% 77.1% 460
Private
Aided
7.3% 9.9% 668
Government 10.7% 13.1% 598
* Calculations in above table is based on the number of responses as given in the AISHE 2011-12
Stand-alone Institutions are those that are outside the purview of the university & college and they require recognition
from one or other statutory bodies. These include Polytechnics, PGDM, Nursing, Teacher Training, CA, CS etc. In AP,
there are 1169 such stand-alone institutions and the total enrolment in these is estimated to be around 2.81 lakhs.
Indicator Colleges Stand-alone
Institutions
Total No. of colleges/ institutions 4814 1169
Colleges per lakh population (18-23 yrs) 48 -
Average enrollment per college/ institution 490 240
Total estimated enrolment (Lakhs) 24.21 2.81
96%
2%
1%1%
Types of Colleges
Affiliated College
Constituent / UniversityCollege
Recognized Centre
PG / Off-Campus Centre
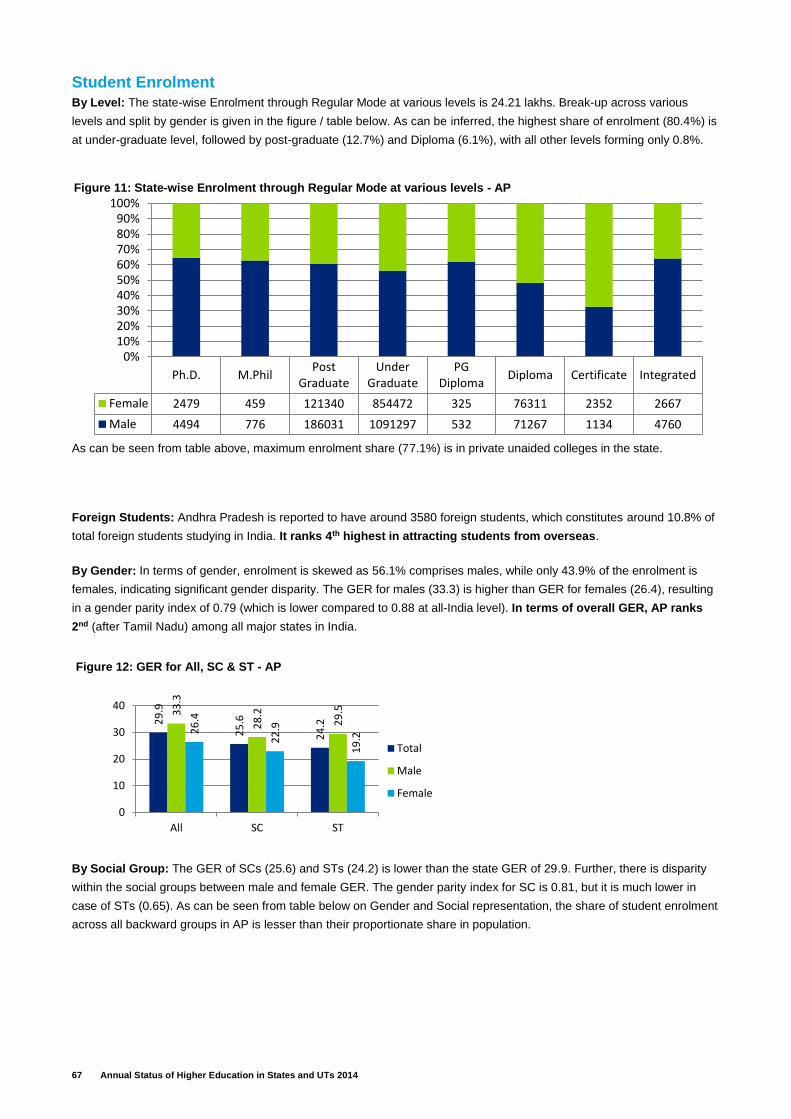
67 Annual Status of Higher Education in States and UTs 2014
Student Enrolment
By Level: The state-wise Enrolment through Regular Mode at various levels is 24.21 lakhs. Break-up across various
levels and split by gender is given in the figure / table below. As can be inferred, the highest share of enrolment (80.4%) is
at under-graduate level, followed by post-graduate (12.7%) and Diploma (6.1%), with all other levels forming only 0.8%.
As can be seen from table above, maximum enrolment share (77.1%) is in private unaided colleges in the state.
Foreign Students: Andhra Pradesh is reported to have around 3580 foreign students, which constitutes around 10.8% of
total foreign students studying in India. It ranks 4th highest in attracting students from overseas.
By Gender: In terms of gender, enrolment is skewed as 56.1% comprises males, while only 43.9% of the enrolment is
females, indicating significant gender disparity. The GER for males (33.3) is higher than GER for females (26.4), resulting
in a gender parity index of 0.79 (which is lower compared to 0.88 at all-India level). In terms of overall GER, AP ranks
2nd (after Tamil Nadu) among all major states in India.
By Social Group: The GER of SCs (25.6) and STs (24.2) is lower than the state GER of 29.9. Further, there is disparity
within the social groups between male and female GER. The gender parity index for SC is 0.81, but it is much lower in
case of STs (0.65). As can be seen from table below on Gender and Social representation, the share of student enrolment
across all backward groups in AP is lesser than their proportionate share in population.
Ph.D. M.PhilPost
GraduateUnder
GraduatePG
DiplomaDiploma Certificate Integrated
Female 2479 459 121340 854472 325 76311 2352 2667
Male 4494 776 186031 1091297 532 71267 1134 4760
0%10%20%30%40%50%60%70%80%90%
100%Figure 11: State‐wise Enrolment through Regular Mode at various levels - AP
29
.9
25
.6
24
.2
33
.3
28
.2
29
.5
26
.4
22
.9
19
.2
0
10
20
30
40
All SC ST
Total
Male
Female
Figure 12: GER for All, SC & ST - AP
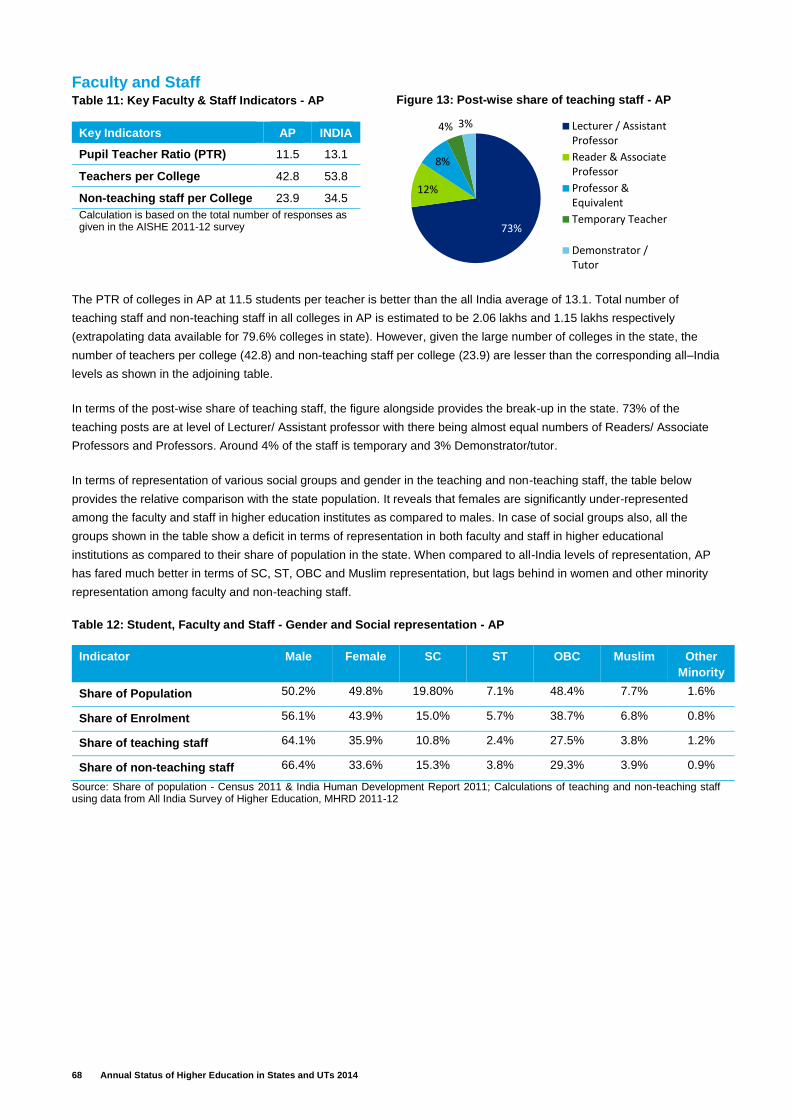
68 Annual Status of Higher Education in States and UTs 2014
Faculty and Staff Table 11: Key Faculty & Staff Indicators - AP
The PTR of colleges in AP at 11.5 students per teacher is better than the all India average of 13.1. Total number of
teaching staff and non-teaching staff in all colleges in AP is estimated to be 2.06 lakhs and 1.15 lakhs respectively
(extrapolating data available for 79.6% colleges in state). However, given the large number of colleges in the state, the
number of teachers per college (42.8) and non-teaching staff per college (23.9) are lesser than the corresponding all–India
levels as shown in the adjoining table.
In terms of the post-wise share of teaching staff, the figure alongside provides the break-up in the state. 73% of the
teaching posts are at level of Lecturer/ Assistant professor with there being almost equal numbers of Readers/ Associate
Professors and Professors. Around 4% of the staff is temporary and 3% Demonstrator/tutor.
In terms of representation of various social groups and gender in the teaching and non-teaching staff, the table below
provides the relative comparison with the state population. It reveals that females are significantly under-represented
among the faculty and staff in higher education institutes as compared to males. In case of social groups also, all the
groups shown in the table show a deficit in terms of representation in both faculty and staff in higher educational
institutions as compared to their share of population in the state. When compared to all-India levels of representation, AP
has fared much better in terms of SC, ST, OBC and Muslim representation, but lags behind in women and other minority
representation among faculty and non-teaching staff.
Table 12: Student, Faculty and Staff - Gender and Social representation - AP
Indicator Male Female SC ST OBC Muslim Other
Minority
Share of Population 50.2% 49.8% 19.80% 7.1% 48.4% 7.7% 1.6%
Share of Enrolment 56.1% 43.9% 15.0% 5.7% 38.7% 6.8% 0.8%
Share of teaching staff 64.1% 35.9% 10.8% 2.4% 27.5% 3.8% 1.2%
Share of non-teaching staff 66.4% 33.6% 15.3% 3.8% 29.3% 3.9% 0.9%
Source: Share of population - Census 2011 & India Human Development Report 2011; Calculations of teaching and non-teaching staff using data from All India Survey of Higher Education, MHRD 2011-12
Key Indicators AP INDIA
Pupil Teacher Ratio (PTR) 11.5 13.1
Teachers per College 42.8 53.8
Non-teaching staff per College 23.9 34.5
Calculation is based on the total number of responses as given in the AISHE 2011-12 survey 73%
12%
8%
4% 3% Lecturer / AssistantProfessor
Reader & AssociateProfessor
Professor &Equivalent
Temporary Teacher
Demonstrator /Tutor
Figure 13: Post-wise share of teaching staff - AP
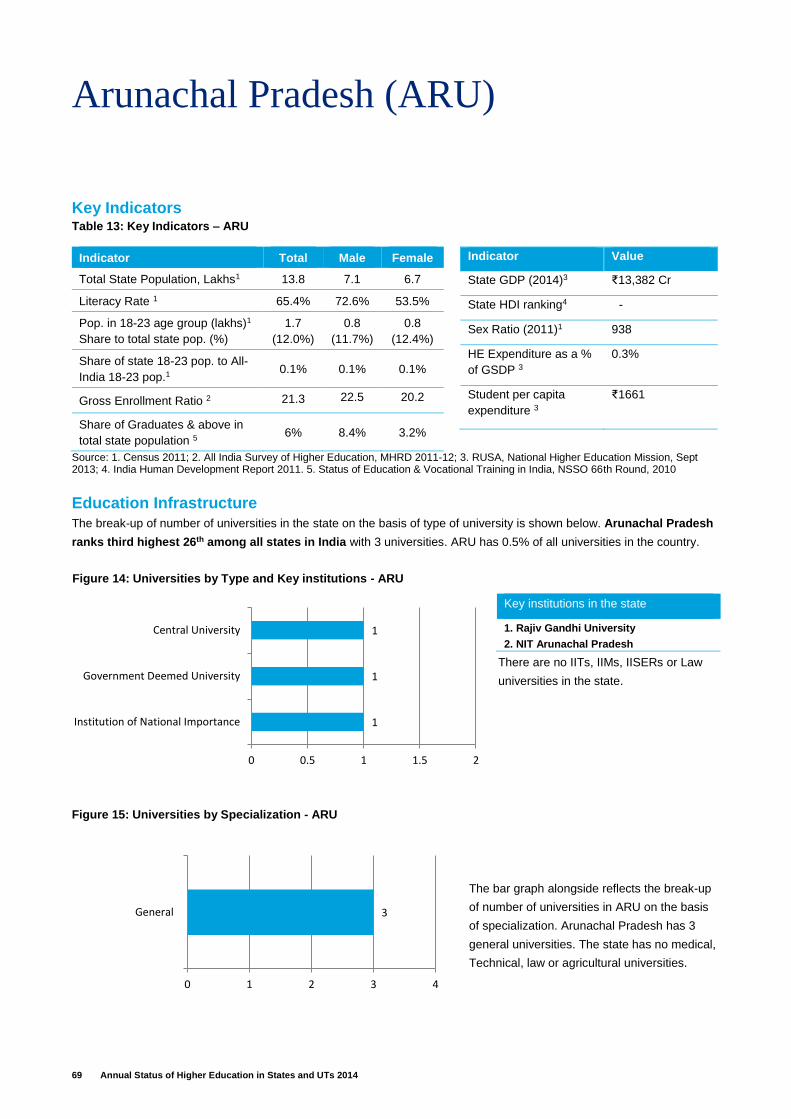
69 Annual Status of Higher Education in States and UTs 2014
Arunachal Pradesh (ARU)
Key Indicators Table 13: Key Indicators – ARU
Indicator Total Male Female
Total State Population, Lakhs1 13.8 7.1 6.7
Literacy Rate 1 65.4% 72.6% 53.5%
Pop. in 18-23 age group (lakhs)1
Share to total state pop. (%)
1.7
(12.0%)
0.8
(11.7%)
0.8
(12.4%)
Share of state 18-23 pop. to All-
India 18-23 pop.1 0.1% 0.1% 0.1%
Gross Enrollment Ratio 2 21.3 22.5 20.2
Share of Graduates & above in
total state population 5 6% 8.4% 3.2%
Indicator Value
State GDP (2014)3 ₹13,382 Cr
State HDI ranking4 -
Sex Ratio (2011)1 938
HE Expenditure as a %
of GSDP 3
0.3%
Student per capita
expenditure 3
₹1661
Source: 1. Census 2011; 2. All India Survey of Higher Education, MHRD 2011-12; 3. RUSA, National Higher Education Mission, Sept 2013; 4. India Human Development Report 2011. 5. Status of Education & Vocational Training in India, NSSO 66th Round, 2010
Education Infrastructure
The break-up of number of universities in the state on the basis of type of university is shown below. Arunachal Pradesh
ranks third highest 26th among all states in India with 3 universities. ARU has 0.5% of all universities in the country.
There are no IITs, IIMs, IISERs or Law
universities in the state.
Key institutions in the state
1. Rajiv Gandhi University
2. NIT Arunachal Pradesh
The bar graph alongside reflects the break-up
of number of universities in ARU on the basis
of specialization. Arunachal Pradesh has 3
general universities. The state has no medical,
Technical, law or agricultural universities.
Figure 14: Universities by Type and Key institutions - ARU
3
0 1 2 3 4
General
Figure 15: Universities by Specialization - ARU
1
1
1
0 0.5 1 1.5 2
Institution of National Importance
Government Deemed University
Central University
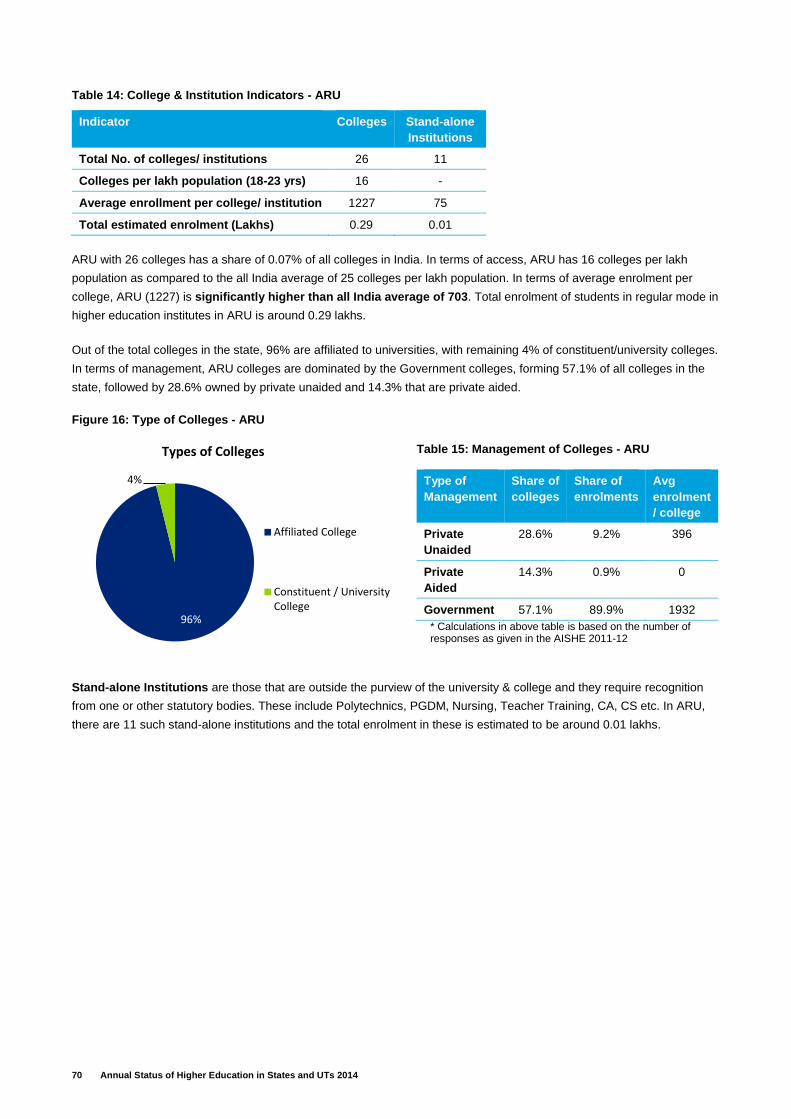
70 Annual Status of Higher Education in States and UTs 2014
Table 14: College & Institution Indicators - ARU
ARU with 26 colleges has a share of 0.07% of all colleges in India. In terms of access, ARU has 16 colleges per lakh
population as compared to the all India average of 25 colleges per lakh population. In terms of average enrolment per
college, ARU (1227) is significantly higher than all India average of 703. Total enrolment of students in regular mode in
higher education institutes in ARU is around 0.29 lakhs.
Out of the total colleges in the state, 96% are affiliated to universities, with remaining 4% of constituent/university colleges.
In terms of management, ARU colleges are dominated by the Government colleges, forming 57.1% of all colleges in the
state, followed by 28.6% owned by private unaided and 14.3% that are private aided.
Figure 16: Type of Colleges - ARU
Table 15: Management of Colleges - ARU
Type of
Management
Share of
colleges
Share of
enrolments
Avg
enrolment
/ college
Private
Unaided
28.6% 9.2% 396
Private
Aided
14.3% 0.9% 0
Government 57.1% 89.9% 1932
* Calculations in above table is based on the number of responses as given in the AISHE 2011-12
Stand-alone Institutions are those that are outside the purview of the university & college and they require recognition
from one or other statutory bodies. These include Polytechnics, PGDM, Nursing, Teacher Training, CA, CS etc. In ARU,
there are 11 such stand-alone institutions and the total enrolment in these is estimated to be around 0.01 lakhs.
Indicator Colleges Stand-alone
Institutions
Total No. of colleges/ institutions 26 11
Colleges per lakh population (18-23 yrs) 16 -
Average enrollment per college/ institution 1227 75
Total estimated enrolment (Lakhs) 0.29 0.01
96%
4%
Types of Colleges
Affiliated College
Constituent / UniversityCollege
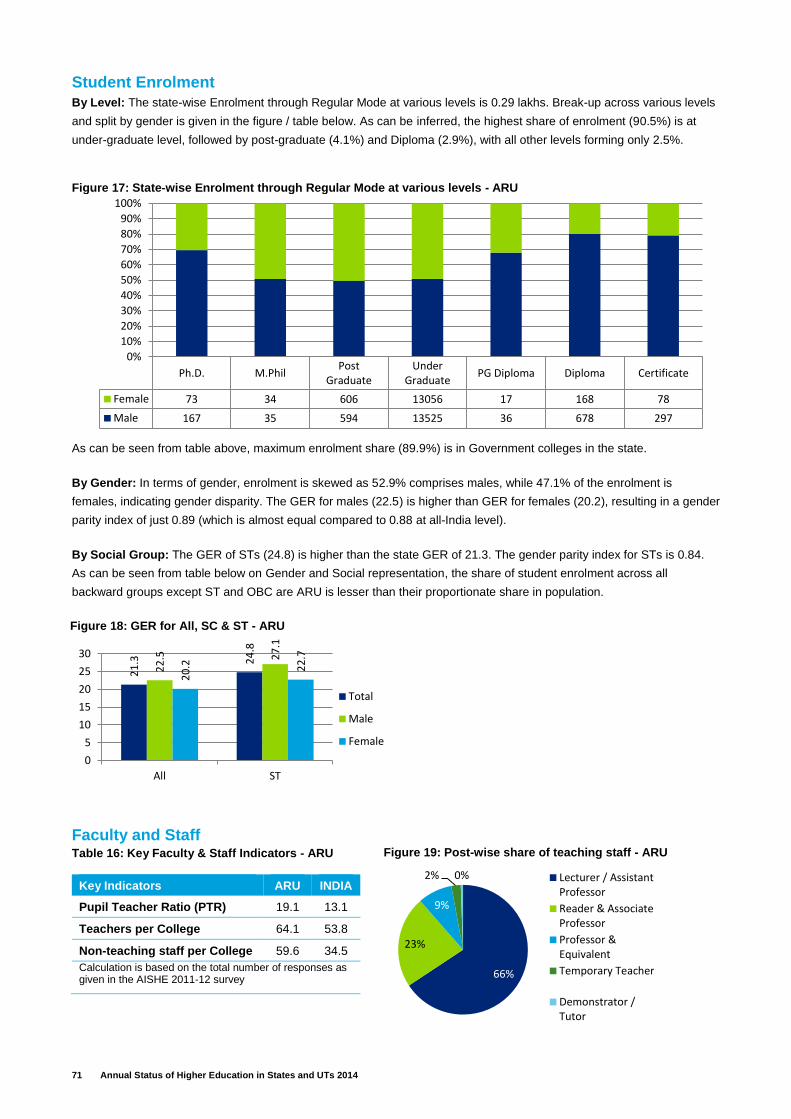
71 Annual Status of Higher Education in States and UTs 2014
Student Enrolment
By Level: The state-wise Enrolment through Regular Mode at various levels is 0.29 lakhs. Break-up across various levels
and split by gender is given in the figure / table below. As can be inferred, the highest share of enrolment (90.5%) is at
under-graduate level, followed by post-graduate (4.1%) and Diploma (2.9%), with all other levels forming only 2.5%.
As can be seen from table above, maximum enrolment share (89.9%) is in Government colleges in the state.
By Gender: In terms of gender, enrolment is skewed as 52.9% comprises males, while 47.1% of the enrolment is
females, indicating gender disparity. The GER for males (22.5) is higher than GER for females (20.2), resulting in a gender
parity index of just 0.89 (which is almost equal compared to 0.88 at all-India level).
By Social Group: The GER of STs (24.8) is higher than the state GER of 21.3. The gender parity index for STs is 0.84.
As can be seen from table below on Gender and Social representation, the share of student enrolment across all
backward groups except ST and OBC are ARU is lesser than their proportionate share in population.
Faculty and Staff Table 16: Key Faculty & Staff Indicators - ARU
Key Indicators ARU INDIA
Pupil Teacher Ratio (PTR) 19.1 13.1
Teachers per College 64.1 53.8
Non-teaching staff per College 59.6 34.5
Calculation is based on the total number of responses as given in the AISHE 2011-12 survey
Ph.D. M.PhilPost
GraduateUnder
GraduatePG Diploma Diploma Certificate
Female 73 34 606 13056 17 168 78
Male 167 35 594 13525 36 678 297
0%
10%
20%
30%
40%
50%
60%
70%
80%
90%
100%
Figure 17: State‐wise Enrolment through Regular Mode at various levels - ARU
21
.3 24
.8
22
.5 27
.1
20
.2 22
.7
0
5
10
15
20
25
30
All ST
Total
Male
Female
Figure 18: GER for All, SC & ST - ARU
66%
23%
9%
2% 0% Lecturer / AssistantProfessor
Reader & AssociateProfessor
Professor &Equivalent
Temporary Teacher
Demonstrator /Tutor
Figure 19: Post-wise share of teaching staff - ARU
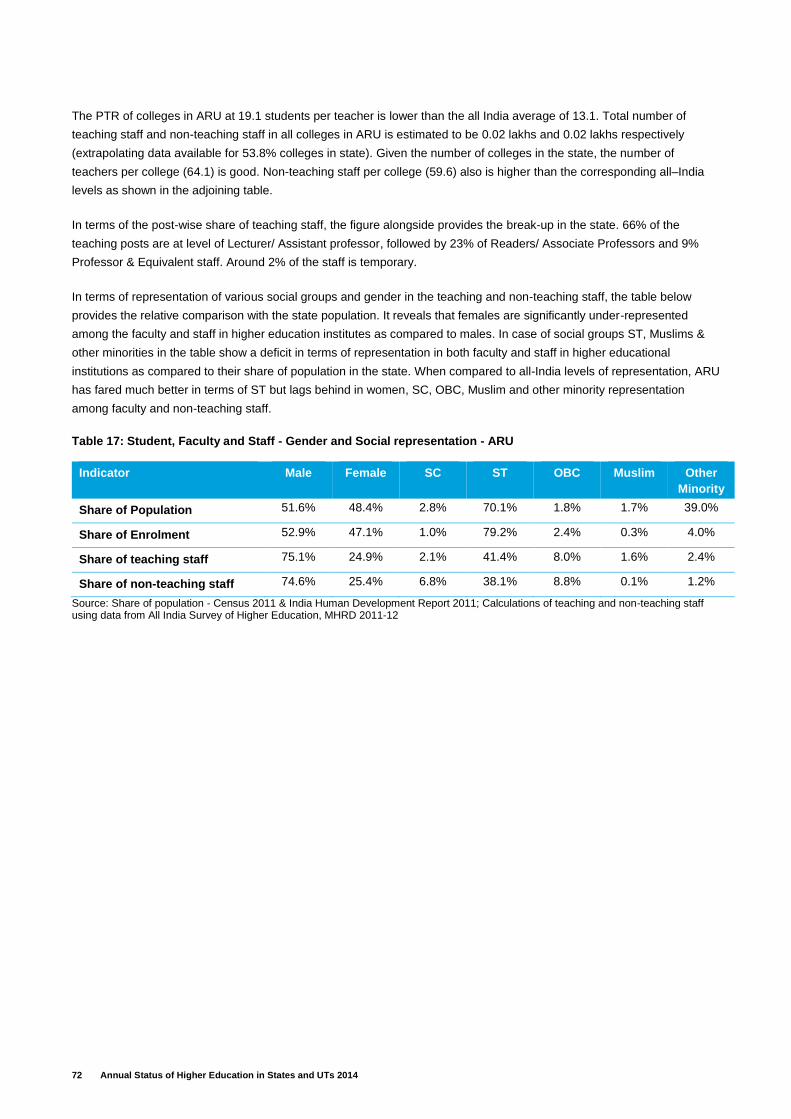
72 Annual Status of Higher Education in States and UTs 2014
The PTR of colleges in ARU at 19.1 students per teacher is lower than the all India average of 13.1. Total number of
teaching staff and non-teaching staff in all colleges in ARU is estimated to be 0.02 lakhs and 0.02 lakhs respectively
(extrapolating data available for 53.8% colleges in state). Given the number of colleges in the state, the number of
teachers per college (64.1) is good. Non-teaching staff per college (59.6) also is higher than the corresponding all–India
levels as shown in the adjoining table.
In terms of the post-wise share of teaching staff, the figure alongside provides the break-up in the state. 66% of the
teaching posts are at level of Lecturer/ Assistant professor, followed by 23% of Readers/ Associate Professors and 9%
Professor & Equivalent staff. Around 2% of the staff is temporary.
In terms of representation of various social groups and gender in the teaching and non-teaching staff, the table below
provides the relative comparison with the state population. It reveals that females are significantly under-represented
among the faculty and staff in higher education institutes as compared to males. In case of social groups ST, Muslims &
other minorities in the table show a deficit in terms of representation in both faculty and staff in higher educational
institutions as compared to their share of population in the state. When compared to all-India levels of representation, ARU
has fared much better in terms of ST but lags behind in women, SC, OBC, Muslim and other minority representation
among faculty and non-teaching staff.
Table 17: Student, Faculty and Staff - Gender and Social representation - ARU
Indicator Male Female SC ST OBC Muslim Other
Minority
Share of Population 51.6% 48.4% 2.8% 70.1% 1.8% 1.7% 39.0%
Share of Enrolment 52.9% 47.1% 1.0% 79.2% 2.4% 0.3% 4.0%
Share of teaching staff 75.1% 24.9% 2.1% 41.4% 8.0% 1.6% 2.4%
Share of non-teaching staff 74.6% 25.4% 6.8% 38.1% 8.8% 0.1% 1.2%
Source: Share of population - Census 2011 & India Human Development Report 2011; Calculations of teaching and non-teaching staff using data from All India Survey of Higher Education, MHRD 2011-12
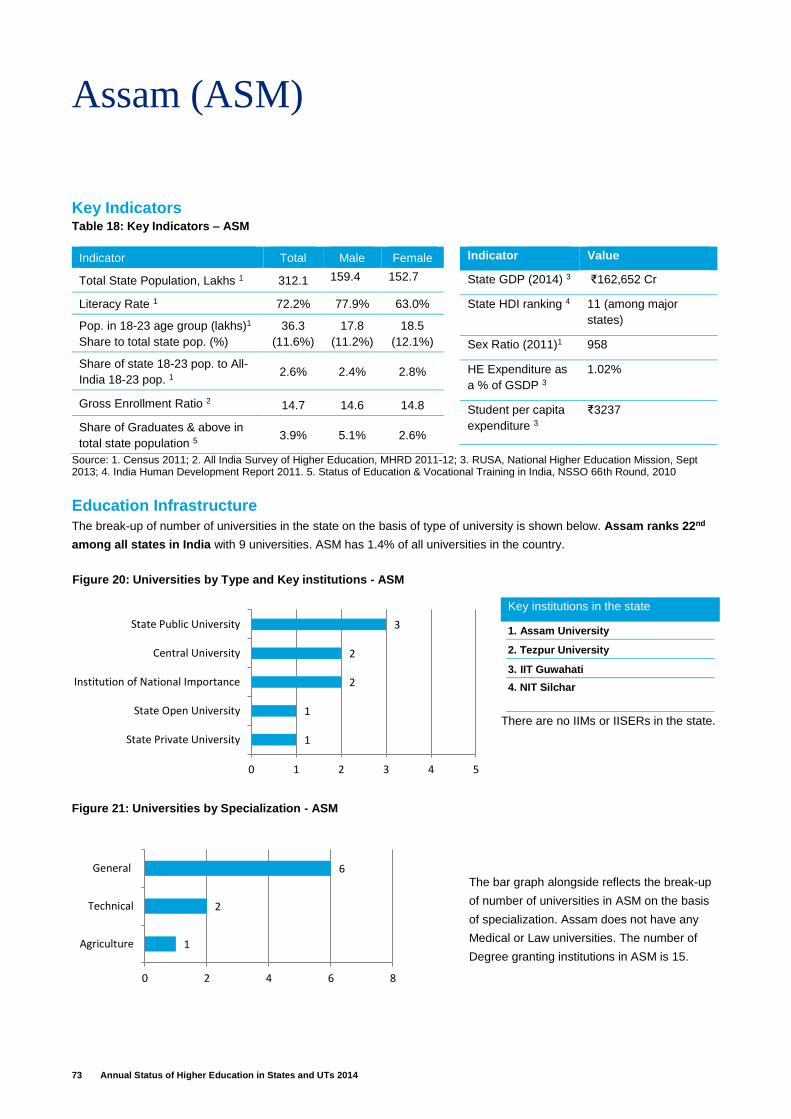
73 Annual Status of Higher Education in States and UTs 2014
Assam (ASM)
Key Indicators Table 18: Key Indicators – ASM
Indicator Total Male Female
Total State Population, Lakhs 1 312.1 159.4 152.7
Literacy Rate 1 72.2% 77.9% 63.0%
Pop. in 18-23 age group (lakhs)1
Share to total state pop. (%)
36.3
(11.6%)
17.8
(11.2%)
18.5
(12.1%)
Share of state 18-23 pop. to All-
India 18-23 pop. 1 2.6% 2.4% 2.8%
Gross Enrollment Ratio 2 14.7 14.6 14.8
Share of Graduates & above in
total state population 5 3.9% 5.1% 2.6%
Indicator Value
State GDP (2014) 3 ₹162,652 Cr
State HDI ranking 4 11 (among major
states)
Sex Ratio (2011)1 958
HE Expenditure as
a % of GSDP 3
1.02%
Student per capita
expenditure 3
₹3237
Source: 1. Census 2011; 2. All India Survey of Higher Education, MHRD 2011-12; 3. RUSA, National Higher Education Mission, Sept 2013; 4. India Human Development Report 2011. 5. Status of Education & Vocational Training in India, NSSO 66th Round, 2010
Education Infrastructure
The break-up of number of universities in the state on the basis of type of university is shown below. Assam ranks 22nd
among all states in India with 9 universities. ASM has 1.4% of all universities in the country.
There are no IIMs or IISERs in the state.
Key institutions in the state
1. Assam University
2. Tezpur University
3. IIT Guwahati
4. NIT Silchar
The bar graph alongside reflects the break-up
of number of universities in ASM on the basis
of specialization. Assam does not have any
Medical or Law universities. The number of
Degree granting institutions in ASM is 15.
Figure 20: Universities by Type and Key institutions - ASM
1
2
6
0 2 4 6 8
Agriculture
Technical
General
Figure 21: Universities by Specialization - ASM
1
1
2
2
3
0 1 2 3 4 5
State Private University
State Open University
Institution of National Importance
Central University
State Public University
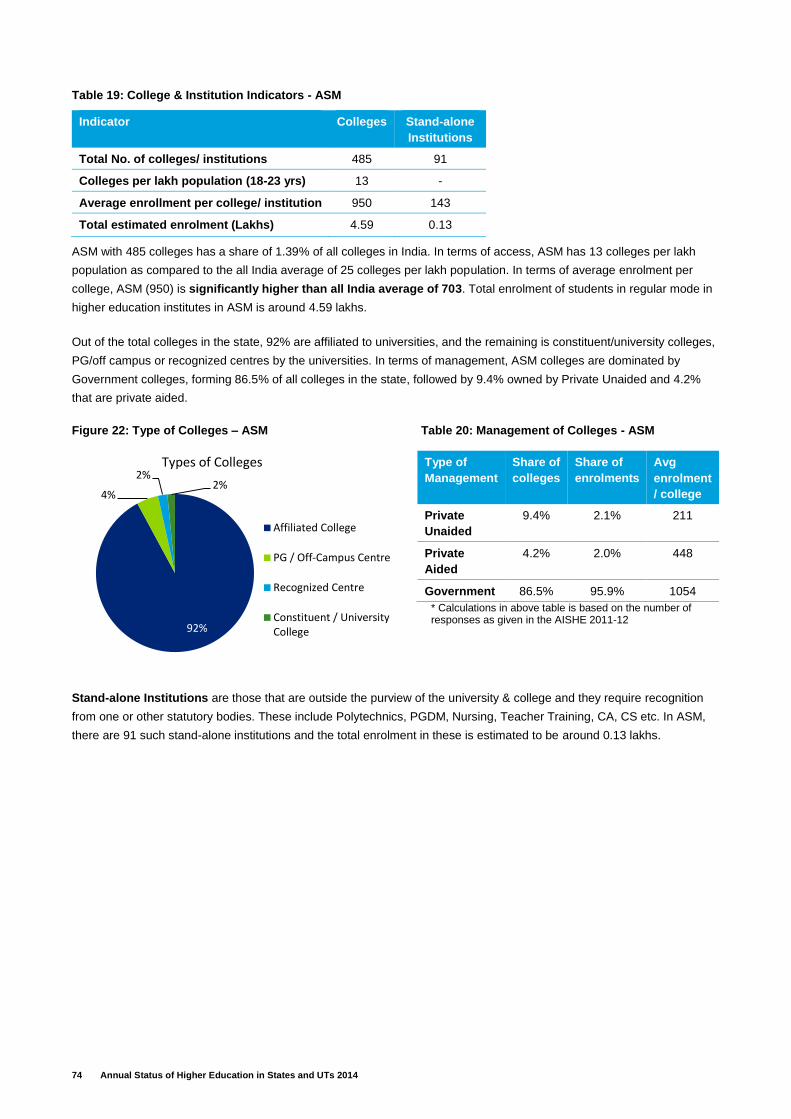
74 Annual Status of Higher Education in States and UTs 2014
Table 19: College & Institution Indicators - ASM
ASM with 485 colleges has a share of 1.39% of all colleges in India. In terms of access, ASM has 13 colleges per lakh
population as compared to the all India average of 25 colleges per lakh population. In terms of average enrolment per
college, ASM (950) is significantly higher than all India average of 703. Total enrolment of students in regular mode in
higher education institutes in ASM is around 4.59 lakhs.
Out of the total colleges in the state, 92% are affiliated to universities, and the remaining is constituent/university colleges,
PG/off campus or recognized centres by the universities. In terms of management, ASM colleges are dominated by
Government colleges, forming 86.5% of all colleges in the state, followed by 9.4% owned by Private Unaided and 4.2%
that are private aided.
Figure 22: Type of Colleges – ASM Table 20: Management of Colleges - ASM
* Calculations in above table is based on the number of responses as given in the AISHE 2011-12
Type of
Management
Share of
colleges
Share of
enrolments
Avg
enrolment
/ college
Private
Unaided
9.4% 2.1% 211
Private
Aided
4.2% 2.0% 448
Government 86.5% 95.9% 1054
Stand-alone Institutions are those that are outside the purview of the university & college and they require recognition
from one or other statutory bodies. These include Polytechnics, PGDM, Nursing, Teacher Training, CA, CS etc. In ASM,
there are 91 such stand-alone institutions and the total enrolment in these is estimated to be around 0.13 lakhs.
Indicator Colleges Stand-alone
Institutions
Total No. of colleges/ institutions 485 91
Colleges per lakh population (18-23 yrs) 13 -
Average enrollment per college/ institution 950 143
Total estimated enrolment (Lakhs) 4.59 0.13
92%
4%
2%2%
Types of Colleges
Affiliated College
PG / Off-Campus Centre
Recognized Centre
Constituent / UniversityCollege
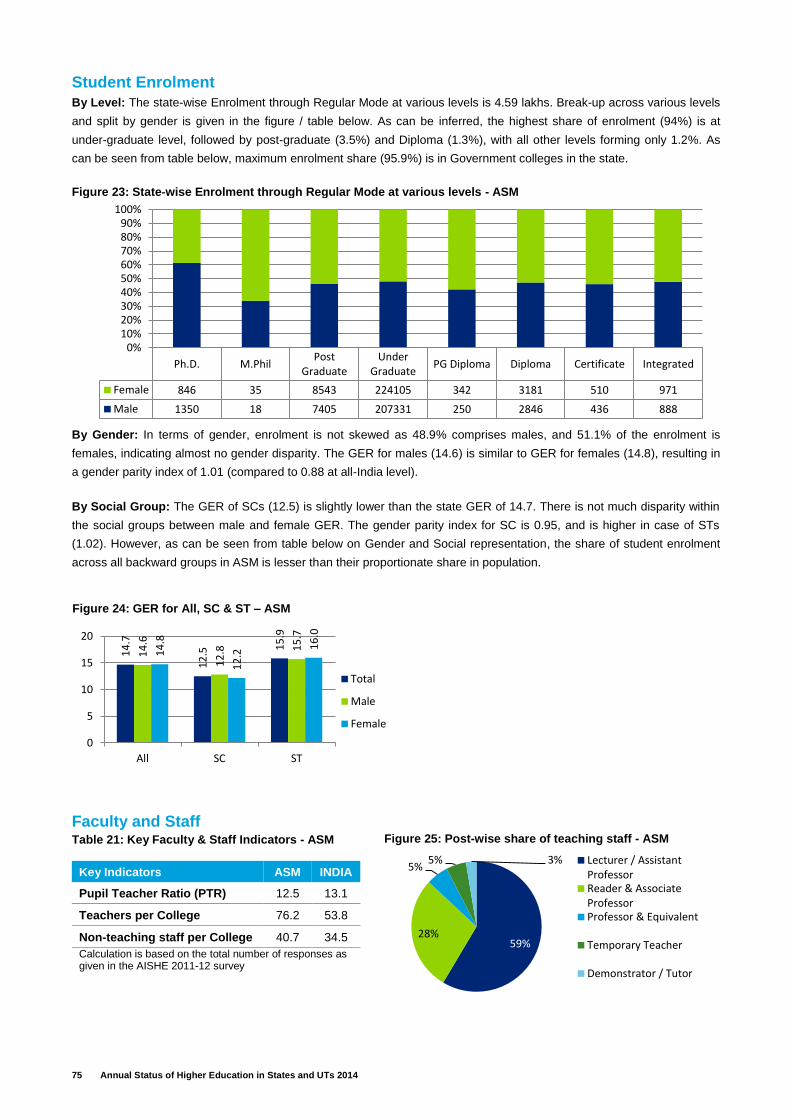
75 Annual Status of Higher Education in States and UTs 2014
Student Enrolment
By Level: The state-wise Enrolment through Regular Mode at various levels is 4.59 lakhs. Break-up across various levels
and split by gender is given in the figure / table below. As can be inferred, the highest share of enrolment (94%) is at
under-graduate level, followed by post-graduate (3.5%) and Diploma (1.3%), with all other levels forming only 1.2%. As
can be seen from table below, maximum enrolment share (95.9%) is in Government colleges in the state.
By Gender: In terms of gender, enrolment is not skewed as 48.9% comprises males, and 51.1% of the enrolment is
females, indicating almost no gender disparity. The GER for males (14.6) is similar to GER for females (14.8), resulting in
a gender parity index of 1.01 (compared to 0.88 at all-India level).
By Social Group: The GER of SCs (12.5) is slightly lower than the state GER of 14.7. There is not much disparity within
the social groups between male and female GER. The gender parity index for SC is 0.95, and is higher in case of STs
(1.02). However, as can be seen from table below on Gender and Social representation, the share of student enrolment
across all backward groups in ASM is lesser than their proportionate share in population.
Faculty and Staff Table 21: Key Faculty & Staff Indicators - ASM
Key Indicators ASM INDIA
Pupil Teacher Ratio (PTR) 12.5 13.1
Teachers per College 76.2 53.8
Non-teaching staff per College 40.7 34.5
Calculation is based on the total number of responses as given in the AISHE 2011-12 survey
Ph.D. M.PhilPost
GraduateUnder
GraduatePG Diploma Diploma Certificate Integrated
Female 846 35 8543 224105 342 3181 510 971
Male 1350 18 7405 207331 250 2846 436 888
0%10%20%30%40%50%60%70%80%90%
100%
Figure 23: State‐wise Enrolment through Regular Mode at various levels - ASM
14
.7
12
.5 15
.9
14
.6
12
.8 15
.7
14
.8
12
.2
16
.0
0
5
10
15
20
All SC ST
Total
Male
Female
Figure 24: GER for All, SC & ST – ASM
59%28%
5%5% 3% Lecturer / Assistant
ProfessorReader & AssociateProfessorProfessor & Equivalent
Temporary Teacher
Demonstrator / Tutor
Figure 25: Post-wise share of teaching staff - ASM
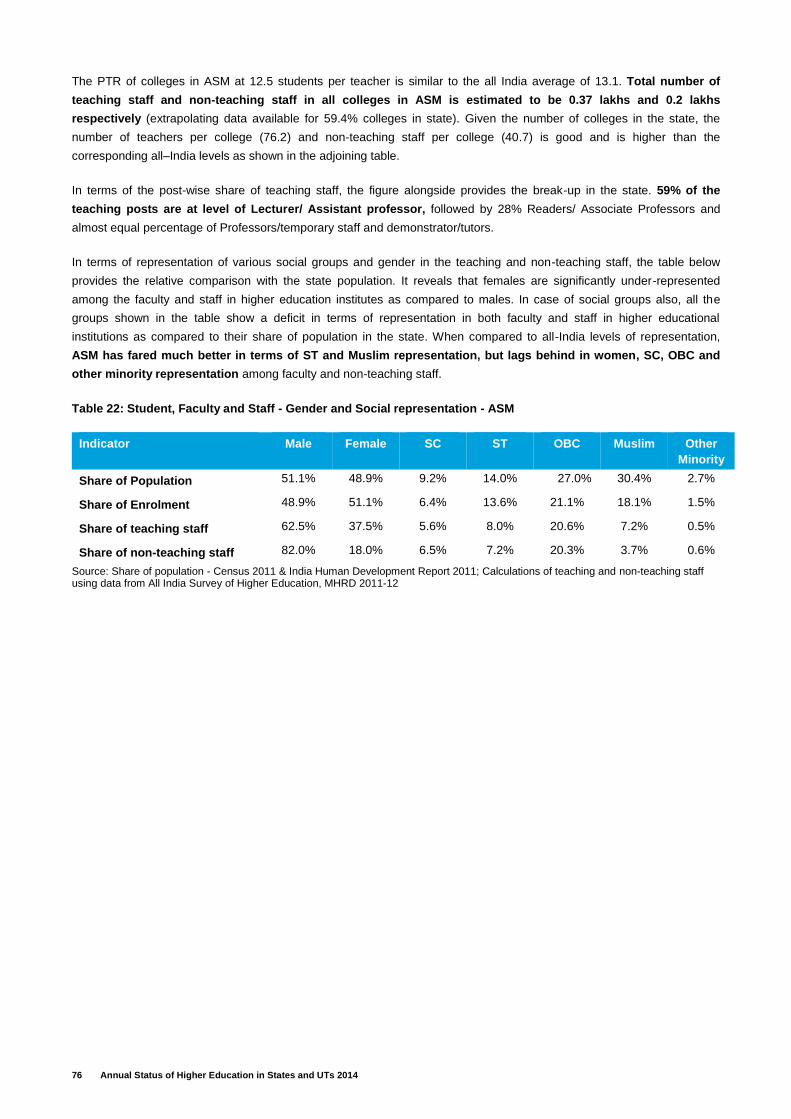
76 Annual Status of Higher Education in States and UTs 2014
The PTR of colleges in ASM at 12.5 students per teacher is similar to the all India average of 13.1. Total number of
teaching staff and non-teaching staff in all colleges in ASM is estimated to be 0.37 lakhs and 0.2 lakhs
respectively (extrapolating data available for 59.4% colleges in state). Given the number of colleges in the state, the
number of teachers per college (76.2) and non-teaching staff per college (40.7) is good and is higher than the
corresponding all–India levels as shown in the adjoining table.
In terms of the post-wise share of teaching staff, the figure alongside provides the break-up in the state. 59% of the
teaching posts are at level of Lecturer/ Assistant professor, followed by 28% Readers/ Associate Professors and
almost equal percentage of Professors/temporary staff and demonstrator/tutors.
In terms of representation of various social groups and gender in the teaching and non-teaching staff, the table below
provides the relative comparison with the state population. It reveals that females are significantly under-represented
among the faculty and staff in higher education institutes as compared to males. In case of social groups also, all the
groups shown in the table show a deficit in terms of representation in both faculty and staff in higher educational
institutions as compared to their share of population in the state. When compared to all-India levels of representation,
ASM has fared much better in terms of ST and Muslim representation, but lags behind in women, SC, OBC and
other minority representation among faculty and non-teaching staff.
Table 22: Student, Faculty and Staff - Gender and Social representation - ASM
Indicator Male Female SC ST OBC Muslim Other
Minority
Share of Population 51.1% 48.9% 9.2% 14.0% 27.0% 30.4% 2.7%
Share of Enrolment 48.9% 51.1% 6.4% 13.6% 21.1% 18.1% 1.5%
Share of teaching staff 62.5% 37.5% 5.6% 8.0% 20.6% 7.2% 0.5%
Share of non-teaching staff 82.0% 18.0% 6.5% 7.2% 20.3% 3.7% 0.6%
Source: Share of population - Census 2011 & India Human Development Report 2011; Calculations of teaching and non-teaching staff using data from All India Survey of Higher Education, MHRD 2011-12
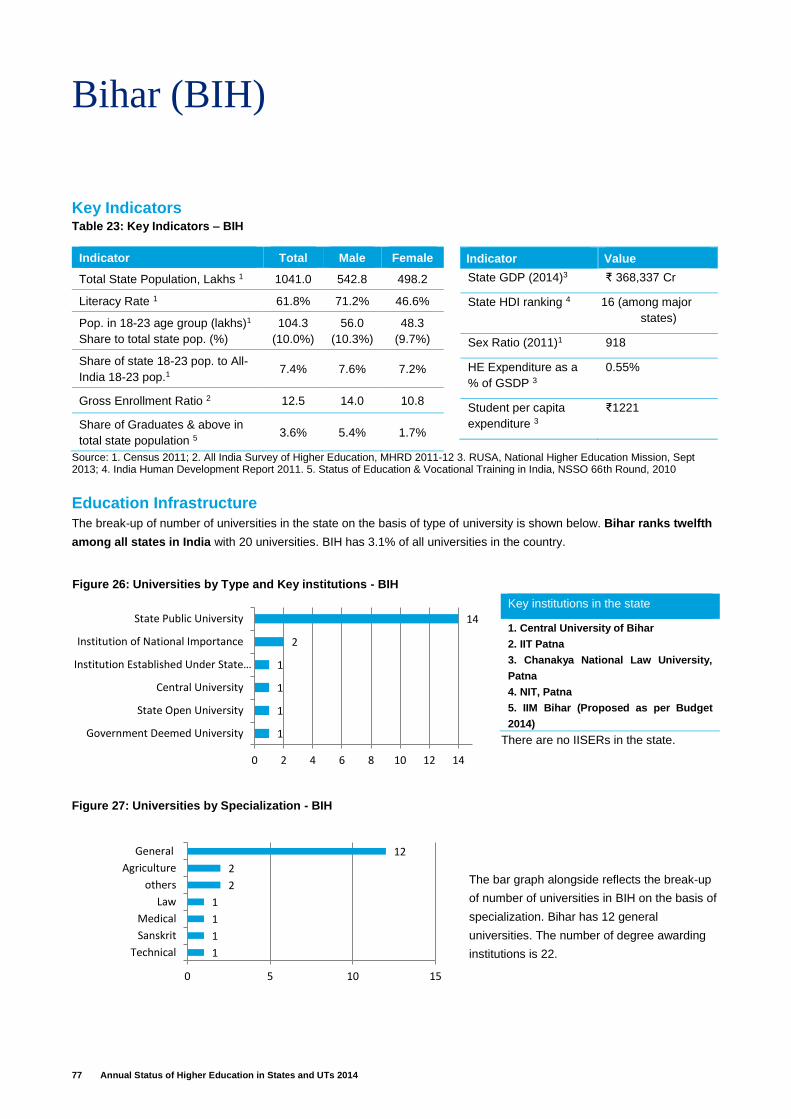
77 Annual Status of Higher Education in States and UTs 2014
Bihar (BIH)
Key Indicators Table 23: Key Indicators – BIH
Indicator Total Male Female
Total State Population, Lakhs 1 1041.0 542.8 498.2
Literacy Rate 1 61.8% 71.2% 46.6%
Pop. in 18-23 age group (lakhs)1
Share to total state pop. (%)
104.3
(10.0%)
56.0
(10.3%)
48.3
(9.7%)
Share of state 18-23 pop. to All-
India 18-23 pop.1 7.4% 7.6% 7.2%
Gross Enrollment Ratio 2 12.5 14.0 10.8
Share of Graduates & above in
total state population 5 3.6% 5.4% 1.7%
Indicator Value
State GDP (2014)3 ₹ 368,337 Cr
State HDI ranking 4 16 (among major
states)
Sex Ratio (2011)1 918
HE Expenditure as a
% of GSDP 3
0.55%
Student per capita
expenditure 3
₹1221
Source: 1. Census 2011; 2. All India Survey of Higher Education, MHRD 2011-12 3. RUSA, National Higher Education Mission, Sept 2013; 4. India Human Development Report 2011. 5. Status of Education & Vocational Training in India, NSSO 66th Round, 2010
Education Infrastructure
The break-up of number of universities in the state on the basis of type of university is shown below. Bihar ranks twelfth
among all states in India with 20 universities. BIH has 3.1% of all universities in the country.
There are no IISERs in the state.
Key institutions in the state
1. Central University of Bihar
2. IIT Patna
3. Chanakya National Law University,
Patna
4. NIT, Patna
5. IIM Bihar (Proposed as per Budget
2014)
The bar graph alongside reflects the break-up
of number of universities in BIH on the basis of
specialization. Bihar has 12 general
universities. The number of degree awarding
institutions is 22.
Figure 26: Universities by Type and Key institutions - BIH
1
1
1
1
2
2
12
0 5 10 15
Technical
Sanskrit
Medical
Law
others
Agriculture
General
Figure 27: Universities by Specialization - BIH
1
1
1
1
2
14
0 2 4 6 8 10 12 14
Government Deemed University
State Open University
Central University
Institution Established Under State…
Institution of National Importance
State Public University
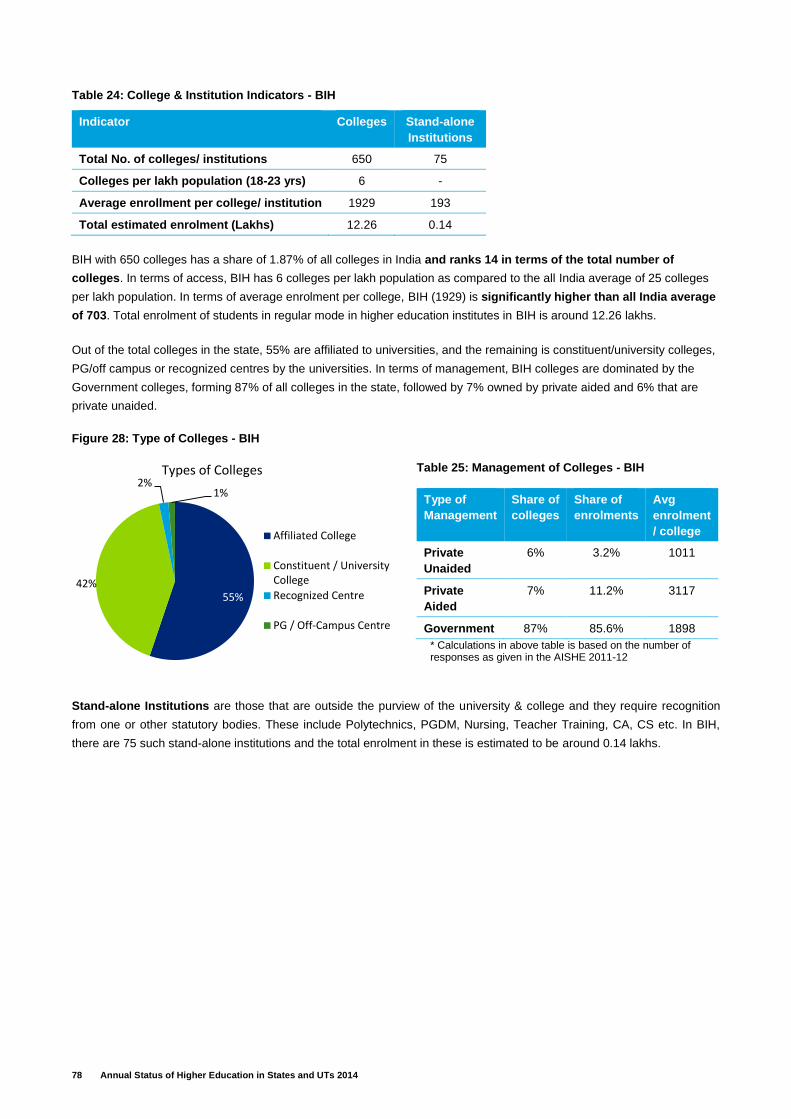
78 Annual Status of Higher Education in States and UTs 2014
Table 24: College & Institution Indicators - BIH
BIH with 650 colleges has a share of 1.87% of all colleges in India and ranks 14 in terms of the total number of
colleges. In terms of access, BIH has 6 colleges per lakh population as compared to the all India average of 25 colleges
per lakh population. In terms of average enrolment per college, BIH (1929) is significantly higher than all India average
of 703. Total enrolment of students in regular mode in higher education institutes in BIH is around 12.26 lakhs.
Out of the total colleges in the state, 55% are affiliated to universities, and the remaining is constituent/university colleges,
PG/off campus or recognized centres by the universities. In terms of management, BIH colleges are dominated by the
Government colleges, forming 87% of all colleges in the state, followed by 7% owned by private aided and 6% that are
private unaided.
Figure 28: Type of Colleges - BIH
Table 25: Management of Colleges - BIH
Type of
Management
Share of
colleges
Share of
enrolments
Avg
enrolment
/ college
Private
Unaided
6% 3.2% 1011
Private
Aided
7% 11.2% 3117
Government 87% 85.6% 1898
* Calculations in above table is based on the number of responses as given in the AISHE 2011-12
Stand-alone Institutions are those that are outside the purview of the university & college and they require recognition
from one or other statutory bodies. These include Polytechnics, PGDM, Nursing, Teacher Training, CA, CS etc. In BIH,
there are 75 such stand-alone institutions and the total enrolment in these is estimated to be around 0.14 lakhs.
Indicator Colleges Stand-alone
Institutions
Total No. of colleges/ institutions 650 75
Colleges per lakh population (18-23 yrs) 6 -
Average enrollment per college/ institution 1929 193
Total estimated enrolment (Lakhs) 12.26 0.14
55%42%
2%1%
Types of Colleges
Affiliated College
Constituent / UniversityCollege
Recognized Centre
PG / Off-Campus Centre
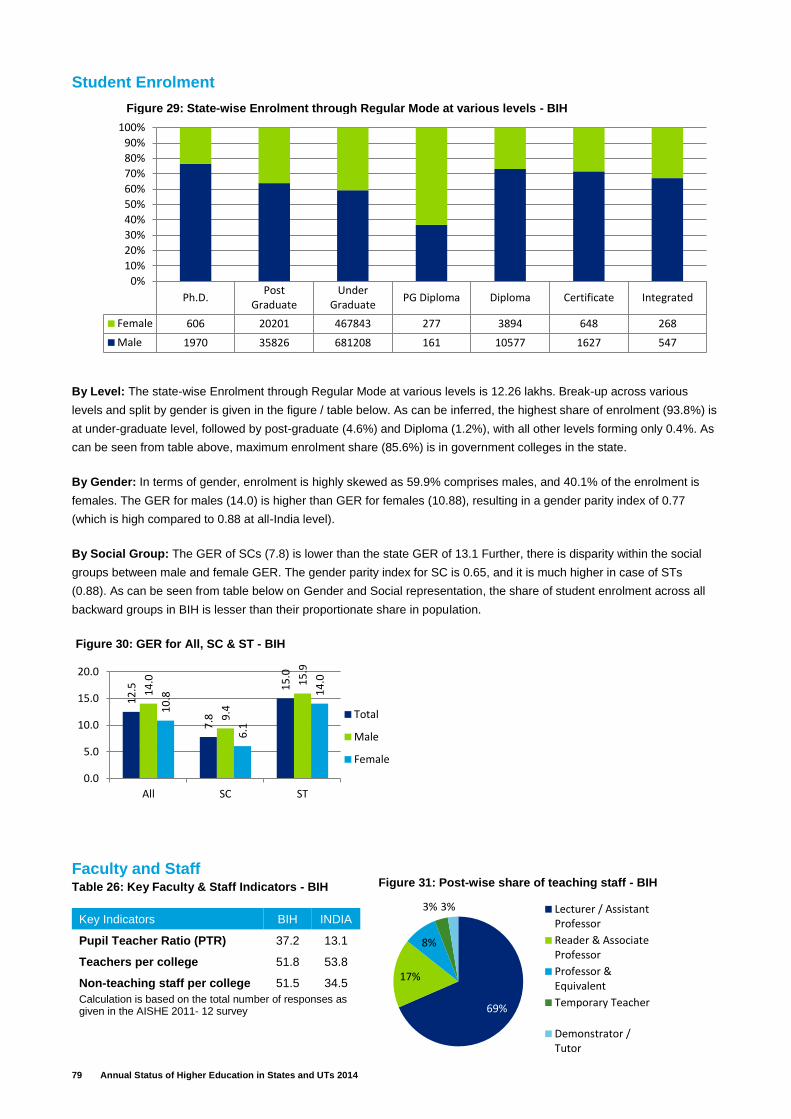
79 Annual Status of Higher Education in States and UTs 2014
Student Enrolment
By Level: The state-wise Enrolment through Regular Mode at various levels is 12.26 lakhs. Break-up across various
levels and split by gender is given in the figure / table below. As can be inferred, the highest share of enrolment (93.8%) is
at under-graduate level, followed by post-graduate (4.6%) and Diploma (1.2%), with all other levels forming only 0.4%. As
can be seen from table above, maximum enrolment share (85.6%) is in government colleges in the state.
By Gender: In terms of gender, enrolment is highly skewed as 59.9% comprises males, and 40.1% of the enrolment is
females. The GER for males (14.0) is higher than GER for females (10.88), resulting in a gender parity index of 0.77
(which is high compared to 0.88 at all-India level).
By Social Group: The GER of SCs (7.8) is lower than the state GER of 13.1 Further, there is disparity within the social
groups between male and female GER. The gender parity index for SC is 0.65, and it is much higher in case of STs
(0.88). As can be seen from table below on Gender and Social representation, the share of student enrolment across all
backward groups in BIH is lesser than their proportionate share in population.
Faculty and Staff Table 26: Key Faculty & Staff Indicators - BIH
Key Indicators BIH INDIA
Pupil Teacher Ratio (PTR) 37.2 13.1
Teachers per college 51.8 53.8
Non-teaching staff per college 51.5 34.5
Calculation is based on the total number of responses as given in the AISHE 2011- 12 survey
Ph.D.Post
GraduateUnder
GraduatePG Diploma Diploma Certificate Integrated
Female 606 20201 467843 277 3894 648 268
Male 1970 35826 681208 161 10577 1627 547
0%
10%
20%
30%
40%
50%
60%
70%
80%
90%
100%
Figure 29: State‐wise Enrolment through Regular Mode at various levels - BIH
12
.5
7.8
15
.0
14
.0
9.4
15
.9
10
.8
6.1
14
.0
0.0
5.0
10.0
15.0
20.0
All SC ST
Total
Male
Female
Figure 30: GER for All, SC & ST - BIH
69%
17%
8%
3% 3% Lecturer / AssistantProfessor
Reader & AssociateProfessor
Professor &Equivalent
Temporary Teacher
Demonstrator /Tutor
Figure 31: Post-wise share of teaching staff - BIH
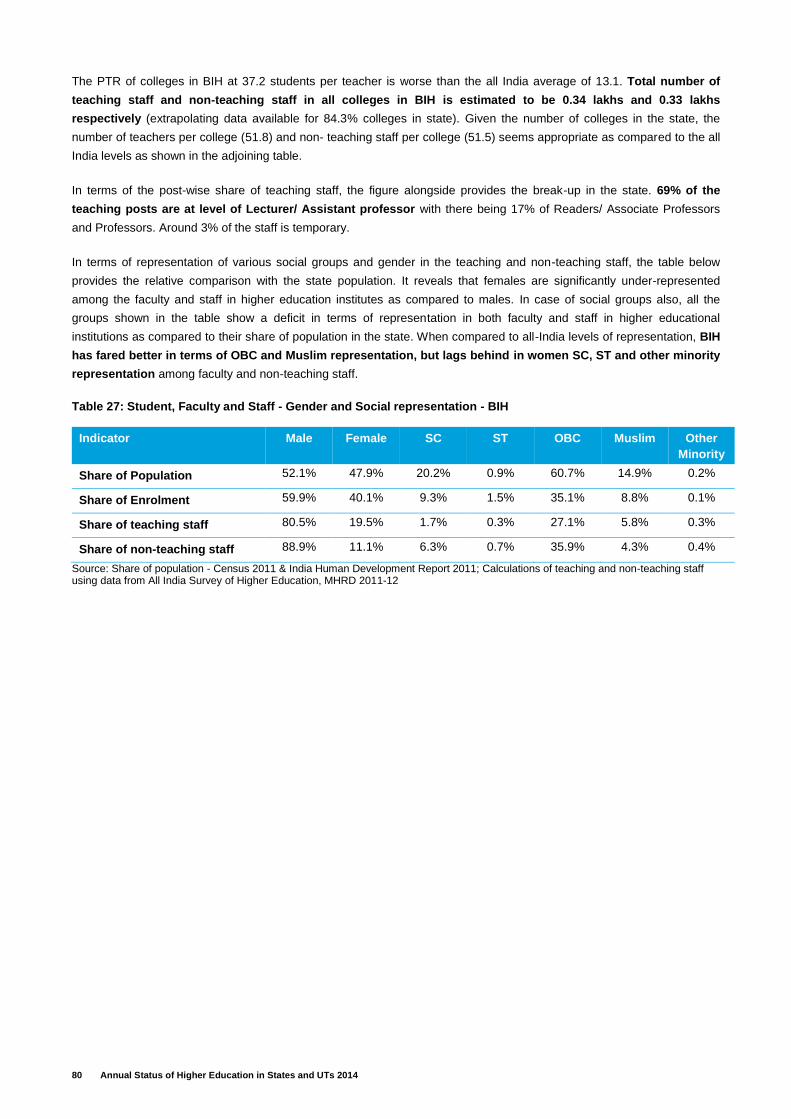
80 Annual Status of Higher Education in States and UTs 2014
The PTR of colleges in BIH at 37.2 students per teacher is worse than the all India average of 13.1. Total number of
teaching staff and non-teaching staff in all colleges in BIH is estimated to be 0.34 lakhs and 0.33 lakhs
respectively (extrapolating data available for 84.3% colleges in state). Given the number of colleges in the state, the
number of teachers per college (51.8) and non- teaching staff per college (51.5) seems appropriate as compared to the all
India levels as shown in the adjoining table.
In terms of the post-wise share of teaching staff, the figure alongside provides the break-up in the state. 69% of the
teaching posts are at level of Lecturer/ Assistant professor with there being 17% of Readers/ Associate Professors
and Professors. Around 3% of the staff is temporary.
In terms of representation of various social groups and gender in the teaching and non-teaching staff, the table below
provides the relative comparison with the state population. It reveals that females are significantly under-represented
among the faculty and staff in higher education institutes as compared to males. In case of social groups also, all the
groups shown in the table show a deficit in terms of representation in both faculty and staff in higher educational
institutions as compared to their share of population in the state. When compared to all-India levels of representation, BIH
has fared better in terms of OBC and Muslim representation, but lags behind in women SC, ST and other minority
representation among faculty and non-teaching staff.
Table 27: Student, Faculty and Staff - Gender and Social representation - BIH
Indicator Male Female SC ST OBC Muslim Other
Minority
Share of Population 52.1% 47.9% 20.2% 0.9% 60.7% 14.9% 0.2%
Share of Enrolment 59.9% 40.1% 9.3% 1.5% 35.1% 8.8% 0.1%
Share of teaching staff 80.5% 19.5% 1.7% 0.3% 27.1% 5.8% 0.3%
Share of non-teaching staff 88.9% 11.1% 6.3% 0.7% 35.9% 4.3% 0.4%
Source: Share of population - Census 2011 & India Human Development Report 2011; Calculations of teaching and non-teaching staff using data from All India Survey of Higher Education, MHRD 2011-12
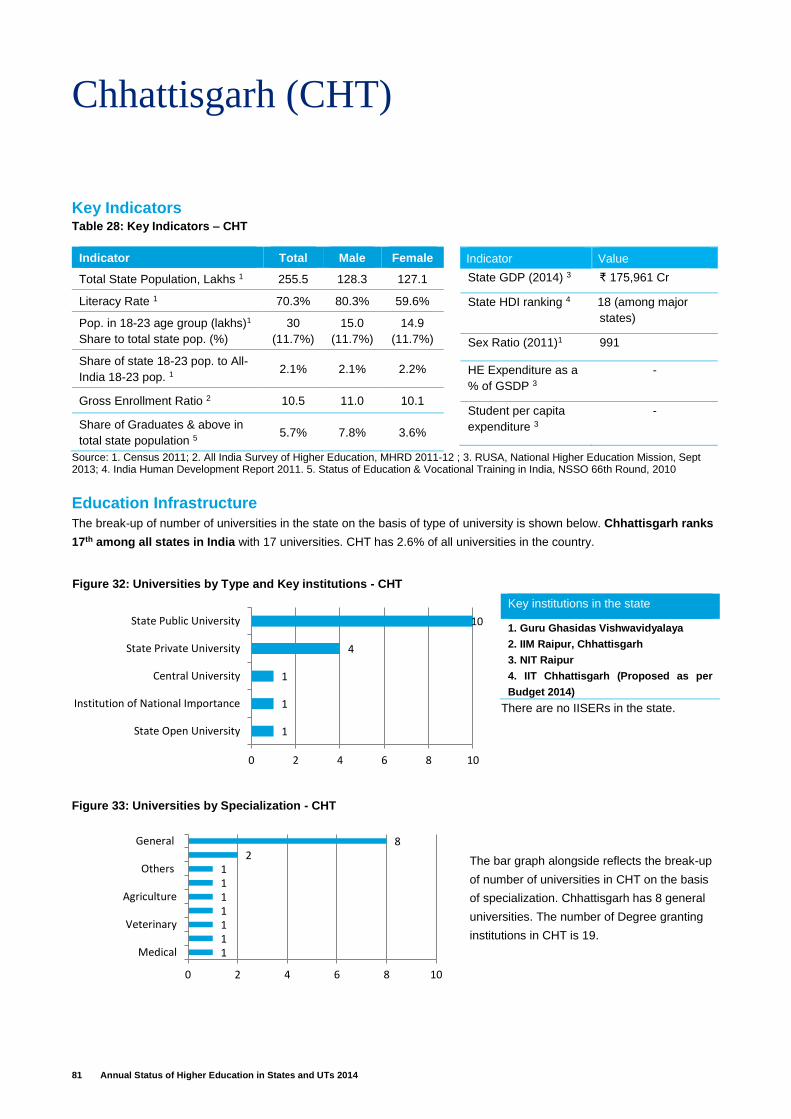
81 Annual Status of Higher Education in States and UTs 2014
Chhattisgarh (CHT)
Key Indicators Table 28: Key Indicators – CHT
Indicator Total Male Female
Total State Population, Lakhs 1 255.5 128.3 127.1
Literacy Rate 1 70.3% 80.3% 59.6%
Pop. in 18-23 age group (lakhs)1
Share to total state pop. (%)
30
(11.7%)
15.0
(11.7%)
14.9
(11.7%)
Share of state 18-23 pop. to All-
India 18-23 pop. 1 2.1% 2.1% 2.2%
Gross Enrollment Ratio 2 10.5 11.0 10.1
Share of Graduates & above in
total state population 5 5.7% 7.8% 3.6%
Indicator Value
State GDP (2014) 3 ₹ 175,961 Cr
State HDI ranking 4 18 (1 18 (among major
states)
Sex Ratio (2011)1 991
HE Expenditure as a
% of GSDP 3
-
Student per capita
expenditure 3
-
Source: 1. Census 2011; 2. All India Survey of Higher Education, MHRD 2011-12 ; 3. RUSA, National Higher Education Mission, Sept 2013; 4. India Human Development Report 2011. 5. Status of Education & Vocational Training in India, NSSO 66th Round, 2010
Education Infrastructure
The break-up of number of universities in the state on the basis of type of university is shown below. Chhattisgarh ranks
17th among all states in India with 17 universities. CHT has 2.6% of all universities in the country.
There are no IISERs in the state.
Key institutions in the state
1. Guru Ghasidas Vishwavidyalaya
2. IIM Raipur, Chhattisgarh
3. NIT Raipur
4. IIT Chhattisgarh (Proposed as per
Budget 2014)
The bar graph alongside reflects the break-up
of number of universities in CHT on the basis
of specialization. Chhattisgarh has 8 general
universities. The number of Degree granting
institutions in CHT is 19.
Figure 32: Universities by Type and Key institutions - CHT
1111111
28
0 2 4 6 8 10
Medical
Veterinary
Agriculture
Others
General
Figure 33: Universities by Specialization - CHT
1
1
1
4
10
0 2 4 6 8 10
State Open University
Institution of National Importance
Central University
State Private University
State Public University
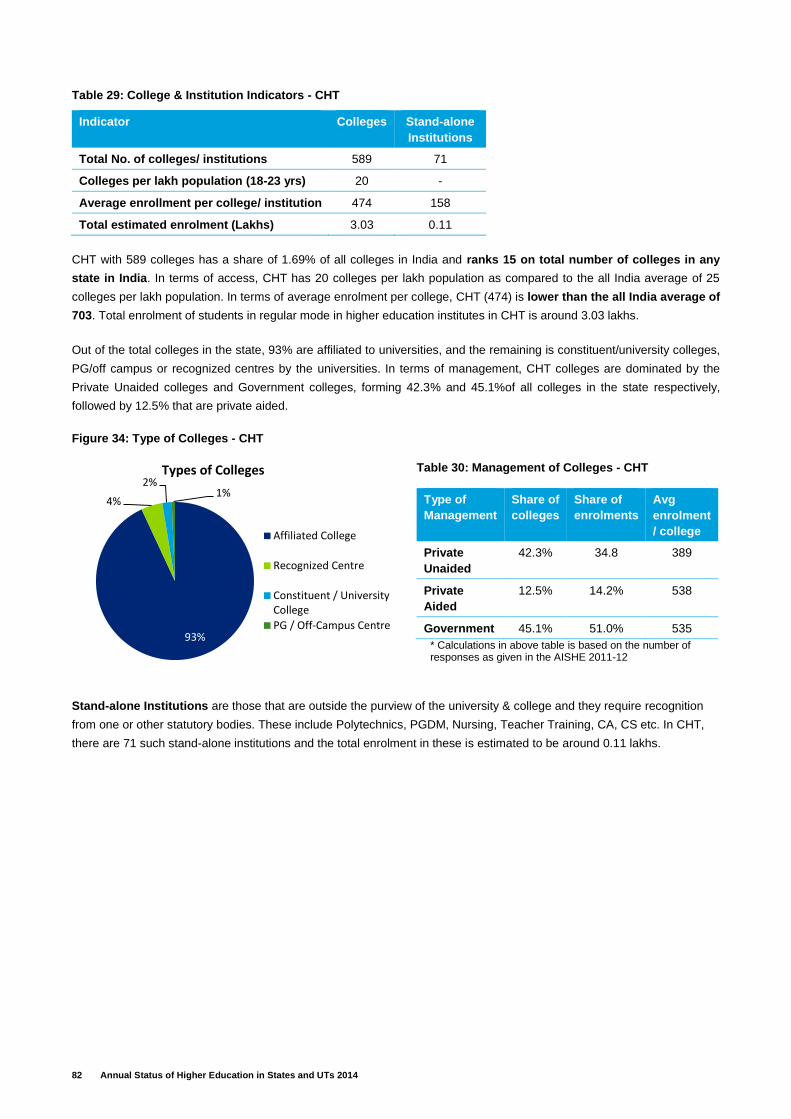
82 Annual Status of Higher Education in States and UTs 2014
Table 29: College & Institution Indicators - CHT
CHT with 589 colleges has a share of 1.69% of all colleges in India and ranks 15 on total number of colleges in any
state in India. In terms of access, CHT has 20 colleges per lakh population as compared to the all India average of 25
colleges per lakh population. In terms of average enrolment per college, CHT (474) is lower than the all India average of
703. Total enrolment of students in regular mode in higher education institutes in CHT is around 3.03 lakhs.
Out of the total colleges in the state, 93% are affiliated to universities, and the remaining is constituent/university colleges,
PG/off campus or recognized centres by the universities. In terms of management, CHT colleges are dominated by the
Private Unaided colleges and Government colleges, forming 42.3% and 45.1%of all colleges in the state respectively,
followed by 12.5% that are private aided.
Figure 34: Type of Colleges - CHT
Table 30: Management of Colleges - CHT
Type of
Management
Share of
colleges
Share of
enrolments
Avg
enrolment
/ college
Private
Unaided
42.3% 34.8 389
Private
Aided
12.5% 14.2% 538
Government 45.1% 51.0% 535
* Calculations in above table is based on the number of responses as given in the AISHE 2011-12
Stand-alone Institutions are those that are outside the purview of the university & college and they require recognition
from one or other statutory bodies. These include Polytechnics, PGDM, Nursing, Teacher Training, CA, CS etc. In CHT,
there are 71 such stand-alone institutions and the total enrolment in these is estimated to be around 0.11 lakhs.
Indicator Colleges Stand-alone
Institutions
Total No. of colleges/ institutions 589 71
Colleges per lakh population (18-23 yrs) 20 -
Average enrollment per college/ institution 474 158
Total estimated enrolment (Lakhs) 3.03 0.11
93%
4%
2%1%
Types of Colleges
Affiliated College
Recognized Centre
Constituent / UniversityCollege
PG / Off-Campus Centre
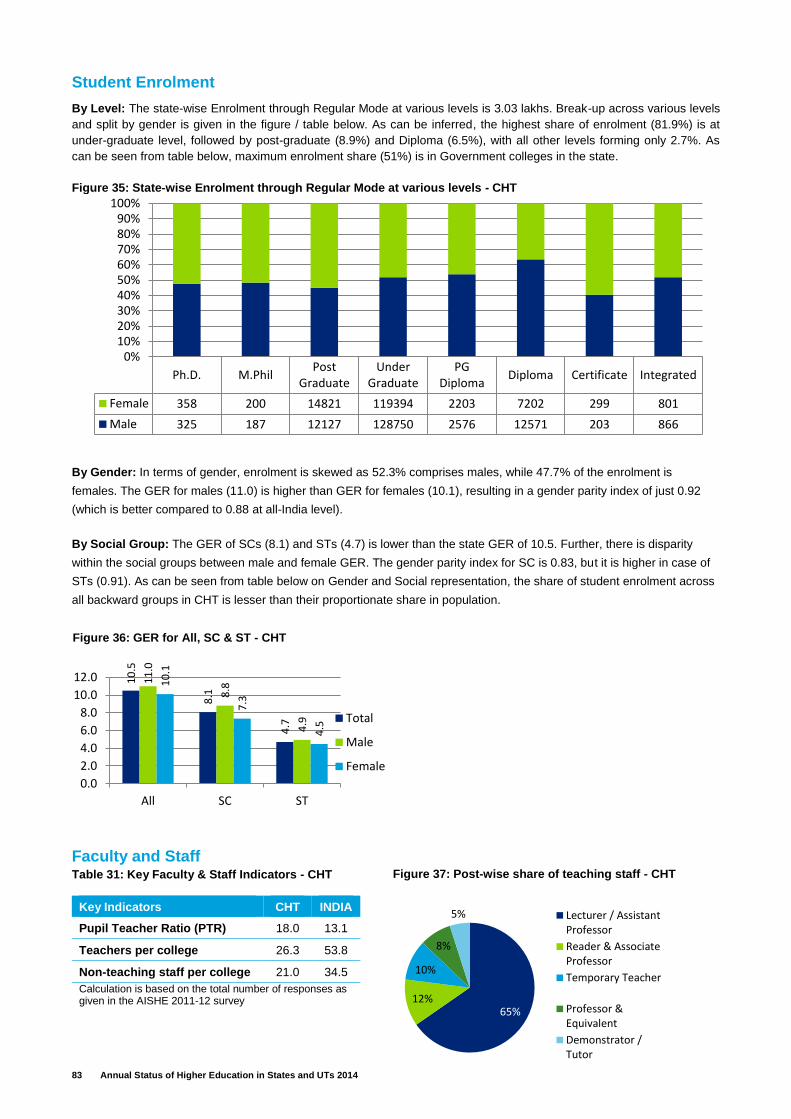
83 Annual Status of Higher Education in States and UTs 2014
Student Enrolment
By Level: The state-wise Enrolment through Regular Mode at various levels is 3.03 lakhs. Break-up across various levels
and split by gender is given in the figure / table below. As can be inferred, the highest share of enrolment (81.9%) is at
under-graduate level, followed by post-graduate (8.9%) and Diploma (6.5%), with all other levels forming only 2.7%. As
can be seen from table below, maximum enrolment share (51%) is in Government colleges in the state.
By Gender: In terms of gender, enrolment is skewed as 52.3% comprises males, while 47.7% of the enrolment is
females. The GER for males (11.0) is higher than GER for females (10.1), resulting in a gender parity index of just 0.92
(which is better compared to 0.88 at all-India level).
By Social Group: The GER of SCs (8.1) and STs (4.7) is lower than the state GER of 10.5. Further, there is disparity
within the social groups between male and female GER. The gender parity index for SC is 0.83, but it is higher in case of
STs (0.91). As can be seen from table below on Gender and Social representation, the share of student enrolment across
all backward groups in CHT is lesser than their proportionate share in population.
Faculty and Staff Table 31: Key Faculty & Staff Indicators - CHT
Key Indicators CHT INDIA
Pupil Teacher Ratio (PTR) 18.0 13.1
Teachers per college 26.3 53.8
Non-teaching staff per college 21.0 34.5
Calculation is based on the total number of responses as given in the AISHE 2011-12 survey
Ph.D. M.PhilPost
GraduateUnder
GraduatePG
DiplomaDiploma Certificate Integrated
Female 358 200 14821 119394 2203 7202 299 801
Male 325 187 12127 128750 2576 12571 203 866
0%10%20%30%40%50%60%70%80%90%
100%Figure 35: State‐wise Enrolment through Regular Mode at various levels - CHT
65%12%
10%
8%
5% Lecturer / AssistantProfessor
Reader & AssociateProfessor
Temporary Teacher
Professor &Equivalent
Demonstrator /Tutor
Figure 37: Post-wise share of teaching staff - CHT
10
.5
8.1
4.7
11
.0
8.8
4.9
10
.1
7.3
4.5
0.0
2.0
4.0
6.0
8.0
10.0
12.0
All SC ST
Total
Male
Female
Figure 36: GER for All, SC & ST - CHT
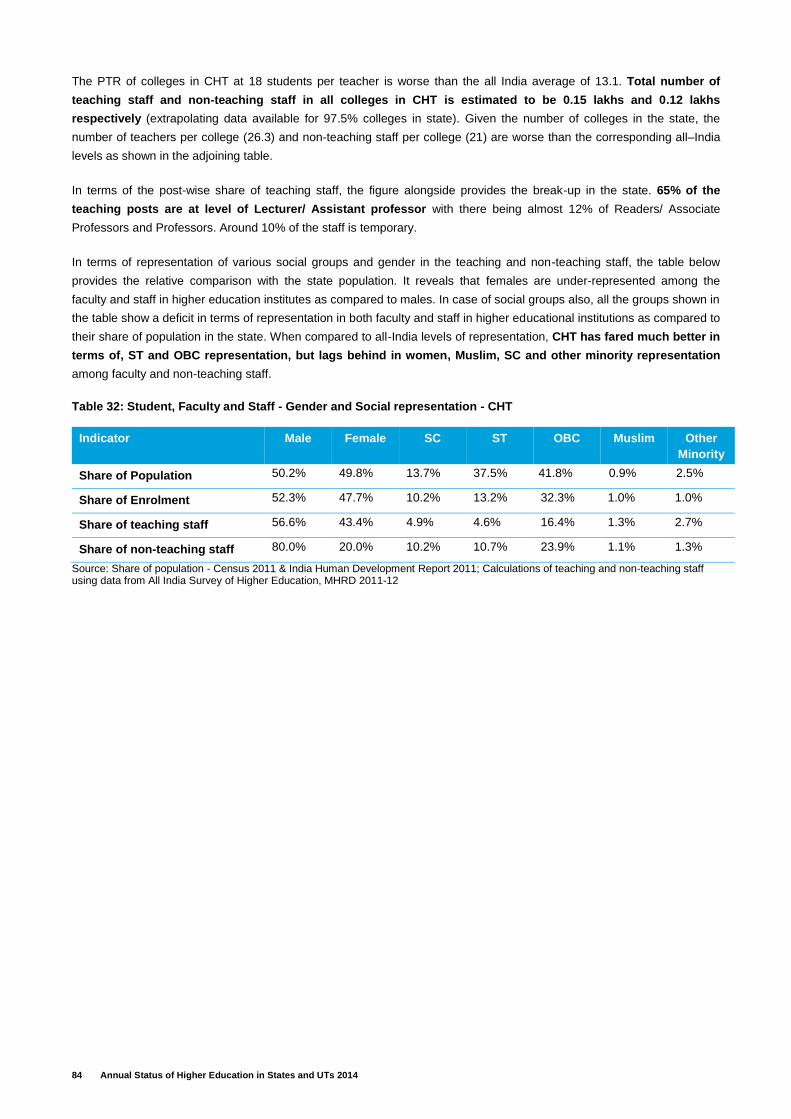
84 Annual Status of Higher Education in States and UTs 2014
The PTR of colleges in CHT at 18 students per teacher is worse than the all India average of 13.1. Total number of
teaching staff and non-teaching staff in all colleges in CHT is estimated to be 0.15 lakhs and 0.12 lakhs
respectively (extrapolating data available for 97.5% colleges in state). Given the number of colleges in the state, the
number of teachers per college (26.3) and non-teaching staff per college (21) are worse than the corresponding all–India
levels as shown in the adjoining table.
In terms of the post-wise share of teaching staff, the figure alongside provides the break-up in the state. 65% of the
teaching posts are at level of Lecturer/ Assistant professor with there being almost 12% of Readers/ Associate
Professors and Professors. Around 10% of the staff is temporary.
In terms of representation of various social groups and gender in the teaching and non-teaching staff, the table below
provides the relative comparison with the state population. It reveals that females are under-represented among the
faculty and staff in higher education institutes as compared to males. In case of social groups also, all the groups shown in
the table show a deficit in terms of representation in both faculty and staff in higher educational institutions as compared to
their share of population in the state. When compared to all-India levels of representation, CHT has fared much better in
terms of, ST and OBC representation, but lags behind in women, Muslim, SC and other minority representation
among faculty and non-teaching staff.
Table 32: Student, Faculty and Staff - Gender and Social representation - CHT
Indicator Male Female SC ST OBC Muslim Other
Minority
Share of Population 50.2% 49.8% 13.7% 37.5% 41.8% 0.9% 2.5%
Share of Enrolment 52.3% 47.7% 10.2% 13.2% 32.3% 1.0% 1.0%
Share of teaching staff 56.6% 43.4% 4.9% 4.6% 16.4% 1.3% 2.7%
Share of non-teaching staff 80.0% 20.0% 10.2% 10.7% 23.9% 1.1% 1.3%
Source: Share of population - Census 2011 & India Human Development Report 2011; Calculations of teaching and non-teaching staff using data from All India Survey of Higher Education, MHRD 2011-12
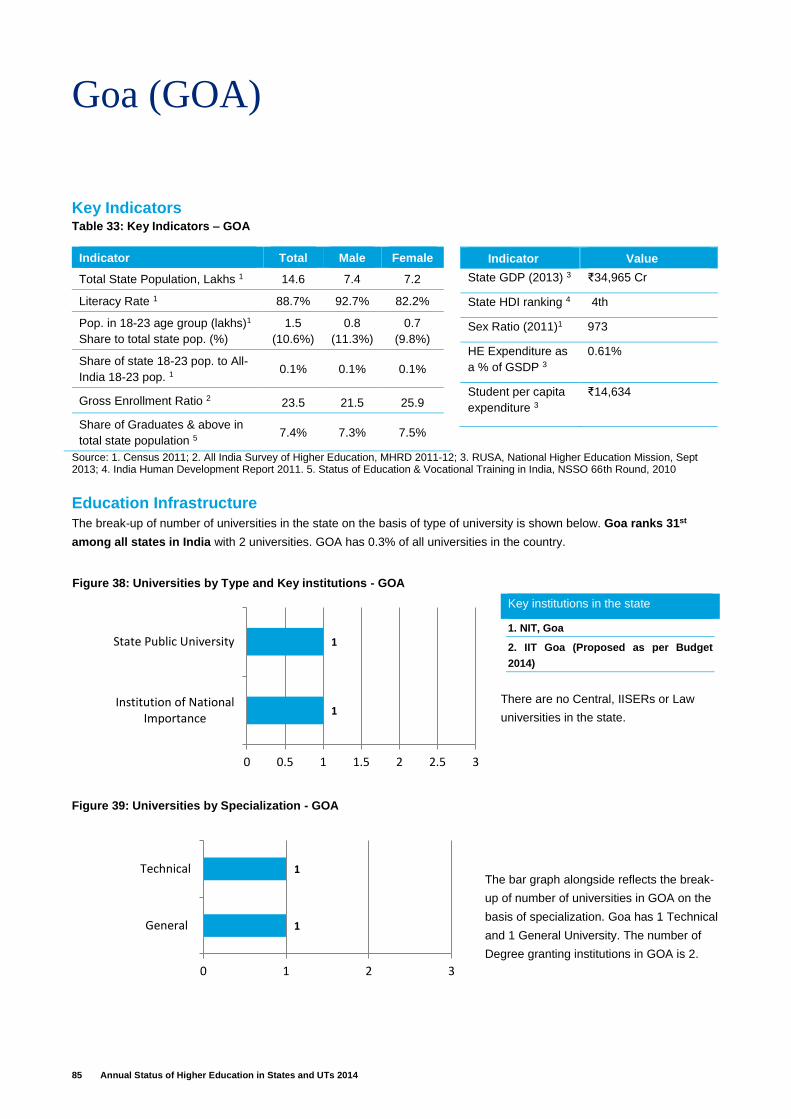
85 Annual Status of Higher Education in States and UTs 2014
Goa (GOA)
Key Indicators Table 33: Key Indicators – GOA
Indicator Total Male Female
Total State Population, Lakhs 1 14.6 7.4 7.2
Literacy Rate 1 88.7% 92.7% 82.2%
Pop. in 18-23 age group (lakhs)1
Share to total state pop. (%)
1.5
(10.6%)
0.8
(11.3%)
0.7
(9.8%)
Share of state 18-23 pop. to All-
India 18-23 pop. 1 0.1% 0.1% 0.1%
Gross Enrollment Ratio 2 23.5 21.5 25.9
Share of Graduates & above in
total state population 5 7.4% 7.3% 7.5%
Indicator Value
State GDP (2013) 3 ₹34,965 Cr
State HDI ranking 4 4th
Sex Ratio (2011)1 973
HE Expenditure as
a % of GSDP 3
0.61%
Student per capita
expenditure 3
₹14,634
Source: 1. Census 2011; 2. All India Survey of Higher Education, MHRD 2011-12; 3. RUSA, National Higher Education Mission, Sept 2013; 4. India Human Development Report 2011. 5. Status of Education & Vocational Training in India, NSSO 66th Round, 2010
Education Infrastructure
The break-up of number of universities in the state on the basis of type of university is shown below. Goa ranks 31st
among all states in India with 2 universities. GOA has 0.3% of all universities in the country.
There are no Central, IISERs or Law
universities in the state.
Key institutions in the state
1. NIT, Goa
2. IIT Goa (Proposed as per Budget
2014)
The bar graph alongside reflects the break-
up of number of universities in GOA on the
basis of specialization. Goa has 1 Technical
and 1 General University. The number of
Degree granting institutions in GOA is 2.
Figure 38: Universities by Type and Key institutions - GOA
Figure 39: Universities by Specialization - GOA
1
1
0 0.5 1 1.5 2 2.5 3
Institution of NationalImportance
State Public University
1
1
0 1 2 3
General
Technical
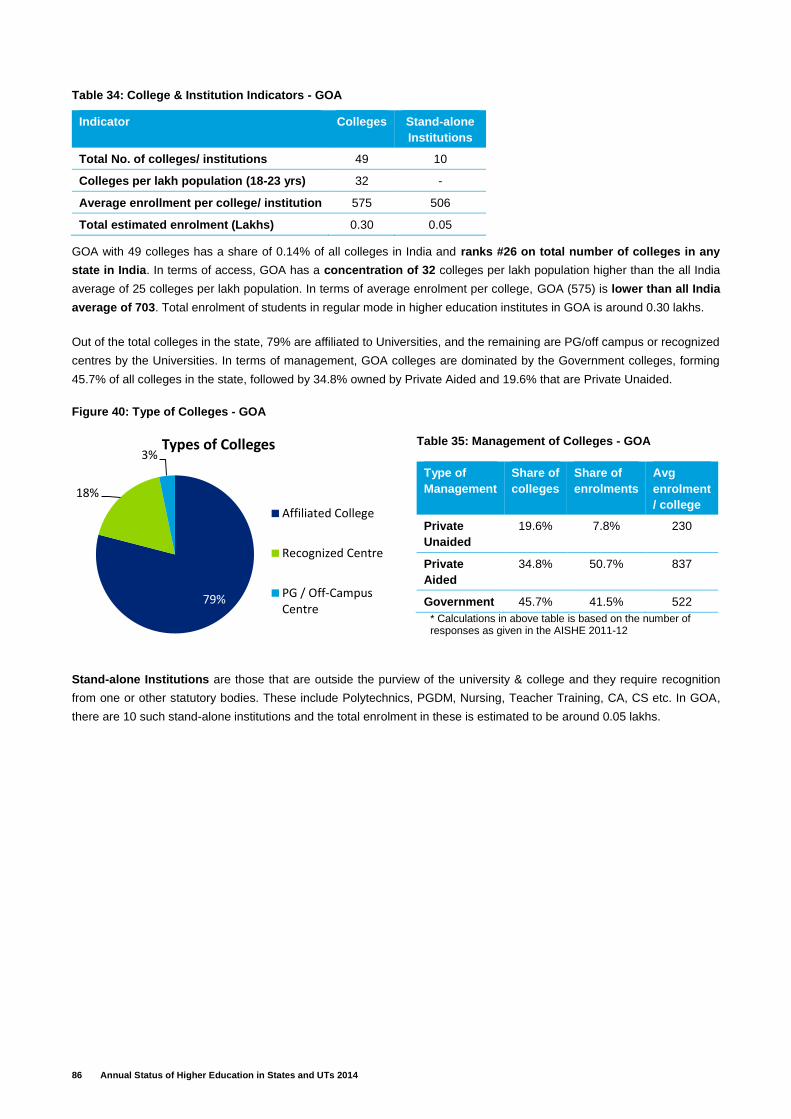
86 Annual Status of Higher Education in States and UTs 2014
Table 34: College & Institution Indicators - GOA
GOA with 49 colleges has a share of 0.14% of all colleges in India and ranks #26 on total number of colleges in any
state in India. In terms of access, GOA has a concentration of 32 colleges per lakh population higher than the all India
average of 25 colleges per lakh population. In terms of average enrolment per college, GOA (575) is lower than all India
average of 703. Total enrolment of students in regular mode in higher education institutes in GOA is around 0.30 lakhs.
Out of the total colleges in the state, 79% are affiliated to Universities, and the remaining are PG/off campus or recognized
centres by the Universities. In terms of management, GOA colleges are dominated by the Government colleges, forming
45.7% of all colleges in the state, followed by 34.8% owned by Private Aided and 19.6% that are Private Unaided.
Figure 40: Type of Colleges - GOA
Table 35: Management of Colleges - GOA
Type of
Management
Share of
colleges
Share of
enrolments
Avg
enrolment
/ college
Private
Unaided
19.6% 7.8% 230
Private
Aided
34.8% 50.7% 837
Government 45.7% 41.5% 522
* Calculations in above table is based on the number of responses as given in the AISHE 2011-12
Stand-alone Institutions are those that are outside the purview of the university & college and they require recognition
from one or other statutory bodies. These include Polytechnics, PGDM, Nursing, Teacher Training, CA, CS etc. In GOA,
there are 10 such stand-alone institutions and the total enrolment in these is estimated to be around 0.05 lakhs.
Indicator Colleges Stand-alone
Institutions
Total No. of colleges/ institutions 49 10
Colleges per lakh population (18-23 yrs) 32 -
Average enrollment per college/ institution 575 506
Total estimated enrolment (Lakhs) 0.30 0.05
79%
18%
3%Types of Colleges
Affiliated College
Recognized Centre
PG / Off-CampusCentre
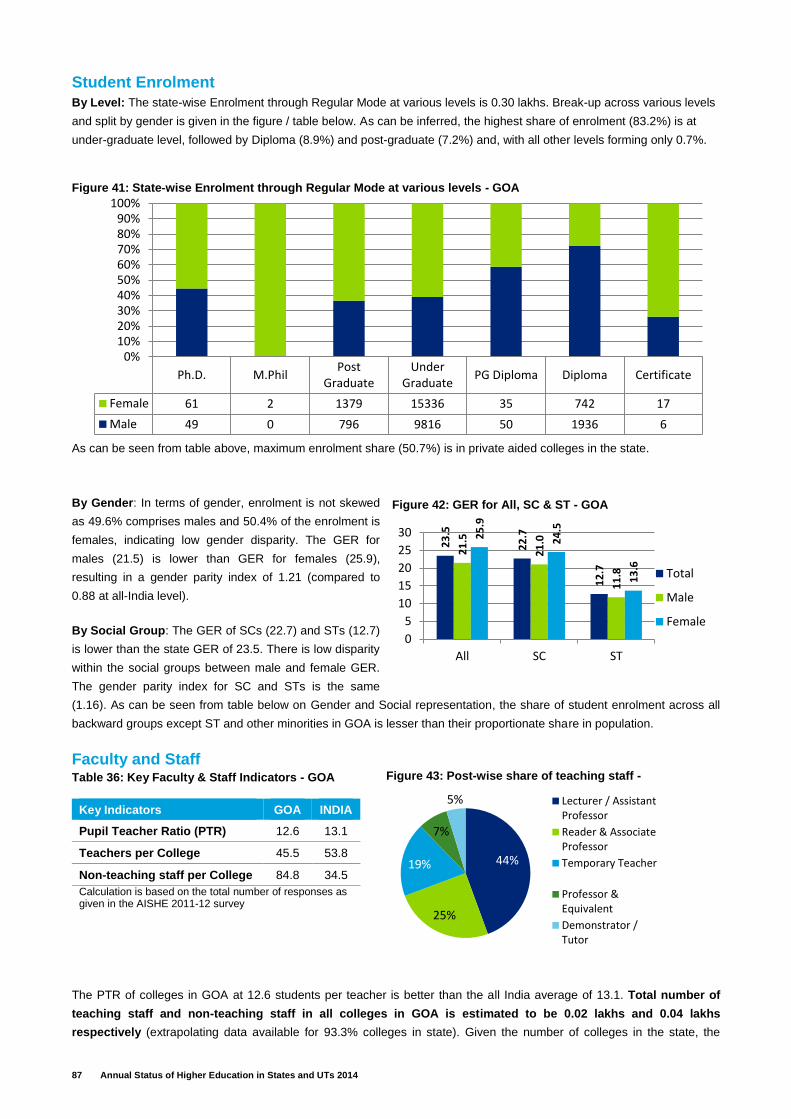
87 Annual Status of Higher Education in States and UTs 2014
Student Enrolment
By Level: The state-wise Enrolment through Regular Mode at various levels is 0.30 lakhs. Break-up across various levels
and split by gender is given in the figure / table below. As can be inferred, the highest share of enrolment (83.2%) is at
under-graduate level, followed by Diploma (8.9%) and post-graduate (7.2%) and, with all other levels forming only 0.7%.
As can be seen from table above, maximum enrolment share (50.7%) is in private aided colleges in the state.
By Gender: In terms of gender, enrolment is not skewed
as 49.6% comprises males and 50.4% of the enrolment is
females, indicating low gender disparity. The GER for
males (21.5) is lower than GER for females (25.9),
resulting in a gender parity index of 1.21 (compared to
0.88 at all-India level).
By Social Group: The GER of SCs (22.7) and STs (12.7)
is lower than the state GER of 23.5. There is low disparity
within the social groups between male and female GER.
The gender parity index for SC and STs is the same
(1.16). As can be seen from table below on Gender and Social representation, the share of student enrolment across all
backward groups except ST and other minorities in GOA is lesser than their proportionate share in population.
Faculty and Staff Table 36: Key Faculty & Staff Indicators - GOA
The PTR of colleges in GOA at 12.6 students per teacher is better than the all India average of 13.1. Total number of
teaching staff and non-teaching staff in all colleges in GOA is estimated to be 0.02 lakhs and 0.04 lakhs
respectively (extrapolating data available for 93.3% colleges in state). Given the number of colleges in the state, the
Key Indicators GOA INDIA
Pupil Teacher Ratio (PTR) 12.6 13.1
Teachers per College 45.5 53.8
Non-teaching staff per College 84.8 34.5
Calculation is based on the total number of responses as given in the AISHE 2011-12 survey
Ph.D. M.PhilPost
GraduateUnder
GraduatePG Diploma Diploma Certificate
Female 61 2 1379 15336 35 742 17
Male 49 0 796 9816 50 1936 6
0%10%20%30%40%50%60%70%80%90%
100%Figure 41: State‐wise Enrolment through Regular Mode at various levels - GOA
23
.5
22
.7
12
.7
21
.5
21
.0
11
.8
25
.9
24
.5
13
.60
5
10
15
20
25
30
All SC ST
Total
Male
Female
Figure 42: GER for All, SC & ST - GOA
44%
25%
19%
7%
5% Lecturer / AssistantProfessor
Reader & AssociateProfessor
Temporary Teacher
Professor &Equivalent
Demonstrator /Tutor
Figure 43: Post-wise share of teaching staff -
GOA
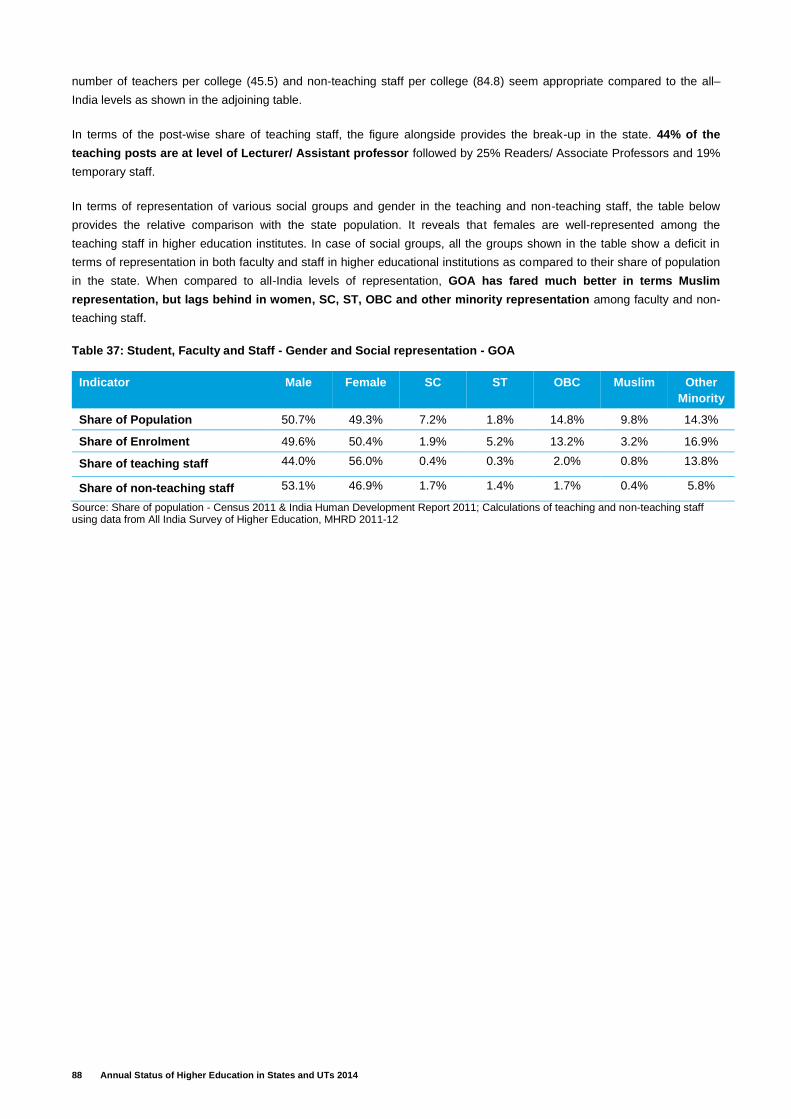
88 Annual Status of Higher Education in States and UTs 2014
number of teachers per college (45.5) and non-teaching staff per college (84.8) seem appropriate compared to the all–
India levels as shown in the adjoining table.
In terms of the post-wise share of teaching staff, the figure alongside provides the break-up in the state. 44% of the
teaching posts are at level of Lecturer/ Assistant professor followed by 25% Readers/ Associate Professors and 19%
temporary staff.
In terms of representation of various social groups and gender in the teaching and non-teaching staff, the table below
provides the relative comparison with the state population. It reveals that females are well-represented among the
teaching staff in higher education institutes. In case of social groups, all the groups shown in the table show a deficit in
terms of representation in both faculty and staff in higher educational institutions as compared to their share of population
in the state. When compared to all-India levels of representation, GOA has fared much better in terms Muslim
representation, but lags behind in women, SC, ST, OBC and other minority representation among faculty and non-
teaching staff.
Table 37: Student, Faculty and Staff - Gender and Social representation - GOA
Indicator Male Female SC ST OBC Muslim Other
Minority
Share of Population 50.7% 49.3% 7.2% 1.8% 14.8% 9.8% 14.3%
Share of Enrolment 49.6% 50.4% 1.9% 5.2% 13.2% 3.2% 16.9%
Share of teaching staff 44.0% 56.0% 0.4% 0.3% 2.0% 0.8% 13.8%
Share of non-teaching staff 53.1% 46.9% 1.7% 1.4% 1.7% 0.4% 5.8%
Source: Share of population - Census 2011 & India Human Development Report 2011; Calculations of teaching and non-teaching staff using data from All India Survey of Higher Education, MHRD 2011-12
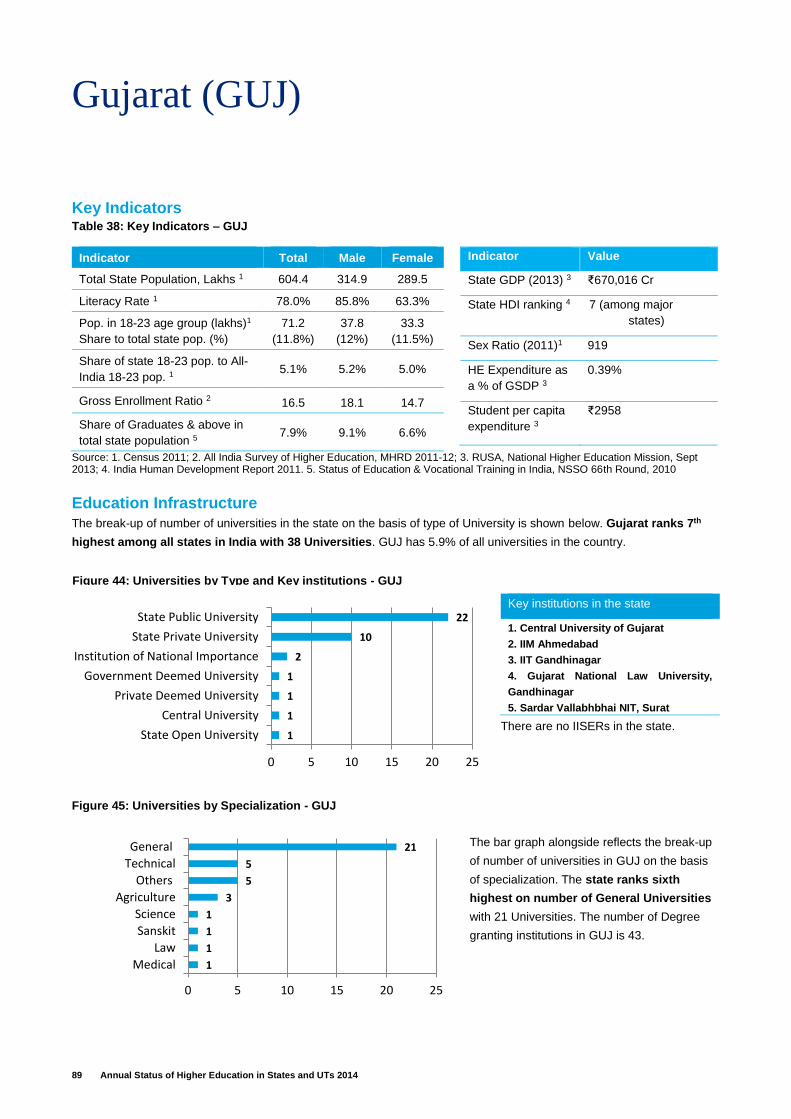
89 Annual Status of Higher Education in States and UTs 2014
Gujarat (GUJ)
Key Indicators Table 38: Key Indicators – GUJ
Indicator Total Male Female
Total State Population, Lakhs 1 604.4 314.9 289.5
Literacy Rate 1 78.0% 85.8% 63.3%
Pop. in 18-23 age group (lakhs)1
Share to total state pop. (%)
71.2
(11.8%)
37.8
(12%)
33.3
(11.5%)
Share of state 18-23 pop. to All-
India 18-23 pop. 1 5.1% 5.2% 5.0%
Gross Enrollment Ratio 2 16.5 18.1 14.7
Share of Graduates & above in
total state population 5 7.9% 9.1% 6.6%
Indicator Value
State GDP (2013) 3 ₹670,016 Cr
State HDI ranking 4 7 (among major
states)
Sex Ratio (2011)1 919
HE Expenditure as
a % of GSDP 3
0.39%
Student per capita
expenditure 3
₹2958
Source: 1. Census 2011; 2. All India Survey of Higher Education, MHRD 2011-12; 3. RUSA, National Higher Education Mission, Sept 2013; 4. India Human Development Report 2011. 5. Status of Education & Vocational Training in India, NSSO 66th Round, 2010
Education Infrastructure
The break-up of number of universities in the state on the basis of type of University is shown below. Gujarat ranks 7th
highest among all states in India with 38 Universities. GUJ has 5.9% of all universities in the country.
There are no IISERs in the state.
Key institutions in the state
1. Central University of Gujarat
2. IIM Ahmedabad
3. IIT Gandhinagar
4. Gujarat National Law University,
Gandhinagar
5. Sardar Vallabhbhai NIT, Surat
The bar graph alongside reflects the break-up
of number of universities in GUJ on the basis
of specialization. The state ranks sixth
highest on number of General Universities
with 21 Universities. The number of Degree
granting institutions in GUJ is 43.
Figure 44: Universities by Type and Key institutions - GUJ
1
1
1
1
3
5
5
21
0 5 10 15 20 25
Medical
Law
Sanskit
Science
Agriculture
Others
Technical
General
Figure 45: Universities by Specialization - GUJ
1
1
1
1
2
10
22
0 5 10 15 20 25
State Open University
Central University
Private Deemed University
Government Deemed University
Institution of National Importance
State Private University
State Public University
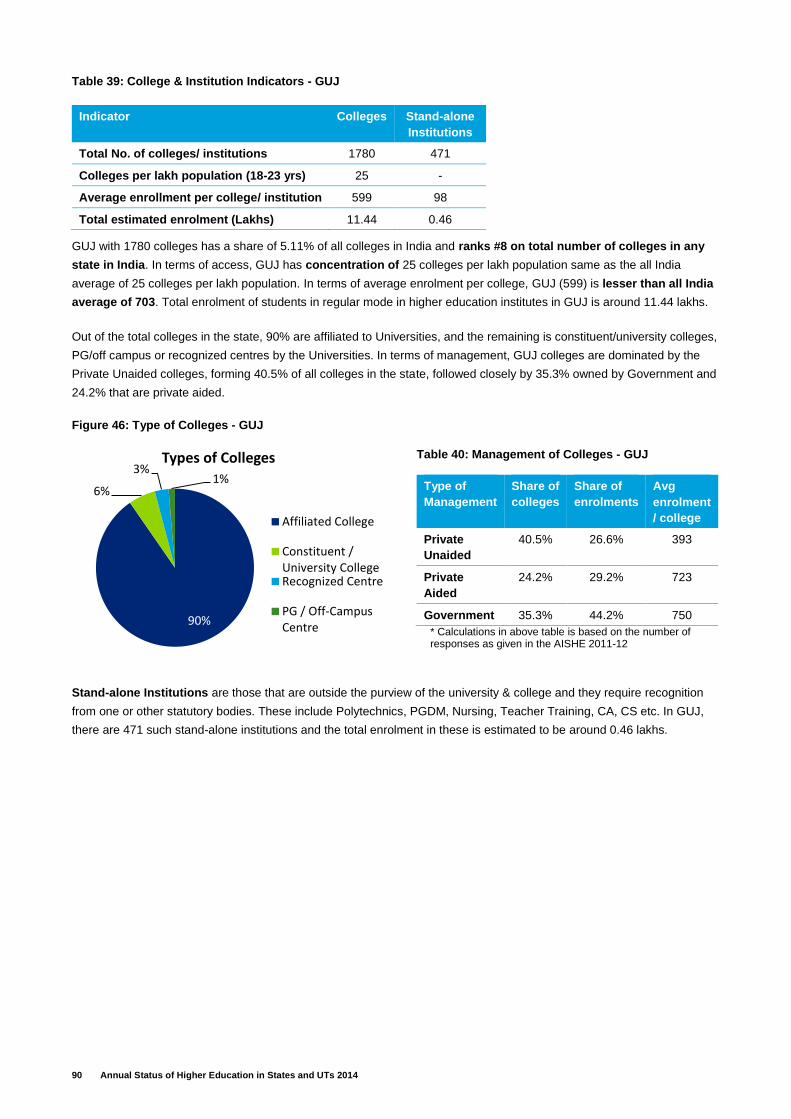
90 Annual Status of Higher Education in States and UTs 2014
Table 39: College & Institution Indicators - GUJ
GUJ with 1780 colleges has a share of 5.11% of all colleges in India and ranks #8 on total number of colleges in any
state in India. In terms of access, GUJ has concentration of 25 colleges per lakh population same as the all India
average of 25 colleges per lakh population. In terms of average enrolment per college, GUJ (599) is lesser than all India
average of 703. Total enrolment of students in regular mode in higher education institutes in GUJ is around 11.44 lakhs.
Out of the total colleges in the state, 90% are affiliated to Universities, and the remaining is constituent/university colleges,
PG/off campus or recognized centres by the Universities. In terms of management, GUJ colleges are dominated by the
Private Unaided colleges, forming 40.5% of all colleges in the state, followed closely by 35.3% owned by Government and
24.2% that are private aided.
Figure 46: Type of Colleges - GUJ
Table 40: Management of Colleges - GUJ
Type of
Management
Share of
colleges
Share of
enrolments
Avg
enrolment
/ college
Private
Unaided
40.5% 26.6% 393
Private
Aided
24.2% 29.2% 723
Government 35.3% 44.2% 750
* Calculations in above table is based on the number of responses as given in the AISHE 2011-12
Stand-alone Institutions are those that are outside the purview of the university & college and they require recognition
from one or other statutory bodies. These include Polytechnics, PGDM, Nursing, Teacher Training, CA, CS etc. In GUJ,
there are 471 such stand-alone institutions and the total enrolment in these is estimated to be around 0.46 lakhs.
Indicator Colleges Stand-alone
Institutions
Total No. of colleges/ institutions 1780 471
Colleges per lakh population (18-23 yrs) 25 -
Average enrollment per college/ institution 599 98
Total estimated enrolment (Lakhs) 11.44 0.46
90%
6%
3%1%
Types of Colleges
Affiliated College
Constituent /University CollegeRecognized Centre
PG / Off-CampusCentre
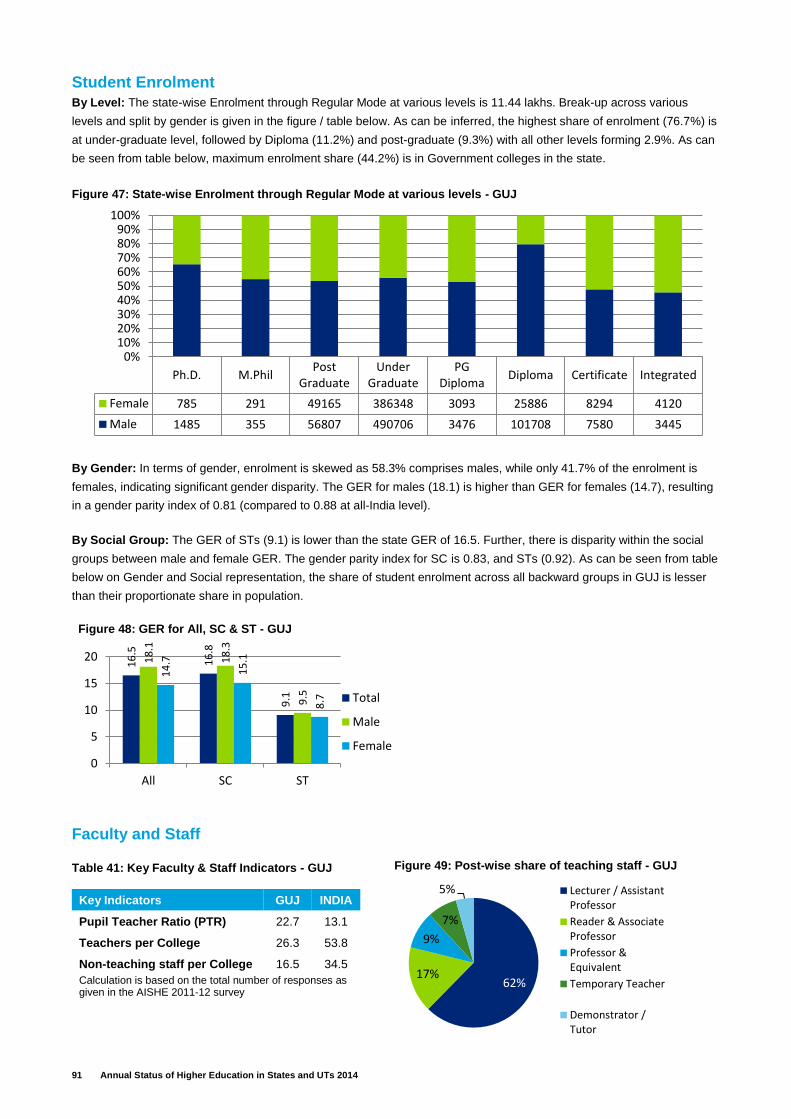
91 Annual Status of Higher Education in States and UTs 2014
Student Enrolment
By Level: The state-wise Enrolment through Regular Mode at various levels is 11.44 lakhs. Break-up across various
levels and split by gender is given in the figure / table below. As can be inferred, the highest share of enrolment (76.7%) is
at under-graduate level, followed by Diploma (11.2%) and post-graduate (9.3%) with all other levels forming 2.9%. As can
be seen from table below, maximum enrolment share (44.2%) is in Government colleges in the state.
By Gender: In terms of gender, enrolment is skewed as 58.3% comprises males, while only 41.7% of the enrolment is
females, indicating significant gender disparity. The GER for males (18.1) is higher than GER for females (14.7), resulting
in a gender parity index of 0.81 (compared to 0.88 at all-India level).
By Social Group: The GER of STs (9.1) is lower than the state GER of 16.5. Further, there is disparity within the social
groups between male and female GER. The gender parity index for SC is 0.83, and STs (0.92). As can be seen from table
below on Gender and Social representation, the share of student enrolment across all backward groups in GUJ is lesser
than their proportionate share in population.
Faculty and Staff
Table 41: Key Faculty & Staff Indicators - GUJ
Key Indicators GUJ INDIA
Pupil Teacher Ratio (PTR) 22.7 13.1
Teachers per College 26.3 53.8
Non-teaching staff per College 16.5 34.5
Calculation is based on the total number of responses as given in the AISHE 2011-12 survey
Ph.D. M.PhilPost
GraduateUnder
GraduatePG
DiplomaDiploma Certificate Integrated
Female 785 291 49165 386348 3093 25886 8294 4120
Male 1485 355 56807 490706 3476 101708 7580 3445
0%10%20%30%40%50%60%70%80%90%
100%
Figure 47: State‐wise Enrolment through Regular Mode at various levels - GUJ
62%17%
9%
7%
5% Lecturer / AssistantProfessor
Reader & AssociateProfessor
Professor &Equivalent
Temporary Teacher
Demonstrator /Tutor
Figure 49: Post-wise share of teaching staff - GUJ
16
.5
16
.8
9.1
18
.1
18
.3
9.5
14
.7
15
.1
8.7
0
5
10
15
20
All SC ST
Total
Male
Female
Figure 48: GER for All, SC & ST - GUJ
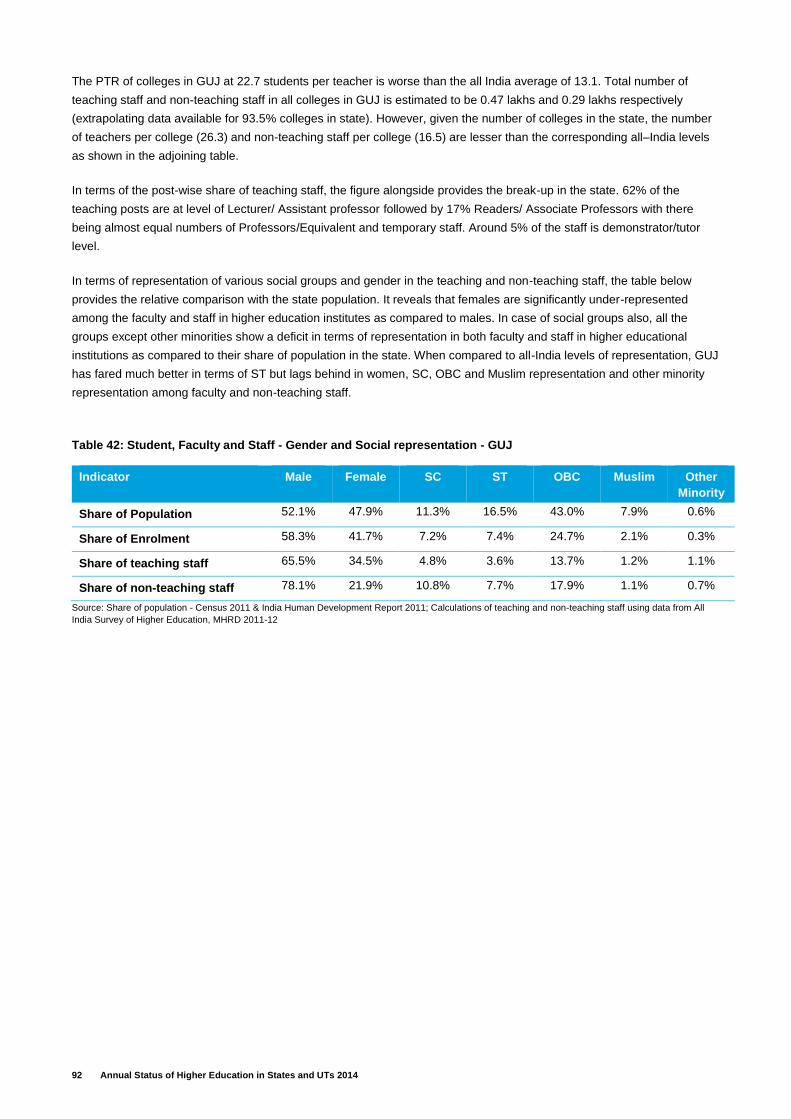
92 Annual Status of Higher Education in States and UTs 2014
The PTR of colleges in GUJ at 22.7 students per teacher is worse than the all India average of 13.1. Total number of
teaching staff and non-teaching staff in all colleges in GUJ is estimated to be 0.47 lakhs and 0.29 lakhs respectively
(extrapolating data available for 93.5% colleges in state). However, given the number of colleges in the state, the number
of teachers per college (26.3) and non-teaching staff per college (16.5) are lesser than the corresponding all–India levels
as shown in the adjoining table.
In terms of the post-wise share of teaching staff, the figure alongside provides the break-up in the state. 62% of the
teaching posts are at level of Lecturer/ Assistant professor followed by 17% Readers/ Associate Professors with there
being almost equal numbers of Professors/Equivalent and temporary staff. Around 5% of the staff is demonstrator/tutor
level.
In terms of representation of various social groups and gender in the teaching and non-teaching staff, the table below
provides the relative comparison with the state population. It reveals that females are significantly under-represented
among the faculty and staff in higher education institutes as compared to males. In case of social groups also, all the
groups except other minorities show a deficit in terms of representation in both faculty and staff in higher educational
institutions as compared to their share of population in the state. When compared to all-India levels of representation, GUJ
has fared much better in terms of ST but lags behind in women, SC, OBC and Muslim representation and other minority
representation among faculty and non-teaching staff.
Table 42: Student, Faculty and Staff - Gender and Social representation - GUJ
Indicator Male Female SC ST OBC Muslim Other
Minority
Share of Population 52.1% 47.9% 11.3% 16.5% 43.0% 7.9% 0.6%
Share of Enrolment 58.3% 41.7% 7.2% 7.4% 24.7% 2.1% 0.3%
Share of teaching staff 65.5% 34.5% 4.8% 3.6% 13.7% 1.2% 1.1%
Share of non-teaching staff 78.1% 21.9% 10.8% 7.7% 17.9% 1.1% 0.7%
Source: Share of population - Census 2011 & India Human Development Report 2011; Calculations of teaching and non-teaching staff using data from All
India Survey of Higher Education, MHRD 2011-12
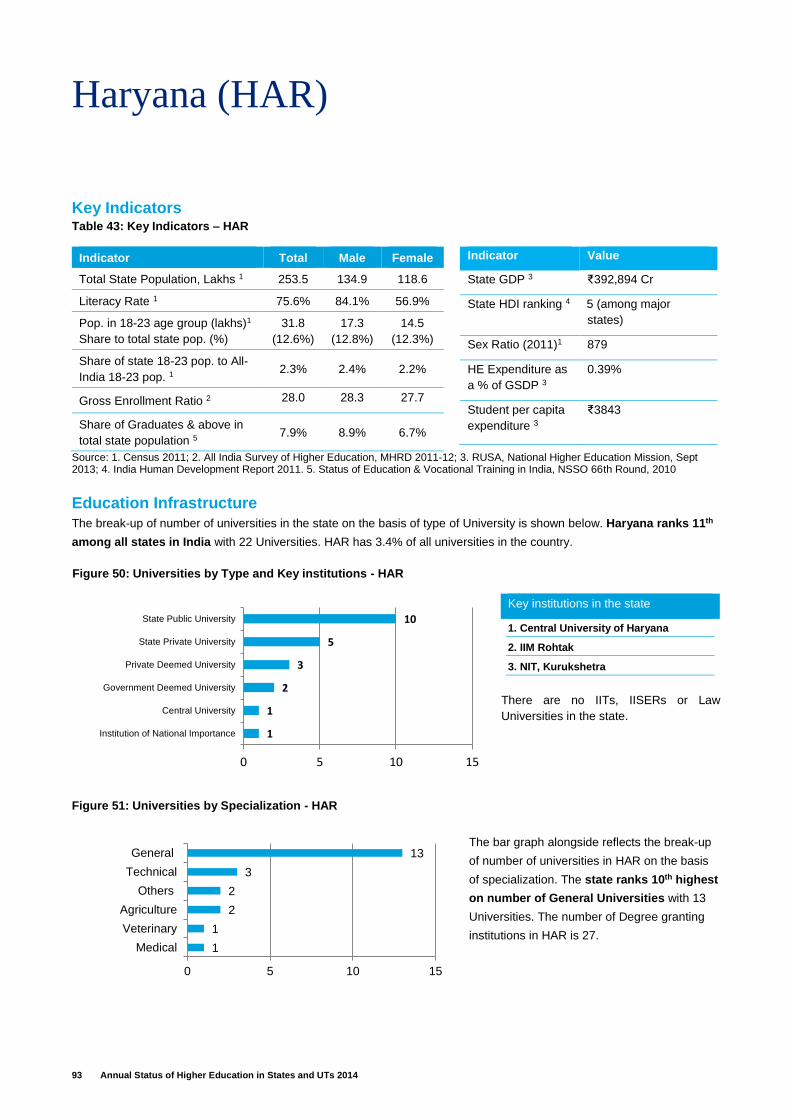
93 Annual Status of Higher Education in States and UTs 2014
Haryana (HAR)
Key Indicators Table 43: Key Indicators – HAR
Indicator Total Male Female
Total State Population, Lakhs 1 253.5 134.9 118.6
Literacy Rate 1 75.6% 84.1% 56.9%
Pop. in 18-23 age group (lakhs)1
Share to total state pop. (%)
31.8
(12.6%)
17.3
(12.8%)
14.5
(12.3%)
Share of state 18-23 pop. to All-
India 18-23 pop. 1 2.3% 2.4% 2.2%
Gross Enrollment Ratio 2 28.0 28.3 27.7
Share of Graduates & above in
total state population 5 7.9% 8.9% 6.7%
Indicator Value
State GDP 3 ₹392,894 Cr
State HDI ranking 4 5 (among major
states)
Sex Ratio (2011)1 879
HE Expenditure as
a % of GSDP 3
0.39%
Student per capita
expenditure 3
₹3843
Source: 1. Census 2011; 2. All India Survey of Higher Education, MHRD 2011-12; 3. RUSA, National Higher Education Mission, Sept 2013; 4. India Human Development Report 2011. 5. Status of Education & Vocational Training in India, NSSO 66th Round, 2010
Education Infrastructure
The break-up of number of universities in the state on the basis of type of University is shown below. Haryana ranks 11th
among all states in India with 22 Universities. HAR has 3.4% of all universities in the country.
There are no IITs, IISERs or Law
Universities in the state.
Key institutions in the state
1. Central University of Haryana
2. IIM Rohtak
3. NIT, Kurukshetra
The bar graph alongside reflects the break-up
of number of universities in HAR on the basis
of specialization. The state ranks 10th highest
on number of General Universities with 13
Universities. The number of Degree granting
institutions in HAR is 27.
Figure 50: Universities by Type and Key institutions - HAR
1
1
2
2
3
13
0 5 10 15
Medical
Veterinary
Agriculture
Others
Technical
General
Figure 51: Universities by Specialization - HAR
1
1
2
3
5
10
0 5 10 15
Institution of National Importance
Central University
Government Deemed University
Private Deemed University
State Private University
State Public University
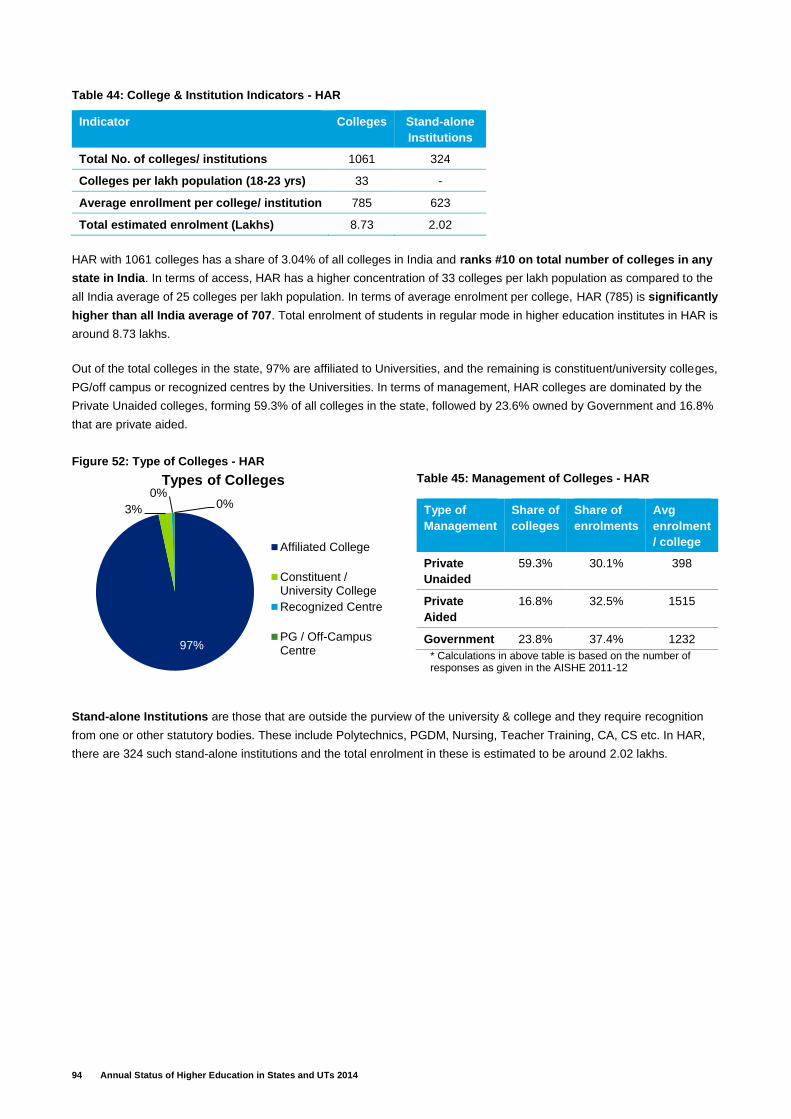
94 Annual Status of Higher Education in States and UTs 2014
Table 44: College & Institution Indicators - HAR
HAR with 1061 colleges has a share of 3.04% of all colleges in India and ranks #10 on total number of colleges in any
state in India. In terms of access, HAR has a higher concentration of 33 colleges per lakh population as compared to the
all India average of 25 colleges per lakh population. In terms of average enrolment per college, HAR (785) is significantly
higher than all India average of 707. Total enrolment of students in regular mode in higher education institutes in HAR is
around 8.73 lakhs.
Out of the total colleges in the state, 97% are affiliated to Universities, and the remaining is constituent/university colleges,
PG/off campus or recognized centres by the Universities. In terms of management, HAR colleges are dominated by the
Private Unaided colleges, forming 59.3% of all colleges in the state, followed by 23.6% owned by Government and 16.8%
that are private aided.
Figure 52: Type of Colleges - HAR
Table 45: Management of Colleges - HAR
Type of
Management
Share of
colleges
Share of
enrolments
Avg
enrolment
/ college
Private
Unaided
59.3% 30.1% 398
Private
Aided
16.8% 32.5% 1515
Government 23.8% 37.4% 1232
* Calculations in above table is based on the number of responses as given in the AISHE 2011-12
Stand-alone Institutions are those that are outside the purview of the university & college and they require recognition
from one or other statutory bodies. These include Polytechnics, PGDM, Nursing, Teacher Training, CA, CS etc. In HAR,
there are 324 such stand-alone institutions and the total enrolment in these is estimated to be around 2.02 lakhs.
Indicator Colleges Stand-alone
Institutions
Total No. of colleges/ institutions 1061 324
Colleges per lakh population (18-23 yrs) 33 -
Average enrollment per college/ institution 785 623
Total estimated enrolment (Lakhs) 8.73 2.02
97%
3%
0%0%
Types of Colleges
Affiliated College
Constituent /University College
Recognized Centre
PG / Off-CampusCentre
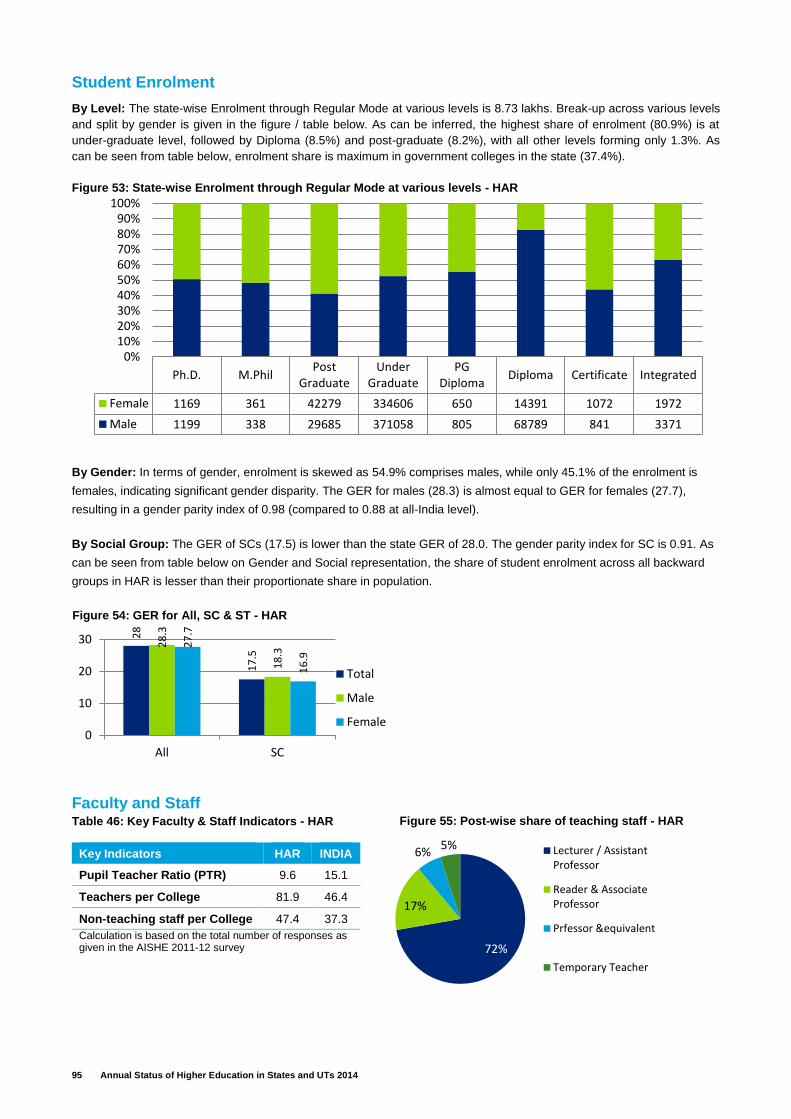
95 Annual Status of Higher Education in States and UTs 2014
Student Enrolment
By Level: The state-wise Enrolment through Regular Mode at various levels is 8.73 lakhs. Break-up across various levels
and split by gender is given in the figure / table below. As can be inferred, the highest share of enrolment (80.9%) is at
under-graduate level, followed by Diploma (8.5%) and post-graduate (8.2%), with all other levels forming only 1.3%. As
can be seen from table below, enrolment share is maximum in government colleges in the state (37.4%).
By Gender: In terms of gender, enrolment is skewed as 54.9% comprises males, while only 45.1% of the enrolment is
females, indicating significant gender disparity. The GER for males (28.3) is almost equal to GER for females (27.7),
resulting in a gender parity index of 0.98 (compared to 0.88 at all-India level).
By Social Group: The GER of SCs (17.5) is lower than the state GER of 28.0. The gender parity index for SC is 0.91. As
can be seen from table below on Gender and Social representation, the share of student enrolment across all backward
groups in HAR is lesser than their proportionate share in population.
Faculty and Staff Table 46: Key Faculty & Staff Indicators - HAR
Key Indicators HAR INDIA
Pupil Teacher Ratio (PTR) 9.6 15.1
Teachers per College 81.9 46.4
Non-teaching staff per College 47.4 37.3
Calculation is based on the total number of responses as given in the AISHE 2011-12 survey
Ph.D. M.PhilPost
GraduateUnder
GraduatePG
DiplomaDiploma Certificate Integrated
Female 1169 361 42279 334606 650 14391 1072 1972
Male 1199 338 29685 371058 805 68789 841 3371
0%10%20%30%40%50%60%70%80%90%
100%Figure 53: State‐wise Enrolment through Regular Mode at various levels - HAR
28
17
.5
28
.3
18
.3
27
.7
16
.9
0
10
20
30
All SC
Total
Male
Female
Figure 54: GER for All, SC & ST - HAR
72%
17%
6%5% Lecturer / Assistant
Professor
Reader & AssociateProfessor
Prfessor &equivalent
Temporary Teacher
Figure 55: Post-wise share of teaching staff - HAR

96 Annual Status of Higher Education in States and UTs 2014
The PTR of colleges in HAR at 9.6 students per teacher is better than the all India average of 15.1. Total number of
teaching staff and non-teaching staff in all colleges in HAR is estimated to be 0.87 lakhs and 0.5 lakhs respectively
(extrapolating data available for 47.0% colleges in state). However, given the large number of colleges in the state, the
number of teachers per college (81.9) and non-teaching staff per college (15.1) are lesser than the corresponding all–India
levels as shown in the adjoining table.
In terms of the post-wise share of teaching staff, the figure alongside provides the break-up in the state. 72% of the
teaching posts are at level of Lecturer/ Assistant professor, 17% of Readers/ Associate Professors and 6% Professors.
Around 5% of the staff is temporary.
In terms of representation of various social groups and gender in the teaching and non-teaching staff, the table below
provides the relative comparison with the state population. It reveals that females are significantly under-represented
among the faculty and staff in higher education institutes as compared to males. In case of social groups also, all the
groups shown in the table show a deficit in terms of representation in both faculty and staff in higher educational
institutions as compared to their share of population in the state. When compared to all-India levels of representation, HAR
has fared much better in terms of SC and Muslim representation, but lags behind in ST and OBC representation among
faculty and non-teaching staff.
Table 47: Student, Faculty and Staff - Gender and Social representation - HAR
Indicator Male Female SC ST OBC Muslim Other
Minority
Share of Population 53.2% 46.8% 25.0% 0.1% 28.1% 7.7% 6.0%
Share of Enrolment 54.9% 45.1% 13.2% 0.1% 20.9% 1.2% 2.9%
Share of teaching staff 55.5% 44.5% 4.0% 0.2% 7.6% 0.3% 1.1%
Share of non-teaching staff 81.9% 18.1% 15.8% 0.5% 13.4% 0.2% 0.5%
Source: Share of population - Census 2011 & India Human Development Report 2011; Calculations of teaching and non-teaching staff using data from All
India Survey of Higher Education, MHRD 2011-12
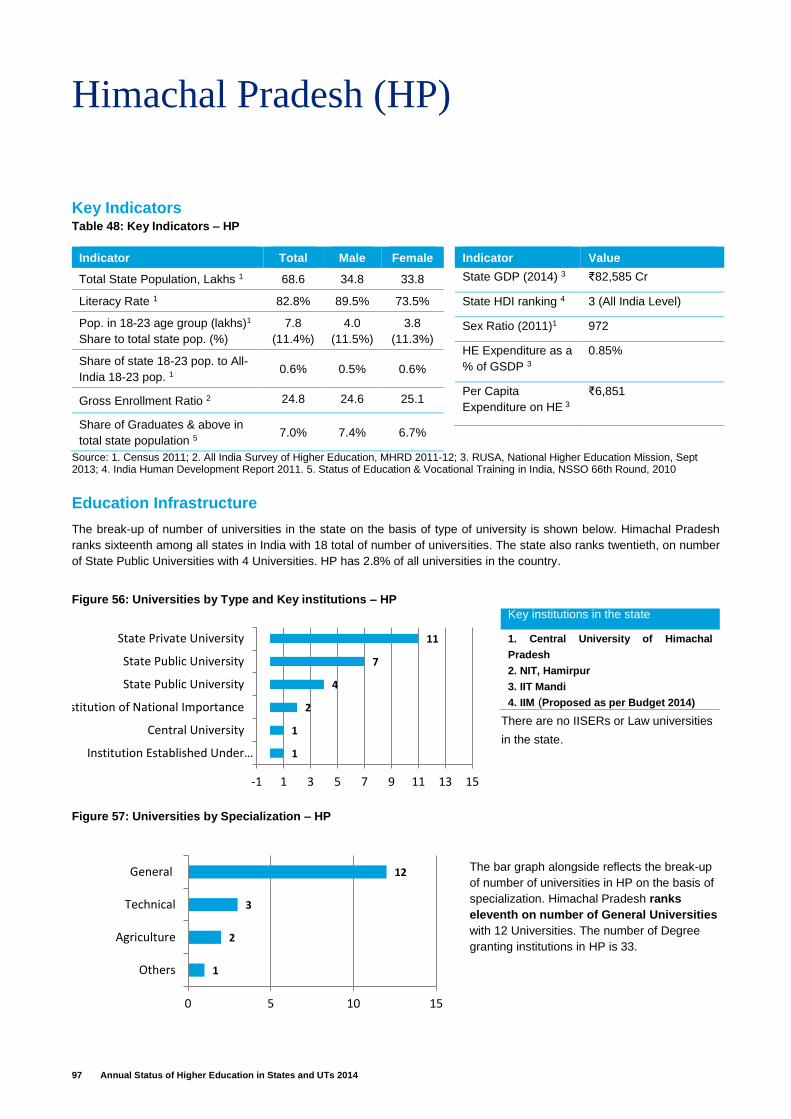
97 Annual Status of Higher Education in States and UTs 2014
Himachal Pradesh (HP)
Key Indicators Table 48: Key Indicators – HP
Indicator Total Male Female
Total State Population, Lakhs 1 68.6 34.8 33.8
Literacy Rate 1 82.8% 89.5% 73.5%
Pop. in 18-23 age group (lakhs)1
Share to total state pop. (%)
7.8
(11.4%)
4.0
(11.5%)
3.8
(11.3%)
Share of state 18-23 pop. to All-
India 18-23 pop. 1 0.6% 0.5% 0.6%
Gross Enrollment Ratio 2 24.8 24.6 25.1
Share of Graduates & above in
total state population 5 7.0% 7.4% 6.7%
Indicator Value
State GDP (2014) 3 ₹82,585 Cr
State HDI ranking 4 3 (All India Level)
Sex Ratio (2011)1 972
HE Expenditure as a
% of GSDP 3
0.85%
Per Capita
Expenditure on HE 3
₹6,851
Source: 1. Census 2011; 2. All India Survey of Higher Education, MHRD 2011-12; 3. RUSA, National Higher Education Mission, Sept 2013; 4. India Human Development Report 2011. 5. Status of Education & Vocational Training in India, NSSO 66th Round, 2010
Education Infrastructure
The break-up of number of universities in the state on the basis of type of university is shown below. Himachal Pradesh
ranks sixteenth among all states in India with 18 total of number of universities. The state also ranks twentieth, on number
of State Public Universities with 4 Universities. HP has 2.8% of all universities in the country.
There are no IISERs or Law universities
in the state.
Key institutions in the state
1. Central University of Himachal
Pradesh
2. NIT, Hamirpur
3. IIT Mandi
4. IIM (Proposed as per Budget 2014)
The bar graph alongside reflects the break-up
of number of universities in HP on the basis of
specialization. Himachal Pradesh ranks
eleventh on number of General Universities
with 12 Universities. The number of Degree
granting institutions in HP is 33.
Figure 56: Universities by Type and Key institutions – HP
1
2
3
12
0 5 10 15
Others
Agriculture
Technical
General
Figure 57: Universities by Specialization – HP
1
1
2
4
7
11
-1 1 3 5 7 9 11 13 15
Institution Established Under…
Central University
Institution of National Importance
State Public University
State Public University
State Private University
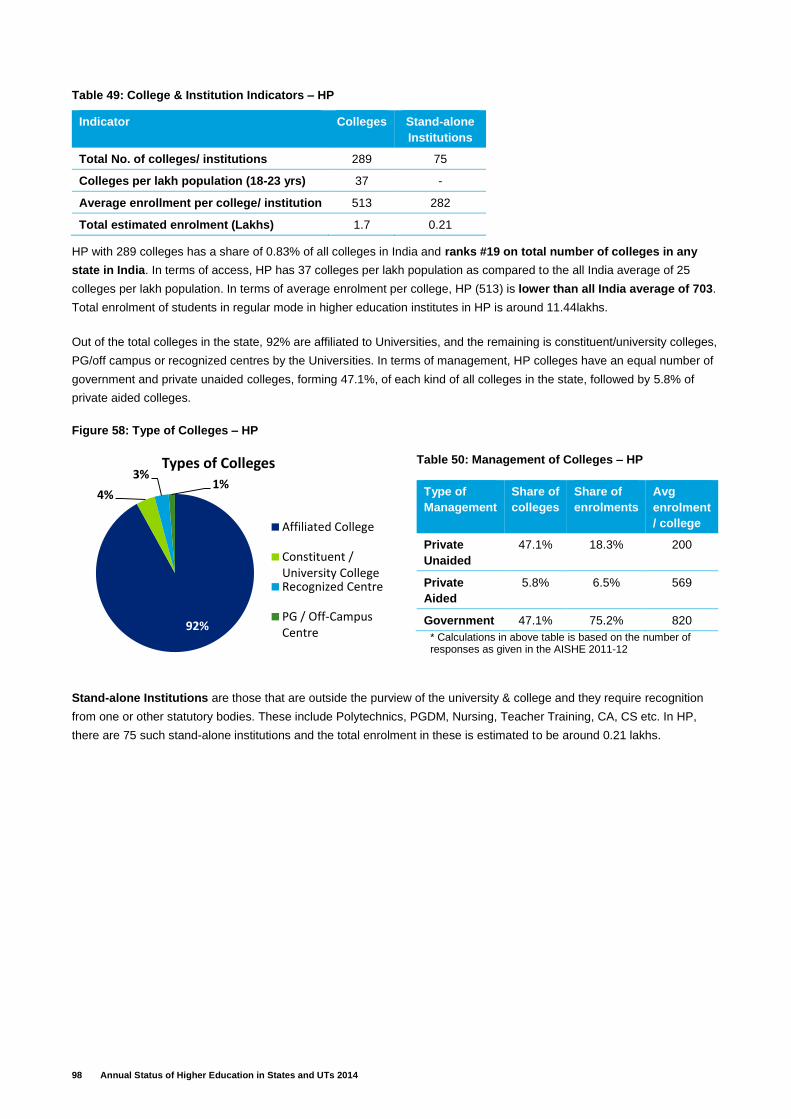
98 Annual Status of Higher Education in States and UTs 2014
Table 49: College & Institution Indicators – HP
HP with 289 colleges has a share of 0.83% of all colleges in India and ranks #19 on total number of colleges in any
state in India. In terms of access, HP has 37 colleges per lakh population as compared to the all India average of 25
colleges per lakh population. In terms of average enrolment per college, HP (513) is lower than all India average of 703.
Total enrolment of students in regular mode in higher education institutes in HP is around 11.44lakhs.
Out of the total colleges in the state, 92% are affiliated to Universities, and the remaining is constituent/university colleges,
PG/off campus or recognized centres by the Universities. In terms of management, HP colleges have an equal number of
government and private unaided colleges, forming 47.1%, of each kind of all colleges in the state, followed by 5.8% of
private aided colleges.
Figure 58: Type of Colleges – HP
Table 50: Management of Colleges – HP
Type of
Management
Share of
colleges
Share of
enrolments
Avg
enrolment
/ college
Private
Unaided
47.1% 18.3% 200
Private
Aided
5.8% 6.5% 569
Government 47.1% 75.2% 820
* Calculations in above table is based on the number of responses as given in the AISHE 2011-12
Stand-alone Institutions are those that are outside the purview of the university & college and they require recognition
from one or other statutory bodies. These include Polytechnics, PGDM, Nursing, Teacher Training, CA, CS etc. In HP,
there are 75 such stand-alone institutions and the total enrolment in these is estimated to be around 0.21 lakhs.
Indicator Colleges Stand-alone
Institutions
Total No. of colleges/ institutions 289 75
Colleges per lakh population (18-23 yrs) 37 -
Average enrollment per college/ institution 513 282
Total estimated enrolment (Lakhs) 1.7 0.21
92%
4%
3%1%
Types of Colleges
Affiliated College
Constituent /University CollegeRecognized Centre
PG / Off-CampusCentre
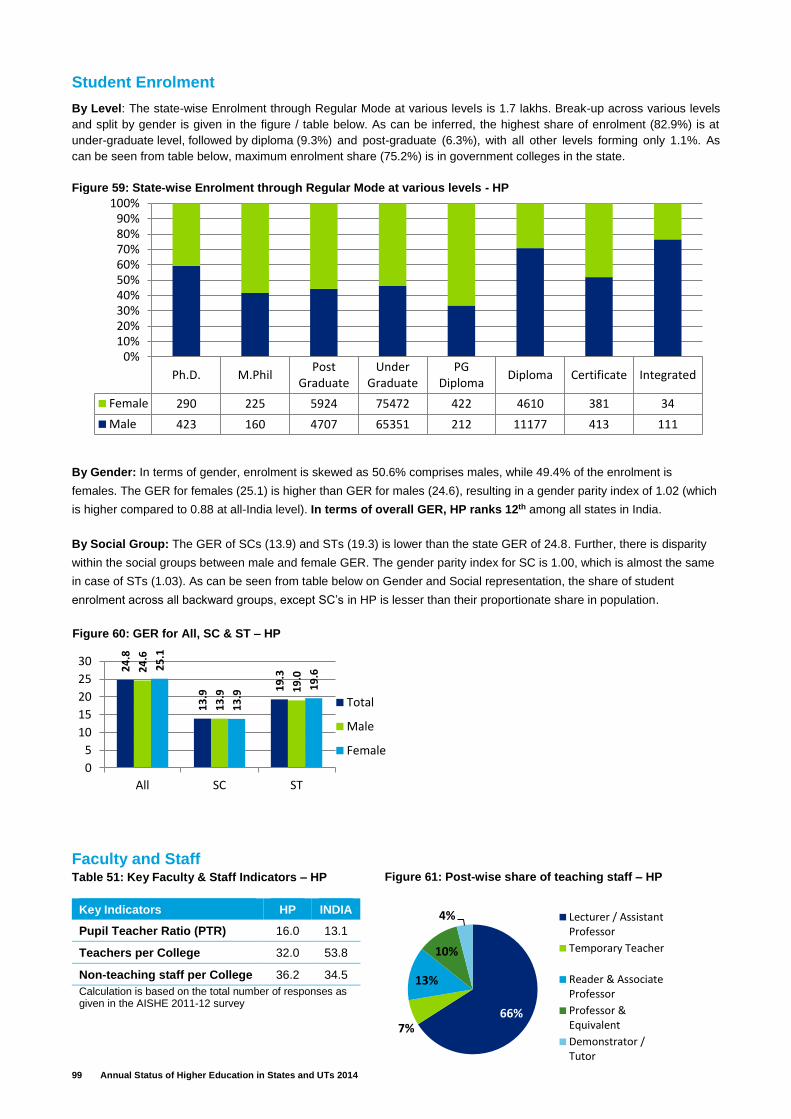
99 Annual Status of Higher Education in States and UTs 2014
Student Enrolment
By Level: The state-wise Enrolment through Regular Mode at various levels is 1.7 lakhs. Break-up across various levels
and split by gender is given in the figure / table below. As can be inferred, the highest share of enrolment (82.9%) is at
under-graduate level, followed by diploma (9.3%) and post-graduate (6.3%), with all other levels forming only 1.1%. As
can be seen from table below, maximum enrolment share (75.2%) is in government colleges in the state.
By Gender: In terms of gender, enrolment is skewed as 50.6% comprises males, while 49.4% of the enrolment is
females. The GER for females (25.1) is higher than GER for males (24.6), resulting in a gender parity index of 1.02 (which
is higher compared to 0.88 at all-India level). In terms of overall GER, HP ranks 12th among all states in India.
By Social Group: The GER of SCs (13.9) and STs (19.3) is lower than the state GER of 24.8. Further, there is disparity
within the social groups between male and female GER. The gender parity index for SC is 1.00, which is almost the same
in case of STs (1.03). As can be seen from table below on Gender and Social representation, the share of student
enrolment across all backward groups, except SC’s in HP is lesser than their proportionate share in population.
Faculty and Staff Table 51: Key Faculty & Staff Indicators – HP
Key Indicators HP INDIA
Pupil Teacher Ratio (PTR) 16.0 13.1
Teachers per College 32.0 53.8
Non-teaching staff per College 36.2 34.5
Calculation is based on the total number of responses as given in the AISHE 2011-12 survey
Ph.D. M.PhilPost
GraduateUnder
GraduatePG
DiplomaDiploma Certificate Integrated
Female 290 225 5924 75472 422 4610 381 34
Male 423 160 4707 65351 212 11177 413 111
0%10%20%30%40%50%60%70%80%90%
100%Figure 59: State‐wise Enrolment through Regular Mode at various levels - HP
24
.8
13
.9
19
.3
24
.6
13
.9
19
.0
25
.1
13
.9
19
.6
0
5
10
15
20
25
30
All SC ST
Total
Male
Female
Figure 60: GER for All, SC & ST – HP
66%7%
13%
10%
4% Lecturer / AssistantProfessor
Temporary Teacher
Reader & AssociateProfessor
Professor &Equivalent
Demonstrator /Tutor
Figure 61: Post-wise share of teaching staff – HP
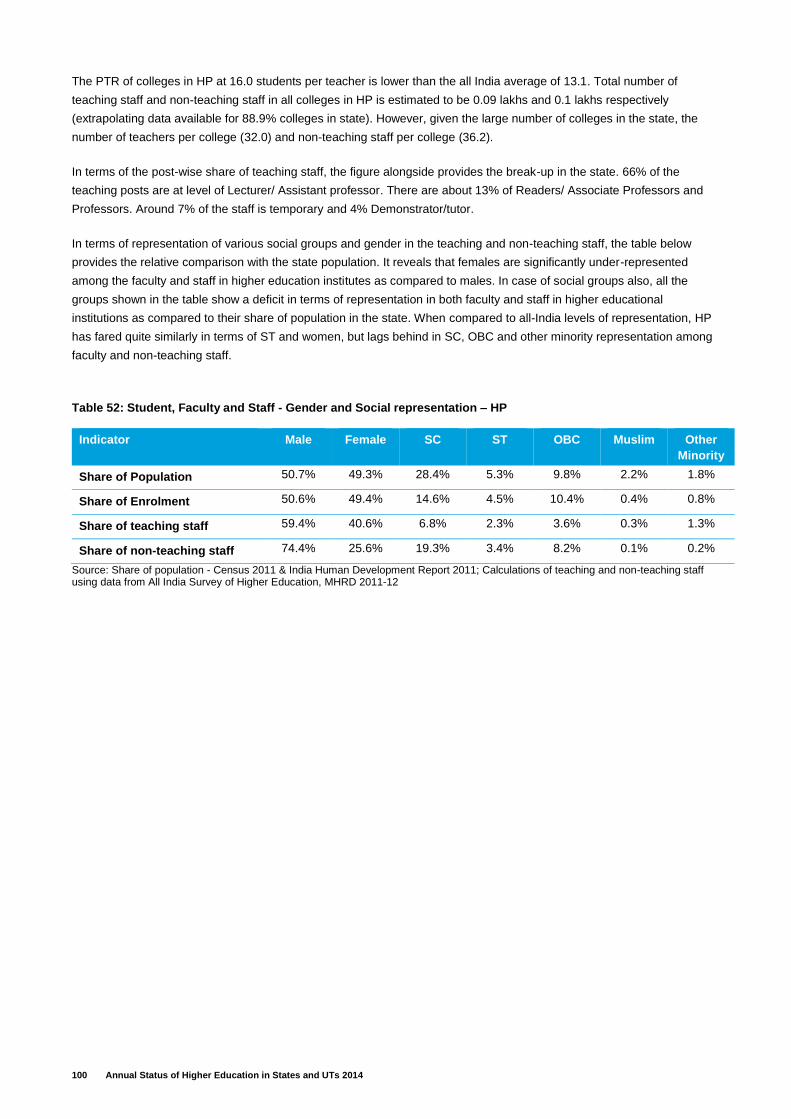
100 Annual Status of Higher Education in States and UTs 2014
The PTR of colleges in HP at 16.0 students per teacher is lower than the all India average of 13.1. Total number of
teaching staff and non-teaching staff in all colleges in HP is estimated to be 0.09 lakhs and 0.1 lakhs respectively
(extrapolating data available for 88.9% colleges in state). However, given the large number of colleges in the state, the
number of teachers per college (32.0) and non-teaching staff per college (36.2).
In terms of the post-wise share of teaching staff, the figure alongside provides the break-up in the state. 66% of the
teaching posts are at level of Lecturer/ Assistant professor. There are about 13% of Readers/ Associate Professors and
Professors. Around 7% of the staff is temporary and 4% Demonstrator/tutor.
In terms of representation of various social groups and gender in the teaching and non-teaching staff, the table below
provides the relative comparison with the state population. It reveals that females are significantly under-represented
among the faculty and staff in higher education institutes as compared to males. In case of social groups also, all the
groups shown in the table show a deficit in terms of representation in both faculty and staff in higher educational
institutions as compared to their share of population in the state. When compared to all-India levels of representation, HP
has fared quite similarly in terms of ST and women, but lags behind in SC, OBC and other minority representation among
faculty and non-teaching staff.
Table 52: Student, Faculty and Staff - Gender and Social representation – HP
Indicator Male Female SC ST OBC Muslim Other
Minority
Share of Population 50.7% 49.3% 28.4% 5.3% 9.8% 2.2% 1.8%
Share of Enrolment 50.6% 49.4% 14.6% 4.5% 10.4% 0.4% 0.8%
Share of teaching staff 59.4% 40.6% 6.8% 2.3% 3.6% 0.3% 1.3%
Share of non-teaching staff 74.4% 25.6% 19.3% 3.4% 8.2% 0.1% 0.2%
Source: Share of population - Census 2011 & India Human Development Report 2011; Calculations of teaching and non-teaching staff using data from All India Survey of Higher Education, MHRD 2011-12
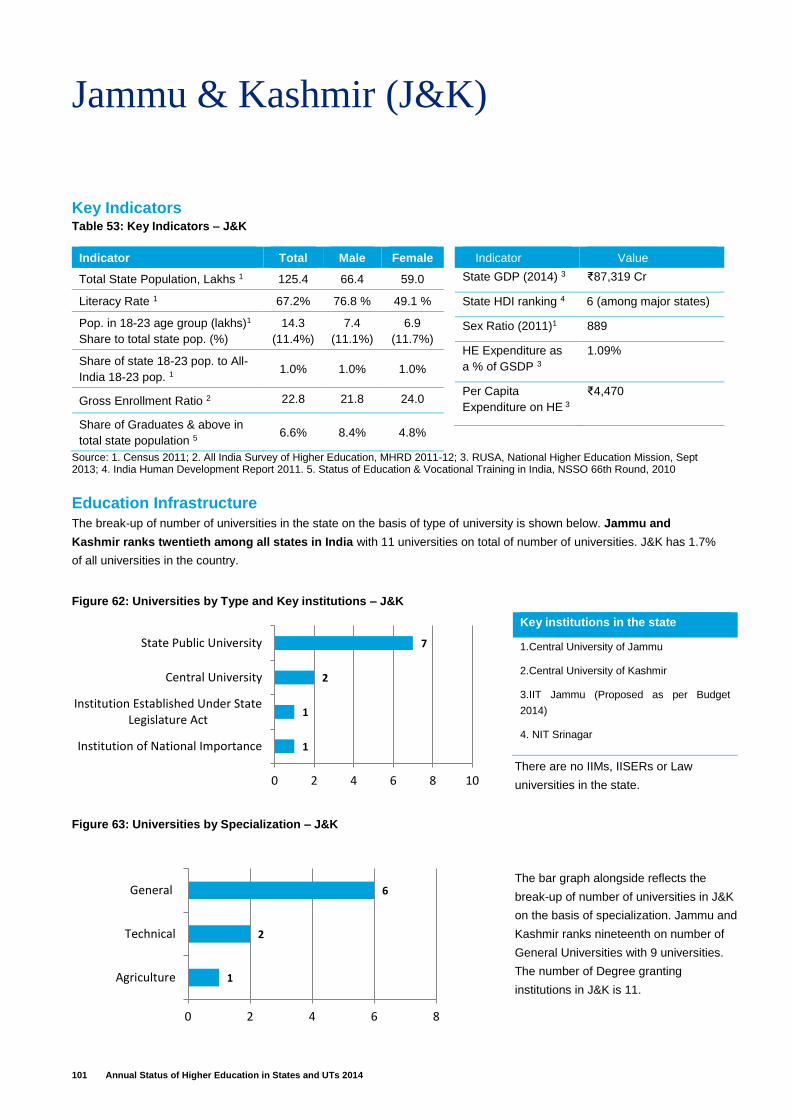
101 Annual Status of Higher Education in States and UTs 2014
Jammu & Kashmir (J&K)
Key Indicators Table 53: Key Indicators – J&K
Indicator Total Male Female
Total State Population, Lakhs 1 125.4 66.4 59.0
Literacy Rate 1 67.2% 76.8 % 49.1 %
Pop. in 18-23 age group (lakhs)1
Share to total state pop. (%)
14.3
(11.4%)
7.4
(11.1%)
6.9
(11.7%)
Share of state 18-23 pop. to All-
India 18-23 pop. 1 1.0% 1.0% 1.0%
Gross Enrollment Ratio 2 22.8 21.8 24.0
Share of Graduates & above in
total state population 5 6.6% 8.4% 4.8%
Indicator Value
State GDP (2014) 3 ₹87,319 Cr
State HDI ranking 4 6 (among major states)
Sex Ratio (2011)1 889
HE Expenditure as
a % of GSDP 3
1.09%
Per Capita
Expenditure on HE 3
₹4,470
Source: 1. Census 2011; 2. All India Survey of Higher Education, MHRD 2011-12; 3. RUSA, National Higher Education Mission, Sept 2013; 4. India Human Development Report 2011. 5. Status of Education & Vocational Training in India, NSSO 66th Round, 2010
Education Infrastructure
The break-up of number of universities in the state on the basis of type of university is shown below. Jammu and
Kashmir ranks twentieth among all states in India with 11 universities on total of number of universities. J&K has 1.7%
of all universities in the country.
There are no IIMs, IISERs or Law
universities in the state.
The bar graph alongside reflects the
break-up of number of universities in J&K
on the basis of specialization. Jammu and
Kashmir ranks nineteenth on number of
General Universities with 9 universities.
The number of Degree granting
institutions in J&K is 11.
Key institutions in the state
1.Central University of Jammu
2.Central University of Kashmir
3.IIT Jammu (Proposed as per Budget
2014)
4. NIT Srinagar
Figure 62: Universities by Type and Key institutions – J&K
1
2
6
0 2 4 6 8
Agriculture
Technical
General
Figure 63: Universities by Specialization – J&K
1
1
2
7
0 2 4 6 8 10
Institution of National Importance
Institution Established Under StateLegislature Act
Central University
State Public University
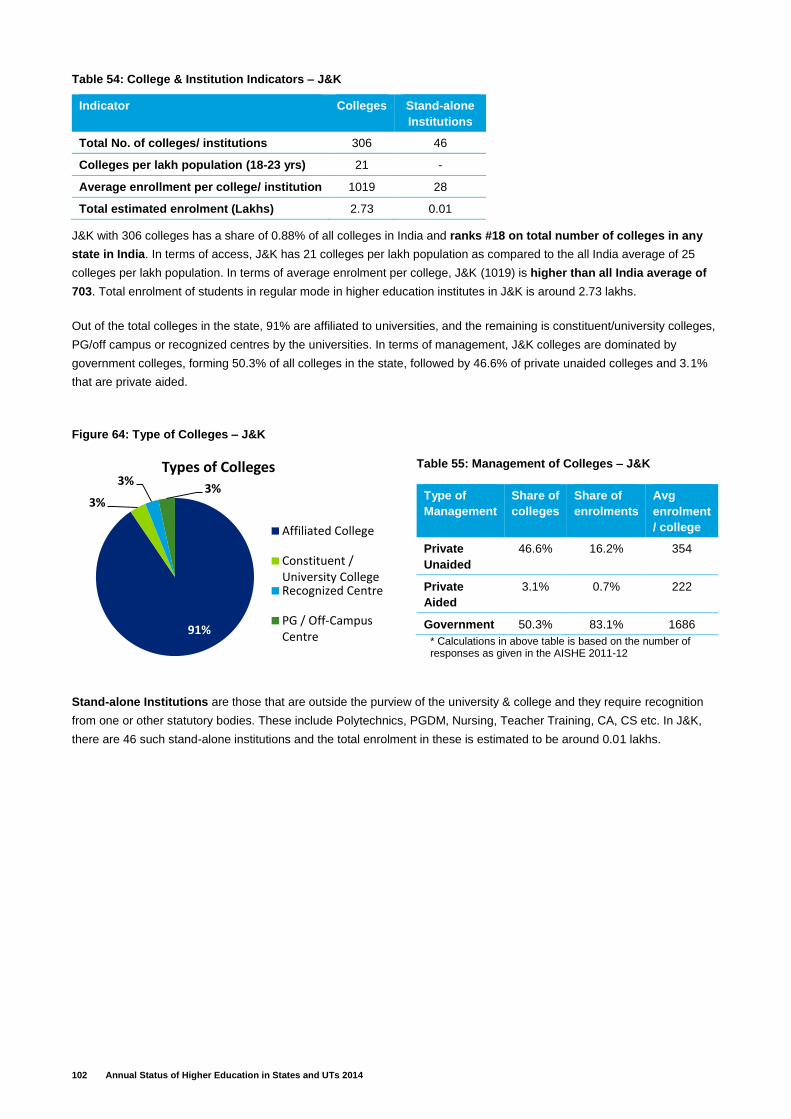
102 Annual Status of Higher Education in States and UTs 2014
Table 54: College & Institution Indicators – J&K
J&K with 306 colleges has a share of 0.88% of all colleges in India and ranks #18 on total number of colleges in any
state in India. In terms of access, J&K has 21 colleges per lakh population as compared to the all India average of 25
colleges per lakh population. In terms of average enrolment per college, J&K (1019) is higher than all India average of
703. Total enrolment of students in regular mode in higher education institutes in J&K is around 2.73 lakhs.
Out of the total colleges in the state, 91% are affiliated to universities, and the remaining is constituent/university colleges,
PG/off campus or recognized centres by the universities. In terms of management, J&K colleges are dominated by
government colleges, forming 50.3% of all colleges in the state, followed by 46.6% of private unaided colleges and 3.1%
that are private aided.
Figure 64: Type of Colleges – J&K
Table 55: Management of Colleges – J&K
Type of
Management
Share of
colleges
Share of
enrolments
Avg
enrolment
/ college
Private
Unaided
46.6% 16.2% 354
Private
Aided
3.1% 0.7% 222
Government 50.3% 83.1% 1686
* Calculations in above table is based on the number of responses as given in the AISHE 2011-12
Stand-alone Institutions are those that are outside the purview of the university & college and they require recognition
from one or other statutory bodies. These include Polytechnics, PGDM, Nursing, Teacher Training, CA, CS etc. In J&K,
there are 46 such stand-alone institutions and the total enrolment in these is estimated to be around 0.01 lakhs.
Indicator Colleges Stand-alone
Institutions
Total No. of colleges/ institutions 306 46
Colleges per lakh population (18-23 yrs) 21 -
Average enrollment per college/ institution 1019 28
Total estimated enrolment (Lakhs) 2.73 0.01
91%
3%
3%3%
Types of Colleges
Affiliated College
Constituent /University CollegeRecognized Centre
PG / Off-CampusCentre
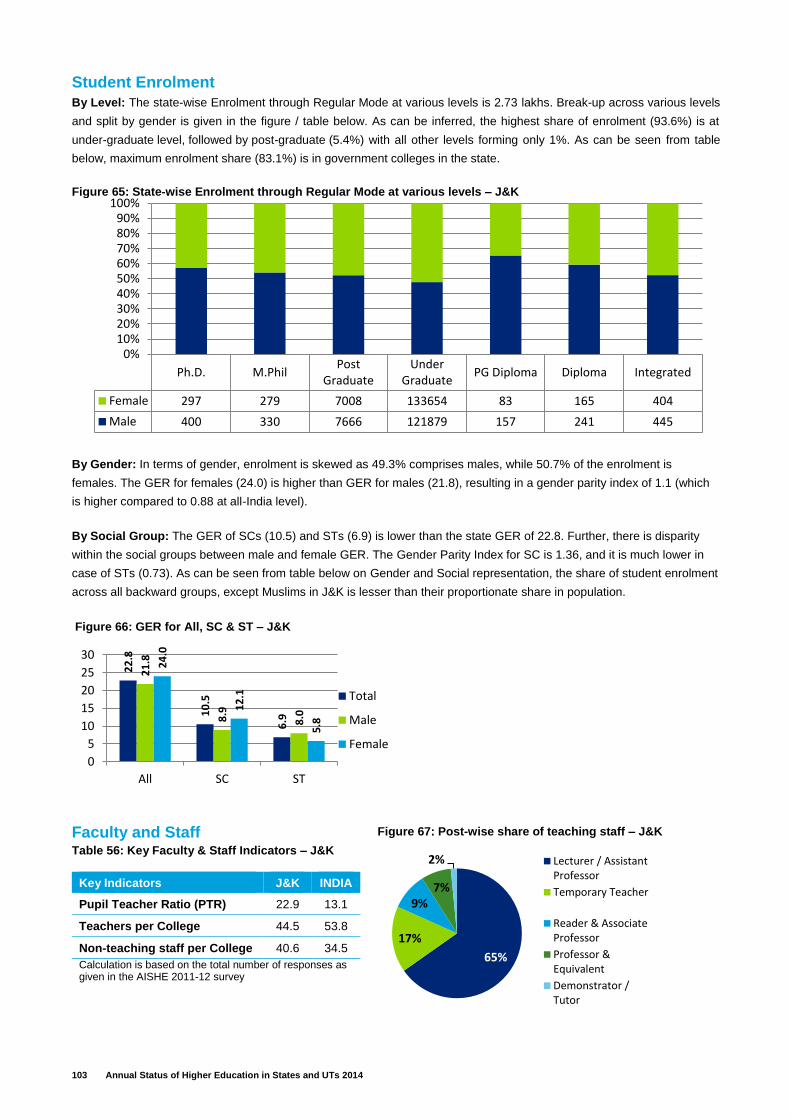
103 Annual Status of Higher Education in States and UTs 2014
Student Enrolment
By Level: The state-wise Enrolment through Regular Mode at various levels is 2.73 lakhs. Break-up across various levels
and split by gender is given in the figure / table below. As can be inferred, the highest share of enrolment (93.6%) is at
under-graduate level, followed by post-graduate (5.4%) with all other levels forming only 1%. As can be seen from table
below, maximum enrolment share (83.1%) is in government colleges in the state.
By Gender: In terms of gender, enrolment is skewed as 49.3% comprises males, while 50.7% of the enrolment is
females. The GER for females (24.0) is higher than GER for males (21.8), resulting in a gender parity index of 1.1 (which
is higher compared to 0.88 at all-India level).
By Social Group: The GER of SCs (10.5) and STs (6.9) is lower than the state GER of 22.8. Further, there is disparity
within the social groups between male and female GER. The Gender Parity Index for SC is 1.36, and it is much lower in
case of STs (0.73). As can be seen from table below on Gender and Social representation, the share of student enrolment
across all backward groups, except Muslims in J&K is lesser than their proportionate share in population.
Faculty and Staff Table 56: Key Faculty & Staff Indicators – J&K
Key Indicators J&K INDIA
Pupil Teacher Ratio (PTR) 22.9 13.1
Teachers per College 44.5 53.8
Non-teaching staff per College 40.6 34.5
Calculation is based on the total number of responses as given in the AISHE 2011-12 survey
Ph.D. M.PhilPost
GraduateUnder
GraduatePG Diploma Diploma Integrated
Female 297 279 7008 133654 83 165 404
Male 400 330 7666 121879 157 241 445
0%10%20%30%40%50%60%70%80%90%
100%Figure 65: State‐wise Enrolment through Regular Mode at various levels – J&K
22
.8
10
.5
6.9
21
.8
8.9
8.0
24
.0
12
.1
5.8
0
5
10
15
20
25
30
All SC ST
Total
Male
Female
Figure 66: GER for All, SC & ST – J&K
65%
17%
9%7%
2% Lecturer / AssistantProfessor
Temporary Teacher
Reader & AssociateProfessor
Professor &Equivalent
Demonstrator /Tutor
Figure 67: Post-wise share of teaching staff – J&K

104 Annual Status of Higher Education in States and UTs 2014
The PTR of colleges in J&K at 22.9 students per teacher is lower than the all India average of 13.1. Total number of
teaching staff and non-teaching staff in all colleges in J&K is estimated to be 0.14 lakhs and 0.12 lakhs respectively
(extrapolating data available for 63.1% colleges in state). However, given the number of colleges in the state, the number
of teachers per college (44.5) and non-teaching staff per college (40.6) farely appropriate when compared to the
corresponding all–India levels as shown in the adjoining table.
In terms of the post-wise share of teaching staff, the figure alongside provides the break-up in the state. 65% of the
teaching posts are at level of Lecturer/ Assistant professor. There are about 9% of Readers/ Associate Professors and
Professors. Around 7% of the staff is temporary and 2% Demonstrator/tutor.
In terms of representation of various social groups and gender in the teaching and non-teaching staff, the table below
provides the relative comparison with the state population. It reveals that females are significantly under-represented
among the faculty and staff in higher education institutes as compared to males. In case of social groups also, all the
groups shown in the table show a deficit in terms of representation in both faculty and staff in higher educational
institutions as compared to their share of population in the state. When compared to all-India levels of representation, J&K
has fared much better in terms of Muslim representation, but lags behind in women, SC, ST, OBC and other minority
representation among faculty and non-teaching staff.
Table 57: Student, Faculty and Staff - Gender and Social representation – J&K
Indicator Male Female SC ST OBC Muslim Other
Minority
Share of Population 53.0% 47.0% 11.9% 3.3% 11.3% 55.7% 2.7%
Share of Enrolment 49.3% 50.7% 3.7% 3.4 5.9% 62.3% 3.1%
Share of teaching staff 53.1% 46.9% 2.8% 1.1% 1.3% 36.5% 2.5%
Share of non-teaching staff 74.6% 25.4% 6.1% 2.0% 0.9% 45.4% 2.8%
Source: Share of population - Census 2011 & India Human Development Report 2011; Calculations of teaching and non-teaching staff using data from All India Survey of Higher Education, MHRD 2011-12
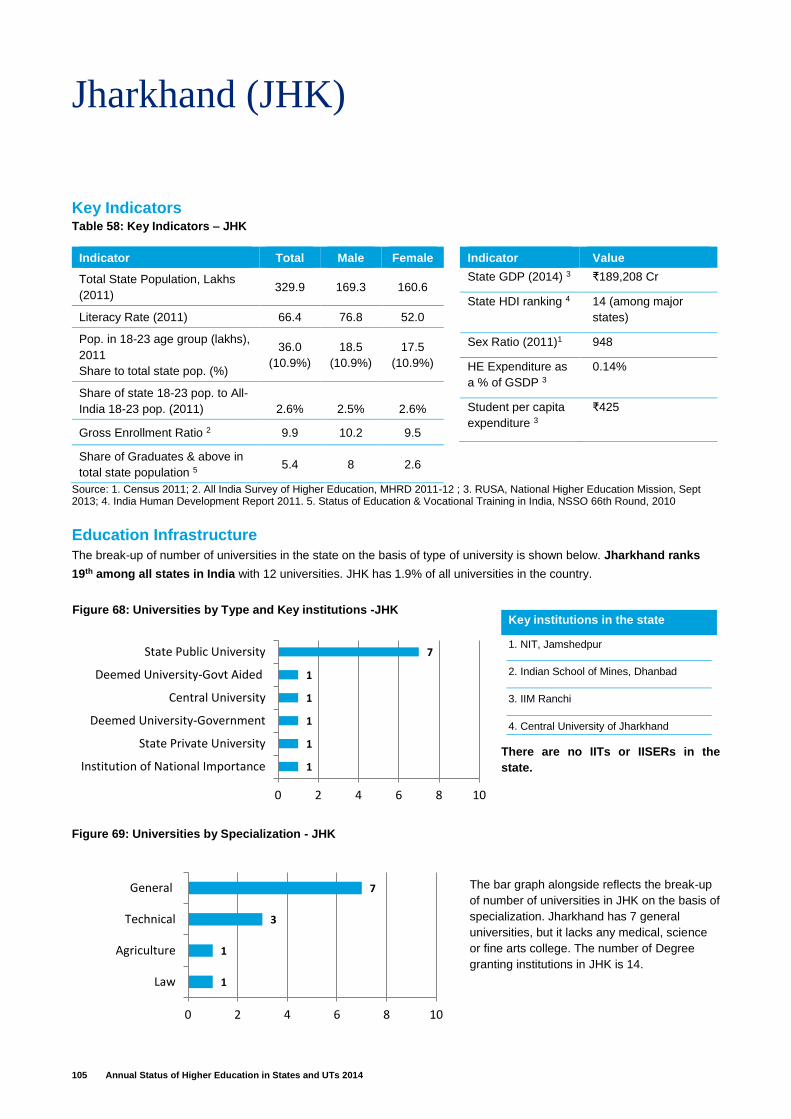
105 Annual Status of Higher Education in States and UTs 2014
Jharkhand (JHK)
Key Indicators Table 58: Key Indicators – JHK
Indicator Total Male Female
Total State Population, Lakhs
(2011) 329.9 169.3 160.6
Literacy Rate (2011) 66.4 76.8 52.0
Pop. in 18-23 age group (lakhs),
2011
Share to total state pop. (%)
36.0
(10.9%)
18.5
(10.9%)
17.5
(10.9%)
Share of state 18-23 pop. to All-
India 18-23 pop. (2011) 2.6% 2.5% 2.6%
Gross Enrollment Ratio 2 9.9 10.2 9.5
Share of Graduates & above in
total state population 5 5.4 8 2.6
Indicator Value
State GDP (2014) 3 ₹189,208 Cr
State HDI ranking 4 14 (among major
states)
Sex Ratio (2011)1 948
HE Expenditure as
a % of GSDP 3
0.14%
Student per capita
expenditure 3
₹425
Source: 1. Census 2011; 2. All India Survey of Higher Education, MHRD 2011-12 ; 3. RUSA, National Higher Education Mission, Sept 2013; 4. India Human Development Report 2011. 5. Status of Education & Vocational Training in India, NSSO 66th Round, 2010
Education Infrastructure
The break-up of number of universities in the state on the basis of type of university is shown below. Jharkhand ranks
19th among all states in India with 12 universities. JHK has 1.9% of all universities in the country.
There are no IITs or IISERs in the
state.
Key institutions in the state
1. NIT, Jamshedpur
2. Indian School of Mines, Dhanbad
3. IIM Ranchi
4. Central University of Jharkhand
The bar graph alongside reflects the break-up
of number of universities in JHK on the basis of
specialization. Jharkhand has 7 general
universities, but it lacks any medical, science
or fine arts college. The number of Degree
granting institutions in JHK is 14.
Figure 68: Universities by Type and Key institutions -JHK
1
1
3
7
0 2 4 6 8 10
Law
Agriculture
Technical
General
Figure 69: Universities by Specialization - JHK
1
1
1
1
1
7
0 2 4 6 8 10
Institution of National Importance
State Private University
Deemed University-Government
Central University
Deemed University-Govt Aided
State Public University
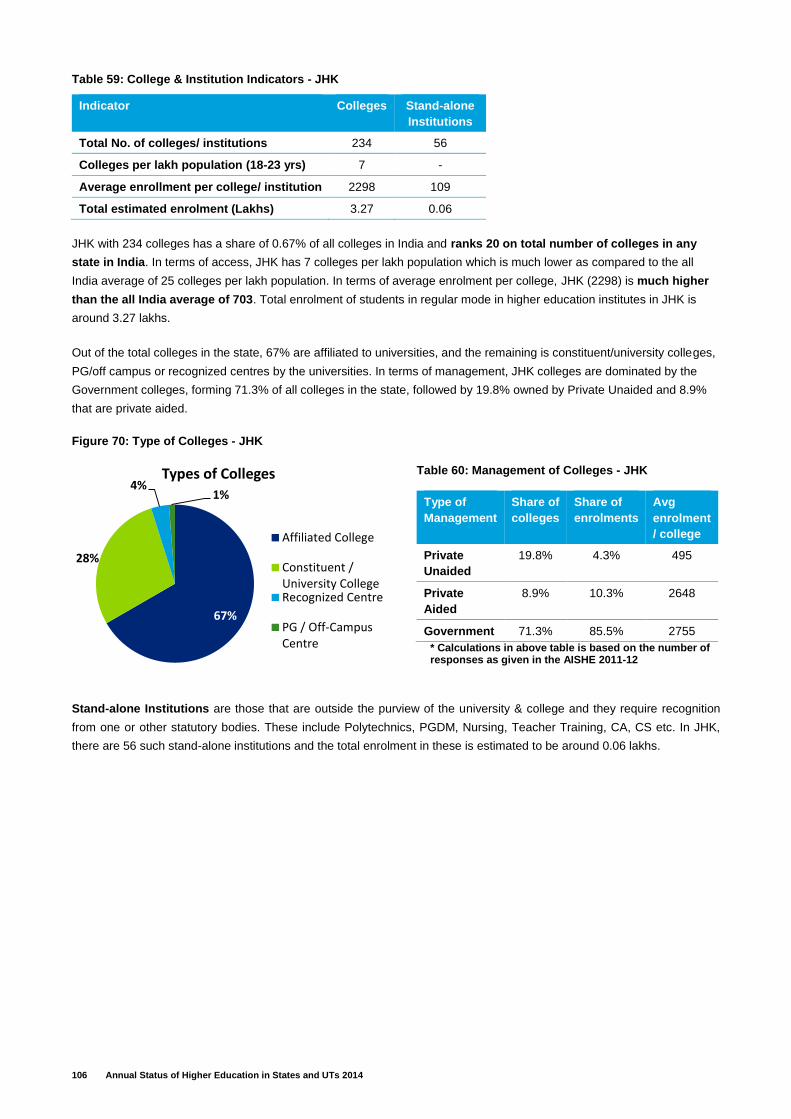
106 Annual Status of Higher Education in States and UTs 2014
Table 59: College & Institution Indicators - JHK
JHK with 234 colleges has a share of 0.67% of all colleges in India and ranks 20 on total number of colleges in any
state in India. In terms of access, JHK has 7 colleges per lakh population which is much lower as compared to the all
India average of 25 colleges per lakh population. In terms of average enrolment per college, JHK (2298) is much higher
than the all India average of 703. Total enrolment of students in regular mode in higher education institutes in JHK is
around 3.27 lakhs.
Out of the total colleges in the state, 67% are affiliated to universities, and the remaining is constituent/university colleges,
PG/off campus or recognized centres by the universities. In terms of management, JHK colleges are dominated by the
Government colleges, forming 71.3% of all colleges in the state, followed by 19.8% owned by Private Unaided and 8.9%
that are private aided.
Figure 70: Type of Colleges - JHK
Table 60: Management of Colleges - JHK
Type of
Management
Share of
colleges
Share of
enrolments
Avg
enrolment
/ college
Private
Unaided
19.8% 4.3% 495
Private
Aided
8.9% 10.3% 2648
Government 71.3% 85.5% 2755
* Calculations in above table is based on the number of responses as given in the AISHE 2011-12
Stand-alone Institutions are those that are outside the purview of the university & college and they require recognition
from one or other statutory bodies. These include Polytechnics, PGDM, Nursing, Teacher Training, CA, CS etc. In JHK,
there are 56 such stand-alone institutions and the total enrolment in these is estimated to be around 0.06 lakhs.
Indicator Colleges Stand-alone
Institutions
Total No. of colleges/ institutions 234 56
Colleges per lakh population (18-23 yrs) 7 -
Average enrollment per college/ institution 2298 109
Total estimated enrolment (Lakhs) 3.27 0.06
67%
28%
4%1%
Types of Colleges
Affiliated College
Constituent /University CollegeRecognized Centre
PG / Off-CampusCentre
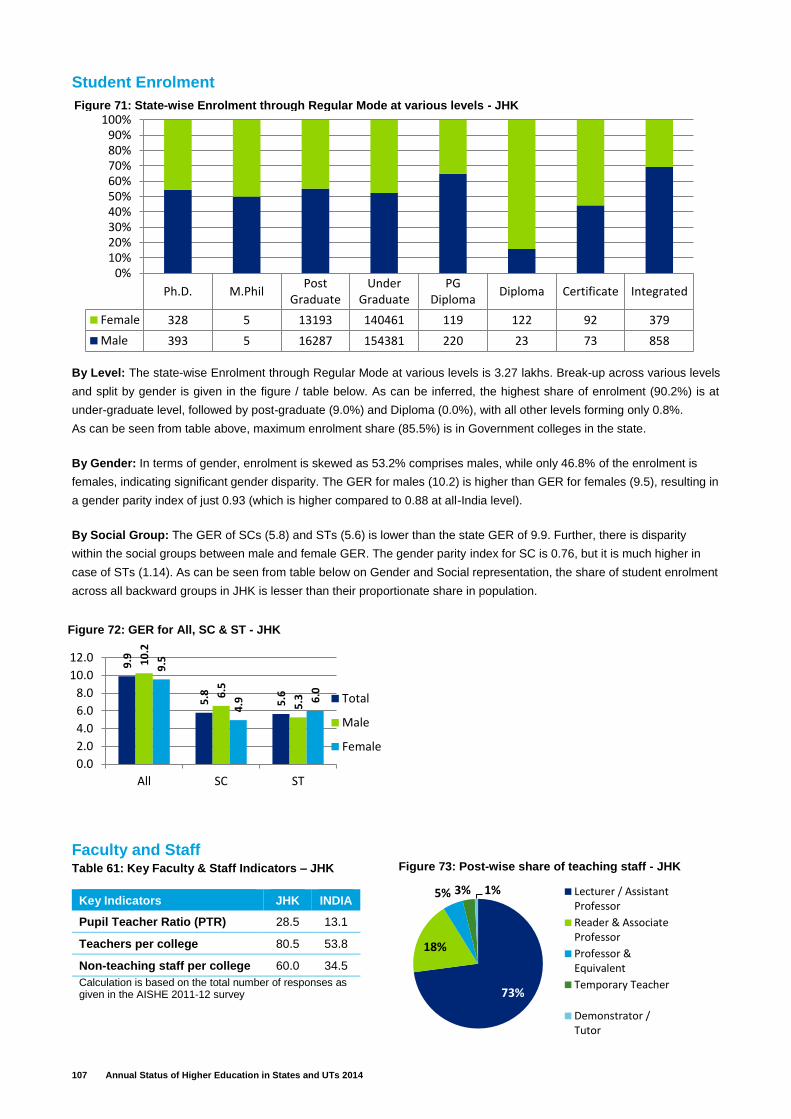
107 Annual Status of Higher Education in States and UTs 2014
Student Enrolment
By Level: The state-wise Enrolment through Regular Mode at various levels is 3.27 lakhs. Break-up across various levels
and split by gender is given in the figure / table below. As can be inferred, the highest share of enrolment (90.2%) is at
under-graduate level, followed by post-graduate (9.0%) and Diploma (0.0%), with all other levels forming only 0.8%.
As can be seen from table above, maximum enrolment share (85.5%) is in Government colleges in the state.
By Gender: In terms of gender, enrolment is skewed as 53.2% comprises males, while only 46.8% of the enrolment is
females, indicating significant gender disparity. The GER for males (10.2) is higher than GER for females (9.5), resulting in
a gender parity index of just 0.93 (which is higher compared to 0.88 at all-India level).
By Social Group: The GER of SCs (5.8) and STs (5.6) is lower than the state GER of 9.9. Further, there is disparity
within the social groups between male and female GER. The gender parity index for SC is 0.76, but it is much higher in
case of STs (1.14). As can be seen from table below on Gender and Social representation, the share of student enrolment
across all backward groups in JHK is lesser than their proportionate share in population.
Faculty and Staff Table 61: Key Faculty & Staff Indicators – JHK
Key Indicators JHK INDIA
Pupil Teacher Ratio (PTR) 28.5 13.1
Teachers per college 80.5 53.8
Non-teaching staff per college 60.0 34.5
Calculation is based on the total number of responses as given in the AISHE 2011-12 survey
Ph.D. M.PhilPost
GraduateUnder
GraduatePG
DiplomaDiploma Certificate Integrated
Female 328 5 13193 140461 119 122 92 379
Male 393 5 16287 154381 220 23 73 858
0%10%20%30%40%50%60%70%80%90%
100%Figure 71: State‐wise Enrolment through Regular Mode at various levels - JHK
9.9
5.8
5.6
10
.2
6.5
5.3
9.5
4.9 6
.0
0.0
2.0
4.0
6.0
8.0
10.0
12.0
All SC ST
Total
Male
Female
Figure 72: GER for All, SC & ST - JHK
73%
18%
5% 3% 1% Lecturer / AssistantProfessor
Reader & AssociateProfessor
Professor &Equivalent
Temporary Teacher
Demonstrator /Tutor
Figure 73: Post-wise share of teaching staff - JHK
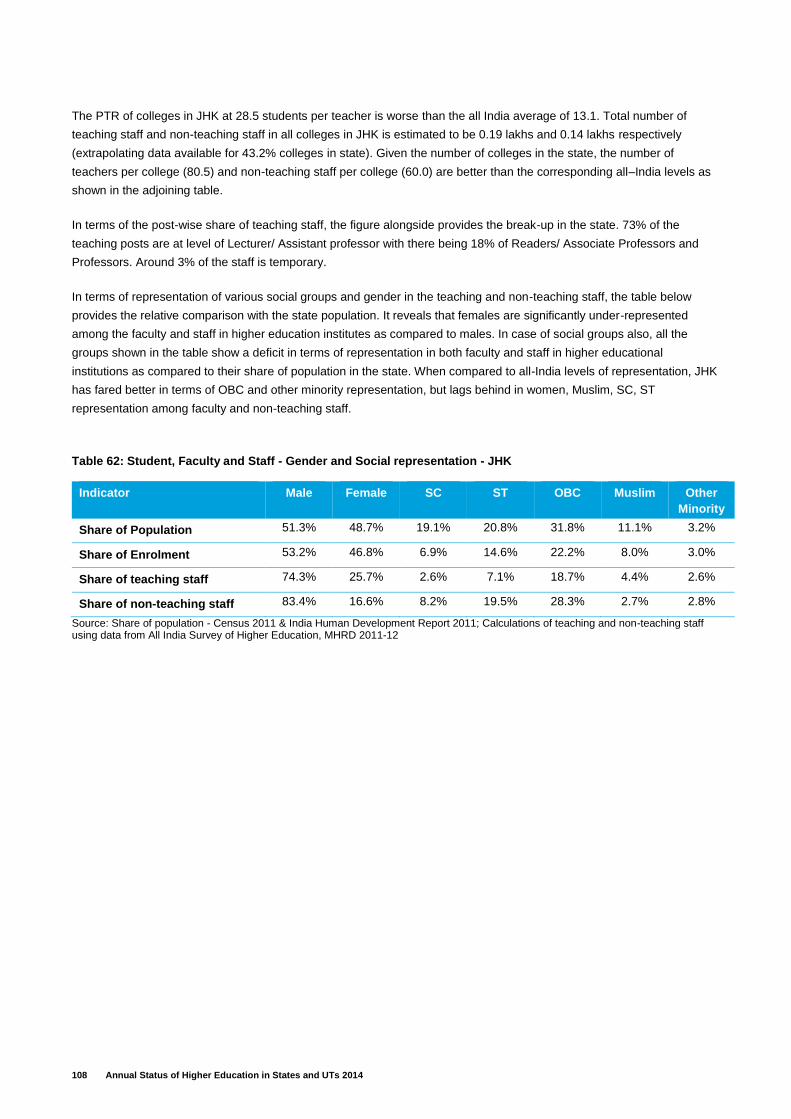
108 Annual Status of Higher Education in States and UTs 2014
The PTR of colleges in JHK at 28.5 students per teacher is worse than the all India average of 13.1. Total number of
teaching staff and non-teaching staff in all colleges in JHK is estimated to be 0.19 lakhs and 0.14 lakhs respectively
(extrapolating data available for 43.2% colleges in state). Given the number of colleges in the state, the number of
teachers per college (80.5) and non-teaching staff per college (60.0) are better than the corresponding all–India levels as
shown in the adjoining table.
In terms of the post-wise share of teaching staff, the figure alongside provides the break-up in the state. 73% of the
teaching posts are at level of Lecturer/ Assistant professor with there being 18% of Readers/ Associate Professors and
Professors. Around 3% of the staff is temporary.
In terms of representation of various social groups and gender in the teaching and non-teaching staff, the table below
provides the relative comparison with the state population. It reveals that females are significantly under-represented
among the faculty and staff in higher education institutes as compared to males. In case of social groups also, all the
groups shown in the table show a deficit in terms of representation in both faculty and staff in higher educational
institutions as compared to their share of population in the state. When compared to all-India levels of representation, JHK
has fared better in terms of OBC and other minority representation, but lags behind in women, Muslim, SC, ST
representation among faculty and non-teaching staff.
Table 62: Student, Faculty and Staff - Gender and Social representation - JHK
Indicator Male Female SC ST OBC Muslim Other
Minority
Share of Population 51.3% 48.7% 19.1% 20.8% 31.8% 11.1% 3.2%
Share of Enrolment 53.2% 46.8% 6.9% 14.6% 22.2% 8.0% 3.0%
Share of teaching staff 74.3% 25.7% 2.6% 7.1% 18.7% 4.4% 2.6%
Share of non-teaching staff 83.4% 16.6% 8.2% 19.5% 28.3% 2.7% 2.8%
Source: Share of population - Census 2011 & India Human Development Report 2011; Calculations of teaching and non-teaching staff using data from All India Survey of Higher Education, MHRD 2011-12
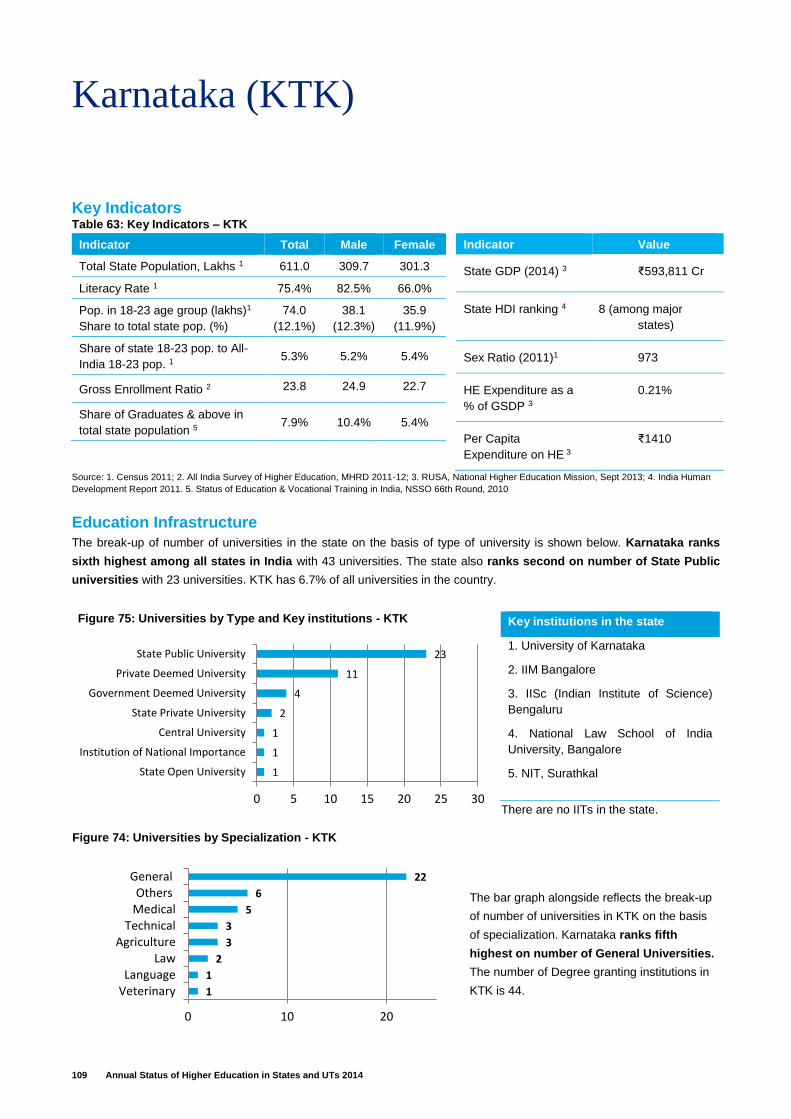
109 Annual Status of Higher Education in States and UTs 2014
Karnataka (KTK)
Key Indicators Table 63: Key Indicators – KTK
Indicator Total Male Female
Total State Population, Lakhs 1 611.0 309.7 301.3
Literacy Rate 1 75.4% 82.5% 66.0%
Pop. in 18-23 age group (lakhs)1
Share to total state pop. (%)
74.0
(12.1%)
38.1
(12.3%)
35.9
(11.9%)
Share of state 18-23 pop. to All-
India 18-23 pop. 1 5.3% 5.2% 5.4%
Gross Enrollment Ratio 2 23.8 24.9 22.7
Share of Graduates & above in
total state population 5 7.9% 10.4% 5.4%
Indicator Value
State GDP (2014) 3 ₹593,811 Cr
State HDI ranking 4 8 (among major
states)
Sex Ratio (2011)1 973
HE Expenditure as a
% of GSDP 3
0.21%
Per Capita
Expenditure on HE 3
₹1410
Source: 1. Census 2011; 2. All India Survey of Higher Education, MHRD 2011-12; 3. RUSA, National Higher Education Mission, Sept 2013; 4. India Human
Development Report 2011. 5. Status of Education & Vocational Training in India, NSSO 66th Round, 2010
Education Infrastructure
The break-up of number of universities in the state on the basis of type of university is shown below. Karnataka ranks
sixth highest among all states in India with 43 universities. The state also ranks second on number of State Public
universities with 23 universities. KTK has 6.7% of all universities in the country.
There are no IITs in the state.
Key institutions in the state
1. University of Karnataka
2. IIM Bangalore
3. IISc (Indian Institute of Science)
Bengaluru
4. National Law School of India
University, Bangalore
5. NIT, Surathkal
The bar graph alongside reflects the break-up
of number of universities in KTK on the basis
of specialization. Karnataka ranks fifth
highest on number of General Universities.
The number of Degree granting institutions in
KTK is 44.
Figure 75: Universities by Type and Key institutions - KTK
1
1
2
3
3
5
6
22
0 10 20
VeterinaryLanguage
LawAgriculture
TechnicalMedicalOthers
General
Figure 74: Universities by Specialization - KTK
1
1
1
2
4
11
23
0 5 10 15 20 25 30
State Open University
Institution of National Importance
Central University
State Private University
Government Deemed University
Private Deemed University
State Public University
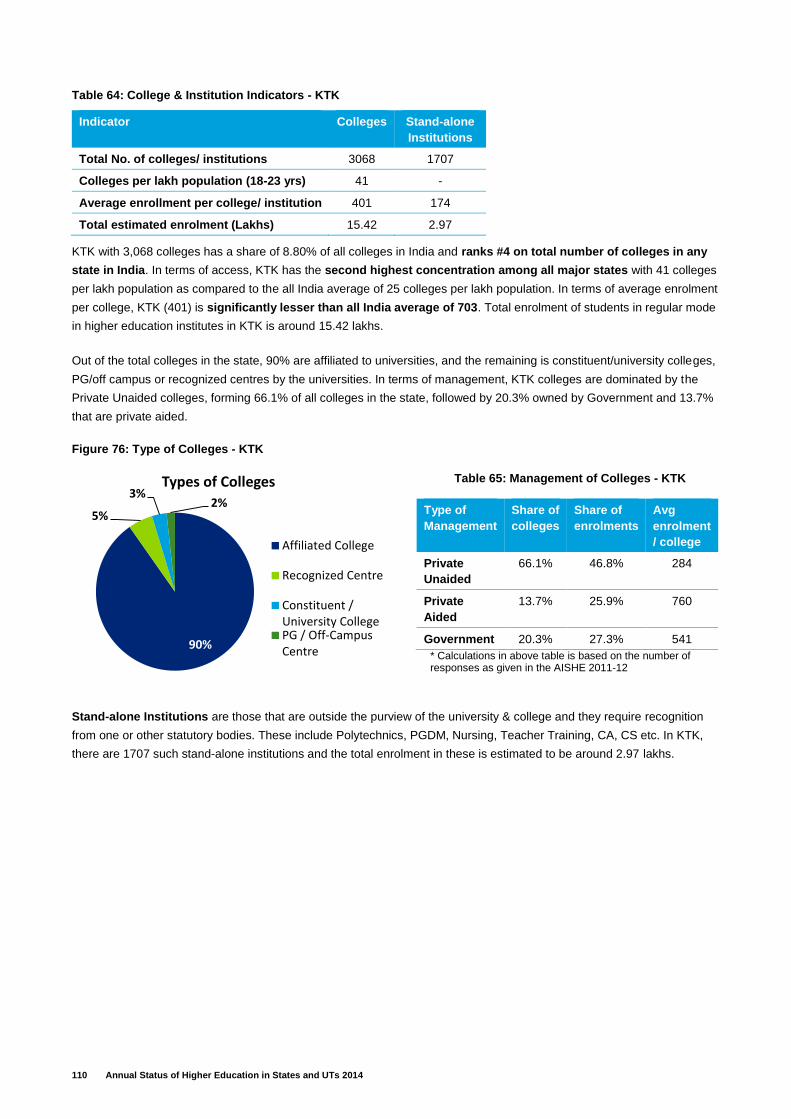
110 Annual Status of Higher Education in States and UTs 2014
Table 64: College & Institution Indicators - KTK
KTK with 3,068 colleges has a share of 8.80% of all colleges in India and ranks #4 on total number of colleges in any
state in India. In terms of access, KTK has the second highest concentration among all major states with 41 colleges
per lakh population as compared to the all India average of 25 colleges per lakh population. In terms of average enrolment
per college, KTK (401) is significantly lesser than all India average of 703. Total enrolment of students in regular mode
in higher education institutes in KTK is around 15.42 lakhs.
Out of the total colleges in the state, 90% are affiliated to universities, and the remaining is constituent/university colleges,
PG/off campus or recognized centres by the universities. In terms of management, KTK colleges are dominated by the
Private Unaided colleges, forming 66.1% of all colleges in the state, followed by 20.3% owned by Government and 13.7%
that are private aided.
Figure 76: Type of Colleges - KTK
Table 65: Management of Colleges - KTK
Type of
Management
Share of
colleges
Share of
enrolments
Avg
enrolment
/ college
Private
Unaided
66.1% 46.8% 284
Private
Aided
13.7% 25.9% 760
Government 20.3% 27.3% 541
* Calculations in above table is based on the number of responses as given in the AISHE 2011-12
Stand-alone Institutions are those that are outside the purview of the university & college and they require recognition
from one or other statutory bodies. These include Polytechnics, PGDM, Nursing, Teacher Training, CA, CS etc. In KTK,
there are 1707 such stand-alone institutions and the total enrolment in these is estimated to be around 2.97 lakhs.
Indicator Colleges Stand-alone
Institutions
Total No. of colleges/ institutions 3068 1707
Colleges per lakh population (18-23 yrs) 41 -
Average enrollment per college/ institution 401 174
Total estimated enrolment (Lakhs) 15.42 2.97
90%
5%
3%2%
Types of Colleges
Affiliated College
Recognized Centre
Constituent /University CollegePG / Off-CampusCentre
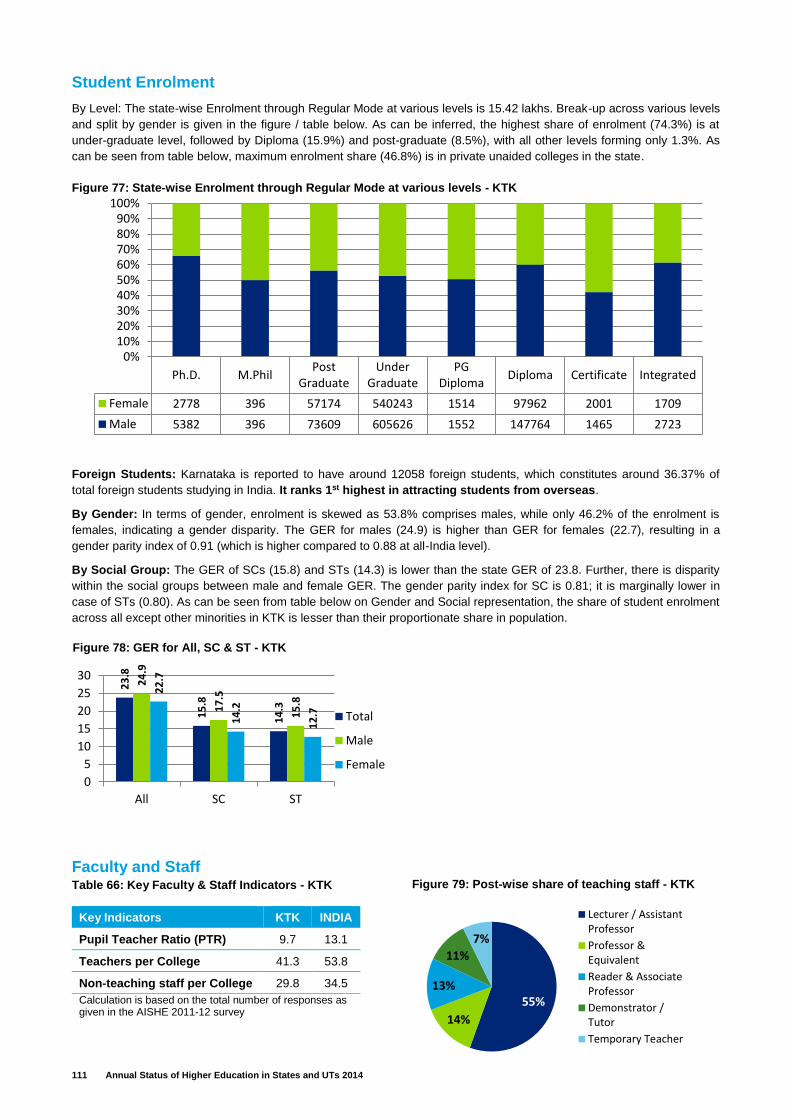
111 Annual Status of Higher Education in States and UTs 2014
Student Enrolment
By Level: The state-wise Enrolment through Regular Mode at various levels is 15.42 lakhs. Break-up across various levels
and split by gender is given in the figure / table below. As can be inferred, the highest share of enrolment (74.3%) is at
under-graduate level, followed by Diploma (15.9%) and post-graduate (8.5%), with all other levels forming only 1.3%. As
can be seen from table below, maximum enrolment share (46.8%) is in private unaided colleges in the state.
Foreign Students: Karnataka is reported to have around 12058 foreign students, which constitutes around 36.37% of
total foreign students studying in India. It ranks 1st highest in attracting students from overseas.
By Gender: In terms of gender, enrolment is skewed as 53.8% comprises males, while only 46.2% of the enrolment is
females, indicating a gender disparity. The GER for males (24.9) is higher than GER for females (22.7), resulting in a
gender parity index of 0.91 (which is higher compared to 0.88 at all-India level).
By Social Group: The GER of SCs (15.8) and STs (14.3) is lower than the state GER of 23.8. Further, there is disparity
within the social groups between male and female GER. The gender parity index for SC is 0.81; it is marginally lower in
case of STs (0.80). As can be seen from table below on Gender and Social representation, the share of student enrolment
across all except other minorities in KTK is lesser than their proportionate share in population.
Faculty and Staff Table 66: Key Faculty & Staff Indicators - KTK
Key Indicators KTK INDIA
Pupil Teacher Ratio (PTR) 9.7 13.1
Teachers per College 41.3 53.8
Non-teaching staff per College 29.8 34.5
Calculation is based on the total number of responses as given in the AISHE 2011-12 survey
Ph.D. M.PhilPost
GraduateUnder
GraduatePG
DiplomaDiploma Certificate Integrated
Female 2778 396 57174 540243 1514 97962 2001 1709
Male 5382 396 73609 605626 1552 147764 1465 2723
0%10%20%30%40%50%60%70%80%90%
100%Figure 77: State‐wise Enrolment through Regular Mode at various levels - KTK
23
.8
15
.8
14
.3
24
.9
17
.5
15
.8
22
.7
14
.2
12
.7
0
5
10
15
20
25
30
All SC ST
Total
Male
Female
Figure 78: GER for All, SC & ST - KTK
55%
14%
13%
11%
7%
Lecturer / AssistantProfessor
Professor &Equivalent
Reader & AssociateProfessor
Demonstrator /Tutor
Temporary Teacher
Figure 79: Post-wise share of teaching staff - KTK
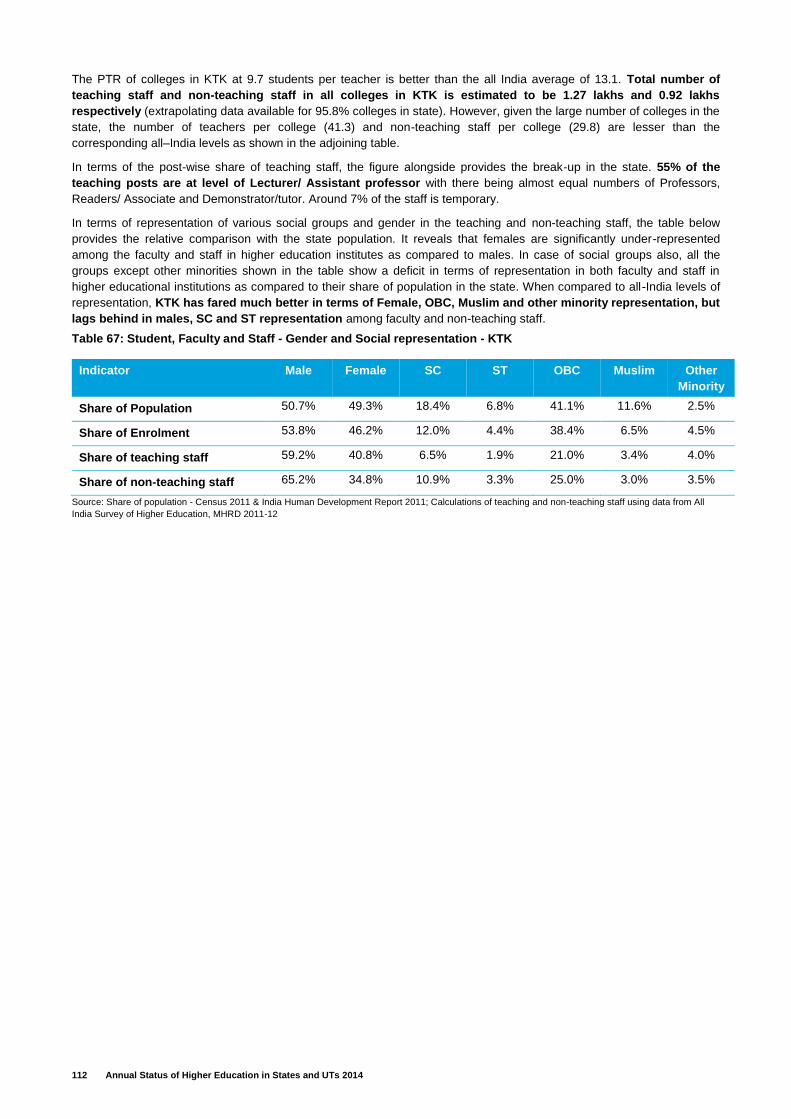
112 Annual Status of Higher Education in States and UTs 2014
The PTR of colleges in KTK at 9.7 students per teacher is better than the all India average of 13.1. Total number of
teaching staff and non-teaching staff in all colleges in KTK is estimated to be 1.27 lakhs and 0.92 lakhs
respectively (extrapolating data available for 95.8% colleges in state). However, given the large number of colleges in the
state, the number of teachers per college (41.3) and non-teaching staff per college (29.8) are lesser than the
corresponding all–India levels as shown in the adjoining table.
In terms of the post-wise share of teaching staff, the figure alongside provides the break-up in the state. 55% of the
teaching posts are at level of Lecturer/ Assistant professor with there being almost equal numbers of Professors,
Readers/ Associate and Demonstrator/tutor. Around 7% of the staff is temporary.
In terms of representation of various social groups and gender in the teaching and non-teaching staff, the table below
provides the relative comparison with the state population. It reveals that females are significantly under-represented
among the faculty and staff in higher education institutes as compared to males. In case of social groups also, all the
groups except other minorities shown in the table show a deficit in terms of representation in both faculty and staff in
higher educational institutions as compared to their share of population in the state. When compared to all-India levels of
representation, KTK has fared much better in terms of Female, OBC, Muslim and other minority representation, but
lags behind in males, SC and ST representation among faculty and non-teaching staff.
Table 67: Student, Faculty and Staff - Gender and Social representation - KTK
Indicator Male Female SC ST OBC Muslim Other
Minority
Share of Population 50.7% 49.3% 18.4% 6.8% 41.1% 11.6% 2.5%
Share of Enrolment 53.8% 46.2% 12.0% 4.4% 38.4% 6.5% 4.5%
Share of teaching staff 59.2% 40.8% 6.5% 1.9% 21.0% 3.4% 4.0%
Share of non-teaching staff 65.2% 34.8% 10.9% 3.3% 25.0% 3.0% 3.5%
Source: Share of population - Census 2011 & India Human Development Report 2011; Calculations of teaching and non-teaching staff using data from All
India Survey of Higher Education, MHRD 2011-12
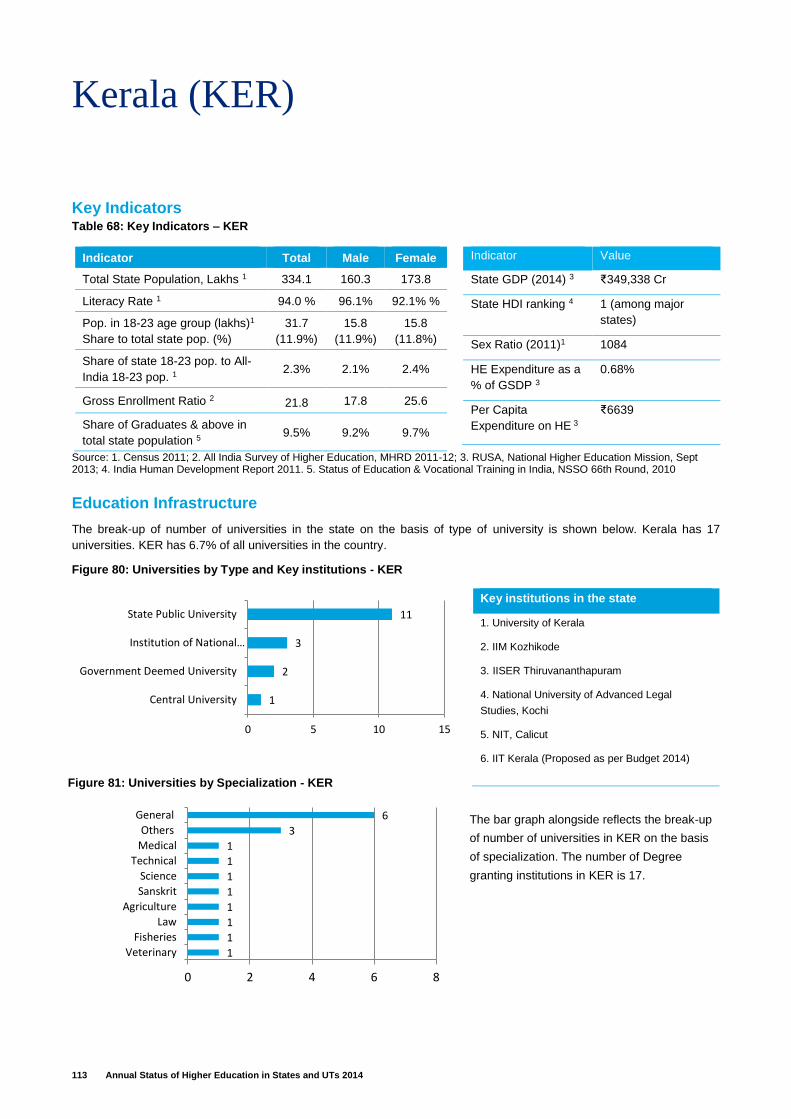
113 Annual Status of Higher Education in States and UTs 2014
Kerala (KER)
Key Indicators Table 68: Key Indicators – KER
Indicator Total Male Female
Total State Population, Lakhs 1 334.1 160.3 173.8
Literacy Rate 1 94.0 % 96.1% 92.1% %
Pop. in 18-23 age group (lakhs)1
Share to total state pop. (%)
31.7
(11.9%)
15.8
(11.9%)
15.8
(11.8%)
Share of state 18-23 pop. to All-
India 18-23 pop. 1 2.3% 2.1% 2.4%
Gross Enrollment Ratio 2 21.8 17.8 25.6
Share of Graduates & above in
total state population 5 9.5% 9.2% 9.7%
Indicator Value
State GDP (2014) 3 ₹349,338 Cr
State HDI ranking 4 1 (among major
states)
Sex Ratio (2011)1 1084
HE Expenditure as a
% of GSDP 3
0.68%
Per Capita
Expenditure on HE 3
₹6639
Source: 1. Census 2011; 2. All India Survey of Higher Education, MHRD 2011-12; 3. RUSA, National Higher Education Mission, Sept 2013; 4. India Human Development Report 2011. 5. Status of Education & Vocational Training in India, NSSO 66th Round, 2010
Education Infrastructure
The break-up of number of universities in the state on the basis of type of university is shown below. Kerala has 17
universities. KER has 6.7% of all universities in the country.
Key institutions in the state
1. University of Kerala
2. IIM Kozhikode
3. IISER Thiruvananthapuram
4. National University of Advanced Legal
Studies, Kochi
5. NIT, Calicut
6. IIT Kerala (Proposed as per Budget 2014)
The bar graph alongside reflects the break-up
of number of universities in KER on the basis
of specialization. The number of Degree
granting institutions in KER is 17.
Figure 80: Universities by Type and Key institutions - KER
1
1
1
1
1
1
1
1
3
6
0 2 4 6 8
Veterinary
Fisheries
Law
Agriculture
Sanskrit
Science
Technical
Medical
Others
General
Figure 81: Universities by Specialization - KER
1
2
3
11
0 5 10 15
Central University
Government Deemed University
Institution of National…
State Public University

114 Annual Status of Higher Education in States and UTs 2014
Table 69: College & Institution Indicators - KER
KER with 1,033 colleges has a share of 2.96% of all colleges in India. In terms of access, KER has the fifth highest
concentration among all major states with 33 colleges per lakh population as compared to the all India average of 25
colleges per lakh population. In terms of average enrolment per college, KER (538) is significantly lesser than all India
average of 703. Total enrolment of students in regular mode in higher education institutes in KER is around 6.20 lakhs.
Out of the total colleges in the state, 91% are affiliated to universities, and the remaining is constituent/university colleges,
PG/off campus or recognized centres by the universities. In terms of management, KER colleges are dominated by the
Private Unaided colleges, forming 57.4% of all colleges in the state, followed by 23.5% Private Aided and 19.2% that are
owned by the government.
Figure 82: Type of Colleges - KER
Table 70: Management of Colleges - KER
Type of
Management
Share of
colleges
Share of
enrolments
Avg
enrolment
/ college
Private
Unaided
57.4% 38.8% 364
Private
Aided
23.5% 42.9% 985
Government 19.2% 18.3% 514
* Calculations in above table is based on the number of responses as given in the AISHE 2011-12
Stand-alone Institutions are those that are outside the purview of the university & college and they require recognition
from one or other statutory bodies. These include Polytechnics, PGDM, Nursing, Teacher Training, CA, CS etc. In KER,
there are 593 such stand-alone institutions and the total enrolment in these is estimated to be around 0.96 lakhs.
Indicator Colleges Stand-alone
Institutions
Total No. of colleges/ institutions 1033 593
Colleges per lakh population (18-23 yrs) 33 -
Average enrollment per college/ institution 538 162
Total estimated enrolment (Lakhs) 6.20 0.96
91%
4%
3%2%
Types of Colleges
Affiliated College
Recognized Centre
Constituent /University CollegePG / Off-CampusCentre
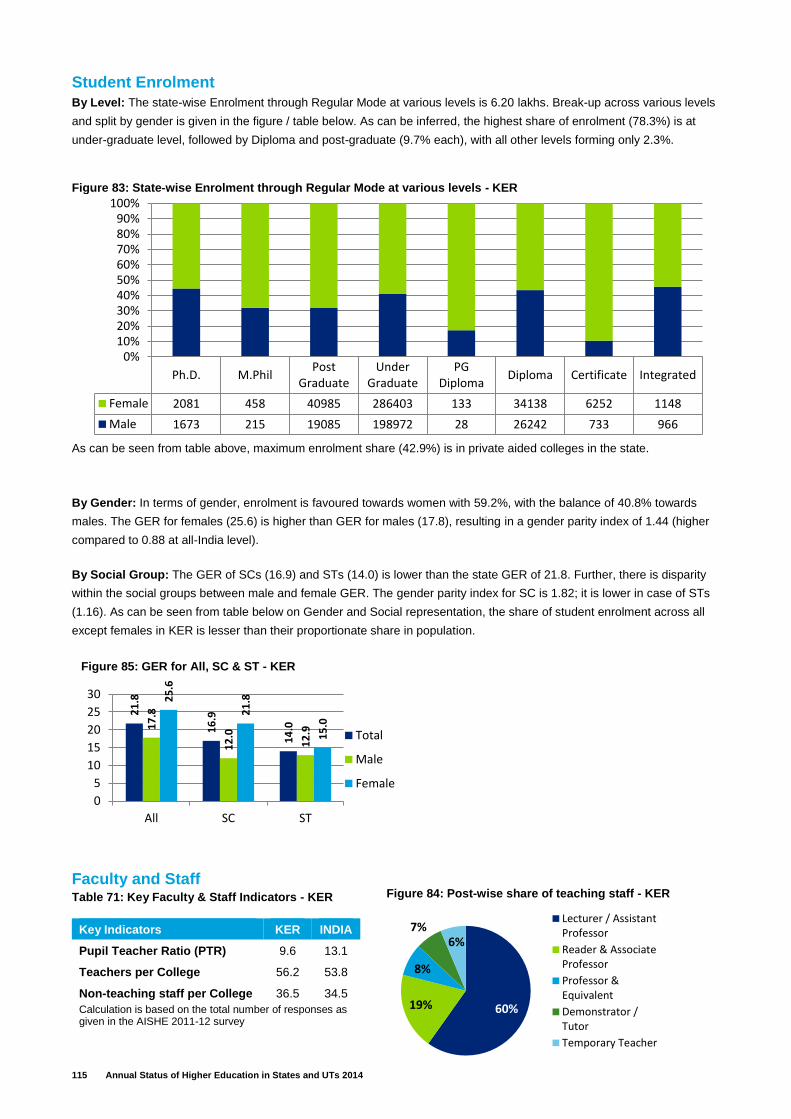
115 Annual Status of Higher Education in States and UTs 2014
Student Enrolment
By Level: The state-wise Enrolment through Regular Mode at various levels is 6.20 lakhs. Break-up across various levels
and split by gender is given in the figure / table below. As can be inferred, the highest share of enrolment (78.3%) is at
under-graduate level, followed by Diploma and post-graduate (9.7% each), with all other levels forming only 2.3%.
As can be seen from table above, maximum enrolment share (42.9%) is in private aided colleges in the state.
By Gender: In terms of gender, enrolment is favoured towards women with 59.2%, with the balance of 40.8% towards
males. The GER for females (25.6) is higher than GER for males (17.8), resulting in a gender parity index of 1.44 (higher
compared to 0.88 at all-India level).
By Social Group: The GER of SCs (16.9) and STs (14.0) is lower than the state GER of 21.8. Further, there is disparity
within the social groups between male and female GER. The gender parity index for SC is 1.82; it is lower in case of STs
(1.16). As can be seen from table below on Gender and Social representation, the share of student enrolment across all
except females in KER is lesser than their proportionate share in population.
Faculty and Staff Table 71: Key Faculty & Staff Indicators - KER
Key Indicators KER INDIA
Pupil Teacher Ratio (PTR) 9.6 13.1
Teachers per College 56.2 53.8
Non-teaching staff per College 36.5 34.5
Calculation is based on the total number of responses as given in the AISHE 2011-12 survey
Ph.D. M.PhilPost
GraduateUnder
GraduatePG
DiplomaDiploma Certificate Integrated
Female 2081 458 40985 286403 133 34138 6252 1148
Male 1673 215 19085 198972 28 26242 733 966
0%10%20%30%40%50%60%70%80%90%
100%Figure 83: State‐wise Enrolment through Regular Mode at various levels - KER
21
.8
16
.9
14
.017
.8
12
.0
12
.9
25
.6
21
.8
15
.0
0
5
10
15
20
25
30
All SC ST
Total
Male
Female
Figure 85: GER for All, SC & ST - KER
60%19%
8%
7%6%
Lecturer / AssistantProfessor
Reader & AssociateProfessor
Professor &Equivalent
Demonstrator /Tutor
Temporary Teacher
Figure 84: Post-wise share of teaching staff - KER

116 Annual Status of Higher Education in States and UTs 2014
The PTR of colleges in KER at 9.6 students per teacher is better than the all India average of 13.1. Total number of
teaching staff and non-teaching staff in all colleges in KER is estimated to be 0.58 lakhs and 0.38 lakhs respectively
(extrapolating data available for 76.8% colleges in state). The number of teachers per college (56.2) and non-teaching
staff per college (36.5) are higher than the corresponding all–India levels as shown in the adjoining table.
In terms of the post-wise share of teaching staff, the figure alongside provides the break-up in the state. 60% of the
teaching posts are at level of Lecturer/ Assistant professor, 19% being reader & Associate Professor with there
being almost equal numbers of Professors and Demonstrator/tutor. Around 6% of the staff is temporary.
In terms of representation of various social groups and gender in the teaching and non-teaching staff, the table below
provides the relative comparison with the state population. It reveals that females are significantly under-represented
among the faculty and staff in higher education institutes as compared to males. In case of social groups also, all the
groups except males (non-teaching) and females (teaching) as shown in the table show a deficit in terms of representation
in both faculty and staff in higher educational institutions as compared to their share of population in the state. When
compared to all-India levels of representation, KER has fared better in terms of Female, OBC, Muslim and other
minority representation, but lags behind in SC and ST representation among faculty and non-teaching staff.
Table 72: Student, Faculty and Staff - Gender and Social representation - KER
Indicator Male Female SC ST OBC Muslim Other
Minority
Share of Population 48.0% 52.0% 10.3% 1.1% 61.5% 24.1% 18.6%
Share of Enrolment 40.8% 59.2% 7.0% 1.0% 31.7% 16.7% 17.3%
Share of teaching staff 45.3% 54.7% 2.7% 0.2% 25.0% 6.8% 17.2%
Share of non-teaching staff 58.3% 41.7% 4.9% 0.9% 31.3% 5.9% 13.1%
Source: Share of population - Census 2011 & India Human Development Report 2011; Calculations of teaching and non-teaching staff using data from All
India Survey of Higher Education, MHRD 2011-12
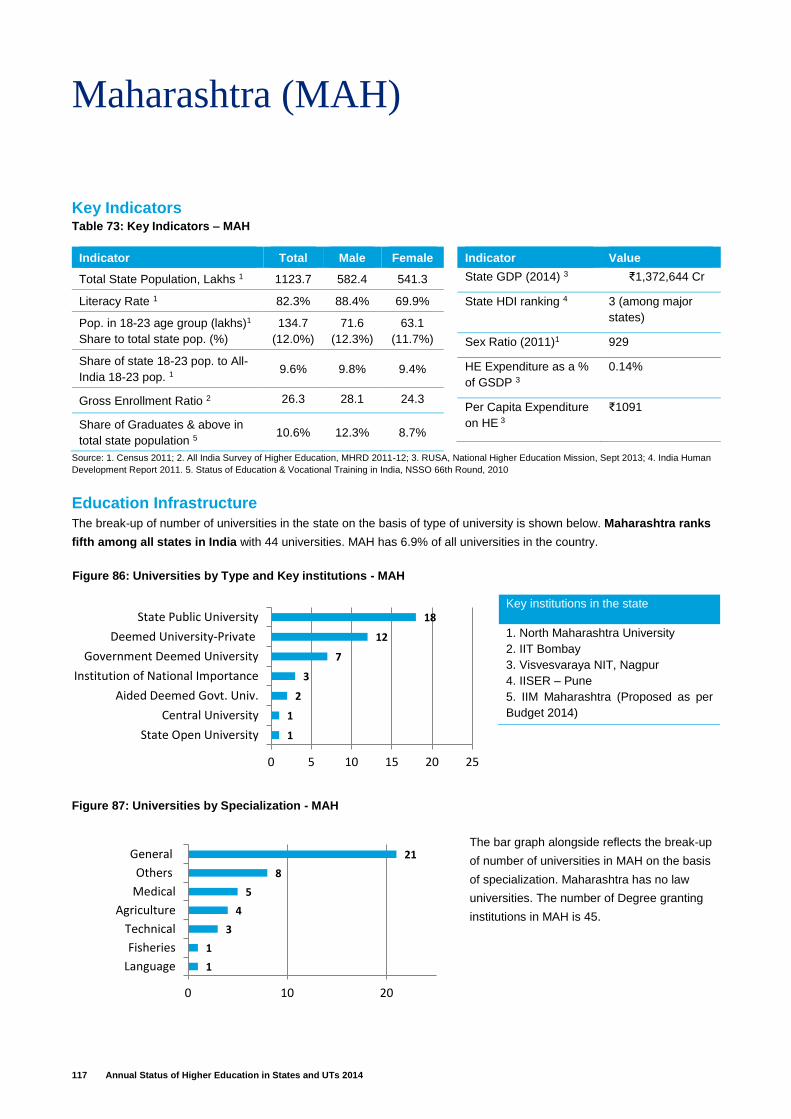
117 Annual Status of Higher Education in States and UTs 2014
Maharashtra (MAH)
Key Indicators Table 73: Key Indicators – MAH
Indicator Total Male Female
Total State Population, Lakhs 1 1123.7 582.4 541.3
Literacy Rate 1 82.3% 88.4% 69.9%
Pop. in 18-23 age group (lakhs)1
Share to total state pop. (%)
134.7
(12.0%)
71.6
(12.3%)
63.1
(11.7%)
Share of state 18-23 pop. to All-
India 18-23 pop. 1 9.6% 9.8% 9.4%
Gross Enrollment Ratio 2 26.3 28.1 24.3
Share of Graduates & above in
total state population 5 10.6% 12.3% 8.7%
Indicator Value
State GDP (2014) 3 ₹1,372,644 Cr
State HDI ranking 4 3 (among major
states)
Sex Ratio (2011)1 929
HE Expenditure as a %
of GSDP 3
0.14%
Per Capita Expenditure
on HE 3
₹1091
Source: 1. Census 2011; 2. All India Survey of Higher Education, MHRD 2011-12; 3. RUSA, National Higher Education Mission, Sept 2013; 4. India Human
Development Report 2011. 5. Status of Education & Vocational Training in India, NSSO 66th Round, 2010
Education Infrastructure
The break-up of number of universities in the state on the basis of type of university is shown below. Maharashtra ranks
fifth among all states in India with 44 universities. MAH has 6.9% of all universities in the country.
Key institutions in the state
1. North Maharashtra University
2. IIT Bombay
3. Visvesvaraya NIT, Nagpur
4. IISER – Pune
5. IIM Maharashtra (Proposed as per
Budget 2014)
The bar graph alongside reflects the break-up
of number of universities in MAH on the basis
of specialization. Maharashtra has no law
universities. The number of Degree granting
institutions in MAH is 45.
Figure 86: Universities by Type and Key institutions - MAH
1
1
3
4
5
8
21
0 10 20
Language
Fisheries
Technical
Agriculture
Medical
Others
General
Figure 87: Universities by Specialization - MAH
1
1
2
3
7
12
18
0 5 10 15 20 25
State Open University
Central University
Aided Deemed Govt. Univ.
Institution of National Importance
Government Deemed University
Deemed University-Private
State Public University
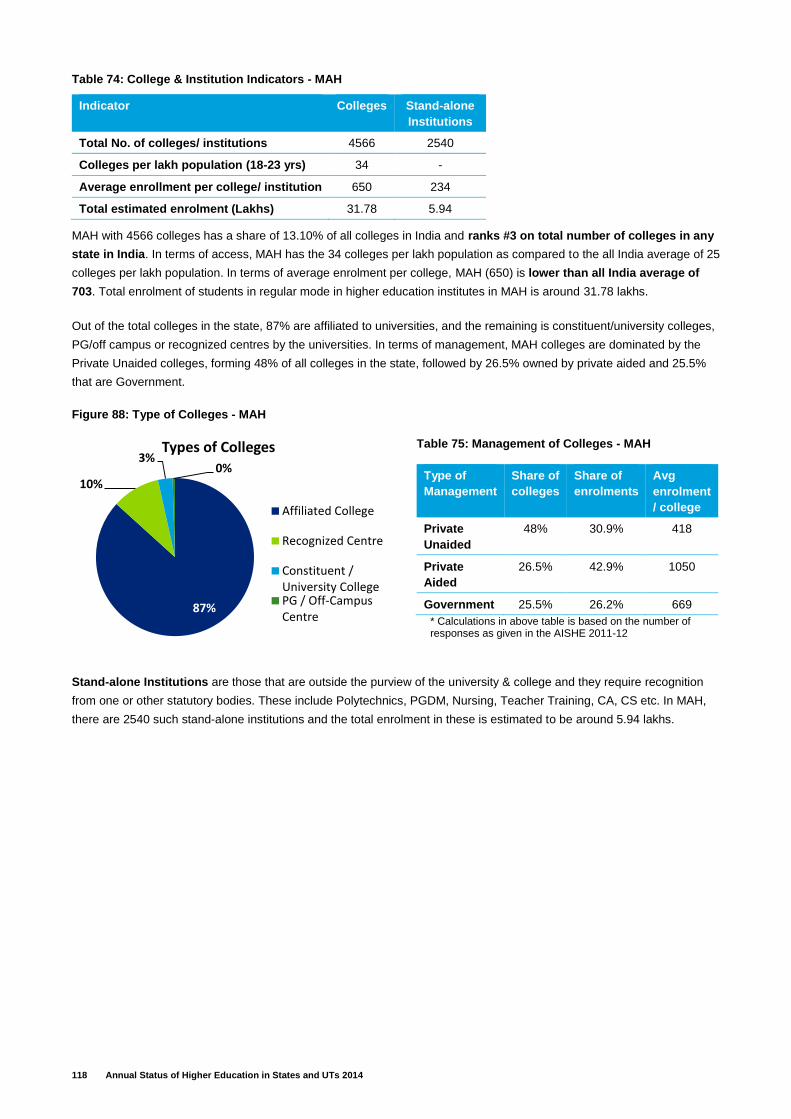
118 Annual Status of Higher Education in States and UTs 2014
Table 74: College & Institution Indicators - MAH
MAH with 4566 colleges has a share of 13.10% of all colleges in India and ranks #3 on total number of colleges in any
state in India. In terms of access, MAH has the 34 colleges per lakh population as compared to the all India average of 25
colleges per lakh population. In terms of average enrolment per college, MAH (650) is lower than all India average of
703. Total enrolment of students in regular mode in higher education institutes in MAH is around 31.78 lakhs.
Out of the total colleges in the state, 87% are affiliated to universities, and the remaining is constituent/university colleges,
PG/off campus or recognized centres by the universities. In terms of management, MAH colleges are dominated by the
Private Unaided colleges, forming 48% of all colleges in the state, followed by 26.5% owned by private aided and 25.5%
that are Government.
Figure 88: Type of Colleges - MAH
Table 75: Management of Colleges - MAH
Type of
Management
Share of
colleges
Share of
enrolments
Avg
enrolment
/ college
Private
Unaided
48% 30.9% 418
Private
Aided
26.5% 42.9% 1050
Government 25.5% 26.2% 669
* Calculations in above table is based on the number of responses as given in the AISHE 2011-12
Stand-alone Institutions are those that are outside the purview of the university & college and they require recognition
from one or other statutory bodies. These include Polytechnics, PGDM, Nursing, Teacher Training, CA, CS etc. In MAH,
there are 2540 such stand-alone institutions and the total enrolment in these is estimated to be around 5.94 lakhs.
Indicator Colleges Stand-alone
Institutions
Total No. of colleges/ institutions 4566 2540
Colleges per lakh population (18-23 yrs) 34 -
Average enrollment per college/ institution 650 234
Total estimated enrolment (Lakhs) 31.78 5.94
87%
10%
3%0%
Types of Colleges
Affiliated College
Recognized Centre
Constituent /University CollegePG / Off-CampusCentre
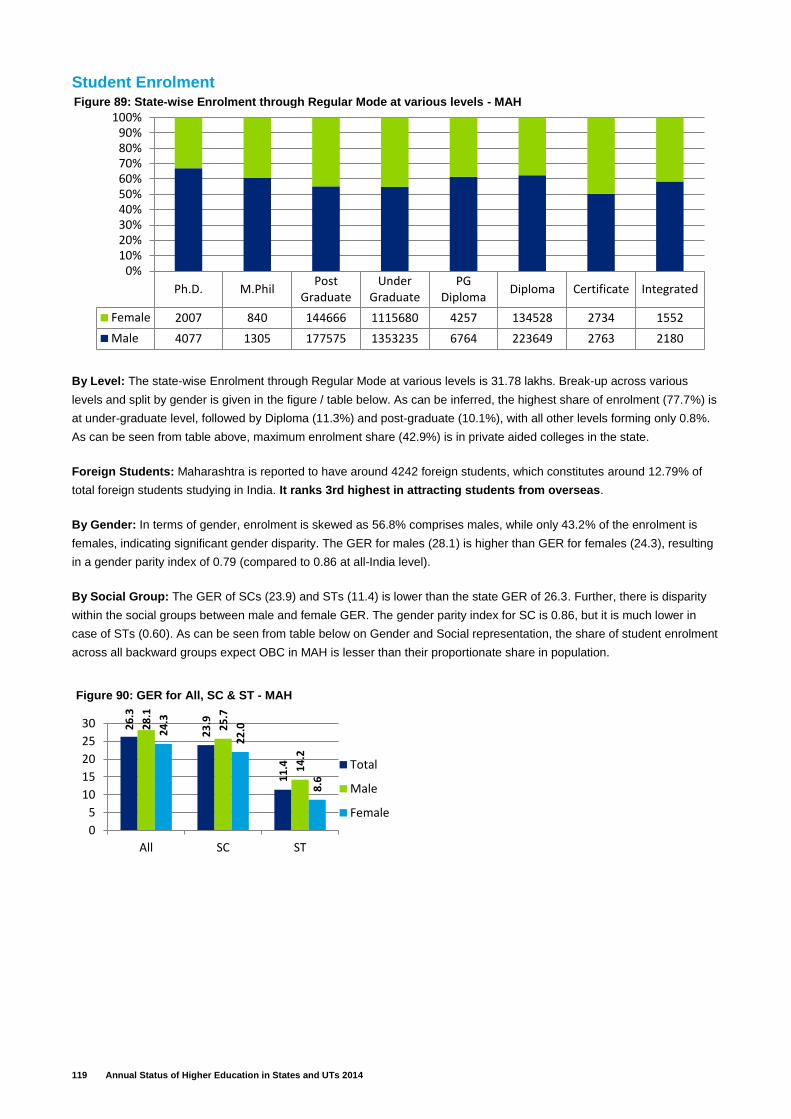
119 Annual Status of Higher Education in States and UTs 2014
Student Enrolment
By Level: The state-wise Enrolment through Regular Mode at various levels is 31.78 lakhs. Break-up across various
levels and split by gender is given in the figure / table below. As can be inferred, the highest share of enrolment (77.7%) is
at under-graduate level, followed by Diploma (11.3%) and post-graduate (10.1%), with all other levels forming only 0.8%.
As can be seen from table above, maximum enrolment share (42.9%) is in private aided colleges in the state.
Foreign Students: Maharashtra is reported to have around 4242 foreign students, which constitutes around 12.79% of
total foreign students studying in India. It ranks 3rd highest in attracting students from overseas.
By Gender: In terms of gender, enrolment is skewed as 56.8% comprises males, while only 43.2% of the enrolment is
females, indicating significant gender disparity. The GER for males (28.1) is higher than GER for females (24.3), resulting
in a gender parity index of 0.79 (compared to 0.86 at all-India level).
By Social Group: The GER of SCs (23.9) and STs (11.4) is lower than the state GER of 26.3. Further, there is disparity
within the social groups between male and female GER. The gender parity index for SC is 0.86, but it is much lower in
case of STs (0.60). As can be seen from table below on Gender and Social representation, the share of student enrolment
across all backward groups expect OBC in MAH is lesser than their proportionate share in population.
Ph.D. M.PhilPost
GraduateUnder
GraduatePG
DiplomaDiploma Certificate Integrated
Female 2007 840 144666 1115680 4257 134528 2734 1552
Male 4077 1305 177575 1353235 6764 223649 2763 2180
0%10%20%30%40%50%60%70%80%90%
100%Figure 89: State‐wise Enrolment through Regular Mode at various levels - MAH
26
.3
23
.9
11
.4
28
.1
25
.7
14
.2
24
.3
22
.0
8.6
0
5
10
15
20
25
30
All SC ST
Total
Male
Female
Figure 90: GER for All, SC & ST - MAH
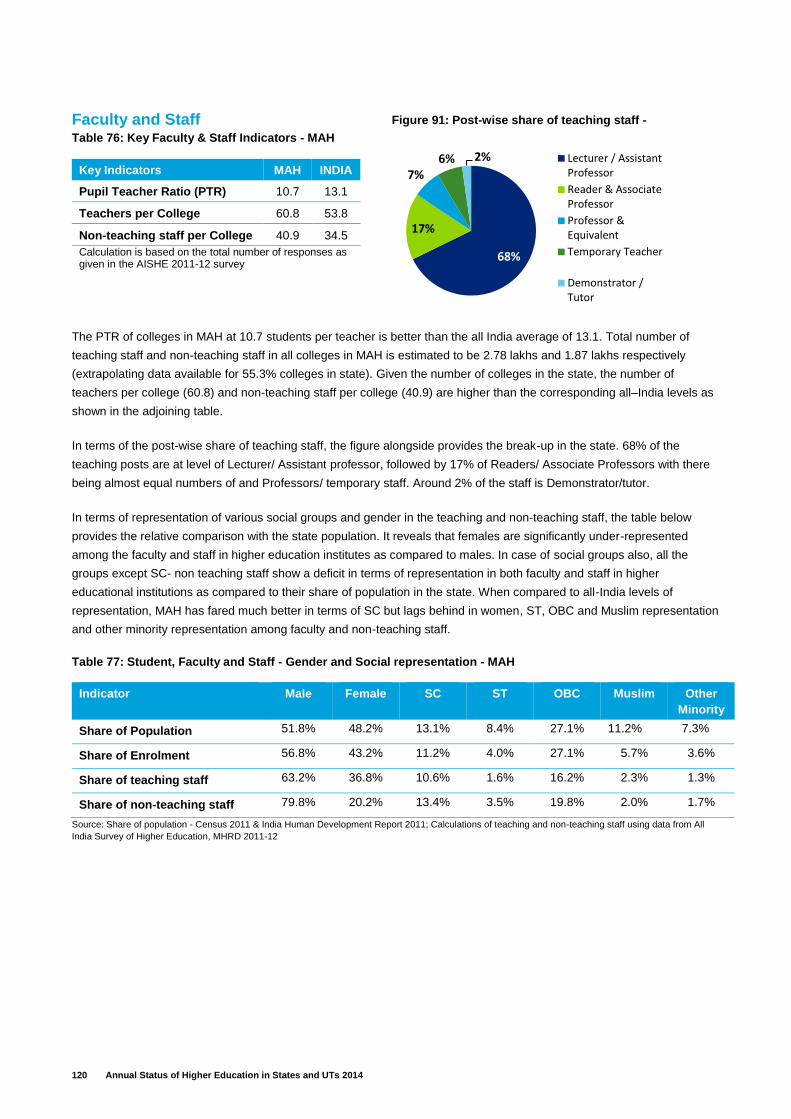
120 Annual Status of Higher Education in States and UTs 2014
Faculty and Staff Table 76: Key Faculty & Staff Indicators - MAH
The PTR of colleges in MAH at 10.7 students per teacher is better than the all India average of 13.1. Total number of
teaching staff and non-teaching staff in all colleges in MAH is estimated to be 2.78 lakhs and 1.87 lakhs respectively
(extrapolating data available for 55.3% colleges in state). Given the number of colleges in the state, the number of
teachers per college (60.8) and non-teaching staff per college (40.9) are higher than the corresponding all–India levels as
shown in the adjoining table.
In terms of the post-wise share of teaching staff, the figure alongside provides the break-up in the state. 68% of the
teaching posts are at level of Lecturer/ Assistant professor, followed by 17% of Readers/ Associate Professors with there
being almost equal numbers of and Professors/ temporary staff. Around 2% of the staff is Demonstrator/tutor.
In terms of representation of various social groups and gender in the teaching and non-teaching staff, the table below
provides the relative comparison with the state population. It reveals that females are significantly under-represented
among the faculty and staff in higher education institutes as compared to males. In case of social groups also, all the
groups except SC- non teaching staff show a deficit in terms of representation in both faculty and staff in higher
educational institutions as compared to their share of population in the state. When compared to all-India levels of
representation, MAH has fared much better in terms of SC but lags behind in women, ST, OBC and Muslim representation
and other minority representation among faculty and non-teaching staff.
Table 77: Student, Faculty and Staff - Gender and Social representation - MAH
Indicator Male Female SC ST OBC Muslim Other
Minority
Share of Population 51.8% 48.2% 13.1% 8.4% 27.1% 11.2% 7.3%
Share of Enrolment 56.8% 43.2% 11.2% 4.0% 27.1% 5.7% 3.6%
Share of teaching staff 63.2% 36.8% 10.6% 1.6% 16.2% 2.3% 1.3%
Share of non-teaching staff 79.8% 20.2% 13.4% 3.5% 19.8% 2.0% 1.7%
Source: Share of population - Census 2011 & India Human Development Report 2011; Calculations of teaching and non-teaching staff using data from All
India Survey of Higher Education, MHRD 2011-12
Key Indicators MAH INDIA
Pupil Teacher Ratio (PTR) 10.7 13.1
Teachers per College 60.8 53.8
Non-teaching staff per College 40.9 34.5
Calculation is based on the total number of responses as given in the AISHE 2011-12 survey
68%
17%
7%6% 2% Lecturer / Assistant
Professor
Reader & AssociateProfessor
Professor &Equivalent
Temporary Teacher
Demonstrator /Tutor
Figure 91: Post-wise share of teaching staff -
MAH
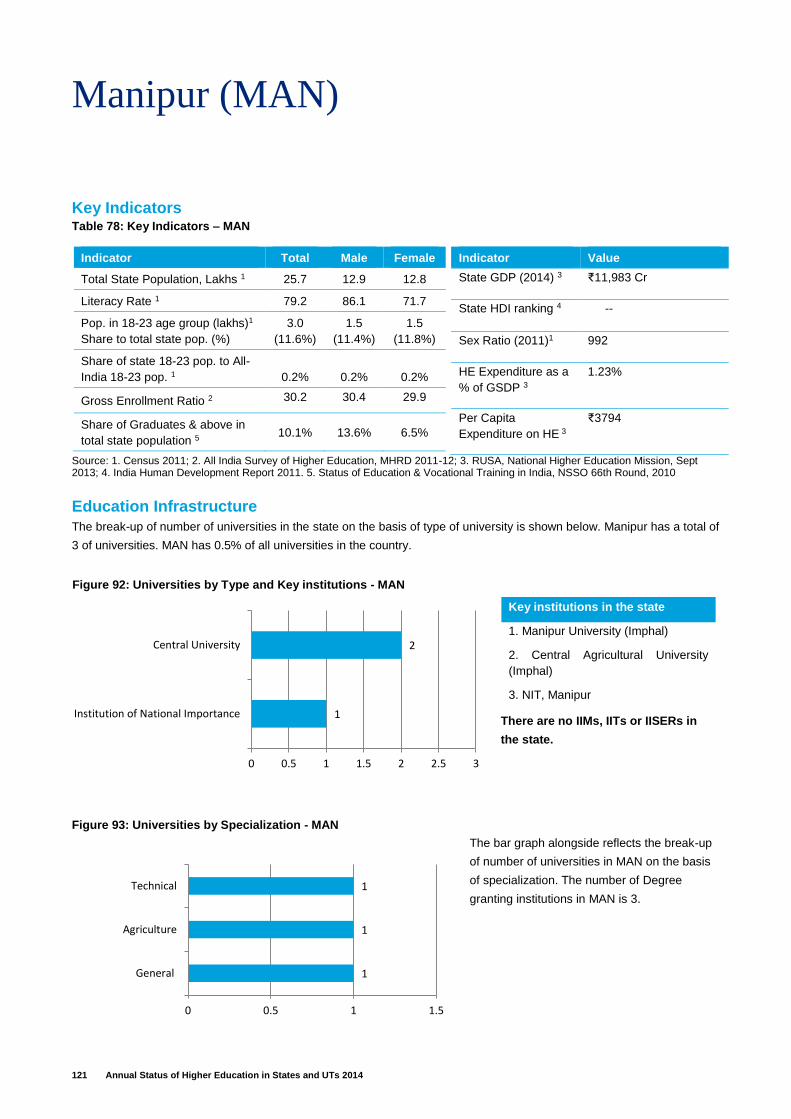
121 Annual Status of Higher Education in States and UTs 2014
Manipur (MAN)
Key Indicators Table 78: Key Indicators – MAN
Indicator Total Male Female
Total State Population, Lakhs 1 25.7 12.9 12.8
Literacy Rate 1 79.2 86.1 71.7
Pop. in 18-23 age group (lakhs)1
Share to total state pop. (%)
3.0
(11.6%)
1.5
(11.4%)
1.5
(11.8%)
Share of state 18-23 pop. to All-
India 18-23 pop. 1 0.2% 0.2% 0.2%
Gross Enrollment Ratio 2 30.2 30.4 29.9
Share of Graduates & above in
total state population 5 10.1% 13.6% 6.5%
Indicator Value
State GDP (2014) 3 ₹11,983 Cr
State HDI ranking 4 --
Sex Ratio (2011)1 992
HE Expenditure as a
% of GSDP 3
1.23%
Per Capita
Expenditure on HE 3
₹3794
Source: 1. Census 2011; 2. All India Survey of Higher Education, MHRD 2011-12; 3. RUSA, National Higher Education Mission, Sept 2013; 4. India Human Development Report 2011. 5. Status of Education & Vocational Training in India, NSSO 66th Round, 2010
Education Infrastructure
The break-up of number of universities in the state on the basis of type of university is shown below. Manipur has a total of
3 of universities. MAN has 0.5% of all universities in the country.
There are no IIMs, IITs or IISERs in
the state.
Key institutions in the state
1. Manipur University (Imphal)
2. Central Agricultural University
(Imphal)
3. NIT, Manipur
The bar graph alongside reflects the break-up
of number of universities in MAN on the basis
of specialization. The number of Degree
granting institutions in MAN is 3.
Figure 92: Universities by Type and Key institutions - MAN
1
1
1
0 0.5 1 1.5
General
Agriculture
Technical
Figure 93: Universities by Specialization - MAN
1
2
0 0.5 1 1.5 2 2.5 3
Institution of National Importance
Central University
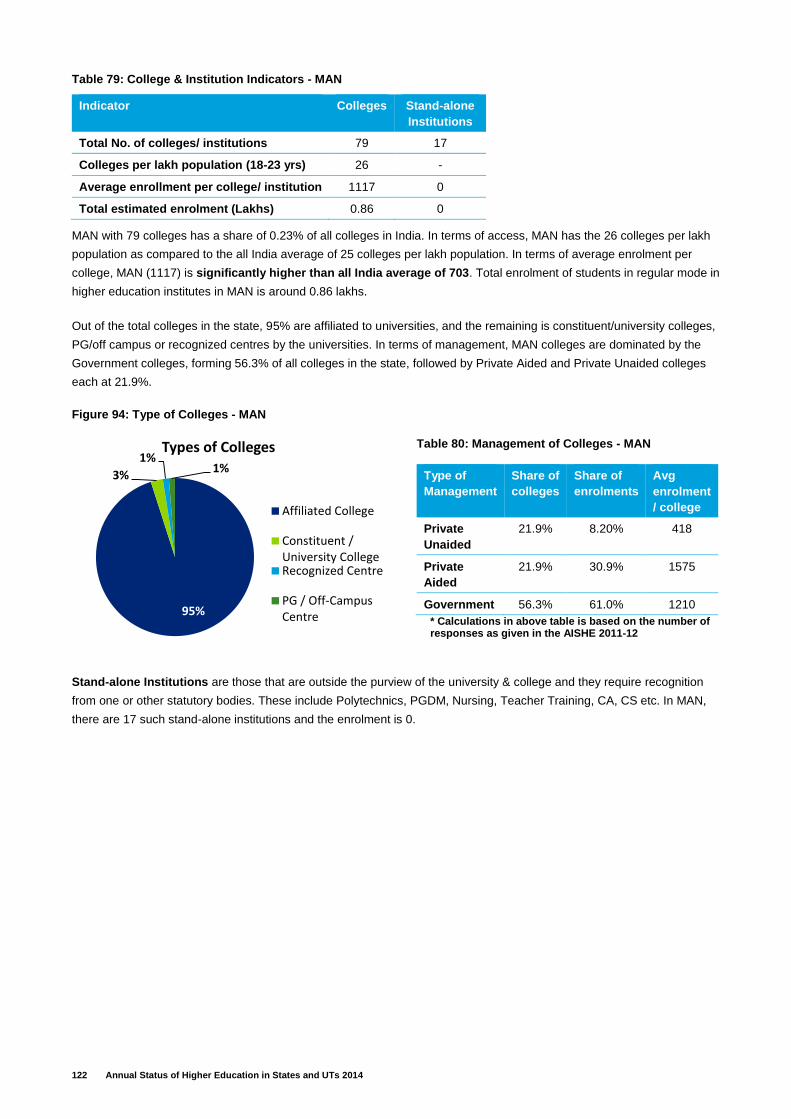
122 Annual Status of Higher Education in States and UTs 2014
Table 79: College & Institution Indicators - MAN
MAN with 79 colleges has a share of 0.23% of all colleges in India. In terms of access, MAN has the 26 colleges per lakh
population as compared to the all India average of 25 colleges per lakh population. In terms of average enrolment per
college, MAN (1117) is significantly higher than all India average of 703. Total enrolment of students in regular mode in
higher education institutes in MAN is around 0.86 lakhs.
Out of the total colleges in the state, 95% are affiliated to universities, and the remaining is constituent/university colleges,
PG/off campus or recognized centres by the universities. In terms of management, MAN colleges are dominated by the
Government colleges, forming 56.3% of all colleges in the state, followed by Private Aided and Private Unaided colleges
each at 21.9%.
Figure 94: Type of Colleges - MAN
Table 80: Management of Colleges - MAN
Type of
Management
Share of
colleges
Share of
enrolments
Avg
enrolment
/ college
Private
Unaided
21.9% 8.20% 418
Private
Aided
21.9% 30.9% 1575
Government 56.3% 61.0% 1210
* Calculations in above table is based on the number of responses as given in the AISHE 2011-12
Stand-alone Institutions are those that are outside the purview of the university & college and they require recognition
from one or other statutory bodies. These include Polytechnics, PGDM, Nursing, Teacher Training, CA, CS etc. In MAN,
there are 17 such stand-alone institutions and the enrolment is 0.
Indicator Colleges Stand-alone
Institutions
Total No. of colleges/ institutions 79 17
Colleges per lakh population (18-23 yrs) 26 -
Average enrollment per college/ institution 1117 0
Total estimated enrolment (Lakhs) 0.86 0
95%
3%
1%1%
Types of Colleges
Affiliated College
Constituent /University CollegeRecognized Centre
PG / Off-CampusCentre
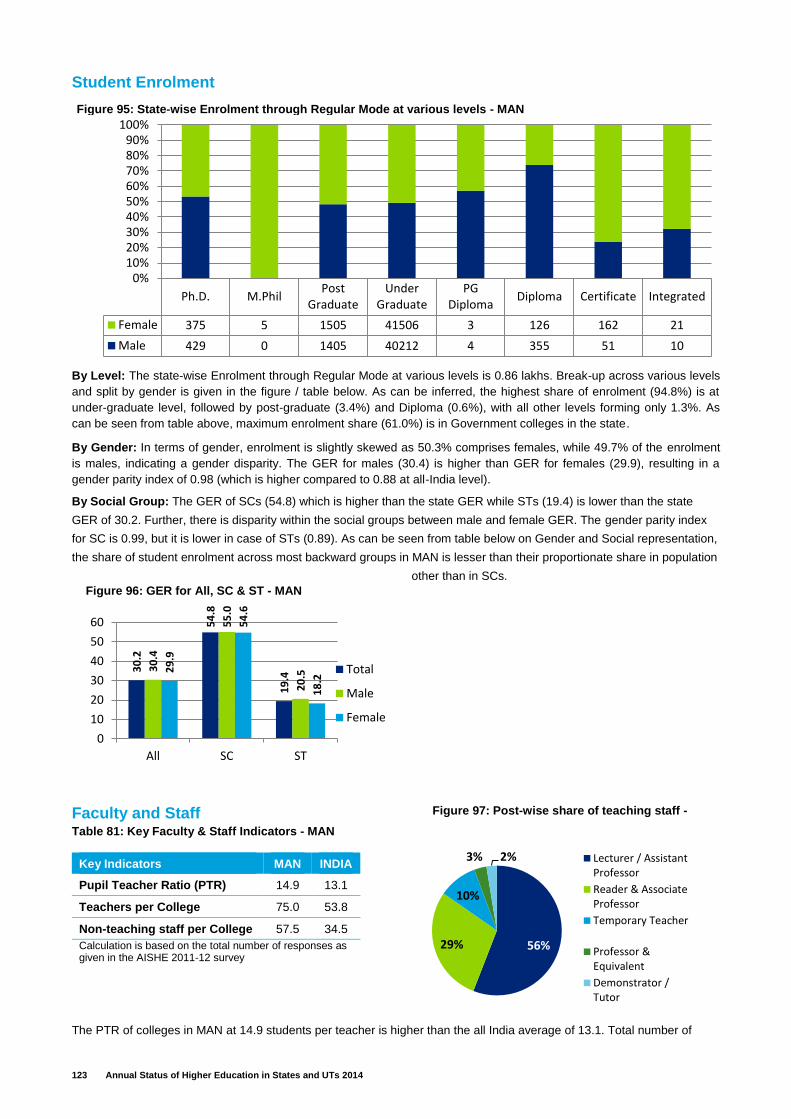
123 Annual Status of Higher Education in States and UTs 2014
Student Enrolment
By Level: The state-wise Enrolment through Regular Mode at various levels is 0.86 lakhs. Break-up across various levels
and split by gender is given in the figure / table below. As can be inferred, the highest share of enrolment (94.8%) is at
under-graduate level, followed by post-graduate (3.4%) and Diploma (0.6%), with all other levels forming only 1.3%. As
can be seen from table above, maximum enrolment share (61.0%) is in Government colleges in the state.
By Gender: In terms of gender, enrolment is slightly skewed as 50.3% comprises females, while 49.7% of the enrolment
is males, indicating a gender disparity. The GER for males (30.4) is higher than GER for females (29.9), resulting in a
gender parity index of 0.98 (which is higher compared to 0.88 at all-India level).
By Social Group: The GER of SCs (54.8) which is higher than the state GER while STs (19.4) is lower than the state
GER of 30.2. Further, there is disparity within the social groups between male and female GER. The gender parity index
for SC is 0.99, but it is lower in case of STs (0.89). As can be seen from table below on Gender and Social representation,
the share of student enrolment across most backward groups in MAN is lesser than their proportionate share in population
other than in SCs.
Faculty and Staff Table 81: Key Faculty & Staff Indicators - MAN
The PTR of colleges in MAN at 14.9 students per teacher is higher than the all India average of 13.1. Total number of
Key Indicators MAN INDIA
Pupil Teacher Ratio (PTR) 14.9 13.1
Teachers per College 75.0 53.8
Non-teaching staff per College 57.5 34.5
Calculation is based on the total number of responses as given in the AISHE 2011-12 survey
Ph.D. M.PhilPost
GraduateUnder
GraduatePG
DiplomaDiploma Certificate Integrated
Female 375 5 1505 41506 3 126 162 21
Male 429 0 1405 40212 4 355 51 10
0%10%20%30%40%50%60%70%80%90%
100%Figure 95: State‐wise Enrolment through Regular Mode at various levels - MAN
30
.2
54
.8
19
.4
30
.4
55
.0
20
.529
.9
54
.6
18
.2
0
10
20
30
40
50
60
All SC ST
Total
Male
Female
Figure 96: GER for All, SC & ST - MAN
56%29%
10%
3% 2% Lecturer / AssistantProfessor
Reader & AssociateProfessor
Temporary Teacher
Professor &Equivalent
Demonstrator /Tutor
Figure 97: Post-wise share of teaching staff -
MAN
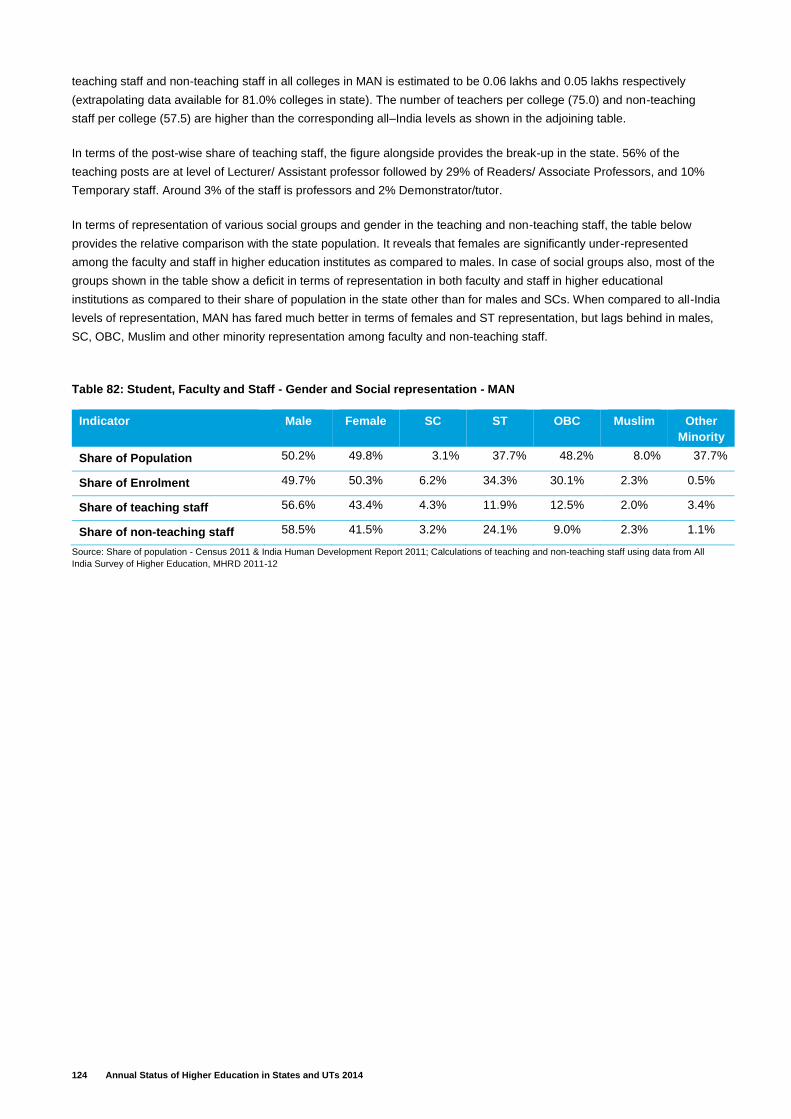
124 Annual Status of Higher Education in States and UTs 2014
teaching staff and non-teaching staff in all colleges in MAN is estimated to be 0.06 lakhs and 0.05 lakhs respectively
(extrapolating data available for 81.0% colleges in state). The number of teachers per college (75.0) and non-teaching
staff per college (57.5) are higher than the corresponding all–India levels as shown in the adjoining table.
In terms of the post-wise share of teaching staff, the figure alongside provides the break-up in the state. 56% of the
teaching posts are at level of Lecturer/ Assistant professor followed by 29% of Readers/ Associate Professors, and 10%
Temporary staff. Around 3% of the staff is professors and 2% Demonstrator/tutor.
In terms of representation of various social groups and gender in the teaching and non-teaching staff, the table below
provides the relative comparison with the state population. It reveals that females are significantly under-represented
among the faculty and staff in higher education institutes as compared to males. In case of social groups also, most of the
groups shown in the table show a deficit in terms of representation in both faculty and staff in higher educational
institutions as compared to their share of population in the state other than for males and SCs. When compared to all-India
levels of representation, MAN has fared much better in terms of females and ST representation, but lags behind in males,
SC, OBC, Muslim and other minority representation among faculty and non-teaching staff.
Table 82: Student, Faculty and Staff - Gender and Social representation - MAN
Indicator Male Female SC ST OBC Muslim Other
Minority
Share of Population 50.2% 49.8% 3.1% 37.7% 48.2% 8.0% 37.7%
Share of Enrolment 49.7% 50.3% 6.2% 34.3% 30.1% 2.3% 0.5%
Share of teaching staff 56.6% 43.4% 4.3% 11.9% 12.5% 2.0% 3.4%
Share of non-teaching staff 58.5% 41.5% 3.2% 24.1% 9.0% 2.3% 1.1%
Source: Share of population - Census 2011 & India Human Development Report 2011; Calculations of teaching and non-teaching staff using data from All
India Survey of Higher Education, MHRD 2011-12
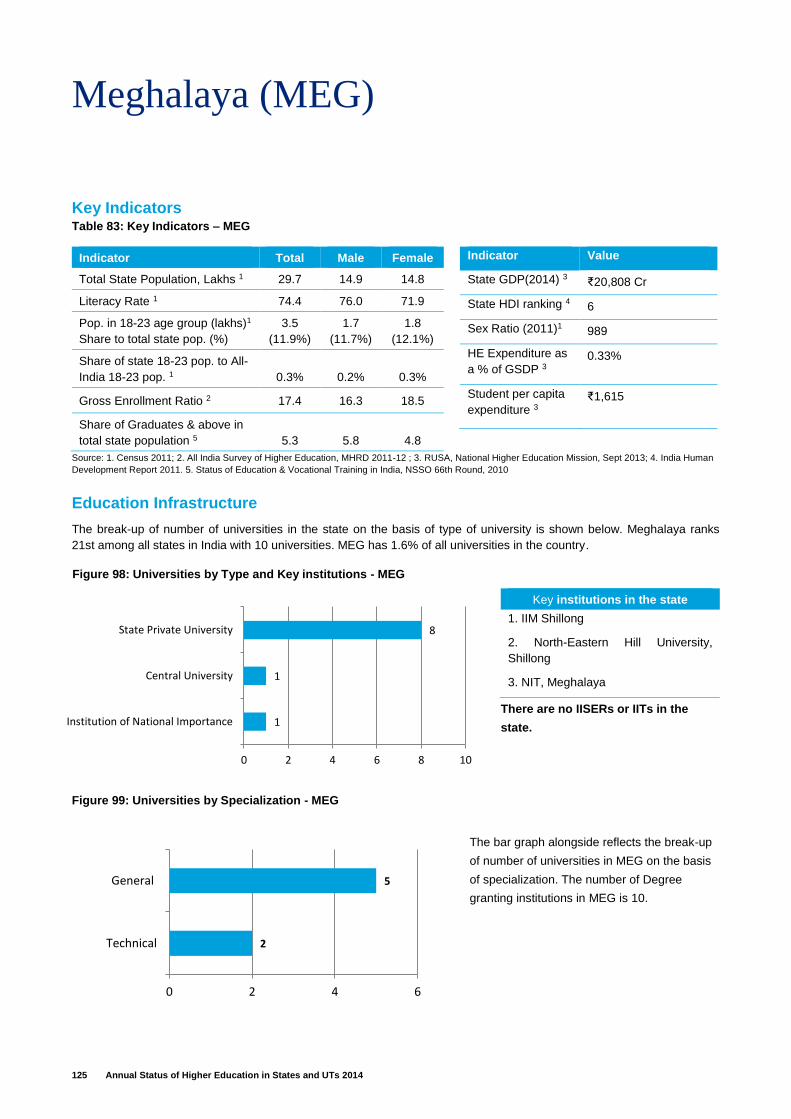
125 Annual Status of Higher Education in States and UTs 2014
Meghalaya (MEG)
Key Indicators Table 83: Key Indicators – MEG
Indicator Total Male Female
Total State Population, Lakhs 1 29.7 14.9 14.8
Literacy Rate 1 74.4 76.0 71.9
Pop. in 18-23 age group (lakhs)1
Share to total state pop. (%)
3.5
(11.9%)
1.7
(11.7%)
1.8
(12.1%)
Share of state 18-23 pop. to All-
India 18-23 pop. 1 0.3% 0.2% 0.3%
Gross Enrollment Ratio 2 17.4 16.3 18.5
Share of Graduates & above in
total state population 5 5.3 5.8 4.8
Indicator Value
State GDP(2014) 3 ₹20,808 Cr
State HDI ranking 4 6
Sex Ratio (2011)1 989
HE Expenditure as
a % of GSDP 3 0.33%
Student per capita
expenditure 3 ₹1,615
Source: 1. Census 2011; 2. All India Survey of Higher Education, MHRD 2011-12 ; 3. RUSA, National Higher Education Mission, Sept 2013; 4. India Human
Development Report 2011. 5. Status of Education & Vocational Training in India, NSSO 66th Round, 2010
Education Infrastructure
The break-up of number of universities in the state on the basis of type of university is shown below. Meghalaya ranks
21st among all states in India with 10 universities. MEG has 1.6% of all universities in the country.
There are no IISERs or IITs in the
state.
Key institutions in the state
1. IIM Shillong
2. North-Eastern Hill University,
Shillong
3. NIT, Meghalaya
The bar graph alongside reflects the break-up
of number of universities in MEG on the basis
of specialization. The number of Degree
granting institutions in MEG is 10.
Figure 98: Universities by Type and Key institutions - MEG
2
5
0 2 4 6
Technical
General
Figure 99: Universities by Specialization - MEG
1
1
8
0 2 4 6 8 10
Institution of National Importance
Central University
State Private University
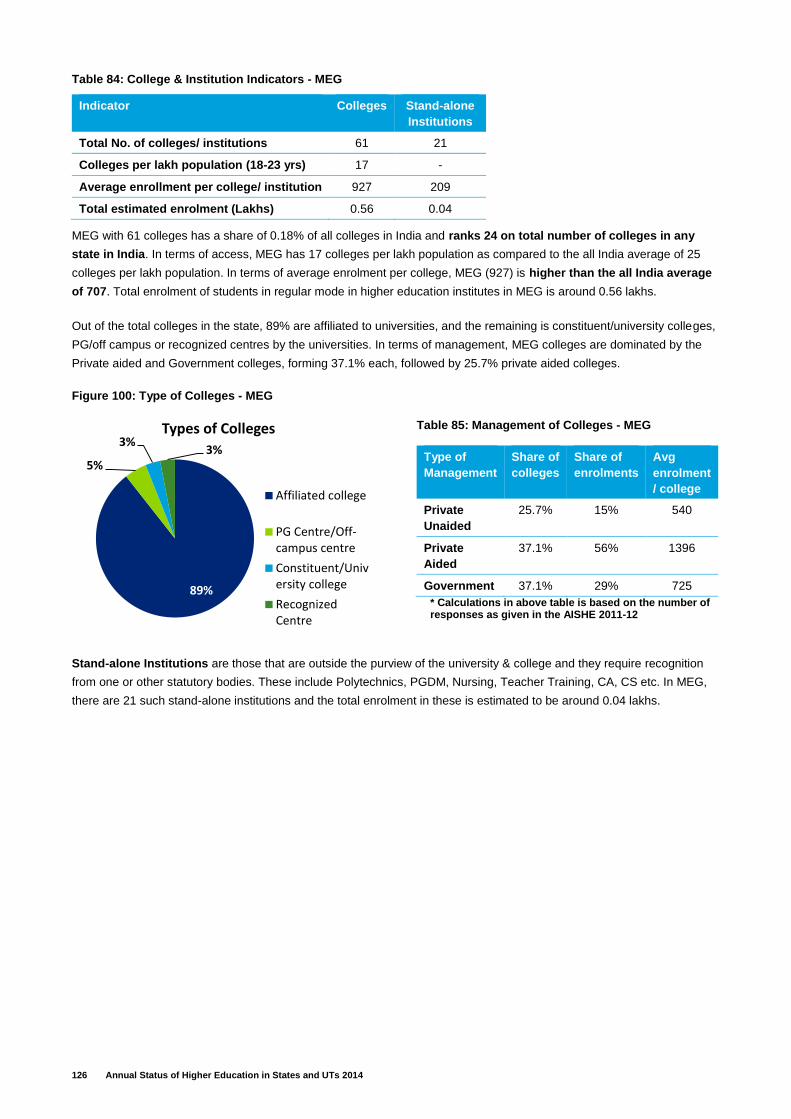
126 Annual Status of Higher Education in States and UTs 2014
Table 84: College & Institution Indicators - MEG
MEG with 61 colleges has a share of 0.18% of all colleges in India and ranks 24 on total number of colleges in any
state in India. In terms of access, MEG has 17 colleges per lakh population as compared to the all India average of 25
colleges per lakh population. In terms of average enrolment per college, MEG (927) is higher than the all India average
of 707. Total enrolment of students in regular mode in higher education institutes in MEG is around 0.56 lakhs.
Out of the total colleges in the state, 89% are affiliated to universities, and the remaining is constituent/university colleges,
PG/off campus or recognized centres by the universities. In terms of management, MEG colleges are dominated by the
Private aided and Government colleges, forming 37.1% each, followed by 25.7% private aided colleges.
Figure 100: Type of Colleges - MEG
Table 85: Management of Colleges - MEG
Type of
Management
Share of
colleges
Share of
enrolments
Avg
enrolment
/ college
Private
Unaided
25.7% 15% 540
Private
Aided
37.1% 56% 1396
Government 37.1% 29% 725
* Calculations in above table is based on the number of responses as given in the AISHE 2011-12
Stand-alone Institutions are those that are outside the purview of the university & college and they require recognition
from one or other statutory bodies. These include Polytechnics, PGDM, Nursing, Teacher Training, CA, CS etc. In MEG,
there are 21 such stand-alone institutions and the total enrolment in these is estimated to be around 0.04 lakhs.
Indicator Colleges Stand-alone
Institutions
Total No. of colleges/ institutions 61 21
Colleges per lakh population (18-23 yrs) 17 -
Average enrollment per college/ institution 927 209
Total estimated enrolment (Lakhs) 0.56 0.04
89%
5%
3%3%
Types of Colleges
Affiliated college
PG Centre/Off-campus centre
Constituent/University college
RecognizedCentre
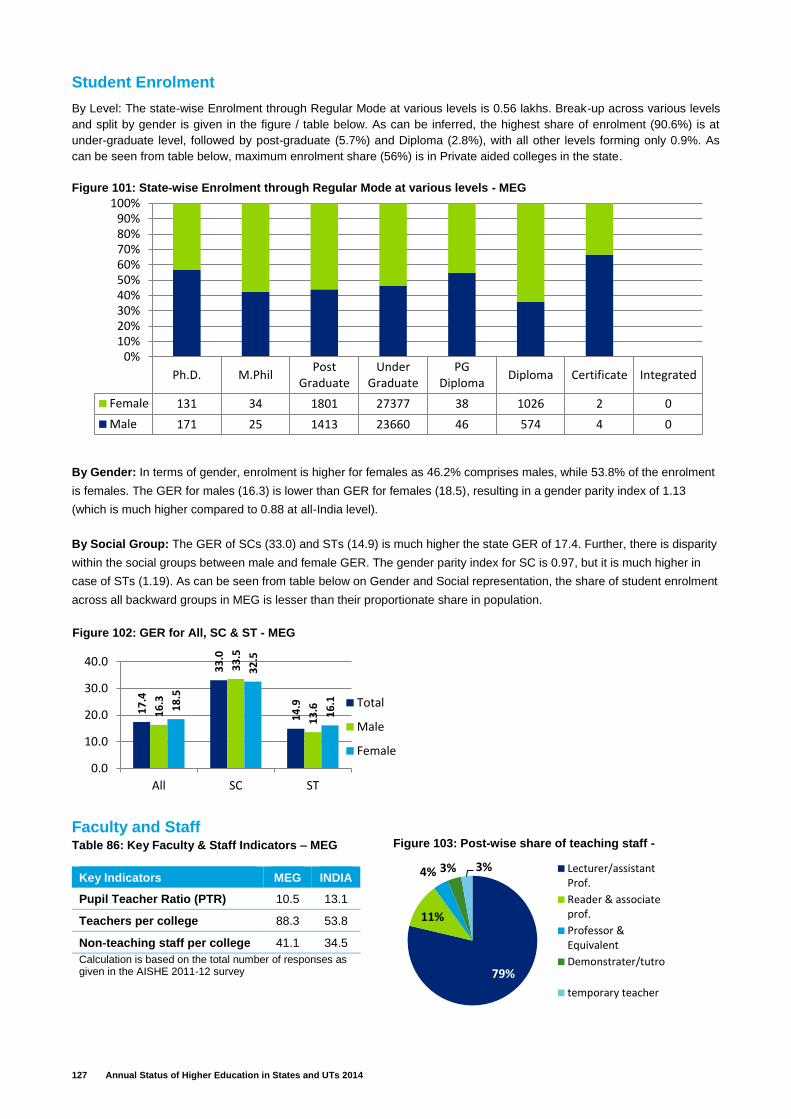
127 Annual Status of Higher Education in States and UTs 2014
Student Enrolment
By Level: The state-wise Enrolment through Regular Mode at various levels is 0.56 lakhs. Break-up across various levels
and split by gender is given in the figure / table below. As can be inferred, the highest share of enrolment (90.6%) is at
under-graduate level, followed by post-graduate (5.7%) and Diploma (2.8%), with all other levels forming only 0.9%. As
can be seen from table below, maximum enrolment share (56%) is in Private aided colleges in the state.
By Gender: In terms of gender, enrolment is higher for females as 46.2% comprises males, while 53.8% of the enrolment
is females. The GER for males (16.3) is lower than GER for females (18.5), resulting in a gender parity index of 1.13
(which is much higher compared to 0.88 at all-India level).
By Social Group: The GER of SCs (33.0) and STs (14.9) is much higher the state GER of 17.4. Further, there is disparity
within the social groups between male and female GER. The gender parity index for SC is 0.97, but it is much higher in
case of STs (1.19). As can be seen from table below on Gender and Social representation, the share of student enrolment
across all backward groups in MEG is lesser than their proportionate share in population.
Faculty and Staff Table 86: Key Faculty & Staff Indicators – MEG
Key Indicators MEG INDIA
Pupil Teacher Ratio (PTR) 10.5 13.1
Teachers per college 88.3 53.8
Non-teaching staff per college 41.1 34.5
Calculation is based on the total number of responses as given in the AISHE 2011-12 survey
Ph.D. M.PhilPost
GraduateUnder
GraduatePG
DiplomaDiploma Certificate Integrated
Female 131 34 1801 27377 38 1026 2 0
Male 171 25 1413 23660 46 574 4 0
0%10%20%30%40%50%60%70%80%90%
100%Figure 101: State‐wise Enrolment through Regular Mode at various levels - MEG
17
.4
33
.0
14
.9
16
.3
33
.5
13
.618
.5
32
.5
16
.1
0.0
10.0
20.0
30.0
40.0
All SC ST
Total
Male
Female
Figure 102: GER for All, SC & ST - MEG
79%
11%
4% 3% 3% Lecturer/assistantProf.
Reader & associateprof.
Professor &Equivalent
Demonstrater/tutro
temporary teacher
Figure 103: Post-wise share of teaching staff -
MEG
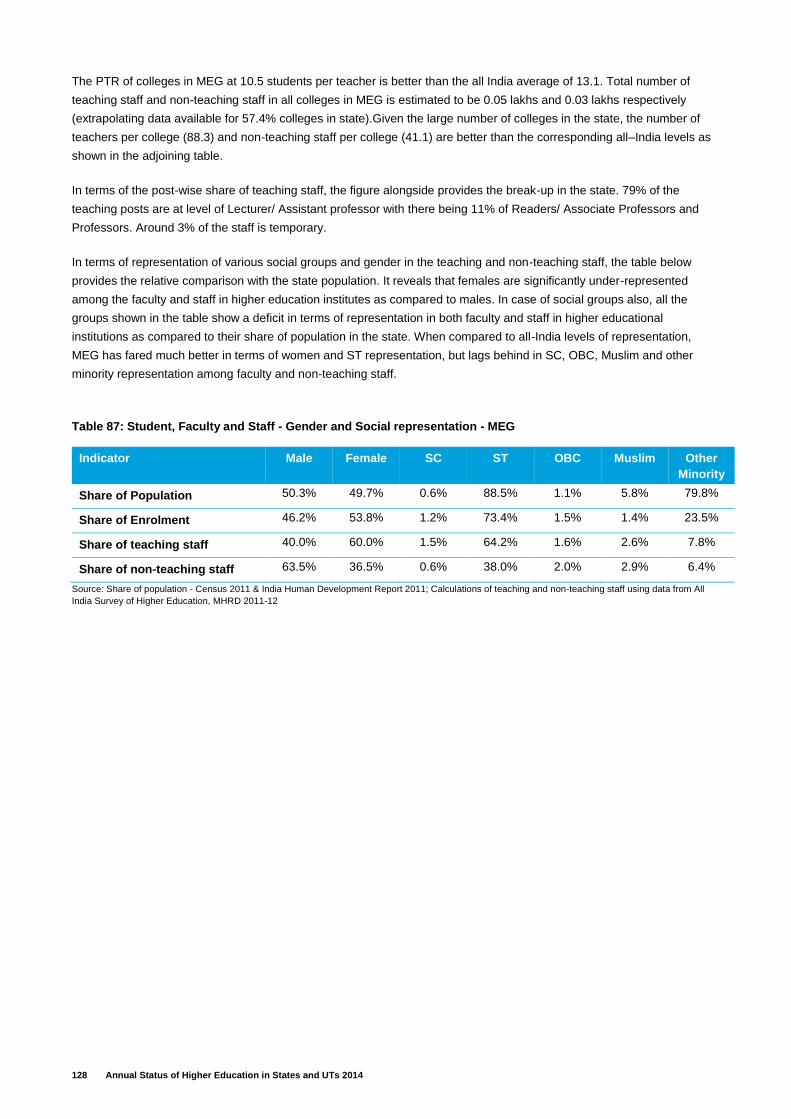
128 Annual Status of Higher Education in States and UTs 2014
The PTR of colleges in MEG at 10.5 students per teacher is better than the all India average of 13.1. Total number of
teaching staff and non-teaching staff in all colleges in MEG is estimated to be 0.05 lakhs and 0.03 lakhs respectively
(extrapolating data available for 57.4% colleges in state).Given the large number of colleges in the state, the number of
teachers per college (88.3) and non-teaching staff per college (41.1) are better than the corresponding all–India levels as
shown in the adjoining table.
In terms of the post-wise share of teaching staff, the figure alongside provides the break-up in the state. 79% of the
teaching posts are at level of Lecturer/ Assistant professor with there being 11% of Readers/ Associate Professors and
Professors. Around 3% of the staff is temporary.
In terms of representation of various social groups and gender in the teaching and non-teaching staff, the table below
provides the relative comparison with the state population. It reveals that females are significantly under-represented
among the faculty and staff in higher education institutes as compared to males. In case of social groups also, all the
groups shown in the table show a deficit in terms of representation in both faculty and staff in higher educational
institutions as compared to their share of population in the state. When compared to all-India levels of representation,
MEG has fared much better in terms of women and ST representation, but lags behind in SC, OBC, Muslim and other
minority representation among faculty and non-teaching staff.
Table 87: Student, Faculty and Staff - Gender and Social representation - MEG
Indicator Male Female SC ST OBC Muslim Other
Minority
Share of Population 50.3% 49.7% 0.6% 88.5% 1.1% 5.8% 79.8%
Share of Enrolment 46.2% 53.8% 1.2% 73.4% 1.5% 1.4% 23.5%
Share of teaching staff 40.0% 60.0% 1.5% 64.2% 1.6% 2.6% 7.8%
Share of non-teaching staff 63.5% 36.5% 0.6% 38.0% 2.0% 2.9% 6.4%
Source: Share of population - Census 2011 & India Human Development Report 2011; Calculations of teaching and non-teaching staff using data from All
India Survey of Higher Education, MHRD 2011-12
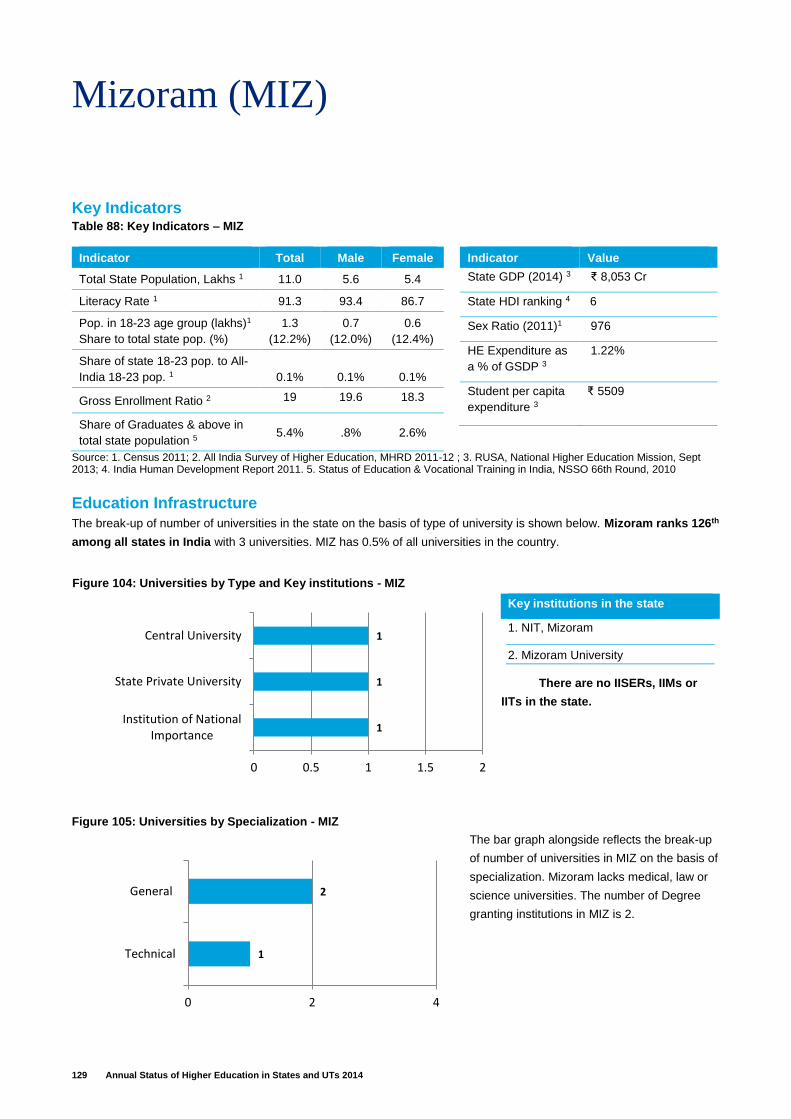
129 Annual Status of Higher Education in States and UTs 2014
Mizoram (MIZ)
Key Indicators Table 88: Key Indicators – MIZ
Indicator Total Male Female
Total State Population, Lakhs 1 11.0 5.6 5.4
Literacy Rate 1 91.3 93.4 86.7
Pop. in 18-23 age group (lakhs)1
Share to total state pop. (%)
1.3
(12.2%)
0.7
(12.0%)
0.6
(12.4%)
Share of state 18-23 pop. to All-
India 18-23 pop. 1 0.1% 0.1% 0.1%
Gross Enrollment Ratio 2 19 19.6 18.3
Share of Graduates & above in
total state population 5 5.4% .8% 2.6%
Indicator Value
State GDP (2014) 3 ₹ 8,053 Cr
State HDI ranking 4 6
Sex Ratio (2011)1 976
HE Expenditure as
a % of GSDP 3
1.22%
Student per capita
expenditure 3
₹ 5509
Source: 1. Census 2011; 2. All India Survey of Higher Education, MHRD 2011-12 ; 3. RUSA, National Higher Education Mission, Sept 2013; 4. India Human Development Report 2011. 5. Status of Education & Vocational Training in India, NSSO 66th Round, 2010
Education Infrastructure
The break-up of number of universities in the state on the basis of type of university is shown below. Mizoram ranks 126th
among all states in India with 3 universities. MIZ has 0.5% of all universities in the country.
There are no IISERs, IIMs or
IITs in the state.
Key institutions in the state
1. NIT, Mizoram
2. Mizoram University
The bar graph alongside reflects the break-up
of number of universities in MIZ on the basis of
specialization. Mizoram lacks medical, law or
science universities. The number of Degree
granting institutions in MIZ is 2.
Figure 104: Universities by Type and Key institutions - MIZ
1
2
0 2 4
Technical
General
Figure 105: Universities by Specialization - MIZ
1
1
1
0 0.5 1 1.5 2
Institution of NationalImportance
State Private University
Central University

130 Annual Status of Higher Education in States and UTs 2014
Table 89: College & Institution Indicators - MIZ
MIZ with 29 colleges has a share of 0.08% of all colleges in India and ranks 28 on total number of colleges in any state
in India. In terms of access, MIZ has 22 colleges per lakh population as compared to the all India average of 25 colleges
per lakh population. In terms of average enrolment per college, MIZ (586) is higher than the all India average of 703.
Total enrolment of students in regular mode in higher education institutes in MIZ is around 0.20 lakhs.
Out of the total colleges in the state, 93% are affiliated to universities, and the remaining is constituent/university colleges,
PG/off campus or recognized centres by the universities. In terms of management, MIZ colleges are dominated by the
Government colleges, forming 93.1% of all colleges in the state, followed by 3.4% for each of the private aided and private
unaided colleges.
Figure 106: Type of Colleges - MIZ
Table 90: Management of Colleges - MIZ
Type of
Management
Share of
colleges
Share of
enrolments
Avg
enrolment
/ college
Private
Unaided
3.4% 0.6% 110
Private
Aided
3.4% 1.3% 225
Government 93.1% 98.0% 617
* Calculations in above table is based on the number of responses as given in the AISHE 2011-12
Stand-alone Institutions are those that are outside the purview of the university & college and they require recognition
from one or other statutory bodies. These include Polytechnics, PGDM, Nursing, Teacher Training, CA, CS etc. In MIZ,
there are 9 such stand-alone institutions and the total enrolment in these is estimated to be around 0.01 lakhs.
Indicator Colleges Stand-alone
Institutions
Total No. of colleges/ institutions 29 9
Colleges per lakh population (18-23 yrs) 22 -
Average enrollment per college/ institution 586 143
Total estimated enrolment (Lakhs) 0.20 0.01
93%
7%
0%0%
Types of Colleges
Affiliated College
Constituent /University CollegeRecognized Centre
PG / Off-CampusCentre
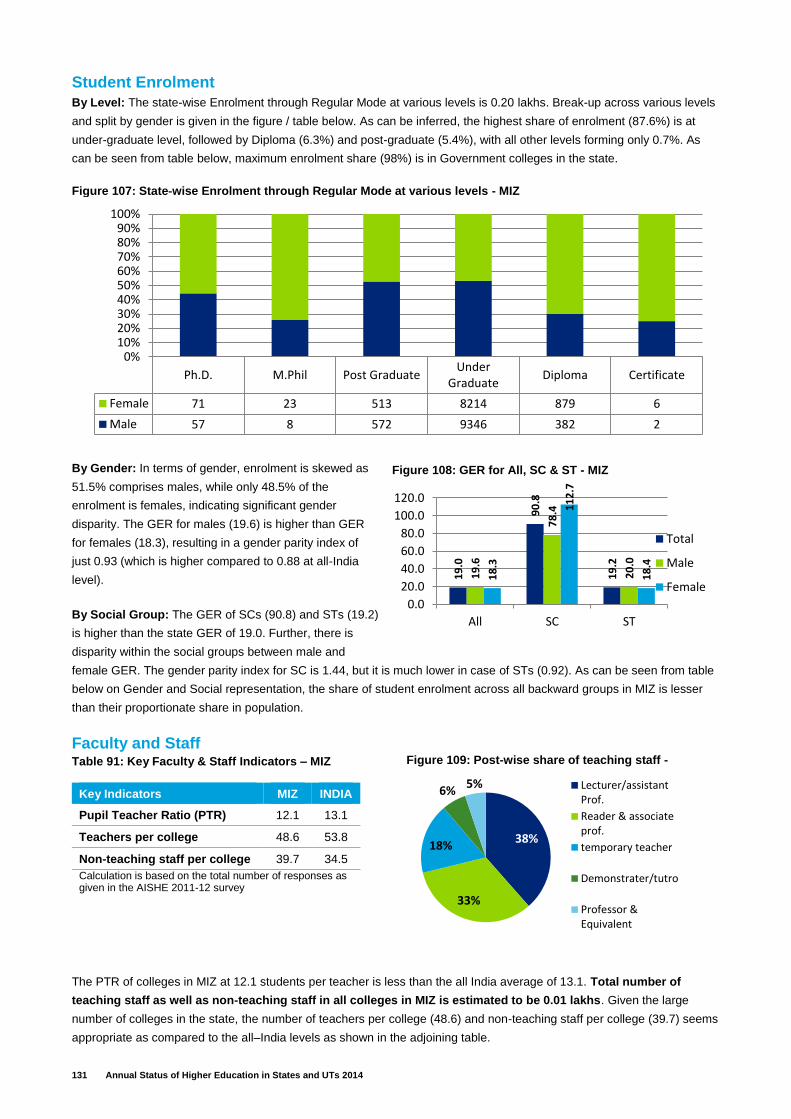
131 Annual Status of Higher Education in States and UTs 2014
Student Enrolment
By Level: The state-wise Enrolment through Regular Mode at various levels is 0.20 lakhs. Break-up across various levels
and split by gender is given in the figure / table below. As can be inferred, the highest share of enrolment (87.6%) is at
under-graduate level, followed by Diploma (6.3%) and post-graduate (5.4%), with all other levels forming only 0.7%. As
can be seen from table below, maximum enrolment share (98%) is in Government colleges in the state.
By Gender: In terms of gender, enrolment is skewed as
51.5% comprises males, while only 48.5% of the
enrolment is females, indicating significant gender
disparity. The GER for males (19.6) is higher than GER
for females (18.3), resulting in a gender parity index of
just 0.93 (which is higher compared to 0.88 at all-India
level).
By Social Group: The GER of SCs (90.8) and STs (19.2)
is higher than the state GER of 19.0. Further, there is
disparity within the social groups between male and
female GER. The gender parity index for SC is 1.44, but it is much lower in case of STs (0.92). As can be seen from table
below on Gender and Social representation, the share of student enrolment across all backward groups in MIZ is lesser
than their proportionate share in population.
Faculty and Staff Table 91: Key Faculty & Staff Indicators – MIZ
The PTR of colleges in MIZ at 12.1 students per teacher is less than the all India average of 13.1. Total number of
teaching staff as well as non-teaching staff in all colleges in MIZ is estimated to be 0.01 lakhs. Given the large
number of colleges in the state, the number of teachers per college (48.6) and non-teaching staff per college (39.7) seems
appropriate as compared to the all–India levels as shown in the adjoining table.
Key Indicators MIZ INDIA
Pupil Teacher Ratio (PTR) 12.1 13.1
Teachers per college 48.6 53.8
Non-teaching staff per college 39.7 34.5
Calculation is based on the total number of responses as given in the AISHE 2011-12 survey
Ph.D. M.Phil Post GraduateUnder
GraduateDiploma Certificate
Female 71 23 513 8214 879 6
Male 57 8 572 9346 382 2
0%10%20%30%40%50%60%70%80%90%
100%
Figure 107: State‐wise Enrolment through Regular Mode at various levels - MIZ
19
.0
90
.8
19
.2
19
.6
78
.4
20
.0
18
.3
11
2.7
18
.4
0.0
20.0
40.0
60.0
80.0
100.0
120.0
All SC ST
Total
Male
Female
Figure 108: GER for All, SC & ST - MIZ
38%
33%
18%
6%5% Lecturer/assistant
Prof.
Reader & associateprof.
temporary teacher
Demonstrater/tutro
Professor &Equivalent
Figure 109: Post-wise share of teaching staff -
MIZ
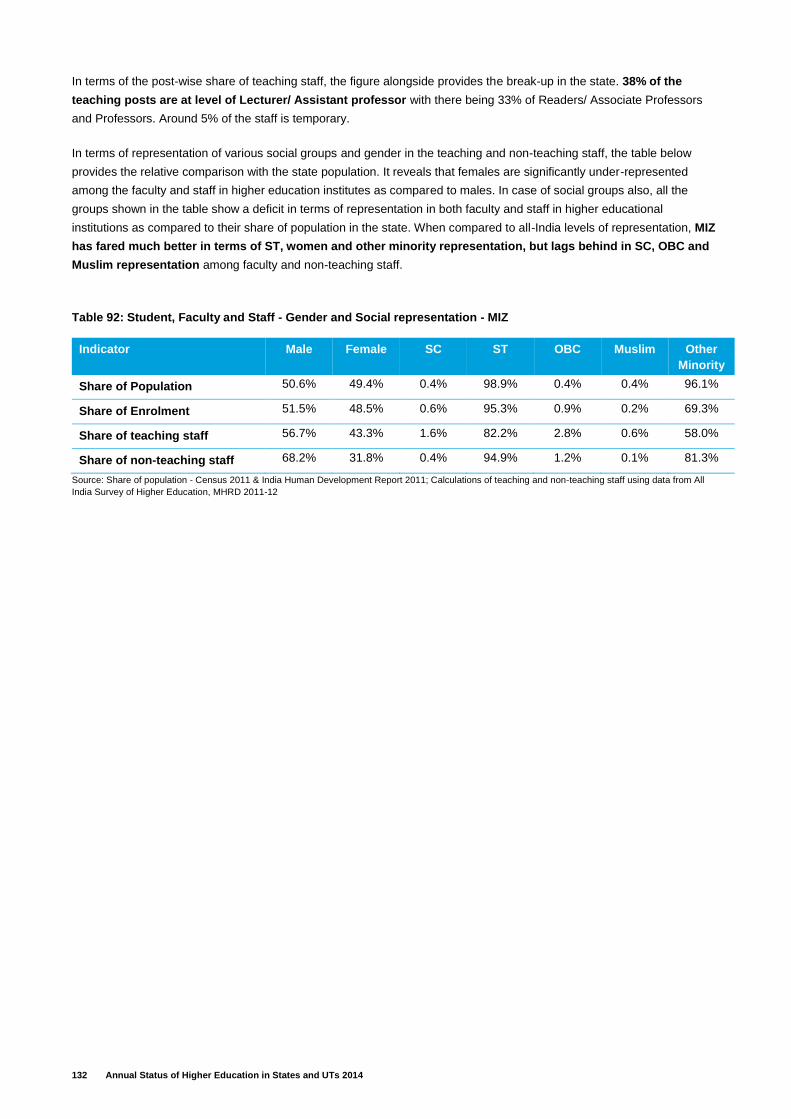
132 Annual Status of Higher Education in States and UTs 2014
In terms of the post-wise share of teaching staff, the figure alongside provides the break-up in the state. 38% of the
teaching posts are at level of Lecturer/ Assistant professor with there being 33% of Readers/ Associate Professors
and Professors. Around 5% of the staff is temporary.
In terms of representation of various social groups and gender in the teaching and non-teaching staff, the table below
provides the relative comparison with the state population. It reveals that females are significantly under-represented
among the faculty and staff in higher education institutes as compared to males. In case of social groups also, all the
groups shown in the table show a deficit in terms of representation in both faculty and staff in higher educational
institutions as compared to their share of population in the state. When compared to all-India levels of representation, MIZ
has fared much better in terms of ST, women and other minority representation, but lags behind in SC, OBC and
Muslim representation among faculty and non-teaching staff.
Table 92: Student, Faculty and Staff - Gender and Social representation - MIZ
Indicator Male Female SC ST OBC Muslim Other
Minority
Share of Population 50.6% 49.4% 0.4% 98.9% 0.4% 0.4% 96.1%
Share of Enrolment 51.5% 48.5% 0.6% 95.3% 0.9% 0.2% 69.3%
Share of teaching staff 56.7% 43.3% 1.6% 82.2% 2.8% 0.6% 58.0%
Share of non-teaching staff 68.2% 31.8% 0.4% 94.9% 1.2% 0.1% 81.3%
Source: Share of population - Census 2011 & India Human Development Report 2011; Calculations of teaching and non-teaching staff using data from All
India Survey of Higher Education, MHRD 2011-12
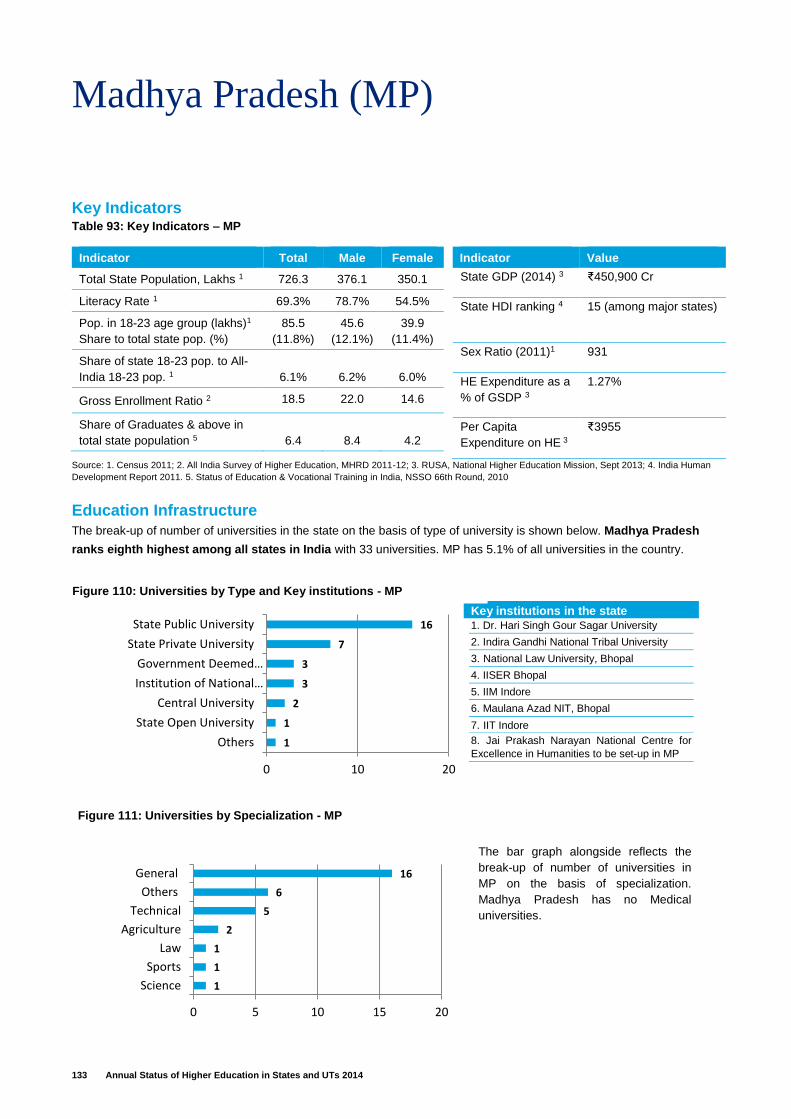
133 Annual Status of Higher Education in States and UTs 2014
Madhya Pradesh (MP)
Key Indicators Table 93: Key Indicators – MP
Indicator Total Male Female
Total State Population, Lakhs 1 726.3 376.1 350.1
Literacy Rate 1 69.3% 78.7% 54.5%
Pop. in 18-23 age group (lakhs)1
Share to total state pop. (%)
85.5
(11.8%)
45.6
(12.1%)
39.9
(11.4%)
Share of state 18-23 pop. to All-
India 18-23 pop. 1 6.1% 6.2% 6.0%
Gross Enrollment Ratio 2 18.5 22.0 14.6
Share of Graduates & above in
total state population 5 6.4 8.4 4.2
Indicator Value
State GDP (2014) 3 ₹450,900 Cr
State HDI ranking 4 15 (among major states)
Sex Ratio (2011)1 931
HE Expenditure as a
% of GSDP 3
1.27%
Per Capita
Expenditure on HE 3
₹3955
Source: 1. Census 2011; 2. All India Survey of Higher Education, MHRD 2011-12; 3. RUSA, National Higher Education Mission, Sept 2013; 4. India Human
Development Report 2011. 5. Status of Education & Vocational Training in India, NSSO 66th Round, 2010
Education Infrastructure
The break-up of number of universities in the state on the basis of type of university is shown below. Madhya Pradesh
ranks eighth highest among all states in India with 33 universities. MP has 5.1% of all universities in the country.
The bar graph alongside reflects the
break-up of number of universities in
MP on the basis of specialization.
Madhya Pradesh has no Medical
universities.
Key institutions in the state
1. Dr. Hari Singh Gour Sagar University
2. Indira Gandhi National Tribal University
3. National Law University, Bhopal
4. IISER Bhopal
5. IIM Indore
6. Maulana Azad NIT, Bhopal
7. IIT Indore
8. Jai Prakash Narayan National Centre for
Excellence in Humanities to be set-up in MP
Figure 110: Universities by Type and Key institutions - MP
1
1
1
2
5
6
16
0 5 10 15 20
Science
Sports
Law
Agriculture
Technical
Others
General
Figure 111: Universities by Specialization - MP
1
1
2
3
3
7
16
0 10 20
Others
State Open University
Central University
Institution of National…
Government Deemed…
State Private University
State Public University
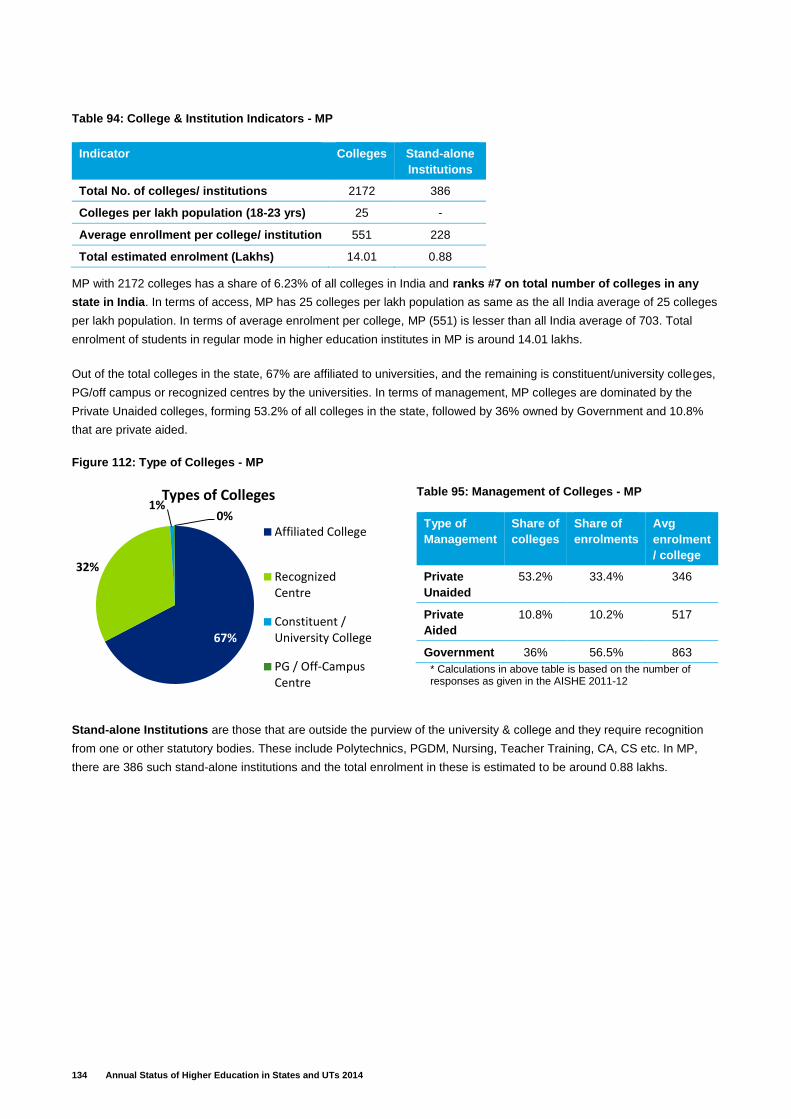
134 Annual Status of Higher Education in States and UTs 2014
Table 94: College & Institution Indicators - MP
MP with 2172 colleges has a share of 6.23% of all colleges in India and ranks #7 on total number of colleges in any
state in India. In terms of access, MP has 25 colleges per lakh population as same as the all India average of 25 colleges
per lakh population. In terms of average enrolment per college, MP (551) is lesser than all India average of 703. Total
enrolment of students in regular mode in higher education institutes in MP is around 14.01 lakhs.
Out of the total colleges in the state, 67% are affiliated to universities, and the remaining is constituent/university colleges,
PG/off campus or recognized centres by the universities. In terms of management, MP colleges are dominated by the
Private Unaided colleges, forming 53.2% of all colleges in the state, followed by 36% owned by Government and 10.8%
that are private aided.
Figure 112: Type of Colleges - MP
Table 95: Management of Colleges - MP
Type of
Management
Share of
colleges
Share of
enrolments
Avg
enrolment
/ college
Private
Unaided
53.2% 33.4% 346
Private
Aided
10.8% 10.2% 517
Government 36% 56.5% 863
* Calculations in above table is based on the number of responses as given in the AISHE 2011-12
Stand-alone Institutions are those that are outside the purview of the university & college and they require recognition
from one or other statutory bodies. These include Polytechnics, PGDM, Nursing, Teacher Training, CA, CS etc. In MP,
there are 386 such stand-alone institutions and the total enrolment in these is estimated to be around 0.88 lakhs.
Indicator Colleges Stand-alone
Institutions
Total No. of colleges/ institutions 2172 386
Colleges per lakh population (18-23 yrs) 25 -
Average enrollment per college/ institution 551 228
Total estimated enrolment (Lakhs) 14.01 0.88
67%
32%
1%0%
Types of Colleges
Affiliated College
RecognizedCentre
Constituent /University College
PG / Off-CampusCentre
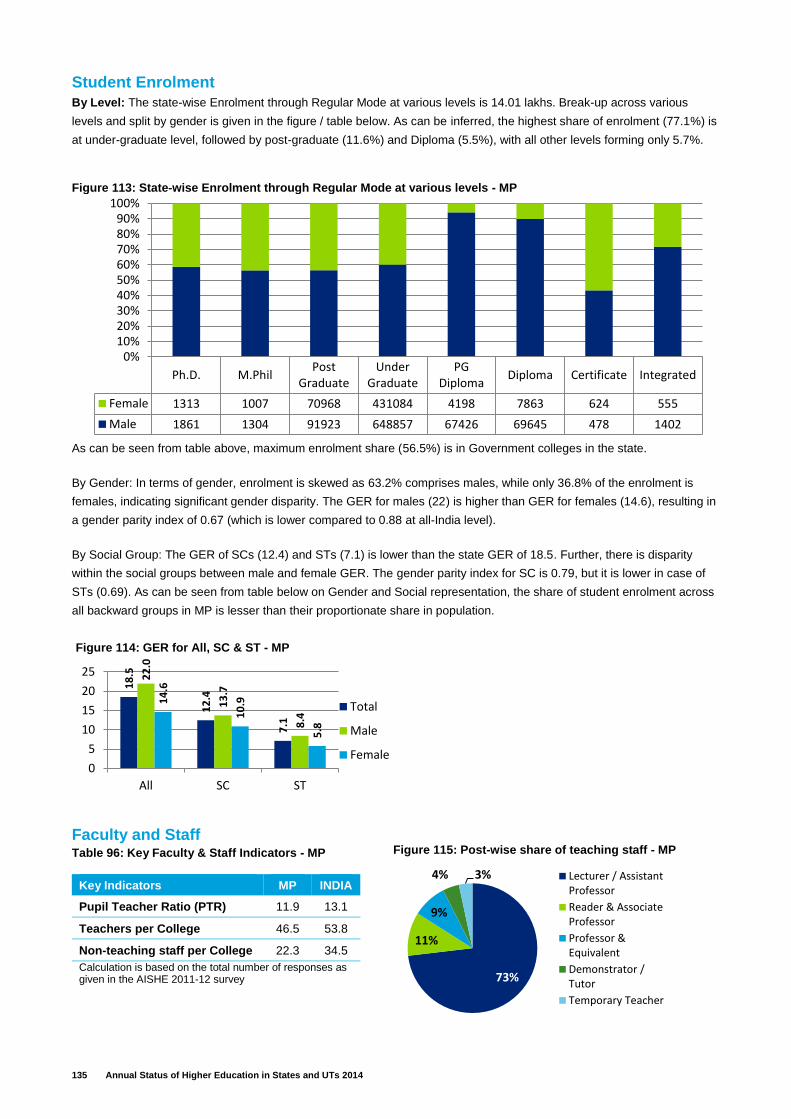
135 Annual Status of Higher Education in States and UTs 2014
Student Enrolment
By Level: The state-wise Enrolment through Regular Mode at various levels is 14.01 lakhs. Break-up across various
levels and split by gender is given in the figure / table below. As can be inferred, the highest share of enrolment (77.1%) is
at under-graduate level, followed by post-graduate (11.6%) and Diploma (5.5%), with all other levels forming only 5.7%.
As can be seen from table above, maximum enrolment share (56.5%) is in Government colleges in the state.
By Gender: In terms of gender, enrolment is skewed as 63.2% comprises males, while only 36.8% of the enrolment is
females, indicating significant gender disparity. The GER for males (22) is higher than GER for females (14.6), resulting in
a gender parity index of 0.67 (which is lower compared to 0.88 at all-India level).
By Social Group: The GER of SCs (12.4) and STs (7.1) is lower than the state GER of 18.5. Further, there is disparity
within the social groups between male and female GER. The gender parity index for SC is 0.79, but it is lower in case of
STs (0.69). As can be seen from table below on Gender and Social representation, the share of student enrolment across
all backward groups in MP is lesser than their proportionate share in population.
Faculty and Staff Table 96: Key Faculty & Staff Indicators - MP
Key Indicators MP INDIA
Pupil Teacher Ratio (PTR) 11.9 13.1
Teachers per College 46.5 53.8
Non-teaching staff per College 22.3 34.5
Calculation is based on the total number of responses as given in the AISHE 2011-12 survey
Ph.D. M.PhilPost
GraduateUnder
GraduatePG
DiplomaDiploma Certificate Integrated
Female 1313 1007 70968 431084 4198 7863 624 555
Male 1861 1304 91923 648857 67426 69645 478 1402
0%10%20%30%40%50%60%70%80%90%
100%Figure 113: State‐wise Enrolment through Regular Mode at various levels - MP
18
.5
12
.4
7.1
22
.0
13
.7
8.4
14
.6
10
.9
5.8
0
5
10
15
20
25
All SC ST
Total
Male
Female
Figure 114: GER for All, SC & ST - MP
73%
11%
9%
4% 3% Lecturer / AssistantProfessor
Reader & AssociateProfessor
Professor &Equivalent
Demonstrator /Tutor
Temporary Teacher
Figure 115: Post-wise share of teaching staff - MP
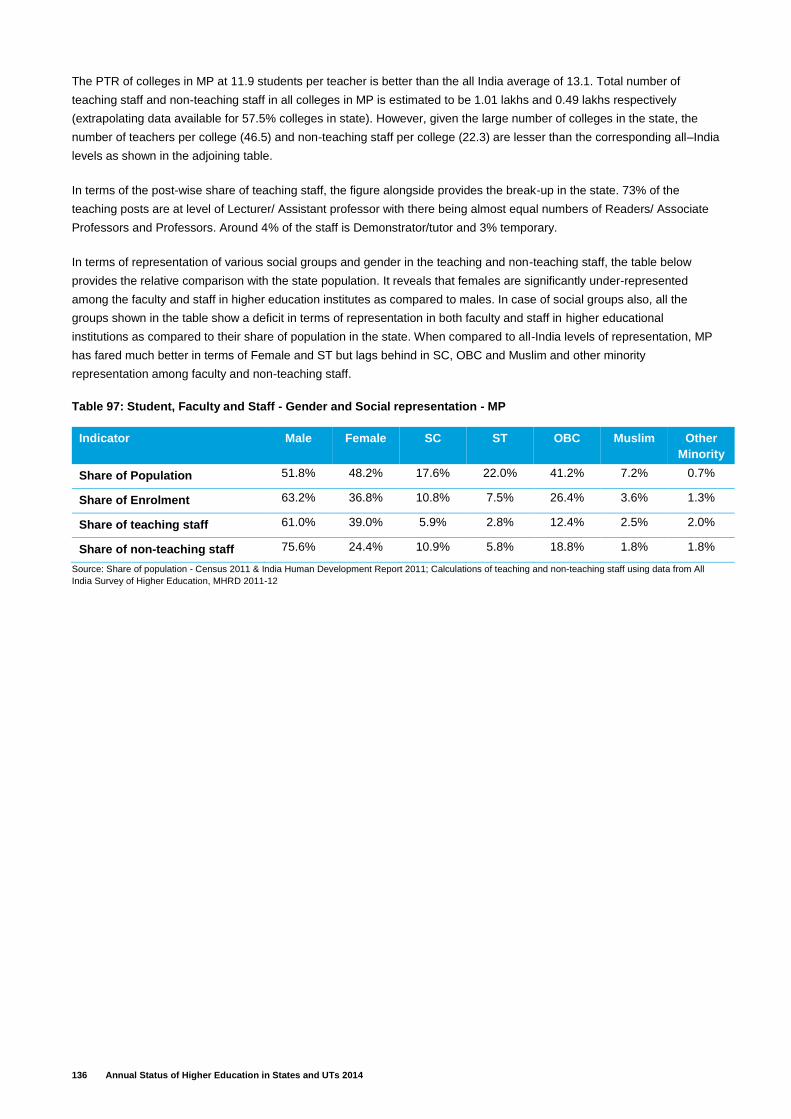
136 Annual Status of Higher Education in States and UTs 2014
The PTR of colleges in MP at 11.9 students per teacher is better than the all India average of 13.1. Total number of
teaching staff and non-teaching staff in all colleges in MP is estimated to be 1.01 lakhs and 0.49 lakhs respectively
(extrapolating data available for 57.5% colleges in state). However, given the large number of colleges in the state, the
number of teachers per college (46.5) and non-teaching staff per college (22.3) are lesser than the corresponding all–India
levels as shown in the adjoining table.
In terms of the post-wise share of teaching staff, the figure alongside provides the break-up in the state. 73% of the
teaching posts are at level of Lecturer/ Assistant professor with there being almost equal numbers of Readers/ Associate
Professors and Professors. Around 4% of the staff is Demonstrator/tutor and 3% temporary.
In terms of representation of various social groups and gender in the teaching and non-teaching staff, the table below
provides the relative comparison with the state population. It reveals that females are significantly under-represented
among the faculty and staff in higher education institutes as compared to males. In case of social groups also, all the
groups shown in the table show a deficit in terms of representation in both faculty and staff in higher educational
institutions as compared to their share of population in the state. When compared to all-India levels of representation, MP
has fared much better in terms of Female and ST but lags behind in SC, OBC and Muslim and other minority
representation among faculty and non-teaching staff.
Table 97: Student, Faculty and Staff - Gender and Social representation - MP
Indicator Male Female SC ST OBC Muslim Other
Minority
Share of Population 51.8% 48.2% 17.6% 22.0% 41.2% 7.2% 0.7%
Share of Enrolment 63.2% 36.8% 10.8% 7.5% 26.4% 3.6% 1.3%
Share of teaching staff 61.0% 39.0% 5.9% 2.8% 12.4% 2.5% 2.0%
Share of non-teaching staff 75.6% 24.4% 10.9% 5.8% 18.8% 1.8% 1.8%
Source: Share of population - Census 2011 & India Human Development Report 2011; Calculations of teaching and non-teaching staff using data from All
India Survey of Higher Education, MHRD 2011-12
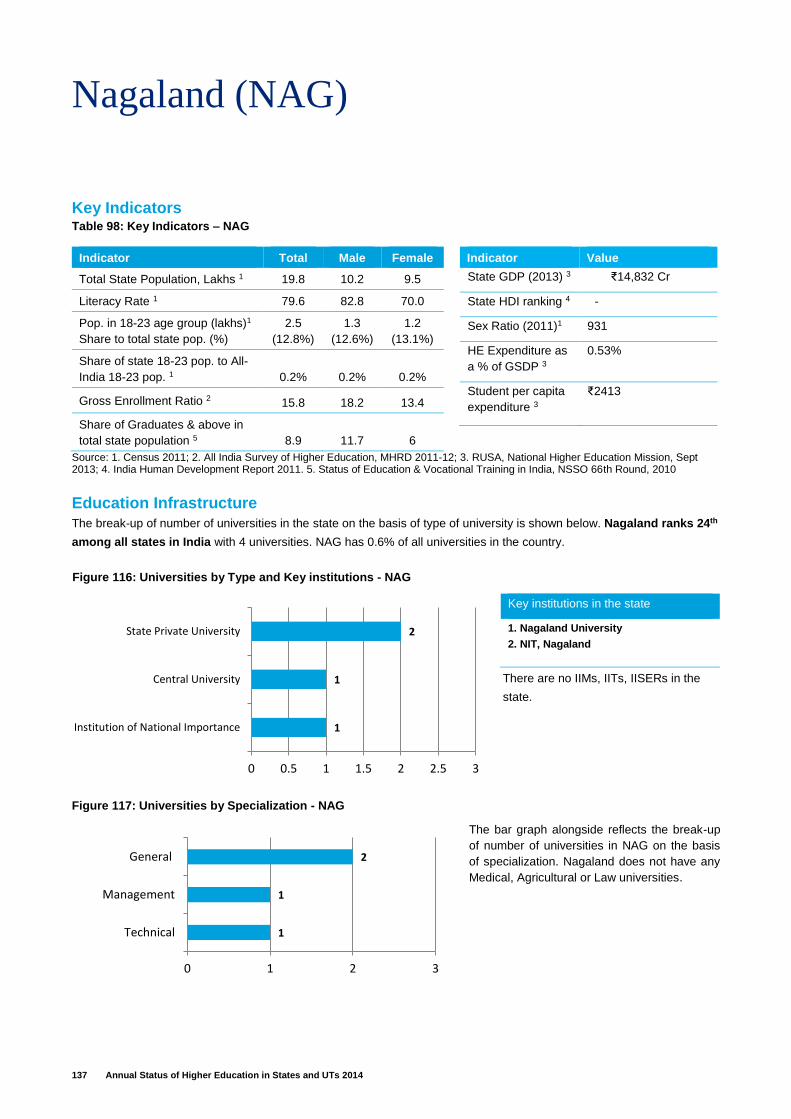
137 Annual Status of Higher Education in States and UTs 2014
Nagaland (NAG)
Key Indicators Table 98: Key Indicators – NAG
Indicator Total Male Female
Total State Population, Lakhs 1 19.8 10.2 9.5
Literacy Rate 1 79.6 82.8 70.0
Pop. in 18-23 age group (lakhs)1
Share to total state pop. (%)
2.5
(12.8%)
1.3
(12.6%)
1.2
(13.1%)
Share of state 18-23 pop. to All-
India 18-23 pop. 1 0.2% 0.2% 0.2%
Gross Enrollment Ratio 2 15.8 18.2 13.4
Share of Graduates & above in
total state population 5 8.9 11.7 6
Indicator Value
State GDP (2013) 3 ₹14,832 Cr
State HDI ranking 4 -
Sex Ratio (2011)1 931
HE Expenditure as
a % of GSDP 3
0.53%
Student per capita
expenditure 3
₹2413
Source: 1. Census 2011; 2. All India Survey of Higher Education, MHRD 2011-12; 3. RUSA, National Higher Education Mission, Sept 2013; 4. India Human Development Report 2011. 5. Status of Education & Vocational Training in India, NSSO 66th Round, 2010
Education Infrastructure
The break-up of number of universities in the state on the basis of type of university is shown below. Nagaland ranks 24th
among all states in India with 4 universities. NAG has 0.6% of all universities in the country.
There are no IIMs, IITs, IISERs in the
state.
Key institutions in the state
1. Nagaland University
2. NIT, Nagaland
The bar graph alongside reflects the break-up
of number of universities in NAG on the basis
of specialization. Nagaland does not have any
Medical, Agricultural or Law universities.
Figure 116: Universities by Type and Key institutions - NAG
1
1
2
0 1 2 3
Technical
Management
General
Figure 117: Universities by Specialization - NAG
1
1
2
0 0.5 1 1.5 2 2.5 3
Institution of National Importance
Central University
State Private University

138 Annual Status of Higher Education in States and UTs 2014
Table 99: College & Institution Indicators - NAG
NAG with 57 colleges has a share of 0.16% of all colleges in India. In terms of access, NAG has 22 colleges per lakh
population as compared to the all India average of 25 colleges per lakh population. In terms of average enrolment per
college, NAG (486) is lower than all India average of 703. Total enrolment of students in regular mode in higher
education institutes in NAG is around 0.30 lakhs.
Out of the total colleges in the state, 92% are affiliated to universities, and the remaining are PG centre/Off-campus
centres and recognized centres. In terms of management, NAG colleges dominated by Private Aided colleges with 49%
followed by Government colleges (35.2%) and Private Unaided colleges (15.8%).
Figure 118: Type of Colleges - NAG
Table 100: Management of Colleges - NAG
Type of
Management
Share of
colleges
Share of
enrolments
Avg
enrolment
/ college
Private
Unaided
15.8% 15% 458
Private
Aided
49% 46% 455
Government 35.2% 39% 541
* Calculations in above table is based on the number of responses as given in the AISHE 2011-12
Stand-alone Institutions are those that are outside the purview of the university & college and they require recognition
from one or other statutory bodies. These include Polytechnics, PGDM, Nursing, Teacher Training, CA, CS etc. In NAG,
there are 9 such stand-alone institutions and the total enrolment in these is estimated to be around 0.01 lakhs.
Indicator Colleges Stand-alone
Institutions
Total No. of colleges/ institutions 57 9
Colleges per lakh population (18-23 yrs) 22 -
Average enrollment per college/ institution 486 155
Total estimated enrolment (Lakhs) 0.30 0.01
92%
5%
3%Types of Colleges
Affiliated College
PG Centre/Off-campus centre
Recognized Centre
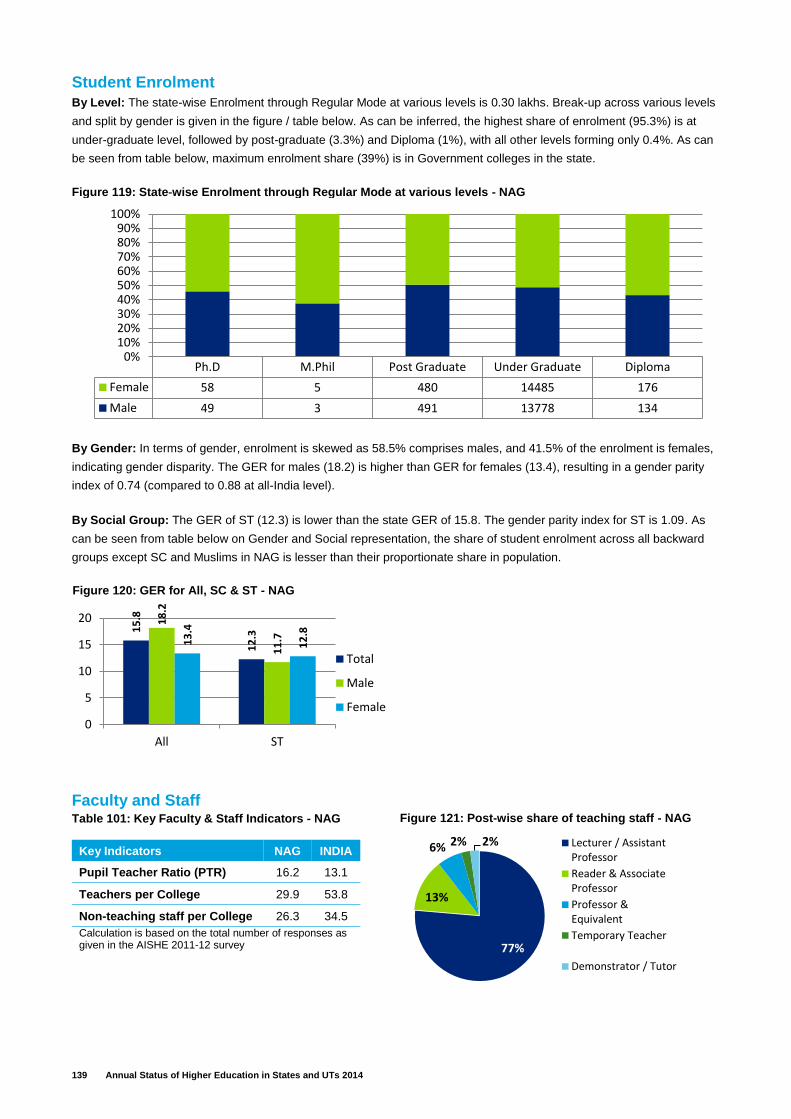
139 Annual Status of Higher Education in States and UTs 2014
Student Enrolment
By Level: The state-wise Enrolment through Regular Mode at various levels is 0.30 lakhs. Break-up across various levels
and split by gender is given in the figure / table below. As can be inferred, the highest share of enrolment (95.3%) is at
under-graduate level, followed by post-graduate (3.3%) and Diploma (1%), with all other levels forming only 0.4%. As can
be seen from table below, maximum enrolment share (39%) is in Government colleges in the state.
By Gender: In terms of gender, enrolment is skewed as 58.5% comprises males, and 41.5% of the enrolment is females,
indicating gender disparity. The GER for males (18.2) is higher than GER for females (13.4), resulting in a gender parity
index of 0.74 (compared to 0.88 at all-India level).
By Social Group: The GER of ST (12.3) is lower than the state GER of 15.8. The gender parity index for ST is 1.09. As
can be seen from table below on Gender and Social representation, the share of student enrolment across all backward
groups except SC and Muslims in NAG is lesser than their proportionate share in population.
Faculty and Staff Table 101: Key Faculty & Staff Indicators - NAG
Key Indicators NAG INDIA
Pupil Teacher Ratio (PTR) 16.2 13.1
Teachers per College 29.9 53.8
Non-teaching staff per College 26.3 34.5
Calculation is based on the total number of responses as given in the AISHE 2011-12 survey
Ph.D M.Phil Post Graduate Under Graduate Diploma
Female 58 5 480 14485 176
Male 49 3 491 13778 134
0%10%20%30%40%50%60%70%80%90%
100%
Figure 119: State‐wise Enrolment through Regular Mode at various levels - NAG
15
.8
12
.3
18
.2
11
.713
.4
12
.8
0
5
10
15
20
All ST
Total
Male
Female
Figure 120: GER for All, SC & ST - NAG
77%
13%
6% 2% 2% Lecturer / AssistantProfessor
Reader & AssociateProfessor
Professor &Equivalent
Temporary Teacher
Demonstrator / Tutor
Figure 121: Post-wise share of teaching staff - NAG
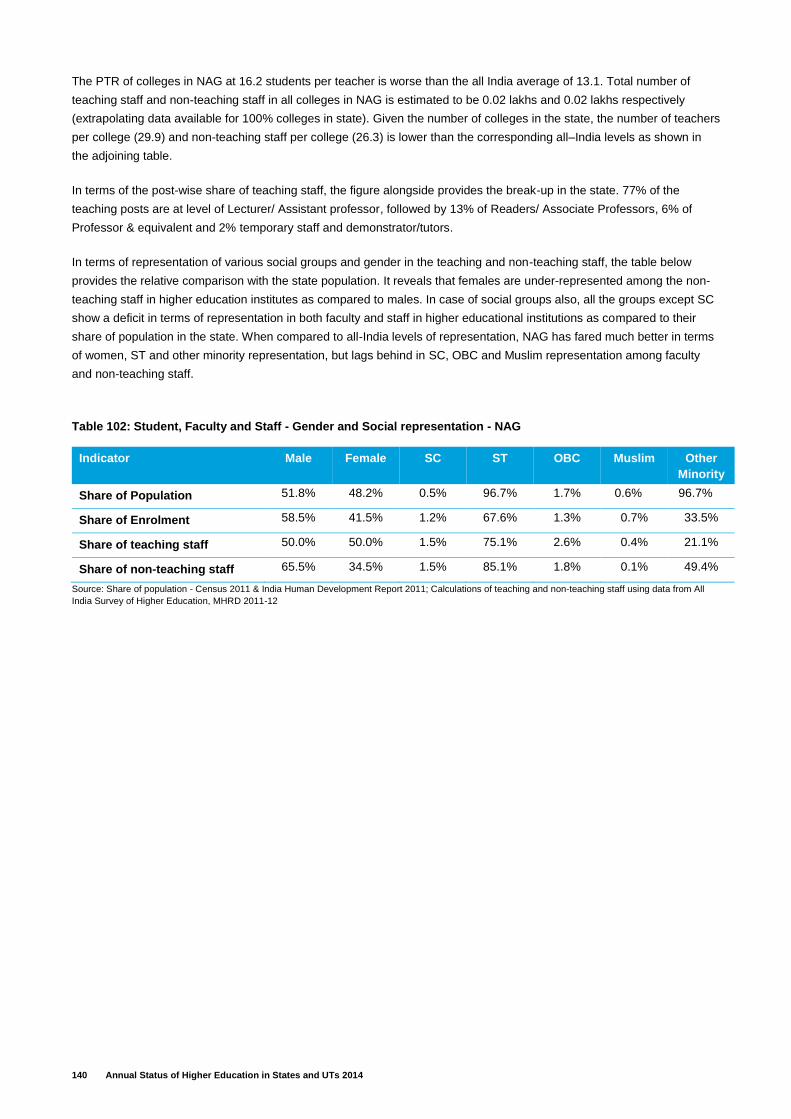
140 Annual Status of Higher Education in States and UTs 2014
The PTR of colleges in NAG at 16.2 students per teacher is worse than the all India average of 13.1. Total number of
teaching staff and non-teaching staff in all colleges in NAG is estimated to be 0.02 lakhs and 0.02 lakhs respectively
(extrapolating data available for 100% colleges in state). Given the number of colleges in the state, the number of teachers
per college (29.9) and non-teaching staff per college (26.3) is lower than the corresponding all–India levels as shown in
the adjoining table.
In terms of the post-wise share of teaching staff, the figure alongside provides the break-up in the state. 77% of the
teaching posts are at level of Lecturer/ Assistant professor, followed by 13% of Readers/ Associate Professors, 6% of
Professor & equivalent and 2% temporary staff and demonstrator/tutors.
In terms of representation of various social groups and gender in the teaching and non-teaching staff, the table below
provides the relative comparison with the state population. It reveals that females are under-represented among the non-
teaching staff in higher education institutes as compared to males. In case of social groups also, all the groups except SC
show a deficit in terms of representation in both faculty and staff in higher educational institutions as compared to their
share of population in the state. When compared to all-India levels of representation, NAG has fared much better in terms
of women, ST and other minority representation, but lags behind in SC, OBC and Muslim representation among faculty
and non-teaching staff.
Table 102: Student, Faculty and Staff - Gender and Social representation - NAG
Indicator Male Female SC ST OBC Muslim Other
Minority
Share of Population 51.8% 48.2% 0.5% 96.7% 1.7% 0.6% 96.7%
Share of Enrolment 58.5% 41.5% 1.2% 67.6% 1.3% 0.7% 33.5%
Share of teaching staff 50.0% 50.0% 1.5% 75.1% 2.6% 0.4% 21.1%
Share of non-teaching staff 65.5% 34.5% 1.5% 85.1% 1.8% 0.1% 49.4%
Source: Share of population - Census 2011 & India Human Development Report 2011; Calculations of teaching and non-teaching staff using data from All
India Survey of Higher Education, MHRD 2011-12
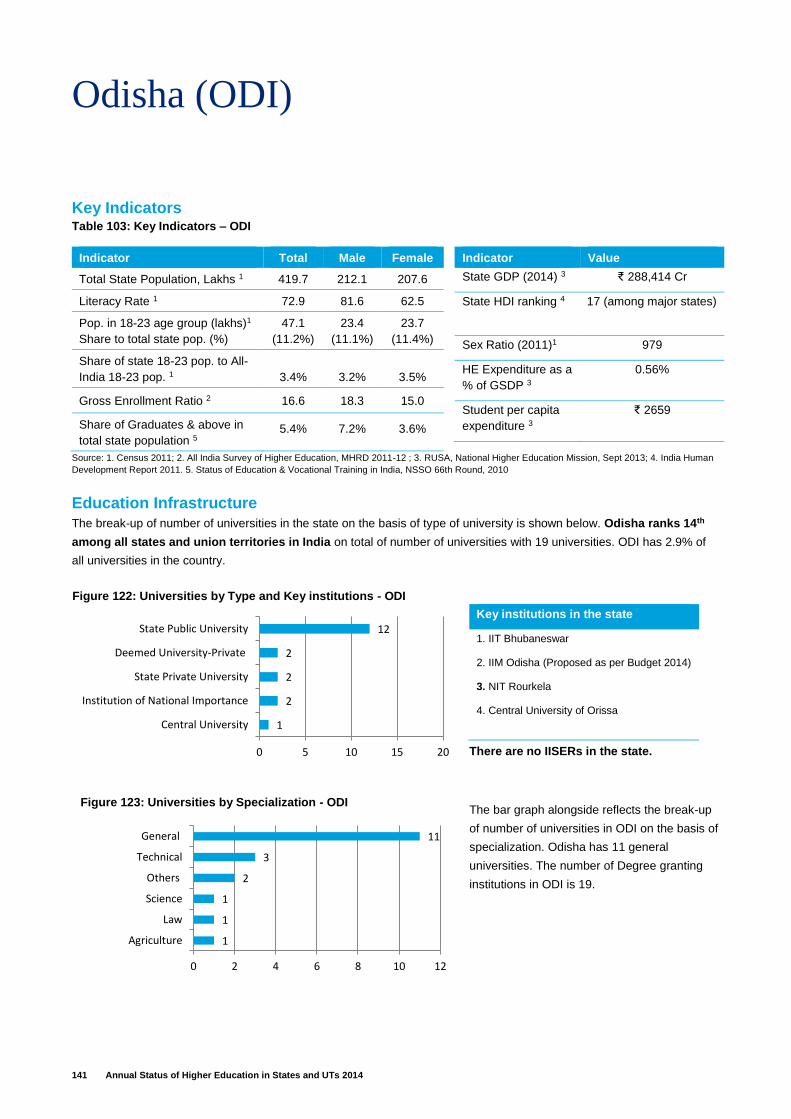
141 Annual Status of Higher Education in States and UTs 2014
Odisha (ODI)
Key Indicators Table 103: Key Indicators – ODI
Indicator Total Male Female
Total State Population, Lakhs 1 419.7 212.1 207.6
Literacy Rate 1 72.9 81.6 62.5
Pop. in 18-23 age group (lakhs)1
Share to total state pop. (%)
47.1
(11.2%)
23.4
(11.1%)
23.7
(11.4%)
Share of state 18-23 pop. to All-
India 18-23 pop. 1 3.4% 3.2% 3.5%
Gross Enrollment Ratio 2 16.6 18.3 15.0
Share of Graduates & above in
total state population 5 5.4% 7.2% 3.6%
Indicator Value
State GDP (2014) 3 ₹ 288,414 Cr
State HDI ranking 4 17 (among major states)
Sex Ratio (2011)1 979
HE Expenditure as a
% of GSDP 3
0.56%
Student per capita
expenditure 3
₹ 2659
Source: 1. Census 2011; 2. All India Survey of Higher Education, MHRD 2011-12 ; 3. RUSA, National Higher Education Mission, Sept 2013; 4. India Human
Development Report 2011. 5. Status of Education & Vocational Training in India, NSSO 66th Round, 2010
Education Infrastructure
The break-up of number of universities in the state on the basis of type of university is shown below. Odisha ranks 14th
among all states and union territories in India on total of number of universities with 19 universities. ODI has 2.9% of
all universities in the country.
There are no IISERs in the state.
The bar graph alongside reflects the break-up
of number of universities in ODI on the basis of
specialization. Odisha has 11 general
universities. The number of Degree granting
institutions in ODI is 19.
Key institutions in the state
1. IIT Bhubaneswar
2. IIM Odisha (Proposed as per Budget 2014)
3. NIT Rourkela
4. Central University of Orissa
Figure 122: Universities by Type and Key institutions - ODI
1
1
1
2
3
11
0 2 4 6 8 10 12
Agriculture
Law
Science
Others
Technical
General
Figure 123: Universities by Specialization - ODI
1
2
2
2
12
0 5 10 15 20
Central University
Institution of National Importance
State Private University
Deemed University-Private
State Public University
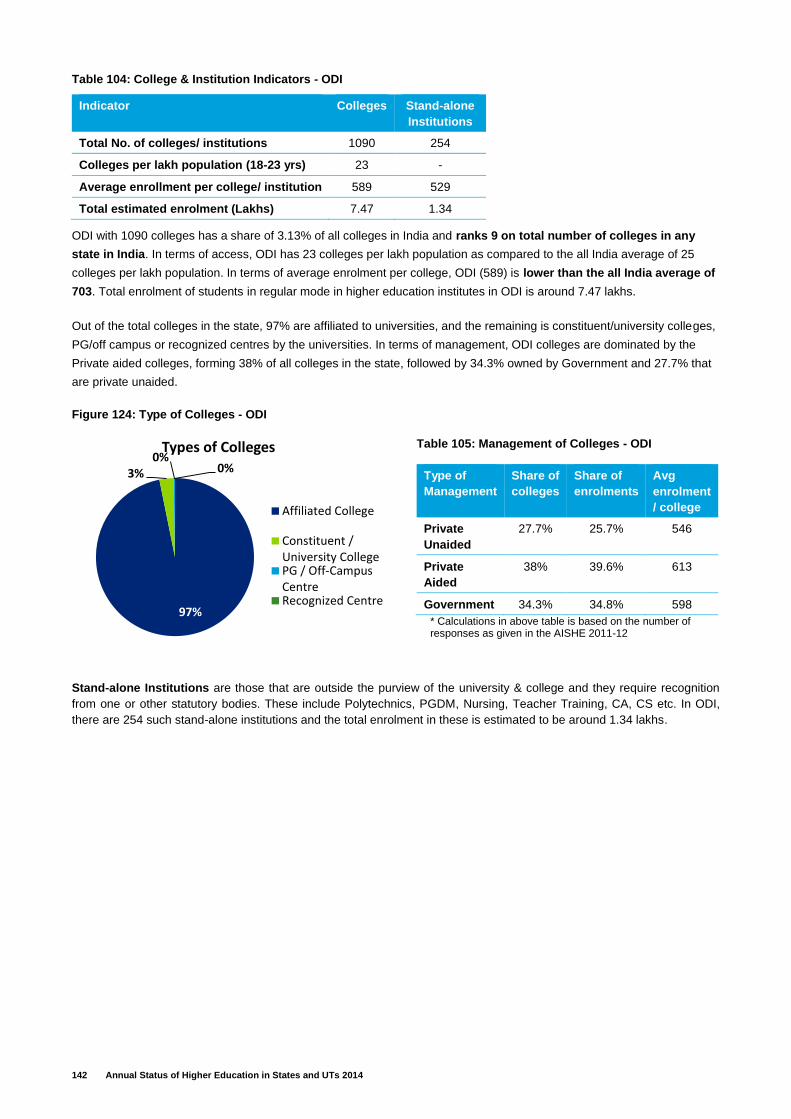
142 Annual Status of Higher Education in States and UTs 2014
Table 104: College & Institution Indicators - ODI
ODI with 1090 colleges has a share of 3.13% of all colleges in India and ranks 9 on total number of colleges in any
state in India. In terms of access, ODI has 23 colleges per lakh population as compared to the all India average of 25
colleges per lakh population. In terms of average enrolment per college, ODI (589) is lower than the all India average of
703. Total enrolment of students in regular mode in higher education institutes in ODI is around 7.47 lakhs.
Out of the total colleges in the state, 97% are affiliated to universities, and the remaining is constituent/university colleges,
PG/off campus or recognized centres by the universities. In terms of management, ODI colleges are dominated by the
Private aided colleges, forming 38% of all colleges in the state, followed by 34.3% owned by Government and 27.7% that
are private unaided.
Figure 124: Type of Colleges - ODI
Table 105: Management of Colleges - ODI
Type of
Management
Share of
colleges
Share of
enrolments
Avg
enrolment
/ college
Private
Unaided
27.7% 25.7% 546
Private
Aided
38% 39.6% 613
Government 34.3% 34.8% 598
* Calculations in above table is based on the number of responses as given in the AISHE 2011-12
Stand-alone Institutions are those that are outside the purview of the university & college and they require recognition
from one or other statutory bodies. These include Polytechnics, PGDM, Nursing, Teacher Training, CA, CS etc. In ODI,
there are 254 such stand-alone institutions and the total enrolment in these is estimated to be around 1.34 lakhs.
Indicator Colleges Stand-alone
Institutions
Total No. of colleges/ institutions 1090 254
Colleges per lakh population (18-23 yrs) 23 -
Average enrollment per college/ institution 589 529
Total estimated enrolment (Lakhs) 7.47 1.34
97%
3%0%
0%
Types of Colleges
Affiliated College
Constituent /University CollegePG / Off-CampusCentreRecognized Centre
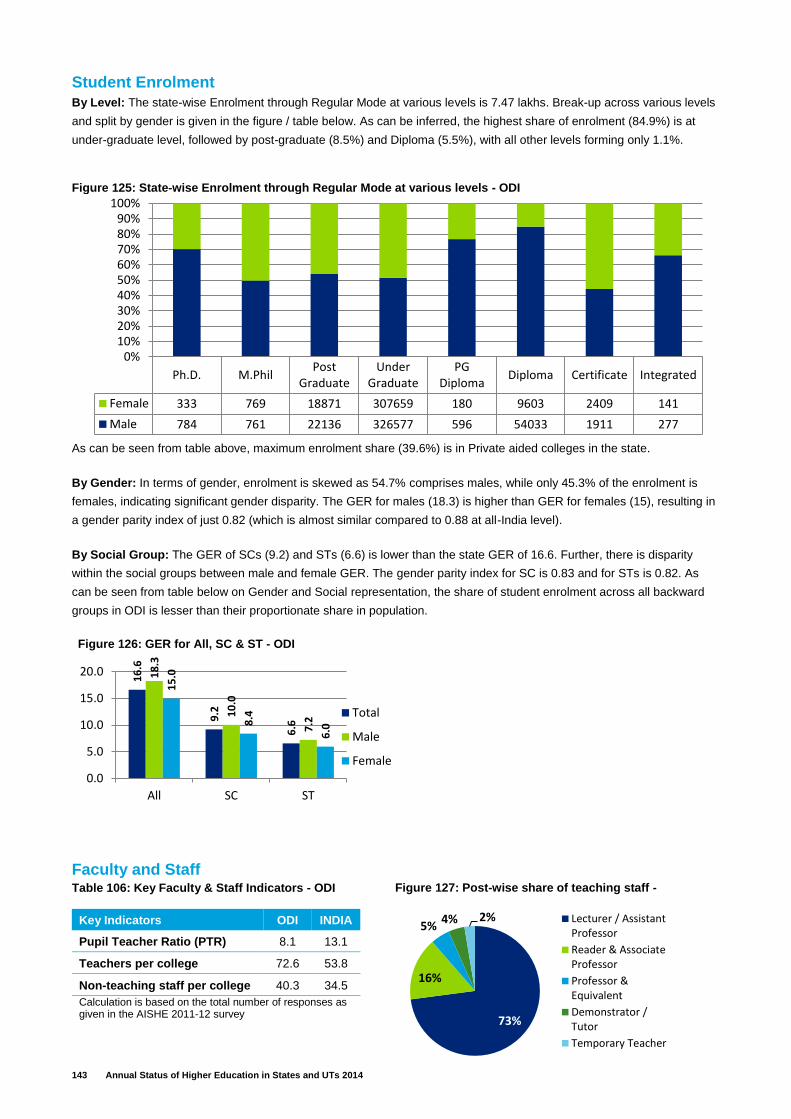
143 Annual Status of Higher Education in States and UTs 2014
Student Enrolment
By Level: The state-wise Enrolment through Regular Mode at various levels is 7.47 lakhs. Break-up across various levels
and split by gender is given in the figure / table below. As can be inferred, the highest share of enrolment (84.9%) is at
under-graduate level, followed by post-graduate (8.5%) and Diploma (5.5%), with all other levels forming only 1.1%.
As can be seen from table above, maximum enrolment share (39.6%) is in Private aided colleges in the state.
By Gender: In terms of gender, enrolment is skewed as 54.7% comprises males, while only 45.3% of the enrolment is
females, indicating significant gender disparity. The GER for males (18.3) is higher than GER for females (15), resulting in
a gender parity index of just 0.82 (which is almost similar compared to 0.88 at all-India level).
By Social Group: The GER of SCs (9.2) and STs (6.6) is lower than the state GER of 16.6. Further, there is disparity
within the social groups between male and female GER. The gender parity index for SC is 0.83 and for STs is 0.82. As
can be seen from table below on Gender and Social representation, the share of student enrolment across all backward
groups in ODI is lesser than their proportionate share in population.
Faculty and Staff Table 106: Key Faculty & Staff Indicators - ODI
Key Indicators ODI INDIA
Pupil Teacher Ratio (PTR) 8.1 13.1
Teachers per college 72.6 53.8
Non-teaching staff per college 40.3 34.5
Calculation is based on the total number of responses as given in the AISHE 2011-12 survey
Ph.D. M.PhilPost
GraduateUnder
GraduatePG
DiplomaDiploma Certificate Integrated
Female 333 769 18871 307659 180 9603 2409 141
Male 784 761 22136 326577 596 54033 1911 277
0%10%20%30%40%50%60%70%80%90%
100%Figure 125: State‐wise Enrolment through Regular Mode at various levels - ODI
16
.6
9.2
6.6
18
.3
10
.0
7.2
15
.0
8.4
6.0
0.0
5.0
10.0
15.0
20.0
All SC ST
Total
Male
Female
Figure 126: GER for All, SC & ST - ODI
73%
16%
5%4% 2% Lecturer / Assistant
Professor
Reader & AssociateProfessor
Professor &Equivalent
Demonstrator /Tutor
Temporary Teacher
Figure 127: Post-wise share of teaching staff -
ODI
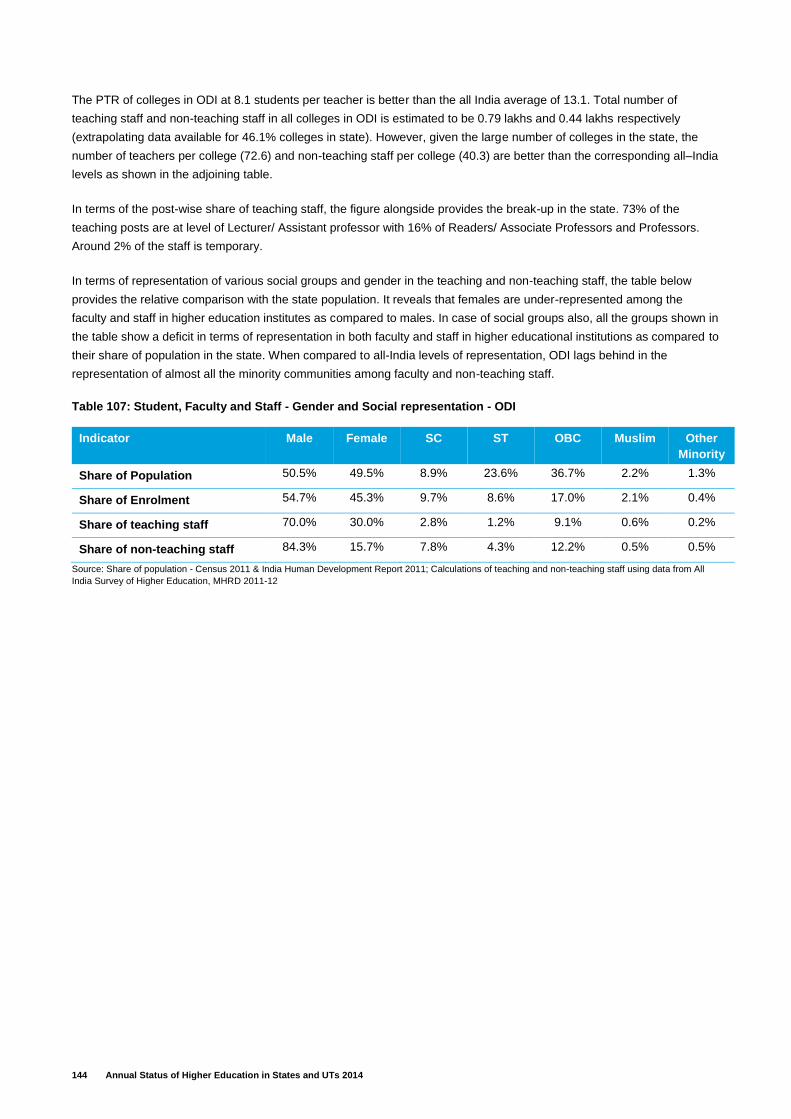
144 Annual Status of Higher Education in States and UTs 2014
The PTR of colleges in ODI at 8.1 students per teacher is better than the all India average of 13.1. Total number of
teaching staff and non-teaching staff in all colleges in ODI is estimated to be 0.79 lakhs and 0.44 lakhs respectively
(extrapolating data available for 46.1% colleges in state). However, given the large number of colleges in the state, the
number of teachers per college (72.6) and non-teaching staff per college (40.3) are better than the corresponding all–India
levels as shown in the adjoining table.
In terms of the post-wise share of teaching staff, the figure alongside provides the break-up in the state. 73% of the
teaching posts are at level of Lecturer/ Assistant professor with 16% of Readers/ Associate Professors and Professors.
Around 2% of the staff is temporary.
In terms of representation of various social groups and gender in the teaching and non-teaching staff, the table below
provides the relative comparison with the state population. It reveals that females are under-represented among the
faculty and staff in higher education institutes as compared to males. In case of social groups also, all the groups shown in
the table show a deficit in terms of representation in both faculty and staff in higher educational institutions as compared to
their share of population in the state. When compared to all-India levels of representation, ODI lags behind in the
representation of almost all the minority communities among faculty and non-teaching staff.
Table 107: Student, Faculty and Staff - Gender and Social representation - ODI
Indicator Male Female SC ST OBC Muslim Other
Minority
Share of Population 50.5% 49.5% 8.9% 23.6% 36.7% 2.2% 1.3%
Share of Enrolment 54.7% 45.3% 9.7% 8.6% 17.0% 2.1% 0.4%
Share of teaching staff 70.0% 30.0% 2.8% 1.2% 9.1% 0.6% 0.2%
Share of non-teaching staff 84.3% 15.7% 7.8% 4.3% 12.2% 0.5% 0.5%
Source: Share of population - Census 2011 & India Human Development Report 2011; Calculations of teaching and non-teaching staff using data from All
India Survey of Higher Education, MHRD 2011-12
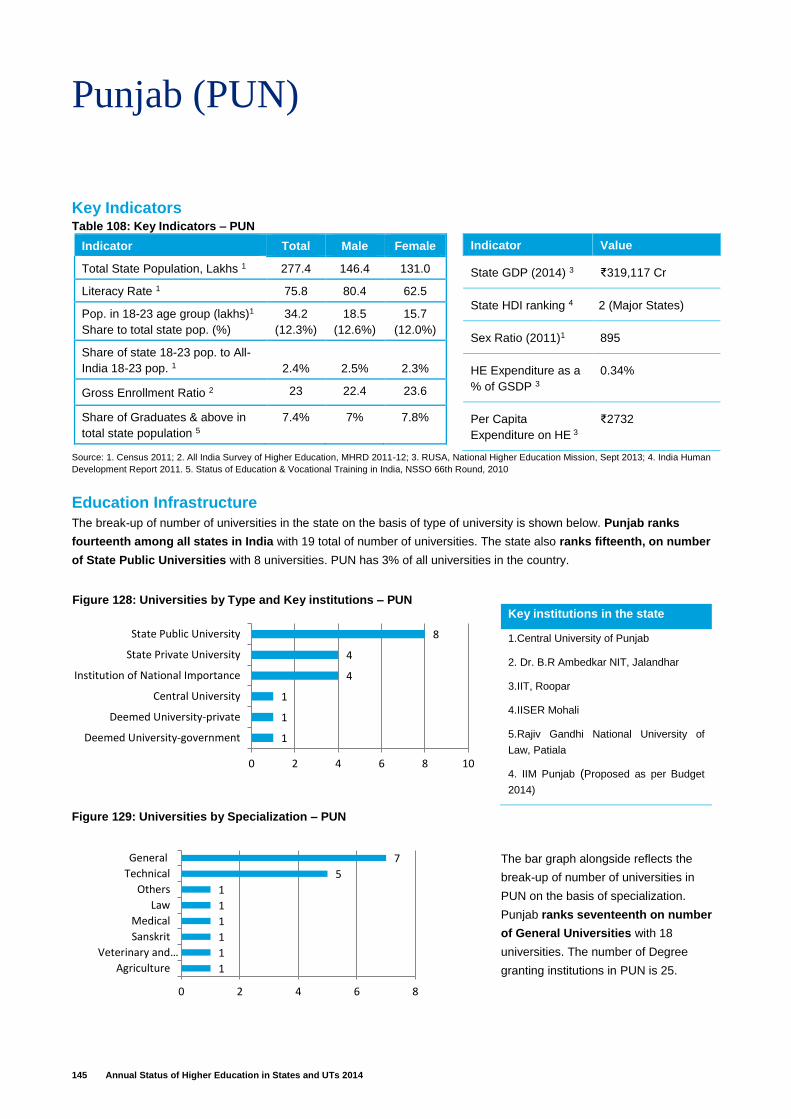
145 Annual Status of Higher Education in States and UTs 2014
Punjab (PUN)
Key Indicators Table 108: Key Indicators – PUN
Indicator Total Male Female
Total State Population, Lakhs 1 277.4 146.4 131.0
Literacy Rate 1 75.8 80.4 62.5
Pop. in 18-23 age group (lakhs)1
Share to total state pop. (%)
34.2
(12.3%)
18.5
(12.6%)
15.7
(12.0%)
Share of state 18-23 pop. to All-
India 18-23 pop. 1 2.4% 2.5% 2.3%
Gross Enrollment Ratio 2 23 22.4 23.6
Share of Graduates & above in
total state population 5
7.4% 7% 7.8%
Indicator Value
State GDP (2014) 3 ₹319,117 Cr
State HDI ranking 4 2 (Major States)
Sex Ratio (2011)1 895
HE Expenditure as a
% of GSDP 3
0.34%
Per Capita
Expenditure on HE 3
₹2732
Source: 1. Census 2011; 2. All India Survey of Higher Education, MHRD 2011-12; 3. RUSA, National Higher Education Mission, Sept 2013; 4. India Human
Development Report 2011. 5. Status of Education & Vocational Training in India, NSSO 66th Round, 2010
Education Infrastructure
The break-up of number of universities in the state on the basis of type of university is shown below. Punjab ranks
fourteenth among all states in India with 19 total of number of universities. The state also ranks fifteenth, on number
of State Public Universities with 8 universities. PUN has 3% of all universities in the country.
The bar graph alongside reflects the
break-up of number of universities in
PUN on the basis of specialization.
Punjab ranks seventeenth on number
of General Universities with 18
universities. The number of Degree
granting institutions in PUN is 25.
Key institutions in the state
1.Central University of Punjab
2. Dr. B.R Ambedkar NIT, Jalandhar
3.IIT, Roopar
4.IISER Mohali
5.Rajiv Gandhi National University of
Law, Patiala
4. IIM Punjab (Proposed as per Budget
2014)
Figure 128: Universities by Type and Key institutions – PUN
1
1
1
1
1
1
5
7
0 2 4 6 8
Agriculture
Veterinary and…
Sanskrit
Medical
Law
Others
Technical
General
Figure 129: Universities by Specialization – PUN
1
1
1
4
4
8
0 2 4 6 8 10
Deemed University-government
Deemed University-private
Central University
Institution of National Importance
State Private University
State Public University
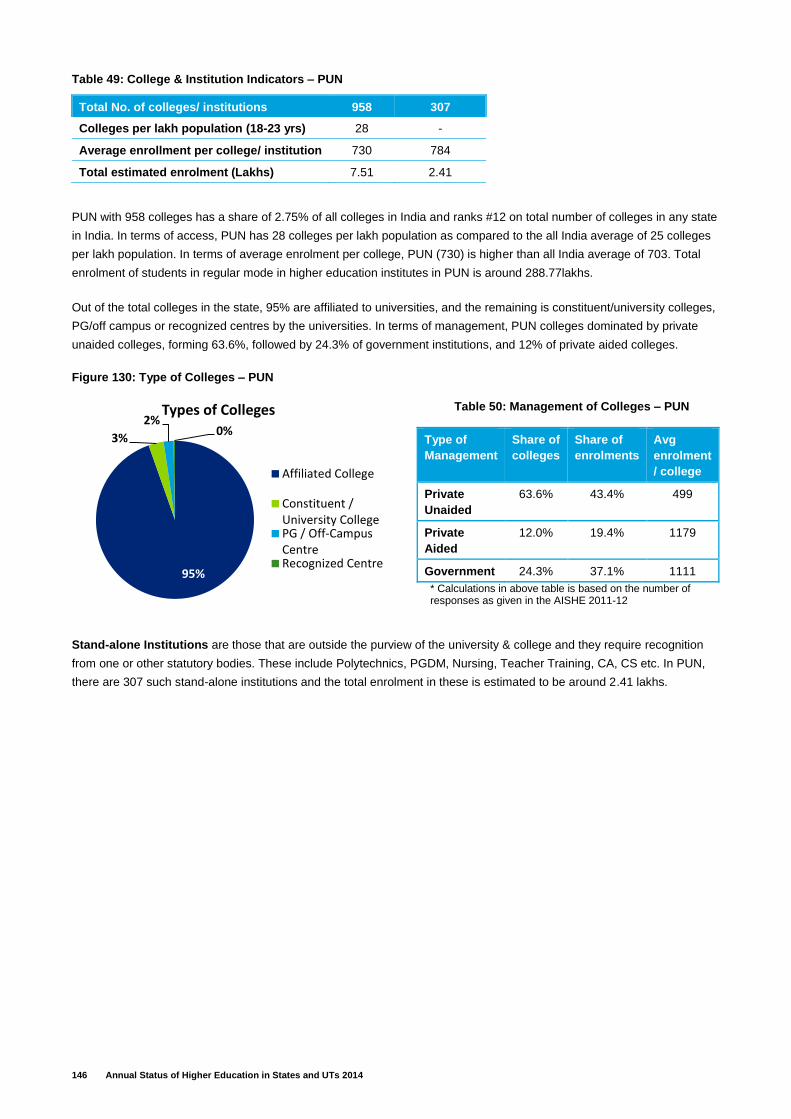
146 Annual Status of Higher Education in States and UTs 2014
Table 49: College & Institution Indicators – PUN
PUN with 958 colleges has a share of 2.75% of all colleges in India and ranks #12 on total number of colleges in any state
in India. In terms of access, PUN has 28 colleges per lakh population as compared to the all India average of 25 colleges
per lakh population. In terms of average enrolment per college, PUN (730) is higher than all India average of 703. Total
enrolment of students in regular mode in higher education institutes in PUN is around 288.77lakhs.
Out of the total colleges in the state, 95% are affiliated to universities, and the remaining is constituent/university colleges,
PG/off campus or recognized centres by the universities. In terms of management, PUN colleges dominated by private
unaided colleges, forming 63.6%, followed by 24.3% of government institutions, and 12% of private aided colleges.
Figure 130: Type of Colleges – PUN
Table 50: Management of Colleges – PUN
Type of
Management
Share of
colleges
Share of
enrolments
Avg
enrolment
/ college
Private
Unaided
63.6% 43.4% 499
Private
Aided
12.0% 19.4% 1179
Government 24.3% 37.1% 1111
* Calculations in above table is based on the number of responses as given in the AISHE 2011-12
Stand-alone Institutions are those that are outside the purview of the university & college and they require recognition
from one or other statutory bodies. These include Polytechnics, PGDM, Nursing, Teacher Training, CA, CS etc. In PUN,
there are 307 such stand-alone institutions and the total enrolment in these is estimated to be around 2.41 lakhs.
Total No. of colleges/ institutions 958 307
Colleges per lakh population (18-23 yrs) 28 -
Average enrollment per college/ institution 730 784
Total estimated enrolment (Lakhs) 7.51 2.41
95%
3%
2%0%
Types of Colleges
Affiliated College
Constituent /University CollegePG / Off-CampusCentreRecognized Centre
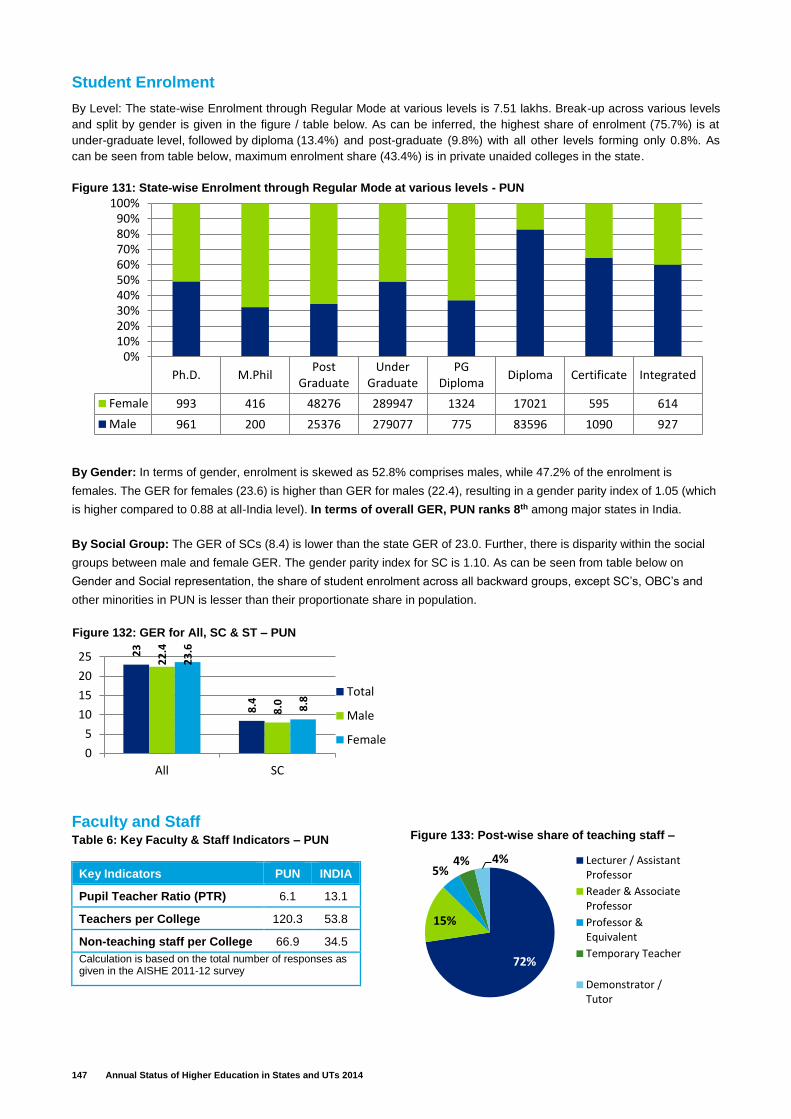
147 Annual Status of Higher Education in States and UTs 2014
Student Enrolment
By Level: The state-wise Enrolment through Regular Mode at various levels is 7.51 lakhs. Break-up across various levels
and split by gender is given in the figure / table below. As can be inferred, the highest share of enrolment (75.7%) is at
under-graduate level, followed by diploma (13.4%) and post-graduate (9.8%) with all other levels forming only 0.8%. As
can be seen from table below, maximum enrolment share (43.4%) is in private unaided colleges in the state.
By Gender: In terms of gender, enrolment is skewed as 52.8% comprises males, while 47.2% of the enrolment is
females. The GER for females (23.6) is higher than GER for males (22.4), resulting in a gender parity index of 1.05 (which
is higher compared to 0.88 at all-India level). In terms of overall GER, PUN ranks 8th among major states in India.
By Social Group: The GER of SCs (8.4) is lower than the state GER of 23.0. Further, there is disparity within the social
groups between male and female GER. The gender parity index for SC is 1.10. As can be seen from table below on
Gender and Social representation, the share of student enrolment across all backward groups, except SC’s, OBC’s and
other minorities in PUN is lesser than their proportionate share in population.
Faculty and Staff Table 6: Key Faculty & Staff Indicators – PUN
Key Indicators PUN INDIA
Pupil Teacher Ratio (PTR) 6.1 13.1
Teachers per College 120.3 53.8
Non-teaching staff per College 66.9 34.5
Calculation is based on the total number of responses as given in the AISHE 2011-12 survey
Ph.D. M.PhilPost
GraduateUnder
GraduatePG
DiplomaDiploma Certificate Integrated
Female 993 416 48276 289947 1324 17021 595 614
Male 961 200 25376 279077 775 83596 1090 927
0%10%20%30%40%50%60%70%80%90%
100%Figure 131: State‐wise Enrolment through Regular Mode at various levels - PUN
23
8.4
22
.4
8.0
23
.6
8.8
0
5
10
15
20
25
All SC
Total
Male
Female
Figure 132: GER for All, SC & ST – PUN
72%
15%
5%4% 4% Lecturer / Assistant
Professor
Reader & AssociateProfessor
Professor &Equivalent
Temporary Teacher
Demonstrator /Tutor
Figure 133: Post-wise share of teaching staff –
PUN
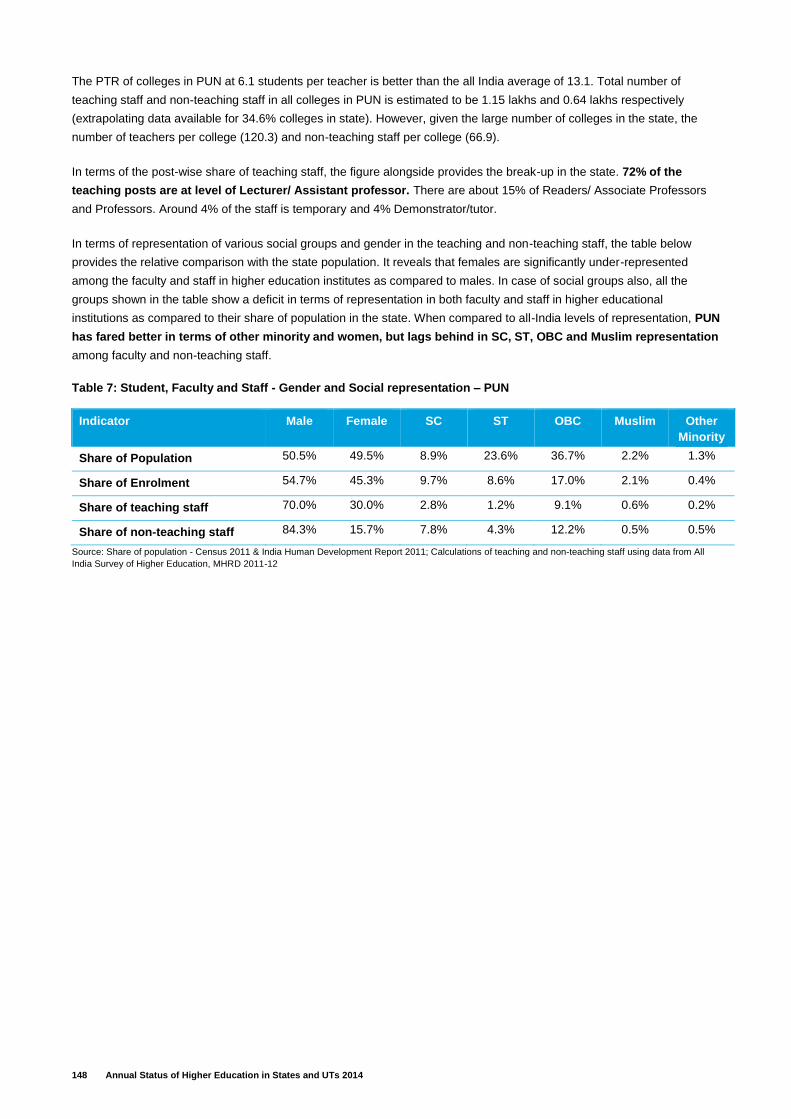
148 Annual Status of Higher Education in States and UTs 2014
The PTR of colleges in PUN at 6.1 students per teacher is better than the all India average of 13.1. Total number of
teaching staff and non-teaching staff in all colleges in PUN is estimated to be 1.15 lakhs and 0.64 lakhs respectively
(extrapolating data available for 34.6% colleges in state). However, given the large number of colleges in the state, the
number of teachers per college (120.3) and non-teaching staff per college (66.9).
In terms of the post-wise share of teaching staff, the figure alongside provides the break-up in the state. 72% of the
teaching posts are at level of Lecturer/ Assistant professor. There are about 15% of Readers/ Associate Professors
and Professors. Around 4% of the staff is temporary and 4% Demonstrator/tutor.
In terms of representation of various social groups and gender in the teaching and non-teaching staff, the table below
provides the relative comparison with the state population. It reveals that females are significantly under-represented
among the faculty and staff in higher education institutes as compared to males. In case of social groups also, all the
groups shown in the table show a deficit in terms of representation in both faculty and staff in higher educational
institutions as compared to their share of population in the state. When compared to all-India levels of representation, PUN
has fared better in terms of other minority and women, but lags behind in SC, ST, OBC and Muslim representation
among faculty and non-teaching staff.
Table 7: Student, Faculty and Staff - Gender and Social representation – PUN
Indicator Male Female SC ST OBC Muslim Other
Minority
Share of Population 50.5% 49.5% 8.9% 23.6% 36.7% 2.2% 1.3%
Share of Enrolment 54.7% 45.3% 9.7% 8.6% 17.0% 2.1% 0.4%
Share of teaching staff 70.0% 30.0% 2.8% 1.2% 9.1% 0.6% 0.2%
Share of non-teaching staff 84.3% 15.7% 7.8% 4.3% 12.2% 0.5% 0.5%
Source: Share of population - Census 2011 & India Human Development Report 2011; Calculations of teaching and non-teaching staff using data from All
India Survey of Higher Education, MHRD 2011-12
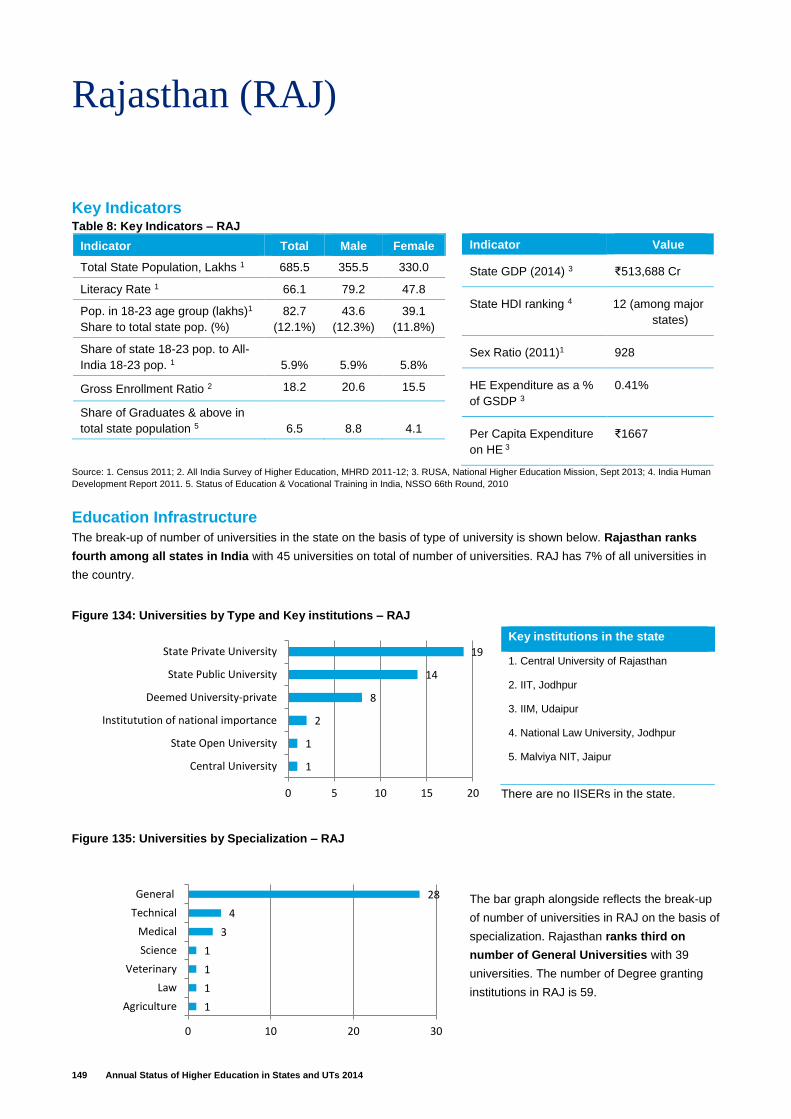
149 Annual Status of Higher Education in States and UTs 2014
Rajasthan (RAJ)
Key Indicators Table 8: Key Indicators – RAJ
Indicator Total Male Female
Total State Population, Lakhs 1 685.5 355.5 330.0
Literacy Rate 1 66.1 79.2 47.8
Pop. in 18-23 age group (lakhs)1
Share to total state pop. (%)
82.7
(12.1%)
43.6
(12.3%)
39.1
(11.8%)
Share of state 18-23 pop. to All-
India 18-23 pop. 1 5.9% 5.9% 5.8%
Gross Enrollment Ratio 2 18.2 20.6 15.5
Share of Graduates & above in
total state population 5 6.5 8.8 4.1
Indicator Value
State GDP (2014) 3 ₹513,688 Cr
State HDI ranking 4 12 (among major
states)
Sex Ratio (2011)1 928
HE Expenditure as a %
of GSDP 3
0.41%
Per Capita Expenditure
on HE 3
₹1667
Source: 1. Census 2011; 2. All India Survey of Higher Education, MHRD 2011-12; 3. RUSA, National Higher Education Mission, Sept 2013; 4. India Human
Development Report 2011. 5. Status of Education & Vocational Training in India, NSSO 66th Round, 2010
Education Infrastructure
The break-up of number of universities in the state on the basis of type of university is shown below. Rajasthan ranks
fourth among all states in India with 45 universities on total of number of universities. RAJ has 7% of all universities in
the country.
There are no IISERs in the state.
Key institutions in the state
1. Central University of Rajasthan
2. IIT, Jodhpur
3. IIM, Udaipur
4. National Law University, Jodhpur
5. Malviya NIT, Jaipur
The bar graph alongside reflects the break-up
of number of universities in RAJ on the basis of
specialization. Rajasthan ranks third on
number of General Universities with 39
universities. The number of Degree granting
institutions in RAJ is 59.
Figure 134: Universities by Type and Key institutions – RAJ
1
1
1
1
3
4
28
0 10 20 30
Agriculture
Law
Veterinary
Science
Medical
Technical
General
Figure 135: Universities by Specialization – RAJ
1
1
2
8
14
19
0 5 10 15 20
Central University
State Open University
Institutution of national importance
Deemed University-private
State Public University
State Private University
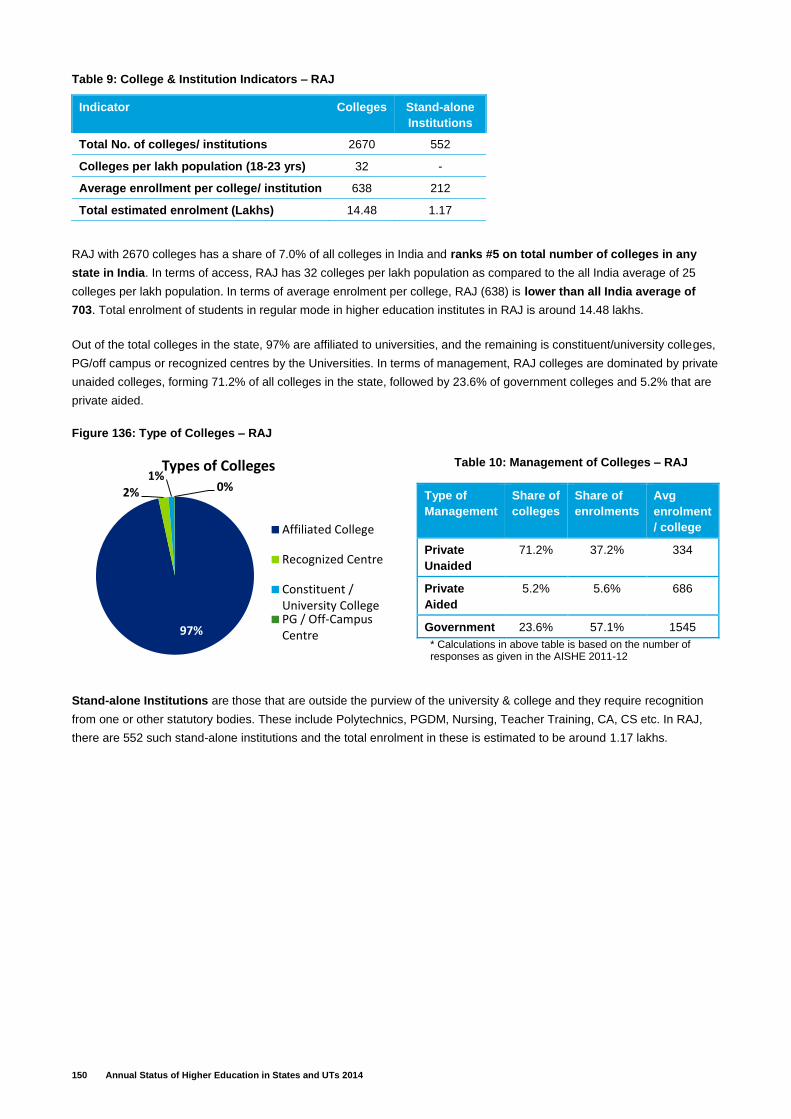
150 Annual Status of Higher Education in States and UTs 2014
Table 9: College & Institution Indicators – RAJ
RAJ with 2670 colleges has a share of 7.0% of all colleges in India and ranks #5 on total number of colleges in any
state in India. In terms of access, RAJ has 32 colleges per lakh population as compared to the all India average of 25
colleges per lakh population. In terms of average enrolment per college, RAJ (638) is lower than all India average of
703. Total enrolment of students in regular mode in higher education institutes in RAJ is around 14.48 lakhs.
Out of the total colleges in the state, 97% are affiliated to universities, and the remaining is constituent/university colleges,
PG/off campus or recognized centres by the Universities. In terms of management, RAJ colleges are dominated by private
unaided colleges, forming 71.2% of all colleges in the state, followed by 23.6% of government colleges and 5.2% that are
private aided.
Figure 136: Type of Colleges – RAJ
Table 10: Management of Colleges – RAJ
Type of
Management
Share of
colleges
Share of
enrolments
Avg
enrolment
/ college
Private
Unaided
71.2% 37.2% 334
Private
Aided
5.2% 5.6% 686
Government 23.6% 57.1% 1545
* Calculations in above table is based on the number of responses as given in the AISHE 2011-12
Stand-alone Institutions are those that are outside the purview of the university & college and they require recognition
from one or other statutory bodies. These include Polytechnics, PGDM, Nursing, Teacher Training, CA, CS etc. In RAJ,
there are 552 such stand-alone institutions and the total enrolment in these is estimated to be around 1.17 lakhs.
Indicator Colleges Stand-alone
Institutions
Total No. of colleges/ institutions 2670 552
Colleges per lakh population (18-23 yrs) 32 -
Average enrollment per college/ institution 638 212
Total estimated enrolment (Lakhs) 14.48 1.17
97%
2%
1%0%
Types of Colleges
Affiliated College
Recognized Centre
Constituent /University CollegePG / Off-CampusCentre
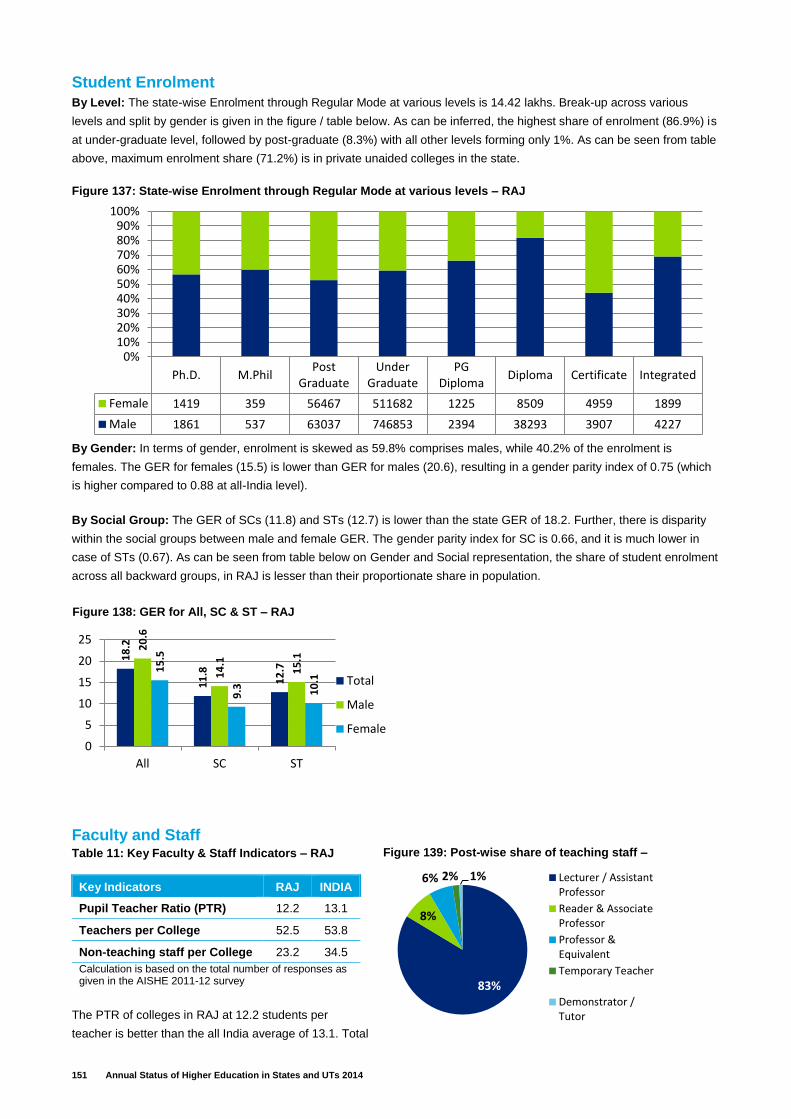
151 Annual Status of Higher Education in States and UTs 2014
Student Enrolment
By Level: The state-wise Enrolment through Regular Mode at various levels is 14.42 lakhs. Break-up across various
levels and split by gender is given in the figure / table below. As can be inferred, the highest share of enrolment (86.9%) is
at under-graduate level, followed by post-graduate (8.3%) with all other levels forming only 1%. As can be seen from table
above, maximum enrolment share (71.2%) is in private unaided colleges in the state.
By Gender: In terms of gender, enrolment is skewed as 59.8% comprises males, while 40.2% of the enrolment is
females. The GER for females (15.5) is lower than GER for males (20.6), resulting in a gender parity index of 0.75 (which
is higher compared to 0.88 at all-India level).
By Social Group: The GER of SCs (11.8) and STs (12.7) is lower than the state GER of 18.2. Further, there is disparity
within the social groups between male and female GER. The gender parity index for SC is 0.66, and it is much lower in
case of STs (0.67). As can be seen from table below on Gender and Social representation, the share of student enrolment
across all backward groups, in RAJ is lesser than their proportionate share in population.
Faculty and Staff Table 11: Key Faculty & Staff Indicators – RAJ
The PTR of colleges in RAJ at 12.2 students per
teacher is better than the all India average of 13.1. Total
Key Indicators RAJ INDIA
Pupil Teacher Ratio (PTR) 12.2 13.1
Teachers per College 52.5 53.8
Non-teaching staff per College 23.2 34.5
Calculation is based on the total number of responses as given in the AISHE 2011-12 survey
Ph.D. M.PhilPost
GraduateUnder
GraduatePG
DiplomaDiploma Certificate Integrated
Female 1419 359 56467 511682 1225 8509 4959 1899
Male 1861 537 63037 746853 2394 38293 3907 4227
0%10%20%30%40%50%60%70%80%90%
100%
Figure 137: State‐wise Enrolment through Regular Mode at various levels – RAJ
18
.2
11
.8
12
.7
20
.6
14
.1
15
.1
15
.5
9.3 10
.1
0
5
10
15
20
25
All SC ST
Total
Male
Female
Figure 138: GER for All, SC & ST – RAJ
83%
8%
6% 2% 1% Lecturer / AssistantProfessor
Reader & AssociateProfessor
Professor &Equivalent
Temporary Teacher
Demonstrator /Tutor
Figure 139: Post-wise share of teaching staff –
RAJ
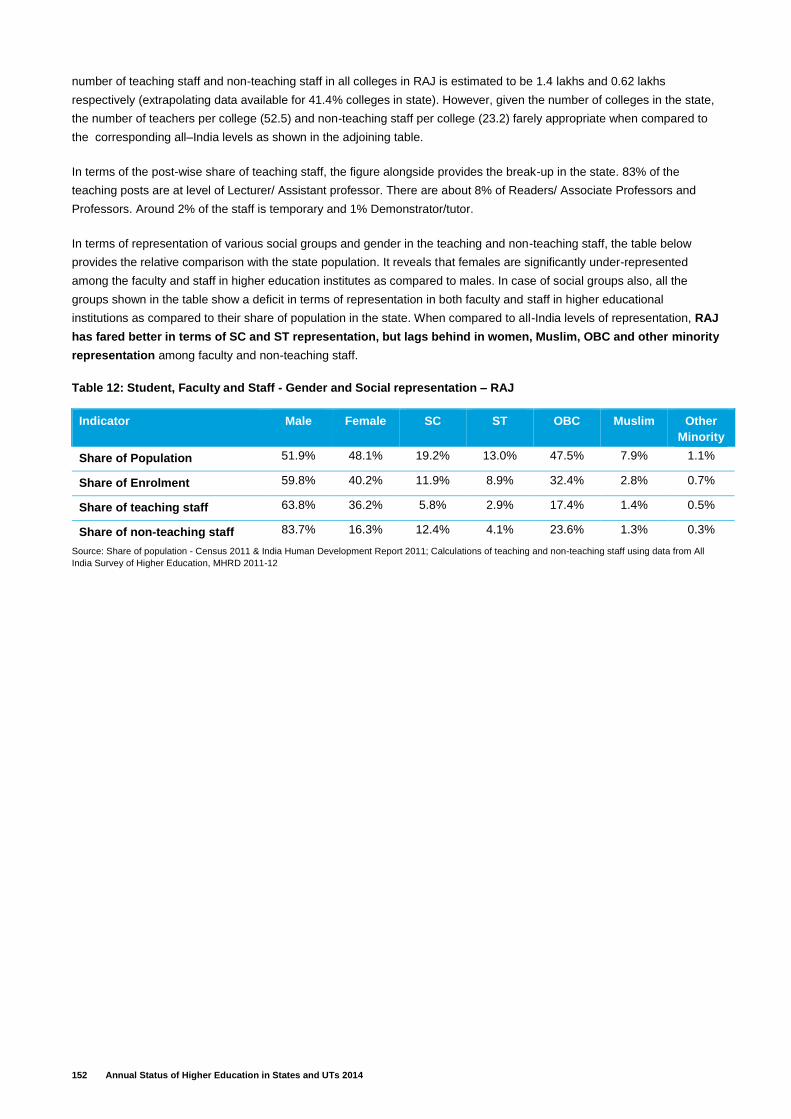
152 Annual Status of Higher Education in States and UTs 2014
number of teaching staff and non-teaching staff in all colleges in RAJ is estimated to be 1.4 lakhs and 0.62 lakhs
respectively (extrapolating data available for 41.4% colleges in state). However, given the number of colleges in the state,
the number of teachers per college (52.5) and non-teaching staff per college (23.2) farely appropriate when compared to
the corresponding all–India levels as shown in the adjoining table.
In terms of the post-wise share of teaching staff, the figure alongside provides the break-up in the state. 83% of the
teaching posts are at level of Lecturer/ Assistant professor. There are about 8% of Readers/ Associate Professors and
Professors. Around 2% of the staff is temporary and 1% Demonstrator/tutor.
In terms of representation of various social groups and gender in the teaching and non-teaching staff, the table below
provides the relative comparison with the state population. It reveals that females are significantly under-represented
among the faculty and staff in higher education institutes as compared to males. In case of social groups also, all the
groups shown in the table show a deficit in terms of representation in both faculty and staff in higher educational
institutions as compared to their share of population in the state. When compared to all-India levels of representation, RAJ
has fared better in terms of SC and ST representation, but lags behind in women, Muslim, OBC and other minority
representation among faculty and non-teaching staff.
Table 12: Student, Faculty and Staff - Gender and Social representation – RAJ
Indicator Male Female SC ST OBC Muslim Other
Minority
Share of Population 51.9% 48.1% 19.2% 13.0% 47.5% 7.9% 1.1%
Share of Enrolment 59.8% 40.2% 11.9% 8.9% 32.4% 2.8% 0.7%
Share of teaching staff 63.8% 36.2% 5.8% 2.9% 17.4% 1.4% 0.5%
Share of non-teaching staff 83.7% 16.3% 12.4% 4.1% 23.6% 1.3% 0.3%
Source: Share of population - Census 2011 & India Human Development Report 2011; Calculations of teaching and non-teaching staff using data from All
India Survey of Higher Education, MHRD 2011-12
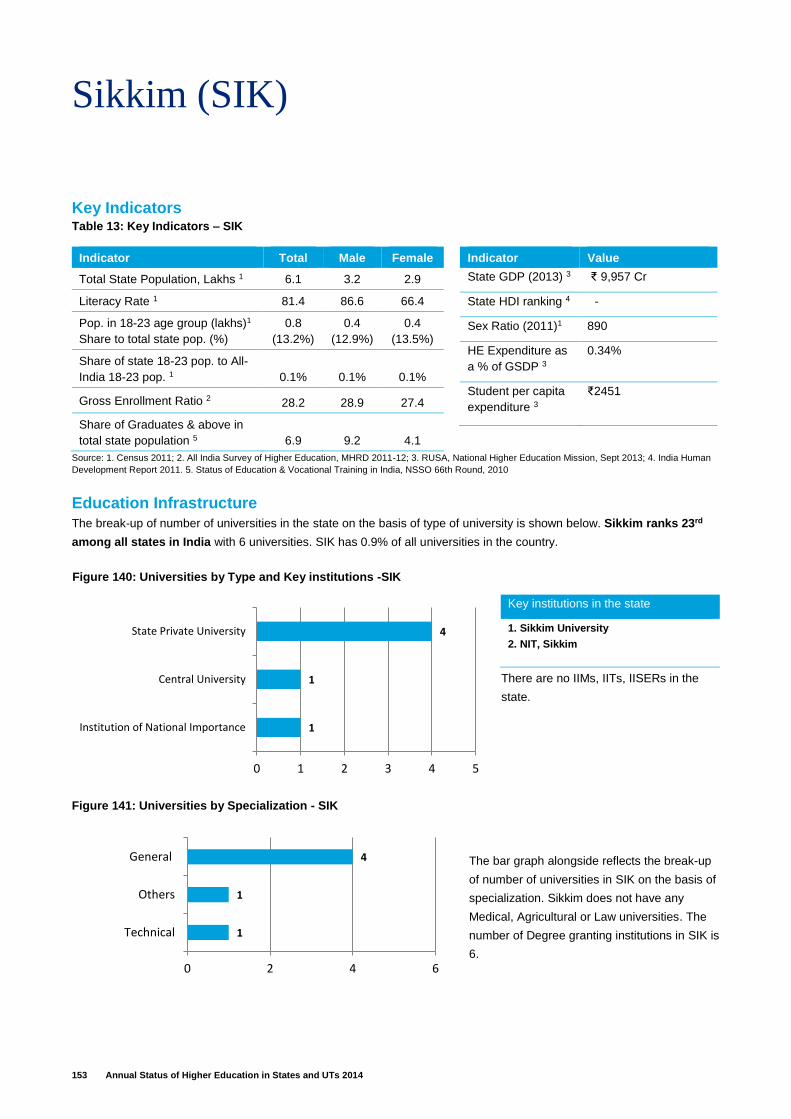
153 Annual Status of Higher Education in States and UTs 2014
Sikkim (SIK)
Key Indicators Table 13: Key Indicators – SIK
Indicator Total Male Female
Total State Population, Lakhs 1 6.1 3.2 2.9
Literacy Rate 1 81.4 86.6 66.4
Pop. in 18-23 age group (lakhs)1
Share to total state pop. (%)
0.8
(13.2%)
0.4
(12.9%)
0.4
(13.5%)
Share of state 18-23 pop. to All-
India 18-23 pop. 1 0.1% 0.1% 0.1%
Gross Enrollment Ratio 2 28.2 28.9 27.4
Share of Graduates & above in
total state population 5 6.9 9.2 4.1
Indicator Value
State GDP (2013) 3 ₹ 9,957 Cr
State HDI ranking 4 -
Sex Ratio (2011)1 890
HE Expenditure as
a % of GSDP 3
0.34%
Student per capita
expenditure 3
₹2451
Source: 1. Census 2011; 2. All India Survey of Higher Education, MHRD 2011-12; 3. RUSA, National Higher Education Mission, Sept 2013; 4. India Human
Development Report 2011. 5. Status of Education & Vocational Training in India, NSSO 66th Round, 2010
Education Infrastructure
The break-up of number of universities in the state on the basis of type of university is shown below. Sikkim ranks 23rd
among all states in India with 6 universities. SIK has 0.9% of all universities in the country.
There are no IIMs, IITs, IISERs in the
state.
Key institutions in the state
1. Sikkim University
2. NIT, Sikkim
The bar graph alongside reflects the break-up
of number of universities in SIK on the basis of
specialization. Sikkim does not have any
Medical, Agricultural or Law universities. The
number of Degree granting institutions in SIK is
6.
Figure 140: Universities by Type and Key institutions -SIK
1
1
4
0 2 4 6
Technical
Others
General
Figure 141: Universities by Specialization - SIK
1
1
4
0 1 2 3 4 5
Institution of National Importance
Central University
State Private University
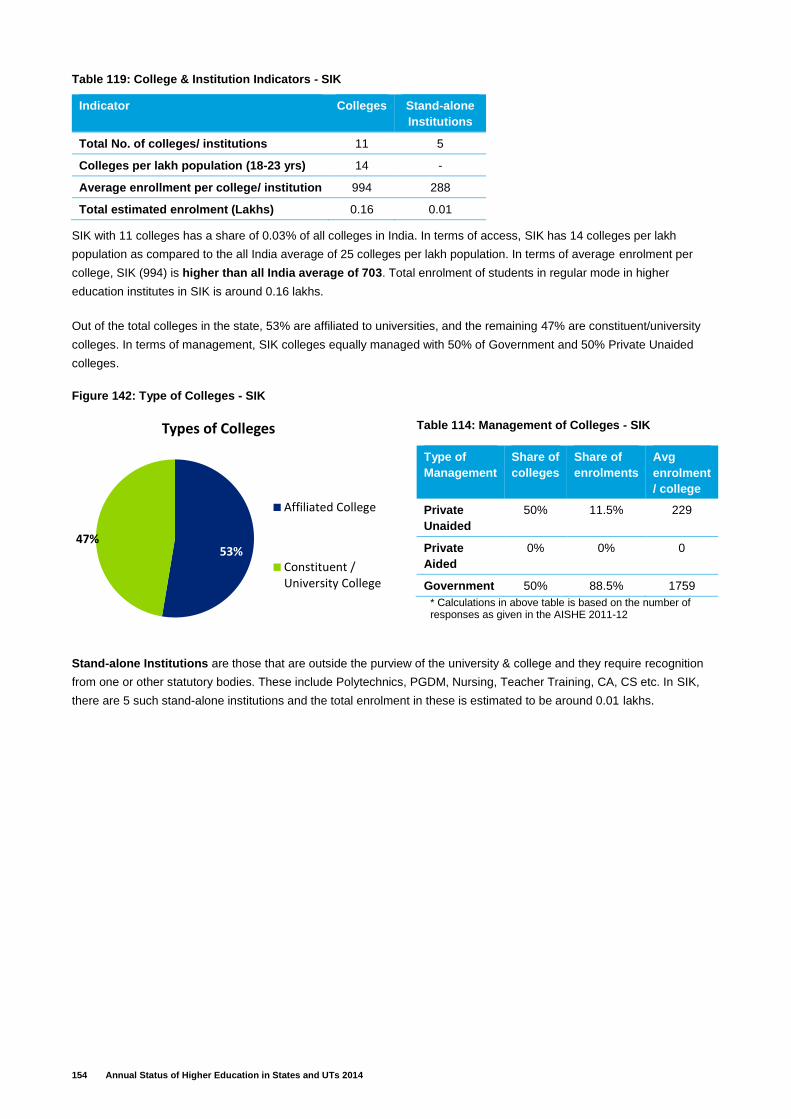
154 Annual Status of Higher Education in States and UTs 2014
Table 119: College & Institution Indicators - SIK
SIK with 11 colleges has a share of 0.03% of all colleges in India. In terms of access, SIK has 14 colleges per lakh
population as compared to the all India average of 25 colleges per lakh population. In terms of average enrolment per
college, SIK (994) is higher than all India average of 703. Total enrolment of students in regular mode in higher
education institutes in SIK is around 0.16 lakhs.
Out of the total colleges in the state, 53% are affiliated to universities, and the remaining 47% are constituent/university
colleges. In terms of management, SIK colleges equally managed with 50% of Government and 50% Private Unaided
colleges.
Figure 142: Type of Colleges - SIK
Table 114: Management of Colleges - SIK
Type of
Management
Share of
colleges
Share of
enrolments
Avg
enrolment
/ college
Private
Unaided
50% 11.5% 229
Private
Aided
0% 0% 0
Government 50% 88.5% 1759
* Calculations in above table is based on the number of responses as given in the AISHE 2011-12
Stand-alone Institutions are those that are outside the purview of the university & college and they require recognition
from one or other statutory bodies. These include Polytechnics, PGDM, Nursing, Teacher Training, CA, CS etc. In SIK,
there are 5 such stand-alone institutions and the total enrolment in these is estimated to be around 0.01 lakhs.
Indicator Colleges Stand-alone
Institutions
Total No. of colleges/ institutions 11 5
Colleges per lakh population (18-23 yrs) 14 -
Average enrollment per college/ institution 994 288
Total estimated enrolment (Lakhs) 0.16 0.01
53%47%
Types of Colleges
Affiliated College
Constituent /University College
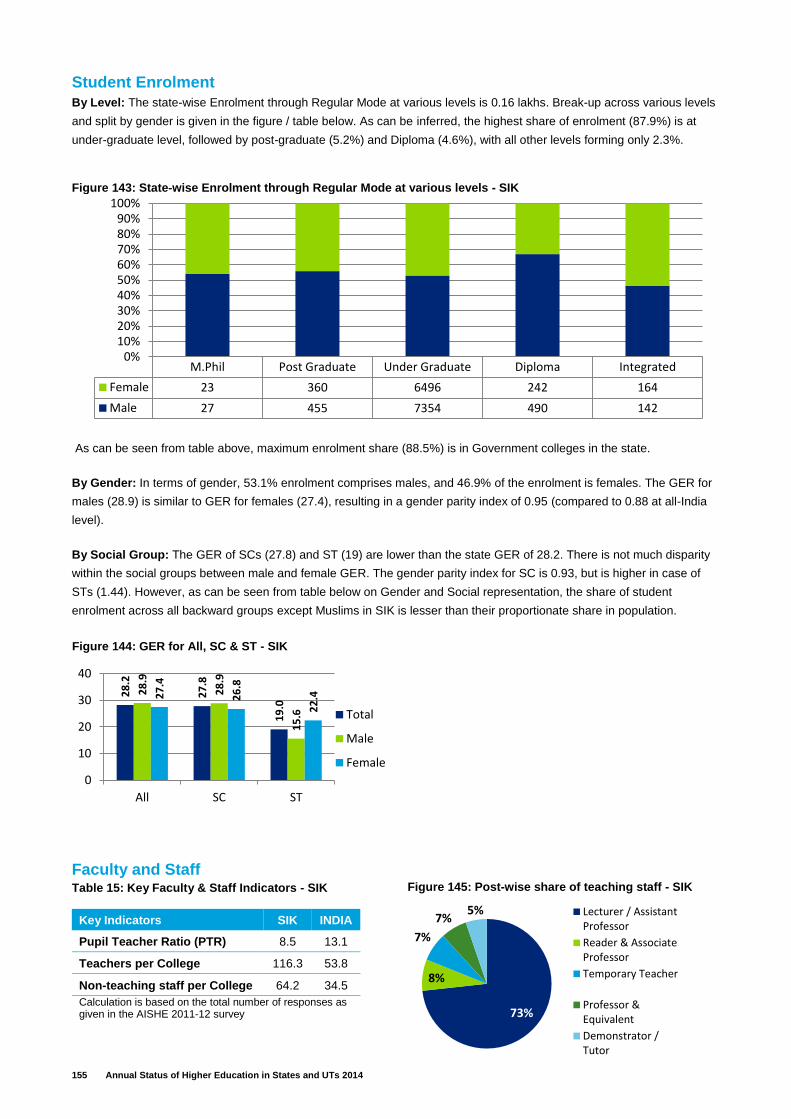
155 Annual Status of Higher Education in States and UTs 2014
Student Enrolment
By Level: The state-wise Enrolment through Regular Mode at various levels is 0.16 lakhs. Break-up across various levels
and split by gender is given in the figure / table below. As can be inferred, the highest share of enrolment (87.9%) is at
under-graduate level, followed by post-graduate (5.2%) and Diploma (4.6%), with all other levels forming only 2.3%.
As can be seen from table above, maximum enrolment share (88.5%) is in Government colleges in the state.
By Gender: In terms of gender, 53.1% enrolment comprises males, and 46.9% of the enrolment is females. The GER for
males (28.9) is similar to GER for females (27.4), resulting in a gender parity index of 0.95 (compared to 0.88 at all-India
level).
By Social Group: The GER of SCs (27.8) and ST (19) are lower than the state GER of 28.2. There is not much disparity
within the social groups between male and female GER. The gender parity index for SC is 0.93, but is higher in case of
STs (1.44). However, as can be seen from table below on Gender and Social representation, the share of student
enrolment across all backward groups except Muslims in SIK is lesser than their proportionate share in population.
Faculty and Staff Table 15: Key Faculty & Staff Indicators - SIK
Key Indicators SIK INDIA
Pupil Teacher Ratio (PTR) 8.5 13.1
Teachers per College 116.3 53.8
Non-teaching staff per College 64.2 34.5
Calculation is based on the total number of responses as given in the AISHE 2011-12 survey
M.Phil Post Graduate Under Graduate Diploma Integrated
Female 23 360 6496 242 164
Male 27 455 7354 490 142
0%10%20%30%40%50%60%70%80%90%
100%Figure 143: State‐wise Enrolment through Regular Mode at various levels - SIK
28
.2
27
.8
19
.0
28
.9
28
.9
15
.6
27
.4
26
.8
22
.4
0
10
20
30
40
All SC ST
Total
Male
Female
Figure 144: GER for All, SC & ST - SIK
73%
8%
7%
7%5% Lecturer / Assistant
Professor
Reader & AssociateProfessor
Temporary Teacher
Professor &Equivalent
Demonstrator /Tutor
Figure 145: Post-wise share of teaching staff - SIK
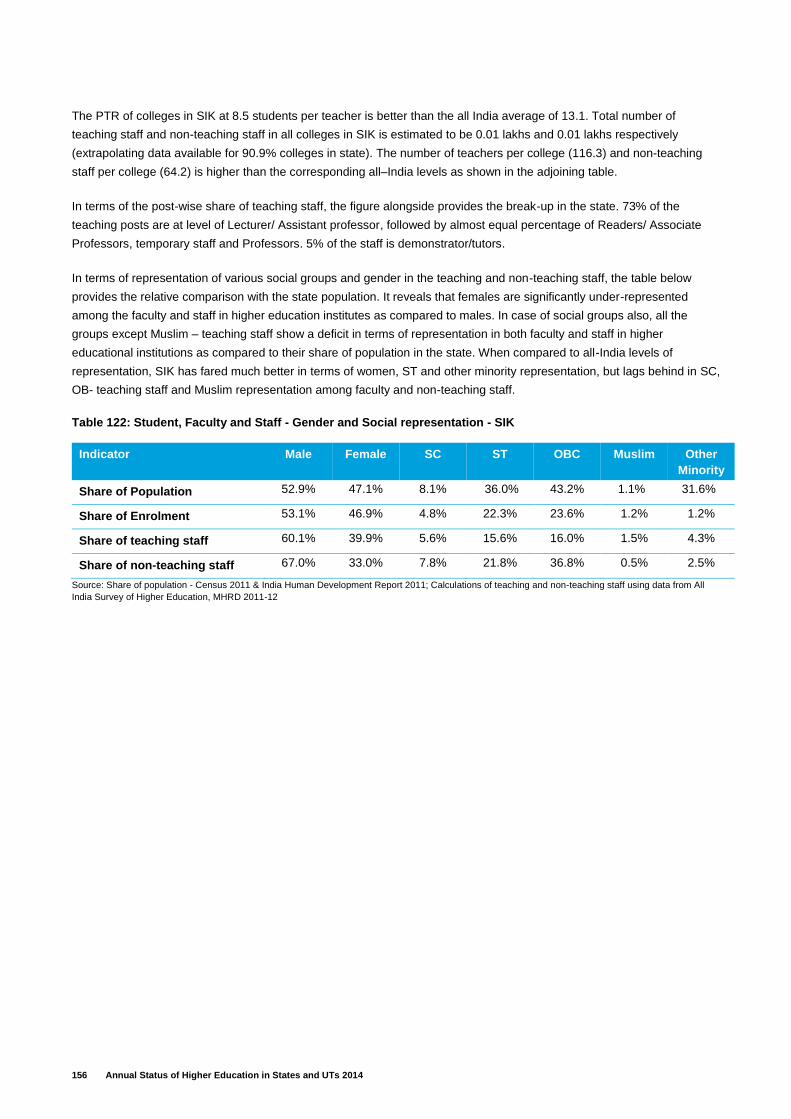
156 Annual Status of Higher Education in States and UTs 2014
The PTR of colleges in SIK at 8.5 students per teacher is better than the all India average of 13.1. Total number of
teaching staff and non-teaching staff in all colleges in SIK is estimated to be 0.01 lakhs and 0.01 lakhs respectively
(extrapolating data available for 90.9% colleges in state). The number of teachers per college (116.3) and non-teaching
staff per college (64.2) is higher than the corresponding all–India levels as shown in the adjoining table.
In terms of the post-wise share of teaching staff, the figure alongside provides the break-up in the state. 73% of the
teaching posts are at level of Lecturer/ Assistant professor, followed by almost equal percentage of Readers/ Associate
Professors, temporary staff and Professors. 5% of the staff is demonstrator/tutors.
In terms of representation of various social groups and gender in the teaching and non-teaching staff, the table below
provides the relative comparison with the state population. It reveals that females are significantly under-represented
among the faculty and staff in higher education institutes as compared to males. In case of social groups also, all the
groups except Muslim – teaching staff show a deficit in terms of representation in both faculty and staff in higher
educational institutions as compared to their share of population in the state. When compared to all-India levels of
representation, SIK has fared much better in terms of women, ST and other minority representation, but lags behind in SC,
OB- teaching staff and Muslim representation among faculty and non-teaching staff.
Table 122: Student, Faculty and Staff - Gender and Social representation - SIK
Indicator Male Female SC ST OBC Muslim Other
Minority
Share of Population 52.9% 47.1% 8.1% 36.0% 43.2% 1.1% 31.6%
Share of Enrolment 53.1% 46.9% 4.8% 22.3% 23.6% 1.2% 1.2%
Share of teaching staff 60.1% 39.9% 5.6% 15.6% 16.0% 1.5% 4.3%
Share of non-teaching staff 67.0% 33.0% 7.8% 21.8% 36.8% 0.5% 2.5%
Source: Share of population - Census 2011 & India Human Development Report 2011; Calculations of teaching and non-teaching staff using data from All
India Survey of Higher Education, MHRD 2011-12
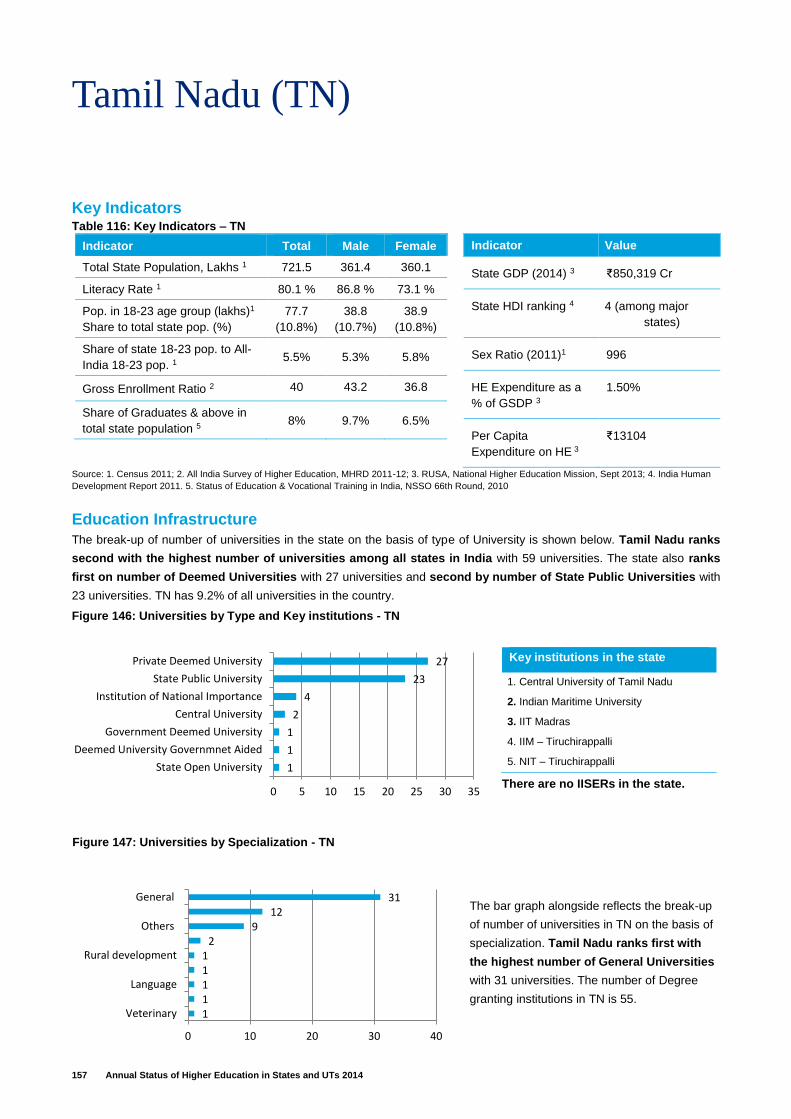
157 Annual Status of Higher Education in States and UTs 2014
Tamil Nadu (TN)
Key Indicators Table 116: Key Indicators – TN
Indicator Total Male Female
Total State Population, Lakhs 1 721.5 361.4 360.1
Literacy Rate 1 80.1 % 86.8 % 73.1 %
Pop. in 18-23 age group (lakhs)1
Share to total state pop. (%)
77.7
(10.8%)
38.8
(10.7%)
38.9
(10.8%)
Share of state 18-23 pop. to All-
India 18-23 pop. 1 5.5% 5.3% 5.8%
Gross Enrollment Ratio 2 40 43.2 36.8
Share of Graduates & above in
total state population 5 8% 9.7% 6.5%
Indicator Value
State GDP (2014) 3 ₹850,319 Cr
State HDI ranking 4 4 (among major
states)
Sex Ratio (2011)1 996
HE Expenditure as a
% of GSDP 3
1.50%
Per Capita
Expenditure on HE 3
₹13104
Source: 1. Census 2011; 2. All India Survey of Higher Education, MHRD 2011-12; 3. RUSA, National Higher Education Mission, Sept 2013; 4. India Human
Development Report 2011. 5. Status of Education & Vocational Training in India, NSSO 66th Round, 2010
Education Infrastructure
The break-up of number of universities in the state on the basis of type of University is shown below. Tamil Nadu ranks
second with the highest number of universities among all states in India with 59 universities. The state also ranks
first on number of Deemed Universities with 27 universities and second by number of State Public Universities with
23 universities. TN has 9.2% of all universities in the country.
There are no IISERs in the state.
Key institutions in the state
1. Central University of Tamil Nadu
2. Indian Maritime University
3. IIT Madras
4. IIM – Tiruchirappalli
5. NIT – Tiruchirappalli
The bar graph alongside reflects the break-up
of number of universities in TN on the basis of
specialization. Tamil Nadu ranks first with
the highest number of General Universities
with 31 universities. The number of Degree
granting institutions in TN is 55.
Figure 146: Universities by Type and Key institutions - TN
11111
29
1231
0 10 20 30 40
Veterinary
Language
Rural development
Others
General
Figure 147: Universities by Specialization - TN
1
1
1
2
4
23
27
0 5 10 15 20 25 30 35
State Open University
Deemed University Governmnet Aided
Government Deemed University
Central University
Institution of National Importance
State Public University
Private Deemed University
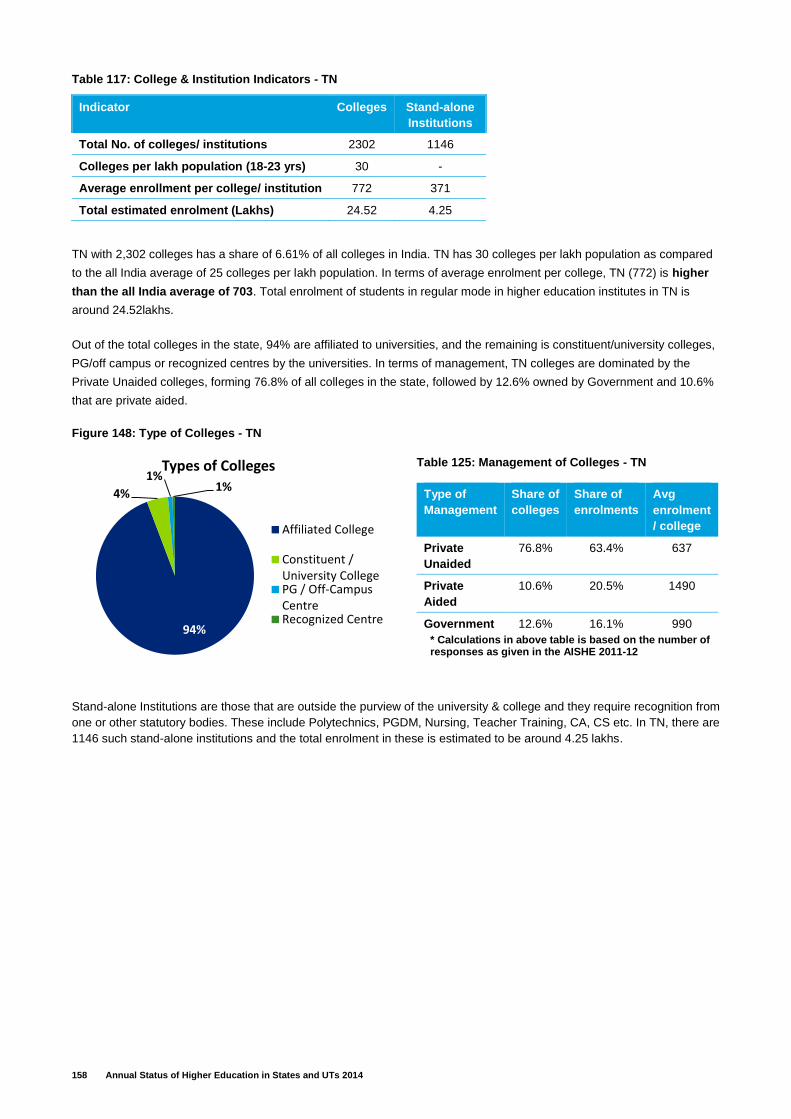
158 Annual Status of Higher Education in States and UTs 2014
Table 117: College & Institution Indicators - TN
TN with 2,302 colleges has a share of 6.61% of all colleges in India. TN has 30 colleges per lakh population as compared
to the all India average of 25 colleges per lakh population. In terms of average enrolment per college, TN (772) is higher
than the all India average of 703. Total enrolment of students in regular mode in higher education institutes in TN is
around 24.52lakhs.
Out of the total colleges in the state, 94% are affiliated to universities, and the remaining is constituent/university colleges,
PG/off campus or recognized centres by the universities. In terms of management, TN colleges are dominated by the
Private Unaided colleges, forming 76.8% of all colleges in the state, followed by 12.6% owned by Government and 10.6%
that are private aided.
Figure 148: Type of Colleges - TN
Table 125: Management of Colleges - TN
Type of
Management
Share of
colleges
Share of
enrolments
Avg
enrolment
/ college
Private
Unaided
76.8% 63.4% 637
Private
Aided
10.6% 20.5% 1490
Government 12.6% 16.1% 990
* Calculations in above table is based on the number of responses as given in the AISHE 2011-12
Stand-alone Institutions are those that are outside the purview of the university & college and they require recognition from
one or other statutory bodies. These include Polytechnics, PGDM, Nursing, Teacher Training, CA, CS etc. In TN, there are
1146 such stand-alone institutions and the total enrolment in these is estimated to be around 4.25 lakhs.
Indicator Colleges Stand-alone
Institutions
Total No. of colleges/ institutions 2302 1146
Colleges per lakh population (18-23 yrs) 30 -
Average enrollment per college/ institution 772 371
Total estimated enrolment (Lakhs) 24.52 4.25
94%
4%
1%1%
Types of Colleges
Affiliated College
Constituent /University CollegePG / Off-CampusCentreRecognized Centre
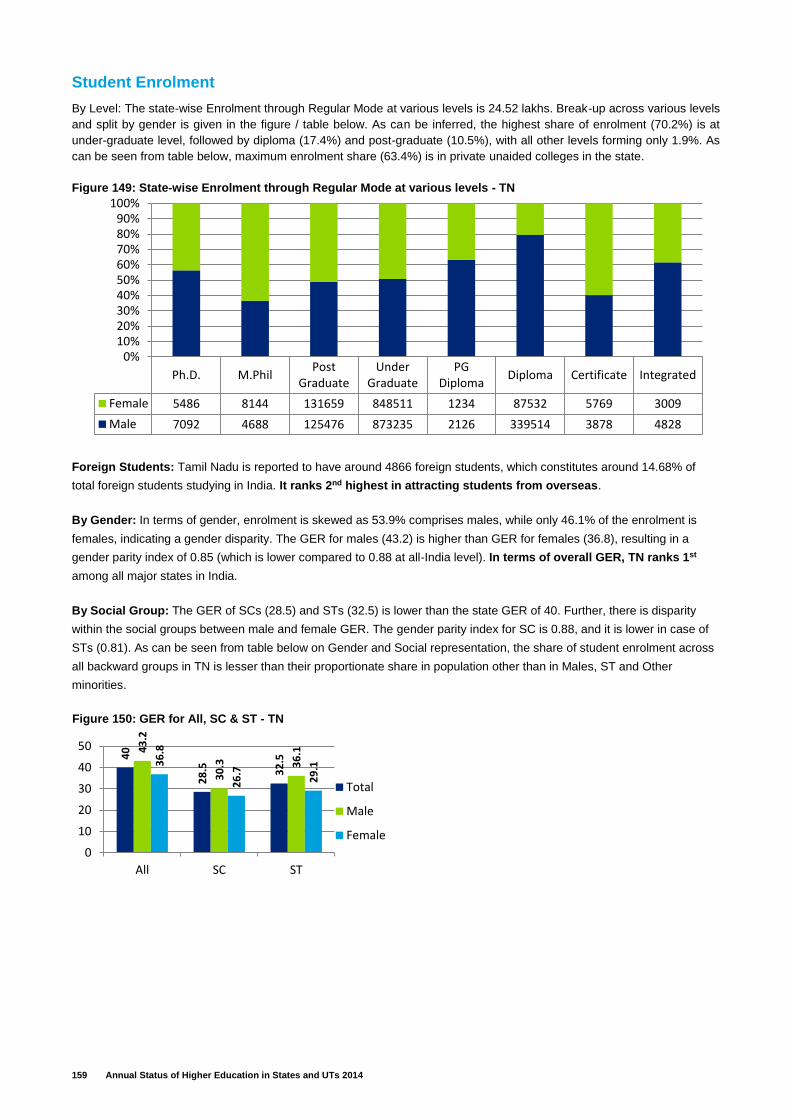
159 Annual Status of Higher Education in States and UTs 2014
Student Enrolment
By Level: The state-wise Enrolment through Regular Mode at various levels is 24.52 lakhs. Break-up across various levels
and split by gender is given in the figure / table below. As can be inferred, the highest share of enrolment (70.2%) is at
under-graduate level, followed by diploma (17.4%) and post-graduate (10.5%), with all other levels forming only 1.9%. As
can be seen from table below, maximum enrolment share (63.4%) is in private unaided colleges in the state.
Foreign Students: Tamil Nadu is reported to have around 4866 foreign students, which constitutes around 14.68% of
total foreign students studying in India. It ranks 2nd highest in attracting students from overseas.
By Gender: In terms of gender, enrolment is skewed as 53.9% comprises males, while only 46.1% of the enrolment is
females, indicating a gender disparity. The GER for males (43.2) is higher than GER for females (36.8), resulting in a
gender parity index of 0.85 (which is lower compared to 0.88 at all-India level). In terms of overall GER, TN ranks 1st
among all major states in India.
By Social Group: The GER of SCs (28.5) and STs (32.5) is lower than the state GER of 40. Further, there is disparity
within the social groups between male and female GER. The gender parity index for SC is 0.88, and it is lower in case of
STs (0.81). As can be seen from table below on Gender and Social representation, the share of student enrolment across
all backward groups in TN is lesser than their proportionate share in population other than in Males, ST and Other
minorities.
Ph.D. M.PhilPost
GraduateUnder
GraduatePG
DiplomaDiploma Certificate Integrated
Female 5486 8144 131659 848511 1234 87532 5769 3009
Male 7092 4688 125476 873235 2126 339514 3878 4828
0%10%20%30%40%50%60%70%80%90%
100%Figure 149: State‐wise Enrolment through Regular Mode at various levels - TN
40
28
.5 32
.5
43
.2
30
.3 36
.1
36
.8
26
.7
29
.1
0
10
20
30
40
50
All SC ST
Total
Male
Female
Figure 150: GER for All, SC & ST - TN
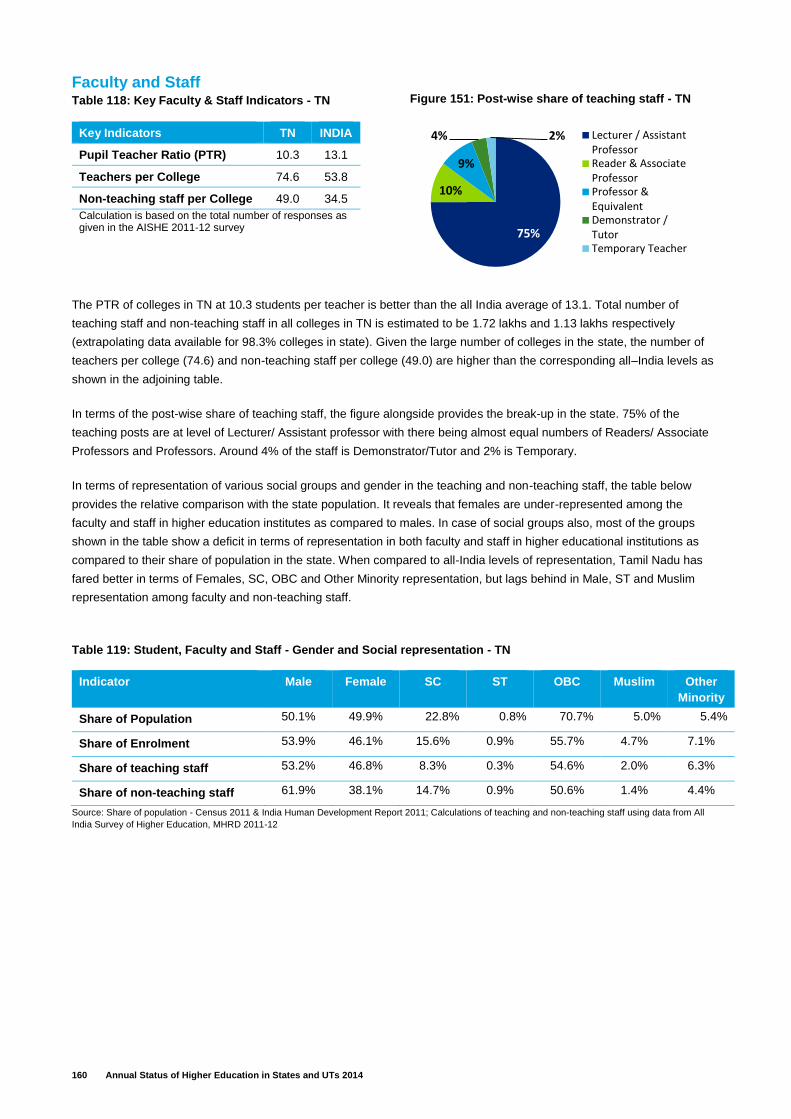
160 Annual Status of Higher Education in States and UTs 2014
Faculty and Staff Table 118: Key Faculty & Staff Indicators - TN
The PTR of colleges in TN at 10.3 students per teacher is better than the all India average of 13.1. Total number of
teaching staff and non-teaching staff in all colleges in TN is estimated to be 1.72 lakhs and 1.13 lakhs respectively
(extrapolating data available for 98.3% colleges in state). Given the large number of colleges in the state, the number of
teachers per college (74.6) and non-teaching staff per college (49.0) are higher than the corresponding all–India levels as
shown in the adjoining table.
In terms of the post-wise share of teaching staff, the figure alongside provides the break-up in the state. 75% of the
teaching posts are at level of Lecturer/ Assistant professor with there being almost equal numbers of Readers/ Associate
Professors and Professors. Around 4% of the staff is Demonstrator/Tutor and 2% is Temporary.
In terms of representation of various social groups and gender in the teaching and non-teaching staff, the table below
provides the relative comparison with the state population. It reveals that females are under-represented among the
faculty and staff in higher education institutes as compared to males. In case of social groups also, most of the groups
shown in the table show a deficit in terms of representation in both faculty and staff in higher educational institutions as
compared to their share of population in the state. When compared to all-India levels of representation, Tamil Nadu has
fared better in terms of Females, SC, OBC and Other Minority representation, but lags behind in Male, ST and Muslim
representation among faculty and non-teaching staff.
Table 119: Student, Faculty and Staff - Gender and Social representation - TN
Indicator Male Female SC ST OBC Muslim Other
Minority
Share of Population 50.1% 49.9% 22.8% 0.8% 70.7% 5.0% 5.4%
Share of Enrolment 53.9% 46.1% 15.6% 0.9% 55.7% 4.7% 7.1%
Share of teaching staff 53.2% 46.8% 8.3% 0.3% 54.6% 2.0% 6.3%
Share of non-teaching staff 61.9% 38.1% 14.7% 0.9% 50.6% 1.4% 4.4%
Source: Share of population - Census 2011 & India Human Development Report 2011; Calculations of teaching and non-teaching staff using data from All
India Survey of Higher Education, MHRD 2011-12
Key Indicators TN INDIA
Pupil Teacher Ratio (PTR) 10.3 13.1
Teachers per College 74.6 53.8
Non-teaching staff per College 49.0 34.5
Calculation is based on the total number of responses as given in the AISHE 2011-12 survey 75%
10%
9%
4% 2% Lecturer / AssistantProfessorReader & AssociateProfessorProfessor &EquivalentDemonstrator /TutorTemporary Teacher
Figure 151: Post-wise share of teaching staff - TN

161 Annual Status of Higher Education in States and UTs 2014
Tripura (TRI)
Key Indicators Table 120: Key Indicators – TRI
Indicator Total Male Female
Total State Population, Lakhs 1 36.7 18.7 18.0
Literacy Rate 1 87.2 91.5 79.0
Pop. in 18-23 age group (lakhs)1
Share to total state pop. (%)
4.5
(12.2%)
2.2
(11.8%)
2.3
(12.7%)
Share of state 18-23 pop. to All-
India 18-23 pop. 1 0.3% 0.3% 0.3%
Gross Enrollment Ratio 2 12.4 14.6 10.2
Share of Graduates & above in
total state population 5 4.4 5.7 3.1
Indicator Value
State GDP (2013) 3 ₹23,855 Cr
State HDI ranking 4 -
Sex Ratio (2011)1 960
HE Expenditure as
a % of GSDP 3
1.10%
Student per capita
expenditure 3
₹4672
Source: 1. Census 2011; 2. All India Survey of Higher Education, MHRD 2011-12; 3. RUSA, National Higher Education Mission, Sept 2013; 4. India Human Development Report 2011. 5. Status of Education & Vocational Training in India, NSSO 66th Round, 2010
Education Infrastructure
The break-up of number of universities in the state on the basis of type of university is shown below. Tripura ranks 26th
among all states in India with 3 universities. TRI has 0.5% of all universities in the country.
There are no IIMs, IITs, IISERs in the
state.
Key institutions in the state
1. Tripura University
2. NIT, Agartala
The bar graph alongside reflects the break-up
of number of universities in TRI on the basis of
specialization. Tripura does not have any
Medical, Agricultural or Law universities.
Figure 152: Universities by Type and Key institutions - TRI
1
2
0 1 2 3
Technical
General
Figure 153: Universities by Specialization - TRI
1
1
1
0 0.5 1 1.5 2
Institution of National Importance
Central University
State Private University
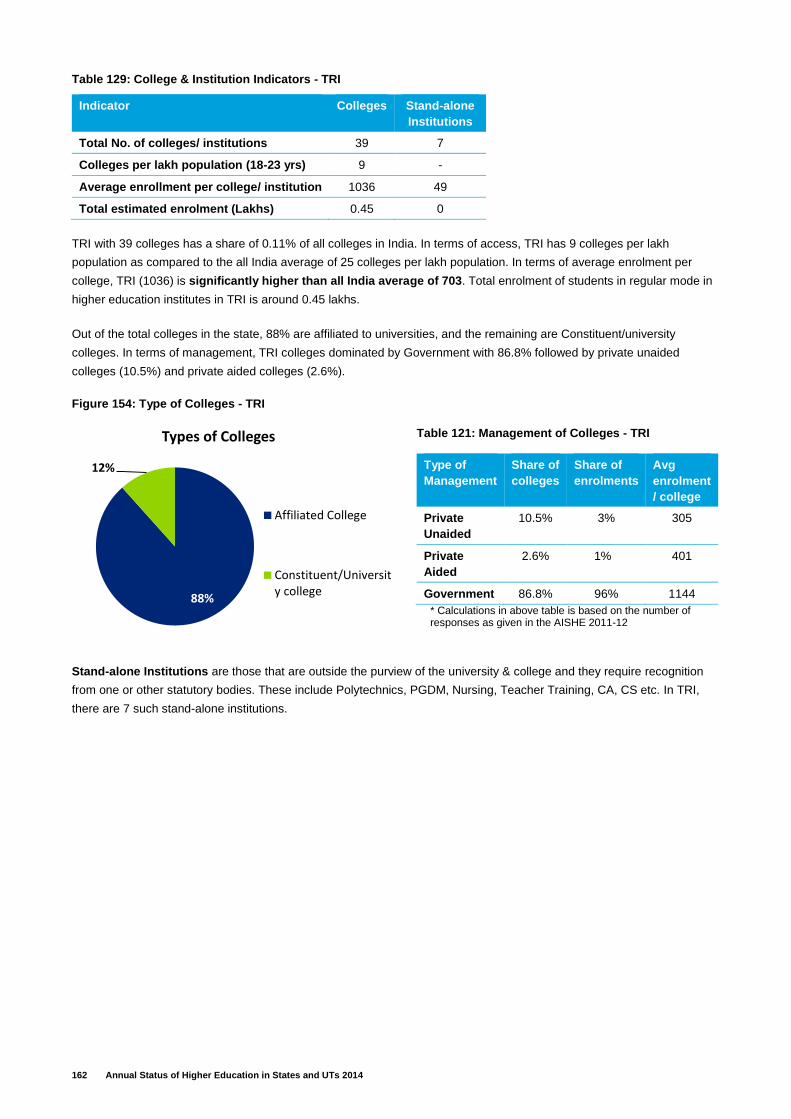
162 Annual Status of Higher Education in States and UTs 2014
Table 129: College & Institution Indicators - TRI
TRI with 39 colleges has a share of 0.11% of all colleges in India. In terms of access, TRI has 9 colleges per lakh
population as compared to the all India average of 25 colleges per lakh population. In terms of average enrolment per
college, TRI (1036) is significantly higher than all India average of 703. Total enrolment of students in regular mode in
higher education institutes in TRI is around 0.45 lakhs.
Out of the total colleges in the state, 88% are affiliated to universities, and the remaining are Constituent/university
colleges. In terms of management, TRI colleges dominated by Government with 86.8% followed by private unaided
colleges (10.5%) and private aided colleges (2.6%).
Figure 154: Type of Colleges - TRI
Table 121: Management of Colleges - TRI
Type of
Management
Share of
colleges
Share of
enrolments
Avg
enrolment
/ college
Private
Unaided
10.5% 3% 305
Private
Aided
2.6% 1% 401
Government 86.8% 96% 1144
* Calculations in above table is based on the number of responses as given in the AISHE 2011-12
Stand-alone Institutions are those that are outside the purview of the university & college and they require recognition
from one or other statutory bodies. These include Polytechnics, PGDM, Nursing, Teacher Training, CA, CS etc. In TRI,
there are 7 such stand-alone institutions.
Indicator Colleges Stand-alone
Institutions
Total No. of colleges/ institutions 39 7
Colleges per lakh population (18-23 yrs) 9 -
Average enrollment per college/ institution 1036 49
Total estimated enrolment (Lakhs) 0.45 0
88%
12%
Types of Colleges
Affiliated College
Constituent/University college
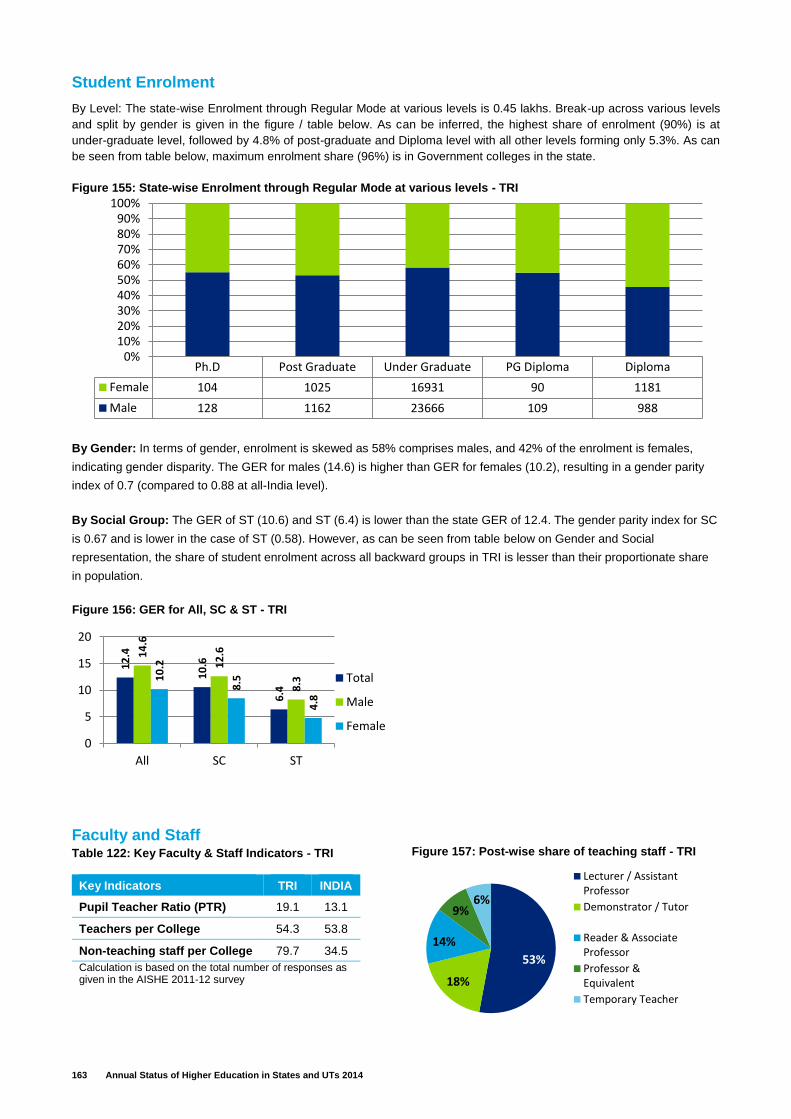
163 Annual Status of Higher Education in States and UTs 2014
Student Enrolment
By Level: The state-wise Enrolment through Regular Mode at various levels is 0.45 lakhs. Break-up across various levels
and split by gender is given in the figure / table below. As can be inferred, the highest share of enrolment (90%) is at
under-graduate level, followed by 4.8% of post-graduate and Diploma level with all other levels forming only 5.3%. As can
be seen from table below, maximum enrolment share (96%) is in Government colleges in the state.
By Gender: In terms of gender, enrolment is skewed as 58% comprises males, and 42% of the enrolment is females,
indicating gender disparity. The GER for males (14.6) is higher than GER for females (10.2), resulting in a gender parity
index of 0.7 (compared to 0.88 at all-India level).
By Social Group: The GER of ST (10.6) and ST (6.4) is lower than the state GER of 12.4. The gender parity index for SC
is 0.67 and is lower in the case of ST (0.58). However, as can be seen from table below on Gender and Social
representation, the share of student enrolment across all backward groups in TRI is lesser than their proportionate share
in population.
Faculty and Staff Table 122: Key Faculty & Staff Indicators - TRI
Key Indicators TRI INDIA
Pupil Teacher Ratio (PTR) 19.1 13.1
Teachers per College 54.3 53.8
Non-teaching staff per College 79.7 34.5
Calculation is based on the total number of responses as given in the AISHE 2011-12 survey
Ph.D Post Graduate Under Graduate PG Diploma Diploma
Female 104 1025 16931 90 1181
Male 128 1162 23666 109 988
0%10%20%30%40%50%60%70%80%90%
100%Figure 155: State‐wise Enrolment through Regular Mode at various levels - TRI
12
.4
10
.6
6.4
14
.6
12
.6
8.31
0.2
8.5
4.8
0
5
10
15
20
All SC ST
Total
Male
Female
Figure 156: GER for All, SC & ST - TRI
53%
18%
14%
9%6%
Lecturer / AssistantProfessor
Demonstrator / Tutor
Reader & AssociateProfessor
Professor &Equivalent
Temporary Teacher
Figure 157: Post-wise share of teaching staff - TRI
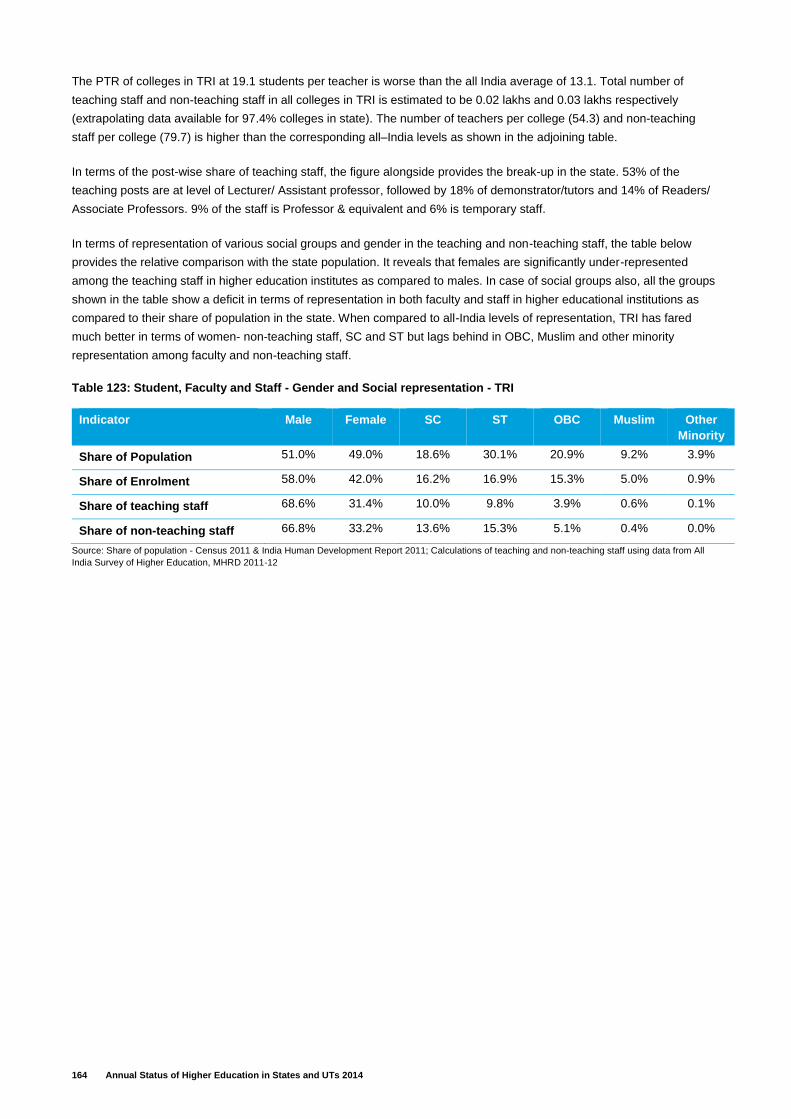
164 Annual Status of Higher Education in States and UTs 2014
The PTR of colleges in TRI at 19.1 students per teacher is worse than the all India average of 13.1. Total number of
teaching staff and non-teaching staff in all colleges in TRI is estimated to be 0.02 lakhs and 0.03 lakhs respectively
(extrapolating data available for 97.4% colleges in state). The number of teachers per college (54.3) and non-teaching
staff per college (79.7) is higher than the corresponding all–India levels as shown in the adjoining table.
In terms of the post-wise share of teaching staff, the figure alongside provides the break-up in the state. 53% of the
teaching posts are at level of Lecturer/ Assistant professor, followed by 18% of demonstrator/tutors and 14% of Readers/
Associate Professors. 9% of the staff is Professor & equivalent and 6% is temporary staff.
In terms of representation of various social groups and gender in the teaching and non-teaching staff, the table below
provides the relative comparison with the state population. It reveals that females are significantly under-represented
among the teaching staff in higher education institutes as compared to males. In case of social groups also, all the groups
shown in the table show a deficit in terms of representation in both faculty and staff in higher educational institutions as
compared to their share of population in the state. When compared to all-India levels of representation, TRI has fared
much better in terms of women- non-teaching staff, SC and ST but lags behind in OBC, Muslim and other minority
representation among faculty and non-teaching staff.
Table 123: Student, Faculty and Staff - Gender and Social representation - TRI
Indicator Male Female SC ST OBC Muslim Other
Minority
Share of Population 51.0% 49.0% 18.6% 30.1% 20.9% 9.2% 3.9%
Share of Enrolment 58.0% 42.0% 16.2% 16.9% 15.3% 5.0% 0.9%
Share of teaching staff 68.6% 31.4% 10.0% 9.8% 3.9% 0.6% 0.1%
Share of non-teaching staff 66.8% 33.2% 13.6% 15.3% 5.1% 0.4% 0.0%
Source: Share of population - Census 2011 & India Human Development Report 2011; Calculations of teaching and non-teaching staff using data from All
India Survey of Higher Education, MHRD 2011-12
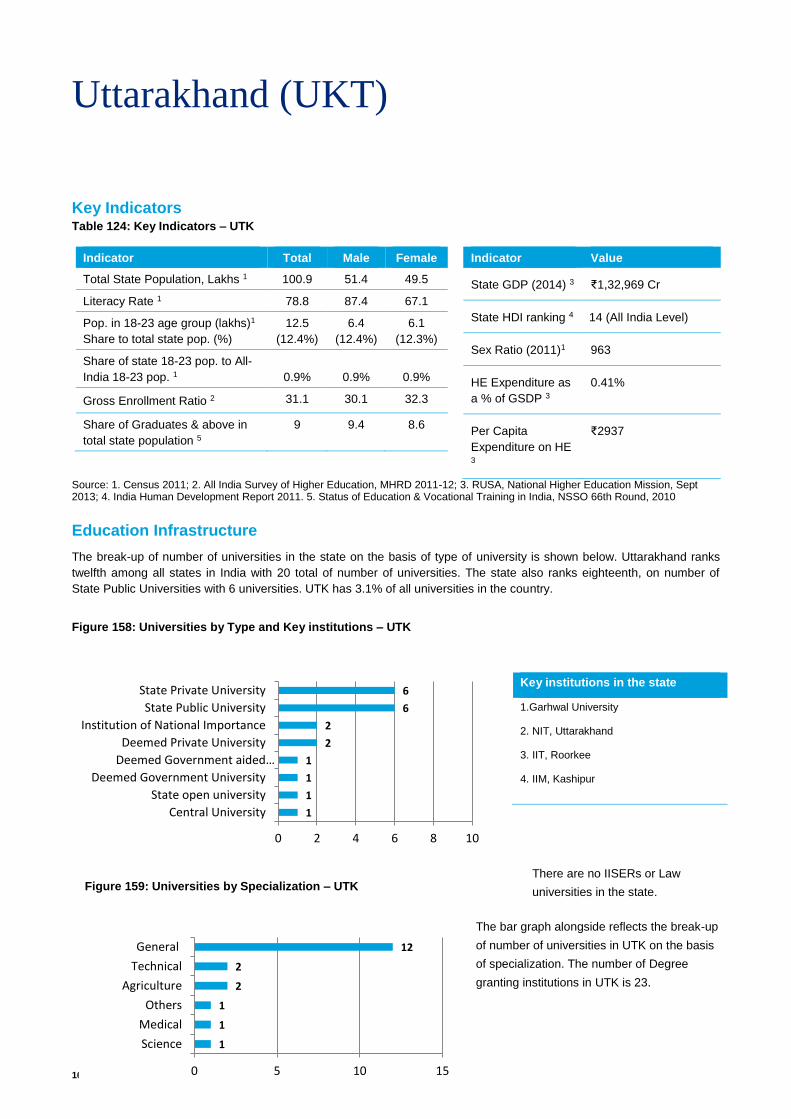
165 Annual Status of Higher Education in States and UTs 2014
Uttarakhand (UKT)
Key Indicators Table 124: Key Indicators – UTK
Indicator Total Male Female
Total State Population, Lakhs 1 100.9 51.4 49.5
Literacy Rate 1 78.8 87.4 67.1
Pop. in 18-23 age group (lakhs)1
Share to total state pop. (%)
12.5
(12.4%)
6.4
(12.4%)
6.1
(12.3%)
Share of state 18-23 pop. to All-
India 18-23 pop. 1 0.9% 0.9% 0.9%
Gross Enrollment Ratio 2 31.1 30.1 32.3
Share of Graduates & above in
total state population 5
9 9.4 8.6
Indicator Value
State GDP (2014) 3 ₹1,32,969 Cr
State HDI ranking 4 14 (All India Level)
Sex Ratio (2011)1 963
HE Expenditure as
a % of GSDP 3
0.41%
Per Capita
Expenditure on HE
3
₹2937
Source: 1. Census 2011; 2. All India Survey of Higher Education, MHRD 2011-12; 3. RUSA, National Higher Education Mission, Sept 2013; 4. India Human Development Report 2011. 5. Status of Education & Vocational Training in India, NSSO 66th Round, 2010
Education Infrastructure
The break-up of number of universities in the state on the basis of type of university is shown below. Uttarakhand ranks
twelfth among all states in India with 20 total of number of universities. The state also ranks eighteenth, on number of
State Public Universities with 6 universities. UTK has 3.1% of all universities in the country.
There are no IISERs or Law
universities in the state.
The bar graph alongside reflects the break-up
of number of universities in UTK on the basis
of specialization. The number of Degree
granting institutions in UTK is 23.
Key institutions in the state
1.Garhwal University
2. NIT, Uttarakhand
3. IIT, Roorkee
4. IIM, Kashipur
Figure 158: Universities by Type and Key institutions – UTK
1
1
1
2
2
12
0 5 10 15
Science
Medical
Others
Agriculture
Technical
General
Figure 159: Universities by Specialization – UTK
1
1
1
1
2
2
6
6
0 2 4 6 8 10
Central University
State open university
Deemed Government University
Deemed Government aided…
Deemed Private University
Institution of National Importance
State Public University
State Private University
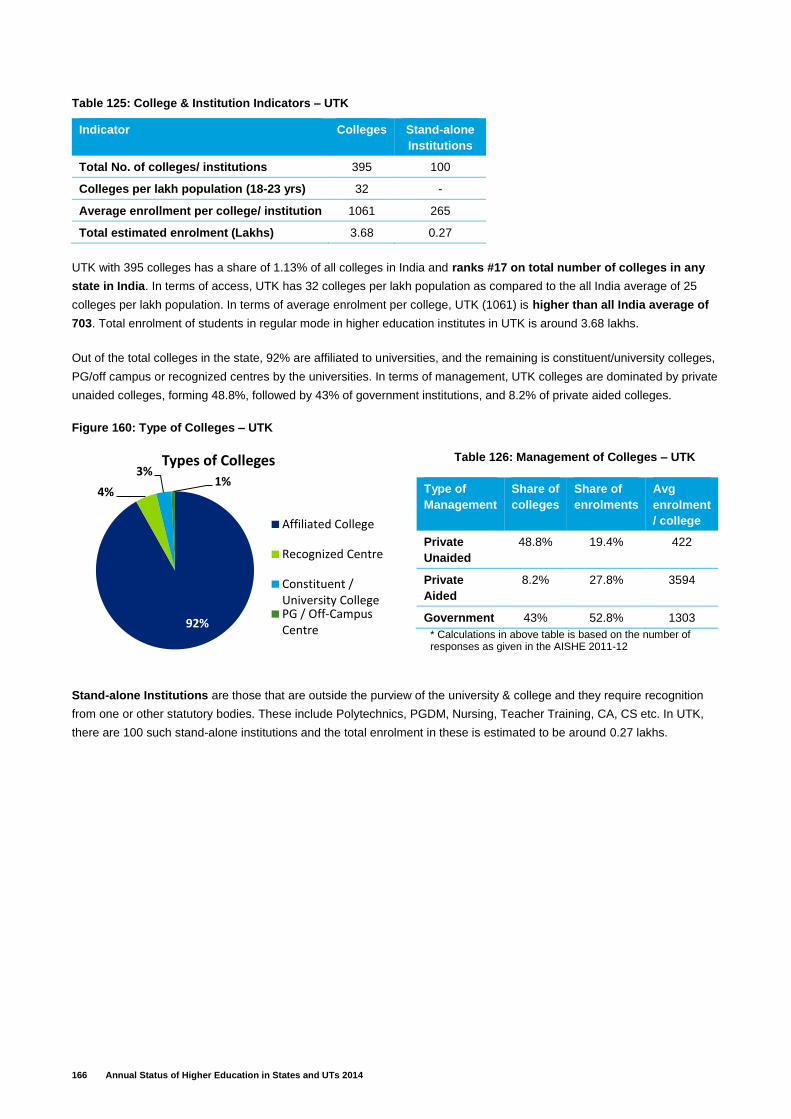
166 Annual Status of Higher Education in States and UTs 2014
Table 125: College & Institution Indicators – UTK
UTK with 395 colleges has a share of 1.13% of all colleges in India and ranks #17 on total number of colleges in any
state in India. In terms of access, UTK has 32 colleges per lakh population as compared to the all India average of 25
colleges per lakh population. In terms of average enrolment per college, UTK (1061) is higher than all India average of
703. Total enrolment of students in regular mode in higher education institutes in UTK is around 3.68 lakhs.
Out of the total colleges in the state, 92% are affiliated to universities, and the remaining is constituent/university colleges,
PG/off campus or recognized centres by the universities. In terms of management, UTK colleges are dominated by private
unaided colleges, forming 48.8%, followed by 43% of government institutions, and 8.2% of private aided colleges.
Figure 160: Type of Colleges – UTK
Table 126: Management of Colleges – UTK
Type of
Management
Share of
colleges
Share of
enrolments
Avg
enrolment
/ college
Private
Unaided
48.8% 19.4% 422
Private
Aided
8.2% 27.8% 3594
Government 43% 52.8% 1303
* Calculations in above table is based on the number of responses as given in the AISHE 2011-12
Stand-alone Institutions are those that are outside the purview of the university & college and they require recognition
from one or other statutory bodies. These include Polytechnics, PGDM, Nursing, Teacher Training, CA, CS etc. In UTK,
there are 100 such stand-alone institutions and the total enrolment in these is estimated to be around 0.27 lakhs.
Indicator Colleges Stand-alone
Institutions
Total No. of colleges/ institutions 395 100
Colleges per lakh population (18-23 yrs) 32 -
Average enrollment per college/ institution 1061 265
Total estimated enrolment (Lakhs) 3.68 0.27
92%
4%
3%1%
Types of Colleges
Affiliated College
Recognized Centre
Constituent /University CollegePG / Off-CampusCentre
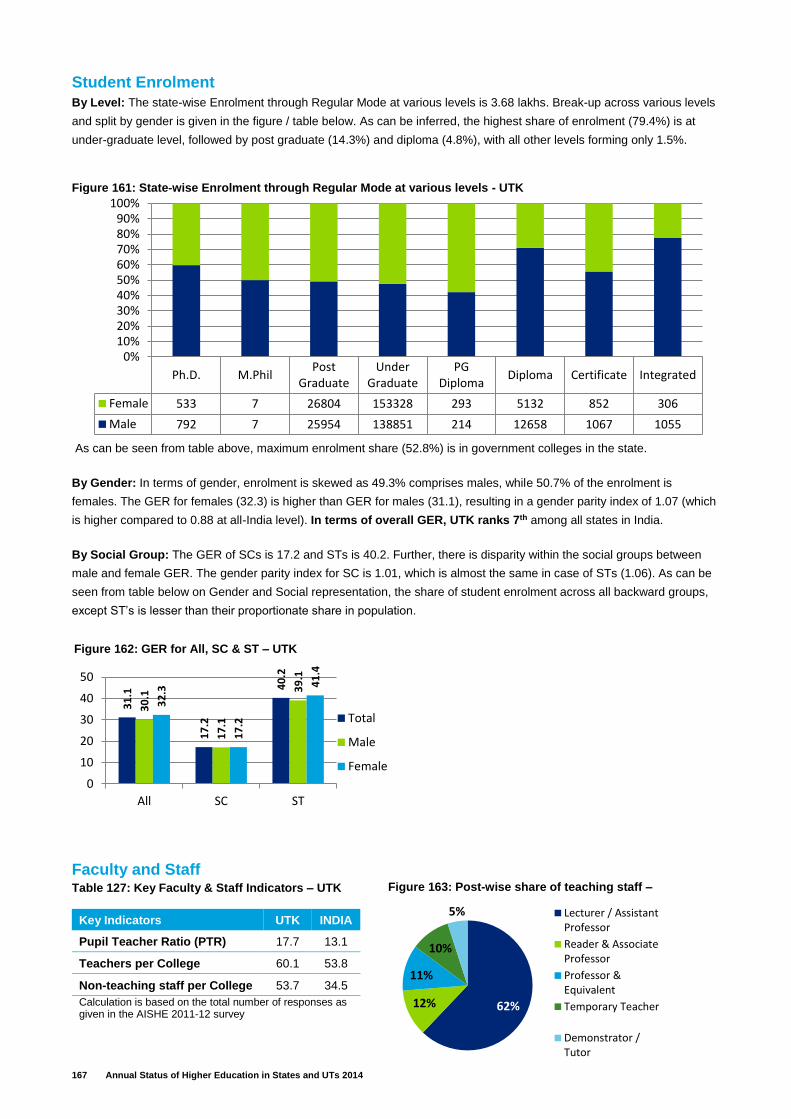
167 Annual Status of Higher Education in States and UTs 2014
Student Enrolment
By Level: The state-wise Enrolment through Regular Mode at various levels is 3.68 lakhs. Break-up across various levels
and split by gender is given in the figure / table below. As can be inferred, the highest share of enrolment (79.4%) is at
under-graduate level, followed by post graduate (14.3%) and diploma (4.8%), with all other levels forming only 1.5%.
As can be seen from table above, maximum enrolment share (52.8%) is in government colleges in the state.
By Gender: In terms of gender, enrolment is skewed as 49.3% comprises males, while 50.7% of the enrolment is
females. The GER for females (32.3) is higher than GER for males (31.1), resulting in a gender parity index of 1.07 (which
is higher compared to 0.88 at all-India level). In terms of overall GER, UTK ranks 7th among all states in India.
By Social Group: The GER of SCs is 17.2 and STs is 40.2. Further, there is disparity within the social groups between
male and female GER. The gender parity index for SC is 1.01, which is almost the same in case of STs (1.06). As can be
seen from table below on Gender and Social representation, the share of student enrolment across all backward groups,
except ST’s is lesser than their proportionate share in population.
Faculty and Staff Table 127: Key Faculty & Staff Indicators – UTK
Key Indicators UTK INDIA
Pupil Teacher Ratio (PTR) 17.7 13.1
Teachers per College 60.1 53.8
Non-teaching staff per College 53.7 34.5
Calculation is based on the total number of responses as given in the AISHE 2011-12 survey
Ph.D. M.PhilPost
GraduateUnder
GraduatePG
DiplomaDiploma Certificate Integrated
Female 533 7 26804 153328 293 5132 852 306
Male 792 7 25954 138851 214 12658 1067 1055
0%10%20%30%40%50%60%70%80%90%
100%Figure 161: State‐wise Enrolment through Regular Mode at various levels - UTK
31
.1
17
.2
40
.2
30
.1
17
.1
39
.1
32
.3
17
.2
41
.4
0
10
20
30
40
50
All SC ST
Total
Male
Female
Figure 162: GER for All, SC & ST – UTK
62%12%
11%
10%
5% Lecturer / AssistantProfessor
Reader & AssociateProfessor
Professor &Equivalent
Temporary Teacher
Demonstrator /Tutor
Figure 163: Post-wise share of teaching staff –
UTK
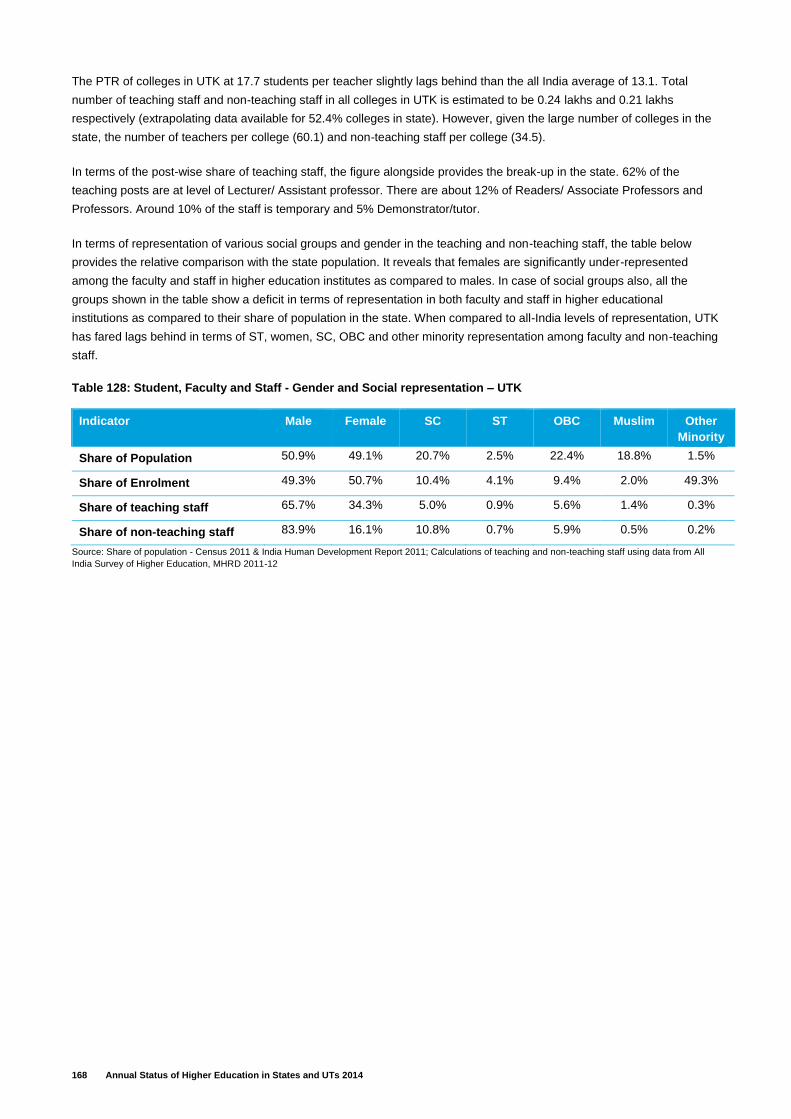
168 Annual Status of Higher Education in States and UTs 2014
The PTR of colleges in UTK at 17.7 students per teacher slightly lags behind than the all India average of 13.1. Total
number of teaching staff and non-teaching staff in all colleges in UTK is estimated to be 0.24 lakhs and 0.21 lakhs
respectively (extrapolating data available for 52.4% colleges in state). However, given the large number of colleges in the
state, the number of teachers per college (60.1) and non-teaching staff per college (34.5).
In terms of the post-wise share of teaching staff, the figure alongside provides the break-up in the state. 62% of the
teaching posts are at level of Lecturer/ Assistant professor. There are about 12% of Readers/ Associate Professors and
Professors. Around 10% of the staff is temporary and 5% Demonstrator/tutor.
In terms of representation of various social groups and gender in the teaching and non-teaching staff, the table below
provides the relative comparison with the state population. It reveals that females are significantly under-represented
among the faculty and staff in higher education institutes as compared to males. In case of social groups also, all the
groups shown in the table show a deficit in terms of representation in both faculty and staff in higher educational
institutions as compared to their share of population in the state. When compared to all-India levels of representation, UTK
has fared lags behind in terms of ST, women, SC, OBC and other minority representation among faculty and non-teaching
staff.
Table 128: Student, Faculty and Staff - Gender and Social representation – UTK
Indicator Male Female SC ST OBC Muslim Other
Minority
Share of Population 50.9% 49.1% 20.7% 2.5% 22.4% 18.8% 1.5%
Share of Enrolment 49.3% 50.7% 10.4% 4.1% 9.4% 2.0% 49.3%
Share of teaching staff 65.7% 34.3% 5.0% 0.9% 5.6% 1.4% 0.3%
Share of non-teaching staff 83.9% 16.1% 10.8% 0.7% 5.9% 0.5% 0.2%
Source: Share of population - Census 2011 & India Human Development Report 2011; Calculations of teaching and non-teaching staff using data from All
India Survey of Higher Education, MHRD 2011-12
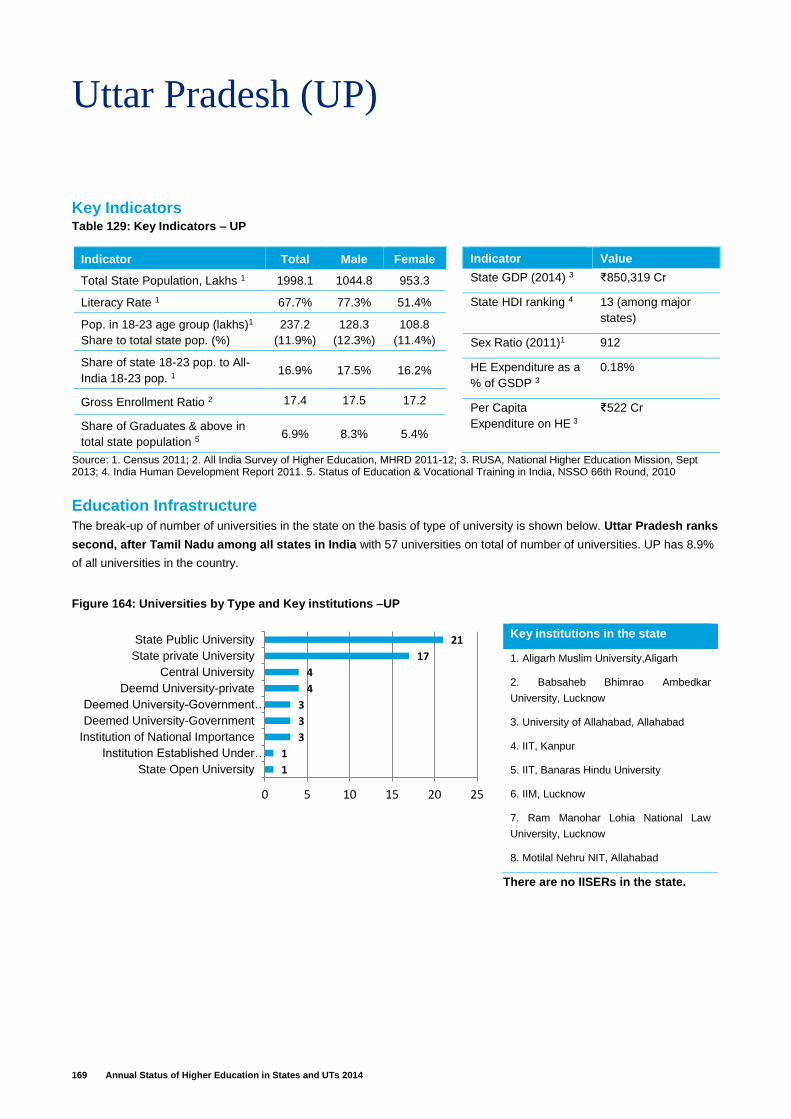
169 Annual Status of Higher Education in States and UTs 2014
Uttar Pradesh (UP)
Key Indicators Table 129: Key Indicators – UP
Indicator Total Male Female
Total State Population, Lakhs 1 1998.1 1044.8 953.3
Literacy Rate 1 67.7% 77.3% 51.4%
Pop. in 18-23 age group (lakhs)1
Share to total state pop. (%)
237.2
(11.9%)
128.3
(12.3%)
108.8
(11.4%)
Share of state 18-23 pop. to All-
India 18-23 pop. 1 16.9% 17.5% 16.2%
Gross Enrollment Ratio 2 17.4 17.5 17.2
Share of Graduates & above in
total state population 5 6.9% 8.3% 5.4%
Indicator Value
State GDP (2014) 3 ₹850,319 Cr
State HDI ranking 4 13 (among major
states)
Sex Ratio (2011)1 912
HE Expenditure as a
% of GSDP 3
0.18%
Per Capita
Expenditure on HE 3
₹522 Cr
Source: 1. Census 2011; 2. All India Survey of Higher Education, MHRD 2011-12; 3. RUSA, National Higher Education Mission, Sept 2013; 4. India Human Development Report 2011. 5. Status of Education & Vocational Training in India, NSSO 66th Round, 2010
Education Infrastructure
The break-up of number of universities in the state on the basis of type of university is shown below. Uttar Pradesh ranks
second, after Tamil Nadu among all states in India with 57 universities on total of number of universities. UP has 8.9%
of all universities in the country.
There are no IISERs in the state.
Key institutions in the state
1. Aligarh Muslim University,Aligarh
2. Babsaheb Bhimrao Ambedkar
University, Lucknow
3. University of Allahabad, Allahabad
4. IIT, Kanpur
5. IIT, Banaras Hindu University
6. IIM, Lucknow
7. Ram Manohar Lohia National Law
University, Lucknow
8. Motilal Nehru NIT, Allahabad
Figure 164: Universities by Type and Key institutions –UP
1
1
3
3
3
4
4
17
21
0 5 10 15 20 25
State Open University
Institution Established Under…
Institution of National Importance
Deemed University-Government
Deemed University-Government…
Deemd University-private
Central University
State private University
State Public University
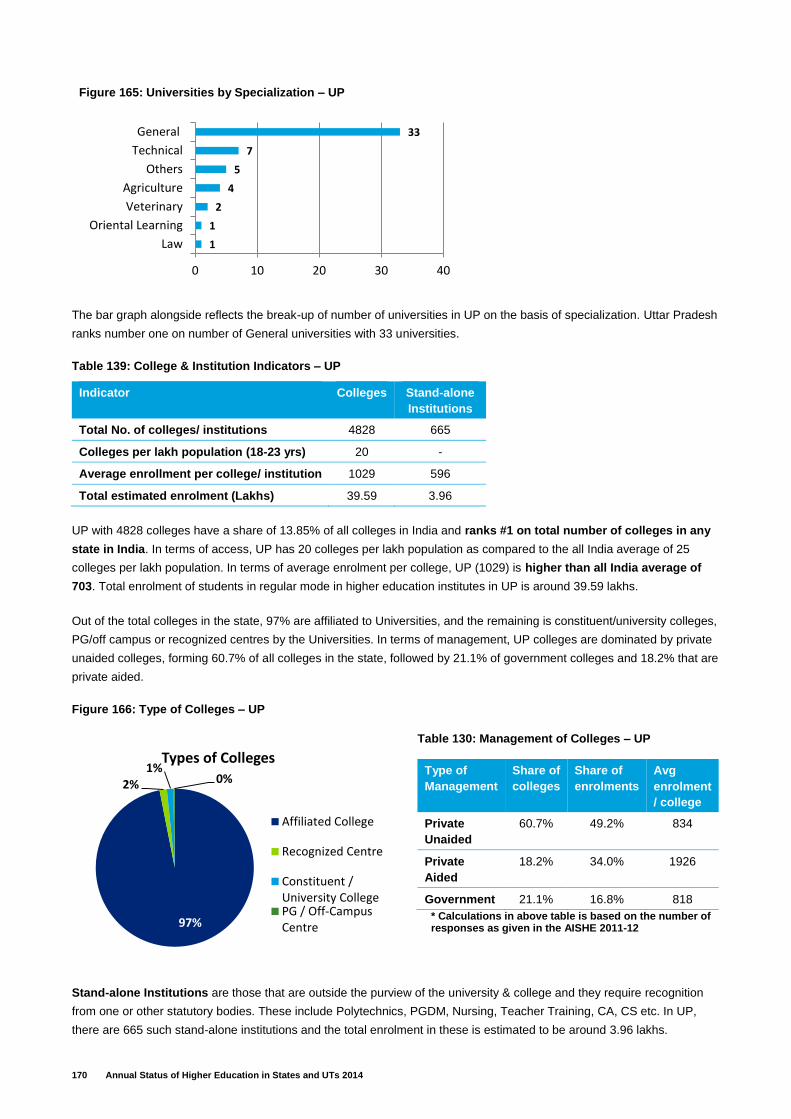
170 Annual Status of Higher Education in States and UTs 2014
The bar graph alongside reflects the break-up of number of universities in UP on the basis of specialization. Uttar Pradesh
ranks number one on number of General universities with 33 universities.
Table 139: College & Institution Indicators – UP
UP with 4828 colleges have a share of 13.85% of all colleges in India and ranks #1 on total number of colleges in any
state in India. In terms of access, UP has 20 colleges per lakh population as compared to the all India average of 25
colleges per lakh population. In terms of average enrolment per college, UP (1029) is higher than all India average of
703. Total enrolment of students in regular mode in higher education institutes in UP is around 39.59 lakhs.
Out of the total colleges in the state, 97% are affiliated to Universities, and the remaining is constituent/university colleges,
PG/off campus or recognized centres by the Universities. In terms of management, UP colleges are dominated by private
unaided colleges, forming 60.7% of all colleges in the state, followed by 21.1% of government colleges and 18.2% that are
private aided.
Figure 166: Type of Colleges – UP
Table 130: Management of Colleges – UP
Type of
Management
Share of
colleges
Share of
enrolments
Avg
enrolment
/ college
Private
Unaided
60.7% 49.2% 834
Private
Aided
18.2% 34.0% 1926
Government 21.1% 16.8% 818
* Calculations in above table is based on the number of responses as given in the AISHE 2011-12
Stand-alone Institutions are those that are outside the purview of the university & college and they require recognition
from one or other statutory bodies. These include Polytechnics, PGDM, Nursing, Teacher Training, CA, CS etc. In UP,
there are 665 such stand-alone institutions and the total enrolment in these is estimated to be around 3.96 lakhs.
Indicator Colleges Stand-alone
Institutions
Total No. of colleges/ institutions 4828 665
Colleges per lakh population (18-23 yrs) 20 -
Average enrollment per college/ institution 1029 596
Total estimated enrolment (Lakhs) 39.59 3.96
Figure 165: Universities by Specialization – UP
1
1
2
4
5
7
33
0 10 20 30 40
Law
Oriental Learning
Veterinary
Agriculture
Others
Technical
General
97%
2%1%
0%
Types of Colleges
Affiliated College
Recognized Centre
Constituent /University CollegePG / Off-CampusCentre
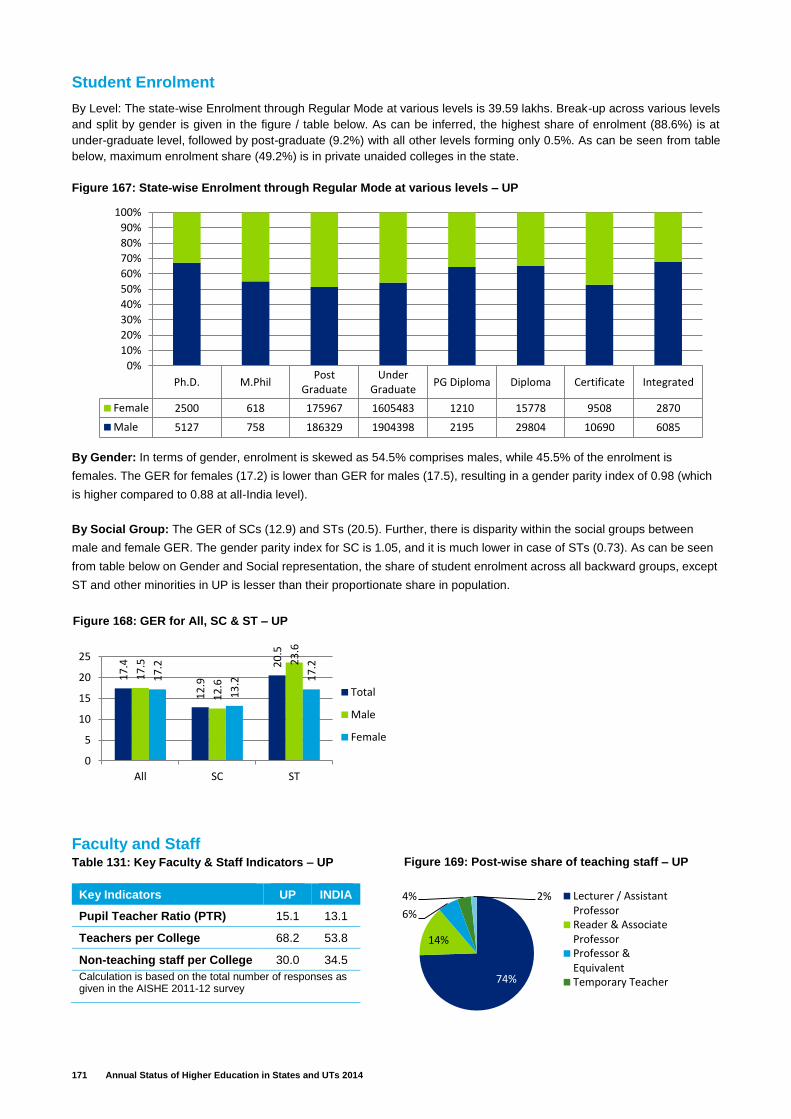
171 Annual Status of Higher Education in States and UTs 2014
Student Enrolment
By Level: The state-wise Enrolment through Regular Mode at various levels is 39.59 lakhs. Break-up across various levels
and split by gender is given in the figure / table below. As can be inferred, the highest share of enrolment (88.6%) is at
under-graduate level, followed by post-graduate (9.2%) with all other levels forming only 0.5%. As can be seen from table
below, maximum enrolment share (49.2%) is in private unaided colleges in the state.
By Gender: In terms of gender, enrolment is skewed as 54.5% comprises males, while 45.5% of the enrolment is
females. The GER for females (17.2) is lower than GER for males (17.5), resulting in a gender parity index of 0.98 (which
is higher compared to 0.88 at all-India level).
By Social Group: The GER of SCs (12.9) and STs (20.5). Further, there is disparity within the social groups between
male and female GER. The gender parity index for SC is 1.05, and it is much lower in case of STs (0.73). As can be seen
from table below on Gender and Social representation, the share of student enrolment across all backward groups, except
ST and other minorities in UP is lesser than their proportionate share in population.
Faculty and Staff Table 131: Key Faculty & Staff Indicators – UP
Key Indicators UP INDIA
Pupil Teacher Ratio (PTR) 15.1 13.1
Teachers per College 68.2 53.8
Non-teaching staff per College 30.0 34.5
Calculation is based on the total number of responses as given in the AISHE 2011-12 survey
Figure 167: State‐wise Enrolment through Regular Mode at various levels – UP
Figure 169: Post-wise share of teaching staff – UP
Ph.D. M.PhilPost
GraduateUnder
GraduatePG Diploma Diploma Certificate Integrated
Female 2500 618 175967 1605483 1210 15778 9508 2870
Male 5127 758 186329 1904398 2195 29804 10690 6085
0%
10%
20%
30%
40%
50%
60%
70%
80%
90%
100%
Figure 168: GER for All, SC & ST – UP
17
.4
12
.9
20
.5
17
.5
12
.6
23
.6
17
.2
13
.2 17
.2
0
5
10
15
20
25
All SC ST
Total
Male
Female
74%
14%
6%
4% 2% Lecturer / AssistantProfessorReader & AssociateProfessorProfessor &EquivalentTemporary Teacher

172 Annual Status of Higher Education in States and UTs 2014
The PTR of colleges in UP at 15.1 students per teacher is lower than the all India average of 13.1. Total number of
teaching staff and non-teaching staff in all colleges in UP is estimated to be 3.29 lakhs and 1.45 lakhs respectively
(extrapolating data available for 39.5% colleges in state). However, given the number of colleges in the state, the number
of teachers per college (68.2) and non-teaching staff per college (30.0) farely appropriate when compared to the
corresponding all–India levels as shown in the adjoining table.
In terms of the post-wise share of teaching staff, the figure alongside provides the break-up in the state. 74% of the
teaching posts are at level of Lecturer/ Assistant professor. There are about 14% of Readers/ Associate Professors and
Professors. Around 4% of the staff is temporary and 2% Demonstrator/tutor.
In terms of representation of various social groups and gender in the teaching and non-teaching staff, the table below
provides the relative comparison with the state population. It reveals that females are significantly under-represented
among the faculty and staff in higher education institutes as compared to males. In case of social groups also, all the
groups shown in the table show a deficit in terms of representation in both faculty and staff in higher educational
institutions as compared to their share of population in the state. When compared to all-India levels of representation, UP
has fared much better in terms of Muslim representation, but lags behind in women, ST, OBC and other minority
representation among faculty and non-teaching staff.
Table 132: Student, Faculty and Staff - Gender and Social representation – UP
Indicator Male Female SC ST OBC Muslim Other
Minority
Share of Population 52.3% 47.7% 25.8% 0.8% 52.5% 18.8% 0.6%
Share of Enrolment 54.5% 45.5% 14.9% 0.6% 34.2% 8.7% 0.9%
Share of teaching staff 67.7% 32.3% 5.7% 0.3% 16.9% 4.8% 1.5%
Share of non-teaching staff 84.0% 16.0% 13.1% 0.9% 21.2% 9.5% 1.3%
Source: Share of population - Census 2011 & India Human Development Report 2011; Calculations of teaching and non-teaching staff using data from All
India Survey of Higher Education, MHRD 2011-12
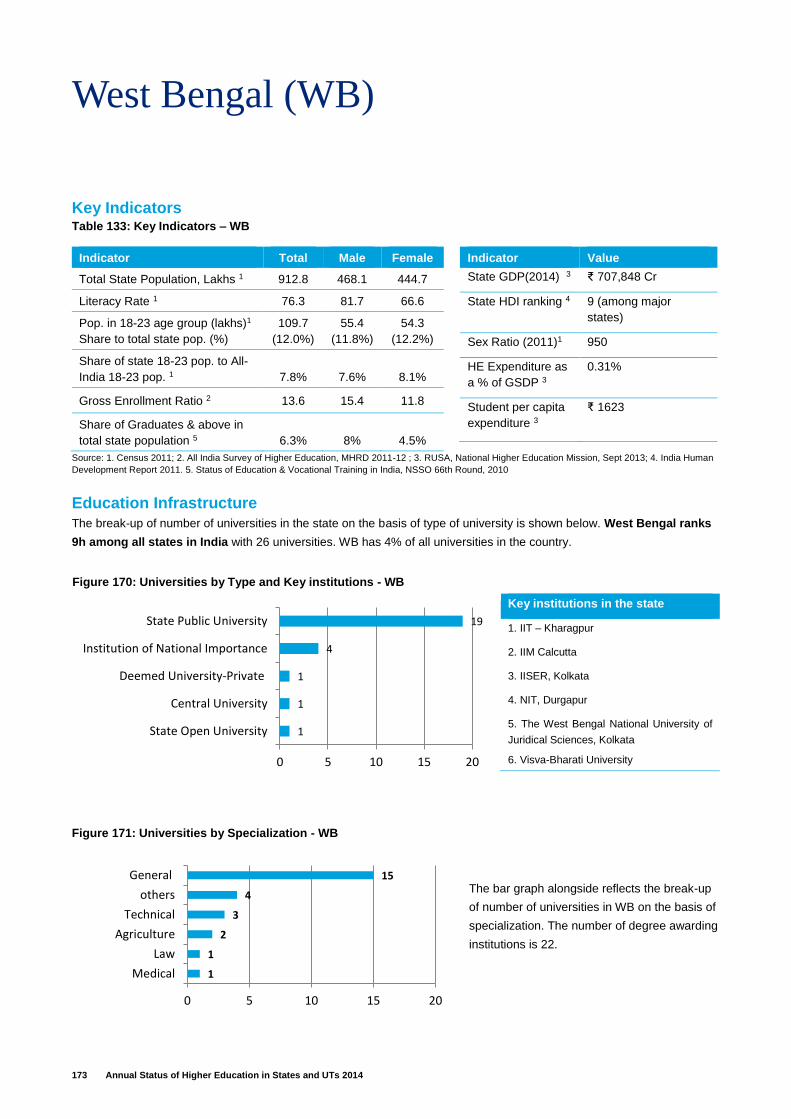
173 Annual Status of Higher Education in States and UTs 2014
West Bengal (WB)
Key Indicators Table 133: Key Indicators – WB
Indicator Total Male Female
Total State Population, Lakhs 1 912.8 468.1 444.7
Literacy Rate 1 76.3 81.7 66.6
Pop. in 18-23 age group (lakhs)1
Share to total state pop. (%)
109.7
(12.0%)
55.4
(11.8%)
54.3
(12.2%)
Share of state 18-23 pop. to All-
India 18-23 pop. 1 7.8% 7.6% 8.1%
Gross Enrollment Ratio 2 13.6 15.4 11.8
Share of Graduates & above in
total state population 5 6.3% 8% 4.5%
Indicator Value
State GDP(2014) 3 ₹ 707,848 Cr
State HDI ranking 4 9 (among major
states)
Sex Ratio (2011)1 950
HE Expenditure as
a % of GSDP 3
0.31%
Student per capita
expenditure 3
₹ 1623
Source: 1. Census 2011; 2. All India Survey of Higher Education, MHRD 2011-12 ; 3. RUSA, National Higher Education Mission, Sept 2013; 4. India Human
Development Report 2011. 5. Status of Education & Vocational Training in India, NSSO 66th Round, 2010
Education Infrastructure
The break-up of number of universities in the state on the basis of type of university is shown below. West Bengal ranks
9h among all states in India with 26 universities. WB has 4% of all universities in the country.
Key institutions in the state
1. IIT – Kharagpur
2. IIM Calcutta
3. IISER, Kolkata
4. NIT, Durgapur
5. The West Bengal National University of
Juridical Sciences, Kolkata
6. Visva-Bharati University
The bar graph alongside reflects the break-up
of number of universities in WB on the basis of
specialization. The number of degree awarding
institutions is 22.
Figure 170: Universities by Type and Key institutions - WB
1
1
2
3
4
15
0 5 10 15 20
Medical
Law
Agriculture
Technical
others
General
Figure 171: Universities by Specialization - WB
1
1
1
4
19
0 5 10 15 20
State Open University
Central University
Deemed University-Private
Institution of National Importance
State Public University
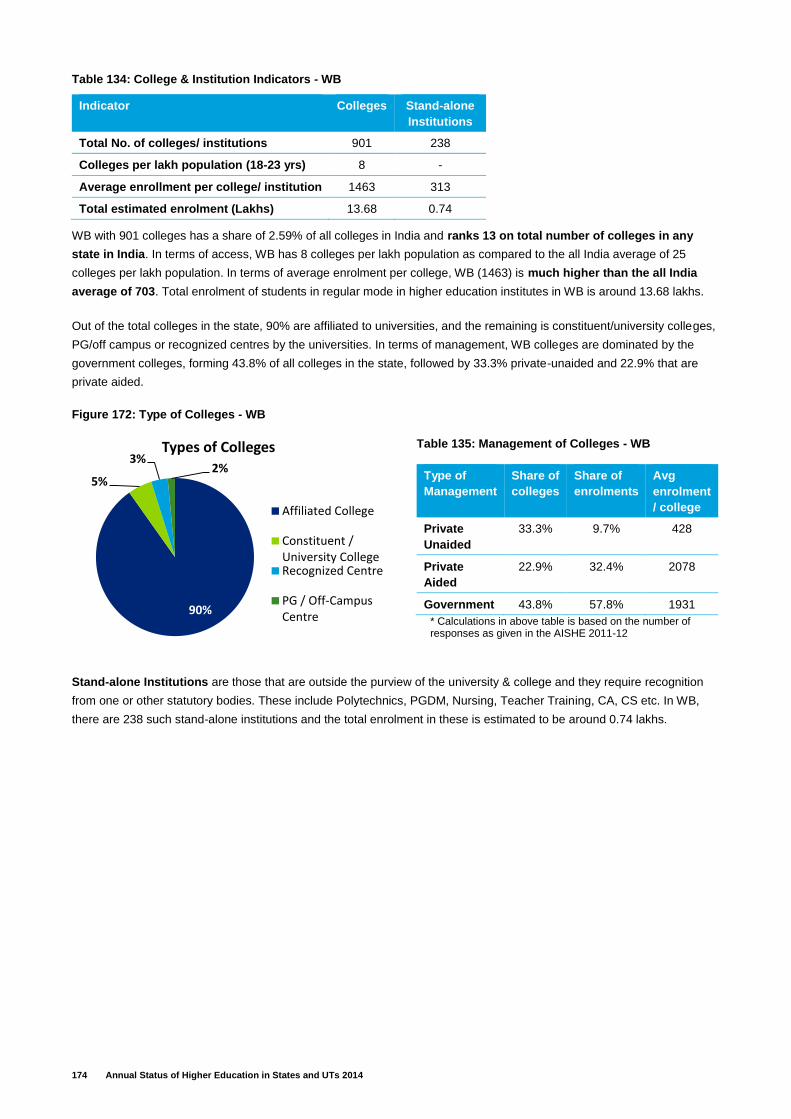
174 Annual Status of Higher Education in States and UTs 2014
Table 134: College & Institution Indicators - WB
WB with 901 colleges has a share of 2.59% of all colleges in India and ranks 13 on total number of colleges in any
state in India. In terms of access, WB has 8 colleges per lakh population as compared to the all India average of 25
colleges per lakh population. In terms of average enrolment per college, WB (1463) is much higher than the all India
average of 703. Total enrolment of students in regular mode in higher education institutes in WB is around 13.68 lakhs.
Out of the total colleges in the state, 90% are affiliated to universities, and the remaining is constituent/university colleges,
PG/off campus or recognized centres by the universities. In terms of management, WB colleges are dominated by the
government colleges, forming 43.8% of all colleges in the state, followed by 33.3% private-unaided and 22.9% that are
private aided.
Figure 172: Type of Colleges - WB
Table 135: Management of Colleges - WB
Type of
Management
Share of
colleges
Share of
enrolments
Avg
enrolment
/ college
Private
Unaided
33.3% 9.7% 428
Private
Aided
22.9% 32.4% 2078
Government 43.8% 57.8% 1931
* Calculations in above table is based on the number of responses as given in the AISHE 2011-12
Stand-alone Institutions are those that are outside the purview of the university & college and they require recognition
from one or other statutory bodies. These include Polytechnics, PGDM, Nursing, Teacher Training, CA, CS etc. In WB,
there are 238 such stand-alone institutions and the total enrolment in these is estimated to be around 0.74 lakhs.
Indicator Colleges Stand-alone
Institutions
Total No. of colleges/ institutions 901 238
Colleges per lakh population (18-23 yrs) 8 -
Average enrollment per college/ institution 1463 313
Total estimated enrolment (Lakhs) 13.68 0.74
90%
5%
3%2%
Types of Colleges
Affiliated College
Constituent /University CollegeRecognized Centre
PG / Off-CampusCentre
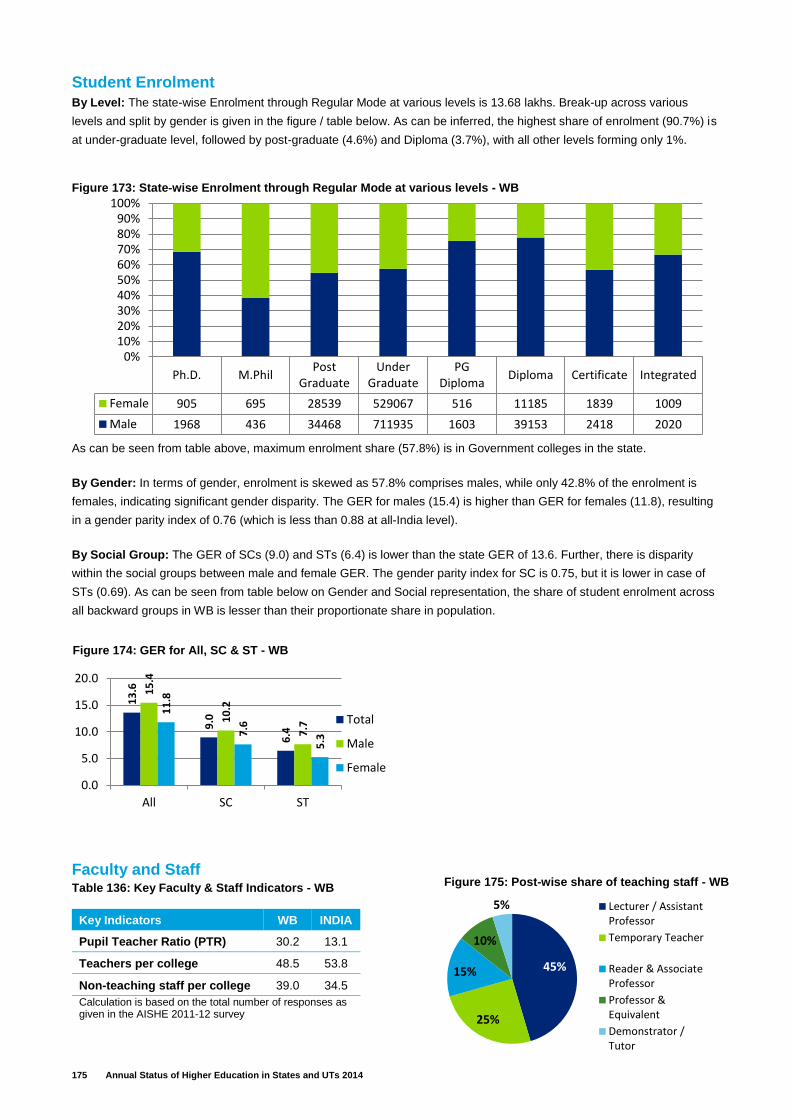
175 Annual Status of Higher Education in States and UTs 2014
Student Enrolment
By Level: The state-wise Enrolment through Regular Mode at various levels is 13.68 lakhs. Break-up across various
levels and split by gender is given in the figure / table below. As can be inferred, the highest share of enrolment (90.7%) is
at under-graduate level, followed by post-graduate (4.6%) and Diploma (3.7%), with all other levels forming only 1%.
As can be seen from table above, maximum enrolment share (57.8%) is in Government colleges in the state.
By Gender: In terms of gender, enrolment is skewed as 57.8% comprises males, while only 42.8% of the enrolment is
females, indicating significant gender disparity. The GER for males (15.4) is higher than GER for females (11.8), resulting
in a gender parity index of 0.76 (which is less than 0.88 at all-India level).
By Social Group: The GER of SCs (9.0) and STs (6.4) is lower than the state GER of 13.6. Further, there is disparity
within the social groups between male and female GER. The gender parity index for SC is 0.75, but it is lower in case of
STs (0.69). As can be seen from table below on Gender and Social representation, the share of student enrolment across
all backward groups in WB is lesser than their proportionate share in population.
Faculty and Staff Table 136: Key Faculty & Staff Indicators - WB
Key Indicators WB INDIA
Pupil Teacher Ratio (PTR) 30.2 13.1
Teachers per college 48.5 53.8
Non-teaching staff per college 39.0 34.5
Calculation is based on the total number of responses as given in the AISHE 2011-12 survey
Ph.D. M.PhilPost
GraduateUnder
GraduatePG
DiplomaDiploma Certificate Integrated
Female 905 695 28539 529067 516 11185 1839 1009
Male 1968 436 34468 711935 1603 39153 2418 2020
0%10%20%30%40%50%60%70%80%90%
100%Figure 173: State‐wise Enrolment through Regular Mode at various levels - WB
13
.6
9.0
6.4
15
.4
10
.2
7.7
11
.8
7.6
5.3
0.0
5.0
10.0
15.0
20.0
All SC ST
Total
Male
Female
Figure 174: GER for All, SC & ST - WB
45%
25%
15%
10%
5% Lecturer / AssistantProfessor
Temporary Teacher
Reader & AssociateProfessor
Professor &Equivalent
Demonstrator /Tutor
Figure 175: Post-wise share of teaching staff - WB
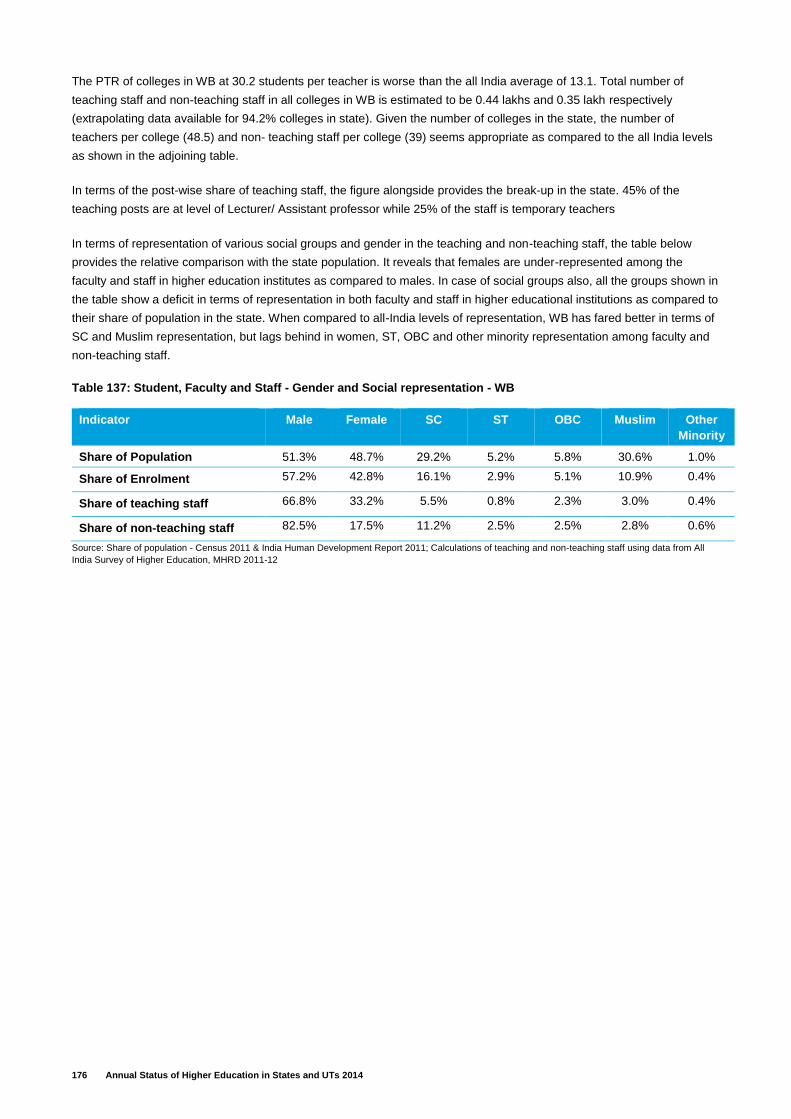
176 Annual Status of Higher Education in States and UTs 2014
The PTR of colleges in WB at 30.2 students per teacher is worse than the all India average of 13.1. Total number of
teaching staff and non-teaching staff in all colleges in WB is estimated to be 0.44 lakhs and 0.35 lakh respectively
(extrapolating data available for 94.2% colleges in state). Given the number of colleges in the state, the number of
teachers per college (48.5) and non- teaching staff per college (39) seems appropriate as compared to the all India levels
as shown in the adjoining table.
In terms of the post-wise share of teaching staff, the figure alongside provides the break-up in the state. 45% of the
teaching posts are at level of Lecturer/ Assistant professor while 25% of the staff is temporary teachers
In terms of representation of various social groups and gender in the teaching and non-teaching staff, the table below
provides the relative comparison with the state population. It reveals that females are under-represented among the
faculty and staff in higher education institutes as compared to males. In case of social groups also, all the groups shown in
the table show a deficit in terms of representation in both faculty and staff in higher educational institutions as compared to
their share of population in the state. When compared to all-India levels of representation, WB has fared better in terms of
SC and Muslim representation, but lags behind in women, ST, OBC and other minority representation among faculty and
non-teaching staff.
Table 137: Student, Faculty and Staff - Gender and Social representation - WB
Indicator Male Female SC ST OBC Muslim Other
Minority
Share of Population 51.3% 48.7% 29.2% 5.2% 5.8% 30.6% 1.0%
Share of Enrolment 57.2% 42.8% 16.1% 2.9% 5.1% 10.9% 0.4%
Share of teaching staff 66.8% 33.2% 5.5% 0.8% 2.3% 3.0% 0.4%
Share of non-teaching staff 82.5% 17.5% 11.2% 2.5% 2.5% 2.8% 0.6%
Source: Share of population - Census 2011 & India Human Development Report 2011; Calculations of teaching and non-teaching staff using data from All
India Survey of Higher Education, MHRD 2011-12
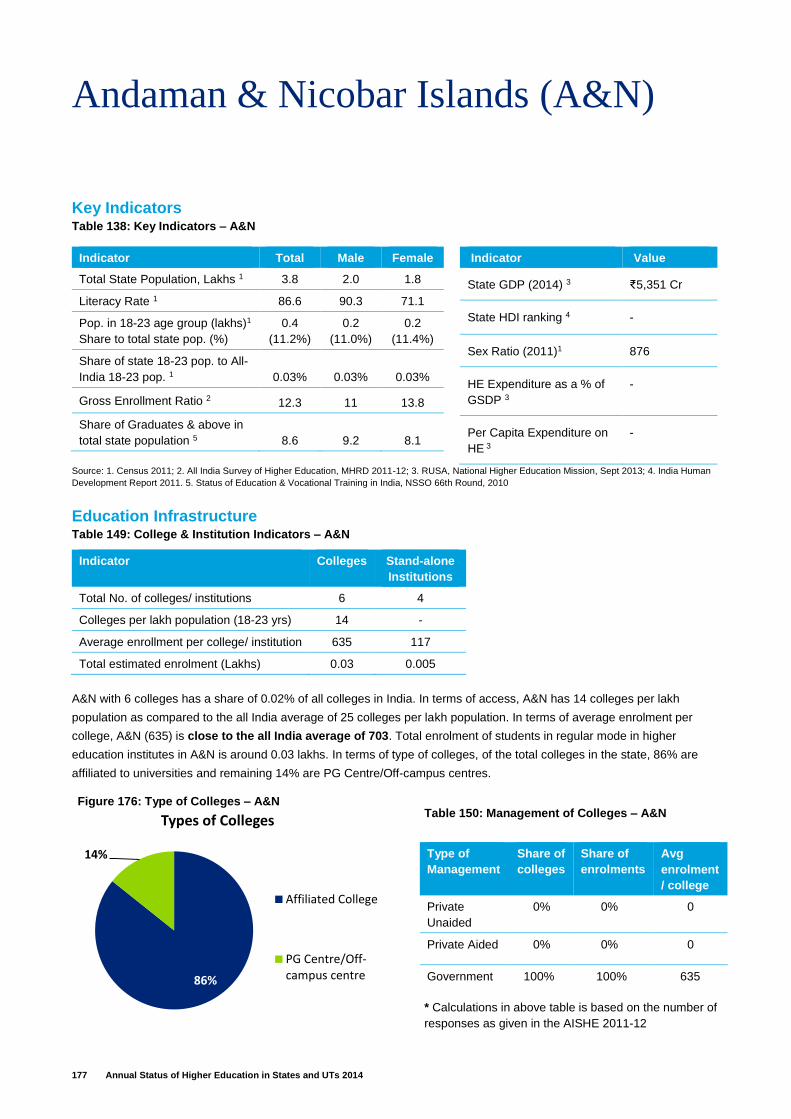
177 Annual Status of Higher Education in States and UTs 2014
Andaman & Nicobar Islands (A&N)
Key Indicators Table 138: Key Indicators – A&N
Indicator Total Male Female
Total State Population, Lakhs 1 3.8 2.0 1.8
Literacy Rate 1 86.6 90.3 71.1
Pop. in 18-23 age group (lakhs)1
Share to total state pop. (%)
0.4
(11.2%)
0.2
(11.0%)
0.2
(11.4%)
Share of state 18-23 pop. to All-
India 18-23 pop. 1 0.03% 0.03% 0.03%
Gross Enrollment Ratio 2 12.3 11 13.8
Share of Graduates & above in
total state population 5 8.6 9.2 8.1
Indicator Value
State GDP (2014) 3 ₹5,351 Cr
State HDI ranking 4 -
Sex Ratio (2011)1 876
HE Expenditure as a % of
GSDP 3
-
Per Capita Expenditure on
HE 3
-
Source: 1. Census 2011; 2. All India Survey of Higher Education, MHRD 2011-12; 3. RUSA, National Higher Education Mission, Sept 2013; 4. India Human
Development Report 2011. 5. Status of Education & Vocational Training in India, NSSO 66th Round, 2010
Education Infrastructure Table 149: College & Institution Indicators – A&N
A&N with 6 colleges has a share of 0.02% of all colleges in India. In terms of access, A&N has 14 colleges per lakh
population as compared to the all India average of 25 colleges per lakh population. In terms of average enrolment per
college, A&N (635) is close to the all India average of 703. Total enrolment of students in regular mode in higher
education institutes in A&N is around 0.03 lakhs. In terms of type of colleges, of the total colleges in the state, 86% are
affiliated to universities and remaining 14% are PG Centre/Off-campus centres.
Indicator Colleges Stand-alone
Institutions
Total No. of colleges/ institutions 6 4
Colleges per lakh population (18-23 yrs) 14 -
Average enrollment per college/ institution 635 117
Total estimated enrolment (Lakhs) 0.03 0.005
Type of
Management
Share of
colleges
Share of
enrolments
Avg
enrolment
/ college
Private
Unaided
0% 0% 0
Private Aided 0% 0% 0
Government 100% 100% 635 86%
14%
Types of Colleges
Affiliated College
PG Centre/Off-campus centre
Figure 176: Type of Colleges – A&N Table 150: Management of Colleges – A&N
* Calculations in above table is based on the number of
responses as given in the AISHE 2011-12
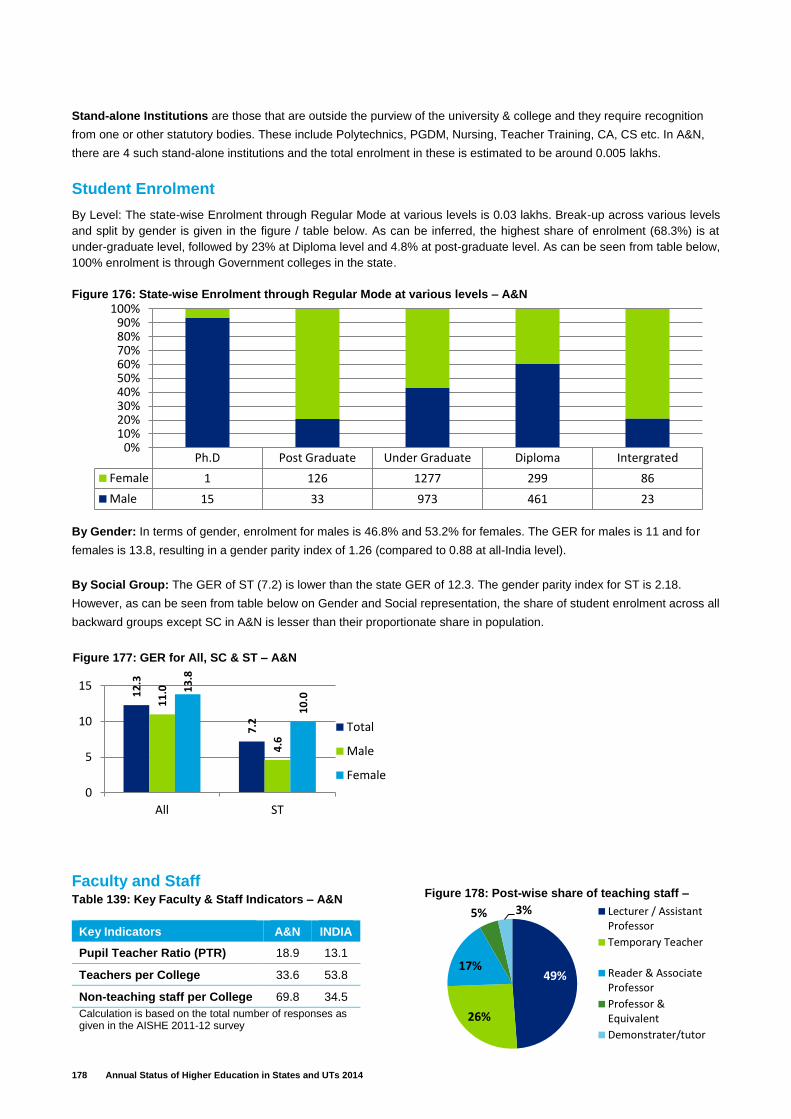
178 Annual Status of Higher Education in States and UTs 2014
Stand-alone Institutions are those that are outside the purview of the university & college and they require recognition
from one or other statutory bodies. These include Polytechnics, PGDM, Nursing, Teacher Training, CA, CS etc. In A&N,
there are 4 such stand-alone institutions and the total enrolment in these is estimated to be around 0.005 lakhs.
Student Enrolment
By Level: The state-wise Enrolment through Regular Mode at various levels is 0.03 lakhs. Break-up across various levels
and split by gender is given in the figure / table below. As can be inferred, the highest share of enrolment (68.3%) is at
under-graduate level, followed by 23% at Diploma level and 4.8% at post-graduate level. As can be seen from table below,
100% enrolment is through Government colleges in the state.
By Gender: In terms of gender, enrolment for males is 46.8% and 53.2% for females. The GER for males is 11 and for
females is 13.8, resulting in a gender parity index of 1.26 (compared to 0.88 at all-India level).
By Social Group: The GER of ST (7.2) is lower than the state GER of 12.3. The gender parity index for ST is 2.18.
However, as can be seen from table below on Gender and Social representation, the share of student enrolment across all
backward groups except SC in A&N is lesser than their proportionate share in population.
Faculty and Staff Table 139: Key Faculty & Staff Indicators – A&N
Key Indicators A&N INDIA
Pupil Teacher Ratio (PTR) 18.9 13.1
Teachers per College 33.6 53.8
Non-teaching staff per College 69.8 34.5
Calculation is based on the total number of responses as given in the AISHE 2011-12 survey
Ph.D Post Graduate Under Graduate Diploma Intergrated
Female 1 126 1277 299 86
Male 15 33 973 461 23
0%10%20%30%40%50%60%70%80%90%
100%Figure 176: State‐wise Enrolment through Regular Mode at various levels – A&N
12
.3
7.2
11
.0
4.6
13
.8
10
.0
0
5
10
15
All ST
Total
Male
Female
Figure 177: GER for All, SC & ST – A&N
49%
26%
17%
5% 3% Lecturer / AssistantProfessor
Temporary Teacher
Reader & AssociateProfessor
Professor &Equivalent
Demonstrater/tutor
Figure 178: Post-wise share of teaching staff –
A&N
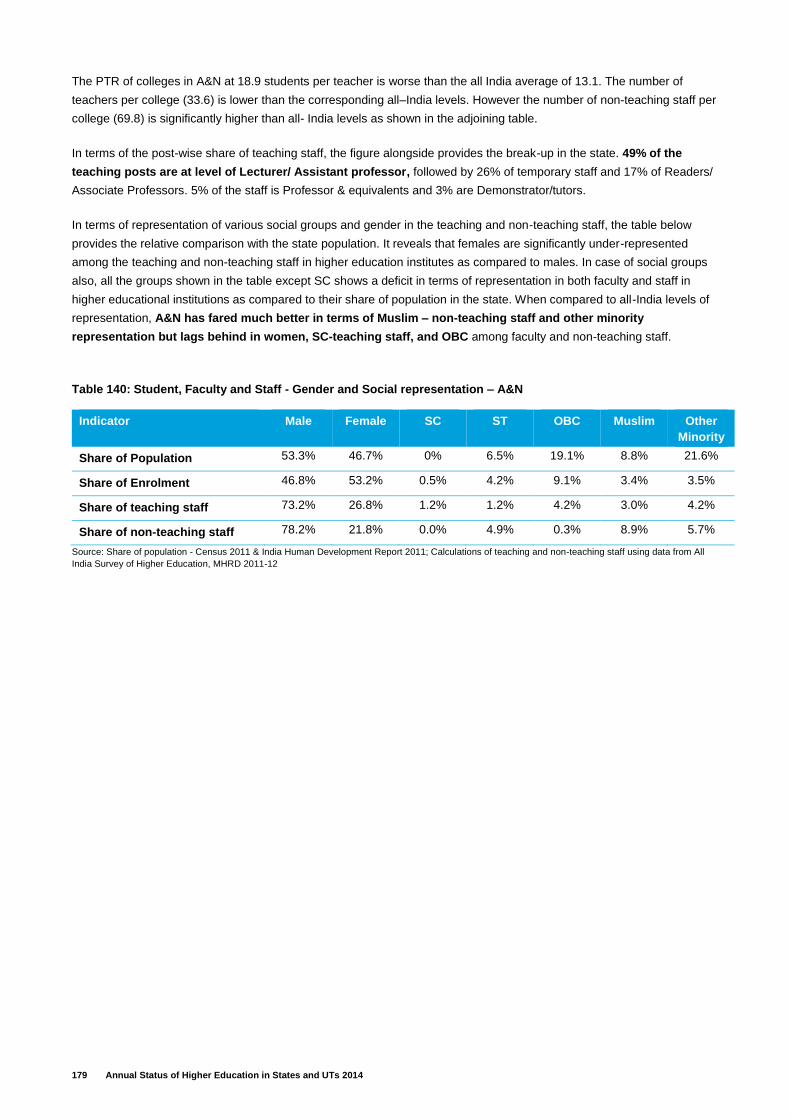
179 Annual Status of Higher Education in States and UTs 2014
The PTR of colleges in A&N at 18.9 students per teacher is worse than the all India average of 13.1. The number of
teachers per college (33.6) is lower than the corresponding all–India levels. However the number of non-teaching staff per
college (69.8) is significantly higher than all- India levels as shown in the adjoining table.
In terms of the post-wise share of teaching staff, the figure alongside provides the break-up in the state. 49% of the
teaching posts are at level of Lecturer/ Assistant professor, followed by 26% of temporary staff and 17% of Readers/
Associate Professors. 5% of the staff is Professor & equivalents and 3% are Demonstrator/tutors.
In terms of representation of various social groups and gender in the teaching and non-teaching staff, the table below
provides the relative comparison with the state population. It reveals that females are significantly under-represented
among the teaching and non-teaching staff in higher education institutes as compared to males. In case of social groups
also, all the groups shown in the table except SC shows a deficit in terms of representation in both faculty and staff in
higher educational institutions as compared to their share of population in the state. When compared to all-India levels of
representation, A&N has fared much better in terms of Muslim – non-teaching staff and other minority
representation but lags behind in women, SC-teaching staff, and OBC among faculty and non-teaching staff.
Table 140: Student, Faculty and Staff - Gender and Social representation – A&N
Indicator Male Female SC ST OBC Muslim Other
Minority
Share of Population 53.3% 46.7% 0% 6.5% 19.1% 8.8% 21.6%
Share of Enrolment 46.8% 53.2% 0.5% 4.2% 9.1% 3.4% 3.5%
Share of teaching staff 73.2% 26.8% 1.2% 1.2% 4.2% 3.0% 4.2%
Share of non-teaching staff 78.2% 21.8% 0.0% 4.9% 0.3% 8.9% 5.7%
Source: Share of population - Census 2011 & India Human Development Report 2011; Calculations of teaching and non-teaching staff using data from All
India Survey of Higher Education, MHRD 2011-12
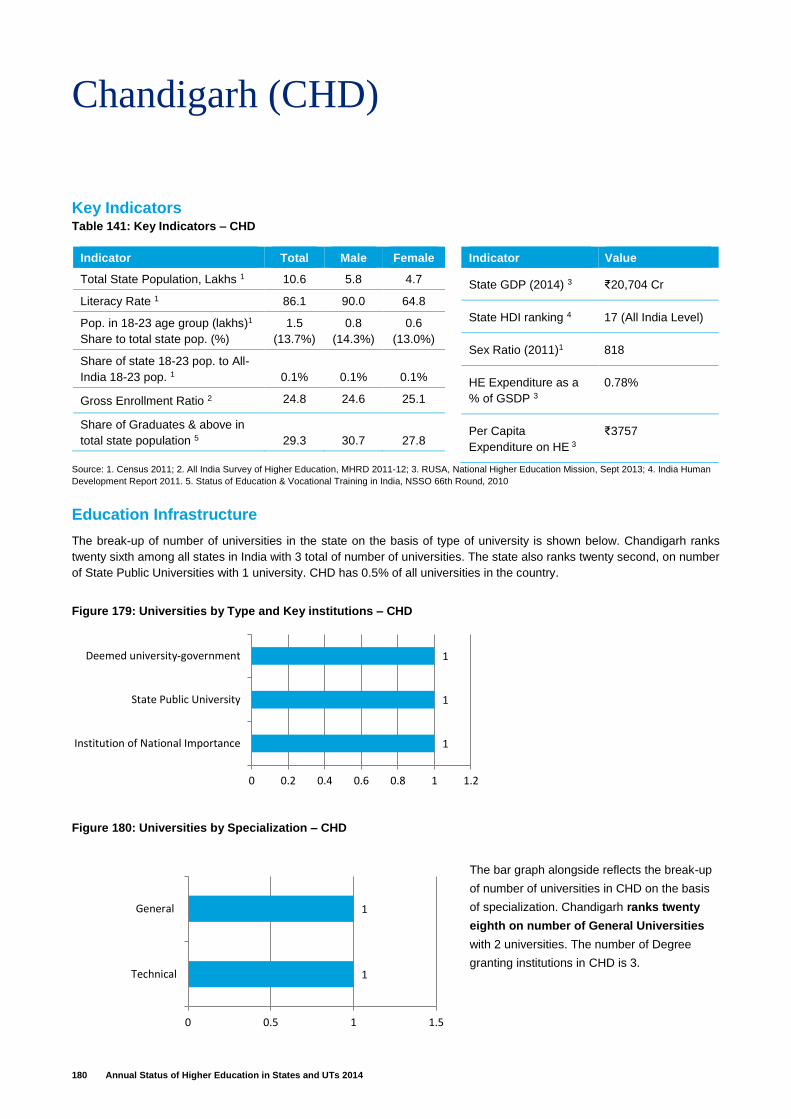
180 Annual Status of Higher Education in States and UTs 2014
Chandigarh (CHD)
Key Indicators Table 141: Key Indicators – CHD
Indicator Total Male Female
Total State Population, Lakhs 1 10.6 5.8 4.7
Literacy Rate 1 86.1 90.0 64.8
Pop. in 18-23 age group (lakhs)1
Share to total state pop. (%)
1.5
(13.7%)
0.8
(14.3%)
0.6
(13.0%)
Share of state 18-23 pop. to All-
India 18-23 pop. 1 0.1% 0.1% 0.1%
Gross Enrollment Ratio 2 24.8 24.6 25.1
Share of Graduates & above in
total state population 5 29.3 30.7 27.8
Indicator Value
State GDP (2014) 3 ₹20,704 Cr
State HDI ranking 4 17 (All India Level)
Sex Ratio (2011)1 818
HE Expenditure as a
% of GSDP 3
0.78%
Per Capita
Expenditure on HE 3
₹3757
Source: 1. Census 2011; 2. All India Survey of Higher Education, MHRD 2011-12; 3. RUSA, National Higher Education Mission, Sept 2013; 4. India Human
Development Report 2011. 5. Status of Education & Vocational Training in India, NSSO 66th Round, 2010
Education Infrastructure
The break-up of number of universities in the state on the basis of type of university is shown below. Chandigarh ranks
twenty sixth among all states in India with 3 total of number of universities. The state also ranks twenty second, on number
of State Public Universities with 1 university. CHD has 0.5% of all universities in the country.
The bar graph alongside reflects the break-up
of number of universities in CHD on the basis
of specialization. Chandigarh ranks twenty
eighth on number of General Universities
with 2 universities. The number of Degree
granting institutions in CHD is 3.
Figure 179: Universities by Type and Key institutions – CHD
1
1
0 0.5 1 1.5
Technical
General
Figure 180: Universities by Specialization – CHD
1
1
1
0 0.2 0.4 0.6 0.8 1 1.2
Institution of National Importance
State Public University
Deemed university-government
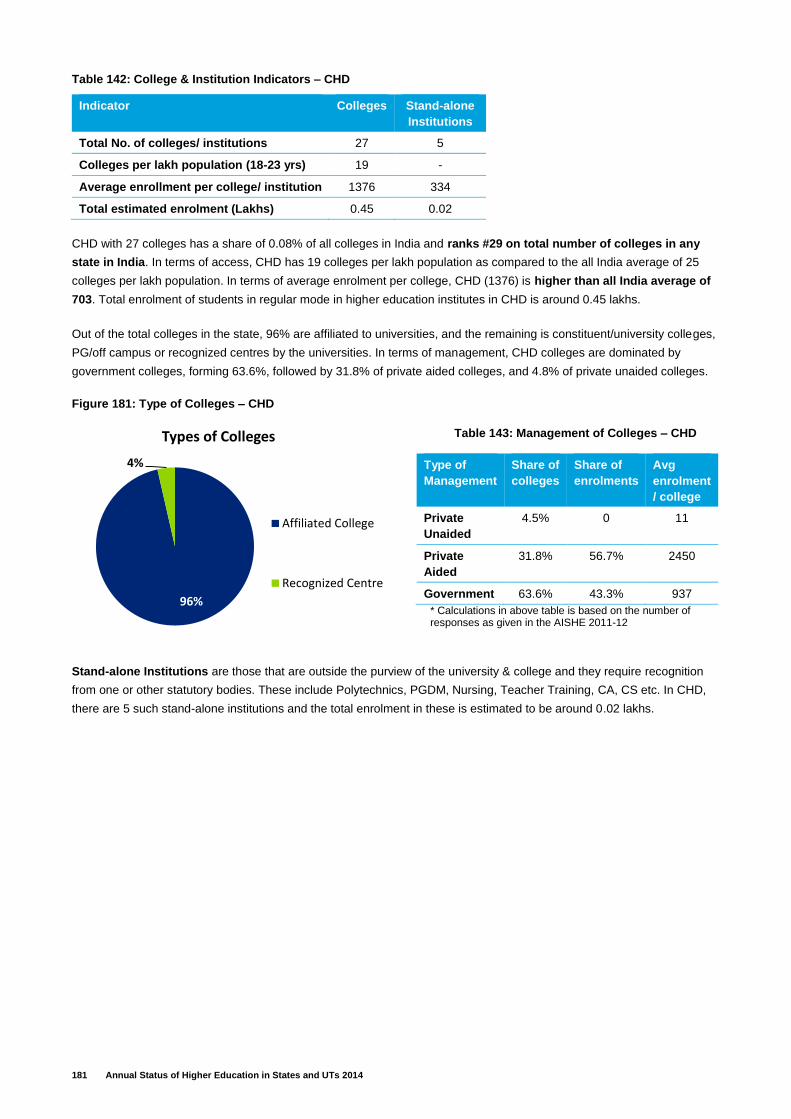
181 Annual Status of Higher Education in States and UTs 2014
Table 142: College & Institution Indicators – CHD
CHD with 27 colleges has a share of 0.08% of all colleges in India and ranks #29 on total number of colleges in any
state in India. In terms of access, CHD has 19 colleges per lakh population as compared to the all India average of 25
colleges per lakh population. In terms of average enrolment per college, CHD (1376) is higher than all India average of
703. Total enrolment of students in regular mode in higher education institutes in CHD is around 0.45 lakhs.
Out of the total colleges in the state, 96% are affiliated to universities, and the remaining is constituent/university colleges,
PG/off campus or recognized centres by the universities. In terms of management, CHD colleges are dominated by
government colleges, forming 63.6%, followed by 31.8% of private aided colleges, and 4.8% of private unaided colleges.
Figure 181: Type of Colleges – CHD
Table 143: Management of Colleges – CHD
Type of
Management
Share of
colleges
Share of
enrolments
Avg
enrolment
/ college
Private
Unaided
4.5% 0 11
Private
Aided
31.8% 56.7% 2450
Government 63.6% 43.3% 937
* Calculations in above table is based on the number of responses as given in the AISHE 2011-12
Stand-alone Institutions are those that are outside the purview of the university & college and they require recognition
from one or other statutory bodies. These include Polytechnics, PGDM, Nursing, Teacher Training, CA, CS etc. In CHD,
there are 5 such stand-alone institutions and the total enrolment in these is estimated to be around 0.02 lakhs.
Indicator Colleges Stand-alone
Institutions
Total No. of colleges/ institutions 27 5
Colleges per lakh population (18-23 yrs) 19 -
Average enrollment per college/ institution 1376 334
Total estimated enrolment (Lakhs) 0.45 0.02
96%
4%
Types of Colleges
Affiliated College
Recognized Centre
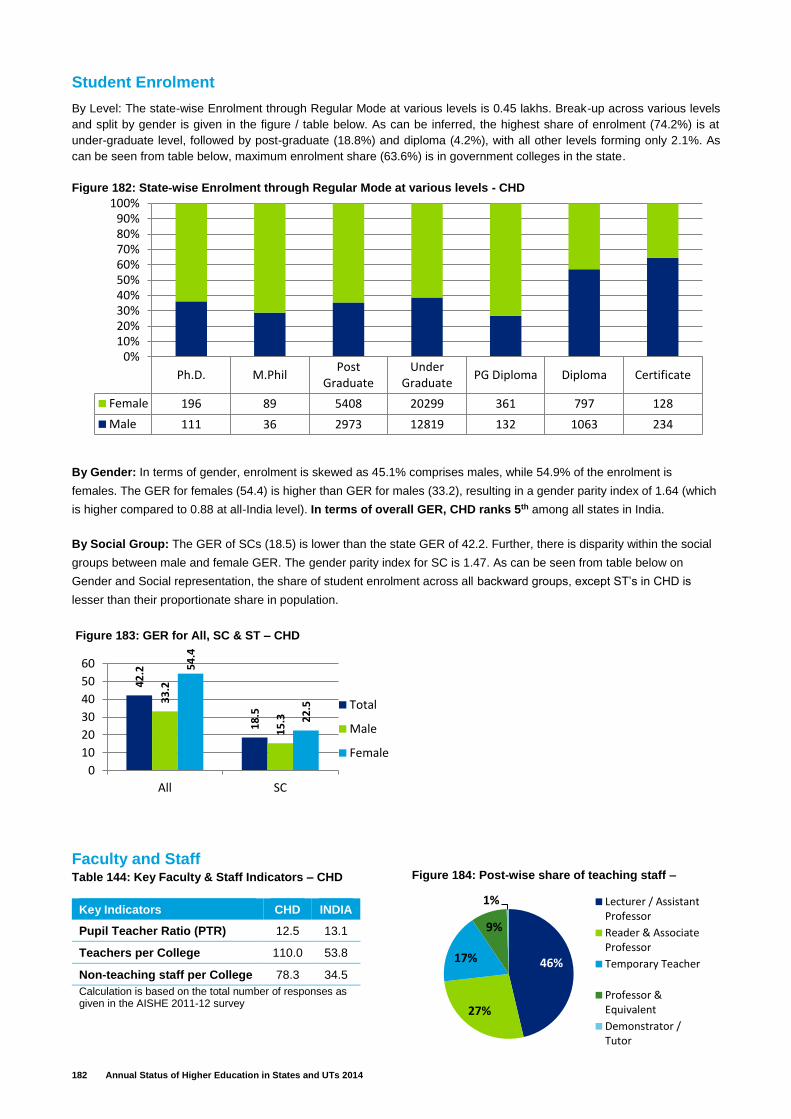
182 Annual Status of Higher Education in States and UTs 2014
Student Enrolment
By Level: The state-wise Enrolment through Regular Mode at various levels is 0.45 lakhs. Break-up across various levels
and split by gender is given in the figure / table below. As can be inferred, the highest share of enrolment (74.2%) is at
under-graduate level, followed by post-graduate (18.8%) and diploma (4.2%), with all other levels forming only 2.1%. As
can be seen from table below, maximum enrolment share (63.6%) is in government colleges in the state.
By Gender: In terms of gender, enrolment is skewed as 45.1% comprises males, while 54.9% of the enrolment is
females. The GER for females (54.4) is higher than GER for males (33.2), resulting in a gender parity index of 1.64 (which
is higher compared to 0.88 at all-India level). In terms of overall GER, CHD ranks 5th among all states in India.
By Social Group: The GER of SCs (18.5) is lower than the state GER of 42.2. Further, there is disparity within the social
groups between male and female GER. The gender parity index for SC is 1.47. As can be seen from table below on
Gender and Social representation, the share of student enrolment across all backward groups, except ST’s in CHD is
lesser than their proportionate share in population.
Faculty and Staff Table 144: Key Faculty & Staff Indicators – CHD
Key Indicators CHD INDIA
Pupil Teacher Ratio (PTR) 12.5 13.1
Teachers per College 110.0 53.8
Non-teaching staff per College 78.3 34.5
Calculation is based on the total number of responses as given in the AISHE 2011-12 survey
Ph.D. M.PhilPost
GraduateUnder
GraduatePG Diploma Diploma Certificate
Female 196 89 5408 20299 361 797 128
Male 111 36 2973 12819 132 1063 234
0%10%20%30%40%50%60%70%80%90%
100%Figure 182: State‐wise Enrolment through Regular Mode at various levels - CHD
42
.2
18
.5
33
.2
15
.3
54
.4
22
.5
0
10
20
30
40
50
60
All SC
Total
Male
Female
Figure 183: GER for All, SC & ST – CHD
46%
27%
17%
9%
1% Lecturer / AssistantProfessor
Reader & AssociateProfessor
Temporary Teacher
Professor &Equivalent
Demonstrator /Tutor
Figure 184: Post-wise share of teaching staff –
CHD

183 Annual Status of Higher Education in States and UTs 2014
The PTR of colleges in CHD at 12.5 students per teacher is better than the all India average of 13.1. Total number of
teaching staff and non-teaching staff in all colleges in CHD is estimated to be 0.03 lakhs and 0.2 lakhs respectively
(extrapolating data available for 81.5% colleges in state). However, given the large number of colleges in the state, the
number of teachers per college (110.0) and non-teaching staff per college (78.3) are more than the corresponding all-India
levels as shown in the adjoining table.
In terms of the post-wise share of teaching staff, the figure alongside provides the break-up in the state. 46% of the
teaching posts are at level of Lecturer/ Assistant professor. There are about 27% of Readers/ Associate Professors and
Professors. Around 17% of the staff is temporary and 1% Demonstrator/tutor.
In terms of representation of various social groups and gender in the teaching and non-teaching staff, the table below
provides the relative comparison with the state population. It reveals that females are significantly under-represented
among the faculty and staff in higher education institutes as compared to males. In case of social groups also, all the
groups shown in the table show a deficit in terms of representation in both faculty and staff in higher educational
institutions as compared to their share of population in the state. When compared to all-India levels of representation,
CHD has fared better in terms of SC, women and other minority but lags behind in SC, OBC and muslim representation
among faculty and non-teaching staff.
Table 145: Student, Faculty and Staff - Gender and Social representation – CHD
Indicator Male Female SC ST OBC Muslim Other
Minority
Share of Population 55.0% 45.0% 19.8% 0.2% 15.2% 4.3% 13.6%
Share of Enrolment 45.1% 54.9% 8.5% 1.6% 3.1% 0.4% 7.1%
Share of teaching staff 39.1% 60.9% 6.5% 0.5% 2.9% 0.1% 7.3%
Share of non-teaching staff 77.2% 22.8% 19.0% 0.5% 3.1% 0.2% 7.4%
Source: Share of population - Census 2011 & India Human Development Report 2011; Calculations of teaching and non-teaching staff using data from All
India Survey of Higher Education, MHRD 2011-12
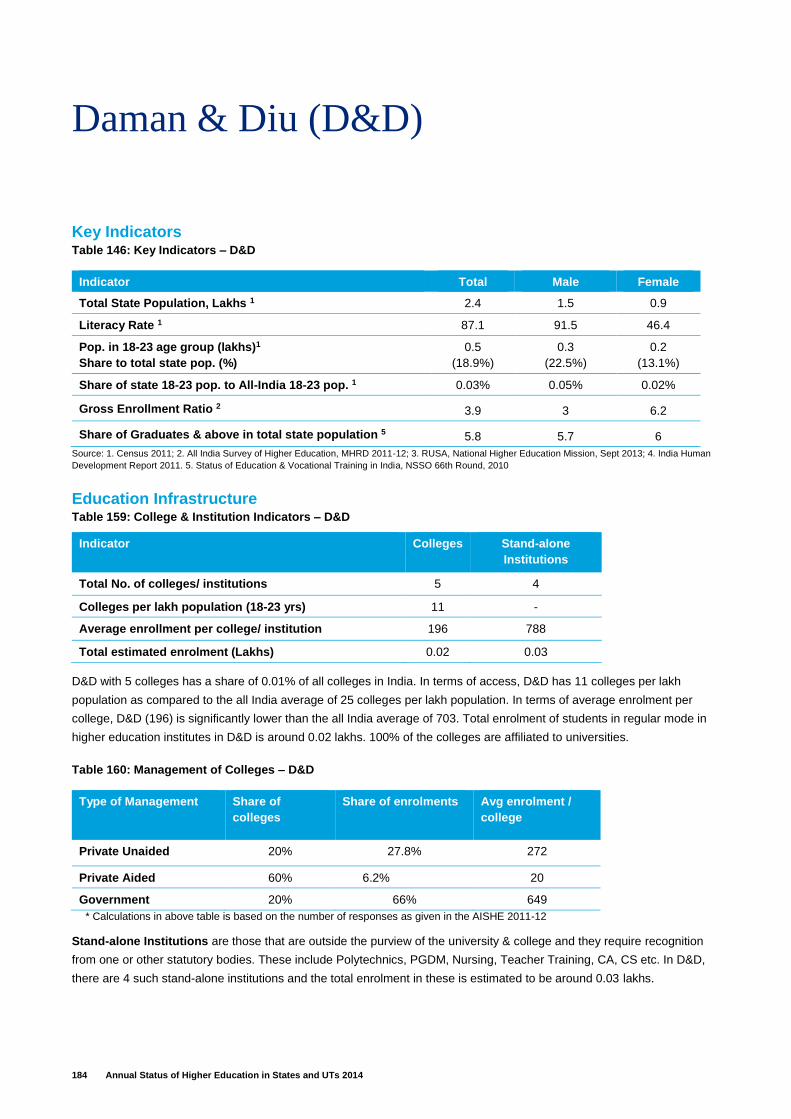
184 Annual Status of Higher Education in States and UTs 2014
Daman & Diu (D&D)
Key Indicators Table 146: Key Indicators – D&D
Indicator Total Male Female
Total State Population, Lakhs 1 2.4 1.5 0.9
Literacy Rate 1 87.1 91.5 46.4
Pop. in 18-23 age group (lakhs)1
Share to total state pop. (%)
0.5
(18.9%)
0.3
(22.5%)
0.2
(13.1%)
Share of state 18-23 pop. to All-India 18-23 pop. 1 0.03% 0.05% 0.02%
Gross Enrollment Ratio 2 3.9 3 6.2
Share of Graduates & above in total state population 5 5.8 5.7 6
Source: 1. Census 2011; 2. All India Survey of Higher Education, MHRD 2011-12; 3. RUSA, National Higher Education Mission, Sept 2013; 4. India Human
Development Report 2011. 5. Status of Education & Vocational Training in India, NSSO 66th Round, 2010
Education Infrastructure Table 159: College & Institution Indicators – D&D
D&D with 5 colleges has a share of 0.01% of all colleges in India. In terms of access, D&D has 11 colleges per lakh
population as compared to the all India average of 25 colleges per lakh population. In terms of average enrolment per
college, D&D (196) is significantly lower than the all India average of 703. Total enrolment of students in regular mode in
higher education institutes in D&D is around 0.02 lakhs. 100% of the colleges are affiliated to universities.
Table 160: Management of Colleges – D&D
Type of Management Share of
colleges
Share of enrolments Avg enrolment /
college
Private Unaided 20% 27.8% 272
Private Aided 60% 6.2% 20
Government 20% 66% 649
* Calculations in above table is based on the number of responses as given in the AISHE 2011-12
Stand-alone Institutions are those that are outside the purview of the university & college and they require recognition
from one or other statutory bodies. These include Polytechnics, PGDM, Nursing, Teacher Training, CA, CS etc. In D&D,
there are 4 such stand-alone institutions and the total enrolment in these is estimated to be around 0.03 lakhs.
Indicator Colleges Stand-alone
Institutions
Total No. of colleges/ institutions 5 4
Colleges per lakh population (18-23 yrs) 11 -
Average enrollment per college/ institution 196 788
Total estimated enrolment (Lakhs) 0.02 0.03
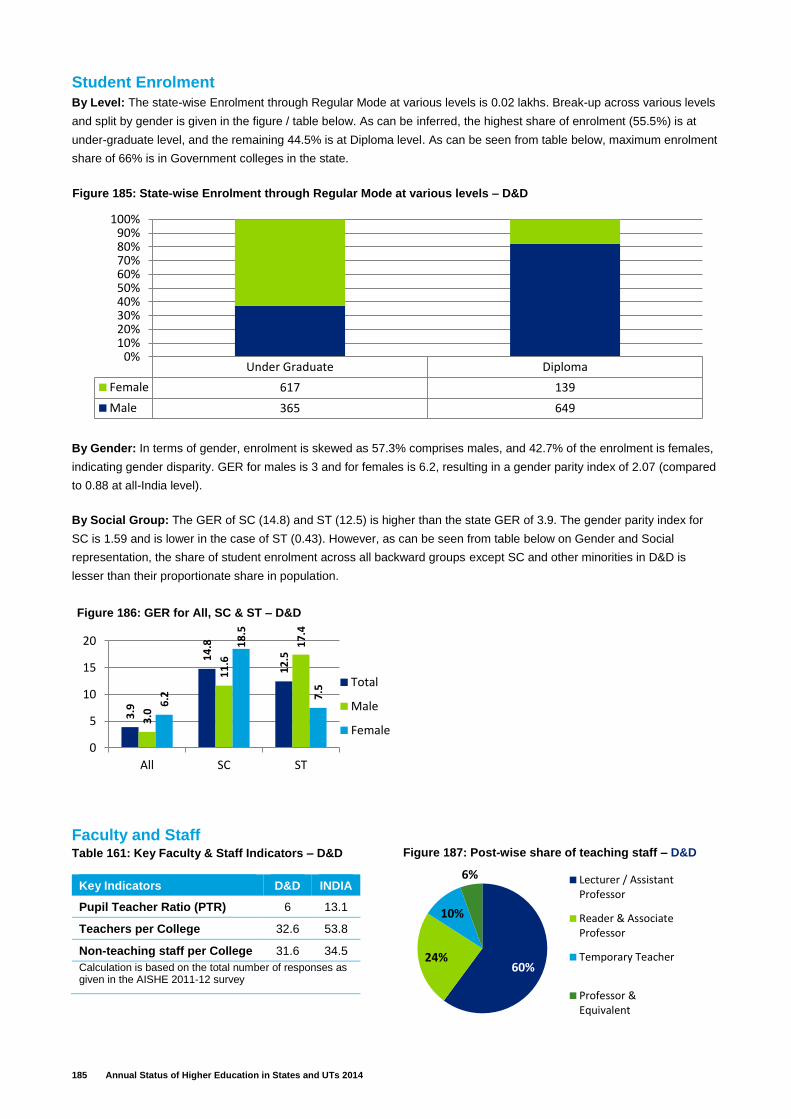
185 Annual Status of Higher Education in States and UTs 2014
Student Enrolment
By Level: The state-wise Enrolment through Regular Mode at various levels is 0.02 lakhs. Break-up across various levels
and split by gender is given in the figure / table below. As can be inferred, the highest share of enrolment (55.5%) is at
under-graduate level, and the remaining 44.5% is at Diploma level. As can be seen from table below, maximum enrolment
share of 66% is in Government colleges in the state.
By Gender: In terms of gender, enrolment is skewed as 57.3% comprises males, and 42.7% of the enrolment is females,
indicating gender disparity. GER for males is 3 and for females is 6.2, resulting in a gender parity index of 2.07 (compared
to 0.88 at all-India level).
By Social Group: The GER of SC (14.8) and ST (12.5) is higher than the state GER of 3.9. The gender parity index for
SC is 1.59 and is lower in the case of ST (0.43). However, as can be seen from table below on Gender and Social
representation, the share of student enrolment across all backward groups except SC and other minorities in D&D is
lesser than their proportionate share in population.
Faculty and Staff Table 161: Key Faculty & Staff Indicators – D&D
Key Indicators D&D INDIA
Pupil Teacher Ratio (PTR) 6 13.1
Teachers per College 32.6 53.8
Non-teaching staff per College 31.6 34.5
Calculation is based on the total number of responses as given in the AISHE 2011-12 survey
Under Graduate Diploma
Female 617 139
Male 365 649
0%10%20%30%40%50%60%70%80%90%
100%
Figure 185: State‐wise Enrolment through Regular Mode at various levels – D&D
3.9
14
.8
12
.5
3.0
11
.6
17
.4
6.2
18
.5
7.5
0
5
10
15
20
All SC ST
Total
Male
Female
Figure 186: GER for All, SC & ST – D&D
60%24%
10%
6% Lecturer / AssistantProfessor
Reader & AssociateProfessor
Temporary Teacher
Professor &Equivalent
Figure 187: Post-wise share of teaching staff – D&D
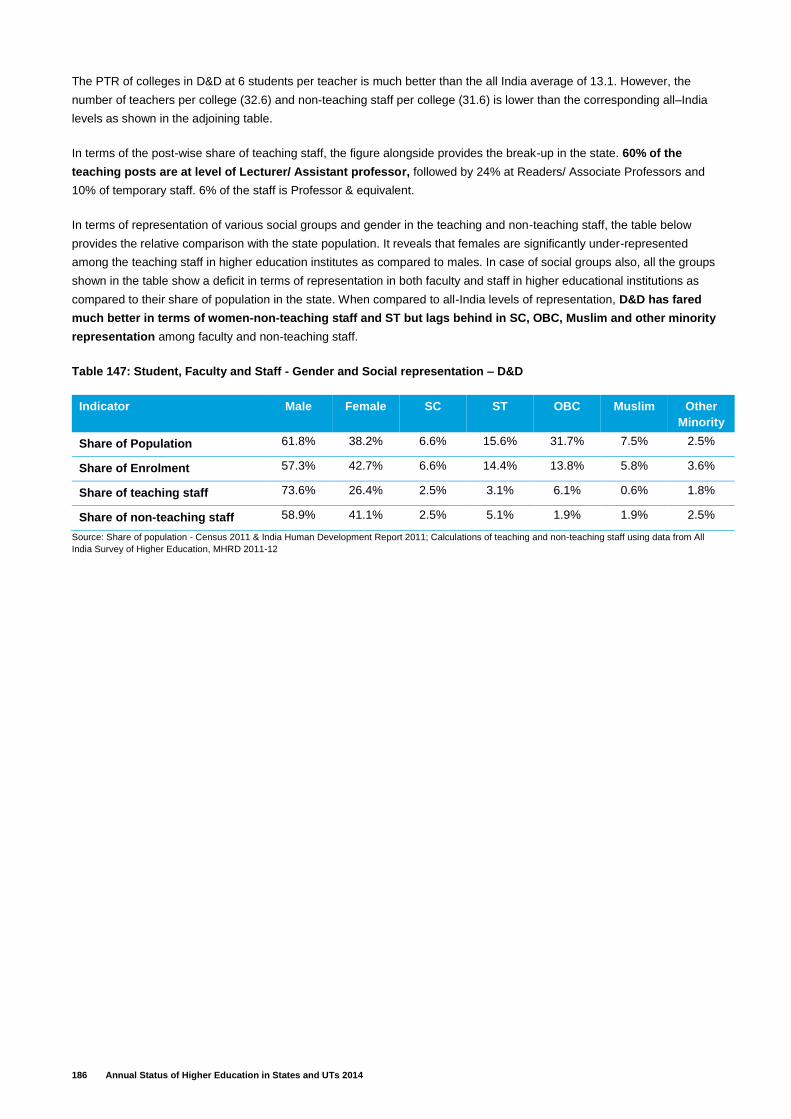
186 Annual Status of Higher Education in States and UTs 2014
The PTR of colleges in D&D at 6 students per teacher is much better than the all India average of 13.1. However, the
number of teachers per college (32.6) and non-teaching staff per college (31.6) is lower than the corresponding all–India
levels as shown in the adjoining table.
In terms of the post-wise share of teaching staff, the figure alongside provides the break-up in the state. 60% of the
teaching posts are at level of Lecturer/ Assistant professor, followed by 24% at Readers/ Associate Professors and
10% of temporary staff. 6% of the staff is Professor & equivalent.
In terms of representation of various social groups and gender in the teaching and non-teaching staff, the table below
provides the relative comparison with the state population. It reveals that females are significantly under-represented
among the teaching staff in higher education institutes as compared to males. In case of social groups also, all the groups
shown in the table show a deficit in terms of representation in both faculty and staff in higher educational institutions as
compared to their share of population in the state. When compared to all-India levels of representation, D&D has fared
much better in terms of women-non-teaching staff and ST but lags behind in SC, OBC, Muslim and other minority
representation among faculty and non-teaching staff.
Table 147: Student, Faculty and Staff - Gender and Social representation – D&D
Indicator Male Female SC ST OBC Muslim Other
Minority
Share of Population 61.8% 38.2% 6.6% 15.6% 31.7% 7.5% 2.5%
Share of Enrolment 57.3% 42.7% 6.6% 14.4% 13.8% 5.8% 3.6%
Share of teaching staff 73.6% 26.4% 2.5% 3.1% 6.1% 0.6% 1.8%
Share of non-teaching staff 58.9% 41.1% 2.5% 5.1% 1.9% 1.9% 2.5%
Source: Share of population - Census 2011 & India Human Development Report 2011; Calculations of teaching and non-teaching staff using data from All
India Survey of Higher Education, MHRD 2011-12
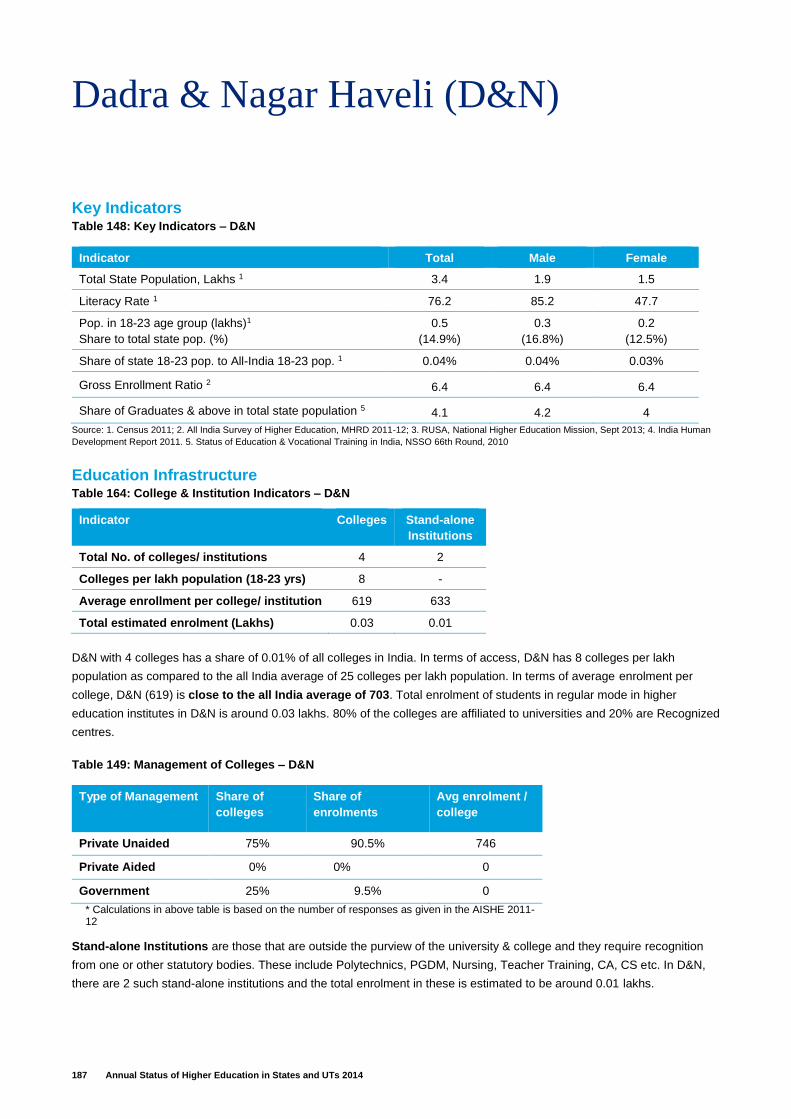
187 Annual Status of Higher Education in States and UTs 2014
Dadra & Nagar Haveli (D&N)
Key Indicators Table 148: Key Indicators – D&N
Indicator Total Male Female
Total State Population, Lakhs 1 3.4 1.9 1.5
Literacy Rate 1 76.2 85.2 47.7
Pop. in 18-23 age group (lakhs)1
Share to total state pop. (%)
0.5
(14.9%)
0.3
(16.8%)
0.2
(12.5%)
Share of state 18-23 pop. to All-India 18-23 pop. 1 0.04% 0.04% 0.03%
Gross Enrollment Ratio 2 6.4 6.4 6.4
Share of Graduates & above in total state population 5 4.1 4.2 4
Source: 1. Census 2011; 2. All India Survey of Higher Education, MHRD 2011-12; 3. RUSA, National Higher Education Mission, Sept 2013; 4. India Human
Development Report 2011. 5. Status of Education & Vocational Training in India, NSSO 66th Round, 2010
Education Infrastructure Table 164: College & Institution Indicators – D&N
D&N with 4 colleges has a share of 0.01% of all colleges in India. In terms of access, D&N has 8 colleges per lakh
population as compared to the all India average of 25 colleges per lakh population. In terms of average enrolment per
college, D&N (619) is close to the all India average of 703. Total enrolment of students in regular mode in higher
education institutes in D&N is around 0.03 lakhs. 80% of the colleges are affiliated to universities and 20% are Recognized
centres.
Table 149: Management of Colleges – D&N
Type of Management Share of
colleges
Share of
enrolments
Avg enrolment /
college
Private Unaided 75% 90.5% 746
Private Aided 0% 0% 0
Government 25% 9.5% 0
* Calculations in above table is based on the number of responses as given in the AISHE 2011-12
Stand-alone Institutions are those that are outside the purview of the university & college and they require recognition
from one or other statutory bodies. These include Polytechnics, PGDM, Nursing, Teacher Training, CA, CS etc. In D&N,
there are 2 such stand-alone institutions and the total enrolment in these is estimated to be around 0.01 lakhs.
Indicator Colleges Stand-alone
Institutions
Total No. of colleges/ institutions 4 2
Colleges per lakh population (18-23 yrs) 8 -
Average enrollment per college/ institution 619 633
Total estimated enrolment (Lakhs) 0.03 0.01
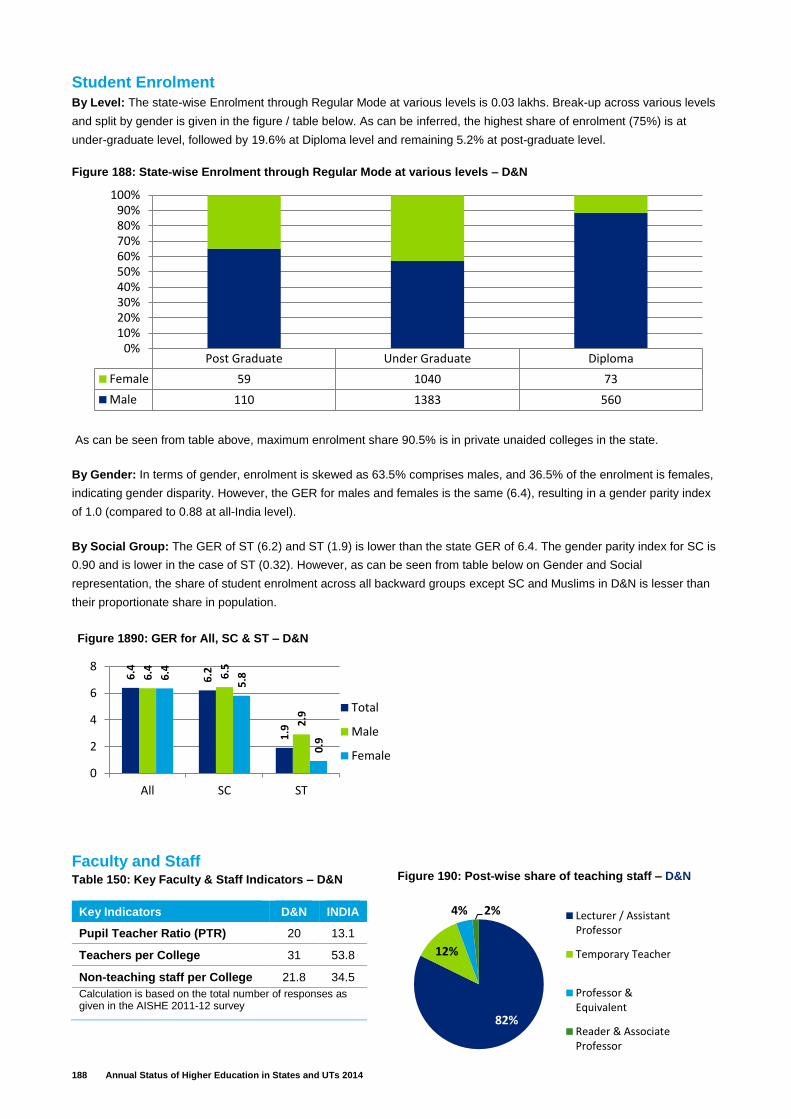
188 Annual Status of Higher Education in States and UTs 2014
Student Enrolment
By Level: The state-wise Enrolment through Regular Mode at various levels is 0.03 lakhs. Break-up across various levels
and split by gender is given in the figure / table below. As can be inferred, the highest share of enrolment (75%) is at
under-graduate level, followed by 19.6% at Diploma level and remaining 5.2% at post-graduate level.
As can be seen from table above, maximum enrolment share 90.5% is in private unaided colleges in the state.
By Gender: In terms of gender, enrolment is skewed as 63.5% comprises males, and 36.5% of the enrolment is females,
indicating gender disparity. However, the GER for males and females is the same (6.4), resulting in a gender parity index
of 1.0 (compared to 0.88 at all-India level).
By Social Group: The GER of ST (6.2) and ST (1.9) is lower than the state GER of 6.4. The gender parity index for SC is
0.90 and is lower in the case of ST (0.32). However, as can be seen from table below on Gender and Social
representation, the share of student enrolment across all backward groups except SC and Muslims in D&N is lesser than
their proportionate share in population.
Faculty and Staff Table 150: Key Faculty & Staff Indicators – D&N
Key Indicators D&N INDIA
Pupil Teacher Ratio (PTR) 20 13.1
Teachers per College 31 53.8
Non-teaching staff per College 21.8 34.5
Calculation is based on the total number of responses as given in the AISHE 2011-12 survey
Post Graduate Under Graduate Diploma
Female 59 1040 73
Male 110 1383 560
0%10%20%30%40%50%60%70%80%90%
100%
Figure 188: State‐wise Enrolment through Regular Mode at various levels – D&N
6.4
6.2
1.9
6.4 6.5
2.9
6.4
5.8
0.9
0
2
4
6
8
All SC ST
Total
Male
Female
Figure 1890: GER for All, SC & ST – D&N
82%
12%
4% 2% Lecturer / AssistantProfessor
Temporary Teacher
Professor &Equivalent
Reader & AssociateProfessor
Figure 190: Post-wise share of teaching staff – D&N
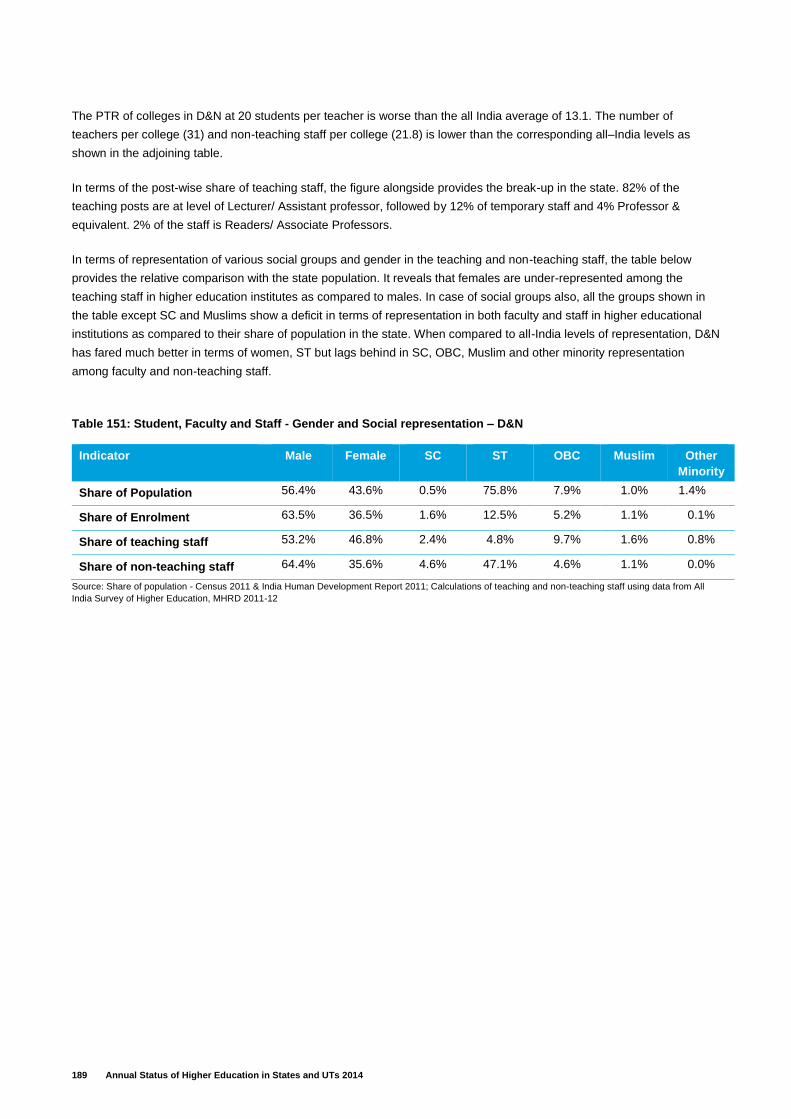
189 Annual Status of Higher Education in States and UTs 2014
The PTR of colleges in D&N at 20 students per teacher is worse than the all India average of 13.1. The number of
teachers per college (31) and non-teaching staff per college (21.8) is lower than the corresponding all–India levels as
shown in the adjoining table.
In terms of the post-wise share of teaching staff, the figure alongside provides the break-up in the state. 82% of the
teaching posts are at level of Lecturer/ Assistant professor, followed by 12% of temporary staff and 4% Professor &
equivalent. 2% of the staff is Readers/ Associate Professors.
In terms of representation of various social groups and gender in the teaching and non-teaching staff, the table below
provides the relative comparison with the state population. It reveals that females are under-represented among the
teaching staff in higher education institutes as compared to males. In case of social groups also, all the groups shown in
the table except SC and Muslims show a deficit in terms of representation in both faculty and staff in higher educational
institutions as compared to their share of population in the state. When compared to all-India levels of representation, D&N
has fared much better in terms of women, ST but lags behind in SC, OBC, Muslim and other minority representation
among faculty and non-teaching staff.
Table 151: Student, Faculty and Staff - Gender and Social representation – D&N
Indicator Male Female SC ST OBC Muslim Other
Minority
Share of Population 56.4% 43.6% 0.5% 75.8% 7.9% 1.0% 1.4%
Share of Enrolment 63.5% 36.5% 1.6% 12.5% 5.2% 1.1% 0.1%
Share of teaching staff 53.2% 46.8% 2.4% 4.8% 9.7% 1.6% 0.8%
Share of non-teaching staff 64.4% 35.6% 4.6% 47.1% 4.6% 1.1% 0.0%
Source: Share of population - Census 2011 & India Human Development Report 2011; Calculations of teaching and non-teaching staff using data from All
India Survey of Higher Education, MHRD 2011-12
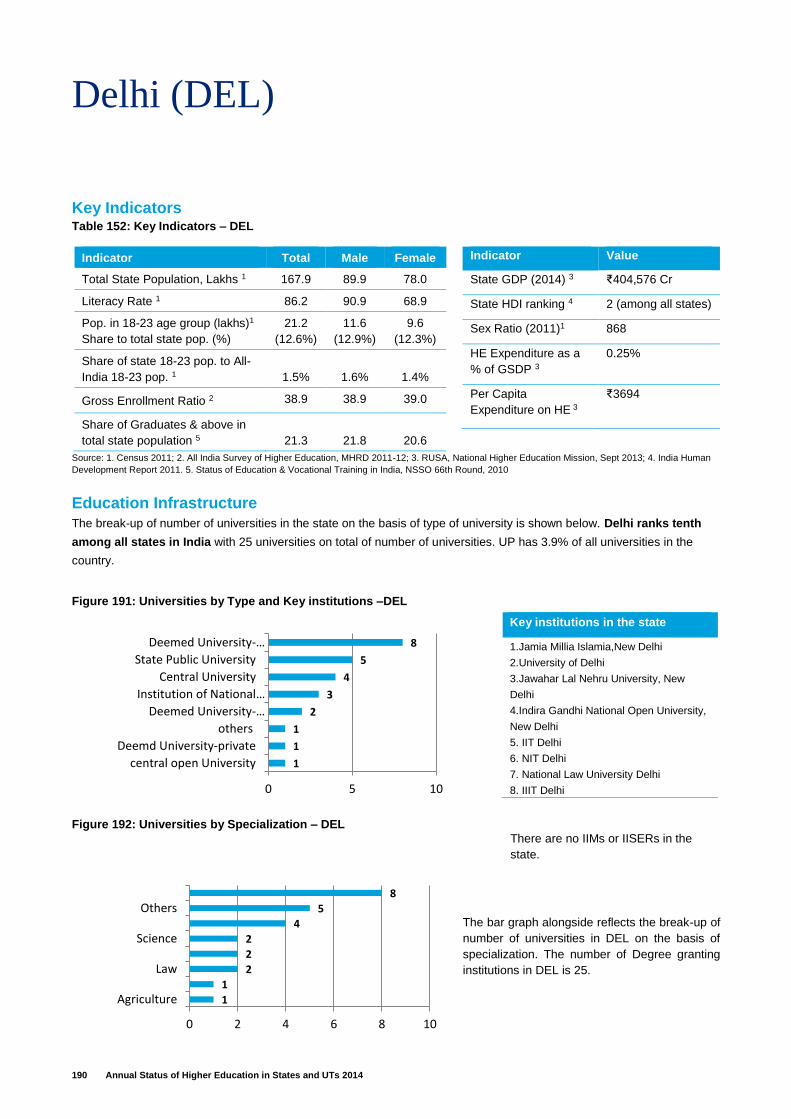
190 Annual Status of Higher Education in States and UTs 2014
Delhi (DEL)
Key Indicators Table 152: Key Indicators – DEL
Indicator Total Male Female
Total State Population, Lakhs 1 167.9 89.9 78.0
Literacy Rate 1 86.2 90.9 68.9
Pop. in 18-23 age group (lakhs)1
Share to total state pop. (%)
21.2
(12.6%)
11.6
(12.9%)
9.6
(12.3%)
Share of state 18-23 pop. to All-
India 18-23 pop. 1 1.5% 1.6% 1.4%
Gross Enrollment Ratio 2 38.9 38.9 39.0
Share of Graduates & above in
total state population 5 21.3 21.8 20.6
Indicator Value
State GDP (2014) 3 ₹404,576 Cr
State HDI ranking 4 2 (among all states)
Sex Ratio (2011)1 868
HE Expenditure as a
% of GSDP 3
0.25%
Per Capita
Expenditure on HE 3
₹3694
Source: 1. Census 2011; 2. All India Survey of Higher Education, MHRD 2011-12; 3. RUSA, National Higher Education Mission, Sept 2013; 4. India Human
Development Report 2011. 5. Status of Education & Vocational Training in India, NSSO 66th Round, 2010
Education Infrastructure
The break-up of number of universities in the state on the basis of type of university is shown below. Delhi ranks tenth
among all states in India with 25 universities on total of number of universities. UP has 3.9% of all universities in the
country.
There are no IIMs or IISERs in the
state.
Key institutions in the state
1.Jamia Millia Islamia,New Delhi
2.University of Delhi
3.Jawahar Lal Nehru University, New
Delhi
4.Indira Gandhi National Open University,
New Delhi
5. IIT Delhi
6. NIT Delhi
7. National Law University Delhi
8. IIIT Delhi
The bar graph alongside reflects the break-up of
number of universities in DEL on the basis of
specialization. The number of Degree granting
institutions in DEL is 25.
Figure 191: Universities by Type and Key institutions –DEL
Figure 192: Universities by Specialization – DEL
1
1
1
2
3
4
5
8
0 5 10
central open University
Deemd University-private
others
Deemed University-…
Institution of National…
Central University
State Public University
Deemed University-…
1
1
2
2
2
4
5
8
0 2 4 6 8 10
Agriculture
Law
Science
Others
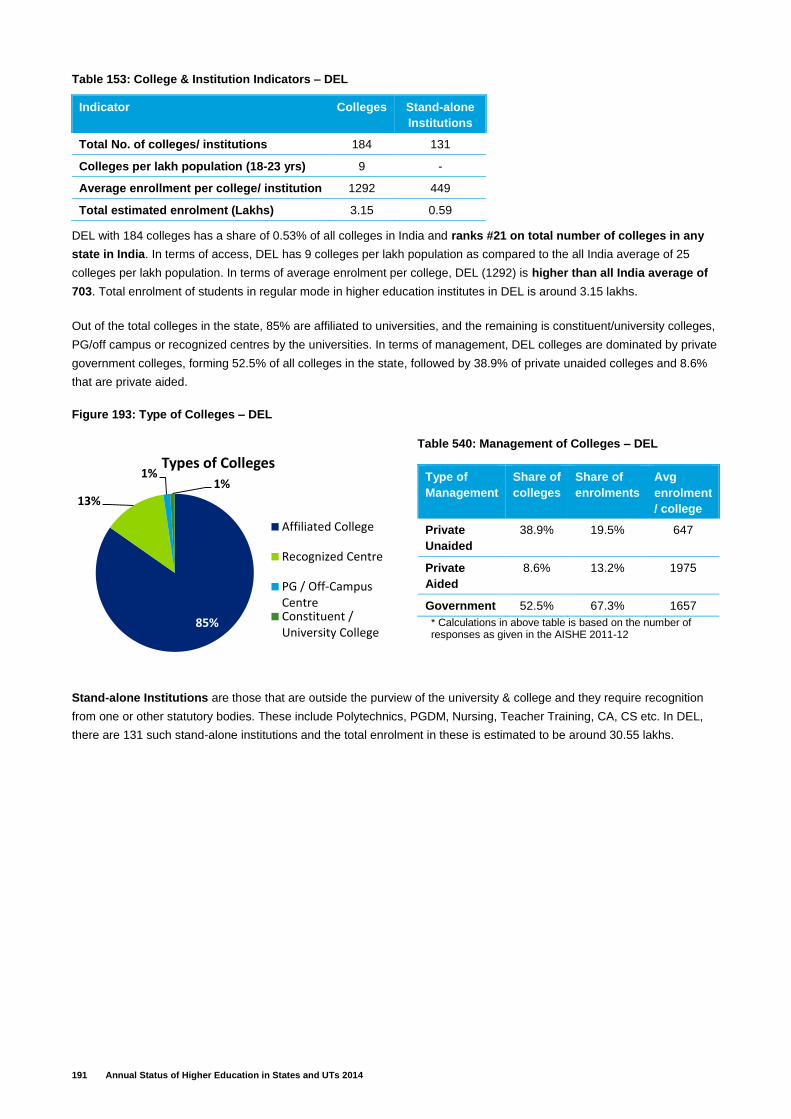
191 Annual Status of Higher Education in States and UTs 2014
Table 153: College & Institution Indicators – DEL
DEL with 184 colleges has a share of 0.53% of all colleges in India and ranks #21 on total number of colleges in any
state in India. In terms of access, DEL has 9 colleges per lakh population as compared to the all India average of 25
colleges per lakh population. In terms of average enrolment per college, DEL (1292) is higher than all India average of
703. Total enrolment of students in regular mode in higher education institutes in DEL is around 3.15 lakhs.
Out of the total colleges in the state, 85% are affiliated to universities, and the remaining is constituent/university colleges,
PG/off campus or recognized centres by the universities. In terms of management, DEL colleges are dominated by private
government colleges, forming 52.5% of all colleges in the state, followed by 38.9% of private unaided colleges and 8.6%
that are private aided.
Figure 193: Type of Colleges – DEL
Table 540: Management of Colleges – DEL
Type of
Management
Share of
colleges
Share of
enrolments
Avg
enrolment
/ college
Private
Unaided
38.9% 19.5% 647
Private
Aided
8.6% 13.2% 1975
Government 52.5% 67.3% 1657
* Calculations in above table is based on the number of responses as given in the AISHE 2011-12
Stand-alone Institutions are those that are outside the purview of the university & college and they require recognition
from one or other statutory bodies. These include Polytechnics, PGDM, Nursing, Teacher Training, CA, CS etc. In DEL,
there are 131 such stand-alone institutions and the total enrolment in these is estimated to be around 30.55 lakhs.
Indicator Colleges Stand-alone
Institutions
Total No. of colleges/ institutions 184 131
Colleges per lakh population (18-23 yrs) 9 -
Average enrollment per college/ institution 1292 449
Total estimated enrolment (Lakhs) 3.15 0.59
85%
13%
1%1%
Types of Colleges
Affiliated College
Recognized Centre
PG / Off-CampusCentreConstituent /University College
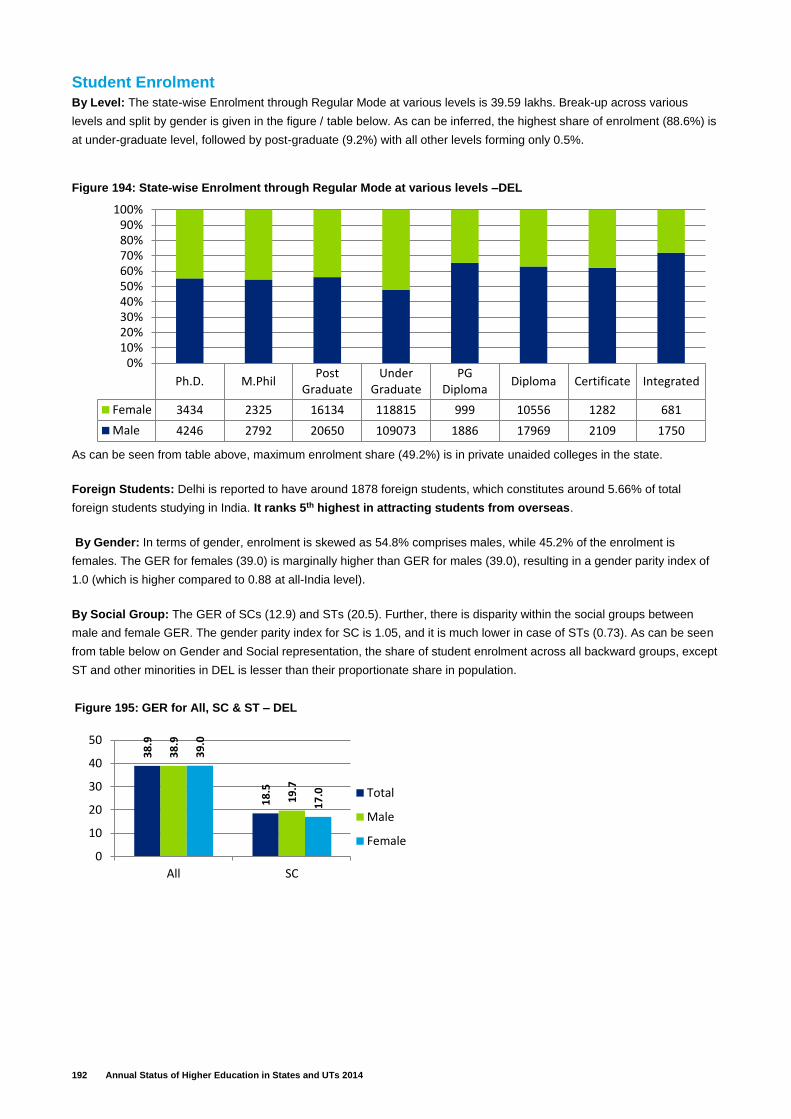
192 Annual Status of Higher Education in States and UTs 2014
Student Enrolment
By Level: The state-wise Enrolment through Regular Mode at various levels is 39.59 lakhs. Break-up across various
levels and split by gender is given in the figure / table below. As can be inferred, the highest share of enrolment (88.6%) is
at under-graduate level, followed by post-graduate (9.2%) with all other levels forming only 0.5%.
As can be seen from table above, maximum enrolment share (49.2%) is in private unaided colleges in the state.
Foreign Students: Delhi is reported to have around 1878 foreign students, which constitutes around 5.66% of total
foreign students studying in India. It ranks 5th highest in attracting students from overseas.
By Gender: In terms of gender, enrolment is skewed as 54.8% comprises males, while 45.2% of the enrolment is
females. The GER for females (39.0) is marginally higher than GER for males (39.0), resulting in a gender parity index of
1.0 (which is higher compared to 0.88 at all-India level).
By Social Group: The GER of SCs (12.9) and STs (20.5). Further, there is disparity within the social groups between
male and female GER. The gender parity index for SC is 1.05, and it is much lower in case of STs (0.73). As can be seen
from table below on Gender and Social representation, the share of student enrolment across all backward groups, except
ST and other minorities in DEL is lesser than their proportionate share in population.
Figure 194: State‐wise Enrolment through Regular Mode at various levels –DEL
Ph.D. M.PhilPost
GraduateUnder
GraduatePG
DiplomaDiploma Certificate Integrated
Female 3434 2325 16134 118815 999 10556 1282 681
Male 4246 2792 20650 109073 1886 17969 2109 1750
0%10%20%30%40%50%60%70%80%90%
100%
Figure 195: GER for All, SC & ST – DEL
38
.9
18
.5
38
.9
19
.7
39
.0
17
.0
0
10
20
30
40
50
All SC
Total
Male
Female
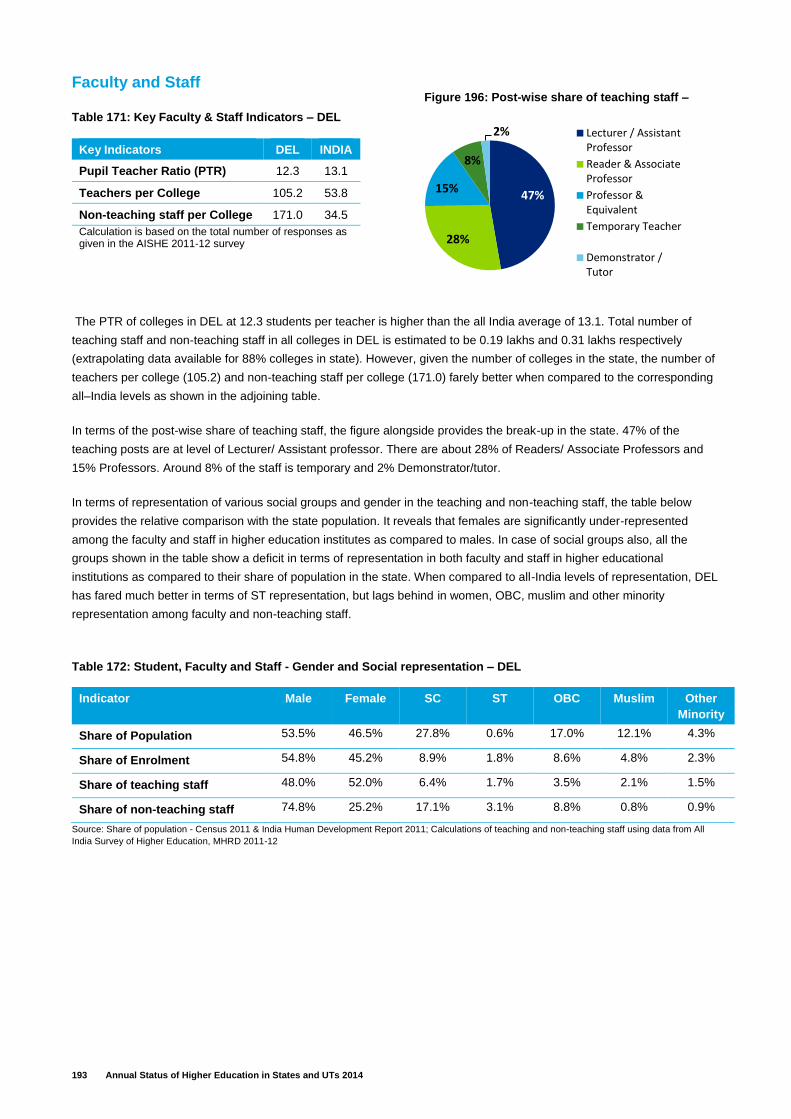
193 Annual Status of Higher Education in States and UTs 2014
Faculty and Staff
Table 171: Key Faculty & Staff Indicators – DEL
The PTR of colleges in DEL at 12.3 students per teacher is higher than the all India average of 13.1. Total number of
teaching staff and non-teaching staff in all colleges in DEL is estimated to be 0.19 lakhs and 0.31 lakhs respectively
(extrapolating data available for 88% colleges in state). However, given the number of colleges in the state, the number of
teachers per college (105.2) and non-teaching staff per college (171.0) farely better when compared to the corresponding
all–India levels as shown in the adjoining table.
In terms of the post-wise share of teaching staff, the figure alongside provides the break-up in the state. 47% of the
teaching posts are at level of Lecturer/ Assistant professor. There are about 28% of Readers/ Associate Professors and
15% Professors. Around 8% of the staff is temporary and 2% Demonstrator/tutor.
In terms of representation of various social groups and gender in the teaching and non-teaching staff, the table below
provides the relative comparison with the state population. It reveals that females are significantly under-represented
among the faculty and staff in higher education institutes as compared to males. In case of social groups also, all the
groups shown in the table show a deficit in terms of representation in both faculty and staff in higher educational
institutions as compared to their share of population in the state. When compared to all-India levels of representation, DEL
has fared much better in terms of ST representation, but lags behind in women, OBC, muslim and other minority
representation among faculty and non-teaching staff.
Table 172: Student, Faculty and Staff - Gender and Social representation – DEL
Indicator Male Female SC ST OBC Muslim Other
Minority
Share of Population 53.5% 46.5% 27.8% 0.6% 17.0% 12.1% 4.3%
Share of Enrolment 54.8% 45.2% 8.9% 1.8% 8.6% 4.8% 2.3%
Share of teaching staff 48.0% 52.0% 6.4% 1.7% 3.5% 2.1% 1.5%
Share of non-teaching staff 74.8% 25.2% 17.1% 3.1% 8.8% 0.8% 0.9%
Source: Share of population - Census 2011 & India Human Development Report 2011; Calculations of teaching and non-teaching staff using data from All
India Survey of Higher Education, MHRD 2011-12
Key Indicators DEL INDIA
Pupil Teacher Ratio (PTR) 12.3 13.1
Teachers per College 105.2 53.8
Non-teaching staff per College 171.0 34.5
Calculation is based on the total number of responses as given in the AISHE 2011-12 survey
Figure 196: Post-wise share of teaching staff –
DEL
47%
28%
15%
8%
2% Lecturer / AssistantProfessor
Reader & AssociateProfessor
Professor &Equivalent
Temporary Teacher
Demonstrator /Tutor
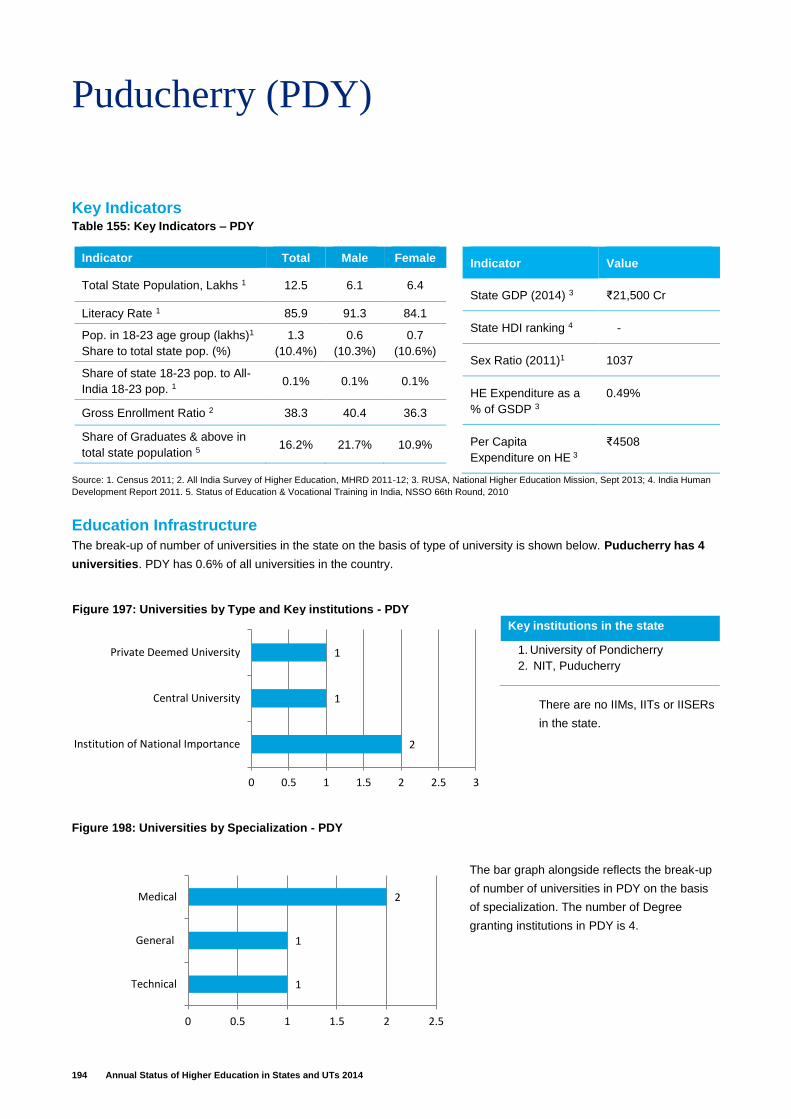
194 Annual Status of Higher Education in States and UTs 2014
Puducherry (PDY)
Key Indicators Table 155: Key Indicators – PDY
Indicator Total Male Female
Total State Population, Lakhs 1 12.5 6.1 6.4
Literacy Rate 1 85.9 91.3 84.1
Pop. in 18-23 age group (lakhs)1
Share to total state pop. (%)
1.3
(10.4%)
0.6
(10.3%)
0.7
(10.6%)
Share of state 18-23 pop. to All-
India 18-23 pop. 1 0.1% 0.1% 0.1%
Gross Enrollment Ratio 2 38.3 40.4 36.3
Share of Graduates & above in
total state population 5 16.2% 21.7% 10.9%
Indicator Value
State GDP (2014) 3 ₹21,500 Cr
State HDI ranking 4 -
Sex Ratio (2011)1 1037
HE Expenditure as a
% of GSDP 3
0.49%
Per Capita
Expenditure on HE 3
₹4508
Source: 1. Census 2011; 2. All India Survey of Higher Education, MHRD 2011-12; 3. RUSA, National Higher Education Mission, Sept 2013; 4. India Human
Development Report 2011. 5. Status of Education & Vocational Training in India, NSSO 66th Round, 2010
Education Infrastructure
The break-up of number of universities in the state on the basis of type of university is shown below. Puducherry has 4
universities. PDY has 0.6% of all universities in the country.
There are no IIMs, IITs or IISERs
in the state.
Key institutions in the state
1. University of Pondicherry
2. NIT, Puducherry
The bar graph alongside reflects the break-up
of number of universities in PDY on the basis
of specialization. The number of Degree
granting institutions in PDY is 4.
Figure 197: Universities by Type and Key institutions - PDY
1
1
2
0 0.5 1 1.5 2 2.5
Technical
General
Medical
Figure 198: Universities by Specialization - PDY
2
1
1
0 0.5 1 1.5 2 2.5 3
Institution of National Importance
Central University
Private Deemed University

195 Annual Status of Higher Education in States and UTs 2014
Table 156: College & Institution Indicators - PDY
PDY with 4,814 colleges has a share of 0.24% of all colleges in India. In terms of access, PDY has 64 colleges per lakh
population as compared to the all India average of 25 colleges per lakh population. In terms of average enrolment per
college, PDY (459) is significantly lesser than all India average of 703. Total enrolment of students in regular mode in
higher education institutes in PDY is around 0.49 lakhs.
Out of the total colleges in the state, 88% are affiliated to universities, and the remaining is constituent/university colleges
or PG/off campus. In terms of management, PDY colleges are dominated by the Private Unaided colleges, forming 64.9%
of all colleges in the state, followed by 32.4% owned by Government and 2.7% that are private aided.
Figure 199: Type of Colleges - PDY
Table 157: Management of Colleges - PDY
Type of
Management
Share of
colleges
Share of
enrolments
Avg
enrolment
/ college
Private
Unaided
64.9% 58.0% 410
Private
Aided
2.7% 4.9% 840
Government 32.4% 37.1% 525
* Calculations in above table is based on the number of responses as given in the AISHE 2011-12
Stand-alone Institutions are those that are outside the purview of the university & college and they require recognition
from one or other statutory bodies. These include Polytechnics, PGDM, Nursing, Teacher Training, CA, CS etc. In PDY,
there are 56 such stand-alone institutions and the total enrolment in these is estimated to be around 0.26 lakhs.
Indicator Colleges Stand-alone
Institutions
Total No. of colleges/ institutions 83 56
Colleges per lakh population (18-23 yrs) 64 -
Average enrollment per college/ institution 459 459
Total estimated enrolment (Lakhs) 0.49 0.26
88%
9%
3%Types of Colleges
Affiliated College
Constituent /University College
PG / Off-CampusCentre
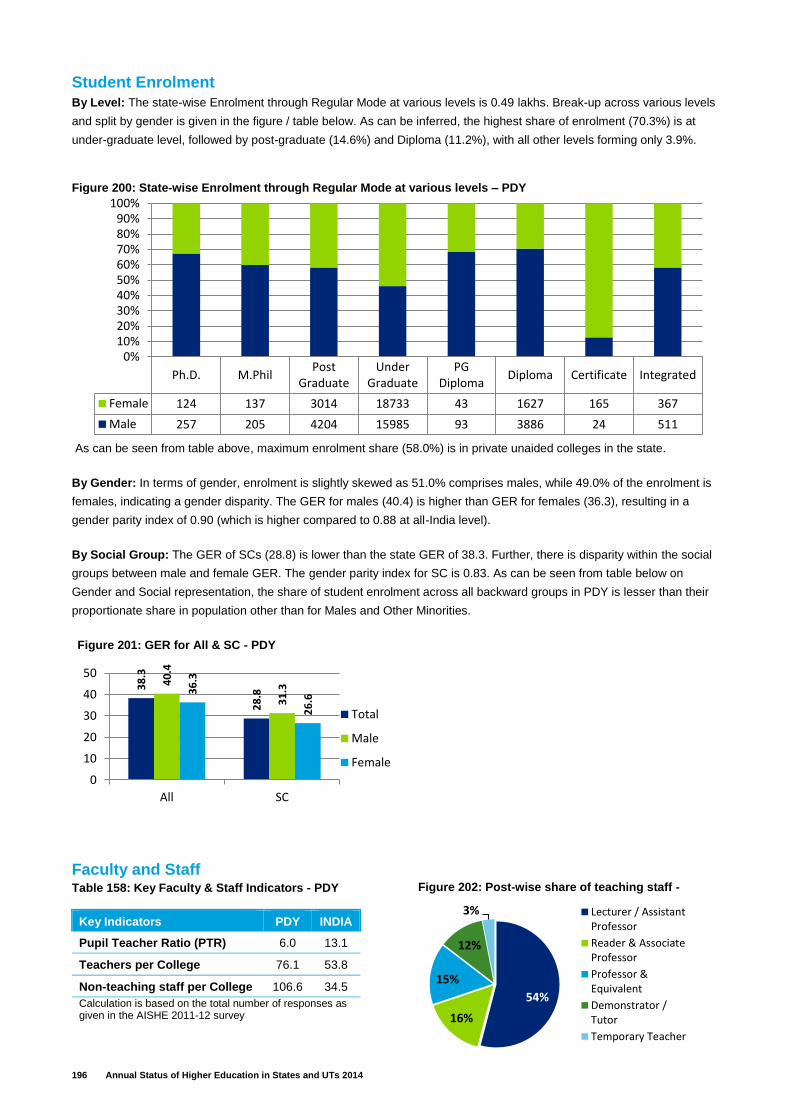
196 Annual Status of Higher Education in States and UTs 2014
Student Enrolment
By Level: The state-wise Enrolment through Regular Mode at various levels is 0.49 lakhs. Break-up across various levels
and split by gender is given in the figure / table below. As can be inferred, the highest share of enrolment (70.3%) is at
under-graduate level, followed by post-graduate (14.6%) and Diploma (11.2%), with all other levels forming only 3.9%.
As can be seen from table above, maximum enrolment share (58.0%) is in private unaided colleges in the state.
By Gender: In terms of gender, enrolment is slightly skewed as 51.0% comprises males, while 49.0% of the enrolment is
females, indicating a gender disparity. The GER for males (40.4) is higher than GER for females (36.3), resulting in a
gender parity index of 0.90 (which is higher compared to 0.88 at all-India level).
By Social Group: The GER of SCs (28.8) is lower than the state GER of 38.3. Further, there is disparity within the social
groups between male and female GER. The gender parity index for SC is 0.83. As can be seen from table below on
Gender and Social representation, the share of student enrolment across all backward groups in PDY is lesser than their
proportionate share in population other than for Males and Other Minorities.
Faculty and Staff Table 158: Key Faculty & Staff Indicators - PDY
Key Indicators PDY INDIA
Pupil Teacher Ratio (PTR) 6.0 13.1
Teachers per College 76.1 53.8
Non-teaching staff per College 106.6 34.5
Calculation is based on the total number of responses as given in the AISHE 2011-12 survey
Ph.D. M.PhilPost
GraduateUnder
GraduatePG
DiplomaDiploma Certificate Integrated
Female 124 137 3014 18733 43 1627 165 367
Male 257 205 4204 15985 93 3886 24 511
0%10%20%30%40%50%60%70%80%90%
100%Figure 200: State‐wise Enrolment through Regular Mode at various levels – PDY
38
.3
28
.8
40
.4
31
.336
.3
26
.6
0
10
20
30
40
50
All SC
Total
Male
Female
Figure 201: GER for All & SC - PDY
54%
16%
15%
12%
3% Lecturer / AssistantProfessor
Reader & AssociateProfessor
Professor &Equivalent
Demonstrator /Tutor
Temporary Teacher
Figure 202: Post-wise share of teaching staff -
PDY
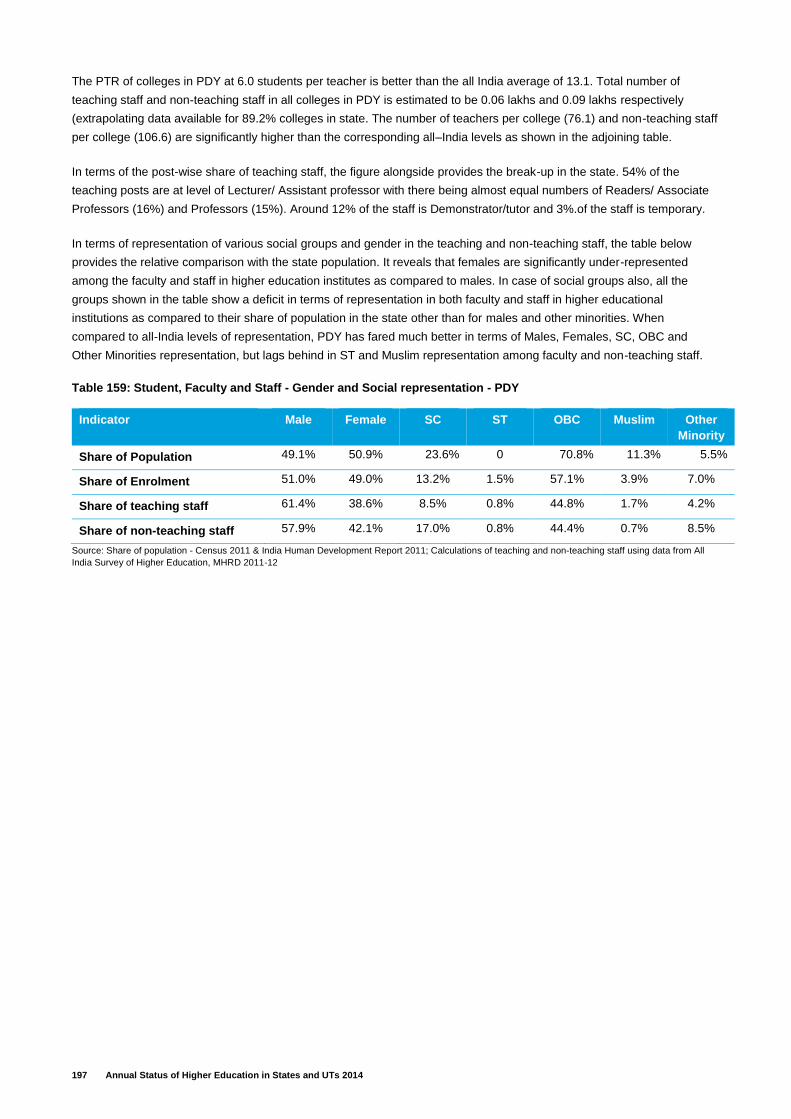
197 Annual Status of Higher Education in States and UTs 2014
The PTR of colleges in PDY at 6.0 students per teacher is better than the all India average of 13.1. Total number of
teaching staff and non-teaching staff in all colleges in PDY is estimated to be 0.06 lakhs and 0.09 lakhs respectively
(extrapolating data available for 89.2% colleges in state. The number of teachers per college (76.1) and non-teaching staff
per college (106.6) are significantly higher than the corresponding all–India levels as shown in the adjoining table.
In terms of the post-wise share of teaching staff, the figure alongside provides the break-up in the state. 54% of the
teaching posts are at level of Lecturer/ Assistant professor with there being almost equal numbers of Readers/ Associate
Professors (16%) and Professors (15%). Around 12% of the staff is Demonstrator/tutor and 3%.of the staff is temporary.
In terms of representation of various social groups and gender in the teaching and non-teaching staff, the table below
provides the relative comparison with the state population. It reveals that females are significantly under-represented
among the faculty and staff in higher education institutes as compared to males. In case of social groups also, all the
groups shown in the table show a deficit in terms of representation in both faculty and staff in higher educational
institutions as compared to their share of population in the state other than for males and other minorities. When
compared to all-India levels of representation, PDY has fared much better in terms of Males, Females, SC, OBC and
Other Minorities representation, but lags behind in ST and Muslim representation among faculty and non-teaching staff.
Table 159: Student, Faculty and Staff - Gender and Social representation - PDY
Indicator Male Female SC ST OBC Muslim Other
Minority
Share of Population 49.1% 50.9% 23.6% 0 70.8% 11.3% 5.5%
Share of Enrolment 51.0% 49.0% 13.2% 1.5% 57.1% 3.9% 7.0%
Share of teaching staff 61.4% 38.6% 8.5% 0.8% 44.8% 1.7% 4.2%
Share of non-teaching staff 57.9% 42.1% 17.0% 0.8% 44.4% 0.7% 8.5%
Source: Share of population - Census 2011 & India Human Development Report 2011; Calculations of teaching and non-teaching staff using data from All
India Survey of Higher Education, MHRD 2011-12
198 Annual Status of Higher Education in States and UTs 2014
About CII
The Confederation of Indian Industry (CII) works to create and sustain an environment conducive to the development of
India, partnering industry, Government, and civil society, through advisory and consultative processes.
CII is a non-government, not-for-profit, industry-led and industry-managed organization, playing a proactive role in India's
development process. Founded in 1895, India's premier business association has over 7200 members, from the private as
well as public sectors, including SMEs and MNCs, and an indirect membership of over 100,000 enterprises from around
242 national and regional sectoral industry bodies.
CII charts change by working closely with Government on policy issues, interfacing with thought leaders, and enhancing
efficiency, competitiveness and business opportunities for industry through a range of specialized services and strategic
global linkages. It also provides a platform for consensus-building and networking on key issues.
Extending its agenda beyond business, CII assists industry to identify and execute corporate citizenship programmes.
Partnerships with civil society organizations carry forward corporate initiatives for integrated and inclusive development
across diverse domains including affirmative action, healthcare, education, livelihood, diversity management, skill
development, empowerment of women, and water, to name a few.
The CII theme of ‘Accelerating Growth, Creating Employment’ for 2014-15 aims to strengthen a growth process that meets
the aspirations of today’s India. During the year, CII will specially focus on economic growth, education, skill development,
manufacturing, investments, ease of doing business, export competitiveness, legal and regulatory architecture, labour law
reforms and entrepreneurship as growth enablers.
With 64 offices, including 9 Centres of Excellence, in India, and 7 overseas offices in Australia, China, Egypt, France,
Singapore, UK, and USA, as well as institutional partnerships with 312 counterpart organizations in 106 countries, CII
serves as a reference point for Indian industry and the international business community.
Confederation of Indian Industry
The Mantosh Sondhi Centre
23, Institutional Area, Lodi Road, New Delhi – 110 003 (India)
T: 91 11 45771000 / 24629994-7 * F: 91 11 24626149
E: [email protected] W: www.cii.in
199 Annual Status of Higher Education in States and UTs 2014
About Deloitte
Deloitte provides assurance, tax, consulting, and financial advisory services to public and private clients spanning multiple
industries. With a globally connected network of member firms in more than 150 countries, Deloitte brings world-class
capabilities and high-quality service to clients, delivering the insights they need to address their most complex business
challenges. Deloitte has in the region around 210000 professionals, all committed to becoming the standard of excellence.
Deloitte in India
In India, Deloitte is spread across 13 locations and over 25500 professionals take pride in their ability to deliver to clients
the right combination of local insight and international expertise.
Mumbai
Indiabulls Finance Centre
Tower 3, 27th-32nd Floor,
Senapati Bapat Marg,
Elphinstone Road (W),
Mumbai – 400013
Tel: + 91 (022) 6185 4100
Fax: + 91 (022) 6185 4101
Bangalore
Deloitte Centre,
Anchorage II,100/2,
Richmond Road,
Bangalore 560 025.
Tel: +91 (080) 6627 6000
Fax: +91 (080) 6627 6409
Delhi/Gurgaon
Building 10,
Tower B, 7th Floor,
DLF Cyber City,
Gurgaon 122 002
Tel : +91 (0124) 679
2000
Fax : + 91 (0124) 679
2012
Chennai
No.52, Venkatanarayana
Road, 7th Floor, ASV N
Ramana Tower,
T-Nagar, Chennai 600 017.
Tel: +91 (044) 6688 5000
Fax: +91 (044) 6688 5019
Kolkata
Bengal Intelligent Park
Building, Alpha, 1st floor,
Plot No –A2, M2 & N2,
Block – EP & GP Sector –
V, Salt Lake Electronics
Complex,
Kolkata - 700 091.
Tel : + 91 (033) 6612 1000
Fax : + 91 (033) 6612 1001
Ahmedabad
“Heritage” 3rd Floor,
Near Gujarat Vidyapith,
Off Ashram Road,
Ahmedabad – 380 014.
Tel: + 91 (079) 2758 2542
Fax: + 91 (079) 2758 2551
Hyderabad
1-8-384 & 385, 3rd Floor,
Gowra Grand S.P.Road,
Begumpet,
Secunderabad – 500 003.
Tel: +91 (040) 4031 2600
Fax:+91 (040) 4031 2714
Vadodara
Chandralok,
31, Nutan Bharat Society,
Alkapuri,
Vadodara – 390 007
Tel: + 91 (0265) 233 3776
Fax: +91 (0265) 233 9729
200 Annual Status of Higher Education in States and UTs 2014
Glossary
AICTE All India Council of Technical Education
AIU Association of Indian Universities
BCI Bar Council of India
CA Chartered Accountancy
CABE Central Advisory Board of Education
CCS Centrally Sponsored Scheme
CII Confederation of Indian Industry
COA Council of Architecture
CPSE Central Public Sector Enterprises
CS Company Secretary
CSR Corporate Social Responsibility
DCI Dental Council of India
DEC Distance Education Council
DIPP Department of Industrial Policy and Promotion
DSIR Department of Scientific and Industrial Research
DTTIPL Deloitte Touche Tohmatsu India Private Limited
FCRA Foreign Contribution Regulation Act
FDI Foreign Direct Investment
FEI Foreign Educational Institution
FEP Foreign Education Provider
GDP Gross Domestic Product
GER Gross Enrolment Ratio
GPI Gender Parity Index
GSDP Gross State Domestic Product
HEIs Higher Education Institutes
IGNOU Indira Gandhi National Global University
IISER Indian Institute of Science Education and Research
INC Indian Nursing Council
IUB Inter-University Board
MCI Medical Council of India
MDC Model Degree College
MDP Management Development Program
MHRD Ministry of Human Resource Development
201 Annual Status of Higher Education in States and UTs 2014
MMER Management, Monitoring, Evaluation and Research
NAAC National Assessment and Accreditation Council
NASSCOM National Association of Software and Services Companies
NBA National Board of Accreditation
NER North Eastern States
NSDC National Skills Development Corporation
NQRI National Quality Renaissance Initiative
NRI Non Resident Indians
NSSO National Sample Survey Office
OBCs Other Backward Class
ODL Open and Distance Learning
PAB Project Approval Board
PGDM Post Graduate Diploma in Management
PTR Pupil Teacher Ratio
RMSA Rashtriya Madhyamik Shiksha Abhiyan
RUSA Rashtriya Uchchatar Shiksha Abhiyan
SCs Scheduled Castes
SHEC State Higher Education Council
SHEP State Higher Education Plan
SSA Sarva Shiksha Abhiyan
STs Scheduled Tribes
TISS Tata Institute of Social Sciences
UGC University Grants Commission
US United States of America
UT Union Territory
VCI Veterinary Council of India
202 Annual Status of Higher Education in States and UTs 2014
Bibliography
Websites
Ministry of Human Resource Development website, http://mhrd.gov.in/ as on 10 October 2014 University Grants Commission website, www.ugc.ac.in as on 10 October 2014 All India Council of Technical Education website, www.aicte-india.org as on 10 October 2014 Department of Industrial Policy & Promotion website, Government of India, http://dipp.nic.in/English/default.aspx as on 8 September 2014 IIT Bombay International Relations Office website, http://www.ir.iitb.ac.in as on 26 October 2014 Center for South Asian Studies, University of Michigan website, http://www.ii.umich.edu/csas/educationalresources/umduundergraduateresearchprogram as on 26 October 2014 Azim Premji University website, http://azimpremjiuniversity.edu.in/SitePages/partnerships-collaborations.aspx as on 26 October 2014 Shiv Nadar University website, http://snu.edu.in/admission/partner_programs.aspx as on 26 October 2014 Ashoka University website, http://ashoka.edu.in/About-Us/Collaborations as on 26 October 2014 Amity Business School website, http://www.amity.edu/abs/Collaborations.asp as on 26 October 2014 GD Goenka World Institute website, http://gdgwi.gdgoenka.com/lancaster-university/collaboration-gdgwi as on 26 October 2014
203 Annual Status of Higher Education in States and UTs 2014
Deloitte refers to one or more of Deloitte Touche Tohmatsu Limited, a UK private company limited by guarantee (“DTTL”), its network of
member firms, and their related entities. DTTL and each of its member firms are legally separate and independent entities. DTTL (also
referred to as “Deloitte Global”) does not provide services to clients. Please see www.deloitte.com/about for a more detailed description
of DTTL and its member firms.
Deloitte in India/Deloitte India herein refers to DTTL member firms in India
This material and the information contained herein prepared by Deloitte Touche Tohmatsu India Private Limited (DTTIPL) is intended to
provide general information on a particular subject or subjects and is not an exhaustive treatment of such subject(s). This material
contains information sourced from third party sites (external sites). DTTIPL is not responsible for any loss whatsoever caused due to
reliance placed on information sourced from such external sites. None of DTTIPL, Deloitte Touche Tohmatsu Limited, its member firms,
or their related entities (collectively, the “Deloitte Network”) is, by means of this material, rendering professional advice or services. The
information is not intended to be relied upon as the sole basis for any decision which may affect you or your business. Before making any
decision or taking any action that might affect your personal finances or business, you should consult a qualified professional adviser.
No entity in the Deloitte Network shall be responsible for any loss whatsoever sustained by any person who relies on this material.
©2014 Deloitte Touche Tohmatsu India Private Limited.

204 Annual Status of Higher Education in States and UTs 2014
The copyrights vest jointly with Confederation of Indian Industry & Deloitte Touche Tohmatsu India Private Limited. Published by Confederation of Indian Industry (CII), The Mantosh Sondhi Centre; 23, Institutional Area, Lodi Road, New Delhi-110003 (INDIA), Tel: +91-11-24629994-7, Fax: +91-11-24626149 Email: [email protected]; Web: www.cii.in