Embed Size (px)
Citation preview
Deloitte State of the Consumer TrackerGlobal Highlights October 2021
TopTakeawaysWave: Month
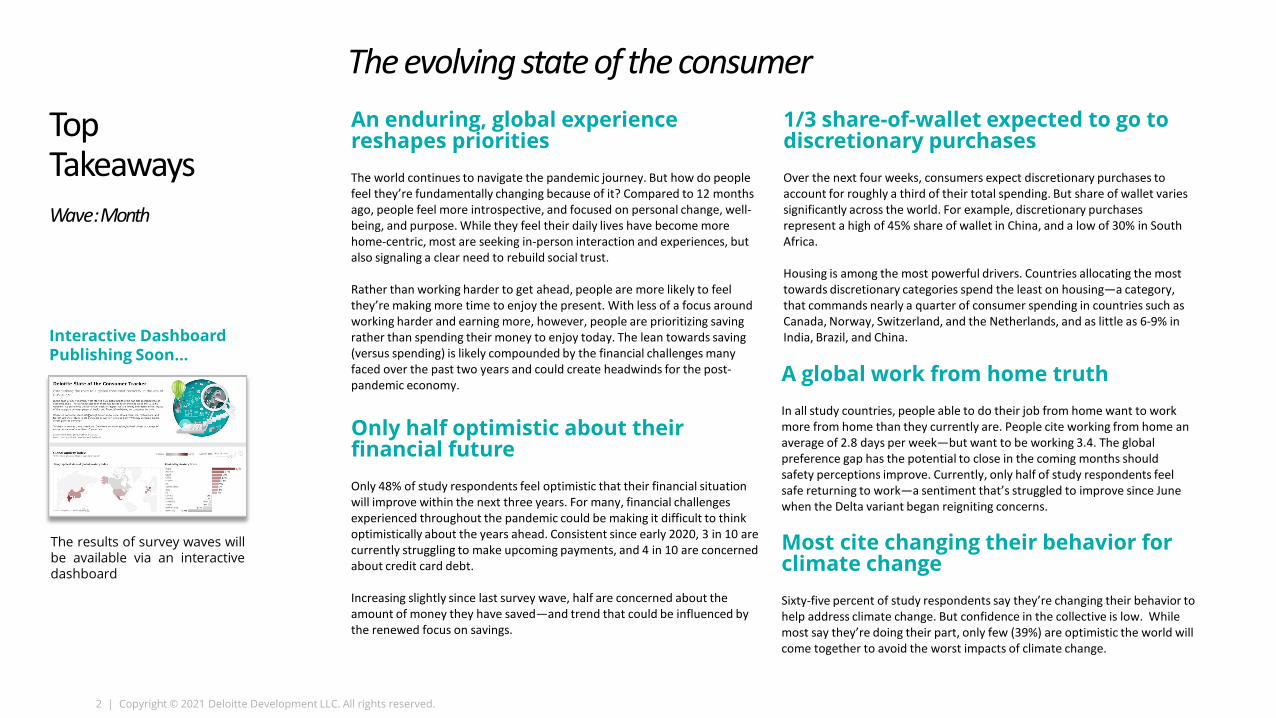
Interactive DashboardPublishing Soon…
An enduring, global experience reshapes prioritiesThe world continues to navigate the pandemic journey. But how do people feel they’re fundamentally changing because of it? Compared to 12 months ago, people feel more introspective, and focused on personal change, well-being, and purpose. While they feel their daily lives have become more home-centric, most are seeking in-person interaction and experiences, but also signaling a clear need to rebuild social trust.
Rather than working harder to get ahead, people are more likely to feel they’re making more time to enjoy the present. With less of a focus around working harder and earning more, however, people are prioritizing saving rather than spending their money to enjoy today. The lean towards saving (versus spending) is likely compounded by the financial challenges many faced over the past two years and could create headwinds for the post-pandemic economy.
The results of survey waves willbe available via an interactivedashboard
2 | Copyright © 2021 Deloitte Development LLC. All rights reserved.
The evolving state of the consumer
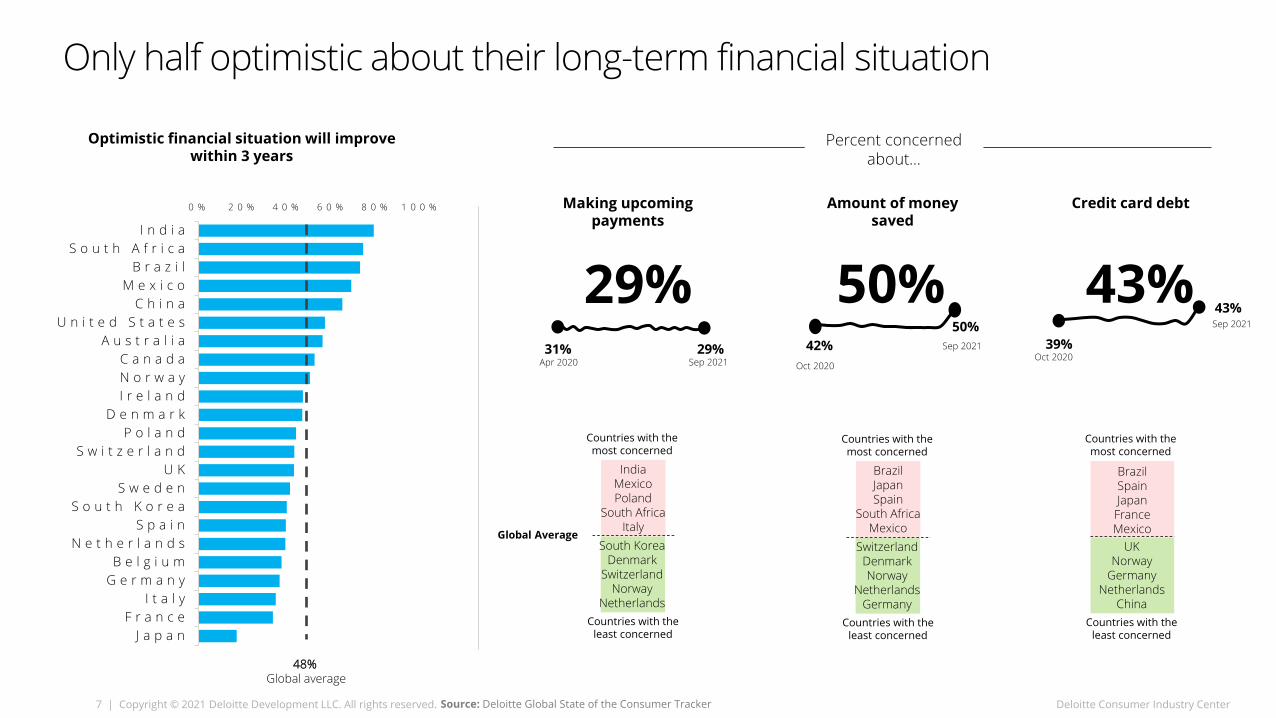
Only half optimistic about their financial futureOnly 48% of study respondents feel optimistic that their financial situation will improve within the next three years. For many, financial challenges experienced throughout the pandemic could be making it difficult to think optimistically about the years ahead. Consistent since early 2020, 3 in 10 are currently struggling to make upcoming payments, and 4 in 10 are concerned about credit card debt.
Increasing slightly since last survey wave, half are concerned about the amount of money they have saved—and trend that could be influenced by the renewed focus on savings.
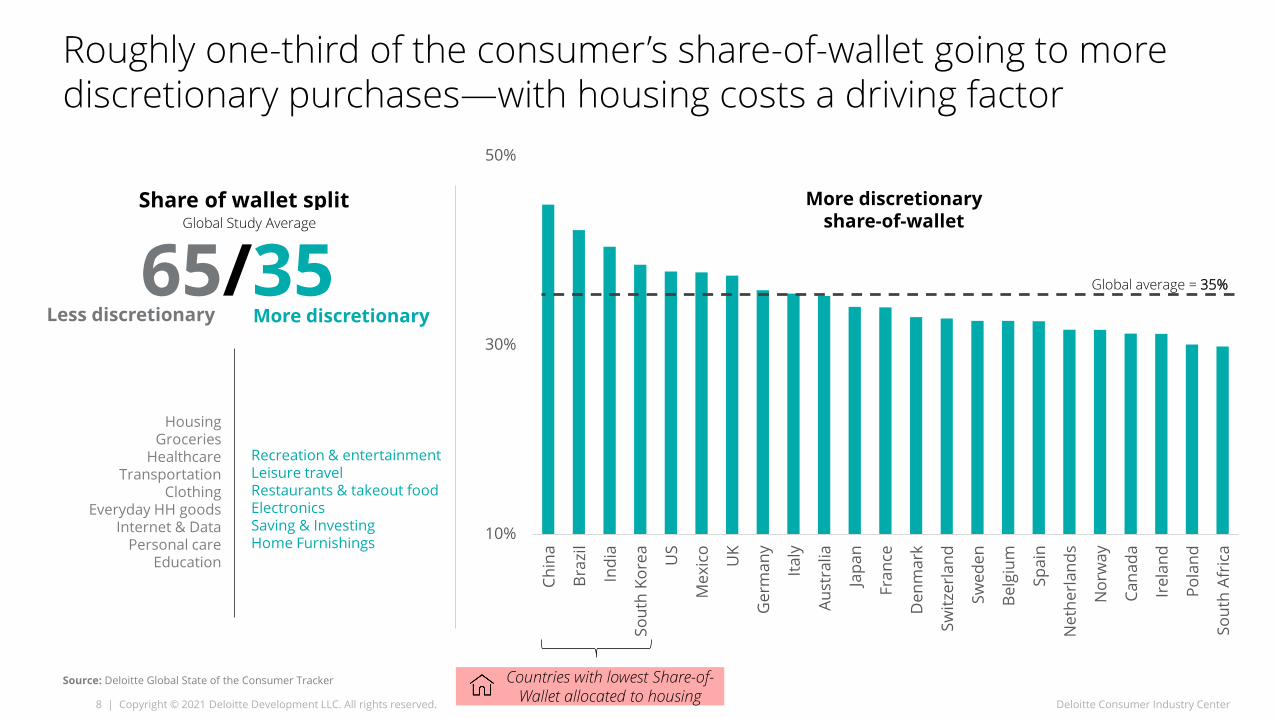
1/3 share-of-wallet expected to go to discretionary purchasesOver the next four weeks, consumers expect discretionary purchases to account for roughly a third of their total spending. But share of wallet varies significantly across the world. For example, discretionary purchases represent a high of 45% share of wallet in China, and a low of 30% in South Africa.
Housing is among the most powerful drivers. Countries allocating the most towards discretionary categories spend the least on housing—a category, that commands nearly a quarter of consumer spending in countries such as Canada, Norway, Switzerland, and the Netherlands, and as little as 6-9% in India, Brazil, and China.
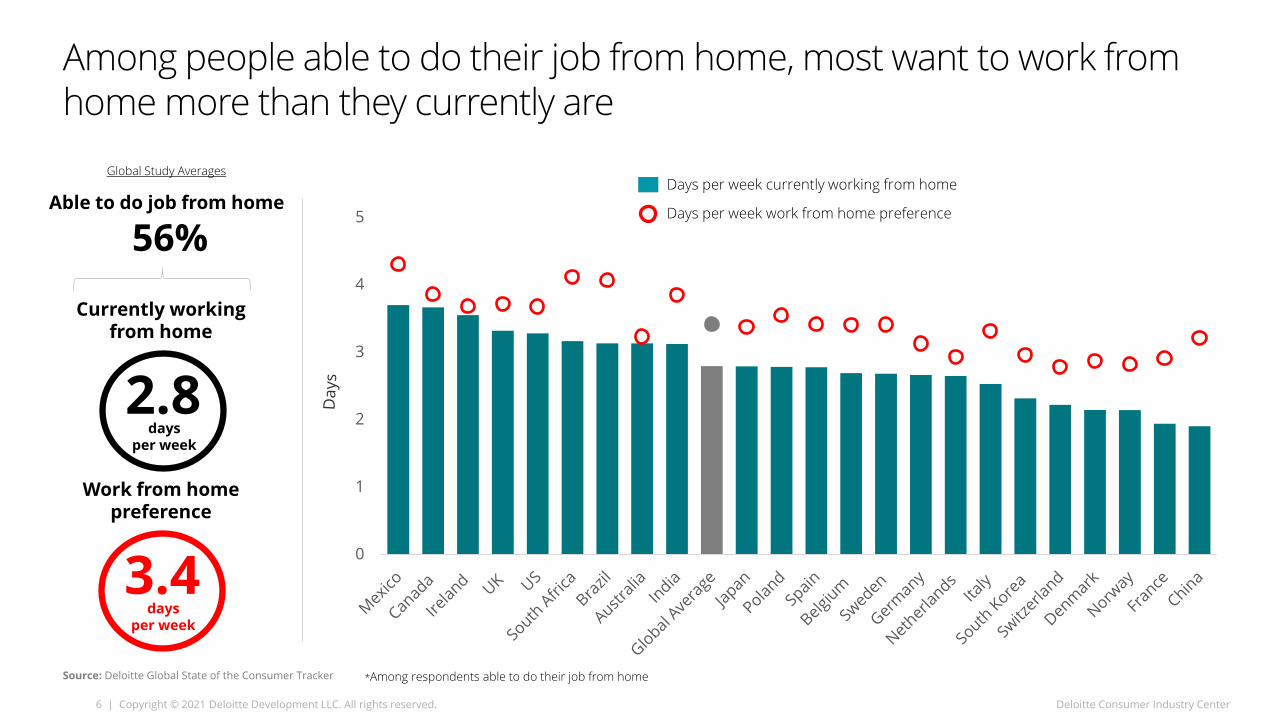
A global work from home truthIn all study countries, people able to do their job from home want to work more from home than they currently are. People cite working from home an average of 2.8 days per week—but want to be working 3.4. The global preference gap has the potential to close in the coming months should safety perceptions improve. Currently, only half of study respondents feel safe returning to work—a sentiment that’s struggled to improve since June when the Delta variant began reigniting concerns.
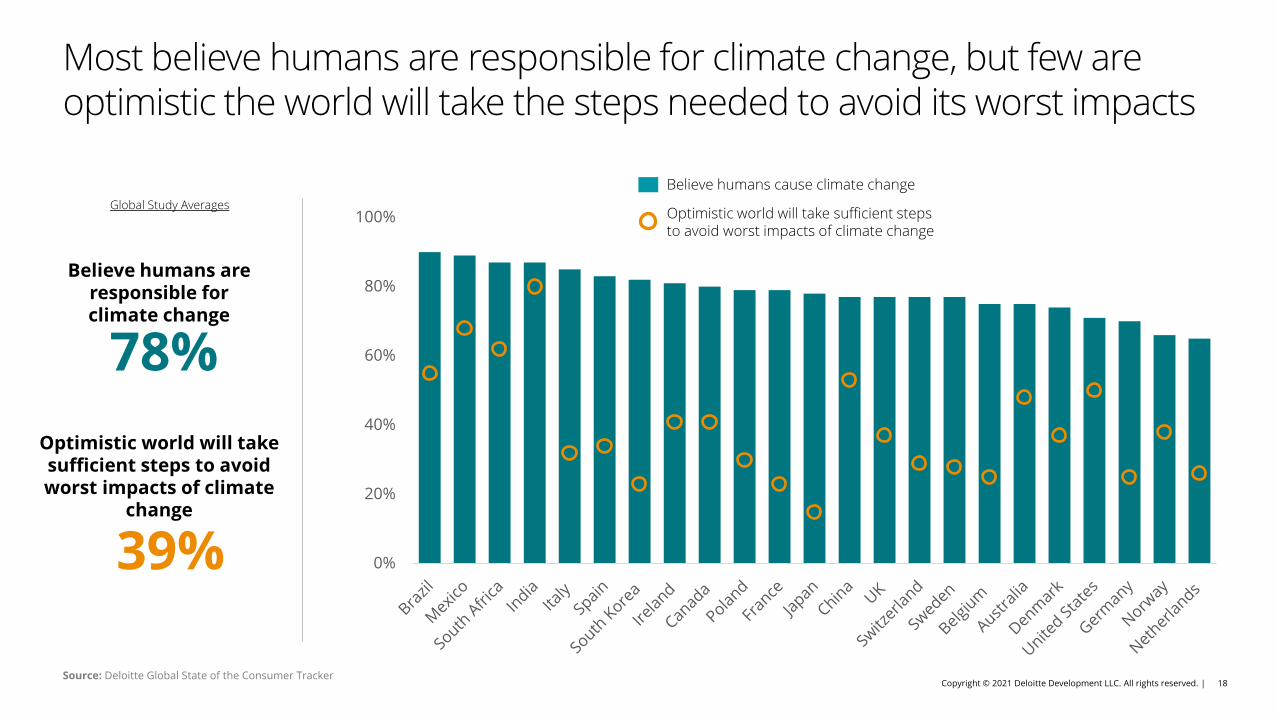
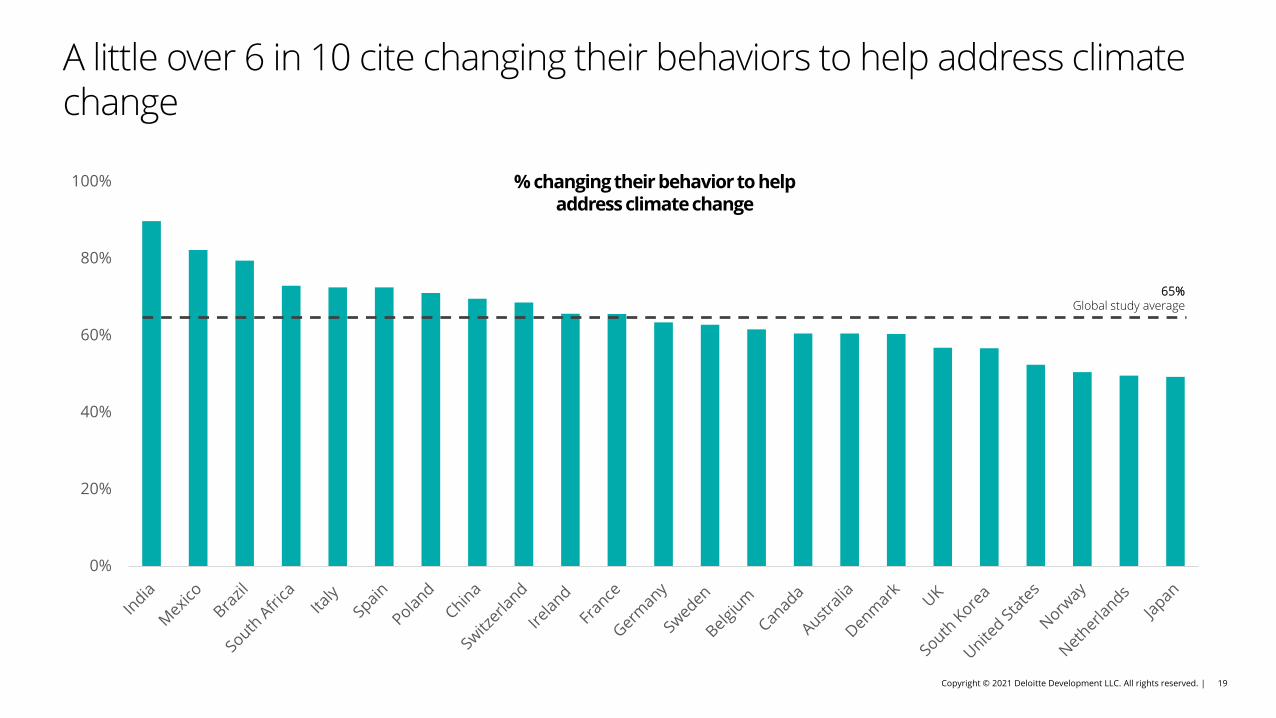
Most cite changing their behavior for climate changeSixty-five percent of study respondents say they’re changing their behavior to help address climate change. But confidence in the collective is low. While most say they’re doing their part, only few (39%) are optimistic the world will come together to avoid the worst impacts of climate change.

3 | Copyright © 2021 Deloitte Development LLC. All rights reserved. Deloitte Consumer Industry Center
Survey Fielding
Methodology:• Online panel, Minimum N=1,000 consumers
per country, age 18+
• Fielded in 22 countries (US Bi-weekly)
• Margin of error ±3%
• Responses are weighted at the country level according to publicly available age and income profiles
Study Overview
Waves 1–22 : April 2020 – Sept 2021
Wave 23 : September 23-27
Countries in Focus• Australia (AU)
• Belgium (BE)
• Brazil (BR)
• Canada (CA)
• China (CN)
• Denmark (DK)
• France (FR)
• Germany (DE)
• India (IN)
• Ireland (IE)
• Italy (IT)
• Japan (JP)
• Mexico (MX)
• Netherlands (NL)
• Norway (NO)
• Poland (PL)
• South Africa (ZA)
• South Korea (KR)
• Spain (ES)
• Sweden (SE)
• Switzerland (CH)
• United Kingdom (UK)
• United States (US)
2 3 C o u n t r i e s
New metrics added
NewNew
New
New
NewNew

4 | Copyright © 2021 Deloitte Development LLC. All rights reserved. Deloitte Consumer Industry Center
Little/Noshift
An enduring, collective global experience reshapes priorities
Source: Deloitte Global State of the Consumer Tracker
Compared to 12 months ago, I feel I’m…
Prioritizing my overall wellbeing
Allowing more things to come before my wellbeing
Pursuing purpose
Wellbeing
Finding more time to enjoy today
Working harder to get ahead
Pursing more purposeful goals
Inward focus
Focused on earning more money
Seeking to drive more change in my community
Seeking to drive more change in myself
Stronger shift
Moderate shift
Little/Noshift
Moderate shift
Strongershift
A greater focus on introspection, wellbeing, and purpose
-80 -60 -40 -20 0 20 40 60 80
Experiences vs Things
Spending exuberanceSaving more money for the future
Spending more on experiences
Spending more on physical possessions I want
Spending more money to enjoy today
Seeking more in-person experiences
In-person interaction
Home-centricityCentering more of my activity from my home
Social (dis)trustMore trusting of
people I don’t know
Replacing more in-person experiences with digital services
Spending more time away from home
More careful around people I don’t know
Work-Life Balance
More home-centric, but seeking in-person interaction with a clear need to rebuild social trust
Valuing today with time, saving money for tomorrow, while balancing experiences and things
5 | Copyright © 2021 Deloitte Development LLC. All rights reserved. Deloitte Consumer Industry Center
Denmark, Norway
10%
20%
30%
40%
50%
60%
70%
Taking a flight
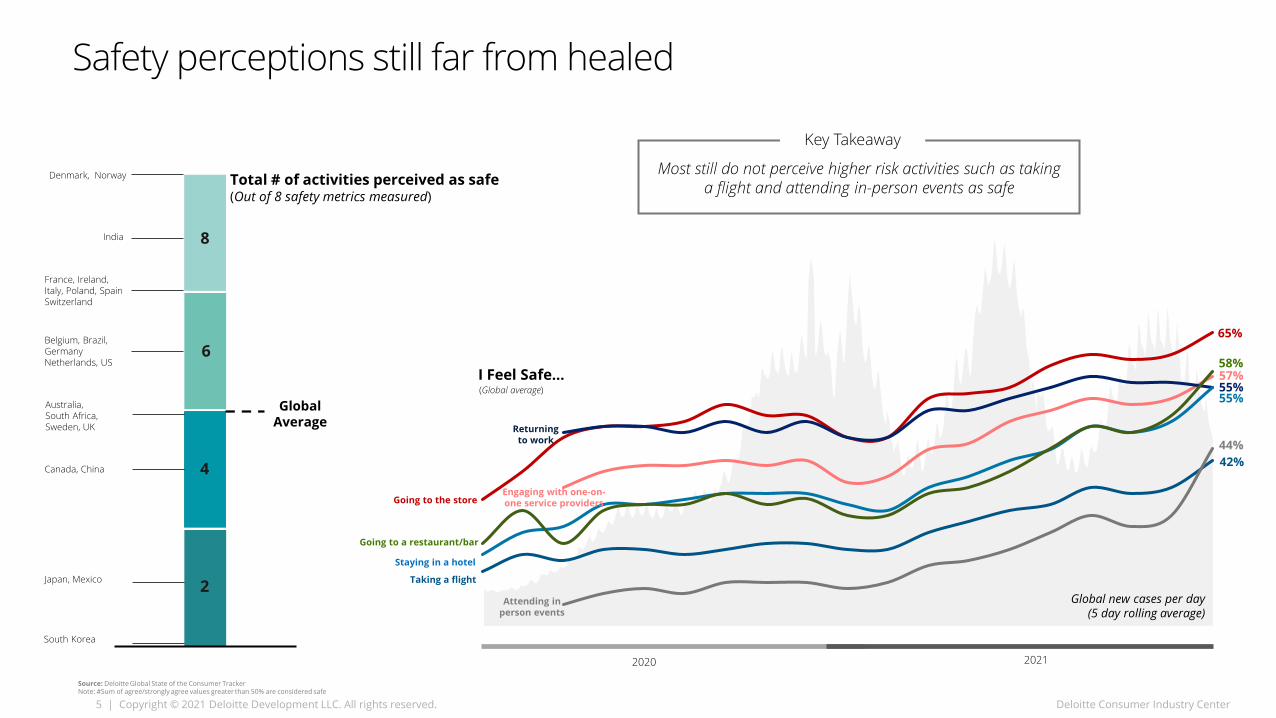
I Feel Safe…
Source: Deloitte Global State of the Consumer TrackerNote: #Sum of agree/strongly agree values greater than 50% are considered safe
Global new cases per day (5 day rolling average)
Going to the store
Attending in person events
Staying in a hotel
Returning to work
65%
55%55%
44%
2020 2021
Total # of activities perceived as safe(Out of 8 safety metrics measured)
India
France, Ireland, Italy, Poland, Spain Switzerland
Belgium, Brazil, Germany Netherlands, US
Canada, China
Australia, South Africa, Sweden, UK
Global Average
Safety perceptions still far from healed
Key Takeaway
Most still do not perceive higher risk activities such as taking a flight and attending in-person events as safe
(Global average)
8
6
4
2
42%
Japan, Mexico
South Korea
57%
Engaging with one-on-one service providers
58%
Going to a restaurant/bar
6 | Copyright © 2021 Deloitte Development LLC. All rights reserved. Deloitte Consumer Industry Center
Among people able to do their job from home, most want to work from home more than they currently are
Source: Deloitte Global State of the Consumer Tracker
0
1
2
3
4
5
Currently working from home
*Among respondents able to do their job from home
Days per week currently working from home
Days per week work from home preference
Work from home preference
Global Study Averages
2.8days
per week
3.4days
per week
Able to do job from home
56%
7 | Copyright © 2021 Deloitte Development LLC. All rights reserved. Deloitte Consumer Industry Center
Optimistic financial situation will improve within 3 years
Apr 2020 Sep 2021
0 % 2 0 % 4 0 % 6 0 % 8 0 % 1 0 0 %
J a p a nF r a n c e
I t a l yG e r m a n yB e l g i u m
N e t h e r l a n d sS p a i n
S o u t h K o r e aS w e d e n
U KS w i t z e r l a n d
P o l a n dD e n m a r k
I r e l a n dN o r w a yC a n a d a
A u s t r a l i aU n i t e d S t a t e s
C h i n aM e x i c o
B r a z i lS o u t h A f r i c a
I n d i a
Source: Deloitte Global State of the Consumer Tracker
48% Global average
Making upcoming payments
29%
Amount of money saved
Credit card debt
Percent concerned about…
31% 29%Oct 2020
Sep 202142%50%
Oct 2020
Sep 2021
39%
43%
Global AverageSouth Korea
DenmarkSwitzerland
NorwayNetherlands
IndiaMexicoPoland
South AfricaItaly
Countries with the most concerned
Countries with the least concerned
SwitzerlandDenmarkNorway
NetherlandsGermany
BrazilJapanSpain
South AfricaMexico
Countries with the most concerned
Countries with the least concerned
UKNorway
GermanyNetherlands
China
BrazilSpainJapan
FranceMexico
Countries with the most concerned
Countries with the least concerned
50% 43%
Only half optimistic about their long-term financial situation
8 | Copyright © 2021 Deloitte Development LLC. All rights reserved. Deloitte Consumer Industry Center
Roughly one-third of the consumer’s share-of-wallet going to more discretionary purchases—with housing costs a driving factor
Source: Deloitte Global State of the Consumer Tracker
Share of wallet split Global Study Average
65/35Less discretionary More discretionary
Recreation & entertainmentLeisure travelRestaurants & takeout foodElectronicsSaving & InvestingHome Furnishings
HousingGroceries
HealthcareTransportation
ClothingEveryday HH goods
Internet & DataPersonal care
Education
10%
30%
50%
Chin
a
Braz
il
Indi
a
Sout
h Ko
rea
US
Mex
ico
UK
Ger
man
y
Italy
Aust
ralia
Japa
n
Fran
ce
Den
mar
k
Switz
erla
nd
Swed
en
Belg
ium
Spai
n
Net
herl
ands
Nor
way
Cana
da
Irel
and
Pola
nd
Sout
h Af
rica
More discretionary share-of-wallet
Global average = 35%
Countries with lowest Share-of-Wallet allocated to housing

9 | Copyright © 2021 Deloitte Development LLC. All rights reserved. Deloitte Consumer Industry CenterSource: Deloitte Global State of the Consumer Tracker
Major categories like housing can represent about a quarter of total spending in countries such as Norway and Switzerland, while only commanding a single digit share in China, India and Brazil
Major Less-discretionary Categories
6%7%9%10%11%
22%22%22%24%
24%
India
China
Brazil
Mexico
South Korea
Sweden
Canada
Netherlands
Switzerland
Norway
Share of wallet
4%5%5%5%5%
6%6%7%7%7%
China
Mexico
Australia
India
Japan
Denmark
Italy
Norway
South Africa
Ireland
3%3%3%3%4%
6%6%
6%7%
9%
Spain
UK
Norway
Sweden
Denmark
South Korea
South Africa
Brazil
Netherlands
Switzerland
17%
Housing
6%
Transportation
5%
Healthcare
Housing17%
Recreation, Entertainment &
Leisure Travel5%
Groceries14%
Transportation6%
Electronics4%
Education4%
Healthcare5%
Mobile/Internet/Cable/Streaming
4%
Saving & Investing
9%
Restaurants & Takeout
6%
Everyday HH Goods
6%
20%
15%
10%
5%
Clothing & personal care
4%
Share of Wallet Global Study Average
Home Furnishings
4%
Top 5 countries with highest share Top 5 countries with least share
Copyright © 2021 Deloitte Development LLC. All rights reserved. | 10
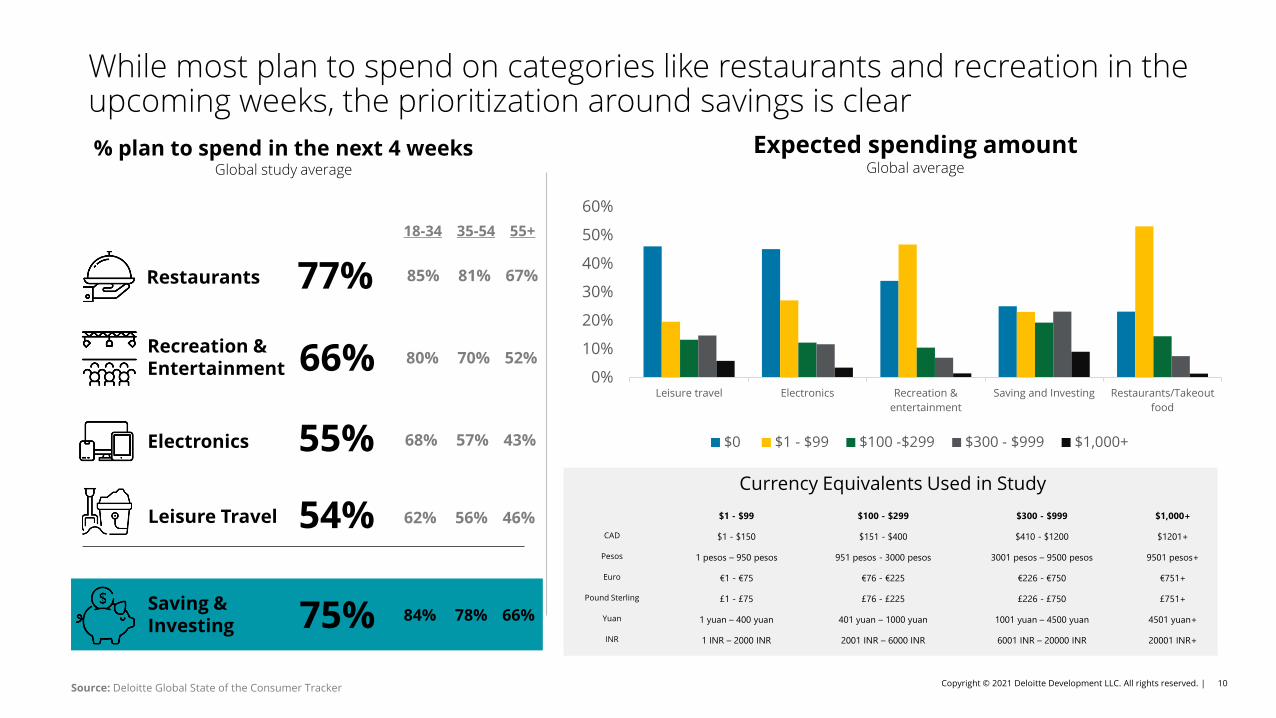
Currency Equivalents Used in Study
Source: Deloitte Global State of the Consumer Tracker
% plan to spend in the next 4 weeksGlobal study average
Recreation & Entertainment 66%
Leisure Travel 54%
Restaurants 77%
Electronics 55%
Saving & Investing 75%
0%
10%
20%
30%
40%
50%
60%
Leisure travel Electronics Recreation &entertainment
Saving and Investing Restaurants/Takeoutfood
$0 $1 - $99 $100 -$299 $300 - $999 $1,000+
Expected spending amountGlobal average
$1 - $99 $100 - $299 $300 - $999 $1,000+
CAD $1 - $150 $151 - $400 $410 - $1200 $1201+
Pesos 1 pesos – 950 pesos 951 pesos - 3000 pesos 3001 pesos – 9500 pesos 9501 pesos+
Euro €1 - €75 €76 - €225 €226 - €750 €751+
Pound Sterling £1 - £75 £76 - £225 £226 - £750 £751+
Yuan 1 yuan – 400 yuan 401 yuan – 1000 yuan 1001 yuan – 4500 yuan 4501 yuan+
INR 1 INR – 2000 INR 2001 INR – 6000 INR 6001 INR – 20000 INR 20001 INR+
18-34 35-54 55+
85% 81% 67%
80% 70% 52%
68% 57% 43%
62% 56% 46%
84% 78% 66%
While most plan to spend on categories like restaurants and recreation in the upcoming weeks, the prioritization around savings is clear
11 | Copyright © 2021 Deloitte Development LLC. All rights reserved. Deloitte Consumer Industry Center
2 0 % 4 0 % 6 0 % 8 0 %
J a p a nD e n m a r k
S w e d e nS o u t h K o r e a
N o r w a yS w i t z e r l a n d
C h i n aN e t h e r l a n d s
I t a l yA u s t r a l i a
U KC a n a d a
U n i t e d S t a t e sI r e l a n d
B e l g i u mF r a n c e
I n d i aG e r m a n y
M e x i c oP o l a n d
S p a i nB r a z i l
S o u t h A f r i c a
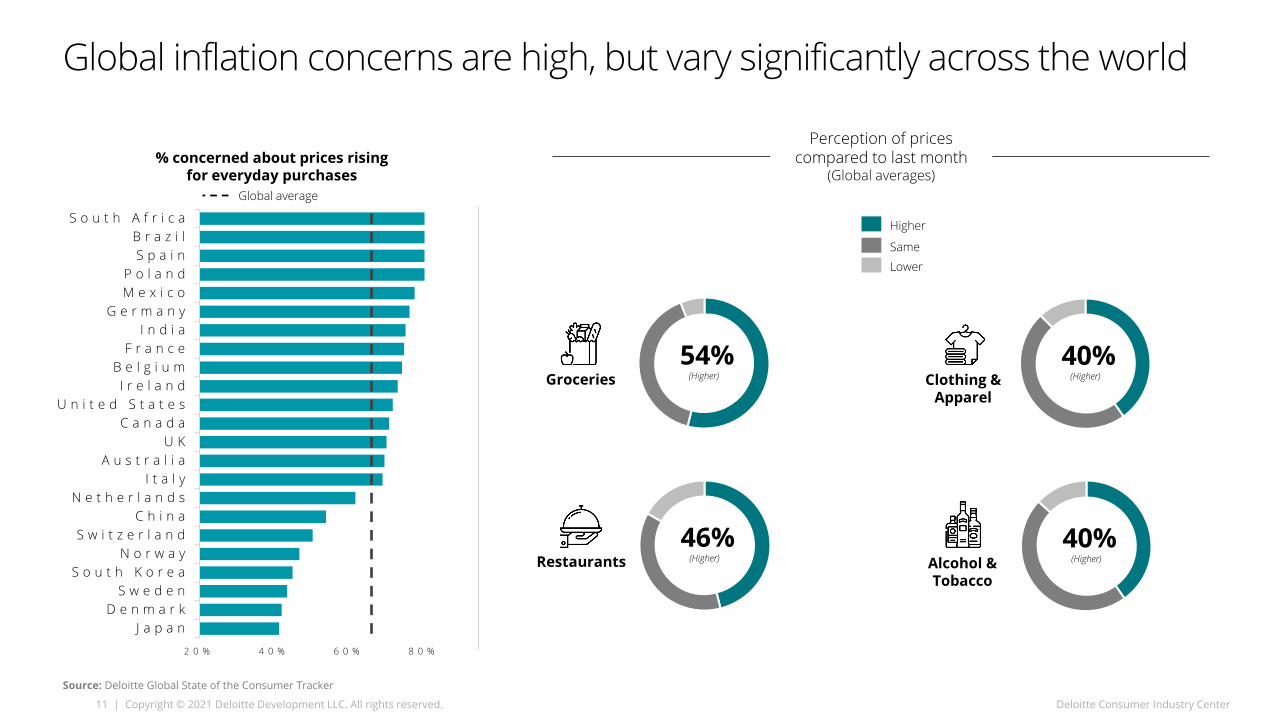
Global inflation concerns are high, but vary significantly across the world
Source: Deloitte Global State of the Consumer Tracker
% concerned about prices rising for everyday purchases
Global average
Perception of prices compared to last month
(Global averages)
Lower
Same
Groceries54%
(Higher)
Alcohol & Tobacco
40%(Higher)Restaurants
46%(Higher)
Clothing & Apparel
40%(Higher)
Higher
Copyright © 2021 Deloitte Development LLC. All rights reserved. | 12
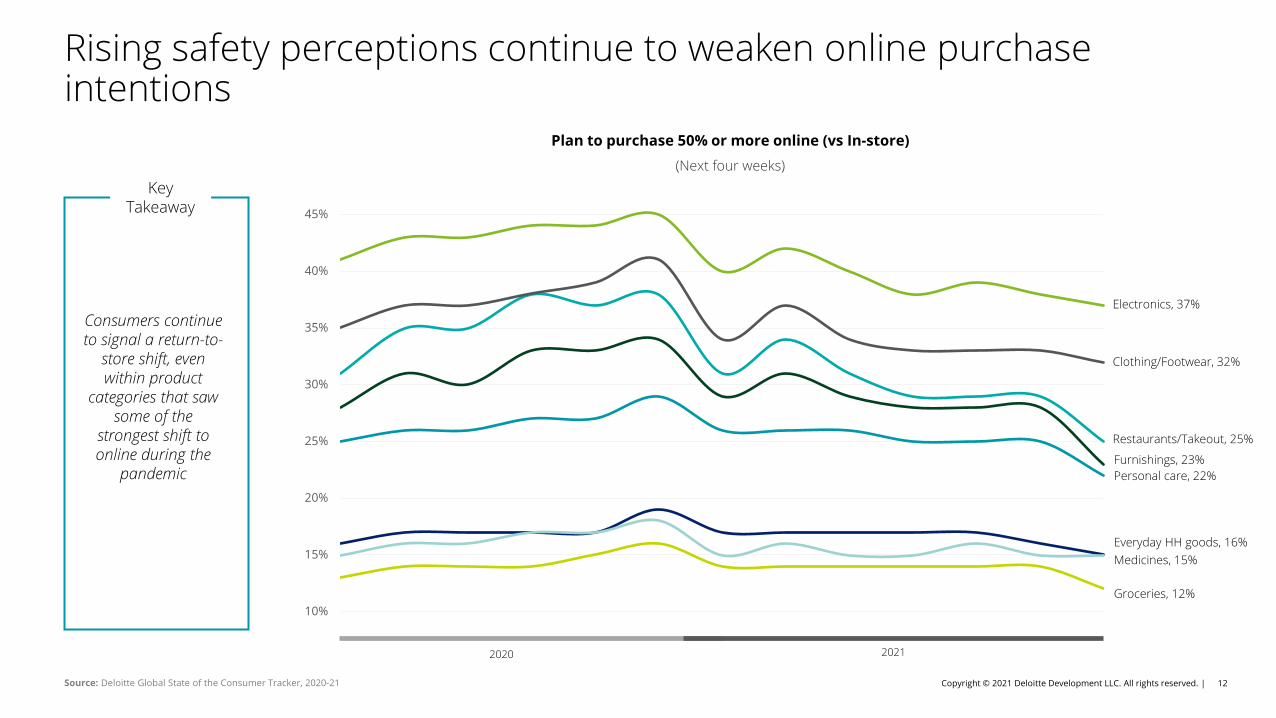
Rising safety perceptions continue to weaken online purchase intentions
Plan to purchase 50% or more online (vs In-store) (Next four weeks)
Source: Deloitte Global State of the Consumer Tracker, 2020-21
10%
15%
20%
25%
30%
35%
40%
45%
Clothing/Footwear, 32%
Groceries, 12%
Personal care, 22%
Restaurants/Takeout, 25%
Everyday HH goods, 16%
Electronics, 37%
Key Takeaway
Consumers continue to signal a return-to-
store shift, even within product
categories that saw some of the
strongest shift to online during the
pandemic
2020 2021
Medicines, 15%
Furnishings, 23%
Copyright © 2021 Deloitte Development LLC. All rights reserved. | 13
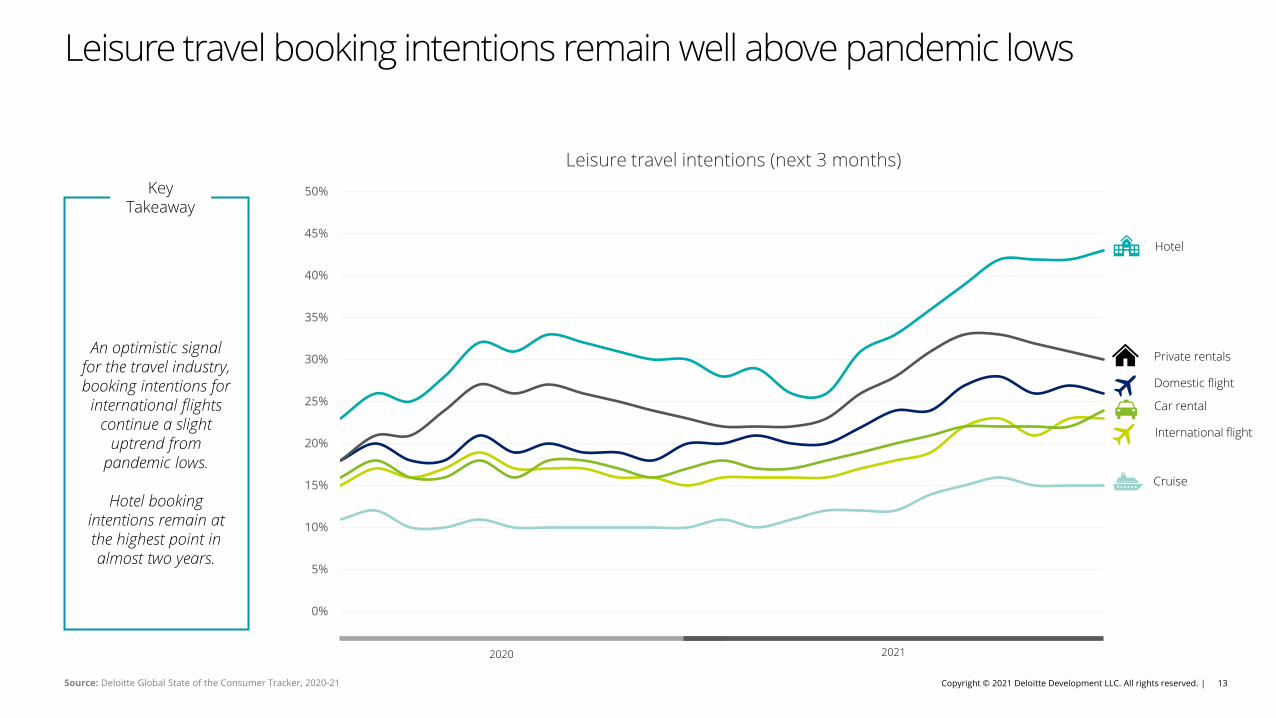
Leisure travel booking intentions remain well above pandemic lows
Leisure travel intentions (next 3 months)
Source: Deloitte Global State of the Consumer Tracker, 2020-21
0%
5%
10%
15%
20%
25%
30%
35%
40%
45%
50%
Domestic flight
Car rental
Private rentals
Cruise
International flight
Key Takeaway
An optimistic signal for the travel industry, booking intentions for
international flights continue a slight
uptrend from pandemic lows.
Hotel booking intentions remain at the highest point in almost two years.
2020 2021
Hotel
Copyright © 2021 Deloitte Development LLC. All rights reserved. | 14
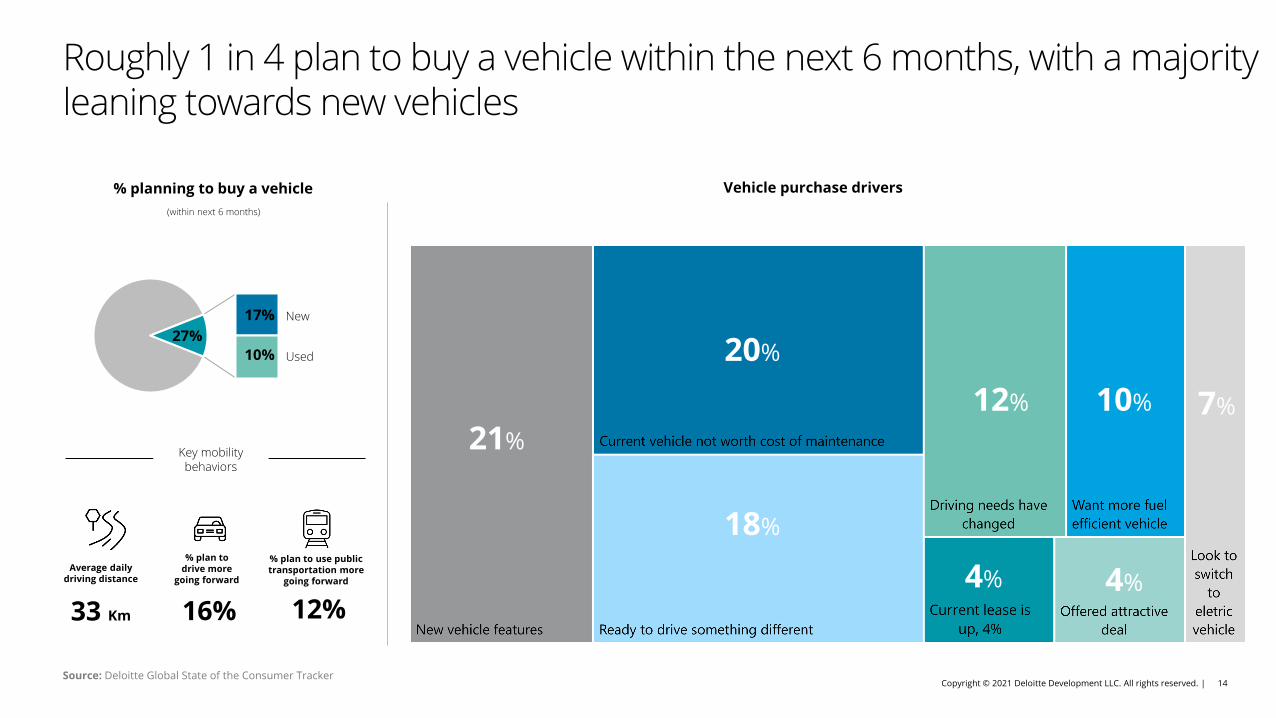
Roughly 1 in 4 plan to buy a vehicle within the next 6 months, with a majority leaning towards new vehicles
Source: Deloitte Global State of the Consumer Tracker
(within next 6 months)
% planning to buy a vehicle
27%17%
10%
New
Used
Key mobility behaviors
Average daily driving distance
33 Km
% plan to drive more
going forward
% plan to use public transportation more
going forward
16% 12%
Vehicle purchase drivers
21%
20%
18%
12% 10%
4% 4%
7%
Copyright © 2021 Deloitte Development LLC. All rights reserved. | 15
SustainabilityModuleHighlights
Copyright © 2021 Deloitte Development LLC. All rights reserved. | 16
0 %
1 0 %
2 0 %
3 0 %
4 0 %
5 0 %
6 0 %
7 0 %
8 0 %
9 0 %
1 0 0 %
Ind
ia
Me
xic
o
Br
az
il
Jap
an
Ita
ly
So
ut
h A
fric
a
So
ut
h K
or
ea
US
Sp
ain
Ca
na
da
Ch
ina
Sw
ed
en
Po
lan
d
Sw
itz
er
lan
d
Ire
lan
d
Ge
rm
an
y
Fr
an
ce
Au
st
ra
lia
UK
De
nm
ar
k
Be
lgiu
m
No
rw
ay
Ne
th
er
lan
ds
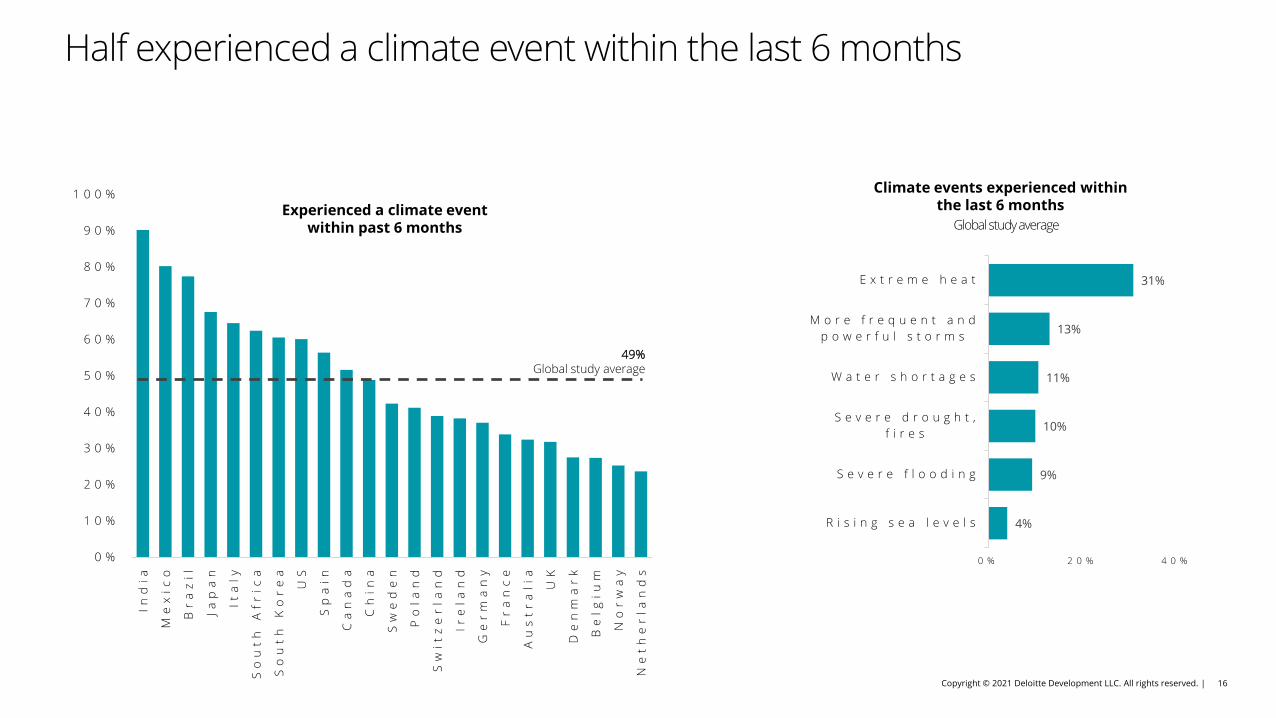
Experienced a climate eventwithin past 6 months
Climate events experienced within the last 6 months
4%
9%
10%
11%
13%
31%
0 % 2 0 % 4 0 %
R i s i n g s e a l e v e l s
S e v e r e f l o o d i n g
S e v e r e d r o u g h t , f i r e s
W a t e r s h o r t a g e s
M o r e f r e q u e n t a n d p o w e r f u l s t o r m s
E x t r e m e h e a t
Global study average
49% Global study average
Half experienced a climate event within the last 6 months

Copyright © 2021 Deloitte Development LLC. All rights reserved. | 17Source: Deloitte Global State of the Consumer Tracker
0%
20%
40%
60%
80%
100%
Worried or anxious about climate change
Worried or anxious about climate change
Believe climate change is an emergency
Believe climate change is an emergency
There is generally widespread belief that climate change is an emergency. Over half are anxious or worried about it.
57%
Global Study Averages
72%
Copyright © 2021 Deloitte Development LLC. All rights reserved. | 18
0%
20%
40%
60%
80%
100%
Source: Deloitte Global State of the Consumer Tracker
Believe humans are responsible for climate change
Believe humans cause climate change
Optimistic world will take sufficient steps to avoid worst impacts of climate change
Optimistic world will take sufficient steps to avoid worst impacts of climate
change
Most believe humans are responsible for climate change, but few are optimistic the world will take the steps needed to avoid its worst impacts
78%
Global Study Averages
39%
Copyright © 2021 Deloitte Development LLC. All rights reserved. | 19
0%
20%
40%
60%
80%
100%
65% Global study average
% changing their behavior to help address climate change
A little over 6 in 10 cite changing their behaviors to help address climate change
Copyright © 2021 Deloitte Development LLC. All rights reserved. | 20
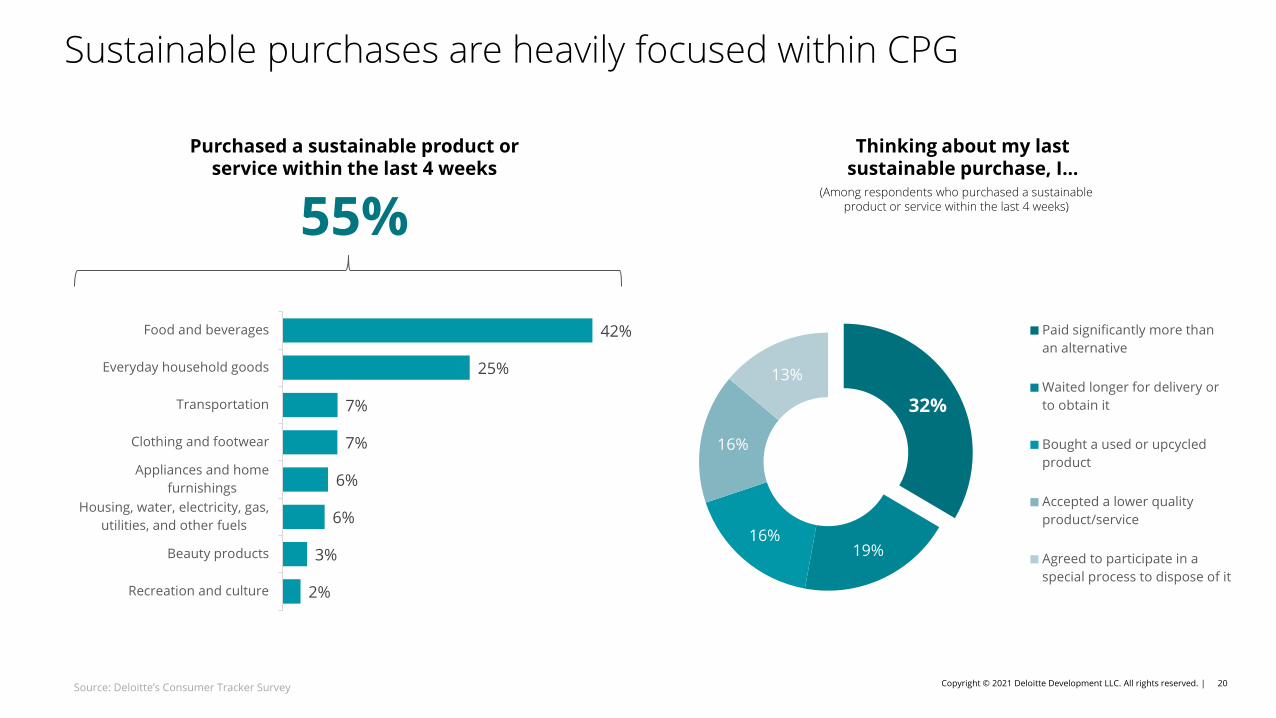
2%
3%
6%
6%
7%
7%
25%
42%
Recreation and culture
Beauty products
Housing, water, electricity, gas,utilities, and other fuels
Appliances and homefurnishings
Clothing and footwear
Transportation
Everyday household goods
Food and beverages
Source: Deloitte’s Consumer Tracker Survey
Purchased a sustainable product or service within the last 4 weeks
32%
19%16%
16%
13%
Paid significantly more thanan alternative
Waited longer for delivery orto obtain it
Bought a used or upcycledproduct
Accepted a lower qualityproduct/service
Agreed to participate in aspecial process to dispose of it
Thinking about my last sustainable purchase, I…
Sustainable purchases are heavily focused within CPG
55%(Among respondents who purchased a sustainable
product or service within the last 4 weeks)
Global State of the Consumer Tracker Dashboard
Click on the link below to visit the interactive dashboard for more insights…
This presentation contains general information only and Deloitte is not, by means of this presentation, rendering accounting, business, financial, investment, legal, tax, or other professional advice or services. This presentation is not a substitute for such professional advice or services, nor should it be used as a basis for any decision or action that may affect your business. Before making any decision or taking any action that may affect your business, you should consult a qualified professional advisor. Deloitte shall not be responsible for any loss sustained by any person who relies on this presentation.
About DeloitteDeloitte refers to one or more of Deloitte Touche Tohmatsu Limited, a UK private company limited by guarantee (“DTTL”), its network of member firms, and their related entities. DTTL and each of its member firms are legally separate and independent entities. DTTL (also referred to as “Deloitte Global”) does not provide services to clients. In the United States, Deloitte refers to one or more of the US member firms of DTTL, their related entities that operate using the “Deloitte” name in the United States and their respective affiliates. Certain services may not be available to attest clients under the rules and regulations of public accounting. Please see www.deloitte.com/about to learn more about our global network of member firms.
Copyright © 2021 Deloitte Development LLC. All rights reserved.