Embed Size (px)
Citation preview

June 2012
LIVELIHOODS AND FOOD SECURITY TRUST FUND – DELTA 1 EVALUATION Evaluation Report
Final report
Valentina Barca, Nils Riemenschneider with the collaboration of Kyaw Shaw, Hnin Nu Hlaing, Ei Ei Htwe, Kyaw Linn Htet, Kyaw Min Htun

Oxford Policy Management Limited 6 St Aldates Courtyard Tel +44 (0) 1865 207300 38 St Aldates Fax +44 (0) 1865 207301 Oxford OX1 1BN E-mail [email protected] Registered in England: 3122495 United Kingdom Website www.opml.co.uk
Livelihoods and Food Security Trust Fund – Delta 1 Evaluation Report
Oxford Policy Management i
Acknowledgements
This report would not have been possible without the contributions of a very experienced team of qualitative researchers from Myanmar Survey Research (MSR), including (in no particular order) Hnin Malar Phyu, Naw Margaret Han, Aye Hnin Phyu, Thandar Oo, Zin Min Htay and Daw Ni Ni Aye. Their very qualified supervisors have been included as co-authors as they contributed to all stages of the analysis. The MSR quantitative team also did a great job under excellent supervision. We would like to acknowledge the contributions of all team members, including supervisors Zaw Win Maung, Thet Zaw Oo, Than Myat Soe, Kyaw Min Lwin, May Phyo Aung Thwin and Daw Htay Htya Ohn and enumerators Wai Wai Tun, Aye Kyu Kyu Thin, Zaw Naing Win, Ko Phyo, Thet Htar Khin, Zar Chi Soe, Nge Nge Aung Tun, Nay Win Htun, Hnin Sabei Win, Cho Mar Khin, Shwe Wadi, Khin Nyein Nyein Aye and May Lin Thandar Aung. At MSR, we would not have been able to conduct this research without Kyaw Shaw and Hnin Nu Hlaing’s constant help and support.
We would like to thank contact partners at the Implementing Partners for their support in better understanding their activities, namely Uwe Hermann, Oddy Angelo, Naw Genevieve, Jitendra Jaiswal, and David H. Mueller. We would also like to thank all the Implementing Partners who helped us during the fieldwork period.
We are indebted to Ye’ Winn, Myint Kyaw, Pwint Phyu Soe, Win Win Myint, Than Tun, Ihan Ian, Naw Tin Thet Sann, Sein Myant, ATO, Daw Thuzar, Kiran, Harald Kreuscher and Andrew Kikwood at UNOPS for generously giving time, ideas and support and to George Collet for tireless co-operation and encouragement throughout.
While we are indebted to all those who made this work possible, all mistakes are our own.

Livelihoods and Food Security Trust Fund – Delta 1 Evaluation Report
Oxford Policy Management ii
1 Executive summary
1.1 Structure of the summary
This summary starts with a brief description of the background, objective and methodology of the study, followed by the findings. These first state which activities have been effective for rice farmers in increasing their incomes, and which had mixed effects and why. It considers questions of sustainability, mode of provision and methods of training. This is followed by an overview of the activities targeted at the poor and vulnerable. Subsequent paragraphs consider wider findings by evaluation area, including the extent of recovery to pre-Nargis levels (including food security) and considerations on targeting and cost-effectiveness.
1.2 Background, objective and methodology
In May 2008, Cyclone Nargis swept through the Ayeyarwady Delta with devastating effects, killing some 140,000 people. In 2009, the multi-donor Livelihood and Food Security Trust Fund (LIFT) was set up. It set out to support rice farmers and poor and vulnerable households by way of providing inputs and training, as well as social protection and local capacity-building measures. In 2010–11, LIFT funded 22 Implementing Partners (IPs) to work across 1,300 villages in the Delta. Overall, the Delta region received support of about $200 million from various donors after Nargis. The LIFT contribution in 2010 was $19.5 million, and it started after many of the other programmes. This is of relevance for this evaluation as many villages are likely to have received interventions from multiple programmes, including non-LIFT. Moreover, the communities were often not aware of LIFT, as the interventions were carried out under the name of the IP or their national/local counterpart. In addition, many of the LIFT Delta 1 interventions were no longer in place in late 2011, when this evaluation was taking place. Consequently, determining the precise impact of LIFT interventions is, understandably, very difficult.
The overarching purpose of this evaluation is to learn from the experiences of implementing projects under the Delta 1 phase so that they can be used to inform future LIFT-funded programming. This evaluation focuses on establishing which measures and procedures have worked particularly well and been most useful to he lp recipients increase their incomes and food availability . Attention has also been paid to trying to assess what kind of changes would be required to improve their impact and longer-term sustainability. In addition, questions around targeting, social mobilisation, accountability and cost-effectiveness were addressed .
The evaluation consisted of a qualitative and quantitative study, carried out in November 2011. Sixty-four focus group discussions (FGDs) and at least two key informant interviews (KIIs) per village were conducted in 16 villages in the Delta area, selected to provide a spread of activities and IPs. The quantitative survey took place in 100 randomly selected villages, and consisted of 100 KIIs and 800 household interviews.

Livelihoods and Food Security Trust Fund – Delta 1 Evaluation Report
Oxford Policy Management iii
1.3 Findings by activity
1.3.1 Rice farmers
Overall effectiveness The activities that were most effective for rice farmer s were those that helped to ‘kick start’ and improve their farming activities after the deva station of Nargis . The provision of buffaloes, power tillers and seeds were particularly useful inputs that helped to increase income and were also seen as sustainable. Fertiliser provision helped to increase income, but was seen as less sustainable.
Training on seed treatment, pest control and soil management taught techniques which were widely adopted. Participants appreciated learning how to prevent soil degradation, recognise plant diseases and select viable seeds. These training sessions were credited with increasing incomes. It was widely expected that the skills gained would also be applied in the future.
Other inputs and training had a more mixed effect. Post-harvest equipment and drum seeders were useful to some farmers and not used by others. Training on transplanting, organic fertiliser production, and inorganic fertiliser usage were also useful to some, but not others.
One common reason for the ineffectiveness of certain ac tivities was the lack of adaptation to the local context . For example, drum seeders were only seen as useful on high/dry land and not during the monsoon season. Similarly, transplanting was often adopted by farmers on parts of their land (reflecting their willingness to test it), but considered too costly (because of the additional labour costs) and not appropriate for land which was prone to flooding.
The local context also played a role with respect to post-harvest equipment: many farmers had to repay loans straight after the harvest and could not store their yield to realise a higher sales price. In other cases, key inputs were not easily available locally, posing problems for the sustainability of certain activities.
Overall, it should be noted that these failures do not mean these activities were always unsuccessful. For example, those farmers who did use drum seeders experienced an increase in yield, as did those who could afford to store their harvest, for example by using air-tight bags.
With respect to sustainability , buffaloes were seen as very sustainable (because of their offspring), especially when a vet was available locally. The sustainability of power tillers depended on the group ownership arrangements (including number of people per group and whether maintenance training was provided). At the time of the study, all power-tiller groups encountered were still functioning well. Seed banks were widely perceived as sustainable as they were replenished every harvest, except for systemic risk. Of the four most effective inputs, only fertiliser was not seen as sustainable, due to its high cost. Nevertheless, it could be argued that if a one-off provision of fertiliser boosts harvest and incomes, this has a long-term impact on the overall debt cycle.1 We hereby briefly summarise the main lessons learned on the agricultural training methods and on the provision of inputs, analysed in detail in Section 3.8 and Section 5.
1 It may be added that the sustainability of the fertiliser practices promoted by IPs may depend on whether the optimal fertiliser use was proven to be viable to farmers. A separate survey conducted by UNOPS (the ‘baseline survey’) indicates that fertilizer is being used by nearly two-thirds of rice farmers in the Delta.
Livelihoods and Food Security Trust Fund – Delta 1 Evaluation Report
Oxford Policy Management iv
The best training, as reported by respondents, was very practical that clearly explained and demonstrated every phase of the agricultural technique being taught. Consistent interactions such as regular meetings with villagers as part of the Farmer Field Schools (FFS) or at least a go-to contact person in the closest town helped to build the trust and confidence of training participants. The systematisation of knowledge spreading, through Farmer Exchange Groups or other informal farmer networks, appeared to be useful in helping knowledge on new techniques to be spread. A further success factor that was reported by a few of the IPs was the linking of the agricultural training with expertise from the Myanmar Agriculture Service (MAS), including MAS extension workers themselves being paid to give the training.
Importantly, as stated above, the lack of appropriate tailoring to local conditions played a role in non-adoption of agricultural techniques. A greater knowledge of village-level constraints (such as land distribution, soil conditions, labour supply and demand, and access to agricultural markets, e.g. through a rapid assessment before training starts) is likely to improve training success, as would basic exercises around the costs and benefits (and therefore the affordability and financial viability) of each technique in that specific village.
In the context of input provision, it is useful to distinguish between different modes of provision of inputs (cash, voucher, direct provision, as well as individual versus group ownership). The main findings (presented in more depth in Section 3.8) are as follows:
- Group ownership of large assets was successful so long as groups were small and mostly homogenous, clear sharing arrangements were set out in advance (including on maintenance) and no practical constraints were encountered.
- The provision of cash to purchase inputs was overall preferred to vouchers (seen as inflexible and leading to lower quality) or direct provision (which was only considered efficient for inputs with economies of scale and certified quality).
1.3.2 Poor and vulnerable
Several activities were specifically set up to target the poorest and most vulnerable households, most often landless casual labourers. Successful activities included the establishment of revolving funds for cash and self-help groups (SHGs ), rice banks, some of the vocational skills training and the training of community exten sion workers (CEWs) .
• The revolving funds for cash and the SHGs allowed people to borrow at lower interest rates and retain more of their income, thereby providing space for business expansion. When successful, they became very sustainable, as they grew on their own success (interest was both used to expand lending and to invest in communal infrastructure).
• Rice banks were considered an extremely useful safety net for the poorest (the one observed was still functioning and widely used).
• The vocational skill training2 led to modest incomes, which implies that the people trained were utilising their skills and earning some money with them. Limitations to incomes were competition from better trained people producing higher quality products or from mass production.
• Livestock extension workers (‘para-vets’) were largely effective, as they saved farmers the cost of a vet and prevented the spreading of disease. They could also earn a modest living from providing these services.
2 In such skills as beauty salons, tailoring, mechanic repair and masonry/carpentry, though in each case the findings are based on one FGD only.

Livelihoods and Food Security Trust Fund – Delta 1 Evaluation Report
Oxford Policy Management v
On the other hand, the provision of small livestock, home gardening kits, boats and nets, and support for other income-generating activities (IGA s) and the cash-for-work (CfW) programmes had mixed success . This was partially linked to inadequate targeting, but also to procurement problems and systemic risks such as livestock disease.
• For example, small livestock and home gardening inputs and training were often provided to households with no access to land (only a minority of the poor – some 15% – own land). Moreover, unhealthy and unsuitable livestock (e.g. pigs of the wrong breeds) were procured in some cases, partially linked to inflexible procurement procedures that did not take beneficiaries’ views into account. The 2011 wave of “Blue Ear” pig disease (Porcine Reproductive and Respiratory Syndrome Virus, PRRSV) worsened the situation, leading to widespread livestock loss. In some cases, when pigs had been provided through a livestock revolving fund, households were thrown into further debt as they were unable to repay their loans. Nevertheless, it should be stressed that in the cases where the pigs did not die – sometimes thanks to the presence of a livestock extension worker – the positive affect on income was significant (i.e. through the profitable selling of pigs). Similarly, for those who had the land and skills to look after ducks or tend their home garden, these activities provided a small regular income and contributed to household food security.
• Regarding the provision of boats and nets, some problems were faced with targeting (inputs being provided to non-fishermen) but most of the difficulties were linked to the system of fishing ground leases and tenders limiting the access for poor fishermen. In areas where this was happening, several households interviewed ended up selling their assets and others were pushed further away from their village to sea in order to provide an income for their households.
• Some of the other IGAs did not address a local demand, and were therefore of little success (e.g. high-cost snack training in one village).
• The CfW programmes were seen as useful for rebuilding and improving infrastructure and for increasing incomes, but only in the short term and hence not sustainable.
1.4 Findings by evaluation area
1.4.1 Incomes, food security and levels of post-Nar gis recovery
Across FGDs there was a remarkably consistent picture with respect to the perceived developments of income and food security in the years following Nargis. An overwhelming majority of respondents was of the overall opinion that incomes had increased substantially after the Nargis collapse, but not enough to reach pre-Nargis levels .
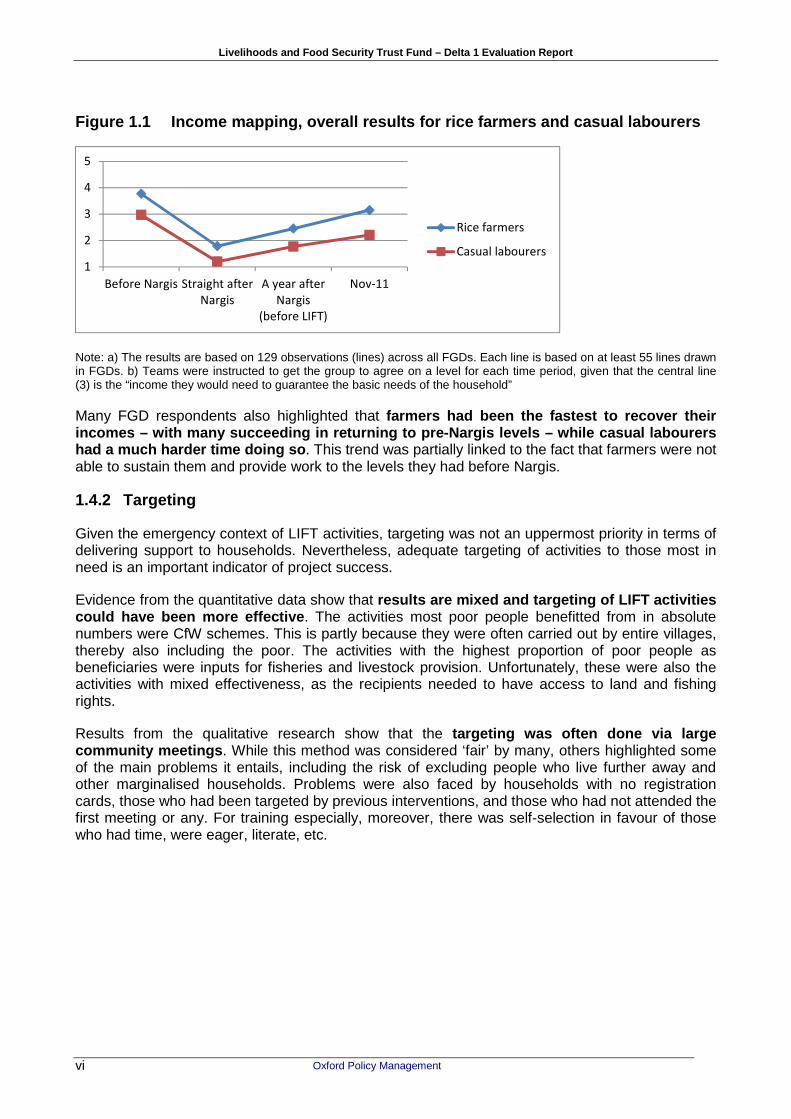
Based on summary evidence from income and food-mapping exercises (analysed in detail in sections 4.2 and 4.3), incomes plummeted straight after Nargis for both farmers and casual labourers. Increases in incomes of about one-third were reported as soon as a year after and were often linked to hand-outs from organisations. During the time LIFT was in operation, incomes were perceived to have increased by a further third, bringing rice farmers to a level above that of ‘self-sufficiency’ and casual labourers close to pre-Nargis levels.
Livelihoods and Food Security Trust Fund – Delta 1 Evaluation Report
Oxford Policy Management vi
Figure 1.1 Income mapping, overall results for rice farmers and casual labourers
Note: a) The results are based on 129 observations (lines) across all FGDs. Each line is based on at least 55 lines drawn in FGDs. b) Teams were instructed to get the group to agree on a level for each time period, given that the central line (3) is the “income they would need to guarantee the basic needs of the household”
Many FGD respondents also highlighted that farmers had been the fastest to recover their incomes – with many succeeding in returning to pre- Nargis levels – while casual labourers had a much harder time doing so . This trend was partially linked to the fact that farmers were not able to sustain them and provide work to the levels they had before Nargis.
1.4.2 Targeting
Given the emergency context of LIFT activities, targeting was not an uppermost priority in terms of delivering support to households. Nevertheless, adequate targeting of activities to those most in need is an important indicator of project success.
Evidence from the quantitative data show that results are mixed and targeting of LIFT activities could have been more effective . The activities most poor people benefitted from in absolute numbers were CfW schemes. This is partly because they were often carried out by entire villages, thereby also including the poor. The activities with the highest proportion of poor people as beneficiaries were inputs for fisheries and livestock provision. Unfortunately, these were also the activities with mixed effectiveness, as the recipients needed to have access to land and fishing rights.
Results from the qualitative research show that the targeting was often done via large community meetings . While this method was considered ‘fair’ by many, others highlighted some of the main problems it entails, including the risk of excluding people who live further away and other marginalised households. Problems were also faced by households with no registration cards, those who had been targeted by previous interventions, and those who had not attended the first meeting or any. For training especially, moreover, there was self-selection in favour of those who had time, were eager, literate, etc.
1
2
3
4
5
Before Nargis Straight after
Nargis
A year after
Nargis
(before LIFT)
Nov-11
Rice farmers
Casual labourers
Livelihoods and Food Security Trust Fund – Delta 1 Evaluation Report
Oxford Policy Management vii
Table of contents
Acknowledgements i
1 Executive summary ii 1.1 Structure of the summary ii 1.2 Background, objective and methodology ii 1.3 Findings by activity iii 1.4 Findings by evaluation area v
List of tables and figures ix
Abbreviations xi
Section A: Background to the research 1
2 Introduction 2
2.1 Background to the evaluation 2
2.2 Research questions 4
2.3 Limitations to the research 7
2.4 Structure of the report 8
Section B: Findings 10
3 Findings by activity 11
3.1 Introduction 11
3.2 Training in agricultural techniques – training methods 11
3.3 Training in agricultural techniques – content 14
3.4 Impact of inputs for farmers 27
3.5 Impact of other livelihood inputs and training (not related to rice production) 38
3.6 Revolving funds, SHGs, seed banks and rice banks 58
3.7 Cash for Work 66
3.8 How the mode of provision affected outcomes 70
3.9 Overall summary tables 73
4 Overall findings by evaluation area 78
4.1 Introduction 78
4.2 Impact on incomes 78
4.3 Impact on food security 84
4.4 Sustainability 87
4.5 Targeting 90
4.6 Accountability, participation and social mobilisation 95
4.7 Additional impact areas 97
4.8 Cost-effectiveness 99
5 Overall lessons learned and associated recommendations 104
5.1 Research questions, addressed in summary 104
5.2 Summary of lessons learned and recommendations 107
Annex A Terms of reference 111

Livelihoods and Food Security Trust Fund – Delta 1 Evaluation Report
Oxford Policy Management viii
Annex B Development of the research tools and plan 120
B.2 Methods adopted 124
B.3 Fieldwork overview 127
B.4 Analysis 128
B.5 Additional information on selection of villages 128
Annex C Principles of accountability within humanitarian response 131
Annex D Additional tables and findings 133
D.1 Perceived increase in income per activity, quantitative results 133

Livelihoods and Food Security Trust Fund – Delta 1 Evaluation Report
Oxford Policy Management ix
List of tables and figures
Table 3.1 Training methods, positive aspects and points to consider 13
Table 3.2 Overall assessment – transplanting 16
Table 3.3 Overall assessment – organic fertiliser training 19
Table 3.4 Overall assessment – inorganic fertiliser 20
Table 3.5 Overall assessment – seed treatment 23
Table 3.6 Overall assessment – pest management 24
Table 3.7 Overall assessment – soil treatment 26
Table 3.8 Overall assessment – summary table 30
Table 3.9 Overall assessment – power tillers 32
Table 3.10 Overall assessment – drum seeders 34
Table 3.11 Overall assessment – fertiliser as an input 35
Table 3.12 Overall assessment – post-harvest equipment 38
Table 3.13 Overall assessment – provision of ducks 41
Table 3.14 Overall assessment – provision of pigs 46
Table 3.15 Overall assessment – provision of boats and nets 50
Table 3.16 Overall assessment – trainings for IGAs 55
Table 3.17 Overall assessment – CEW 57
Table 3.18 Overall assessment – revolving funds for cash 62
Table 3.19 Overall assessment – SHGs 63
Table 3.20 Overall assessment – seed banks 65
Table 3.21 Overall assessment – rice banks 66
Table 3.22 Overall assessment – CfW programmes 69
Table 3.23 Agricultural training – overview of findings per activity for rice farmers 74
Table 3.24 Agricultural inputs – overview of findings per activity for rice farmers 75
Table 3.25 Overview of findings per activity for the poor and vulnerable: employment opportunities and other activities 76
Table 3.26 Overview of findings per activity for the poor and vulnerable: other activities 77
Table 4.27 Proportion of beneficiaries who stated that an activity increased their income83
Table 4.28 Sustainability, an overview 89
Table 4.29 Distribution of welfare segments based on interviewers’ impressions 90
Table 4.30 Percentage of expenditure under Output 1 100
Table 4.31 Percentage of expenditure under Output 2 101
Table 4.32 Effectiveness and proportion of expenditure spent on different activities 102
Table B.1 Selection of villages (showing only 10 of 16 villages for reasons of space) 129
Table D.2 Quantitative results with respect to perceived increase in income per activity and targeting of poor 133
Table D.3 Additional results 137

Livelihoods and Food Security Trust Fund – Delta 1 Evaluation Report
Oxford Policy Management x
Figure 1.1 Income mapping, overall results for rice farmers and casual labourers vi Figure 2.2 Overview of LIFT activities 6
6
Figure 2.3 Sampled qualitative and quantitative villages 7
Figure 3.4 Overall assessment – home gardening 53
Figure 3.5 Total number of work days per month and periods of high labour demand and hunger season 68
Figure 4.6 Income mapping, overall results for rice farmers and casual labourers 79
Figure 4.7 Income mapping, results by FGD respondent type 80
Figure 4.8 Loss in income due to Nargis and level of recovery 81
Figure 4.9 Development of food security over time as seen by a FGD in Hnar Nit Pauk 84
Figure 4.10 Food security mapping, rice farmers and casual labourers 85
Figure 4.11 Reduction in food security levels due to Nargis and level of recovery 86
Figure 4.12 Proportion of households participating in LIFT activities across wealth segments 91
Figure 4.13 Proportion of people who own land – poor versus non-poor 92
Figure 4.14 Targeting by activity: households who participated in LIFT activities as a proportion of total sample 92
Figure 4.15 Targeting by activity: Poor households who benefitted from LIFT activities as a proportion of overall beneficiaries/recipients 93
Figure 4.16 Activities that helped women in particular 98
Figure 4.17 Proportion of respondents who benefitted from the activities with respect to employment 99
Figure B.1 Evaluation framework 121
Figure B.2 Theory of change for agricultural production 123
Figure B.3 Self weighted sample 127
Box 3.1 Experience of an Agricultural Extension Worker, Hnar Hnit Pauk 14
Box 3.2 Community-based procurement, LWF’s experience 45
Box 3.3 Livestock extension worker 56

Livelihoods and Food Security Trust Fund – Delta 1 Evaluation Report
Oxford Policy Management xi
Abbreviations
CBO Community-Based Organisation
CEW Community Extension Worker
CfW Cash for Work
DAC Development Assistance Committee
FFS Farmer Field School
FGD Focus Group Discussion
IGA Income-Generating Activity
IP Implementing Partner
KII Key Informant Interview
LIFT Livelihood and Food Security Trust Fund
MAS Myanmar Agriculture Service
MSR Myanmar Survey Research
NGO Non-Governmental Organisation
OPM Oxford Policy Management
SHG Self-Help Group
VDC Village Development Committee


Livelihoods and Food Security Trust Fund – Delta 1 Evaluation Report
Oxford Policy Management 1
Section A: Background to the research
Livelihoods and Food Security Trust Fund – Delta 1 Evaluation Report
Oxford Policy Management 2
2 Introduction
2.1 Background to the evaluation
In May 2008 Cyclone Nargis swept through the Ayeyarwady Delta in the period when paddy farmers were at the last stage of harvesting a summer season crop and preparing for the monsoon crop, causing widespread physical destruction and some 140,000 deaths. As well as the human costs, survivors faced a loss of assets, including homes and productive assets used in a range of livelihoods. An assessment conducted in September 2008 by Oxfam, for example, showed that farmers and fishers had lost up to 60% of tools, equipment and inputs and that indebtedness in the area increased dramatically after the cyclone. Similarly, research conducted by UNDP reports that “95% of housing and other infrastructure was either destroyed or lost altogether”, with the “livelihoods of about 2.4 million people being destroyed or damaged” (UNDP, 2009).
In March 2009, LIFT was set up as a multi-donor trust fund initially supported by Australia, the European Commission, the Netherlands, Sweden, Switzerland and the UK, as a way to improve the livelihoods of people affected by the cyclone.3 Key LIFT personnel started from December 2009 onwards and by 2010 LIFT was supporting 22 IPs undertaking projects in the Delta.
LIFT’s partner organisations include international NGOs, UN organisations and local organisations. The projects range widely, as explored in the following paragraphs. Importantly, it should be remembered that, overall, the Delta region received support worth about $200m from various donors after Nargis, with LIFT’s contribution in 2010 at $19.5 million for 22 one-year projects. Another $18 million has been spent on nine three-year projects that started in 2011.
2.1.1 Summary of Delta 1 Programme
LIFT’s overall objective, as set out in all relevant documents, is to contribute resources to a “livelihoods and food security programme with the aim of making progress towards the achievement of Millennium Development Goal 1 (the eradication of extreme poverty and hunger) in Myanmar”. More specifically, working through a trust fund modality, “LIFT’s purpose is to increase food availability and incomes of 1–1.5 million target beneficiaries” (LIFT Annual Report, 2010).
LIFT’s programming was designed with these objectives in mind, striving to achieve four main outputs:
1. Direct agricultural production support, mostly through provision of inputs and training; 2. Effective market and employment support (‘diversified and enhanced economic activities’); 3. Effective social protection measures; and 4. Capacity development of local organisations.4
A total of 22 one-year projects were implemented during the first year of programming. As the LIFT 2010 Annual Report highlights, some of the main achievements at the end of 2010 included:
3 LIFT is now supported by Australia, Denmark, the European Commission, the Netherlands, New Zealand, Sweden, Switzerland and the UK. 4 Note that this does not include a fifth output area that this evaluation contributes to: the monitoring and evaluation of LIFT’s activities and the generation of evidence used to inform programme and policy development.

Livelihoods and Food Security Trust Fund – Delta 1 Evaluation Report
Oxford Policy Management 3
• providing 43,454 farmers with agricultural inputs including 1,373 MT of paddy seed and 1,236 MT of fertiliser;
• providing training and advice to farmers to ensure good use of agricultural inputs;
• providing capital to 6,226 households for small businesses ;
• providing livestock to 7,931 households;
• providing nets or boats to 6,069 fishing households;
• implementing CfW activities for landless and poor households, creating 389,877 person-days of work to develop community-based infrastructure (jetties, ponds, bridges, embankments, footpaths, culverts, etc.);
• training 3,300 community-based groups with 56,000 members (42% of whom are women); and
• establishing a network of 61 partners working on food security and livelihood activities in eight regions and states.
2.1.2 Summary of evidence from programme monitoring and evaluation
Many evaluations of LIFT activities have already been conducted by individual LIFT IPs, sometimes too soon to be able to testify to any substantial changes in livelihoods or project impacts.5
Overall, these reports support that LIFT’s projects “clearly had a positive impact on the livelihoods of the target populations” (LWF evaluation report, 2011), as they were a “highly relevant and comprehensive response to the post-emergency phase recovery needs of the Nargis-affected population” (ADRA/ActionAid/ECODEV evaluation report, 2011).
Among the positive impacts cited by previous studies, a few are worth mentioning and will be explored in further detail within this report:6
• Village Development Committees (VDCs) were overall well established, trained, and in charge of coordinating the development efforts in their communities. This indirectly led to a higher level of community cohesion and participation on village development affairs;
• Income had increased since Nargis to some extent for the landless and dramatically for farmers, with debt levels decreasing (enabling increasing investments for the future);
• Improved village infrastructure (through CfW activities) has somewhat eased transport and communication difficulties, improving access to key services;
• The social protection component of most projects had large short-term effects in terms of raising household incomes and improving food security, but no longer-term benefits were found;
• The value of the FFSs and other agricultural training was seen to be very high, though the trickle down of knowledge to other villagers was limited; and
• Resilience of communities has increased, although they remain vulnerable to new cyclones, bad weather, pests and rodent infestations.
Similar findings were also confirmed by numerous field visits by members of the LIFT programme, which informed the discussions during the design and analysis phase and fed directly into the selection of villages for the qualitative fieldwork.
5 Note that this is openly acknowledged by some of the evaluations. 6 The findings are listed in no particular order and are all derived from the IP evaluation reports.
Livelihoods and Food Security Trust Fund – Delta 1 Evaluation Report
Oxford Policy Management 4
2.1.3 Objectives of the evaluation
The overarching purpose of this evaluation is to learn from the experiences of implementing projects under the Delta 1 phase so that they can be used to inform future LIFT-funded programming.
As clearly stated in the LIFT Annual Report 2010, LIFTs main purpose is “to increase food availability and incomes of 1–1.5 million beneficiaries ”. This evaluation therefore focuses on establishing which measures and procedures have worked particularly well and been most useful to help recipients increase their incomes and food availability. Attention has also been paid trying to assess what kind of changes would be required to improve their impact and longer-term sustainability.
2.2 Research questions
The terms of reference for the study provided a key set of research questions, listed in order of priority,7 with clear distinctions between high-, medium- and lower-priority research questions.
High-priority research questions • What interventions worked best to increase paddy production ? What were the contributions
from increase in area planted versus increase in yields?
• What interventions worked best to increase rice farmer income ? (increased production/quality, lower cost inputs, post-harvest processing, rice banks/storage, marketing, transport infrastructure etc.)
• Assessment of impacts of different interventions on the most poor and vulnerable in the community – what worked best for them?
• Assessment of the effectiveness, efficiency and sustainability of different approaches to farmer extension . Assessment of the adoption of different practices/technologies extended (was knowledge new to participants, was it relevant/appropriate, what were the constraints to adoption, etc.?).
• Food security and nutrition : Links between agricultural production, livelihood support, and food security and nutrition.
Medium-priority research questions • What worked best among the various IGAs promoted? (For landless households, for women,
for men, for the aged or disabled?)
• What skills training resulted in the best benefits in terms of employment (Increase in number of days men/women were able to find work? Increase in pay?).
• What is the likelihood that the benefits associated with each type of intervention can/will be sustained ? What are the factors that promote/hinder the sustainability of each?
• Assessment of relative success and cost-effectiveness of the four broad areas of intervention: increasing agricultural production and incomes, improving household incomes and employment
7 Priorities based on a meeting on 13 October 2011 with George Collett (M&E Officer) and Myint Kyaw (Microfinance and Business Development Officer). The results were reviewed by a larger meeting with the Programme Team on 17 October. Present at the meeting were Harald Kreuscher (Programme Officer), Ye Win (Programme Analyst, M&E), Myint Kyaw, George Collett, and Pwint Phyu Soe (M&E Assistant). One adjustment was made as a result of this review and the priorities were agreed.
Livelihoods and Food Security Trust Fund – Delta 1 Evaluation Report
Oxford Policy Management 5
outside of agriculture, providing social protection, and local capacity development. Given the outcomes relative to expenditure, was the balance appropriate?
Lower-priority research questions • Assessment of different approaches to supporting community-based organisations (CBOs)
(including issues of representation of women/landless/vulnerable/minorities, collective ownership of assets – how these worked, management arrangements, equity, transparency/accountability, and sustainability).
• What approaches worked best for provision of credit? (Assessed in terms of numbers of new loans provided, costs of administration, loan terms and conditions, average loan size, loan use (consumption, emergencies, investment), level of arrears/default/successful repayment, sustainability after project support ended, etc.).
• Recovery to pre-Nargis levels of food security and production. What has been the progress made by households towards recovering to pre-Nargis levels of production and livelihood/food security.
In line with Development Assistance Committee (DAC) criteria, the study also considered which approaches and interventions were most relevant to contextual conditions and beneficiary needs and, linked to that and the respective research questions, which were most likely to be sustainable over time and beyond external funding, based on respondents’ perceptions and the behaviour observed during site visits.
These research questions were discussed extensively in meetings between LIFT management and Oxford Policy Management (OPM), aiming at prioritising research goals and developing a conceptual framework that could be effectively used for the analysis of such a wide range of topics relating to the impact of a very diversified array of activities. 8
The result of this prioritisation process was the d ecision to mainly focus on understanding how LIFT’s activities affected the income and food security of rice farmers on one side and the poorest and most vulnerable households on the o ther (with the understanding that these categories are sometimes overlapping), while documenting the processes that led to specific activities’ success or failure, including their perceived longer-term sustainability. The quantitative element of the study, moreover, was designed to give some information on the coverage and targeting of LIFT activities and to give a more widely representative view of beneficiaries’ perceptions of impact.
The figure below provides an overview of all LIFT activities and highlights those that have been covered in this evaluation.
8 It may be added that, on the basis of these research objectives, both the qualitative and quantitative parts of this study were developed as two parts of an integrated approach.

Livelihoods and Food Security Trust Fund – Delta 1 Evaluation Report
Oxford Policy Management 6
Key intervention
areas
Agriculturalproduction
Inputs
Indirect
Cash vouchers for
inputs
Direct
Seeds Fertiliser Tilling
Buffaloes
Power tills
Post harvest equipment
Seed storage facilities
Air tight bags
Other farming
equipment
Rotary cultivators
Trailers
Water pumps
Sprayers
Drum seeders
Training
Farmer extension groups
Farmer field schools
On farm paddy trials
Demonstration plots
Field days and fairs
Market and
employmentsupport
Support to mkt development for rural businesses
Business development
training
Introduction of new
products/ businesses
Scaling up small
business management
Promotion of
bookkeeping knowledge
Expansion of financial services
Revolving funds
In kind funds Cash funds
Repayment against project inputs
Established with savings
Creation of rural employment opportunities
Through liveliihood inputs
Livestock inputs
Pigs, ducks and goats
Fishery inputs
Baby shrimp, boats, nets, equipment
Inputs for home
gardening
Kit of seeds, fertiliser,
tools
Effective social
protection measures
Cash for work
For communal infrastructure
Disaster Risk Reduction work
Agricultural work
Establishment of rice banks
Support for disabled and
elderly
Reintegration of disabled
Physiotherapy
Conditional cash grants
Pregnant women and
lactating mothers
Support to CBOs
Figure 2.2 Overview of LIFT activities
= Lower priority = Higher priority

Livelihoods and Food Security Trust Fund – Delta 1 Evaluation Report
Oxford Policy Management 7
In order to optimise the research efforts, villages were purposefully selected for the qualitative study where success stories were more likely (in consultation with IPs). Moreover, villages were selected to cover a wide range of activities, approaches and IPs. Details of the development of the methodology are provided in Annex B.
The evaluation consisted of a qualitative and quantitative study, carried out in November 2011. Sixty-four FGDs and at least two KIIs per village were conducted in 16 villages in the Delta area, selected to provide a spread of activities and IPs. The quantitative survey took place in 100 randomly selected villages, and consisted of 100 KIIs and 800 household interviews.
Figure 2.3 Sampled qualitative and quantitative vil lages
2.3 Limitations to the research
It is important, at this stage, to emphasise some of the main limitations to this study, in the most part determined by the breadth of topics and activities analysed in the evaluation.
Breadth versus depth The evaluation framework in Annex B (Section B.1.1) brings out a central challenge of the research design, which could be called the ‘breadth-versus-depth’ trade-off: the more activities were to be evaluated the less it was possible to look at each of them in great depth. If, for example, only 4–5 activities had to be evaluated, it would have been possible to look at each of them in all 16 villages of the qualitative research.
However, even when excluding a range of interventions during the inception phase (such as CfW programmes, food and nutrition training, and CBO training), there were still 23 activities of interest

Livelihoods and Food Security Trust Fund – Delta 1 Evaluation Report
Oxford Policy Management 8
for this study. To balance this breadth of activities to be analysed, it was agreed that activities would be covered in less depth, with the focus of the overall evaluation being on success stories and respondents’ perceptions of how their livelihoods had been affected by each. In some cases, lessons learned were expected to be based on the experience in one village only. However, it was felt that a conclusive analysis on a narrow range of activities would be less valuable than a wealth of insights on a wide range of activities.
A further contributing factor to that decision was that the activities were set in place by 22 different IPs who adopted different methods to achieve similar objectives, which added to the complexity of evaluating any particular activity. The village selection ensured that there would be a spread across IPs. At the same time, it was established that there would be no focus on the differential merits of one IP versus another. Rather, the emphasis was on evaluating the main approaches used, rather than the performance of each of the 22 IPs.
However, having made these caveats, we should add that we found that even the ‘breadth-versus-depth’ approach allowed a greater level of depth in the analysis per activity than we had anticipated, as the next section on findings will demonstrate.
Perceived impact It is important to acknowledge that the data collected through the qualitative and quantitative methods were based on villagers’ perceptions of change, given the lack of consistent baseline data across projects, as opposed to a change in objective indicators, such as changes in income levels. This is by no means a limitation to the research, and is in fact the only way to fully understand how LIFT activities were received by the communities.
There was another reason why the estimate of impact needed to be on the basis of perceptions. The Delta region received a support worth about $200 million from various donors after Nargis. The LIFT contribution in 2010 was $19.5 million, and it started after many of the other programmes. Many of the LIFT programme activities had ended in 2010 and were known under different names. Hence, to distinguish the impact of LIFT versus other programmes was a complex task, as far as it was possible in the first place.
Not all activities included Finally, it should be said that not all LIFT activities could be covered. As Figure 2.2 clearly shows, some activities were not analysed at all, while others had a lower priority. For example, of the social protection measures, CfW was only a marginal focus of the evaluation (with a focus on agricultural work on dykes and such like, while excluding disaster risk reduction work). Similarly, no research was conducted on the support for the disabled and elderly or on the conditional cash grants. Moreover, the support to CBOs was a lower-priority focus (analysed in the social mobilisation section of this report), as was the analysis of cash vouchers for inputs.
2.4 Structure of the report
This report has been structured to clearly analyse the success and failures of each of the key LIFT activities selected. It starts with the detail and gradually moves to a more summary perspective.
• The core of the report includes sections on the findings per activity. Each activity has been analysed with respect to purpose, implementation, positive and negative aspects, lessons learned, and impact on income and sustainability. This mainly draws on qualitative findings, with quantitative findings included where relevant.
Livelihoods and Food Security Trust Fund – Delta 1 Evaluation Report
Oxford Policy Management 9
• On the basis of this extensive section, broader lessons with respect to the key evaluation areas of income, food security, sustainability, targeting and accountability are drawn. The research questions outlined above are answered with a summary statement at the end of that section.
• The report ends with a set of ‘lessons learned’ and key recommendations for future LIFT livelihood and food security support activities.

Livelihoods and Food Security Trust Fund – Delta 1 Evaluation Report
Oxford Policy Management 10
Section B: Findings

Livelihoods and Food Security Trust Fund – Delta 1 Evaluation Report
Oxford Policy Management 11
3 Findings by activity
3.1 Introduction
As stated in LIFT’s 2010 Annual Report, its main “purpose is to increase food availability and incomes of 1–1.5 million target beneficiaries”, with “the vast majority of activities ... focused on helping people recover from the damage caused by Cyclone Nargis”.9 As described in Section 2.1, there has been a wide range of activities conducted for this purpose, ranging from training and input provision (often in combination) to CfW programmes. This section looks at these activities one by one.
In order to determine the effectiveness and sustainability of an activity, we refer to definitions by the DAC on effectiveness and sustainability. Effectiveness refers to the question of to what extent an activity attained its objectives and what the main factors and obstacles were in achieving it. Sustainability refers to the question of to what extent the benefits are likely to continue after donor support ceases, and again which factors are relevant in this respect.
With this in mind, for each activity we briefly state the rationale, how it was implemented, and what beneficiaries considered to be positive and negative (i.e. the main reasons that contributed to success or failure). In the next step of the analysis, we try to determine how the negatives could be avoided or mitigated while the positive aspects could be maintained. We put these suggestions forward under the heading ‘lessons learned’.
We conclude each sub-section with a summary overall assessment of the effectiveness of an activity. Effectiveness takes into account perceived usefulness, adoption rate, and impact on income. Changes in food security are closely linked to changes in income. We consider the impact on food security, as far as it adds further insights. In addition, we also venture an educated guess with respect to the question of whether the benefits of the activities are likely to continue after donor funding has been withdrawn (sustainability).
There are many ways to organise the wide range of activities. In this report we have chosen to differentiate between two overlapping target groups that were particularly relevant to LIFT: rice farmers and the poor and vulnerable. We start by focusing on activities specifically targeted at rice farmers, namely training activities and the provision of inputs. We then focus on activities that were primarily targeted at poor and vulnerable households, including the creation of rural employment opportunities, mainly through skills training for IGAs, revolving funds10 and SHGs, and CfW programmes.11
3.2 Training in agricultural techniques – training methods
3.2.1 Introduction
All Delta 1 IPs involved in supporting agricultural production provided agricultural advice and training in one way or another. FFSs and farmer extension groups were the most common methods, though other approaches were also used.
9 LIFT 2010 Annual Report, p. iii. 10 Revolving funds were equally available for rice farmers, it should be added. 11 Although CfW programmes were not a focus of this study.

Livelihoods and Food Security Trust Fund – Delta 1 Evaluation Report
Oxford Policy Management 12
Within the training, which ranged from well-structured and regular weekly sessions to occasional events, a set of more or less standard topics was addressed. The most frequent topics included transplanting, fertiliser use, seed treatment, pest management, and soil treatment.
In assessing the success of these training, it is extremely important to distinguish between the method and the content. For example, the training could have been engaging and the farmers enthused to adopt a method, only to find that the method would not work on their particular soil. Alternatively, the technique may have been more widely adopted if it had been communicated more effectively. In the next section we first look at the various training methods and then at the content (technologies and practices promoted).
3.2.2 Training methods
Overall, it was hard to trace back the individual effectiveness of specific training methods or different ‘intensity’ of training, as results were mixed. However, FGDs and KIIs highlighted some of the main determinants of training success . Training was more likely to be successful when it was:
• very practical;
• linked to a demonstration plot (proving effectiveness);
• frequent and interactive (building trust), e.g. weekly training or contact in town;
• linked with MAS and other government agricultural extension activities;
• tailored to local conditions (trainers had some knowledge of local constraints, etc.), and when agronomic training was linked to economic training, and took into account:
o local labour markets; o soil conditions; o land ownership and land types; o local access to markets and agri-inputs, etc.
• systematic in spreading of knowledge (i.e. FFS or where participants were organised to spread knowledge through Farmer Exchange Groups);
• conducted in a dedicated building (e.g. FFS school) in a village, which helped ongoing interaction and meetings, and was a place to put posters, etc.
More details on these determinants of training success are provided in Section 5.
While all the points above were expressed by respondents in FGDs, some techniques were so easy to implement and so obviously effective that even very low training intensity resulted in widespread adoption. For example, the salt water seed treatment to separate non-viable seed was considered so simple to teach, cheap and useful in increasing yields that farmers spread it widely.
One of the most successful training methods employed was FFSs, which used a combination of demonstration plots, training of selected farmers in a village, and weekly or bi-weekly meetings with villagers where different techniques were taught. The regularity of the meetings in combination with the practical application seems to have been particularly effective.
A group of male rice farmers described the success and the approach of a FFS vividly:
“We learned a lot from the FFS. We learned new things and practiced new methods… The use of fertiliser, pest management and seed treatment training were given twice a month for six months in 2010. Five farmers were selected to take training at Pya

Livelihoods and Food Security Trust Fund – Delta 1 Evaluation Report
Oxford Policy Management 13
Pone town. They got 3,000 Kyats each for transportation. The VDC selected who should take the training… participants must be permanent dwellers, can read, write well and can share with others. For instance, when there is pest infestation in this village, that person who takes the training must be able to share how to solve this. Fifteen farmers attended that knowledge-sharing training and they also spread it to farmers from nearby villages.”12
Other methods that were adopted by IPs included exchange visits (selected farmers visit other villages and exchange ideas), occasional farmer training (i.e. outside a systematic framework such as an FFS) and Farmer Exchange Groups (which were set up to spread knowledge from FFS to other farmers). While it is difficult to disentangle training methods from training contents, there are still several points that can be said with respect to the various training methods, both in terms of positives and points to consider (see Table 3.1).
Table 3.1 Training methods, positive aspects and po ints to consider
Training methods
Positive aspects Points to consider
FFS • Practical • Time to go into depth and apply, build trust • Participants as role models, ripple effects • Allows for coordination with MAS
• If existed: physical place for meetings (wider benefits)
• Recruitment (only those who are interested and with available time)
• Attendants tend to be young and more educated
• Regular sessions, not always easy to attend
• Not always easy to spread knowledge to others (mistrust)
Exchange visits • See how other people do things • Share those in the community
• High cost
• Some of the lessons learned are not relevant to local conditions
• Recruitment (need ID to travel, etc.)
• Not always easy to spread knowledge to others (mistrust)
Occasional farmer training
• Wider number of people included • More age groups/education levels
• Less practical (shorter time, too many people)
• Less time to build trust and confidence
• People less likely to apply the lessons learned
• Less embedded in community (less easy to spread)
Farmer Exchange Groups
• Good to spread knowledge from FFS to all farmers
• Only worked if well managed • Low incentives to participate
12 Male rice farmers, FFS participants, Zin Baung
Livelihoods and Food Security Trust Fund – Delta 1 Evaluation Report
Oxford Policy Management 14
Box 3.1 Experience of an Agricultural Extension Wor ker, Hnar Hnit Pauk
I was selected to attend the training after a village meeting. The training ran for six consecutive days at Kyun Kalay village, in Bogalay township. An agricultural technician gave lectures, instructions and demonstrations on how to improve the yield. People who attended the training were given an allowance of 3000 Kyats/day, meals, accommodation and tea (three times a day).The training covered how to retain and improve soil condition, how to apply pest- and insect-control methods, how to use fertiliser effectively, and how to use insecticide and weed treatment. In August 2010 and April 2011, I gave training to other farmers and disseminated the knowhow I learned. These training sessions were conducted several times … with a total of 45 participants. Usually they were conducted once a week. So far I think I have disseminated my knowledge to over 100 people. I even received 3,000 Kyats/day as an honorarium. Training on how to recognise and defeat insect-infested plants, and on when and how to feed fertiliser, was very useful for the farmers. However, due to a lack of sufficient cash about 14–18 famers out of 47 could not apply the newly gained knowledge on the proper usage of fertilisers and insecticide. About two months ago, disease and sand flies affected the farms. We quickly responded by spraying the insecticide. In the past we did not know how to react; what we did was chop off infected plants and pile them up, so the loss was huge. 75% of the farmers had knowledge on how to respond appropriately, but the remaining 25% do not know much about pest control. I helped one or two people spray insecticide but I did not receive goods or fees for that service. I think we still don’t have sufficient knowledge in farming... I have shared my knowledge in the village whenever I found a group of four or five people. I talked with them and told them about rice plantation methods, cultivation of other plants and fruits…
3.3 Training in agricultural techniques – content
This section covers the various agricultural training sessions in turn. Each training session had the purpose to improve farming. The sub-sections explore to what extent the agricultural methods taught were useful, adopted, led to an increase in income, and were perceived to be sustainable.
3.3.1 Transplanting
Transplanting is a method that can achieve higher yields. Rice seeds are first planted in a seed bed or nursery and subsequently transplanted as young seedlings in rows in the field, ensuring an equal and regular distribution of plants
This contrasts with the method of broadcasting, which is common in the Delta. Broadcasting results in uneven plant establishment (some places too dense and others too sparse). In many cases, broadcasting does not provide seedlings sufficient space to grow well. It also uses large amounts of seed. Transplanting allows the selection of healthy evenly-sized seedlings and optimal spacing for plant growth. Planting in rows also allows weeding and better root aeration. Hence, transplanting generally leads to higher yields in comparison to broadcasting.
Accordingly, the purpose of the training was to encourage farmers to use this technique and thereby increase their yields, income, and food security.
Transplanting techniques were taught in almost all of the training in the study villages. Of the 800 households interviewed as part of the quantitative survey, 40% lived in villages where transplanting training was conducted (making it one of the most widespread LIFT activities). Thirty-eight

Livelihoods and Food Security Trust Fund – Delta 1 Evaluation Report
Oxford Policy Management 15
households (5%) stated that they participated in or benefitted from transplanting training.13 With respect to the question of whether survey respondents felt that participation in the training helped to increase household income, a lower proportion than for most other activities agreed (see Annex C, Table D.2).
The method was adopted by some farmers, and some reported a subsequent increase in yield and the prospects of sustainability. However, other farmers opposed it, sometimes strongly. The motivations for both behaviours are given below. Overall, the results with respect to adoption, increase in income, and sustainability were mixed.
Positive aspects There was an almost universal expectation that transplanting would lead to an increase in yield , due to a better use of the available space . In one village it did increase the yield among those farmers who did adopt it (partly those who had provided their land for demonstration plots). There was also the experience in at least one village that costs were reduced (both for seeds and fertiliser). As several female rice farmers put it:
“The transplanting method is the most excellent one. After having seen the demonstration plots, I tested this transplanting method on 0.70 acres of my own paddy fields this year. I called everyone who went across my tested field, and then showed and told them how good this field and transplanting method have been. This method saved about 50% of seeds, the growth rate was very good, and a lot of small branches (tillers) were produced if fertiliser could be added whenever necessary. Thus, the yield can be increased.” 14
Negative aspects Most farmers, however, were concerned about the higher labour costs associated with transplanting, which was an important issue. Some farmers felt that it was only affordable for large farmers and reported the fact that most casual labourers were not familiar with the technique, which would again lead to higher labour costs. Farmers also worried that more fertiliser would be needed:
“Patience and skill are necessary for transplanting. Most local casual workers are not familiar with the transplanting method and do not want to use it. Therefore, rice farmers have to pay higher wages than normal.”15
In many cases, the results suggest that the balance between expected higher yields and expected higher labour costs was such that many farmers did not implement transplanting (or at least did so only on small areas of their plot). Moreover, the techniques used on the demonstration plots were not always easily transferable to other fields beca use of different conditions . Farmers argued that transplanting does not work well on lower ground subject to flooding.16 For example, a group of rice farmers explained:
“Paddy seeds and soil management were useful, but we always use the broadcasting method. The transplanting method was not useful because our soil is soft. Some
13 In other words 40% had an opportunity to participate, as they live in villages where the training was conducted, while 5% of households did indeed participate or benefit. 14 Female rice farmers, Kant Ba Lar Su 15 Male rice farmers, Kant Ba Lar Su 16 This was the explanation given by the MSR supervisors during the presentation to UNOPS on 1 February 2012.

Livelihoods and Food Security Trust Fund – Delta 1 Evaluation Report
Oxford Policy Management 16
farmers tested this method and the paddy plants died because the soil was very soft.”17
Note that transplanting is ideally taught in conjunction with water management. In the Delta area this was not the case, meaning that the effectiveness of transplanting was possibly reduced.
Lessons learned The cost considerations for transplanting are important, and it may be useful to integrate an element of a simple cost–benefit analysis into the training. Transplanting training could include an exercise around costs and expected income . This may help both the farmers and the trainers better understand the real and perceived constraints to implementation.
Questions as to whether the transplanting can work in the soil conditions encountered in the village in question could also be integrated more into the training.
Overall assessment Overall, the success of transplanting was mixed, with only some farmers using it. Many did not adopt the new method, partly due to considerations around the soil type and partly due to the expectation that higher labour costs would outweigh higher yields.
Table 3.2 Overall assessment – transplanting
Dimension Result
Usefulness of learning about the technique
Generally seen as useful and leading to higher yields (if it was affordable and feasible)
Adoption rate of the technique Mixed. Adopted by some, opposed by most, since higher labour costs were expected to outweigh higher yields; also subject to soil conditions. Some only on small part of their land (e.g. 1 acre)
Increase in income as a result of using the technique
When adopted, higher yields (as expected)
Sustainability If adopted, sustainable (once farmers learned the technique they could use the method again)
Number of FGDs and KIIs Nine FGDs and three KIIs
3.3.2 Fertiliser
The purpose of fertiliser training was to improve the use of inorganic fertilisers (amount, type, and timing) and to show how to produce organic fertiliser, both with the objective of increasing yields in the process.
In the study villages, we found that fertiliser training was provided in different forms, partly in the context of other agricultural training and partly (though less often) in the context of fertiliser provision.
17 Male rice farmers, Kha Yu Chaung

Livelihoods and Food Security Trust Fund – Delta 1 Evaluation Report
Oxford Policy Management 17
According to the quantitative survey, 44% of households lived in villages where fertiliser training was conducted, making it one of the most widely spread activities, and 5% of all households (43 of 800) stated that they participated.18
The quantitative results combine inorganic and organic fertiliser training. However, for the subsequent discussion, it is important to distinguish between organic and inorganic fertiliser.
3.3.2.1 Organic fertiliser Organic fertiliser can be produced by villagers themselves, using animal faeces and straw as key ingredients. In cases where the animals are roaming freely, the collection of faeces may be time consuming. Moreover, the very production process takes time in itself.
The training in the use of organic fertiliser was only discussed in three of the 16 villages visited. Overall, findings show that adoption rates were mixed, both across villages and within villages.19 However, where the method was adopted, it was also shared with others, thereby increasing the chances of achieving sustainability.
Positive aspects Farmers considered organic fertiliser to be “good for the yield.”20 However, it was often mixed with inorganic fertiliser, and hence the effect of organic fertiliser alone is difficult to establish. For example, rice farmers in Ma Gu Ywar Ma stated the following:
“Now, we know that yield production increased when we use organic fertiliser and inorganic fertiliser together….”21
A reason for adoption was the realisation that something valueless can become valuable .
“In the past, duck faeces and buffalo faeces were not useful for us. Now, these faeces are very useful for us to make organic fertiliser. We gradually trained other farmers so as to share this knowledge…” 22
Moreover, the positive effects in terms of preventing soil degradation were stated, even though this did not mean the method was adopted. A group of female rice farmers in Hnar Nit Pauk made this point:
“Organic fertiliser is better than inorganic fertiliser because soil becomes degraded if inorganic fertiliser is used every year. (…) organic fertiliser is good for both the long term and the short term.”23
18 Subsequent discussions highlighted that a distinction between ‘participating’ and ‘benefitting’ is useful, but this distinction had not yet been made in the household questionnaire. Respondents were asked whether they ‘benefitted’ from an activity.
The household questionnaire poses the following question to introduce the topic: ‘We know that in this community the following activities were supported by [Name of IP] under the [Programme name]. Has anyone in your household benefitted from any of the following activities?’ (question B1). 19 One focus group reported that it had adopted organic fertiliser, another reported that it had not, and two more stated that some members had adopted the use of organic fertilisers and others had not. 20 Male rice farmers, Ma Gu Ywar Ma 21 Male rice farmers, FFS participants, Ma Gu Ywar Ma 22 Male rice farmers, FFS participants, Ma Gu Ywar Ma 23 Female rice farmers, Hnar Nit Pauk, Bogale
Livelihoods and Food Security Trust Fund – Delta 1 Evaluation Report
Oxford Policy Management 18
Negative aspects and aspects that can be improved Adoption was hampered when supply of raw materials was scarce (especially given the reduced number of buffaloes and cows after Nargis). The time to prepare the fertiliser was also often considered too long (e.g. the need to collect faeces of free-roaming animals and the time it takes to produce) and the process too complex. Rice farmers in Hnar Nit Pauk stated the following:
“Although we know the advantages of organic fertiliser, we use inorganic fertiliser because the conversion from straw and faeces of cows and buffaloes to fertiliser takes a lot of time…”24
Furthermore, as a male key informant from a local authority explained:
“It takes time. If farmers waited till the time when the straws and faeces of buffalos were converted into natural fertiliser, farmers could not cultivate paddy in time.”25
Importantly, respondents had problems producing enough for all their fields, meaning they often used it only on parts of their fields. Also, in one village respondents claimed they needed a ‘liquid input’ (referred to as an ‘Effective Microorganism’) that was difficult to obtain locally .
While the environmental argument (prevention of soil degradation) was understood, it was not sufficient to induce behaviour change.
Lessons learned Regarding the provision of organic fertiliser training, a few key lessons learned and recommendations emerged. Overall, the success of organic fertiliser training was mixed, with some farmers adopting it and others not. As stated above, the environmental argument is insufficient to induce behaviour change.
In order to provide the necessary inputs, there is a case for creating an easily accessible market for agri-inputs (e.g. make the ‘Effective Microorganism’ liquid more easily available).
It will also be useful to include in training (if not there already) exercises around the following:
• How much effort (e.g. time, sourcing inputs) it will take to produce organic fertiliser in a particular village context. For example, this may depend on animal husbandry (whether animals are roaming free ); and
• The relative advantages and disadvantages of organic versus inorganic fertiliser.
24 Male rice farmers, Hnar Nit Pauk, Bogale 25 Male key informant, Ku Lar Ohn Pin Su

Livelihoods and Food Security Trust Fund – Delta 1 Evaluation Report
Oxford Policy Management 19
Table 3.3 Overall assessment – organic fertiliser t raining
Dimension Result
Usefulness of training Useful (cost saving, increases yield, sustainable)
Adoption rate of the technique Mixed because of some constraints (process takes time, sometimes necessary ingredients such as Effective Microorganism liquid not available, etc.)
Increase in income as a result of using the technique
Those who used it experienced increased yield
Sustainability Where it was adopted, farmers shared knowledge with others
Number of FGDs and KIIs Seven FGDs and two KIIs
3.3.3 Inorganic fertiliser
Training with respect to inorganic fertiliser was mostly given during FFSs and using demonstration plots.26 This is in contrast to situations where fertiliser was provided to farmers and a session with instructions was given.
Positive aspects In some villages, respondents felt that the training made a significant impact. They learned how to utilise fertiliser more effectively, which in turn led to an increase in yield :
“Fertiliser helps better growth and higher yields… We learned a lot from the training. We use the technique taught and our seedlings are strong and have a good growth rate and higher yields… Previously, we didn’t properly use it and wasted it… Now, we use just the right amount and can reduce waste and cost…”27
“Previously the yield per acre was 70 baskets and now it is 100 baskets.”28
Negative aspects However, some villagers felt that the training did not add much to the knowledge they had already. They also raised concerns around costs:
“We know how to utilise fertiliser and the training is not very different from what we already know.” “Not much difference because we already know how to use fertiliser for a long time… It’s just that we can’t afford to use it…”29
Finally, a group of rice farmers and FFS participants in Kwin Wyne stated that fertiliser use depends on the type of soil . They explained that what is taught in the training cannot always be
26 Based on the recollection of MSR supervisors during the presentation at UNOPS on 1 February 2012. 27 Male rice farmers, Zin Baung 28 Mixed (male and female) rice farmers, Bonlon Chaung 29 Mixed (male and female) rice farmers, Kyaung Su

Livelihoods and Food Security Trust Fund – Delta 1 Evaluation Report
Oxford Policy Management 20
applied as it depends on the type of land. The farmers state that the difficulty was the ‘lack of a tester to test soil’, presumably referring to the lack of analysis services to test soil nutrient levels.
With respect to sustainability, some farmers in Bonlon Chaung stated that they will use the method that they were trained in in the future:
“We will continue to use the fertiliser. This is the best method.”30 The same group also stated that the use of the fertiliser method also lowered production costs and reduced waste. With the use of this method, less fertiliser was needed. The group therefore felt that more income was generated with the use of this method. This may explain why they considered it the ‘best method’.
Lessons learned The training needs to take local knowledge, affordability and soil condit ions into account, e.g. if farmers can only afford X amount of fertiliser, then the question is “what is the best fertiliser to use, when is it best to apply it, and how?”
Overall assessment Inorganic fertiliser increased yields but was often seen as too costly. Importantly, farmers who had been trained well reported that their use of fertiliser had actually decreased, as they now know when and how to use it.
Table 3.4 Overall assessment – inorganic fertiliser
Dimension Result
Usefulness of learning about the technique
Mixed – some people found that they did not learn anything new
Adoption rate of the technique Mixed – in many cases costs were too high (unless fertiliser was provided with training, which it rarely was)
Increase in income as a result of using the technique
Yield went up where inorganic fertiliser was used
Sustainability Limited information: only known in one village, who stated that they want to use it in the future
Number of FGDs and KIIs Five FGDs and six KIIs
3.3.4 Salt water seed selection
The purpose of the salt water seed selection process was to improve the germination of seeds. The seed selection technique was a very simple method to distinguish between ‘good’ seeds and ‘bad’ seeds by immersing them in a salt water solution and discarding those that floated.
Like fertiliser and transplanting training, seed treatment was one of the most widely spread LIFT training topics, with 41% of all households living in villages where the training was conducted.
30 Mixed (male and female) rice farmers on the farmer committee, Bonlon Chaung, Kyaiklat

Livelihoods and Food Security Trust Fund – Delta 1 Evaluation Report
Oxford Policy Management 21
Forty-two respondents (5%) stated that they or a member of their households participated in the training.31
Positive aspects Seed selection methods were taught in many villages and were widely adopted .32 The feedback from farmers was very positive, as it often led to higher yields, lower costs and higher income. It was considered to be simple, cheap, and easy to teach to other farmers. The following quote is representative of many others on the topic:
“We can get purified paddy seeds by using the seed treatment method. By cultivating these purified paddy seeds we need less fertiliser, but the growth rate of the paddy plants increases and then yield increases. Thus, our income also increases… When we cultivate paddies without using the seed treatment method, we need about five baskets of paddy seed per acre. If we use the method, we need about three baskets of paddy seeds per acre. It is not necessary to throw away the poor quality seeds that are by-products of the seed treatment method. These poor quality seeds can be consumed for food…”33
In addition, the higher quality seeds and resulting plants are considered to be more resistant to pests and more resilient to flooding:
“The seed treatment method can be applied practically and it produces quality seeds which resist pests and bad weather, as well as producing more paddy plants and boosting the paddy yield accordingly. The yield is higher by 10 to 15 baskets of paddy per acre. Production costs are also lower with the use of this method, so 50% of the village households use this method.”34
Many FGDs reported that the method has helped to increase yields :
“I think the method boosts the yield of paddy… The increase is about 25%”35
Generally, it has also led to widespread change in farmers’ practice :
“Now we focus on the quality of the seeds and get better yields.”36
The method was so successful that even farmers not originally trained were reportedly using it:
“All seeds germinate successfully, and we get a faster growth rate because of quality seeds. Seeing those who use this seed treatment, we all have decided to use that technique later. It pays off with a higher yields, better germination, and resistance to
31 Of those, most (81% or 34) felt that it had increased their income, which is a lower proportion than from other activities. A similar proportion (81% or 33) felt that it improved their households’ food security. These proportions need to be considered relative to the results for other activities (see Table D.2)
32In the focus groups there are often statements with respect to seed treatment such as “half use it”, “all” use it, untrained people use it, etc. 33 Male rice farmers, Bogale 34 Mixed (male and female) rice farmers on the farmer committee; Bonlon Chaung, Kyaiklat 35 Mixed (male and female) rice farmers, FFS participants/Farmer extension group training participants, Kwin Wyne, Pyapon 36 Male rice farmers, FFS participants, Ma Gu Ywar Ma, Bogale

Livelihoods and Food Security Trust Fund – Delta 1 Evaluation Report
Oxford Policy Management 22
extreme weather. It can produce 20 more baskets per acre compared to what we usually do.”37
Negative aspects Larger landowners from one FGD in one village thought that it would lead to an improvement but that only small farmers could use it and they could not afford the effort:
“Seed treatments can only be used by small farmers. Big farmers have to buy huge amounts of seeds and salt. Only one-third of the seeds are left if we use the seed treatment. We know that it will be better, but we can't afford to use it”.38
In another village, the perception was the opposite, i.e. that only large farmers could use it. In effect, the farmers still needed to see proof that it worked:
“This method is not used yet since it requires more work, and we have not witnessed yet the success of using this method and don’t want to incur any cost. Only large-scale farmers are able to do it.”39
Finally, one training session did not work due to the selection of participants. According to a group of male rice farmers in Kyun Nyo Gyi who did not participate in a FFS, two women had been selected for the training who were not knowledgeable enough about rice farming to share what they had learned.40 Therefore, the training was not perceived to have been useful.
An expectation of sustainability was stated in various villages. For example:
“The use of this method will be sustainable because it has more advantages than disadvantages.”41
Summary and lessons learned There is an overwhelming sense, on the basis of feedback from nine of the 12 FGDs that covered seed treatment, that the seed treatment method was successful and changed behaviour. It is simple, cheap and easy to learn. It increased yields and reduced costs.
In one FGD, participants would have liked practical proof before adopting the technique.
Looking forward, however, the question is whether more training on this topic will be as effective because the technique has spread widely and seed quality has now been increasing.
37 Male rice farmers, Farmer Extension Group participants, Zin Baung, Pyapon 38 Male rice farmers who did not participate in FFS/farmer extension, Zin Baung, Pyapon 39 Male rice farmers, Kyun Nyo Gyi 40 The reason for their selection is not known, but sometimes people were selected who had time. Male rice farmers who did not participate in a FFS, Kyun Nyo Gyi 41 Mixed (male and female) rice farmers, FFS participants/Farmer extension group training participants, Kwin Wyne, Pyapon

Livelihoods and Food Security Trust Fund – Delta 1 Evaluation Report
Oxford Policy Management 23
Table 3.5 Overall assessment – seed treatment
Dimension Result
Usefulness of learning about the technique
Widely seen as useful; helps to select viable seeds for planting which in turn reduces need for fertiliser and further seeds. It improves yield. Many use it since it is simple, cheap and easy to learn
Adoption rate of the technique Widely adopted
Increase in income as a result of using the technique
Increased yields through purified seeds; fewer seeds required
Sustainability Farmers want to continue to use it, and are happy to share knowledge
Number of FGDs and KIIs 12 FGDs and five KIIs
3.3.5 Pest management
There is a general expectation that pest management will help to increase yields since pest damage to crops can be contained. The training on this topic was widely considered to have been useful and sessions appear to have been widespread.42
Positive aspects These training sessions were sometimes considered to be among the most useful . In three villages it was listed as one of the two most relevant sessions, expected to increase yield by protecting crops . One of these villages was Kyaung Su, where villagers learned to use less pesticide in a more targeted way :
“We didn't used to distinguish between friendly pests and bad pests. We used to think they were all bad and spray them with a lot of pesticide. Now we can distinguish, we don't waste pesticide and use the right type.”
“… now, people even come to us to show us their pests.”43
The training covered how to distinguish pest types and which pesticide was suitable to be applied to which kind of pest. Non-participants of the training reported that the trained villagers were helpful to the rest of the villagers :
“When there is a pest infestation, I can go ask those who took the training and they can suggest what pest killer I should use… So, it's very useful for us since we can save cost, save work force and can kill pests on time… We can ask many times… We learned a lot from them and improved our knowledge, so we could increase our income... This is the benefit of the training... When we see pests in our field, we go and check the pest-management poster in the FFS.”44
42 Quantitative results are not available with respect to pest management. However, it has been the training covered in the largest number of focus groups (18) during the study. 43Mixed (male and female) rice farmers, FFS participants, Kyaung Su, Bogale 44 Female rice farmers who did not participate in FFS, Kyaung Su, Bogale

Livelihoods and Food Security Trust Fund – Delta 1 Evaluation Report
Oxford Policy Management 24
Negative aspects There were hardly any negative comments with respect to pest management, apart from one village where knowledge was not spread. However, it should also been said that adoption rates were difficult to establish, especially in the absence of a pest outbreak.
Sustainability can be increased by spreading knowledge. Male rice farmers in Kant Ba Lar Su and Bonlon Chaung explained:
“If paddy fields suffer from pests, we can ask the man who attended the training about that. Almost every farmer has asked him what kind of pesticide should be used. He always explains whenever he is asked. If some farmers were not able to decide what kinds of pest and what kind of pesticide should be used for particular pests, he helped them after going and seeing their paddy fields…”45
“The training was even useful for those not trained… I ask the trained villager how to manage pests… he explains to me… I will apply the knowledge for this year’s winter crop.”46
Lessons learned The pest-management training was most effective when farmers had a ‘contact point’ in the village (which the training helped to provide). In addition, it would be useful if there were a contact point in a nearby town (e.g. MAS), who could be asked to identify pests that the village contact point cannot.
An interesting aspect of the pest-management training also regarded its ‘catalyst-like’ effect in increasing the credibility of trainees. When villagers turn to those trained and benefit from the advice, it also enhances the standing of those trained, as well as the chances of their agricultural advice being taken seriously. In one village, an FFS participant experienced an increase in status when other farmers realised he could distinguish between different types of crop pests and identify the most appropriate pesticide. As he explained, once he had gained villagers’ trust this way he was also more likely to be listened to with respect to other methods. Thus, training on a specific, relevant issue (such as pesticide training) served as a way to establish trust that could help with the spreading of other techniques.
Overall assessment The pest-management training was widely seen to be useful. It helped to distinguish between different types of pest, use pesticides more effectively and save crops (and hence increase income). In several villages, the knowledge was spread and the training on this was seen as some of the most useful.
Table 3.6 Overall assessment – pest management
Dimension Result
Usefulness of learning about the technique
Widely seen as useful, helps to distinguish between pests, leads to more targeted use of pesticides, helps to save crops, knowledge often shared
45 Male rice farmers, Kant Ba Lar Su, Bogale 46 Male rice farmers, Bonlon Chaung, Kyaiklat

Livelihoods and Food Security Trust Fund – Delta 1 Evaluation Report
Oxford Policy Management 25
Dimension Result
Adoption rate of the technique Adopted in some villages. Adoption in others not clear, as there may not have been any pests
Increase in income as a result of using the technique
Regarded as helping to save crops and reduce use of pesticides (previously they used to try different kinds by chance)
Sustainability Sustainable, since people think that it can be applied at a later stage. Sustainability can be improved if knowledge is spread
Number of FGDs and KIIs 18 FGDs and two KIIs
3.3.6 Soil management
Purpose and implementation Training was provided with the particular aim of helping farmers assess and manage the acidity of their soil, especially following the penetration of saline water. Decreasing the acidity of soils can be achieved by adding lime.
Positive aspects In those villages where soil-management training was discussed, it was seen as being useful in terms of solving problems related to soil acidity. Some rice farmers mentioned the soil treatment training as one of the two training sessions that were particularly relevant:
“Soil management had the most impact because farmers often provide feeding for the plants but not the soil!”47
“As we did not know clearly why the soil in our paddy field was sour, we never took any action about that. Now, we can prevent the soil from being sour and therefore pests cannot easily enter our paddy field when we add limestone powder...”48
“By using the soil-management method, we were able to prevent the soil from going sour and so soil degradation has reduced. As a result, paddy plants grew well, yield increased, and then income increased.”49
Farmers in Hnar Nit Pauk followed the method learned at the training and witnessed an increase in yield:
“We had never known how to reduce soil degradation. Now we know and have followed the techniques learned in the training. Thus, soil became relieved from being degraded and pests could not easily enter. Then, yield increased.”50
Negative aspects Although the training was seen as useful, the costs of soil-management techniques (e.g. applying lime) were seen either as too high or only affordable by some. A group of rice farmers stated that 47Male rice farmers, FFS participants, Ma Gu Ywar Ma, Bogale 48 Male rice farmers, Ma Gu Ywar Ma, Bogale 49 Female rice farmers, Ku Lar Ohn Pin Su, Bogale 50 Female rice farmers, Hnar Nit Pauk, Bogale

Livelihoods and Food Security Trust Fund – Delta 1 Evaluation Report
Oxford Policy Management 26
they could not afford to buy lime powder and that soil management was useful only for those farmers who could:
“Although we know this method is good, we cannot afford to use this method because of the high cost.”51
However, while the high costs were mentioned in Ku Lar Ohn Pin Su and Hnar Nit Pauk, these villages also reported higher incomes as a result of using the technique.52 In other words, despite the high costs the technique can nevertheless be adopted.
The knowledge learned was expected to remain and be spread. In this sense, the benefits from the training can be considered to be sustainable, as farmers are likely to apply the lessons learned from the training in the future:
“Yes, the knowledge will stay and word has got round – I attended the training and shared knowledge with my relatives, so the whole community will be soon be affected.”53
In short, the training was considered to have changed the way farmers do things.
Lessons learned Local conditions need to be taken into account at the training phase, e.g. sometimes the costs for lime/gypsum are too high for villagers Table 3.7 Overall assessment – soil treatment
Dimension Result
Usefulness of learning about the technique
Widely seen as useful, helps to prevent soil degradation; in one case it was considered as one of the most useful training sessions
Adoption rate of the technique
Adopted in some villages. High costs for lime/gypsum prevented adoption in one village and were mentioned as a concern in two more villages, even though the techniques were adopted
Increase in income as a result of using the technique
In at least one village, a direct link between the technique and higher yields was made
Sustainability Sustainable (provided costs are affordable), as knowledge can be applied in the future
Number of FGDs and KIIs Eight FGDs across four villages and one KII
51 Male rice farmers, Ku Lar Ohn Pin Su, Bogale 52 ‘And the yield increased’ (female rice farmers, Hnar Nit Pauk); ‘and the income increased’ (female rice farmers, Ku Lar Ohn Pin Su). 53 Male rice farmers, FFS participants, Ma Gu Ywar Ma, Bogale

Livelihoods and Food Security Trust Fund – Delta 1 Evaluation Report
Oxford Policy Management 27
3.4 Impact of inputs for farmers
3.4.1 Introduction
Agriculture is the main economic activity in the Delta, supporting the livelihoods of both landowners and landless households. For this reason, LIFT activities maintained a central focus on ensuring economic growth in the agricultural sector, in particular for the production of rice, “which accounts for the large majority of both total crop output and daily caloric intake of local people.”54
Given that agricultural inputs and productive assets were significantly destroyed during Cyclone Nargis, one of LIFT’s key focuses (also known as ‘Output 1, Direct Agricultural Production Support’) was the provision of agricultural inputs for farmers. In the envisaged theory of change, this would not only sustain the production of paddies and increase yield, but also indirectly support the livelihoods of causal labourers through ripple effects (most importantly, an increased demand for labour).
Below, some of the main agricultural inputs provided through LIFT are reviewed. It should be noted that this report focuses on the positive and negative aspects of each individual ‘input’, including discussions on how the mode of provision (direct or through cash grants or vouchers) affected outcomes (see also Section 3.8).
3.4.2 Tilling capacity
As farmers’ tillage capacity was greatly reduced after Nargis, the provision of buffaloes and power tillers (modern hand tractors) was an extremely common activity among LIFT IPs.55 The rationale behind this is that, as rice farmers have only a very short interval (3–4 weeks) between the monsoon paddy and summer paddy, they “need to finish land preparation in time to meet their sowing and harvesting schedules” (LIFT Annual Report, 2010). The following paragraphs analyse the advantages and limitations of each, offering beneficiaries’ perspectives on how these inputs affected their incomes and livelihoods.
3.4.2.1 Buffaloes According to the LIFT Annual Report 2010, a total of 2,610 buffaloes were provided to 1,195 farmers in 146 villages.
The quantitative survey shows that 17% of all households lived in villages where buffaloes were provided and 2% of all households benefitted from the provision of buffaloes, according to the quantitative survey (n=15 of N=800). Almost all of those (n=14) felt that the provision of buffaloes helped to increase their income and food security.
The criteria for receiving buffaloes were not necessarily uniform across the study villages, although in most cases it was smaller farmers who were selected. In Kha Yu Chaung (Bogale), for example, 16 farmers were chosen with the agreement of the community and the criteria included having a household registration card, owning a paddy field but no buffaloes, and not having received anything from other NGOs.
54 LIFT 2010 report 55 So much so, that the provision of buffaloes accounted for 28% of the budget costs under LIFT’s Output 1.

Livelihoods and Food Security Trust Fund – Delta 1 Evaluation Report
Oxford Policy Management 28
The mode of provision of the buffaloes also differed across villages, with some being provided through buffalo banks56 or groups,57 others using vouchers, and others providing buffaloes directly to selected individuals.
Positive aspects The vast majority of respondents who had received buffaloes through LIFT were satisfied with the provision, which they found extremely relevant,58 in many cases because the buffaloes replaced livestock that had been killed during Nargis.59
Since their livestock had been killed, farmers had been renting buffaloes to complete the tilling of their land. It is therefore unsurprising that the most quoted positive aspect of receiving buffaloes was the fact that farmers no longer had to rent , thus reducing their cultivation costs significantly . An interesting corollary of this change was the fact that farmers could also cultivate their fields on time (within the ‘tilling window’), not having to wait for other farmers before they could rent buffaloes:
“If buffaloes were not given, we would still have to hire from others with rental prices. Thus, not only would the cost of cultivation be very high, we also wouldn’t be able to complete the tillage in time. (…) The rental price ranged from 60 baskets of paddy to 80 baskets of paddy according to the size of the buffalo…”60
“It used to be very difficult to rent buffaloes from others after Nargis. We had to borrow baskets of paddy at high interest rates if we did not have paddy in our hands… Moreover, the buffalo owners living in the upper place did not want to hire their buffaloes to the farmers living in the lower place because they were worried that their buffaloes might encounter the danger of another cyclone.”61
Importantly, one of the key reasons why the provision of buffaloes was also considered extremely useful was the fact that these could be used to increase farmers’ incomes . This was perceived to happen through four main channels: higher yields (due to timely cultivation); increased area use (using livestock allowed to till more land); the breeding of young buffaloes , and no longer having to rent :
“Previously we had to rent buffaloes… We could hire buffaloes only after other farmers were done with their cultivation and that caused late cultivation… Now we possess a buffalo and can cultivate in time and consequently waste less paddy… and get higher yields.”62
56 In Kha Yu Chaung, for example, after one year the 16 selected farmers had to pay 70 baskets of paddy seed to another 16 farmers to buy new buffaloes. 57 In Pho Khwe Gyi (Labutta), farmers without buffaloes who owned less than 10 acres received cash vouchers to buy buffaloes. Four buffalo groups were formed and each group consisted of five members, receiving two buffaloes, one male and one female. Each group member could utilise the buffalo in turn. The first farmer who used the buffalo had to save 50 baskets of paddy as a group fund and the rest had to save 10 baskets each. After a year, the saved paddy in the group was sold and a buffalo was bought for the group. Now, almost all members possess a buffalo, so it was felt this method was useful and sustainable. 58 Note that this was also highlighted by the IP evaluation reports. 59 The LWF evaluation report, for example, estimates that “about 2000 pairs of buffaloes are needed to cultivate the 20,000 acres in the area. Very few buffaloes survived the cyclone in this area. Only a fraction of these have been replaced by farmers themselves or other agencies”. 60 Male rice farmers, Kha Yu Chaung, Bogale 61 Female rice farmers, Kha Yu Chaung 62 Male rice farmer belonging to a buffalo bank, Pho Khwe Gyi, Labutta

Livelihoods and Food Security Trust Fund – Delta 1 Evaluation Report
Oxford Policy Management 29
“Buffaloes and power tillers benefit farmers; they till on bigger lands and production increases.”63
“Moreover, buffaloes can breed and thus we can get extra income by renting young buffaloes to others…”64
An indirect effect on incomes was also seen by those who could not afford debt, in that they could avoid loans at exorbitant interest rates:
“Before, small farmers who owned less than 10 acres had to take loans from large farmers from other villages and had to give back rights after harvesting… We took loans out in the cultivation period, gave back the debt in the harvesting period and kept in the debt cycle… Now, having buffaloes, we don’t need to take large loans… Just small loans and thus we have less burden of interest.”65
Incidentally, the sustainability of the provision of buffaloes was flagged by several respondents, who pointed out that “buffaloes can be sustainable because they can breed and are a must for paddy cultivation. They are even better than power tillers: they multiply in number in years.”66 This was seen to be particularly the case when village members had been trained as livestock extension workers or basic vets (see Section Error! Reference source not found. for details).
Negative aspects Hardly any negative comments were made on the provision of buffaloes, testifying to their overall success. The only exception regarded a couple of issues with the procurement process , specifically for those who had less choice over what type and where to purchase the buffaloes. In Htin Pon Kwin (Labutta), for example, beneficiaries were given vouchers to purchase their buffaloes that they could only redeem in one shop:
“Farmers had to go and buy buffaloes from a seller designated by [name of IP]; they cannot buy buffaloes from other places or persons. If I buy buffaloes in my village I will get three of them, but now I went and bought from the designated person and only got two buffaloes.”
Lessons learned Regarding the provision of buffaloes, a few key lessons learned and recommendations emerged:
• The choice of procurement method affected outcomes. Overall, respondents preferred to have autonomy over the choice and procurement of buffaloes and did not appreciate the use of vouchers as it tied them to a particular vendor who could take advantage by inflating prices. This was confirmed by a couple of the IP evaluations.67
• Pairing the provision of buffaloes with the training of a livestock extension worker or para-vet in the village decreases the chances of livestock disease and facilitates the process of breeding calves, thus increasing sustainability.
63 Male rice farmers, Htin Pon Kwin, Labutta 64 Female rice farmers, Hnar Nit Pauk, Bogale 65 Male rice farmers belonging to a buffalo bank, Pho Khwe Gyi, Labutta 66 Mixed (male and female) rice farmers, Shwe Kyun Thar, Labutta 67 For example, in the LWF evaluation report, it is highlighted that “The community procurement method adopted ensured that the project delivered buffaloes of high quality, low price, and suited to the local area”.

Livelihoods and Food Security Trust Fund – Delta 1 Evaluation Report
Oxford Policy Management 30
Table 3.8 Overall assessment – summary table
Dimension Result
Usefulness Very useful and relevant
Adoption rate All those who were provided with buffaloes or who belonged to buffalo groups and banks used them for tilling their fields
Increase in income Farmers perceived an increase in income (lower cost, higher yields, more land cultivated, sale of offspring)
Sustainability Seen as sustainable (breeding of offspring), especially when vet available
Number of FGDs and KIIs 11 FGDs and eight KIIs
3.4.2.2 Power tillers The targeting of power tillers across the project areas appears to have been fair and geared at supporting smallholders who were most in need, contributing to the effectiveness of the intervention. Different IPs adopted slightly different criteria, but overall it was clear that “small farmers who do not have power tillers”68 were primarily targeted.69 For example, in many villages only farmers with less than 10 or 7 acres were selected to belong to the power-tiller groups, providing that they did not own any buffaloes.
As with the targeting, the distribution of power tillers was relatively uniform across all IPs and project areas. Given the size and worth of the asset, small user groups were formed and most often some form of training was provided to a couple of members from the group (including basic mechanics and maintenance principles).
For example, in Ma Gu Ywar Ma (Bogale), respondents explained that “four small rice farmer groups were formed for each power tiller donated. Each group has about 10 or 13 members who use the power tiller in turn within the group. Each group has its own account, engine driver and mechanic. Moreover, each group collects money from group members for funds for when the power tiller is broken down.” Respondents in Kant Ba Lar Su (Bogale) also stressed the easy functioning of the power-tiller groups, emphasising their longer-term sustainability (as did almost all the other FGDs in the research areas):
“If we use a power tiller run by one bottle of fuel, we need to pay 1,000 Kyats to the group leader. That money is used for the wages of its driver and saved as funds to repair it if necessary… So, the power tiller can be most sustainable because (…) there are funds available for repairing it.”
According to the quantitative survey, 23% of households lived in villages where power tillers had been provided and 3% (n=22) of households stated that they had benefitted from it or participated in the activity.
68 Mixed (male and female) rice farmers, Kyaung Su, Bogale 69 There was one exception in Kha Yu Chaung (Bogale), where “two farmers who have over 50 acres of land” were reported to have received the power tillers.
Livelihoods and Food Security Trust Fund – Delta 1 Evaluation Report
Oxford Policy Management 31
Positive aspects Overall, those who were included in power-tiller groups found the support extremely useful, with many listing power tillers among the activities that had the most positive impact on the village (for example, in Htin Pon Kwin, Labutta). This was for several reasons.
First of all – and cited by almost all farmers who were involved – was the decrease in production costs , as most farmers used to pay higher rental fees for power tillers or buffaloes: “If we hired a power tiller from others, the cost would be about 1,000 Kyats; now, we pay about 600 Kyats to use the power tiller”, a farmer explained in Ma Gu Ywar (Bogale), echoed by many others around the Delta area.
Second of all, it was commonly felt that having access to a power tiller was more efficient than using buffaloes and generally allowed small farmers to till their land in a timely manner , guaranteeing higher yields (as the ‘tilling window’ is not very long). “Small farmers had to wait for large farmers to hire a power tiller before… now, they no longer need to wait, and can complete the work in time and enjoy higher yields”,70 one causal labourer commented. Evidence from other FGDs confirmed this, with many casual labourers and small farmers pointing out that power tillers allow people to “finish work on time and thus have less waste and damage to the seeds, increasing income.”71 As one enthusiastic farmer put it: “in the last five years we took a lot of time per acre using buffaloes... when we got the power tiller after Nargis we could cultivate one acre of paddy field within one hour.”72 Others echoed: “cattle tilling consumes more time, and on top of this farmers need to feed the cattle.”73 Comments from farmers in Htin Pon Kwin (Labutta) also highlighted that having access to a power tiller can increase the chances of farmers being able to grow summer paddy. Importantly, this opinion was confirmed through interviews with key informants in each village and among implementation staff. A Village Authority stated:
“A significant change is seen in farming [because of power tillers]. Farmers can harvest monsoon rice earlier and cultivate the summer paddy earlier. Because of power-tiller support, farming activities were completed one month earlier this year.”74
The third most commonly cited reason why power tillers were very useful, which was brought up during three FGDs in the course of the research, was that they helped farmers cultivate more land . As a small holder concisely explained: “previously, they could only till around 3 acres, but now they till 5 acres… thus, income and rice production are both improving.”75
Negative aspects Nevertheless, rice farmers and casual labourers alike acknowledged the limits of distributing power tillers as part of an emergency aid effort.
The main problem was the appropriateness of the power tillers to the land to be ploughed. In a couple of FGDs, respondents highlighted that “power tillers cannot be used everywhere”, adding that this was especially the case “in very rough farm land” where buffaloes are more appropriate to the terrain” and that “power tillers cannot be sustainable because they become rusted when often used in water”.76 A group of farmers in Kyun Nyo Gyi (Dedaye) explained that those who received the power tiller from LIFT could not use it on some of their acres, needing to rent an extra ‘special 70 Female poor and vulnerable, Kyun Nyo Gy, Dedaye 71 Male poor and vulnerable, Oke Kyut, Bogale 72 Male rice farmers, Ma Gu Ywar Ma, Bogale 73 Male rice farmer, Oke Kyut, Bogale 74 Village Authority, Kyaung Su, Bogale 75 Mixed (male and female) rice farmers, Shwe Kyun Thar, Labutta 76 Male rice farmers, Hnar Nit Pauk, Bogale

Livelihoods and Food Security Trust Fund – Delta 1 Evaluation Report
Oxford Policy Management 32
attachment’ to the tiller for rough terrain. To solve the problem, the village’s farmer committee is now planning to sell off one power tiller and buy this attachment for improved ploughing and for harvesting.77
The second problem, cited by few, was that power tillers only benefitted those who got to participate in the power-tiller groups or were allowed to rent from them, meaning that the positive effects were not that widespread. Interestingly, however, it should be noted that casual labourers generally felt that power tillers were not displacing their jobs and were in fact providing more labour for them because of the increased land use and increased yield.
Lessons learned • Provision of power tillers was most effective when groups were relatively small and
homogenous and when a clear rotation system was decided upon in advance.
• The best results in terms of sustainability were reached in locations where power tillers were provided alongside basic mechanical training78 and indications on how to fund any maintenance.
• The use of power tillers by farmers does not necessarily displace labour for casual labourers because of the increase in land cultivated. However, this possibility should be kept in mind and measures designed to mitigate this if it does occur.
• Not all power tillers are usable in all contexts. Especially on rough terrain, some power tillers may struggle but there are adjustable ‘attachments’ that can be purchased separately at additional costs to help cope with these conditions.
Table 3.9 Overall assessment – power tillers
Dimension Result
Usefulness Very relevant and useful in reducing costs, cultivating more land, and encouraging higher yields
Adoption rate/success rate
All those who were provided with power tillers or who belonged to power-tiller groups used them for tilling their fields
Increase in income Increases income through lower costs, more land area cultivated, and higher yields
Sustainability Depends on ownership and upkeep of the power tiller (including number of people per group and whether maintenance training is provided)
Number of FGDs and KIIs
Nine FGDs and 10 KIIs
3.4.3 Drum seeders
The evidence on drum seeders mostly stems from seven FGDs, but overall there was consensus that the targeting of drum seeders was predominantly focused on those who were interested in using them (and sometimes those who applied to purchase one through a revolving fund). In one
77 Male rice farmers, Kyun Nyo Gyi, Dedaye 78 This was also noted in the IP evaluation reports. For example, the LWF evaluation report states that “the provision in the southern area of training in power tiller repair and fuel and lubricants reduced the running and repair costs of the power tillers and thus optimised the area that could be cultivated”.

Livelihoods and Food Security Trust Fund – Delta 1 Evaluation Report
Oxford Policy Management 33
village, drum seeders were only provided to smaller farmers, though “all farmers got a chance to use them at a cheap rental price.”79
Overall, drum seeders were provided in different ways throughout the study areas. A number of different models of seeders were supplied that varied in width and weight, thus influencing labour input and ability to be used in very wet, soft conditions. There were also various degrees of training and ownership. For those who received one through a revolving fund, for example, there was an obligation to pay back the capital in instalments.80 Nevertheless, some of the complications linked with using a drum seeder (listed below) meant that adoption rates were relatively low, leading respondents to be quite negative about the longer-term sustainability of providing drum seeders as a means to improve the incomes of rice farmers. According to the quantitative survey, 11% of households lived in villages where drum seeders had been provided and 1% (n=11) of all households stated that they had benefitted from it or participated in the activity.
Positive aspects While in many cases farmers stressed that the negative sides of drum seeding outweighed the positive sides, leading to relatively low adoption rates, farmers whose fields were appropriate also reaped significant benefits.
The most important benefit, unsurprisingly, was the fact that drum seeders help to save seeds and therefore reduce costs . A satisfied farmer commented:
“We had never seen and heard about drum seeders. When we use it now, we need about two baskets of paddy seeds per acre while we needed about four or five baskets of paddy seeds when we used the traditional broadcasting method in the past… thus, it saves paddy seeds.”81
Moreover, as farmers in Kyaung Su (Bogale) stressed, “using drum seeders reduces waste ... you also need less fertiliser compared to broadcasting and it is easier and quicker for harvesting [because plants are at a regular distance and less thick].” Nevertheless, they added that “we still don't know the condition of the yield for cultivation with seeders; we guess the yield would be a bit higher with seeders… the paddy looks strong.”
Negative aspects Adoption rates with respect to drum seeders were relatively low, even though respondents appreciated the value of reducing the use of seeds. The reasons for this were varied and were mostly linked to the perceived inappropriateness of the drum seeders provided to local conditions.
As farmers in Ku Lar Ohn Pin Su (Bogale) protested, “farmers who own more land cannot use a drum seeder because it takes more time and needs to be weeded regularly… we cannot use them because they are time consuming and need regular care”. Across all the villages who had received training or were aware of drum seeders, moreover, respondents explained that drum seeders could not be used in the monsoon season and on fields on lower grounds (when the soil is wet and soft). In Kant Ba Lar Su (Bogale), moreover, respondents denounced the type of drum seeder provided, which had very small wheels and was not appropriate for local terrain:
“the drum seeder was not useful for us because its wheels made of iron are very small and it did not work well on the soil. We told [name of IP] about that. However, they did not response to us on this issue.”
79 Female rice farmers, Kant Ba Lar Su, Bogale 80 For example in Ku Lar Ohn Pin Su in Bogale 81 Male rice farmers, Ma Gu Ywar Ma, Bogale

Livelihoods and Food Security Trust Fund – Delta 1 Evaluation Report
Oxford Policy Management 34
Lessons learned • Drum seeders are particularly useful on certain types of terrain (dryer solid and higher
grounds). In some cases, any problems can be solved through small adjustments (e.g. wheel type or different, lighter models of seeder).82
• Adoption rates remain low partly because drum seeders are perceived to take a longer time and their effects on yield are still unclear to respondents.
Overall assessment The overall assessment is mixed, as the table below summarises.
Table 3.10 Overall assessment – drum seeders
Dimension Result
Usefulness Can be useful to reduce costs, but there was a low adoption rate
Adoption rate/ success rate
Mixed. Many do not use it because they feel it is not relevant, do not accept its benefits on yield, and feel it is only appropriate on dry land and not in the monsoon season
Increase in income When used, increases income through lower cost and less waste
Sustainability Depends on ownership and upkeep of drum seeder
Number of FGDs and KIIs
Seven FGDs and two KIIs
3.4.4 Fertiliser as an input
In Section 3.2, fertiliser training was discussed at length. A separate question is whether the provision of fertiliser as an input has been effective, and in particular whether the effects are essentially short lived.
There were only two villages where fertiliser was provided as an input without the context of a training session. In some villages, either cash or vouchers for fertiliser purchase were provided, and the following results draw on these as well.
Positive aspects Rice farmers appreciated that fertiliser provision saved them from taking out expensive loans . Naturally, they also appreciated the impact on paddy yields.
The villagers in Ku Lar Ohn Pin Su who received fertiliser thought that it was “good for making paddy plants grow well, and entailed no need to borrow money with a high interest rate to buy fertiliser”, even if they “had to pay back the capital with instalment”. In another village (Kha Yu Chaung), fertiliser was seen to have been good for farmers, as it made the growth rate of paddy plants increase to a certain extent. The IP gave two bags of fertiliser to each farmer, but there was no need to pay back anything.
82 For example, subsequent discussion of the results brought up the point that plastic drum seeders with hollow plastic wheels do not face such problems in very wet, soft soils, but like seed broadcasting run the risk of heavy rain displacing seed before it takes root.

Livelihoods and Food Security Trust Fund – Delta 1 Evaluation Report
Oxford Policy Management 35
An interesting finding came from Kyun Nyo Gyi, where cash vouchers for fertilisers had been provided. Small farmers there found that they needed less fertiliser than they were entitled to, and could buy different inputs (diesel) instead. Farmers reported that all farmers received a cash voucher to buy fertiliser at eight specified places at a specified rate. It was a voucher worth 80,000 Kyats and its use was restricted to buying only fertiliser. The group reported that:
“…large farmers bought fertiliser since they have large farmland and could save on the cost of fertiliser for about 7 acres of land. Small farmers did not need that much fertiliser, so they sold the fertiliser and bought diesel, since it was the time of cultivation and they needed diesel for cultivation. The support was enough for small farmers. Farmers could reduce debt since they did not need to take loans for fertiliser. It also helped to increase the yield since they could cultivate in time. Without fertiliser, the yield was about 35 baskets, and with fertiliser it’s about 45 baskets. No training on how to use fertiliser was given.”
Negative aspects In some cases, it was reported that IPs gave fertiliser for monsoon paddy, but farmers would have preferred it for the summer paddy. In addition, sometimes they provided fertiliser that was not needed, so it was sold.
As seen above, the amount of fertiliser needed was difficult to estimate for an IP. There were subsequent reports that it seemed either not enough (just two bags) or too much (in the case of vouchers). Lessons learned One effect of fertiliser provision was for farmers to avoid borrowing money. This could be achieved through a more direct mechanism.
Summary and overall assessment Farmers appreciated the increase in paddy yield. However, one of the benefits of fertiliser provision (apart from paddy growth) was to enable farmers to reduce their debt. This was achieved by preventing them from taking out expensive loans to pay for fertilisers. The same effect could be achieved through other mechanisms, such as provision of micro credits or revolving funds.
Table 3.11 Overall assessment – fertiliser as an in put
Dimension Result
Usefulness Useful to reduce debt (no loans taken out to pay for fertiliser, i.e. an outcome that could be achieved without having to provide fertiliser). It seems that sometimes not the right type or amount of fertiliser was provided
Adoption rate/ success rate People used fertiliser, provided it was the right type
Increase in income Increase in paddy
Sustainability Requires fertiliser to be provided continuously, unless the additional income from not taking up loans helps to buy fertiliser in the future
Number of FGDs and KIIs Three focus groups and four KIIs

Livelihoods and Food Security Trust Fund – Delta 1 Evaluation Report
Oxford Policy Management 36
3.4.5 Post-harvest equipment
Objective and implementation The rationale for the provision of training and post-harvest storage equipment, such as air-tight bags or silos, was the fact that “many farmers in the Delta sell their crop right after the harvest when prices are at their lowest”. While this was most often done because “farmers need to repay the loans they took for cultivation”, it was also due to the fact that they “lack storage capacity”.83
In other words, there were various objectives associated with the provision of post-harvest storage equipment and training for post-harvest processing, namely:84
• to increase farm income by selling when prices increase;
• to store seed securely for the next sowing, or for household food security; and/or
• to reduce post-harvest storage losses.
Other than storage equipment, many villages where post-harvest management training was covered also provided tarpaulins and threshers. For example, according to a group of rice farmers in Kyaung Su (who did not participate in FFS), tarpaulins were provided to all farmers.
Implementation appears to have been relatively widespread. According to the quantitative survey, 25% of all household lived in villages where some type of post-harvest equipment (e.g. threshers, storage facilities, bags) had been provided. On the other hand, only 4% of all households (n=28 out of N=800) stated that they were assisted by these activities.85
Positive aspects The air-tight bags were considered useful in various villages. They helped to store seeds more safely from rain and water and helped to reduce was te, thereby increasing incomes. For example, farmers in Kyaung Su stated that the air-tight bags were useful and sustainable for small farmers since they could store seeds in a secured bag. In Ma Gu Ywar Ma, rice farmers reported that:
“We used to store paddy seeds in containers made of bamboo. We had not known the disadvantage of this. Now, we use plastic bags to store paddy seeds for the next year. Thus, we need less space and can protect the paddy seeds from rain water and pests…”86
The tarpaulins were also considered useful (e.g. in Oke Kyut) to dry rice . Together with this, respondents were well aware that if they managed to save their rice for a while before selling it they could sell at a higher price . As rice farmers clearly explained in Kwin Wyne (Pyapon), “if farmers can store paddy after harvest for about four months, they can enjoy a higher
83 LIFT 2010 Report 84 Objectives according to the Terms of Reference. Post-harvest management also needs to be seen in the context of rice banks. 85 In this context it may be noted that most of the assisted households (n=24) felt that the activity had contributed to an increase in income and food security (n=25). 86 Male rice farmers, Ma Gu Ywar Ma, Bogale
Livelihoods and Food Security Trust Fund – Delta 1 Evaluation Report
Oxford Policy Management 37
paddy price with the increment of 80,000 Kyats per 100 baskets of paddy”.87 Nevertheless, many households were not able to store rice for long, as described below.
Negative aspects Many of the positive effects of storing rice were counteracted by the fact most farmers could not afford to not sell the rice immediately . This was a common theme in all of the study villages, as the following quotes by rice farmers in different villages highlight:
"Only rich farmers can store seeds… We can't wait to sell till the price goes up.”88 “Only those big farmers can store paddy. If they can store paddy, they can get a better price. If they sell right after harvesting, they earn 600,000 Kyats per 100 baskets. However, if they can store it, they could earn 800,000 Kyats per basket. We can’t store rice since we have debt to immediately pay back right after harvesting. We won’t be able to store rice till we can clear our debt.”89
“We have to sell directly because we need capital, we need to invest for the next season. If we could store the rice, our income would be so much better – we can't even wait 15 days! We can't let our interest rates increase. Loans are short term [including from the government] … we don't even keep it for the household, we sell it all and then buy it back later at a higher price.”90
Increased income and sustainability In those cases where farmers were in a position to store paddy, they managed to receive higher incomes.
The main driving factor for farmers to sell their paddy at low prices was the need to repay loans. In those cases where this was not necessary, they could store paddy longer and generate higher incomes (see also the success of rice banks). This in turn should reduce the need for loans and make it more likely that they can wait to sell their harvest in the next season, which in turn would make the use of post-harvest equipment more sustainable.
Lessons learned Providing post-harvest storage inputs alone was adopted in the short term, but the main barrier to adoption was the need to sell immediately after harvest to repay loans. The key to the success of post-harvest storage will be to ensure that farmers do not need to repay loans right after harvest. Respondents stressed that the only way to solve this would be to provide loans at affordable rates and with timeframes appropriate to the agricu ltural cycle .
87 Mixed (male and female) rice farmers, FFS/Farmer Extension Group participants, Kwin Wyne, Pyapon 88 Male rice farmers who did not participate in FFS, Kyaung Su, Bogale 89 Male rice farmers, Zin Baung, Pyapon 90 Male rice farmers who participated in the FFS, Kyaung Su, Bogale

Livelihoods and Food Security Trust Fund – Delta 1 Evaluation Report
Oxford Policy Management 38
Table 3.12 Overall assessment – post-harvest equipm ent
Dimension Result
Usefulness91 Seen as useful: tarpaulins to dry harvest, air-tight bags for longer-term storage (seed for next season, when possible) etc.
Adoption/success rate Mixed. Useful for those few who could afford to store seeds. However, most small farmers need to repay loans and have to sell harvest immediately (and buy back seeds for their own consumption at higher prices later)
Increase in income Mixed. Few managed to take full advantage
Sustainability Not unless access to credit changes (but tarpaulins etc. are being used and repaired). Revolving funds serve as a useful example of how the loan-constraint can be overcome92
Number of FGDs and KIIs Four FGDs and three KIIs
3.4.6 Seeds
The positive and negative aspects of the provision of seeds are explored in further detail in Section 3.6.4, which focuses on seed banks. It should be noted, however, that where seeds were provided without being linked to a seed bank the positive aspects tended to be less stressed by respondents.
Overall, it was commonly felt that the good quality of the seeds provided guaranteed higher yields , while saving on the cost (and often the high interest rate) of purchasing seeds for the new season.
The quantitative survey shows that 29% of all households lived in villages where seeds were provided (n=232 of N=800) and 6% (n=48 of N=800) participated in or benefitted from the provision of seeds, putting it among the 10 activities with the greatest number of households benefitting from or participating in it.
3.5 Impact of other livelihood inputs and training (not related to rice production)
3.5.1 Introduction
In order to more directly support the poor and vulnerable, a range of inputs (such as small livestock) were provided. They were sometimes accompanied by training. This section covers the various activities in this respect.
91 Objective: to increase farm income by selling when prices increase, to store seed securely for next sowing, for household food security, and/or to reduce post harvest storage losses 92 See also Section 3.6.
Livelihoods and Food Security Trust Fund – Delta 1 Evaluation Report
Oxford Policy Management 39
3.5.2 Provision of livestock
Overall targeting The targeting of livestock inputs (and often training) to poor and vulnerable households was carried out in different ways in different villages, leading to diverging results in terms of the success of these activities.
In most of the study villages, livestock inputs were simply targeted at the poorest members of the community (almost always casual labourers), selected according to simple criteria such as those who were landless, with many family members, disabled people, widows, etc.93 “In this village there were 100 families who applied for the pig-raising activity, but only 20 were chosen, as they are the poorest"94, one group explained. In another village, a group of female poor and vulnerable people explained that, “animals were given to widows, the very poor, elderly, disabled persons and landless workers.”95
However, in a couple of cases, livestock inputs were only given to those who could prove the ability to tend for them. While this can of course have some negative targeting effects, excluding the poorest and most vulnerable who do not have adequate means to take care of livestock, it may also be a solution to the widespread problem of livestock disease and death due to lack of tending (which will be analysed in the following paragraphs). In Kyaung Su, for example, a group of male casual labourers explained that “only five people in the village got animals”, as they were those who had the capacity and land/money to tend them.
In one notable exception, villagers complained that “pigs were given to women in the income generation group by ‘lucky draw’ basis… so, it didn’t represent the poorest and most vulnerable… some were well off!”96 This created some tension among villagers, although interviews with members of the VDC highlighted that the decision was taken unanimously as “the wealth ranks of all the members were not that different.”97
It should be noted that one important criterion that appears to have been used quite uniformly across villages and IPs was the rule that those who received support from other organisations were excluded from LIFT support, including the provision of small livestock. Similarly, as with other activities, there were some complaints that people who had not attended the initial community meetings or who did not live in the area prior to Nargis were not included in the beneficiary lists to receive livestock.
Overall implementation and sustainability The way in which the provision of ducks, goats and especially pigs was conducted significantly affected outcomes and sustainability, with important lessons to be learned for the implementation of the Delta 2 programme. This was a combination of some of the targeting choices described above and of the procurement process for the livestock.
Regarding the targeting, as explained above, small livestock were often provided to households who did not have the means to tend them, either because they lacked land or because they lacked enough income to spend on the livestock. While the details of this will be explored for each animal (ducks, pigs and goats) below, the overall impression from the evaluation was that many households who received livestock were not then able to sustain them, leading to very high rates of
93 For example, this approach was used in Kha Yu Chaung (Bogale), Oke Kyut (Bogale) 94 Male poor and vulnerable, Oke Kyut, Bogale 95 Female poor and vulnerable, Htin Pon Kwin, Labutta 96 Female poor and vulnerable, Kyun Nyo Gyi, Dedaye 97 VDC member, Kyun Nyo Gyi, Dedaye
Livelihoods and Food Security Trust Fund – Delta 1 Evaluation Report
Oxford Policy Management 40
disease and death. Unfortunately, these events were also linked to the specific varieties provided and to a wave of disease that hit most of the Delta area in 2011.
Finally, it may be noted that, according to the quantitative survey, 35% of households lived in villages where small livestock (goats, ducks, pigs) were provided, with 7% (n=52) of all households receiving small livestock. This makes it one of the top 10 activities that people benefitted from. In addition, 40 (5%) households felt that it had contributed to an increase in income and 39 (5%) felt that it had contributed to an increase in food security. In other words, 23% of recipients did not feel that it contributed to an increase in income. This relatively high share sounds plausible given the numbers of animals that died or fell sick.
3.5.2.1 Ducks Overall, the distribution of ducks was only deemed successful in a few cases, where households had land to tend them (or access to feed) and enough ducks to make the activity sustainable.
Positive aspects For those who had these positive circumstances, the regular income from duck tending was considered a great resource. For example, a woman who had received 70 ducks declared that she could make up to 2,000–3,000 Kyats per day selling eggs. “Households who got ducks increased their income through the regular cash they get from selling eggs that are produced almost every day”, a young casual labourer summarised in Ku Lar Ohn Pin Su (Bogale). A woman in the same village expanded on how she sustains her family with the ducks provided through LIFT:
“The eggs we get in a day are enough for the cost of three days of duck food. Thus, the money we get from selling the eggs that are produced on the other two days can be used for our food and payment for initial capital…”
In a FGD in Ma Gu Ywar Ma, similarly, a woman who had received 50 ducks explained that her household gets “one-third net profit by selling duck eggs regularly... because the rest is spent on feeding the ducks.”
Negative aspects Nevertheless, in most of the study villages households were unsatisfied with the provision of ducks as a form of income support for a series of reasons. First of all, a near-universal complaint was the fact that duck tending requires access to land (or expensive duck feed), which many casual labourers do not have. “For ducks, access to a tending ground is a problem… we can’t tend ducks in creeks and rivers since the license holder don’t allow us to tend ducks there and we have no land ourselves”, a woman explained in Kant Ba Lar Su. Key informants commenting on the issue explained that “poor people who have good relationships with farmers and people with land may be able to tend ducks, but for others access to land is a major problem and the cost of duck feed is too high to cover.”98
The second most cited problem was the fact that in many cases too few ducks were provided to justify one family member taking care of them and to make the investment viable. A key informant from one of the IPs estimated that at least 50 ducks are needed in order for beneficiaries to start seeing positive effects: “some IPs gave only 25 ducks or less, but there are economies of scale involved… households face an opportunity cost for tending the ducks and if there aren’t enough they simply stop taking care of them”. FGD participants in Kha Yu Chaung (Bogale) echoed this, explaining that “households who got ducks had difficulty assigning one family member to tend them because only a few ducks were given.”
98 Key informant interviews with implementing partners in Bogale

Livelihoods and Food Security Trust Fund – Delta 1 Evaluation Report
Oxford Policy Management 41
Other less-cited problems with duck breeding included the procurement of the ducks , whereby the ducks provided were sometimes too young and died soon after, and the lack of adequate training in a couple of cases.
Lessons learned The villages where duck breeding was most successful were those where: a) the ducks provided were ‘old’ enough; b) enough ducks were provided (at least 50); c) some training was provided alongside the ducks; d) beneficiaries were granted some access to land in order to tend the ducks; and e) beneficiaries were provided with a certain amount of months’ duck feed.
In terms of lessons learned, these findings easily translate into a set of basic recommendations:
• The targeting of ducks to the poorest and most vulnerable households within a community is not feasible as these households will not have the land or resources to be able to tend those ducks successfully. This either means that the primary objective of supporting those most in need is set aside (targeting households who are relatively better off), or that the provision of ducks is accompanied by additional support. This could include setting up arrangements for beneficiaries to have access to common/other people’s land and providing at least three or four months’ worth of duck feed.
• There are economies of scale in the tending of ducks. Providing less than 50 ducklings increases the opportunity cost of tending the ducks, meaning that households will have a lower incentive to dedicate a household member’s time to taking care of them (reducing their chances of survival).
• The chances of the ducks surviving also increase when recipients are given some basic training and when ‘older’ ducklings are provided.
Table 3.13 Overall assessment – provision of ducks
Dimension Result
Usefulness Can be very useful for regular income if conditions for tending them are there (primarily access to land or feed)
Adoption/success rate Mixed. Many ducks died for lack of tending or were sold by respondents unable to tend them
Increase in income For those who had access to land/feed, regular income was guaranteed
Sustainability Only sustainable under certain conditions
Number of FGDs and KIIs 30 FGDs and 11 KIIs
3.5.2.2 Pigs Attitudes towards the usefulness and success of pig breeding were mixed, mostly depending on the circumstances in each of the study villages. However, as a result of the wave of pig disease that swept across Myanmar in October and November 2011, many of the households who had received pigs through LIFT lost them as a consequence.
Positive aspects For those whose pigs survived, there was no lack of evidence on the positive impacts this had on household income and therefore indirectly food security.

Livelihoods and Food Security Trust Fund – Delta 1 Evaluation Report
Oxford Policy Management 42
Understandably, the most commonly cited positive aspect of the distribution of pigs was the fact that profits can be very high after a relatively short amount of time. This is partly because pigs breed relatively fast and can produce numerous offspring, and because their price (and body weight) also increases rapidly with growth. A middle-aged casual labourer in Kant Ba Lar Su (Bogale) summarises his positive experience:
“I got one female pig from [name of IP]. This female pig delivered nine piglets. One piglet was used as payment for mating and another piglet died. Among the remaining seven piglets, we sold five and the mother. We then used some of the money we got from the sale for the education of two grandchildren whose parents passed away and for food. Moreover, I could pay back the capital of the female pig to the group leader. I currently own two piglets, although I do not have much extra money.”
Similarly, in Kyar Chaung (Labutta), a group of women described the success of the livestock-breeding group in their village, highlighting how pigs can act as a useful saving tool and how profits can be used for reinvestment :
“The best-performing groups supported by [Name of IP] are livestock-breeding groups… Members of livestock-breeding groups get money from [Name of IP] and buy a piglet. The price is only 30,000 Kyats... and after 10 months, you can earn 130,000 Kyats when the pig is sold. In addition, we still have two piglets at home. It’s like we can save money and we can invest in another small trading business with the money earned from selling the adult pig while also buying paddy and storing it. Almost all households who breed pigs are successful.”
This vision – of pigs being particularly useful as savings – was shared by several other FGD participants across the study villages. It was commonly held that, given pigs’ ‘lumpiness’, there was no guarantee of a regular income but more of a ‘safeguard effect’ to be used in times of need. As a seed bank member in Htin Pon Kwin (Labutta) eloquently put it:
“pig (…) raising (…) does not generate daily income; however, it is like a saving bank: when you sell the animal you get lump sum cash. That cash can be used for other purposes such as buying rice or used as capital for other business purposes.”
Another positive aspect of pig raising, which was often contrasted to the tending of ducks, was the fact that pigs require a small amount of land and can be fed leftovers from the household (rather than expensive feed). “Pig feed is easily and abundantly available in the village since fishery is the main livelihood here”, respondents pointed out in Kyar Chaung (Labutta), with villagers in Kyun Nyo Gyi (Dedaye) agreeing that “raising pigs benefited poor and vulnerable households the most as it doesn’t need much ground space and leftovers and waste from meals can be used as feed, meaning there is less cost”. Nevertheless, it should be noted that the poorest of households, who were struggling to provide food for themselves, still found it hard to find enough leftovers for the pigs, resulting in disease and death of their livestock (which was surprisingly frequent, including in some of the villages mentioned above).
Negative aspects The positive aspects of pig raising were unfortunately counterbalanced by several negative comments, first and foremost the extremely high frequency with which pigs provided through LIFT were subject to illnesses and death . In most of the study villages where pigs were distributed, for example, there was widespread loss of animals due to the 2011 wave of ‘Blue Ear’ disease that
Livelihoods and Food Security Trust Fund – Delta 1 Evaluation Report
Oxford Policy Management 43
swept across Myanmar.99 As a sad story told by a group of women belonging to an income generation group exemplifies:
“Some pigs were dead a few days after we received them… It even cost us the cost of medicine… Instead of benefiting from it, some made a loss… Some were able to raise them till the mother pig delivered piglets… But, those piglets died and they had to sell the mother pig so that they could pay back the debt.”100
In a few cases, the widespread death of pigs resulted in further problems, especially when households had received them through a revolving fund and had to pay their initial investment cost back. For example, in the village of Zin Baung (Pyapon) widespread death of livestock led to a series of defaults with the revolving fund, which were seriously undermining its potential for continuation. “Pigs do not benefit poor families”, a lady in Htin Pon Kwin (Labutta) explained, “those pigs got infected with diseases, and were bony… since the pigs were not healthy, the first person who took a turn to feed them faced difficulty: if the pig died she has to compensate other members of the group even though she has lost her asset and extra money.” Another respondent in Kyun Nyo Gyi (Dedaye) also complained that, “for this village, pig support was less sustainable since most of the pigs died… only one-third survived thanks to vaccination or maybe keeping pigs in clean pens.”
A second problem that was widely mentioned in regard to pig breeding was that they were most often sold before they had even reproduced, because they do not give income soon enough or regularly. In Kyaung Su (Bogale), for example, villagers reported that “most of them (those who had received pigs), more than half, just sold it (…). Poor households cannot afford the feed cost and even though they received feed support for three months, pigs have to be raised for about five to six months (before they give any offspring).” In Pho Khwe Gyi (Labutta), similarly, FGD respondents explained that pigs “are not beneficial to most households as people just sold them off and so they have no longer-term impact.” Interestingly, both quotes (as well as others from this study)101 highlight the fact that it was most often the poorest households who benefitted the least from the provision of livestock, as they could not sustain the initial costs of breeding the animals.
One very important problem that was stressed in many discussions, and which is linked to the high mortality rates of pigs provided through LIFT, is the fact that there were issues with procurement . Specifically, a few villages complained that the pigs provided through LIFT were of the “wrong” variety , i.e. not a local one. In some cases, the issue was resolved positively thanks to existing grievance and accountability measures:
“The pigs that were given to us the first time died because they were white and not suited to local conditions. Thus, we made a suggestion that we wanted [name of IP] to give us black pigs that are local. [name of IP] came and saw the situation of our pigs (…) and then accepted our suggestion.”102
99 Porcine reproductive and respiratory syndrome virus (PRRSV), also known as Blue Ear disease. See for example: www.mizzima.com/news/inside-burma/4992-blue-ear-pig-disease-deaths-rapidly-increase-in-burma.html 100 Female poor and vulnerable, Kyun Nyo Gyi, Dedaye 101 For example, in Kha Yu Chaung (Bogale), villagers reported that “pig raising was most difficult for poorest people because it was very hard for them to get enough food even for themselves so they never had enough for pigs. As a consequence, they sold their pig and money earned from selling the pig was used for their own food”. 102 Male rice farmers, Ma Gu Ywar Ma, Bogale

Livelihoods and Food Security Trust Fund – Delta 1 Evaluation Report
Oxford Policy Management 44
In some cases, complaints were linked specifically to the way in which the pigs were procured: either through binding cash vouchers (to be used in specific outlets) or directly through the IP. For example, in Pho Khwe Gyi (Labutta):
“[Name of IP] provided cash vouchers to buy… pigs at a specified place. But these were not worth the price given… they didn’t match the local context too so some got diseases and died. [Name of IP] gave vouchers and made us buy at a specified place, so we couldn’t buy them in other places too… The seller mixed all the pigs and goats in the same place and didn’t feed the animals regularly so they were weak and infected with diseases... they died ten days after they arrived in the village.”103
103 Male rice farmers, Pho Khwe Gyi, Labutta

Livelihoods and Food Security Trust Fund – Delta 1 Evaluation Report
Oxford Policy Management 45
Importantly, a few IPs experimented with more flexible forms of procurement with very positive results. The most notable was LWF’s ‘community-based procurement’, explored in Box 3.2.
Box 3.2 Community-based procurement, LWF’s experien ce
“The single measure taken by the organisations which made the biggest difference in terms of community ownership was the participatory community procurement approach used for the purchase of most larger items. The approach involved the beneficiaries to a very high degree (…) as members of procurement and distribution committees, i.e. with co-responsibility for obtaining quotes, selecting suppliers, purchasing, and transporting the items.
Rather than project staff identifying suppliers, much responsibility was delegated to the communities – supported by project staff – who generally demonstrated a very high knowledge of the most reliable and most cost-effective local suppliers. Moreover, by being closely involved in the process to the extent of experiencing being partly in charge, community representatives ensured that the items bought were the most suitable for the local situation and got the most for ‘their money’.
Communities also had a high knowledge of the item cost of ‘their assistance’. None of the problems experienced previously by other agencies such as bad quality of seeds, buffaloes that could not adapt to local conditions or material that was exchanged due to unsuitability to local conditions were reported by respondents in relation to the community-led procurement, although a few problems with adequate transport facilities did occur.
Overall, community respondents highly valued the community-based procurement method and highlighted it as a key example of how the project approach had been adapted to their needs. In particular, communities in the southern area, who had previously experienced problems with agency-led procurement and where trusted suppliers are small and located geographically far from each other, expressed a high degree of satisfaction. Overall, the more responsibility allocated to the communities during the procurement process, the higher the extent of self-determination over the process and ultimately the higher the level of ownership of the development process.
However, the process also poses challenges in terms of financial control – as management is less centralised – and requires significant training and monitoring. Moreover, local communities might rely solely on existing knowledge and not seek to purchase improved, new or untested types of inputs (for example, different kinds of seed). (…) According to the procurement, who provided additional training and monitoring during a visit in February 2011), community-based procurement “is empowering and participatory – however, it will at all times require a lot more resources when it comes to financial management and procurement. This is not always considered in the project preparation phase and the necessary resources are seldom allocated from the get-go.”
In conclusion, the high level of involvement of communities in procurement was commendable, cost-effective, largely successful, created a strong sense of community ownership and should guide the involved agencies in the future. However, it is important that the required investment and resources are allocated throughout the process to ensure timely implementation at high standards.”
One last issue that was occasionally mentioned by key informants was the fact that the poorest households were often reluctant to even take on the responsibility of rearing a pig, as this was considered too risky . This self-targeting problem is complementary to the issue mentioned above of not being able to sustain the breeding costs.
Lessons learned In terms of lessons learned from the provision of pigs, many have already been acknowledged by LIFT through its monitoring activities. The 2010 report clearly states that “the provision of pigs was problematic”, citing examples of possible solutions to the issue. Here we briefly explore some of these, with a couple of additional points:
• In terms of targeting, pigs were considered too much of a risk for the poo rest and most vulnerable households , especially when these were provided through a revolving fund

Livelihoods and Food Security Trust Fund – Delta 1 Evaluation Report
Oxford Policy Management 46
(whereby beneficiaries felt they were liable in the event of the animal’s death or disease).104 In many cases, this meant that poorer households did not choose to be involved in this activity. In order to solve this issue, there appear to be two main solutions: a) lowering the cost burden of the investment (by providing feed, veterinary help, etc.); and b) providing guarantees that if the pig dies for reasons beyond the beneficiary’s control, they are not liable for its cost.
• The distribution of very young pigs increased the chances of pig mortality, as did the provision of pigs with no feed (at least to sustain the first few months). Similarly, these two factors also contributed to relatively high rates of sales of pigs before they gave birth,105 As the LIFT report stresses, “the lesson learned is that six-month-old pregnant gilts with feed for three months should be provided”.
• The mode of provision of pigs led to several issues, particularly in terms of the local appropriateness of the breed of pigs (“white rather than black”). A more flexible approach to procurement, where communities are primarily involved in the provision, appeared to be the most successful in this context. Details of LWF’s experience with ‘community-based procurement’ are provided in Box 3.3.106
• It is clear that, in a context of widespread disease, villages where training was provided on livestock tending and – most importantly – on veterinary skills suffered less livestock loss. In those villages, the trained livestock extension workers provided vaccinations for the sick pigs, in many cases preventing death.107
Table 3.14 Overall assessment – provision of pigs
Dimension Result
Usefulness Can be very useful for lump sum (high) income if pigs do not die
Adoption/success rate Mixed. Many pigs died because of disease
Increase in income For those whose pigs did not die, large impacts on income were found
Sustainability Sustainable if pigs do not die. There are higher chances of survival with livestock extension worker, good procurement, training, etc.
Number of FGDs and KIIs 30 FGDs and 15 KIIs
3.5.3 Provision of fishery inputs
LIFT IPs supported fishery in the Delta through four main types of fishery inputs: the provision of boats, the provision of nets, the construction of aquaculture ponds and the provision of cash. In total, 8,937 households benefitted from fishery inputs (LIFT report, 2010). This report will focus mostly on the provision of nets and boats (whether through cash grants or direct provision). 104 This is because pigs are a ‘bulky’ investment with high risks attached. 105 This is common behaviour with larger assets that have a cost to sustain them and that only bear their ‘fruits’ after a relatively long period of time. 106 Subsequent discussion of the results also brought up the point that, where large numbers of pigs were transported together from outside the region, the chances of introducing disease were magnified. It has been suggested that pigs be procured locally if possible, which would also have benefits for the local/village economy. 107 For example, in Oke Kyut (Bogale), satisfied villagers explained: “when our pigs got ill he (the vet) came and gave treatment; we just gave him 500 Kyats and he brought medicine with him.”

Livelihoods and Food Security Trust Fund – Delta 1 Evaluation Report
Oxford Policy Management 47
3.5.3.1 Boats and nets The provision of boats and nets, or sometimes just nets, was of course an extremely important form of support given that these were among the livelihood inputs that were most destroyed by Nargis. In this study, we found that in many cases fishermen used the new nets and boats to recover their livelihood and make an income. However, several problems were also faced by beneficiaries because of changing conditions after Nargis.
Overall, the targeting of the boats and nets was mixed in the study villages. In most cases,108 respondents agreed that “fishery inputs such as boats and nets were provided to those who pursued their livelihood in the fishery sector before Nargis” and that “the beneficiaries were selected based on the consensus of community members.”109 In a few cases, however, the explicit targeting towards the poor and vulnerable also meant that nets and boats were “not always given to those who know how to fish.” A group of women involved in the fishery sector in Kyun Nyo Gyi (Dedaye) described how fishery inputs were targeted through their village’s revolving fund:
“LIFT provided fisherman with an adequate length of nets, of 80 feet in the first round. Three people received it. For the next round, the previous round’s beneficiaries and those who had boats and power engines were left out. For instance, those who got nets to catch small fish in the first round didn’t receive a Hilsa net in the next round.”
Regarding the sustainability of providing boats and nets, beneficiaries did not have uniform opinions. Boats and nets were generally viewed as perishable, although some comments proved that this is not necessarily the case:
“Fishing nets and boats can be most sustainable because casual labourers with fishing nets and boats can get a regular income through catching fish and will be able to buy new ones with some money saved from regular income when the current ones wear out.”110
According to the quantitative survey, 35% of households lived in villages that received inputs for fisheries, with 7% (n=54) of all households receiving them (making it one of the 10 activities that most people benefitted from/participated in). Almost all of these (n=48; 6% of all) felt that the inputs helped to increase income and improve food security (n=50; 6% of all).
Positive aspects The most positive aspect of the distribution of nets and boats, unsurprisingly, was the fact that these could be used to gather food and contribute to the household income – especially in the months when not much other work is available. This contribution to the income of poor and vulnerable households was reported in at least nine villages.
“With boats and nets, I can always earn enough for food... I could even store some food at home”, a casual labourer reported in Shwe Kyun Thar (Labutta). Two interesting and exemplary stories – showing how boats were also sometimes used for other IGAs than just fishing – came from the village of Pho Khwe Gyi (Labutta):
“Before we received boats and nets, we just had to catch fish with our hands in the fields and creeks… Now, we can go to the river and catch fish and our income increases. Even in the non-fishing season, we can use boats for firewood and selling
108 See, for example, Pho Khwe Gyi and Shwe Kyun Thar in Labutta and Zin Baung in Pyapon 109 Female poor and vulnerable, Kyaung Su 110 Male poor and vulnerable, Kha Yu Chaung, Bogale

Livelihoods and Food Security Trust Fund – Delta 1 Evaluation Report
Oxford Policy Management 48
other things… Before, we had to rent a boat and it cost us 500 Kyats a day; now, we can earn money with our own boat and we can have more meals than before.”
“Before we sometimes didn’t earn any money and at that time we had to buy rice on credit at the grocery shop… Now, we have a Hilsa net and increased our income… We earn at least 1,500 to 2,000 Kyats per day and on some lucky days we earned 40,000 to 50,000 Kyats… When we earn a lot, we store rice.”111
In some cases, the increase in income was also due to changing behaviour in fishing patterns, with fishermen venturing further towards the sea where t hey could catch more and larger fish (it should be noted this was not done on LIFT-provided boats, which are too small for this). As fishermen who had bought nets and boats through the village revolving fund reported:
“Previously we could fish only in rivers and creeks… Now, we can go fish at sea and catch more fish… and earn more money and have more food… and escape from debt. As more fish are caught, the villagers can also have fish at a fair price.”
“Going to fish at sea allowed us to get huge fish. We can sell these fish in town and the small fish in the village. We had to buy fish from other villages before. Now, we can just have it in our village fresh and plenty.”112
In a heart-warming description, a group of female casual labourers also talked about the wider benefits in terms of empowerment they received from the fishery activities financed through LIFT:
“Women can have more income and can participate in the fishery business… Women now have a chance to be involved in the discussion and acquire more knowledge to keep abreast with men… Before, we stayed at home and couldn’t earn any money… Now […]113 our husbands catch fish and we sell fish and earn income.”114
Negative aspects The biggest problem reported by fishermen who had received boats and nets through LIFT was not directly linked to the nature of the provision, but to an external problem which has apparently been growing in the Ayeyarwady Delta over the past few years (even before Nargis): the leasing of fishing grounds through leases and tenders .
In several villages (five in our study115), this was reported as a huge impediment to smaller fishermen (the poorest and most vulnerable members of the community targeted by LIFT) who could not afford to pay the licensing and sub-tender fees and were therefore not allowed to fish in the surrounding rivers. In some cases, it was reported that the situation had actually worsened because of LIFT support: many more fishermen had nets, meaning that the lease and tender holders became stricter with those whom they caught, sending some of them to jail. The situation was particularly bad in Zin Baung (Pyapon), as a group of casual labourers recounts:
“More people catch fish now, and license holders have become stricter than before Nargis, since they get fewer fish. Because of this license problem, those nets (given through LIFT) are not useful. Some fishermen even got arrested and put into jail…
111 Male poor and vulnerable fisher-folk, Pho Khwe Gyi, Labutta 112 Male poor and vulnerable fisher-folk, Kyun Nyo Gy, Dedaye 113 Note that the group of women also mentions the benefits of home gardening in terms of their empowerment. 114 Female poor and vulnerable, Kyun Nyo Gyi, Dedaye 115 These were Zin Baung, Kyaung Su, Kant Ba Lar Su, Kha Yu Chaung, and Bonlon Chaung

Livelihoods and Food Security Trust Fund – Delta 1 Evaluation Report
Oxford Policy Management 49
sometimes just because they were known to own nets. They can’t fish in rivers and creeks and, if they want to fish, they have to pay license fees they can’t afford... about 1 lakh per year… and it is increasing year by year.”116
A similar story where fishermen were almost forced to sell their nets came from Kyaung Su (Bogale):
"Those who received fishery inputs resold the supports… Very few people used the equipment they received…It's hard to fish near the village – the fishing area is occupied by the licensed holder, so, fishery inputs are not very useful to the poor, and they just resold them.”
In some cases, assets such as the nets and boats provided through LIFT were used as ‘contingency money’ to be sold in case of an emergency . This of course has a positive short-term effect on households – allowing them, for example, to pay for much-needed medical care – but it also undermines longer-term income generation, which is LIFT’s primary concern.
“(Boats and nets are) useful to have as an alternative source of income. However, some people in our village had to sell them because of health emergencies in the household, meaning the support was not sustainable.”117
Issues surrounding a lack of sustainability were raised in several FGDs throughout the study areas, with beneficiaries reporting that nets and boats are both perishable and only last a few years. It should be noted, however, that many others reported that nets can be quite easily fixed and that, if income is good enough, new ones can be bought when the old ones are unusable.
One further issue which relates to LIFT and its IPs regards the way in which the boats and nets were targeted and provided. In some cases, respondents complained that either boats and nets had been given to the “wrong people ” (i.e. people who had not previously been fishermen and who therefore did not know how to use them) or that the wrong types of boats/nets had been provided (and in some cases nets had been provided with no boats, making them useless): “Some nets were given to people who had never fished before, so of course they sold them. Others got nets and no boats, which is useless”, casual labourers complained in Kyaung Su (Bogale).118 In Ma Gu Ywar Ma, respondents explained:
“Fishing nets and boats are good for casual labourers because they can get an income by catching fish when they have no job in some seasons. However, fishing nets that can only be used to catch Hilsa were not useful because villagers in the village are not able to use this type of fishing nets. Some households who received these sold them, and then used this money for capital for the businesses they wanted, for example vegetable selling.”119
One last problem which was described by a couple of FGDs with fishermen (and not systematically confirmed elsewhere) was the progressive drying up of some rivers and lower availability of fish in the rivers: "It used to take two hours to fish at least one big fish, now you can spend a whole day and catch nothing", people reported in Kyaung Su (Bogale). In Zin Baung (Pyapon), on the other hand, a group of women complained that, “now, water dries up in the river and we just keep
116 Male poor and vulnerable, Zin Baung, Pyapon 117 Female poor and vulnerable, Ma Gu Ywar Ma, Bogale 118 Male poor and vulnerable, Kyaung Su, Bogale 119 Male poor and vulnerable, Ma Gu Ywar Ma, Bogale

Livelihoods and Food Security Trust Fund – Delta 1 Evaluation Report
Oxford Policy Management 50
our nets with us and use them for nothing. Fishermen can catch fish for only three months a year, so they just keep the nets for the remaining nine months.”
Lessons learned The provision of boats and nets was not always successful, as stressed in the previous paragraphs. However, the study highlighted what enabling factors could increase the success and sustainability of this activity:
• Possibly the most important issue to be addressed through wider consultations with relevant government authorities is the leasing of fishing grounds through leases and tenders120 that was reported in most of the study areas. Evidence showed that the poorest household were those who were most affected by the leases and tenders, as they were not able to afford the initial investment and were consequently cut out from any consequent profits (and sometimes jailed if they did not respect the ruling).
• While the targeting of boats and nets to the poorest households (i.e. not necessarily those who had previously been involved in fishery) is a laudable objective, such provisions were seen to be ineffective (with beneficiaries selling off their assets) if they were not accompanied by adequate training and support.
• Changing patterns of fishing, with fishermen increasingly staying longer periods further away from their villages (out at sea), require changing forms of safety net measures for their households. This is a wider policy issue that should also be discussed.
Table 3.15 Overall assessment – provision of boats and nets
Dimension Result
Usefulness Very useful for those who had been fishermen before Nargis and where there were no big problems with lease and tender holders etc.
Adoption/success rate Mixed. Several households sold nets and had problems fishing because of restricted access to fishing areas
Increase in income For those who did not face problems with lease and tender holders and depleted fish stocks, increases in income were reported
Sustainability Nets and boats break and depreciate, but systems can be set up to increase sustainability (reinvesting profits, etc.).
Number of FGDs and KIIs 24 FGDs and 11 KIIs
120 Subsequent discussion of the results brought up the following additional information, namely that leases and tenders tie up fishing grounds and are very expensive to acquire (managed by Regional Governments). Licenses, on the other hand, are relatively cheap and are required for certain types of nets and other equipment and administered by the Department of Fisheries.
Livelihoods and Food Security Trust Fund – Delta 1 Evaluation Report
Oxford Policy Management 51
3.5.4 Provision of inputs for home gardening
The provision of inputs121 (and sometimes training) for home gardening had small – yet mostly positive – effects for most of the beneficiaries who were involved. Nevertheless, some problems were reported amongst the poorest of households with no access to land to grow the vegetables on (or with access to land that was too saline).122
Positive aspects The most positive effect of the home gardening, as reported by all of those who had been successful in setting up a garden, was the effects this had on households’ food security , including the diversification of the food products that were being consumed. “Home gardening is the best activity for food”, causal labourers explained in Ku Lar Ohn Pin Su (Bogale). In Bonlon Chaung, respondents were satisfied that there was “no need to buy vegetables from others”, saying that in some cases they could even “sell them”. Similar statements were made across most villages, with many people pointing out they were “saving family expenses on vegetables .”123
The most successful villages, as with other LIFT activities, were those where training was provided alongside the provision of tools. This allowed households to make the most of the inputs they had and avoid ‘crop failure’ as in some villages. An old man from Kant Ba Lar Su (Bogale) summarises the benefits he received from home gardening training:
“We just planted vegetable plants unsystematically before. After getting knowledge about planting methods from the person trained by [Name of IP], we become able to plant home gardening systematically. We know how many inches should be between plants. Therefore, the growth rate of these vegetables is better than before. We can also get and eat the vegetables and fruits from home gardening earlier than before.”
One interesting side effect of the home gardening, which was included in the study’s theory of change, was the fact that women felt empowered by the fact they could produce their own food and sometimes earn a small income on the side. In Kyaung Su (Bogale) and Bonlon Chaung, two groups of women shared their enthusiasm:
“We can sell extra vegetables and earn more income on top of a reduction of costs for food… We can earn more income and do not need to rely on men and gain more confidence.”124
“Because of home gardening, food security is achieved and income is higher. Women can generate income and have influence on husbands… we also become knowledgeable.”125
A further positive aspect was the overall perceived sustainability of the home gardening (though this opinion was not shared by 100% of FGDs): “It’s sustainable since we can grow them again with the seeds from this season’s produce”, women explained in Kyaung Su (Bogale). Similarly, in Oke Kyut (Bogale): “home gardening has long-term benefits; when we grow this year we can keep some for next year”.
121 Support for home gardening was usually given as a kit of seeds (commonly cucumber, morning glory, gourds, okra, pumpkin, etc.), fertiliser, and sometimes tools. 122 There are no quantitative figures available with respect to the number of beneficiaries benefitting from home gardening 123 Male poor and vulnerable, Shwe Kyun Thar, Labutta 124 Female poor and vulnerable, Kyaung Su, Bogale 125 Female poor and vulnerable, Bonlon Chaung, Kyaiklat
Livelihoods and Food Security Trust Fund – Delta 1 Evaluation Report
Oxford Policy Management 52
Negative aspects The biggest problem with home gardening was the fact that some people were excluded from its benefits because of a lack of land or because they owned land with the wrong type of soil or soil that became saline after the monsoon season.
Regarding the problems with land, many households in several villages insisted that ownership of certain types of land was essential in order to be able to do home gardening, explaining that many of the poorest casual labourers in the village often did not even own the land their house was built on. This of course implies that the targeting of home gardening is almost implicitly biased towards those who can actually grow the seeds they are donated (though in some cases villagers found other solutions to the problem, as the second quote shows):
“LIFT gave seeds for home gardening together with sprayer, fertiliser and pesticides to those who are interested in home gardening. Those who don’t have any land were not successful. Those who do have land can grow on it and cover family meals plus income.”126
“Home gardening was very useful to the ones who own land. The villagers who do not own land gave their seeds from [name of IP] to the ones who own land… when the plants became fruits, they then asked for some fruit and vegetables in return.”127
Regarding the soil type and risks of penetration of saline water, the problem was cited in three different villages, highlighting how often problems are contextual. In Kha Yu Chaung (Bogale), respondents explained: “all villagers planted vegetables, but the fruit of home gardening was little; the soil was flooded with saline water after just eating a few vegetables from home gardening.” In Kyun Nyo Gyi (Dedaye), villagers and key informants similarly talked about “saline penetrations in the monsoon season”, which meant no-one was able to grow vegetables.
A second ‘problem’ cited by respondents – which was not necessarily seen as a big issue but more as a ‘missed opportunity’ – was the fact that produce from vegetables gardens could not be sold on local markets. In other words, many respondents felt that home gardening was great in terms of enhancing their food consumption, but not of much help in increasing their income . In some cases, beneficiaries felt this was because there was “no buyer in the village”,128 whilst in other cases it was because “the produce is not enough for sale, just for family meals”.129 One group of farmers explained: “transport and logistics are still a problem here… we can’t go and sell in Yangon or have much access to markets; everything is in favour of the big business people!”
A further problem which was only mentioned informally by key informants such as IPs (and which is linked to the problem of markets featured above) is the fact that, once the donated seeds are used up, it is not always easy for beneficiaries to have access to new stocks of seeds and inputs .
Lessons learned • Given that one of the main problems with establishing home gardening for poor and vulnerable
households was the lack of land altogether or the lack of adequate land (non-saline, etc.), it is unsurprising that the main ‘lesson learned’ – as described by FGDs and key informants – was the need to guarantee land to those who were involved. One IP, for example, encouraged
126 Male poor and vulnerable, Kyun Nyo Gyi, Dedaye 127 Male poor and vulnerable, Ku Lar Ohn Pin Su, Bogale 128 Male poor and vulnerable, Shwe Kyun Thar, Labutta 129 Female poor and vulnerable, Kyun Nyo Gyi, Dedaye

Livelihoods and Food Security Trust Fund – Delta 1 Evaluation Report
Oxford Policy Management 53
farmers to lend land to landless households, a practise that could be taken up by other IPs as well.
• A second lesson that was flagged by key informants was the need to create an easily accessible market for gardening inputs (most importantly seeds). One potentially successful idea that is currently being considered by one IP is the creation of agricultural shops for clusters of villages.
• Because of competition with larger agri-producers in the country and lack of market development locally, there seems to be little scope for home gardening to be used as a source of income rather than just a large contribution to self-sustenance.
Figure 3.4 Overall assessment – home gardening
Dimension Results
Usefulness Self-sufficiency, food security, variety of diet, women felt empowered
Adoption/success rate Required land. With appropriate soil and low salinity, those who had land were happy to grow vegetables
Increase in income Good for food consumption, helped to save expenses on vegetables but of less help in increasing incomes
Sustainability Can continue to use skills, provided land is available. Seed needs to be saved
Number of FGDs and KIIs 13 FGDs and three KIIs
3.5.5 Trainings for IGAs
A common LIFT intervention was to provide trainings that would allow trainees to generate their own income. Other than trainings linked to the provision of inputs analysed in the previous paragraphs (such as fishing and home gardening), a wide set of vocational skills trainings were also conducted, as well as trainings to support business development and specialised trainings for CEWs.
To analyse the full range of these trainings was not possible in the course of this evaluation. First, the chosen IGAs for trainings varied extensively (from crab-trap-making, to beauty-salon development, to fuel-efficient stove-making). Second, different IPs often implemented the trainings in very different ways and very different contexts, meaning it was difficult to draw strong conclusions on which were most useful and effective.
Detail will therefore only be provided on CEWs, while findings on the other vocational and small business development trainings encountered during the fieldwork are briefly outlined below.
Positives The trainings were seen as useful, as they helped to generate and sustain at least a small income . The beauty salon and tailoring training, as well as the masonry and carpentry training, were all seen to increase income. For example, a beneficiary of masonry training stated the following:

Livelihoods and Food Security Trust Fund – Delta 1 Evaluation Report
Oxford Policy Management 54
“After getting the training on masonry, I worked as a mason. Thus I got extra income, about 2500 or 3000 kyats per day…”130
Similarly, women who had received tailoring training explained they could “not only save the expenditure for having the clothes made but also earn extra income”.131 This theme of saving on costs was repeated in a couple other FGDs, for example my men who had received mechanics trainings who could now “fix their own tools”.132 Saving of costs was the main focus of fuel-efficient stove-making trainings, considered successful by all trainees (but useless to make an income).
Negatives The quality of the products or services deriving from these IGAs, however, was not always as good as that of a professional, and as a result the income received was often low . Mechanics in Kyar Chaung explained they were using their skills, but their services were not high-quality enough to be able to serve as professional mechanics. Women trained in beauty-salon techniques were also serving other women in the village, but declared they were “too embarrassed and not good enough to be paid”133 for their services.
A second issue was that sometimes there was not enough demand locally . This was a particular issue for snack making, for example, where people complained they had been trained to make snacks that were either already widely available or irrelevant for local tastes. For tailors, the real issue was the competition of cheap Chinese ready-made clothes. "I do makeup very rarely because people can't afford it so I do it for free” 134 the beauty-salon trainee explained.
It should be noted that a couple of FGDs highlighted that the lack of demand in the village was due to the fact that too many people received the same training, an issue which should be kept in mind for future programming:
“Making crab trappers training was given to casual workers…It is very useful. Almost all poor people took the training, so we can’t make it for sales, but we can make it for our own and catch crabs…”135
“We want to learn making snacks which other villagers do not have. Training for making the same kind of snacks for every village reduces the market size since we can't go sell to other village”136
In a few cases, moreover, trainees found it difficult to procure inputs locally (e.g. spores for mushroom growing).
Overall assessment The trainings for IGAs were seen as useful and also helped to increase income, even if less than that of a professional.
130 Male poor and vulnerable, Ku Lar Ohn Pin Su, Bogale 131 Mixed (male and female) poor and vulnerable, Kant Ba Lar Su, Bogale 132 Male poor and vulnerable, Kyar Chaung, Labutta 133 Female poor and vulnerable, Ma Gu Ywar Ma, Bogale 134 Female poor and vulnerable, Ma Gu Ywar Ma, Bogale 135 Male poor and vulnerable, Kyar Chaung, Labutta 136 Male poor and vulnerable, Kyar Chaung, Labutta

Livelihoods and Food Security Trust Fund – Delta 1 Evaluation Report
Oxford Policy Management 55
Table 3.16 Overall assessment – trainings for IGAs
training result
Beauty salon Often limited demand, but still helped sustain income (even if low),
Masonry and carpenter Helped to increase income (even if low), but quality of output lower than professionals
Mechanic repair training Beneficial to reduce costs, make (very) small income, fix own machinery (upkeep)
Tailoring training Useful to generate small income – though difficult to compete with low priced Chinese products. Mostly used to fix clothes and tarpaulins
Stove making Reported to be good for income (stoves sold), but not necessarily sustainable as a business (as knowledge of how to make stoves spreads). Successful in reducing firewood consumption as much as 50%.
Making snacks Demand too low for high cost snacks that are not relevant to local context
Making crab trappers, Not a business as knowledge spread, but useful for household consumption.
Book-keeping and management
Good for running a business systematically
Note: Results per training based on 1 or 2 focus groups only, as there was a wide spread of IGAs
3.5.5.2 CEWs A special type of training on animal care was provided to selected villagers to become CEWs (also known as livestock extension workers). Implementation The training process is best described via example, though it varied consistently across IPs. The only element that appeared to be fixed was the approach to selecting training participants, i.e. those who were literate, active and enthusiastic to learn. For example, in Hnar Nit Pauk, an IP called an eager villager for animal care training. His story is narrated below:
“I was selected at the village meeting to attend animal husbandry training in Bogalay. Only one person was selected. The whole village agreed that I am suitable as I have previous experience in caring for animals. The training lasted for six days and over 100 trainees attended. That training covered vaccination of buffaloes, cows, pigs and fowl, what are common and seasonal diseases, and how to feed animals properly. In August 2010, I was given medicines to use.
I gave training seven times a month. I received 3,000 Kyats/day honorarium and so far I have given over 30 training sessions. Villagers are beginning to use this newly gained knowledge in the tending of domestic animals.
In the past, many buffaloes died due to illness, but nowadays they no longer die as they were vaccinated. I follow how many injections or in which month the injection should be made. As a volunteer I do not charge.

Livelihoods and Food Security Trust Fund – Delta 1 Evaluation Report
Oxford Policy Management 56
Now I need to buy more medicine... I would like to attend more training on animal husbandry. I know I need to learn a lot more! Besides, I would like to provide training on how to care for domestic and farm animals.”137
A second example is provided in Box 3.2 below.
Box 3.3 Livestock extension worker
It was maybe 2009 when [IP name] came to our village to ask who would have time and interest to become a livestock extension worker. No-one really had time, so I decided to go – I was 18 at the time. The training was in Yangon, at the department for veterinary studies. I spent 17 days there, supported by [name of IP] for travel and accommodation. There were about 40 of us at the training from Bogale and Pyapon – most of us were young, only one or two were 40 or 50. Our training was mostly focused on pigs; that is what is relevant to us in our area as we don’t have much big livestock. We learned about pigs’ pregnancy, the diseases they can have and how to recognise the signs, as well as what vaccines to use in each case. The knowledge was all very applicable to us as it focused on real situations. For example, we learned how to measure the temperature of a pig and what to do if it is not 104 degrees as it should be. Since I’ve come back home I’ve given shots to about ten pigs – only in this last season as before the pigs never got sick. Because of the change in season, pigs get sick with a runny nose like people! All the pigs I vaccine survived… so that is good. But some people in the village still don’t know they can use my services and a few don’t trust me or can’t afford my help. Several pigs have died here, especially the types that are not local. (…) I cannot have a regular income from this job. What people pay me depends on the size of the pig and the amount of vaccine I use, but I normally charge 1,000 Kyats. I just do this to help people, as a service for the community. I don’t do it for business! I don’t want to charge a lot; no-one is well off here. For now, I don’t have any costs: I was given five different bottles of vaccine containing 100 ml each by [name of IP], but when it runs out I will buy more in Bogale – it’s quite easy to find. I’ve already had a four-day follow-up training session in Bogale this year, but of course would want more training, as my knowledge is not enough yet. But I’m only interested in the animals available here! In the meantime, to make an income, I use my motorcycle as a taxi…
Positive aspects The CEW was seen to protect animals from the danger of diseases and was generally viewed as a very useful resource-person to have at the community level (both in terms of preventative care and in case of emergencies):
“The CEW comes and provides veterinary treatment for the animals.”138
“The CEW provides animal care services. He treated the pigs and goats and charged 500 Kyats for it.”139
“The guy who received training on animal care looks after our livestock. He came and gave an injection to the pig and it got better… the training was good for us all.”140
137 Key informant interview with livestock extension worker, Hnar Nit Pauk, Bogale 138 Poor and vulnerable, Htin Pon Kwin, Laputta 139 Rice farmers who did not participate in seed bank, Htin Pon Kwin, Laputta
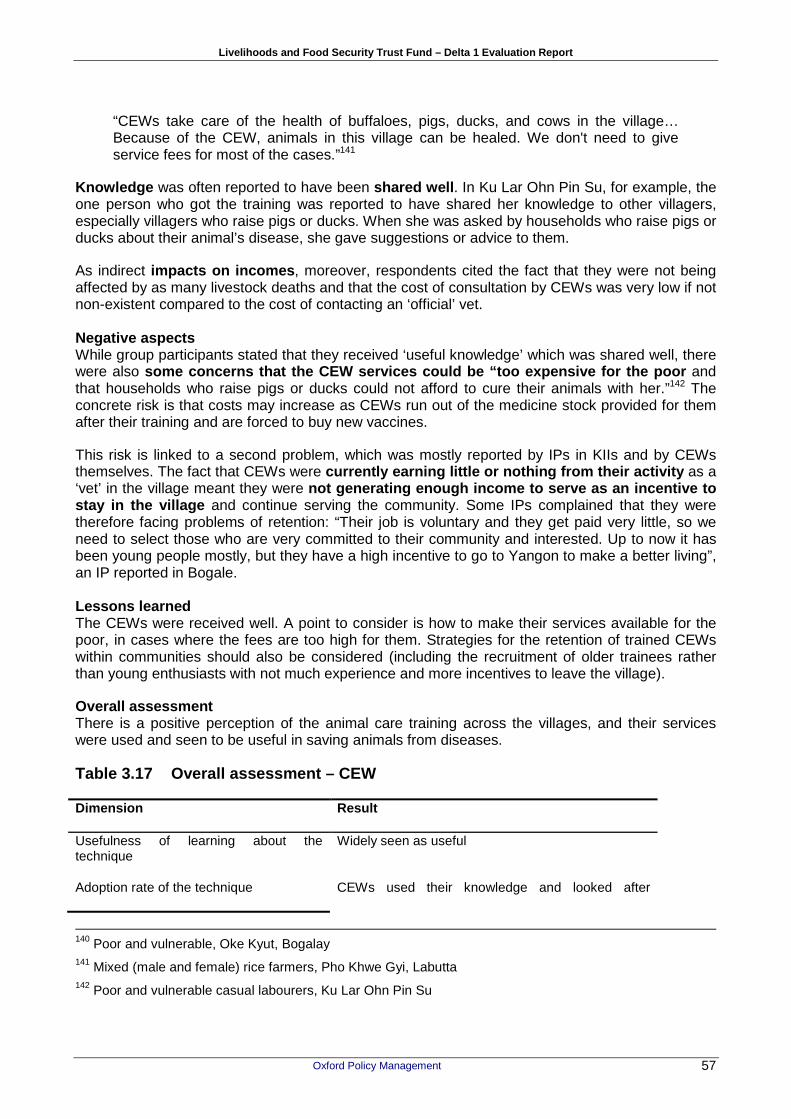
Livelihoods and Food Security Trust Fund – Delta 1 Evaluation Report
Oxford Policy Management 57
“CEWs take care of the health of buffaloes, pigs, ducks, and cows in the village… Because of the CEW, animals in this village can be healed. We don't need to give service fees for most of the cases.”141
Knowledge was often reported to have been shared well . In Ku Lar Ohn Pin Su, for example, the one person who got the training was reported to have shared her knowledge to other villagers, especially villagers who raise pigs or ducks. When she was asked by households who raise pigs or ducks about their animal’s disease, she gave suggestions or advice to them.
As indirect impacts on incomes , moreover, respondents cited the fact that they were not being affected by as many livestock deaths and that the cost of consultation by CEWs was very low if not non-existent compared to the cost of contacting an ‘official’ vet. Negative aspects While group participants stated that they received ‘useful knowledge’ which was shared well, there were also some concerns that the CEW services could be “too e xpensive for the poor and that households who raise pigs or ducks could not afford to cure their animals with her.”142 The concrete risk is that costs may increase as CEWs run out of the medicine stock provided for them after their training and are forced to buy new vaccines.
This risk is linked to a second problem, which was mostly reported by IPs in KIIs and by CEWs themselves. The fact that CEWs were currently earning little or nothing from their acti vity as a ‘vet’ in the village meant they were not generating enough income to serve as an incent ive to stay in the village and continue serving the community. Some IPs complained that they were therefore facing problems of retention: “Their job is voluntary and they get paid very little, so we need to select those who are very committed to their community and interested. Up to now it has been young people mostly, but they have a high incentive to go to Yangon to make a better living”, an IP reported in Bogale. Lessons learned The CEWs were received well. A point to consider is how to make their services available for the poor, in cases where the fees are too high for them. Strategies for the retention of trained CEWs within communities should also be considered (including the recruitment of older trainees rather than young enthusiasts with not much experience and more incentives to leave the village).
Overall assessment
There is a positive perception of the animal care training across the villages, and their services were used and seen to be useful in saving animals from diseases.
Table 3.17 Overall assessment – CEW
Dimension Result
Usefulness of learning about the technique
Widely seen as useful
Adoption rate of the technique CEWs used their knowledge and looked after
140 Poor and vulnerable, Oke Kyut, Bogalay 141 Mixed (male and female) rice farmers, Pho Khwe Gyi, Labutta 142 Poor and vulnerable casual labourers, Ku Lar Ohn Pin Su

Livelihoods and Food Security Trust Fund – Delta 1 Evaluation Report
Oxford Policy Management 58
Dimension Result
animals
Increase in income as a result of using the technique
Indirectly by saving costs compared to more expensive vets and by treating animals earlier
Sustainability As long as the CEW stays and retrains
Number of FGDs Eight across five villages
3.6 Revolving funds, SHGs, seed banks and rice bank s
3.6.1 Introduction
An important set of LIFT interventions involved the formation of groups to collectively manage an asset of some sort (e.g. animals, cash). These included revolving funds of cash and assets and SHGs (also known as Self Reliance Groups). The difference between revolving funds and SHGs was sometimes blurred, but mostly related to the size and openness of the group as well as the importance of savings. Revolving funds were open more widely within villages (including many of the poorest and most vulnerable households), while SHGs were smaller, with more uniform composition and usually only female members. Both revolving funds and SHGs required contributions from members (including membership fees), and in many cases both received external capital or support. Nevertheless, SHGs were more often based on participants’ saving capacity compared to revolving funds.
For example, an IP may provide cash to a revolving fund, and that cash was lent to group members at a low interest rate (2–3%, compared to 6–8% from money lenders). In many cases the group members had to meet regularly and someone who borrowed money typically had to pay it back within six months with interest (there were many variants with, for example, fishermen having to pay the loan back within a month).
The group earned the interest, which then allowed it to make investments and/or lend more money. In one case, the earnings from interest were substantial enough to build a clinic (Kwin Wyne). In a typical case of a SHG, the initial money would be collected via savings by the group members (e.g. by way of daily or weekly savings), until there was enough money to provide a loan to one group member. In the case of an in-kind revolving fund, assets were given to a group, such as piglets. Some group members received the piglets, raised them and (unless they died beforehand) obtained new piglets. They repaid the group with the piglets and kept the others for themselves. Then, other group members received the piglets.
3.6.2 Revolving funds
The basic principle of a revolving fund is described above, i.e. cash or assets are given to a group, which then gives it to selected group members. They pay the asset back (with interest) at an appropriate pre-agreed time (e.g. after several months). Then, the asset is given to other group members.
Livelihoods and Food Security Trust Fund – Delta 1 Evaluation Report
Oxford Policy Management 59
Often, particularly poor and vulnerable community members were selected for the revolving fund, such as poorest households, landless, households headed by poor women, the elderly, ill people, households with disabled members, large households, farmers with less than 10 acres of land, etc. In other words, there was a focus on the poor and vulnerable.
3.6.2.1 In cash According to the quantitative survey, 27% of households lived in villages where a revolving fund of cash was set up, with 11% (n=87) of all households benefitting/participating, making it one of the activities most widely participated in. Almost all of those who participated also felt that it had contributed to increasing their income (n=84; 11% of all) and that it helped to improve food security (n=82, 10% of all).
A good example of a revolving fund in cash is found in Kwin Wyne. A revolving fund was established there in August 2010 for farmers, casual labourers and fishermen. Farmers had to return money every six months, casual labourers every three months, and fishermen every month. Loans had been offered to farmers three times, two times to casual labourers and seven times to fishermen. The group structure and regularity of meetings appeared to have helped to increase discipline among group members.
Another example of a revolving fund is from Ku Lar Ohn Pin Su. [The IP] gave about 0.8 million Kyats to casual labourers to buy the inputs for small livestock and a grocery store. The casual labourers who got capital with 3% interest rate to buy inputs had to pay money back to the leader of the casual labourer revolving fund group in regular instalments (every 15 days). The group consisted of 23 casual labourers, and there was a member fee of 1,000 Kyats.
Positive aspects The most often cited positive aspect of revolving funds was the fact that interest rates were much lower than the market rate (which was reported as between 5–10%143). The interest rate charged by revolving funds was typically 2–3%. This guaranteed access to credit for those who were often unable to take on loans or pay them back and more generally was seen to contribute to the reduction of people’s debt spiral and negative coping strategies .144 At the same time, several respondents highlighted how these low-interest loans allowed beneficiaries to expand their business and therefore secure an income .
“The revolving fund was the best activity. Only 2% interest… If we took a loan from others, it's 15% interest. And now people have more job opportunities since they can expand their business.”145
“It's extremely useful for our business – the interest rate is much lower than any we could get elsewhere. It is the best way to increase our income.”146
143 Interest rates for private money lenders varied. For example, a FGD of poor and vulnerable in Ku Lar Ohn Pin Su (Bogale) referred to an “8% or 10% interest rate from a money lender”. Rice farmers in Kwin Wyne (Pyapon) stated that “private money lenders charge an interest rate of 10%”. A FGD with rice farmers in Bonlon Chaung (Kyaiklat) reported that “private money lenders charge interest of 6 or 8%”. LIFT’s own research found that it can be as low as 5% to 8% a month if the borrower has collateral (e.g. gold). 144 Interestingly, as a result of these lower rates, an anecdotal story from Bonlon Chaung (Kyaiklat) reported that money lenders had also started to charge lower interest, being driven down by the competition. 145 Village Authority, Zin Baung, Pyapon 146 Female poor and vulnerable, Ku Lar Ohn Pin Su, Bogale

Livelihoods and Food Security Trust Fund – Delta 1 Evaluation Report
Oxford Policy Management 60
“The revolving fund is also good for rice farmers’ income because they can borrow money at a low interest rate and it is not necessary to sell paddy seeds in advance at half price. As a consequence, farmers’ income increased.”147
“Because of the revolving fund, we get income from home gardening and can invest in the farm… so we are relieved and enjoy a higher income. Accordingly, we can buy more food to eat.”148
In some cases, revolving funds were so successful they were not only capable of expanding the number of participants, but also able to finance public works in the village with the procee ds from interest rates . In Kwin Wyne (a village of 223 households where more than half of the population received a loan), for example, funds collected through the revolving fund were sufficiently large to construct a clinic, pave lanes in front of the school and set up a water pump.
The quote below exemplifies the slow expansion of a revolving fund in Ku Lar Ohn Pin Su and the beneficial effect this had on casual labourers who would otherwise be denied access to credit:
“No-one wants to lend that amount of money [120,000 Kyats] to a casual labourer because of no trusts in us. Now, we can borrow money from the revolving fund at a low interest rate and then we also do the business that we want. The revolving fund members have thus increased to 23.”149
Casual labourers also benefited from some ripple effects from revolving funds. As a member of a FGD in Zin Baung stated:
“With the revolving funds and training, small farmers could hire casual labour, so they also got jobs and increased income… the revolving fund helps farmers to afford labour costs for transplanting and harvesting activities.”
In Kyauk Ta Lone (Ngapudaw), people also reported learning to work as a team and within an organisation .
Lastly, an important aspect that was mentioned frequently was the sustainability of revolving funds, directly linked to their capacity to expand their base through the collection of interest rates (and avoiding loan defaults). For example:
“We don't believe in just giving people things, there needs to be an effort from the community as well – they need to share the responsibility or they will not value what they get. And so the revolving fund helps sustainability of other activities and – if managed well – can be very sustainable itself.”150
“The revolving fund has increased in terms of money because of the interest charged. So, it is a sustainable source of credit in the village.”151
147 Male rice farmers, Ku Lar Ohn Pin Su, Bogale 148 Mixed (male and female) rice farmers, FFS participants/Farmer extension group training participants, Kwin Wyne, Pyapon 149 Female poor and vulnerable, Ku Lar Ohn Pin Su, Bogale 150 IP, Bogale 151 Male rice farmers, Bonlon Chaung, Kyaiklat
Livelihoods and Food Security Trust Fund – Delta 1 Evaluation Report
Oxford Policy Management 61
Negative aspects The only major issue with revolving funds was mentioned by IPs and by the CBO members responsible for its implementation. According to them, there was a risk that the whole sustainability of the fund could be menaced by loan defaults . This problem was worsened by the fact that revolving funds have no legal measure to enforce repayments, meaning that when people choose not to pay back there is little that can be done.
In Kwin Wyne, a group of poor women who are casual labourers explained that 35 out of 70 casual workers were firstly given loans by the revolving fund. Only 19 or 20 returned the money borrowed. Some delayed repayment. Moreover, respondents complained that the money borrowed was not enough to buy larger inputs .
Lessons learned There were several examples of revolving funds that have developed well and have become more sustainable. It was also the activity that benefitted more people than any other activity, bar CfW programmes.
A problem was that some group members did not pay back their loan, thereby depriving the group of income, and undermining a sense of solidarity (in as far as the group had one). This was aggravated by the fact that IPs often had little space for legal action, leaving them incapable of having any leverage against defaulting members.
Hence, it will be useful to help group leaders enforce the repayment plans, provided group leaders use such a support with consideration.
One IP also suggested creating 'zone' committees (they had been experimenting with groups of 18 villages, with three people from each village). Members of such committees would meet once a month to discuss the weaknesses and strengths of revolving funds and share knowledge, so as to strengthen management and increase overall sustainability.
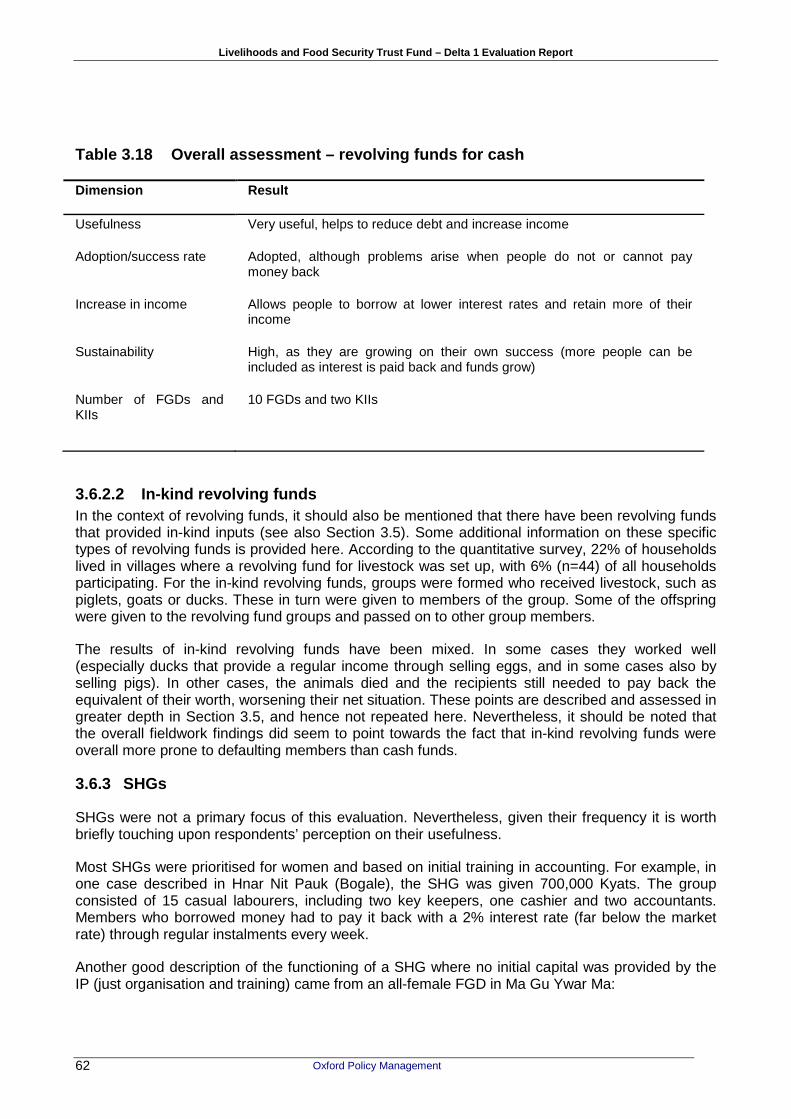
Livelihoods and Food Security Trust Fund – Delta 1 Evaluation Report
Oxford Policy Management 62
Table 3.18 Overall assessment – revolving funds for cash
Dimension Result
Usefulness Very useful, helps to reduce debt and increase income
Adoption/success rate Adopted, although problems arise when people do not or cannot pay money back
Increase in income Allows people to borrow at lower interest rates and retain more of their income
Sustainability High, as they are growing on their own success (more people can be included as interest is paid back and funds grow)
Number of FGDs and KIIs
10 FGDs and two KIIs
3.6.2.2 In-kind revolving funds In the context of revolving funds, it should also be mentioned that there have been revolving funds that provided in-kind inputs (see also Section 3.5). Some additional information on these specific types of revolving funds is provided here. According to the quantitative survey, 22% of households lived in villages where a revolving fund for livestock was set up, with 6% (n=44) of all households participating. For the in-kind revolving funds, groups were formed who received livestock, such as piglets, goats or ducks. These in turn were given to members of the group. Some of the offspring were given to the revolving fund groups and passed on to other group members.
The results of in-kind revolving funds have been mixed. In some cases they worked well (especially ducks that provide a regular income through selling eggs, and in some cases also by selling pigs). In other cases, the animals died and the recipients still needed to pay back the equivalent of their worth, worsening their net situation. These points are described and assessed in greater depth in Section 3.5, and hence not repeated here. Nevertheless, it should be noted that the overall fieldwork findings did seem to point towards the fact that in-kind revolving funds were overall more prone to defaulting members than cash funds.
3.6.3 SHGs
SHGs were not a primary focus of this evaluation. Nevertheless, given their frequency it is worth briefly touching upon respondents’ perception on their usefulness.
Most SHGs were prioritised for women and based on initial training in accounting. For example, in one case described in Hnar Nit Pauk (Bogale), the SHG was given 700,000 Kyats. The group consisted of 15 casual labourers, including two key keepers, one cashier and two accountants. Members who borrowed money had to pay it back with a 2% interest rate (far below the market rate) through regular instalments every week.
Another good description of the functioning of a SHG where no initial capital was provided by the IP (just organisation and training) came from an all-female FGD in Ma Gu Ywar Ma:

Livelihoods and Food Security Trust Fund – Delta 1 Evaluation Report
Oxford Policy Management 63
“There are 13 members in our SHG. Each group member always saves about 300 or 500 Kyats. After saving up for about two weeks, our group had about 3,900 Kyats. We then lent this money with a 3% interest rate to one member who got number one by lucky draw. She had to pay back this money including the interest within two months… and then lent to another member.”
Positive aspects The positive aspects of the SHGs were strongly stressed by respondents. Interest rates reported to be charged by private money lenders varied between 5% and 10% per month. Accordingly, credit at 2% or 3% per month was often seen as extr emely low and helpful . The advantages of an increasing pot of money were also described by all SHG participants interviewed for the study.
“The SHG allows the poor to take loans with low interest rates... Previously, they had to take loans from money lenders with 15% to 20% interest rate... They now do not need to incur such a cost and can expand their businesses with more capital, and thus increase income.”152
Importantly (and unsurprisingly), SHGs were seen as having very positive effects on women’s sense of self-worth :
“Women are now less dependent on their husbands since they can even earn their own money from home gardening, tailoring, and can get loans from the SHG with a 3% interest rate...”153
The story of a woman’s experience with the SHG is emblematic this way:
“First, I got 150,000 Kyats for a grocery store. I set up that store with the money from [IP name]. And then, I needed more capital for my grocery store… so I got a loan from the SHG at a low interest rate to add a lot of goods to my grocery store. My business now runs like a circle.”154
Negative aspects Despite these extremely positive perspectives, one big limitation of SHGs was pointed out in a couple of cases: the fact that by definition it was mostly aimed at improving the livelihoods of those who were already slightly better off (and who could afford to save).
Lessons learned Overall, including comments from the IP reports and findings from this study, the feeling was that SHGs were an extremely useful complementary tool to other interventions, but not a solution for the poorest and most vulnerable households. Similarly, it was also found that SHGs were most likely to be effective when they were relatively small and homogenous and focused on savings.
Table 3.19 Overall assessment – SHGs
Dimension Result
Usefulness Very useful for access to credit of those involved
152 Male poor and vulnerable, Kyaung Su, Bogale 153 Female poor and vulnerable, Kyaung Su, Bogale 154 Female poor and vulnerable, Hnar Nit Pauk, Bogale

Livelihoods and Food Security Trust Fund – Delta 1 Evaluation Report
Oxford Policy Management 64
Adoption/success rate For those who participated, very successful
Increase in income Yes, through business expansion etc.
Sustainability Sustainable
3.6.4 Seed banks
Overall targeting and implementation155 Within the study villages, seed banks were established in Ma Gu Ywar Ma, Kyaung Su and Oke Kyut in Bogale and Htin Pon Kwin in Labutta. In these four villages, the targeting of participants for the seed bank was more or less uniform, with rice farmers being selected according to the amount of land they owned (less than 20, 15 or 10 acres, depending on the village characteristics and land concentration). In Ma Gu Ywar Ma, for example, a young group of FFS participants explained:
“Five baskets of paddy seed were given to every member of four small farmer groups that had been created to share power tillers... they all had less than 15 acres. In total, about 200 baskets of paddy seed were given by [Name of IP]and every farmer who received five baskets has to pay back seven and a half baskets at the harvesting time for the seed bank. Next year, the total amount of seed at the seed bank will be about 400 baskets...”
Similarly, farmers in Htin Pon Kwin (Labutta) described the functioning of their seed bank:
“[The IP] built a seed bank which could contain 2,000 baskets of rice seeds. Farmers who own less than 20 acres came and put their rice seeds in the seed bank. Then, a seed bank supervisory committee was formed… Any farmer who received cash assistance put 14 baskets into the seed bank after harvest season. They could always take the rice back, but two baskets had to be put aside for rice bank maintenance costs. The objectives of building the rice bank were to keep good quality seeds, to keep rice seeds safely and for emergency purposes in case of a food shortage in the village.”
Positive aspects Overall, evidence from the study shows that the seed banks that were established by LIFT were perceived as very successful and sustainable. For example, in no case was there reporting of rice farmers not respecting the reinvestment ‘rule’ that is implicit in the rice bank functioning.
Among the reasons that were cited in order to explain the usefulness of the seed banks, the most common was the fact that seed banks (and the initial provision of seeds that accompanies their establishment) help to secure good quality seeds that give higher yields (and therefore have an indirect impact on incomes). As a farmer clearly put it in Htin Pon Kwin (Labutta), “farmers can get good quality seeds from the seed bank, so good seeds result in good yield.” This opinion was shared by FGD participants in the four villages.
155 Quantitative figures for seed banks do not exist, only for revolving funds for seeds. According to the quantitative survey,13% of households lived in villages where a revolving fund for seeds was set up, with 2% (n=17) of all households benefitting/participating. Almost all of those who participated also felt that it had contributed to increasing their income (n=16; 2% of all) and that it helped to improve food security (n=16, 2% of all).

Livelihoods and Food Security Trust Fund – Delta 1 Evaluation Report
Oxford Policy Management 65
A second important reason was the fact that seed banks reduced storage risks and ensured sufficient seeds for the next season : “Before the seed bank was built, seeds were kept just carelessly and damaged by water, mice and other pests, resulting in lower yield. Now, seeds can be kept in the bank so they are safe, with no damage… and the rice yield is higher”, farmers recounted, adding that “if there were no seed bank, we may not have enough seeds for next year.”156
At the same time, respondents also felt that seed banks were helping them to reduce their debt cycle , as they gave them access to seeds at a lower interest rate than if they were borrowing seeds or cash for investment elsewhere.
All of the considerations above led rice farmers to consider seed banks very sustainable , as they were an important resource that benefitted them all, without any large incentives to default.
Negative aspects When asked to consider the negative aspects of seed banks, FGD participants struggled. Referring to the provision of seeds that often accompanies the establishment of a rice bank, one group in Kyaung Su (Bogale) commented that if seeds are provided too late they cannot be used for planting but only for household consumption. A couple of groups also mentioned that if farmers have systematic crop failure, seed banks would not be sustainable as people would not be able to re-deposit their seeds.
Lessons learned Training in warehouse management may be useful. Further learning is needed on silos, as they appear not to have been used (framers preferred to store their paddy in separate bags).
Table 3.20 Overall assessment – seed banks
Dimension Result
Usefulness Widely perceived as very useful and relevant
Adoption/success rate High. All seed banks were still functioning and no participants were reported to have defaulted
Increase in income Yes (higher yields, less waste, less debt)
Sustainability Widely perceived as sustainable, except for systemic risk
Number of FGDs and KIIs Nine FGDs and four KIIs
3.6.5 Rice banks
Of all the study villages, a rice bank had been established only in Kyauk Ta Lone, Ngapudaw. In that village, the rice that was stored was bought thanks to the interest gained from other livelihood development activities in the village funded through the revolving fund. The proper functioning of the bank was then ensured through the CBO committee.
156 Male rice farmers, Htin Pon Kwin, Labutta
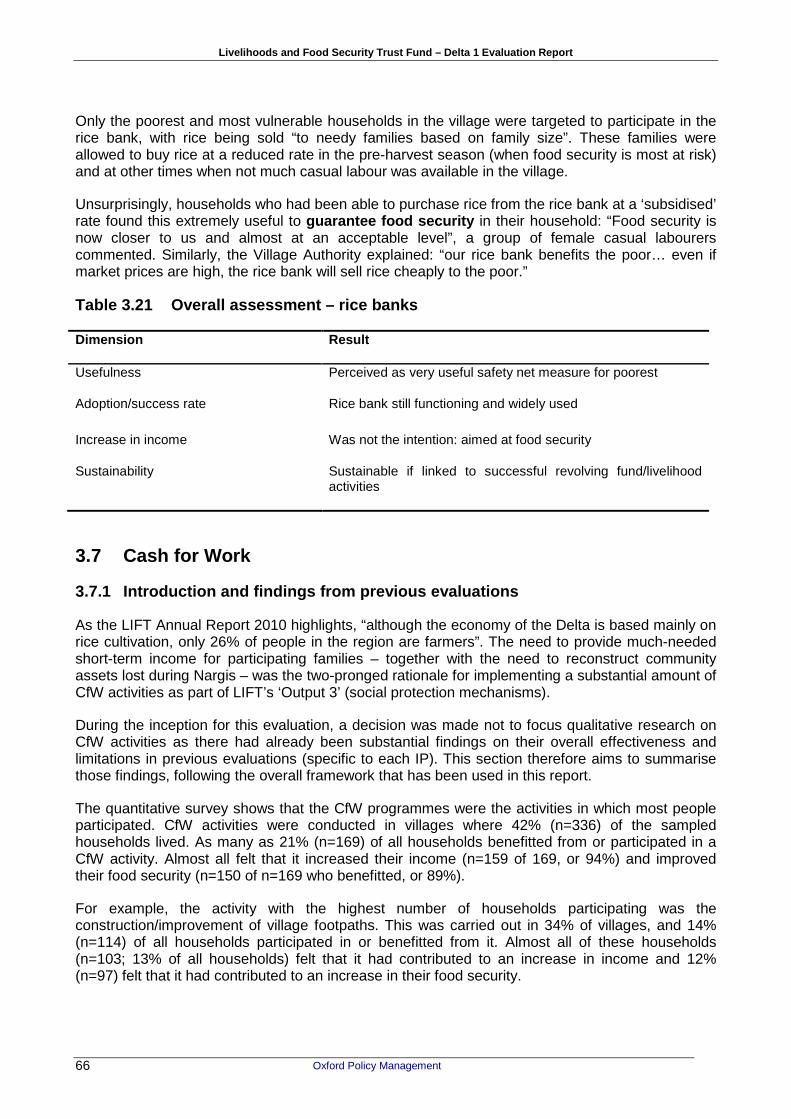
Livelihoods and Food Security Trust Fund – Delta 1 Evaluation Report
Oxford Policy Management 66
Only the poorest and most vulnerable households in the village were targeted to participate in the rice bank, with rice being sold “to needy families based on family size”. These families were allowed to buy rice at a reduced rate in the pre-harvest season (when food security is most at risk) and at other times when not much casual labour was available in the village.
Unsurprisingly, households who had been able to purchase rice from the rice bank at a ‘subsidised’ rate found this extremely useful to guarantee food security in their household: “Food security is now closer to us and almost at an acceptable level”, a group of female casual labourers commented. Similarly, the Village Authority explained: “our rice bank benefits the poor… even if market prices are high, the rice bank will sell rice cheaply to the poor.”
Table 3.21 Overall assessment – rice banks
Dimension Result
Usefulness Perceived as very useful safety net measure for poorest
Adoption/success rate Rice bank still functioning and widely used
Increase in income Was not the intention: aimed at food security
Sustainability Sustainable if linked to successful revolving fund/livelihood activities
3.7 Cash for Work
3.7.1 Introduction and findings from previous evalu ations
As the LIFT Annual Report 2010 highlights, “although the economy of the Delta is based mainly on rice cultivation, only 26% of people in the region are farmers”. The need to provide much-needed short-term income for participating families – together with the need to reconstruct community assets lost during Nargis – was the two-pronged rationale for implementing a substantial amount of CfW activities as part of LIFT’s ‘Output 3’ (social protection mechanisms).
During the inception for this evaluation, a decision was made not to focus qualitative research on CfW activities as there had already been substantial findings on their overall effectiveness and limitations in previous evaluations (specific to each IP). This section therefore aims to summarise those findings, following the overall framework that has been used in this report.
The quantitative survey shows that the CfW programmes were the activities in which most people participated. CfW activities were conducted in villages where 42% (n=336) of the sampled households lived. As many as 21% (n=169) of all households benefitted from or participated in a CfW activity. Almost all felt that it increased their income (n=159 of 169, or 94%) and improved their food security (n=150 of n=169 who benefitted, or 89%).
For example, the activity with the highest number of households participating was the construction/improvement of village footpaths. This was carried out in 34% of villages, and 14% (n=114) of all households participated in or benefitted from it. Almost all of these households (n=103; 13% of all households) felt that it had contributed to an increase in income and 12% (n=97) felt that it had contributed to an increase in their food security.

Livelihoods and Food Security Trust Fund – Delta 1 Evaluation Report
Oxford Policy Management 67
Positive aspects The objective of providing short-term relief to households’ income appears to have been reached by the IPs involved in the provision of CfW (though the amounts provided varied considerably and were in some cases extremely low, as the LIFT 2010 report stresses). For example, the LWF evaluation report explains that the “economic benefit (of CfW) was short-term but not insignificant”. According to the report, “it covered an income gap for about a month, and was mainly used for food”; however, “it will not on its own have a lasting impact on income opportunities”. Similarly, Save the Children’s evaluation report also stresses short-term benefits, including the reduction of negative coping strategies such as taking out loans at high interest rates or selling labour in advance.
The second objective of providing much-needed infrastructure was also partially achieved, with mixed results reported in some cases.
Importantly, these IPs also reported that “landless viewed the wage levels as fair ” and “on par with other odd jobs in the area (around 2,000–2,500 Kyats per day)”.
Negative aspects and limitations The implementing partner evaluation and end-of-year reports highlighted that possibly the main problem with the provision of CfW was its timing . The ADRA-ActionAid-ECODEV evaluation report, for example, stresses that CfW activities were not appropriately planned to coincide with the annual periods of low labour demand and high food insecurity157 (this is clearly shown in Figure 3.5 below). In line with this, the LIFT 2010 report (together with several other sources), recommends that “the best times for implementing CfW in the Delta are February to May (before the start of cultivation); and, October to December, after planting but before the harvesting of paddy fields”158. On the other hand, during the survey in November 2011, harvesting had in fact started in some villages in mid-November.
157 Specifically, the report explains: “The requirements for casual labor correspond to the rice paddy production. The high seasons for labor demand are in July and August, and from November to January. Some cash for work was carried out in July and August; June and July being periods of higher casual labor demand. Cash for work days provided increased considerably in September (3550) and October (3912), corresponding to both a period of low casual labor demand in the district and the predicted peak of the second hunger season of 2010, an opportune time that was targeted by the project. But, by the end of October only 40% of the target work days had been provided. In November 2010 and therefore at the end of the hunger season and the first month of a higher labor demand period, more than 7000 work days, nearly as many days as in the two months prior, were completed”. 158 Note, however, that harvesting can happen as early as mid-November.

Livelihoods and Food Security Trust Fund – Delta 1 Evaluation Report
Oxford Policy Management 68
Figure 3.5 Total number of work days per month and periods of high labour demand and hunger season
Source: ADRA-ActionAid-ECODEV Evaluation Report
Similarly, the LWF evaluation report explains that “timeliness of implementation was a problem in some cases where activities were delayed and/or coincided with periods when landless were busy with fishing or when rainy weather made it unfeasible to carry out the activity”. Importantly, it also reports that, in a few problematic and isolated cases in the south, the “landless were told by the VDCs to carry out the work despite the fact that they could make more money fishing during the same period”.
A further problem stressed by the HelpAge report159 was the redirection of CfW budgets . Specifically, a lot of the money destined to CfW ended up being used “to buy further construction material” (51% of 8.9 million Kyats designated for cash labour in ten villages) and households were only employed for a low amount of days and then expected to ‘volunteer’ their time to complete the construction. This of course defeats the ‘social protection’ orientation of the whole activity.
Finally, some concerns were raised around the targeting of CfW. The LIFT 2010 report notes that “on average, 80% to 100% of all households in a village participated in CfW activities with little targeting of the poor and vulnerable.”160
159 This includes the Network Action Group, Leprosy Mission International, and Golden Plains Agricultural Cooperative, who jointly implemented a project titled RESOLVE (Restoring Enabling and Sustaining of Livelihoods of Vulnerable/Excluded Persons in Kyaitlat). 160 The report also stresses that: “In some cases the lack of targeting appears to be due to a conceptual misunderstanding of the rationale for CfW. However, the main reason was that targeting was strongly resisted in many villages as all households were seen have been affected by Cyclone Nargis, and traditionally, communal activities are carried out by all villagers believing that they will gain merit by being involved in these activities. Targeting in the future will require significant work with communities to convince them of the social protection objectives”

Livelihoods and Food Security Trust Fund – Delta 1 Evaluation Report
Oxford Policy Management 69
Table 3.22 Overall assessment – CfW programmes
Dimension Result
Usefulness Perceived as useful in the short term and very good for reconstruction of assets
Adoption/success rate Positive
Increase in income Mixed. Only in short term and often for very few days
Sustainability CfW programmes are not, but outputs are sustainable
3.7.2 Outputs of CfW: dykes
Within the study villages, a focus on the output of CfW – and specifically the construction of dykes – was explored in Shwe Kyun Thar (Labutta).
Overall, the construction of dykes turned out to be an effective measure to rebuild the livelihoods of rice farmers and the poor and vulnerable in one go. The CfW was specifically conducted in the period when fewer jobs are available in the village, meaning that causal labourers greatly benefitted from the additional income source. “Dyke construction provided jobs for poor people when they most needed it”, the Village Authority reported.
Once the public works were conducted, moreover, the perceived benefits of the dykes were multiple: “Dykes prevented damage caused by salt water which occasionally enters the paddy fields and destroys both the soil and crops”, one farmer commented. “After building the dykes, rice production increased ”, he added, in line with all other respondents in the village. In more detail, a group of farmers explained:
“Before dykes were built, almost every year the paddy fields were flooded in the rainy season and dried up in winter and summer time, affecting the paddy and the harvest. After the dykes were constructed the right level of water was allowed to remain in the paddy fields, resulting in higher yields. Once farmers earned higher incomes they also offered more jobs to the poor and casual labourers… so we all really benefitted!”
Interestingly, the wider benefits of the dykes were also felt to have had an impact on poorer households, as “families could catch fish in the paddy fields and not necessary to go to river for fishing.”161 Similarly, male casual labourers in the village reported that, “as water can be kept inside, people can get fish, prawn, crabs, frogs and make some income.”
Importantly, villagers also felt that dykes would have longer-term benefits :
“Dykes will last for years as they require regular yet non-extensive maintenance. Since the farmers know the benefits of the dykes, it is likely those farmers will put in the efforts to maintain them.”162
161 Village authority, Shwe Kyun Thar, Labutta 162 Mixed (male and female) rice farmers, Shwe Kyun Thar, Labutta
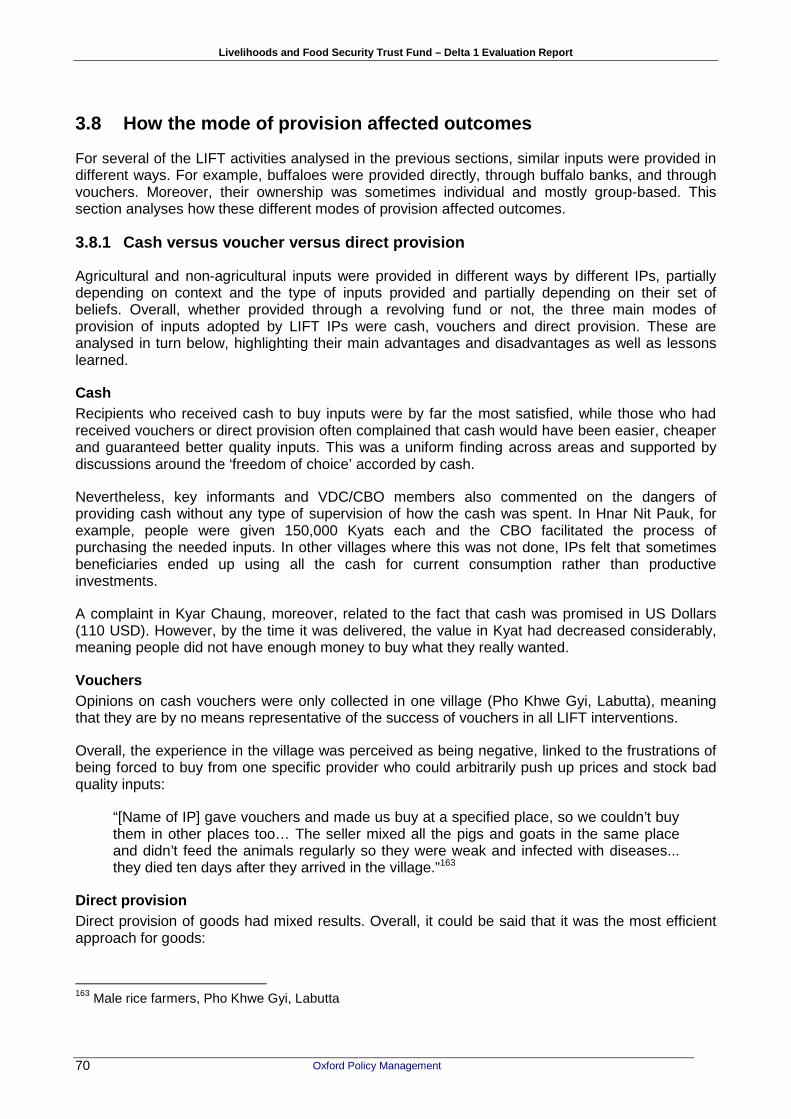
Livelihoods and Food Security Trust Fund – Delta 1 Evaluation Report
Oxford Policy Management 70
3.8 How the mode of provision affected outcomes
For several of the LIFT activities analysed in the previous sections, similar inputs were provided in different ways. For example, buffaloes were provided directly, through buffalo banks, and through vouchers. Moreover, their ownership was sometimes individual and mostly group-based. This section analyses how these different modes of provision affected outcomes.
3.8.1 Cash versus voucher versus direct provision
Agricultural and non-agricultural inputs were provided in different ways by different IPs, partially depending on context and the type of inputs provided and partially depending on their set of beliefs. Overall, whether provided through a revolving fund or not, the three main modes of provision of inputs adopted by LIFT IPs were cash, vouchers and direct provision. These are analysed in turn below, highlighting their main advantages and disadvantages as well as lessons learned.
Cash Recipients who received cash to buy inputs were by far the most satisfied, while those who had received vouchers or direct provision often complained that cash would have been easier, cheaper and guaranteed better quality inputs. This was a uniform finding across areas and supported by discussions around the ‘freedom of choice’ accorded by cash.
Nevertheless, key informants and VDC/CBO members also commented on the dangers of providing cash without any type of supervision of how the cash was spent. In Hnar Nit Pauk, for example, people were given 150,000 Kyats each and the CBO facilitated the process of purchasing the needed inputs. In other villages where this was not done, IPs felt that sometimes beneficiaries ended up using all the cash for current consumption rather than productive investments.
A complaint in Kyar Chaung, moreover, related to the fact that cash was promised in US Dollars (110 USD). However, by the time it was delivered, the value in Kyat had decreased considerably, meaning people did not have enough money to buy what they really wanted.
Vouchers Opinions on cash vouchers were only collected in one village (Pho Khwe Gyi, Labutta), meaning that they are by no means representative of the success of vouchers in all LIFT interventions.
Overall, the experience in the village was perceived as being negative, linked to the frustrations of being forced to buy from one specific provider who could arbitrarily push up prices and stock bad quality inputs:
“[Name of IP] gave vouchers and made us buy at a specified place, so we couldn’t buy them in other places too… The seller mixed all the pigs and goats in the same place and didn’t feed the animals regularly so they were weak and infected with diseases... they died ten days after they arrived in the village.”163
Direct provision Direct provision of goods had mixed results. Overall, it could be said that it was the most efficient approach for goods:
163 Male rice farmers, Pho Khwe Gyi, Labutta
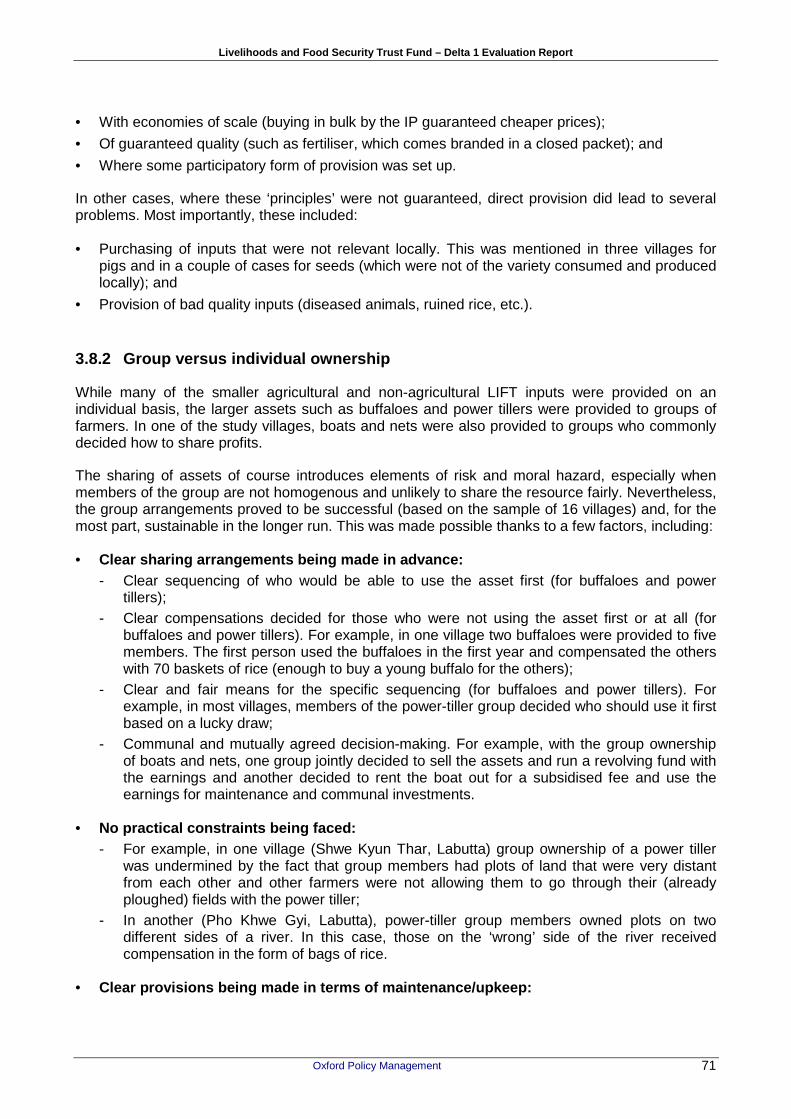
Livelihoods and Food Security Trust Fund – Delta 1 Evaluation Report
Oxford Policy Management 71
• With economies of scale (buying in bulk by the IP guaranteed cheaper prices);
• Of guaranteed quality (such as fertiliser, which comes branded in a closed packet); and
• Where some participatory form of provision was set up.
In other cases, where these ‘principles’ were not guaranteed, direct provision did lead to several problems. Most importantly, these included:
• Purchasing of inputs that were not relevant locally. This was mentioned in three villages for pigs and in a couple of cases for seeds (which were not of the variety consumed and produced locally); and
• Provision of bad quality inputs (diseased animals, ruined rice, etc.).
3.8.2 Group versus individual ownership
While many of the smaller agricultural and non-agricultural LIFT inputs were provided on an individual basis, the larger assets such as buffaloes and power tillers were provided to groups of farmers. In one of the study villages, boats and nets were also provided to groups who commonly decided how to share profits.
The sharing of assets of course introduces elements of risk and moral hazard, especially when members of the group are not homogenous and unlikely to share the resource fairly. Nevertheless, the group arrangements proved to be successful (based on the sample of 16 villages) and, for the most part, sustainable in the longer run. This was made possible thanks to a few factors, including:
• Clear sharing arrangements being made in advance: - Clear sequencing of who would be able to use the asset first (for buffaloes and power
tillers); - Clear compensations decided for those who were not using the asset first or at all (for
buffaloes and power tillers). For example, in one village two buffaloes were provided to five members. The first person used the buffaloes in the first year and compensated the others with 70 baskets of rice (enough to buy a young buffalo for the others);
- Clear and fair means for the specific sequencing (for buffaloes and power tillers). For example, in most villages, members of the power-tiller group decided who should use it first based on a lucky draw;
- Communal and mutually agreed decision-making. For example, with the group ownership of boats and nets, one group jointly decided to sell the assets and run a revolving fund with the earnings and another decided to rent the boat out for a subsidised fee and use the earnings for maintenance and communal investments.
• No practical constraints being faced: - For example, in one village (Shwe Kyun Thar, Labutta) group ownership of a power tiller
was undermined by the fact that group members had plots of land that were very distant from each other and other farmers were not allowing them to go through their (already ploughed) fields with the power tiller;
- In another (Pho Khwe Gyi, Labutta), power-tiller group members owned plots on two different sides of a river. In this case, those on the ‘wrong’ side of the river received compensation in the form of bags of rice.
• Clear provisions being made in terms of maintenance /upkeep:

Livelihoods and Food Security Trust Fund – Delta 1 Evaluation Report
Oxford Policy Management 72
- Small rental fees were charged in order to pay for upkeep and maintenance (power tillers, boats and nets);
- Mechanical training was provided for members of the group (power tillers).
Livelihoods and Food Security Trust Fund – Delta 1 Evaluation Report
Oxford Policy Management 73
3.9 Overall summary tables
The tables below provide an overview of all the separate assessment tables in this section in one single place. Broader lessons with respect to impact, sustainability and targeting are discussed in the next section.
A colour coding has been employed based on the authors’ judgement. For example, if an activity was widely perceived as being useful, it is shaded green. If it was adopted by some, but not others it is shaded yellow. If it was not useful at all, it would have been shaded red; however, none of the activities were useless. The colour coding is meant to help summarise information and allow a clear statement in regard to which activities have been effective overall (based on usefulness, adoption, increase in income and sustainability).

Livelihoods and Food Security Trust Fund – Delta 1 Evaluation Report
Oxford Policy Management 74
Table 3.23 Agricultural training – overview of find ings per activity for rice farmers
Agricultural training
Activities Usefulness Adoption/success rate Increase in income Sustainability Effectiveness
overall
Trans-
planting
Generally seen as useful and leading to
higher yields (if it was affordable and
feasible)
Mixed. Adopted by some, opposed by
many, since higher labour costs were
expected to outweigh higher yields; also
subject to soil conditions. Some only on
small part of their land (e.g. 1 acre)
When adopted, higher
yields
If adopted, sustainable Mixed
Seed
treatment
Widely seen as useful; helps to purify
seeds which in turn reduces need for
fertiliser and seeds. It improves yield.
Many use it since it is simple, cheap and
easy to learn
Widely adopted Increased yields through
purified seeds; lower costs
for fertiliser and fewer
seeds required
Farmers want to
continue to use it, and
are happy to share
knowledge
Effective
Pest
manage-
ment
Widely seen as useful, helps to
distinguish between pests, leads to more
targeted use of pesticides, helps to save
crops, knowledge often shared
Adopted in some villages. Adoption in
others not clear, as there may not have
been pests
Regarded as helping to save
crops and reduce use of
pesticides (previously
people used to try different
kinds by chance)
Sustainable as long as
knowledge is spread
Effective
Soil
treatment
Widely seen as useful, helps to prevent
soil degradation; in one case considered
as one of the most useful training
sessions
Adopted in some villages. High costs for
calcium powder/limestone/gypsum
prevented adoption in one village and
were mentioned as a concern in two
more villages, even though the
techniques were adopted
Yes, in at least one village a
direct link between the
technique and higher yields
was made
Sustainable (provided
costs are affordable) –
once soil acidity is fixed
there is less need for
intervention
Effective
Inorganic
fertiliser
Mixed – some people found that they did
not learn anything new
Mixed – in many cases costs too high
(unless fertiliser was provided with
training, which it rarely was)
Yield went up where
inorganic fertiliser was used
Limited information:
only known in one
village, who stated that
they want to use it in
the future
Mixed
Organic
fertiliser
Useful (cost saving, increases yield,
sustainable)
Mixed because of some constraints Those who used it
experienced increased
yields
Where it was adopted,
farmers shared
knowledge with others
Mixed

Livelihoods and Food Security Trust Fund – Delta 1 Evaluation Report
Oxford Policy Management 75
Table 3.24 Agricultural inputs – overview of findin gs per activity for rice farmers
Agricultural inputs
Activities Usefulness Adoption/success rate Increase in income Sustainability Effectiveness
overall
Buffaloes Very useful and relevant All those who were provided with
buffaloes or who belonged to buffalo
groups and banks used them for tilling
their fields
Farmers perceived an increase
in income (lower cost, higher
yields, more land cultivated,
sale of offspring)
Seen as sustainable (breeding of
offspring), especially when vet
available
Effective
Power
tillers
Very relevant and useful in
reduced costs, cultivating more
land, and higher yields
All those who were provided with
power tillers or who belonged to
power-tiller groups used them for
tilling their fields
Increases income through lower
cost, more land, higher yields
Depends on ownership and
upkeep of the power tiller
(including number of people per
group and whether maintenance
training is provided)
Effective
Drum
seeder
Can be useful to reduce costs
(but low adoption)
Mixed. Many do not use it (because
they feel it is not relevant, do not
accept its benefits in terms of yields, it
is only appropriate on dry land and not
monsoon season)
When used, increases income
through lower cost and less
waste
Depends on ownership and
upkeep of drum seeder
Mixed
Post-
harvest
equipment
Seen as useful: tarpaulins to dry
harvest, air-tight bags for longer-
term storage (seed for next
season, when possible) and
protecting from rats etc.
Mixed. Useful for those few who could
afford to store seeds. However, most
small farmers need to repay loans and
have to sell harvest immediately (and
buy back seeds for their own
consumption at higher prices later)
Mixed. Few managed to take
full advantage
Not unless access to credit
changes (but tarpaulins etc. are
being used and fixed). Rice banks
serve as a useful example of how
the loan constraint can be
overcome
Mixed
Seeds and
seed bank
Widely perceived as very useful
and relevant
High. All seed banks were still
functioning and no participants were
reported to have defaulted
Yes (higher yields, less waste,
less debt)
Widely perceived as sustainable,
except for systemic risk
Effective
Fertiliser Useful to reduce debt (no loans
taken out to pay for fertiliser –
i.e. an outcome that could be
achieved without having to
provide fertiliser). It seems that
sometimes not the right amount
of fertiliser was provided
People used the fertiliser they were
given
Increase in paddy Requires fertiliser to be provided
continuously, unless the
additional income from not taking
up loans helps to buy fertiliser in
the future
Effective

Livelihoods and Food Security Trust Fund – Delta 1 Evaluation Report
Oxford Policy Management 76
Table 3.25 Overview of findings per activity for th e poor and vulnerable: employment opportunities and other activities
Poor and vulnerable: rural employment opportunities
Activities Usefulness Adoption/success rate Increase in income Sustainability Effectiveness
Ducks Can be very useful for regular
income if conditions for tending
them are there (primarily access
to land or feed)
Mixed. Many ducks died for lack of
tending or were sold by respondents
unable to tend them
For those who had access to
land/feed, regular income
was guaranteed
Only sustainable under
certain conditions
Mixed
Pigs Can be very useful for lump sum
(high) income if pigs do not die
Mixed. Many pigs died because of
disease
For those whose pigs did not
die, large positive impacts on
income were found
Sustainable if pigs do not die
(higher chances of survival
with vet, good procurement,
and training)
Mixed
Boats and nets Was considered very useful for
those who had been fishermen
before Nargis and where there
were no big problems with
contractors etc.
Mixed. Several households sold nets
and had problems fishing because of
contractors
For those who did not face
problems with contractors
and depleted fish stocks,
increases in income were
reported
Nets and boats break and
depreciate, but systems can
be set up to increase
sustainability (reinvesting
profits, etc.)
Mixed
Home gardening Self sufficiency; variety of diet;
women felt empowered
Required land. Appropriate soil, good
saline conditions, those who had land
happy to use it
Good for food consumption,
helped to save expenses on
vegetables but not of much
help to increase their income
Can continue to use skills ,
provided land is available
Mixed
Vocational skills
training
Training considered useful Trainees used the
knowledge they had gained
Provides for income source,
even if low
Can continue to use skills in
the future
Effective
Other IGA
training164
Mixed, some useful, others not
(e.g. crabs for crab breeding died,
and loans still needed to be
repaid)
Mixed, some could
be adopted but some
not (e.g. snack making)
Mixed results Mixed results Mixed
Animal care/CEW Widely seen as useful CEW used his knowledge and looked
after animals
Indirectly by saving costs for
more expensive vet and by
treating animals earlier
As long as CEW stays and
retrains
Effective
164 While these have not been explored in detail in the report, this row summarises key findings

Livelihoods and Food Security Trust Fund – Delta 1 Evaluation Report
Oxford Policy Management 77
Table 3.26 Overview of findings per activity for th e poor and vulnerable: other activities
Poor and vulnerable, other activities:
Usefulness Adoption/success rate Increase in income Sustainability Effectiveness
Cash Revolving Fund Very useful, helps to increase
income
Adopted, but the only problem
is when people do not pay the
money back
Allows people to borrow
at lower interest rates,
and retain more of their
income
High, as they are growing on their own
success (more people can be included
as interest is paid back and funds
grow)
Effective
SHGs Very useful for access to credit for
those involved
For those who participated,
very successful
Yes, through business
expansion, etc.
Sustainable Effective
Rice banks Perceived as very useful safety
net measure for poorest
Rice bank was still functioning
and widely used
Was not the intention,
aimed at food security
Sustainable if linked to successful
revolving fund/livelihood activities
Effective
CfW Perceived as useful in short term
and very good for reconstruction
of assets
Positive Mixed. Only in short term
and often very few days
CfW is not, but outputs are Mixed

Livelihoods and Food Security Trust Fund – Delta 1 Evaluation Report
Oxford Policy Management 78
4 Overall findings by evaluation area
4.1 Introduction
In these sections we summarise the findings with respect to the various evaluation dimensions (increase in income, impact on food security, sustainability, etc.). With respect to income and food security we also look at the situation before Nargis and since then, both for rice farmers and poor and vulnerable people (casual labourers).
4.2 Impact on incomes
In order to assess the impact of LIFT activities on household incomes, this evaluation adopted a multi-pronged approach.165 During FGDs, households were asked to map their income over time (before Nargis, straight after Nargis, and at the time of the evaluation) on a chart and explain the reasons for the fluctuations. Additional probing questions were added during FGDs and KIIs, to ask about the specific impact of each individual activity on incomes. Moreover, the small quantitative survey also included questions on incomes and the perceived impact of LIFT activities.
This section analyses this evidence, starting by presenting the overall changes in household income and then moving on to identify which activities were perceived to contribute most to increases in income. It should be noted that on this last point we have only included activities that actually led to a rise in income, not those that “would have raised incomes if and only if…” The assessment of impacts on income is therefore strongly tied to the overall adoption and usefulness of an activity, as analysed extensively in Section 3 above.
4.2.1 Overall impact on incomes in programme areas
Useful evidence to assess the overall trend in household incomes as a consequence of Nargis and subsequently the impact of LIFT activities derives from the income-mapping exercise conducted in all FGDs. As stated above in Section 1.2, the LIFT interventions were only a part of the overall interventions following Nargis, and LIFT also started later than many others. It should also be noted that this participatory tool was used to primarily generate discussion and analysis of changes in incomes over time (presented below). Nevertheless, the aggregate trends that derived from the mapping itself are also a useful (though rough) indicator.
The overwhelming majority of respondents was of the ove rall opinion that incomes had increased substantially after the Nargis collapse i n incomes, but not enough to reach pre-Nargis levels . This was supported by the graphic evidence, which shows a clear positive trend in the years.
Overall, as can be observed in the summary evidence presented in Figure 4.6, incomes of rice farmers and casual labourers were perceived to be ‘sufficient to meet household needs’ (central line of five, as explained in the figure notes) before Nargis. For rice farmers in particular, based on evidence from 139 separate data points, incomes were perceived as being more than sufficient.
Incomes straight after Nargis, unsurprisingly, were seen to plummet for both farmers and casual labourers. Interestingly, on average, this decrease was seen to be almost proportional for both
165 Note that this was partially due to the lack of a ‘rigorous’ quantitative evaluation, using a treatment and control group over time and including a consumption module, which is the only ‘objective’ approach to measuring changes in household income.

Livelihoods and Food Security Trust Fund – Delta 1 Evaluation Report
Oxford Policy Management 79
groups, though some FGD participants talked about a ‘levelling effect’ from Nargis,166 by which the only ones who were less affected were very big landowners who owned machinery rather than livestock and who could continue production even after disaster struck as they had not suffered as many losses.
Increases in incomes were reported as soon as a year after Nargis struck (and before most LIFT activities started). However, it is important to add that this increase was often seen as a direct consequence of hand-outs from many organisations, mostly food aid (which was reported as an ‘income’, although this is not the case) and income from CfW programmes.
The shift that occurred in the following year up until November 2011 when the evaluation was carried out was the one that brought rice farmers to a level above that of ‘self-sufficiency’ and casual labourers close to pre-Nargis levels. In the absence of a comparison group, it is not possible to say whether the shift has been due to the LIFT activities. On the other hand, a number of the LIFT activities have been effective, and hence will have played a role in the recovery. However, it will not be possible to state to what extent. The role of LIFT activities in the recovery is also reflected by FGD participants mentioning un-prompted the positive effects of LIFT activities – in particular for rice farmers (with an indirect effect on casual labourers).
Figure 4.6 Income mapping, overall results for rice farmers and casual labourers
Note: a) The results are based on 129 observations (lines) across all FGDs. Each line is based on at least 55 lines drawn in FGDs. b) Teams were instructed to get the group to agree on a level for each time period, given that the central line (3) is the “income they would need to guarantee the basic needs of the household”.
Interestingly, this reporting was mostly consistent across FGD types, testifying to its soundness. For example, FGDs with rice farmers and with poor and vulnerable households gave a very similar picture, as did interviews with male or female respondents. Nevertheless, it is interesting to notice (as shown in Figure 4.7) that overall rice farmers and females tended to give a more positive picture.
166 "Nargis equalised everyone", respondents reported in Ma Gu Ywar Ma (Bogale) – an opinion shared by several respondents throughout the research areas.
1
2
3
4
5
Before Nargis Straight after
Nargis
A year after
Nargis (before
LIFT)
Nov-11
Rice farmers
Casual labourers
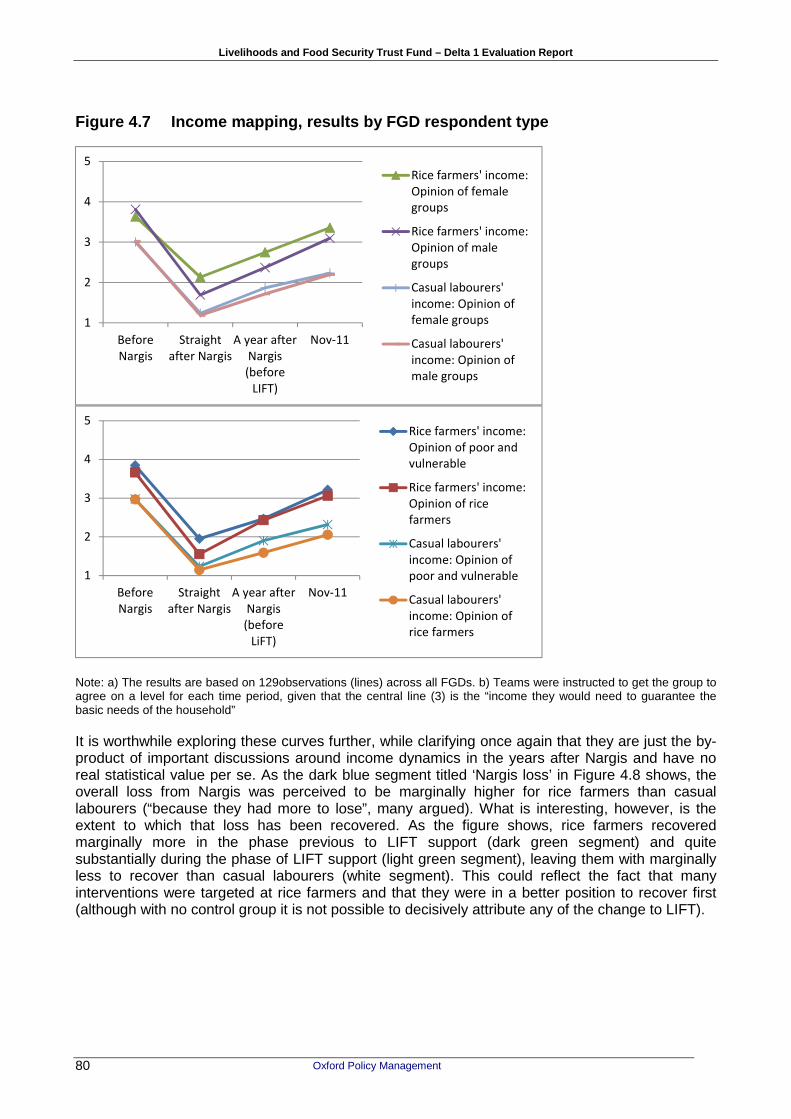
Livelihoods and Food Security Trust Fund – Delta 1 Evaluation Report
Oxford Policy Management 80
Figure 4.7 Income mapping, results by FGD responden t type
Note: a) The results are based on 129observations (lines) across all FGDs. b) Teams were instructed to get the group to agree on a level for each time period, given that the central line (3) is the “income they would need to guarantee the basic needs of the household”
It is worthwhile exploring these curves further, while clarifying once again that they are just the by-product of important discussions around income dynamics in the years after Nargis and have no real statistical value per se. As the dark blue segment titled ‘Nargis loss’ in Figure 4.8 shows, the overall loss from Nargis was perceived to be marginally higher for rice farmers than casual labourers (“because they had more to lose”, many argued). What is interesting, however, is the extent to which that loss has been recovered. As the figure shows, rice farmers recovered marginally more in the phase previous to LIFT support (dark green segment) and quite substantially during the phase of LIFT support (light green segment), leaving them with marginally less to recover than casual labourers (white segment). This could reflect the fact that many interventions were targeted at rice farmers and that they were in a better position to recover first (although with no control group it is not possible to decisively attribute any of the change to LIFT).
1
2
3
4
5
Before
Nargis
Straight
after Nargis
A year after
Nargis
(before
LIFT)
Nov-11
Rice farmers' income:
Opinion of female
groups
Rice farmers' income:
Opinion of male
groups
Casual labourers'
income: Opinion of
female groups
Casual labourers'
income: Opinion of
male groups
1
2
3
4
5
Before
Nargis
Straight
after Nargis
A year after
Nargis
(before
LiFT)
Nov-11
Rice farmers' income:
Opinion of poor and
vulnerable
Rice farmers' income:
Opinion of rice
farmers
Casual labourers'
income: Opinion of
poor and vulnerable
Casual labourers'
income: Opinion of
rice farmers

Livelihoods and Food Security Trust Fund – Delta 1 Evaluation Report
Oxford Policy Management 81
Figure 4.8 Loss in income due to Nargis and level o f recovery
Reading example: rice farmers’ income dropped by two points due to Nargis (from 3.8 to 1.8, see Figure 4.6). Since then it has recovered by 1.4 points (0.7 points before LIFT started, and 0.7 while LIFT was ongoing). Rice farmers’ income is still 0.6 points below the pre-Nargis level. Casual labourers’ income is still 0.8 points below pre-Nargis levels.
This overall trend that emerges from the graphs was validated by the discussions that accompanied the drawing of the graphs – the real focus of the whole exercise. Many FGD respondents highlighted that farmers had been the fastest to recover their incom es – with many succeeding to return to pre-Nargis levels – wh ile casual labourers had a much harder time doing so . This trend was partially linked to the fact that farmers were not able to sustain them and provide work for them as they had before Nargis. A few quotes from casual labourers help to highlight how their incomes are dependent on the wellbeing of landowners (and explain the presence of the ‘scissor’ effect in the graphs above):
"Farmers are now back to where they were before (Nargis); they have capital, land, plus they got so much from [the IP]. Our condition is worse than before Nargis; we used to get things from farmers easily before, now they have their own difficulties.”167
“After Nargis we went below the floor, farmers could go back to the fields but what could we do? They did not have money so could not hire us… Now, we can still barely make a living with what we have – but things are better (…) Now farmers can give us jobs again – if farmers can't afford things neither can casual workers. We rely on them!”168
"Our main constraint is that it is difficult to get a job because farmers cannot hire us. Before Nargis, our daily income had been about 3,000 Kyats. At present, our income is about 1,000 Kyats per day.”169
Both casual labourers and farmers also often stressed that incomes had increased, but not enough to sustain some basic expenditures (linked to health for casual labourers and agricultural investments and debt for farmers), especially for households with many children.
167 Male poor and vulnerable, Kyaung Su, Bogale 168 Mixed (male and female) poor and vulnerable, Ma Gu Ywar Ma, Bogale 169 Female poor and vulnerable, Kha Yu Chaung, Bogale
2.0
1.8
0.7
0.6
0.7
0.4
0.6
0.8
Rice farmers: Nargis loss
Rice farmers: recovery
Casual labourers: Nargis loss
Casual labourers: recovery
recovery before LIFT recovery during LIFT remaining gap

Livelihoods and Food Security Trust Fund – Delta 1 Evaluation Report
Oxford Policy Management 82
"Compared to before the (LIFT) support, it can be assumed that our income is better. But we have not got enough for our daily food and health…”170
“Now, the income of rice farmers is sufficient for food and clothes, but not for health, and we have not escaped from the debt cycle yet.”171
“Now income for us is back to what it was like before, although people with many family members still struggle... and covering health needs is still difficult.”172
“We need financial capital. If we take it from others, we are burdened with debt and interest… as much as these activities have helped us increase our production and incomes, this is our priority.”173
4.2.2 Activities perceived to most increase incomes
The activities that were perceived to most increase incomes are analysed separately for rice farmers and casual labourers. Nevertheless, it should be noted that in several cases poor households stressed that some activities aimed at farmers indirectly affected them as well because of increased demand for labour (“If farmers have enough income then they will spend more and hire us more – and we will benefit”174 is a quotation that summarises this attitude). In fact, sustaining farmers was often perceived as being the most effective way to sustain casual labourers as well, as several interviews with key informants and local partners suggested.
Rice farmers For rice farmers, the top-ranking activities in terms of impact on incomes were the provision of power tillers or buffaloes, as these allowed people to rebuild their farming activity by increasing land use and increasing efficiency (e.g. taking advantage of the tillage window). Generally, cash provision for agricultural inputs was also seen as contributing to increased income (or revolving funds, when targeted at farmers), as was the direct provision of other agricultural inputs (such as fertiliser and seeds), though it was acknowledged these would not have longer-term and ‘sustainable’ effects.175
Out of the training sessions, those that were felt to be most effective for increasing production and consequently incomes were those stated already in earlier sections, namely seed treatment, pest management and soil-management training. The quantitative results were mostly in line with these findings. As Table D.2 in Annex C shows, the activities that are seen to be most contributing to an increase in income among those who benefitted from them were the cash revolving fund and cash to buy inputs. Regarding the provision of buffaloes and power tillers, only relatively few received them but almost all those who did perceived it as increasing their incomes.
170 Female poor and vulnerable, Kha Yu Chaung, Bogale 171 Female rice farmers, Hnar Nit Pauk, Bogale 172 Female poor and vulnerable, Ku Lar Ohn Pin Su, Bogale 173 Mixed (male and female) rice farmers, Kyaung Su, Bogale 174 Pilot village, Dedaye 175 This was based on an understanding of sustainability by which if the inputs cannot be afforded in the next year then it is not sustainable. However, if the cash or input provision gets farmers producing again and able to earn an income as they were doing before (or possibly even better than before), it could be argued these inputs are also sustainable.

Livelihoods and Food Security Trust Fund – Delta 1 Evaluation Report
Oxford Policy Management 83
Table 4.27 Proportion of beneficiaries who stated t hat an activity increased their income
Activities shown if there were at least 20 people who participated in the activity (question B1).Reading example: there were 87 people who benefitted from or participated in the cash revolving fund (according to questions B1 and B2). Of those, 97% stated that the revolving fund for cash increased their income (question B3c).
Poor and vulnerable households Results for poor and vulnerable households were also mixed, depending on the activity. For example, revolving funds in cash were largely successful, either by simply improving consumption
76%
81%
84%
92%
80%
85%
85%
86%
86%
88%
95%
77%
97%
82%
89%
94%
90%
84%
100%
100%
0% 10% 20% 30% 40% 50% 60% 70% 80% 90% 100%
Training in transplanting (n=38)
Training in seed treatment (n=42)
Training in use of fertilizers (n=43)
Farmer extension groups/ Farmer exchange visits…
Training for poor and vulnerable
Training in livestock production (n=56)
Training in small business…
Provision of seeds (n=48)
Provision of power tillers (n=22)
Post harvest equipment (e.g. threshers, storage…
Provision of other agricultural inputs,or…
Cash to buy inputs (n=73)
Provision of inputs for poor
Provision of small livestock (pigs/ducks/goats)…
Revolving Fund for cash (n=87)
Revolving Fund for livestock (n=44)
Inputs for fisheries (n=54)
Cash for Work
Cash for Work (various activities combined)…
Construct/improve village footpaths (n=114)
Construct/improve roads (n=58)
Construct/improve bridges (n=21)
Renovation of drinking water ponds (n=28)
proportion of beneficiaries who felt that activity increased their income 0%

Livelihoods and Food Security Trust Fund – Delta 1 Evaluation Report
Oxford Policy Management 84
or increasing income. The revolving fund for cash was a particularly effective way of breaking the cycle of indebtedness and high interest rates. High interest rates forced small farmers to sell their harvest immediately, as they could not afford to wait until prices were considerably more favourable. Revolving funds and SHGs broke this cycle, and allowed farmers access to cheaper credit and hence higher revenue, making it easier for them to repay the loans while also having the means to increase food security or to invest. The quantitative results also show that the revolving fund for cash was one of the activities where one of the highest proportions (97%) of beneficiaries stated that it increased their income. Livestock (in-kind) revolving funds, however, were less successful because of high mortality rates of pigs and ducks.
Similarly, support to fishery livelihoods through direct or indirect provision of inputs (mostly boats and nets) was praised in some places as being the most useful support to poor people’s income. However, such support was just as frequently seen as problematic given the tendering out of fishing rights and other problems described in Section 3.5.3.
Animal care training and vocational skills training were also targeted at the poor. Those trained employed their new skills, leading to modest increases in income.
4.3 Impact on food security
The relationship between income and food security is, unsurprisingly, a tight one. As income increases, food security tends to increase as well. In fact, as results from the analysis confirm, food security is often seen as being on average slightly ‘higher’ than income, as food is the most important necessity good (meaning households provide for their food needs through other coping strategies even in absence of an income).
Figure 4.9 Development of food security over time a s seen by a FGD in Hnar Nit Pauk
4.3.2 Overall impact on food security in programme areas
As with incomes, the main tool to assess households’ evolving food security over time was the use of a ‘mapping’ tool. Five horizontal lines were drawn on a flip chart, the central line indicating the level by which households have “enough food” in terms of quantity, number of meals per day, type

Livelihoods and Food Security Trust Fund – Delta 1 Evaluation Report
Oxford Policy Management 85
of food, variety, etc.176 Discussants were then asked to discuss their level of food availability over four different time periods (before Nargis, straight after Nargis, about a year after Naris before LIFT activities, and at the time of fieldwork), agreeing on an overall ‘score’ for each period. While we repeat once again that the main objective of the exercise was the generation of a discussion and not the agreement on ‘objective’ scores, it is still interesting to share the aggregate trends that resulted from the analysis.
Figure 4.10 Food security mapping, rice farmers and casual labourers
The results are based on 228 observations (lines) across all FGDs. Each line in Figure 10.2 is based on 55–57 graphs drawn in FGDs.
As with income, the overall trend showed a net loss straight after Nargis, followed by a stead y recovery which assured rice farmers more than ‘enough food’ by the end of 2011 and left casual labourers lagging behind and still struggling to fulfil the food needs of their household. Moreover, neither group perceived to have reached pre-Nargis levels.
This overall trend could be further broken down to understand the extent of the loss and post-Nargis recovery for each group. As Figure 4.11 shows, the levels of post-Nargis loss were almost comparable for rice farmers and casual labourers (though rice farmers of course started off with higher consumption levels), as were the levels of recovery straight after Nargis.
Evidence from the FGD discussions accompanying the drawing of the charts helps to clarify these findings. The phase straight after Nargis was described in dramatic terms by many respondents, with many only eating coconuts and drinking coconut juice for days (many villages had no fresh water for about a week after Nargis).
“Before Nargis many of us could have three meals per day and the majority of farmers especially had sufficient food. After Nargis we barely had enough and shared. We didn't have firewood to cook or houses to cook in! Some people just had coconuts for days; then they went sour as they had fallen from trees.”177
176 This is by definition an arbitrary concept as different people define having ‘enough’ food in very different ways. However, in a qualitative assessment of perceptions on food availability, this is the standard measure used to explore households’ changing consumption patterns over time. 177 Female poor and vulnerable, Ku Lar Ohn Pin Su, Bogale
1
2
3
4
5
Before
Nargis
Straight
after Nargis
A year after
Nargis
(before LIFT)
Nov-11
Rice farmers
Casual labourers

Livelihoods and Food Security Trust Fund – Delta 1 Evaluation Report
Oxford Policy Management 86
Understandably, the recovery phase after that was steep. Households shared food, skipped meals, took on debt and sold assets, allowing them to feed their families. The most common coping strategies cited were eating broken rice gruel and eating fewer meals per day than desired.
Figure 4.11 Reduction in food security levels due t o Nargis and level of recovery
Reading example: rice farmers’s food security dropped by 1.9 points due to Nargis. Since then it has recovered by 1.4 points (0.7 points before LIFT started, and 0.7 while LIFT was ongoing). Thus, rice farmers’ income is still 0.5 points below the pre-Nargis level.
At the time of the interviews in November 2011, many respondents reported their food consumption to be ‘sufficient’ though not always as high and diverse as they would want it to be (in line with the graphs). “Our food level is also back nearly to pre-Nargis level through increased income. However, there are still households who sometimes eat broken rice gruel in the village at present”, male casual labourers reported in Ku Lar Ohn Pin Su (Bogale). Similarly, male and female casual labourers in Ma Gu Ywar Ma (Bogale) explained:
“Before Nargis we had sufficient food; it was regular, we had betel nuts and coconuts to help us, we could eat when we wanted. Now, there is more disruption. We used to use two spoons of cooking oil and now we use one – farmers used to lend us money for food in hard times... and now they can't.”
Rice farmers overall had more positive views, though smaller farmers still did not feel ‘completely satisfied’. “The number of meals per day is the same as before Nargis... but we still can't afford to eat high quality rice… and before Nargis we could afford meat three times more frequently than we can afford now.”178 Interestingly, this shows that the concept of ‘enough’ food varies considerably between rice farmers and casual labourers.
4.3.3 Activities perceived to most affect food secu rity
Among the wide range of activities implemented by LIFT, it is clear that those that led most effectively to an increase in income were also those that allowed improving households’ food availability. This was repeatedly clarified by FGD respondents and key informants and is intuitive to understand. For this reason, this section briefly focuses on those activities that directly rather than indirectly affected households’ food consumption.
178 Mixed (male and female) rice farmers, Kyaung Su, Bogale
1.9
1.8
0.7
0.7
0.7
0.5
0.5
0.5
Rice farmers: Nargis loss
Rice farmers: recovery
Casual labourers: Nargis loss
Casual labourers: recovery
recovery before LIFT recovery during LIFT remaining gap

Livelihoods and Food Security Trust Fund – Delta 1 Evaluation Report
Oxford Policy Management 87
Rice farmers For rice farmers, it is clear that all the activities that increased production of rice both directly and indirectly affected food security. Findings are therefore very similar to those presented in the previous sections. The quote below provides a good example:
“Previously, it cost 70 baskets of rice to rent a buffalo and now those baskets of rice can be saved for food or can be sold for an income.”179
Poor and vulnerable For poor and vulnerable households, the activity that was most directly linked to food security was (unsurprisingly) the home gardening. When this was undertaken successfully (which was not always the case, as analysed in Section 3.5.4), the effects on households’ consumption were extremely positive and immediate. The quote below summarises the opinions of all those who were successful in growing their own vegetables:
“Vegetables from home gardening positively affected our food security; we can now eat fresh and different kinds of vegetables when we want!”180
The second most quoted activity affecting food security directly was the provision of boats and nets to fishermen (once again, if no problems were faced with access to fishing grounds etc.):
“Before we received boats and nets, we just had to catch fish with hands in the fields and creeks… Now, we can go to river and catch fish… Our income increases… and we can have more meals than before… and eat fish!”181
4.4 Sustainability
The theme of sustainability is an important one for the forward planning of future phases of intervention in the Delta area. As the DAC guidelines clearly state, “sustainability is concerned with measuring whether the benefits of an activity are likely to continue after donor funding has been withdrawn”.182 When evaluating the sustainability of each of the LIFT activities, two main questions were explored to address this:
• To what extent did the benefits of each activity continue after the activity ended (or how likely are they to continue)?
• What were the major factors which influenced the achievement or non-achievement of sustainability of the activity?
Within Section 3, the sustainability of each activity has been considered individually. This section aims to summarise those findings, presenting the activities which were found to be the most likely to have long-term sustainability.
Overall results are presented in Table 4.28 on the next page. According to the opinions of FGD respondents, most of the training (both for farmers and IGAs) was highly sustainable as ‘knowledge stays while other things are perishable’. For example:
179 Mixed (male and female) rice farmers, Pho Khwe Gyi, Labutta 180 Mixed (male and female) poor and vulnerable, Kant Ba Lar Su, Bogale 181 Male poor and vulnerable, Pho Khwe Gyi, Labutta 182 DAC Principles for the Evaluation of Development Assistance, OECD (1991)
Livelihoods and Food Security Trust Fund – Delta 1 Evaluation Report
Oxford Policy Management 88
“Training given to farmers has both a short- and long-term impact as the technical knowhow will be repetitively utilised for years.”183
"I attended training sessions and shared knowledge with my relatives, so the whole community will be soon be affected.”184
“We can apply the knowledge learned in income-generating training our whole lives. It cannot be perishable…”185
Revolving funds and SHGs were also often lauded as being sustainable, especially as people had witnessed their slow growth in capital and membership. These positive effects were of course counteracted when the money (or asset) borrowed was not given back, which mostly happened because of failed livestock breeding: “The Self Reliance Group can be very sustainable; till now, the amount of funds it has has increased to about 1.1 million Kyats”, a satisfied woman explained in Hnar Nit Pauk (Bogale).
The provision of buffaloes was similarly seen as very sustainable as “it is essential for the livelihoods of farmers and they also reproduce.”186 Construction of embankments/dykes was also widely seen as sustainable.
183 Male poor and vulnerable, Kyauk Ta Lone, Ngapudaw 184 Male rice farmers, Ma Gu Ywar Ma, Bogale 185 Male poor and vulnerable, Ku Lar Ohn Pin Su, Bogale 186 Male rice farmers, Hnar Nit Pauk, Bogale
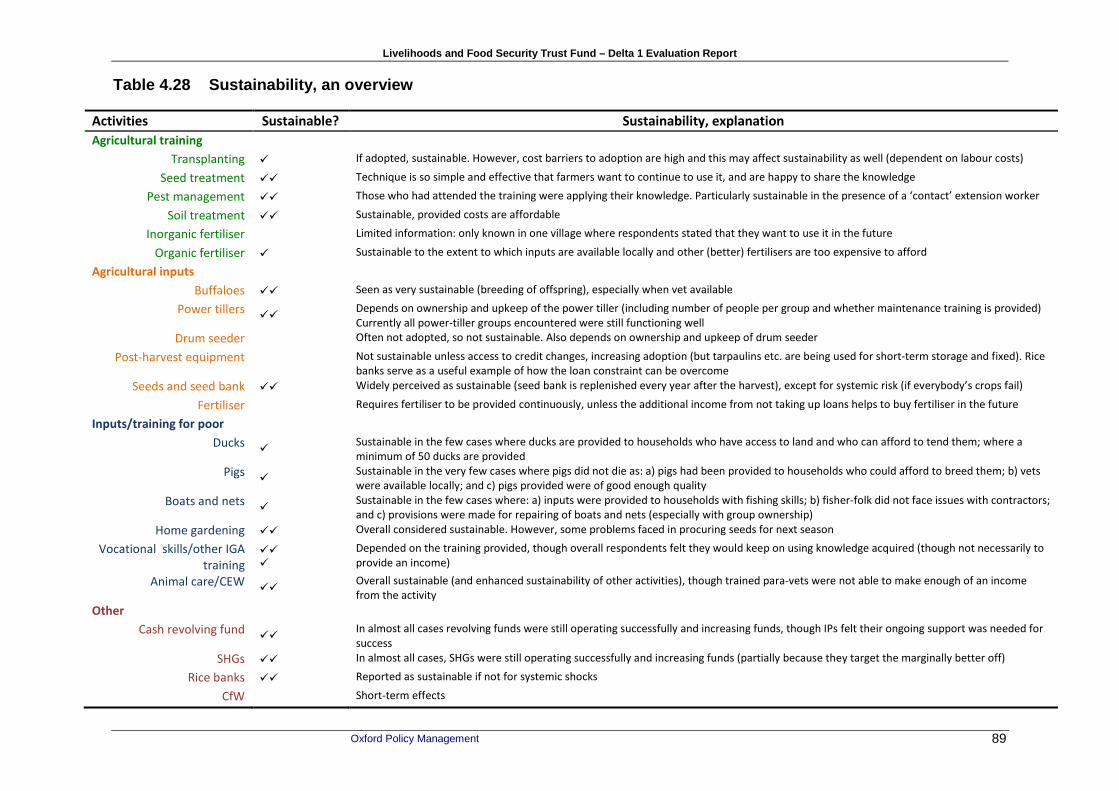
Livelihoods and Food Security Trust Fund – Delta 1 Evaluation Report
Oxford Policy Management 89
Table 4.28 Sustainability, an overview
Activities Sustainable? Sustainability, explanation
Agricultural training
Transplanting � If adopted, sustainable. However, cost barriers to adoption are high and this may affect sustainability as well (dependent on labour costs)
Seed treatment �� Technique is so simple and effective that farmers want to continue to use it, and are happy to share the knowledge
Pest management �� Those who had attended the training were applying their knowledge. Particularly sustainable in the presence of a ‘contact’ extension worker
Soil treatment �� Sustainable, provided costs are affordable
Inorganic fertiliser Limited information: only known in one village where respondents stated that they want to use it in the future
Organic fertiliser � Sustainable to the extent to which inputs are available locally and other (better) fertilisers are too expensive to afford
Agricultural inputs
Buffaloes �� Seen as very sustainable (breeding of offspring), especially when vet available
Power tillers ��
Depends on ownership and upkeep of the power tiller (including number of people per group and whether maintenance training is provided)
Currently all power-tiller groups encountered were still functioning well
Drum seeder Often not adopted, so not sustainable. Also depends on ownership and upkeep of drum seeder
Post-harvest equipment
Not sustainable unless access to credit changes, increasing adoption (but tarpaulins etc. are being used for short-term storage and fixed). Rice
banks serve as a useful example of how the loan constraint can be overcome
Seeds and seed bank �� Widely perceived as sustainable (seed bank is replenished every year after the harvest), except for systemic risk (if everybody’s crops fail)
Fertiliser Requires fertiliser to be provided continuously, unless the additional income from not taking up loans helps to buy fertiliser in the future
Inputs/training for poor
Ducks �
Sustainable in the few cases where ducks are provided to households who have access to land and who can afford to tend them; where a
minimum of 50 ducks are provided Pigs
� Sustainable in the very few cases where pigs did not die as: a) pigs had been provided to households who could afford to breed them; b) vets
were available locally; and c) pigs provided were of good enough quality Boats and nets
� Sustainable in the few cases where: a) inputs were provided to households with fishing skills; b) fisher-folk did not face issues with contractors;
and c) provisions were made for repairing of boats and nets (especially with group ownership) Home gardening �� Overall considered sustainable. However, some problems faced in procuring seeds for next season
Vocational skills/other IGA
training
�� �
Depended on the training provided, though overall respondents felt they would keep on using knowledge acquired (though not necessarily to
provide an income) Animal care/CEW
�� Overall sustainable (and enhanced sustainability of other activities), though trained para-vets were not able to make enough of an income
from the activity Other
Cash revolving fund ��
In almost all cases revolving funds were still operating successfully and increasing funds, though IPs felt their ongoing support was needed for
success
SHGs �� In almost all cases, SHGs were still operating successfully and increasing funds (partially because they target the marginally better off)
Rice banks �� Reported as sustainable if not for systemic shocks
CfW Short-term effects

Livelihoods and Food Security Trust Fund – Delta 1 Evaluation Report
Oxford Policy Management 90
4.5 Targeting
Given the emergency context of LIFT activities, targeting was not an uppermost priority in terms of delivering support to households. Nevertheless, adequate targeting of activities to those most in need is an important indicator of project success. As stated in previous sections, some activities were primarily targeted at rice farmers, while others were targeted mainly at the poor, landless and vulnerable. This section attempts to assess to what extent LIFT activities were reaching the poor and vulnerable and helps to explain any issues that emerged on this topic during the fieldwork.
4.5.1 Quantitative results
Methodology In order to evaluate to what extent activities reached the poor, the most commonly accepted ‘objective’ approach would be based on the estimation of household consumption expenditure. On that basis, it would be possible to distinguish poor and non-poor households and measure inclusion and exclusion errors. However, this approach is beyond the scope of this study (for example, it would require conducting a 30-minute consumption module as part of the household survey). Moreover, given LIFT’s objectives and context (a humanitarian response aimed at rebuilding livelihoods in an emergency context), it could be argued this might not even be an appropriate approach.
The approach that was adopted for this study was therefore to ‘guestimate’ household poverty based on subjective impressions of interviewers, who were carefully trained on this question. We found that the subjective impression correlated strongly with an asset index and a question on monthly expenditure,187 thereby testifying to the quality of the data.
Based on the subjective impression, households were classified according to the following categories.
Table 4.29 Distribution of welfare segments based o n interviewers’ impressions
Welfare segment Number in sample
% in sample
Very poor 65 8.1 Poor 381 47.6 Middle 300 37.5 Well off 54 6.7 Total 800 100
187 Base N=800 households interviews. ‘Poor’ based on interviewers’ observation (very poor and poor). Observation is highly correlated with expenditure and assets. Detail: QH5 asks about nine assets (bicycle, motorcycle, mattress, chairs, table, radio/cassette, TV/satellite dish, cell phone, watch). For each household, we computed the number of assets that the household owned. QH9 asks for monthly expenditure. The sum of assets and expenditure are correlated (0.36) at the 1% significant level. The subjective impression of poverty is correlated with the sum of assets at the 1% significance level (0.587). It is also correlated with expenditure at the 1% significance level (.391). Note that the poverty rate in Myanmar is estimated to be 32.7% (2007 est.) and this can be expected to be higher in rural areas, where this study took place, especially after Nargis. 56% of the households are estimated to be poor on the basis of interviewers’ impressions. Source: http://www.indexmundi.com/burma/population_below_poverty_line.html (the World Bank did not have an estimate).

Livelihoods and Food Security Trust Fund – Delta 1 Evaluation Report
Oxford Policy Management 91
Findings Keeping the caveats presented above in mind, the analysis of targeting aimed to assess how many of the households classified as ‘poorest’ or ‘poor’ participated in any LIFT activity and how effective each activity was at targeting these households.
Results for the first question are summarised in Figure 4.12. Across all interviewed households (n=800), some 55% had received some form of assistance. In the category of the very poor households (n=65), participation was the highest at 60%. Participation was also high for households in the ‘poor’ and ‘middle’ categories (n=381 and 300 respectively) and lowest for ‘richer’ households (n=54) at 35%.
Figure 4.12 Proportion of households participating in LIFT activities across wealth segments 188
While the numbers presented above point towards a higher targeting of poorer households, it is clear that results are mixed and targeting could have been mor e effective . Nevertheless, it should be kept in mind that the explicit objective of targeting many of the LIFT activities at rice farmers automatically biases results towards those who are slightly better off (and this is not necessarily a negative result). This is exemplified by Figure 4.13 below, which shows that only 15% of households classified as ‘poor’ or ‘very poor’ own any land, against 54% of ‘non-poor’ households. In this context, it should be remembered that many of the activities targeted at the poor did require the holding of land (e.g. to raise small livestock). Given that 85% of poor people did not own land, this helps to explain why many of these livestock-related activities had mixed results.
Regarding the second point mentioned in the introduction – the targeting of specific activities – the results can be seen through two different lenses. On one side, it is important to look at overall coverage of each activity and the ‘absolute’ numbers of poor people reached by each. This is done in Figure 4.14 below. On the other, it is also important to get a sense of the effectiveness of each activity at reaching the poorest households among its beneficiaries (% of poor among recipients). This is done in Figure 4.15.
188 The category ‘received assistance’ is based on the following household questionnaire questions: Question B1: has anyone in your household benefitted from any of the following activities? B2: Did the respondent or any member of his/her household participate in or benefit from any activity
55%
60%
55%
58%
35%
45%
40%
45%
42%
65%
Total (n=800)
Very poor (n=65)
Poor (n=381)
Middle (n=300)
Well off (n=54)
received assistance did not receive assistance
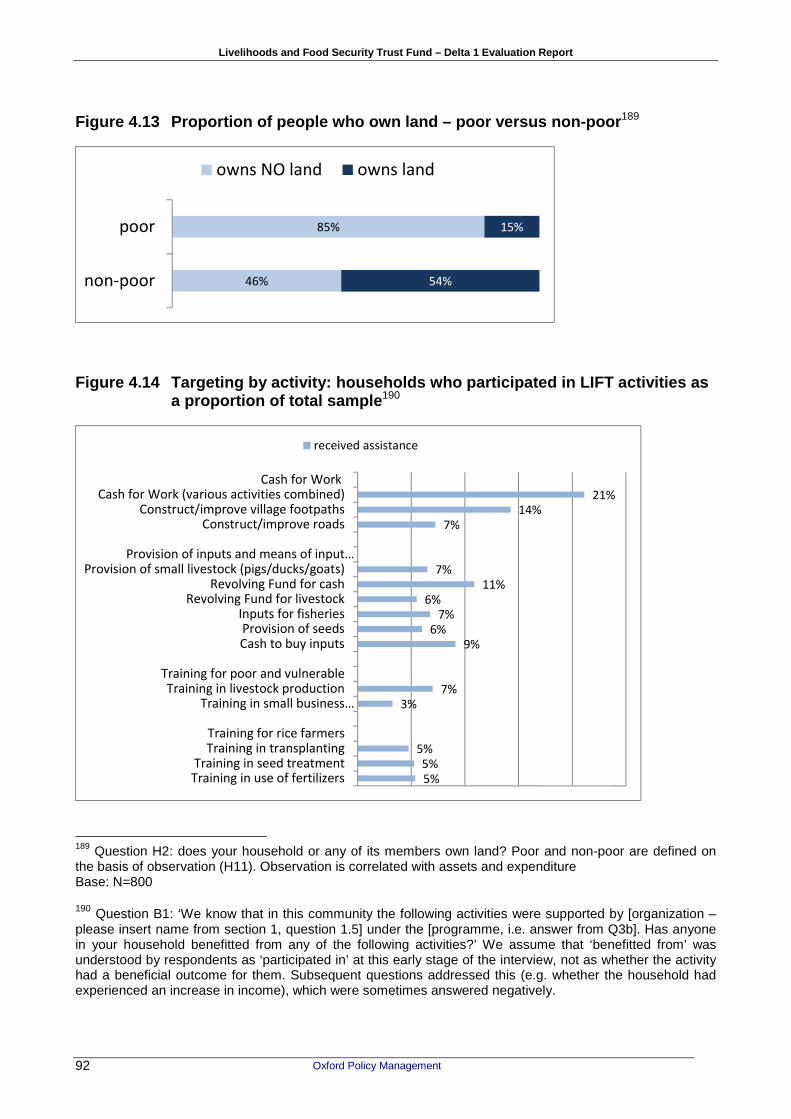
Livelihoods and Food Security Trust Fund – Delta 1 Evaluation Report
Oxford Policy Management 92
Figure 4.13 Proportion of people who own land – poo r versus non-poor 189
Figure 4.14 Targeting by activity: households who p articipated in LIFT activities as a proportion of total sample 190
189 Question H2: does your household or any of its members own land? Poor and non-poor are defined on the basis of observation (H11). Observation is correlated with assets and expenditure Base: N=800 190 Question B1: ‘We know that in this community the following activities were supported by [organization – please insert name from section 1, question 1.5] under the [programme, i.e. answer from Q3b]. Has anyone in your household benefitted from any of the following activities?’ We assume that ‘benefitted from’ was understood by respondents as ‘participated in’ at this early stage of the interview, not as whether the activity had a beneficial outcome for them. Subsequent questions addressed this (e.g. whether the household had experienced an increase in income), which were sometimes answered negatively.
46%
85%
54%
15%
non-poor
poor
owns NO land owns land
21%
14%
7%
7%
11%
6%
7%
6%
9%
7%
3%
5%
5%
5%
Cash for WorkCash for Work (various activities combined)
Construct/improve village footpathsConstruct/improve roads
Provision of inputs and means of input…Provision of small livestock (pigs/ducks/goats)
Revolving Fund for cashRevolving Fund for livestock
Inputs for fisheriesProvision of seedsCash to buy inputs
Training for poor and vulnerableTraining in livestock production
Training in small business…
Training for rice farmersTraining in transplanting
Training in seed treatmentTraining in use of fertilizers
received assistance

Livelihoods and Food Security Trust Fund – Delta 1 Evaluation Report
Oxford Policy Management 93
Note: Results shown if at least 5% of sampled households benefitted from/participated in activity.
Starting from Figure 4.14, the top lighter blue lines show the number of households as a proportion of the overall sample (n=800) that received a specific type of activity/assistance. For example, 14% of the overall sample were involved in a CfW scheme to improve village footpaths, boasting the highest coverage compared to any other activity. Please note that the category ‘cash for work (various activities combined)’ differs from any of the other activities listed, as it combines all CfW activities. Anyone who has participated in at least one of more than 13 CfW activities is included.
Coming to Figure 4.15, results show the proportion of poor who participated in these activities.191 The activities that were best targeted at the poorest (i.e. with the highest number of very poor/poor as a proportion of beneficiaries/recipients) were inputs for fisheries (76%), followed by provision of small livestock (directly or through a revolving fund) and CfW.192
Figure 4.15 Targeting by activity: Poor households who benefitted from LIFT activities as a proportion of overall beneficiaries /recipients
191 The definition of poor is only a rough approximation. It is based on the subjective observation of the interviewers, which turned out to be closely linked to a question on assets and income. 192 Note that home gardening does not figure here as it was not included in the quantitative questionnaire.
58%
56%
59%
67%
44%
66%
76%
27%
56%
59%
31%
39%
33%
33%
Cash for Work
Cash for Work (various activities combined)…
Construct/improve village footpaths (n=114)
Construct/improve roads (n=58)
Provision of inputs and means of input…
Provision of small livestock (pigs/ducks/goats)…
Revolving Fund for cash (n=87)
Revolving Fund for livestock (n=44)
Inputs for fisheries (n=54)
Provision of seeds (n=48)
Cash to buy inputs (n=73)
Training for poor and vulnerable
Training in livestock production (n=56)
Training in small business mgmt/bookkeeping…
Training for rice farmers
Training in transplanting (n=38)
Training in seed treatment (n=42)
Training in use of fertilizers (n=43)
proportion of poor among beneficiaries (n=number of beneficiaries)

Livelihoods and Food Security Trust Fund – Delta 1 Evaluation Report
Oxford Policy Management 94
4.5.2 Qualitative results
As detailed above, the quantitative research highlighted mixed results in terms of targeting, showing that many activities were not as targeted to the poor as had possibly been intended. Qualitative research helped to explore some of the reasons why this may be, adding important contextual information (some of which has already been analysed for each individual activity).
Overall, the most frequent approach to targeting was a large community meeting where all households were summoned to discuss who would be receiving what. A typical example is reported below:
“We were called for a community meeting and asked what we want to do. After that, they classified casual labourers into five groups according to social and economic status and chose people in group four and five… the poorest, old or disabled casual labourers are in groups four and five.”193
While this method was considered ‘fair’ by many, others highlighted some of the main problems it entails:
• As often “only one member per household”194 was invited, people who attend tend to be men rather than women.
• As only one meeting is held and often not much warning or background information is given, “villagers who live in far places do not attend because they cannot give time.”195
• Similarly, there were a couple more reports along the lines that “those who did not attend the first meeting were not included”,196 raising concerns around the involvement of those community members who are most marginalised and less involved in community activities because of social stigma, lack of time or incapacity (single mothers with children, disabled person, elderly, etc.).
Apart from the screening provided by this first meeting (and the lack of adequate retargeting), other reasons were described by respondents as contributing to ‘shaky’ targeting:
• One problem that was cited a couple of times was the exclusion of households with no local registration card , including households who had recently moved to the area and new households that had split off from the family home.
• Another frequent problem was the exclusion of those who had been targeted by previou s interventions in the area . While this practise is understandable in terms of trying to spread the benefits of activities beyond the ‘usual group’, it created negative dynamics within villages as some people got excluded having only received very little previously.
• The targeting for activities such as training and anything requiring regular commitment was almost always (understandably) targeted at those who had time, were eager, were literate , etc. This of course biased against the most marginalised members of the community who could not spare the time or bear the risk of failure.
An interesting view was also presented by one or two groups who questioned the efficacy of merely asking community members what type of support they wanted without any type of assurance that they would be able to sustain their efforts over time:
193 Male poor and vulnerable, Hnar Nit Pauk, Bogale 194 Female poor and vulnerable, Ku Lar Ohn Pin Su, Bogale 195 Female rice farmers, Kant Ba Lar Su, Bogale 196 Female rice farmers Kha Yu Chaung, Bogale

Livelihoods and Food Security Trust Fund – Delta 1 Evaluation Report
Oxford Policy Management 95
“People chose the livelihood inputs which had the most value, not those which they have the capability to do. So, even though they proposed nets or boats which have more value compared to other inputs, they don't have the ability to pursue this business, or the business is not feasible in this local context.”197
“Farmers got high-value items and we also wanted to get high-value ones too, thinking we would have more income… so, we discussed it and proposed it to the committee. But it was rather short-sighted! When we received ducks, we didn’t have land to tend them and thus just had to sell them back… Nets are also not sustainable… Creeks and rivers are licensed to the contractor and we can’t fish near the village!”198
4.6 Accountability, participation and social mobili sation
4.6.1 Accountability within LIFT-funded programmes
The LIFT IPs included a wide range of NGOs, many of which have long experience and knowledge of humanitarian responses and of including principles of transparency and accountability within the design of their programmes.199 Many IPs recognised the importance of accountability issues and included these in their programme proposals developed for LIFT funding. That said, there was significant variation in the degree to which these issues were incorporated in proposals, ranging from no mention of the need for transparency and accountability to substantive and explicit details of organisational commitments to established principles (e.g. the Humanitarian Accountability Partnership, Sphere)200 and other principles and standards (e.g. “Do no harm” and the Red Cross Code of Conduct) and approaches to incorporating them within implementation. Mechanisms also differed, and included complaint boxes, establishing committees and providing contact details of agency staff.
Where proposals had less recognition of the need for accountability or less detail on implementing accountability mechanisms, perhaps unsurprisingly community members were less likely to know who to complain to or how:
“[At first] Staff... often came and met the beneficiaries and then monitored the conditions… Now, both of them do not come to the village. We do not know who to contact and which one should be contacted…”201
In other cases, however, commitment to accountability principles, when followed through with the implementation of accountability mechanisms (e.g. for receiving complaints), led to positive outcomes and responses from agencies (or village-level committees):
“If we have complaints, we can talk to the Village Authority or the CBO or call the IP in Bogale… or send mail through the mail box in the village…”202
"When we have complaints, we could go talk to the committee… They solved the issues..."203
197 Female poor and vulnerable, Kyaung Su, Bogale 198 Male poor and vulnerable, Kyaung Su, Bogale 199 See also Annex C on Principles of accountability within humanitarian response 200 See also Annex C on Principles of accountability within humanitarian response 201 Female rice farmers in Kha Yu Chaung, Bogale 202 Male rice farmers, Kyaung Su, Bogale

Livelihoods and Food Security Trust Fund – Delta 1 Evaluation Report
Oxford Policy Management 96
“If we have complaint or suggestion, we can contact and ask either the community development facilitator … or [the IP]staff in Bogale directly. However, we have never had a complaint till now.”204
“[there was a] letterbox for complaints, but you could also talk to them directly – we did not have complaints, just suggestions. They acted on our suggestions, for example non-local pigs that died were replaced with a better breed.”205
The inclusion of commitments to accountability in proposals did not always lead to increased accountability on its own, however. In some cases, external evaluations noted that accountability mechanisms in proposals were not fully implemented in practice, and in other cases (when mechanisms were put in place), a lack of agency response meant that accountability to affected populations was not as high as it could have been:
“the drum seeder was not useful for us because its wheels made of iron are very small and it did not work well on the soil. We told [them] about that. However, [they] did not respond to us on this issue.”206
“Me and three other households received support from other organisations... I applied for ducks, and the other three applied for pigs... I didn't get ducks (the one who didn’t receive other support got ducks), but the other three got pigs even though we all received support from other organisations... I just wanted to know why... I asked the committee... I didn't get a clear solution. Later on, I just kept silent since, looking at the overall picture, it’s quite fair for most of the people...”207
4.6.2 Participation and social mobilisation
Accountability towards affected populations can be increased not only through more formalised complaints mechanisms or information provision but also through more participatory approaches. Where clear knowledge of and commitment to accountability principles was not present in the proposals, community participation was still often recognised as being important, particularly in beneficiary selection and in the running of community-based groups (e.g. SHGs). Some approaches also included participatory needs assessments and analysis and community involvement in deciding priorities for activities. In Kyaung Su (Bogale), for instance, female casual labourers explained that community members were involved in deciding the activities. The IP called a village meeting and decided who should get what with the consensus from community members.
Social mobilisation appears to have focused on addressing these areas, and particularly on community involvement in the beneficiary selection or targeting. These have been covered in some detail within specific sections focusing on different interventions. Training or capacity development for SHGs or interest groups and CBOs was also conducted, including in the areas of group formation and management.
In some cases, however, particular groups or people were excluded from participation: male rice farmers in Kha Yu Chaung (Bogale) explained that whenever NGOs called community meetings,
203 Male casual labourers in Kyaung Su, Bogale 204 Male casual labourers, Ku Lar Ohn Pin Su, Bogale 205 Male rice farmers, Ma Gu Ywar Ma, Bogale 206 Male rice farmers, Kant Ba Lar Su, Bogale 207 Female casual labourers, Kyaung Su, Bogale

Livelihoods and Food Security Trust Fund – Delta 1 Evaluation Report
Oxford Policy Management 97
some villagers who lived in the more distant areas did not come although the Village Authority announced the meeting and asked every villager to come by using a loudspeaker. This was because they either did not want to take the time to come to the meeting or did not hear the announcement. None of them felt involved in defining needs within the community.
Other issues regarding group formation arose when people involved in CBOs were chosen by village authorities: “Livelihood committees and the Village Authority play a major role... Villagers are not interested in the CBO... it needs more collaboration between different groups to get a better result.”208
4.7 Additional impact areas
While not explicitly a focus of the evaluation, there are two additional areas we provide summary findings on: the impact of LIFT activities on women and the impact on employment. These are analysed in turn below.
4.7.1 Gender
Evidence on gender impacts was not systematically collected. However, some interesting findings emerged in terms of female participation in LIFT activities and the impact this had on their livelihoods and intra-household relations.
Overall, female involvement in the targeting stage was mostly adequate, although there were occasional complaints of only one member per household being invited (resulting in lower female participation). Moreover, many of the activities for poor and vulnerable households were specifically targeted at women, meaning that in many cases they were the primary recipients of the benefits. This was particularly the case for home gardening, revolving funds, SHGs and many of the income-generating training and input provisions (e.g. tailoring, beauty salon, grocery store, etc.).
When discussing the specific effects of these activities on women, the key finding was a sense of ‘independence’ and ‘influence’ over their husbands that women felt because of the support they received. This was confirmed across several female FGDs in the study villages, as exemplified by the quotes below:
“Women can have more income and can participate in the fishery business… Women got a chance to be involved in the discussion and learn more knowledge and can keep abreast with men… Before, we stayed at home and couldn’t earn any money… Now we raise pigs and chickens, and do home gardening… Our husbands catch fish and we sell fish and earn income.”209
“Women became able to speak out and make more income...”210
“Because of the revolving fund, women have improved in terms of not only livelihood but also their mentality. They have become better able to produce income. They have become businesswomen. For example the betel seller woman became a grocery
208 Mixed (male and female) rice farmers from Kyaung Su, Bogale 209 Female poor and vulnerable, Kyun Nyo Gyi, Dedaye 210 Female rice farmers, Kwin Wyne, Pyapon

Livelihoods and Food Security Trust Fund – Delta 1 Evaluation Report
Oxford Policy Management 98
owner. They became able to do home gardening. As they can generate income, women have influence on their husbands.”211
In a couple of cases, women had to overcome male prejudice in order to fulfil their newly acquired skills. “Since she (the para-vet) is female, the farmers didn't trust her ability in the first place… but later on they were convinced that she could heal the animals and now they are taking service from her”, women reported in Pho Khwe Gyi (Labutta).
Results from the quantitative survey also help to complement the overall picture. Respondents were asked which activities, in their opinion, benefitted women in particular. The top-ranking activities were inputs to start businesses and the revolving fund for cash.212 This was followed by the provision of livestock (direct or through the revolving fund).
Figure 4.16 Activities that helped women in particu lar
Figure shows only activities with the highest proportions. Based on question B4g: do you feel that this activity helped women in particular? Base households that lived in villages where the activity has been implemented, according to B1 Results shown for the top-ranking activities (minimum number of respondents per activity n=50 for an activity to be included in ranking)
4.7.2 Employment
Not all the LIFT activities were directly aimed at providing additional employment, although this was often one of the intended effects. Getting a sense of increased employment in the FGDs was difficult. While respondents described how activities had affected their income, it was difficult to garner whether this was linked to a stable source of employment and especially difficult to quantify this. The evidence we present here is therefore based on the findings from the quantitative survey,
211 Mixed (male and female) rice farmers, Bonlon Chaung, Kyaiklat 212 It should be noted that SHGs were not listed in the quantitative survey, so do not appear here.
94%
91%
85%
85%
84%
80%
78%
76%
0% 50% 100%
Inputs to start up business
Revolving Fund for cash
Provision of small livestock…
Revolving Fund for livestock
Cash to buy inputs
Training in livestock production
Construct/improve roads
Renovation of drinking water ponds
proportion of households who think that the activity helped women in
particular

Livelihoods and Food Security Trust Fund – Delta 1 Evaluation Report
Oxford Policy Management 99
where respondents were asked whether the LIFT activities led to new or increased employment for them or other people in their household.213
Figure 4.17 Proportion of respondents who benefitte d from the activities with respect to employment 214
4.8 Cost-effectiveness
This section compares the effectiveness of LIFT activities against costs to try and establish a very basic measure of cost-effectiveness. In previous sections (summarised in Section 3.9), it has been established which activities can be considered to have been effective and which had a mixed effect. It is now of interest to compare this against the estimated expenditure on these activities, as far as these costs are available.
4.8.1 Costs and distribution of funds across activi ties
Given the high number of IPs, it has been extremely difficult to obtain exact costs per activity (partially because these varied widely). On the other hand, the LIFT 2010 Annual Report does provide an overall assessment of costs per activity that frequently match the activities assessed in this report. According to additional information on costs provided by LIFT, 90% of expenditure was spent in 2010. Therefore, the figures from the 2010 Annual Report are used for this exercise in awareness that these are approximations.
The 2010 Annual Report (p. 5), states that expenditure has been distributed as follows, with 33% of expenditure spent on Output 1:
213 Figure 4.12 shows that 12% of respondents stated that the activities helped them to find new or more employment, earn a living, etc. The activities that these respondents participated in most frequently were the revolving fund for cash, inputs for fisheries, provision of small livestock, CfW activities, training in livestock provision, and the revolving fund for livestock. However, it should be noted that there is no direct link between these two questions, and that caution is needed for the interpretation. The activities that are mentioned most often by all participants are also the activities that come up among those who found new employment.
214 Based on questions E1–E5.
14%
24%
12%
27%
18%
0% 20% 40% 60% 80% 100%
activities helped to…
establish a new enterprise
increase profitability of existing
enterprises
find new or more employment
earn a living
reduce your debt
among all 800 sampled respondents
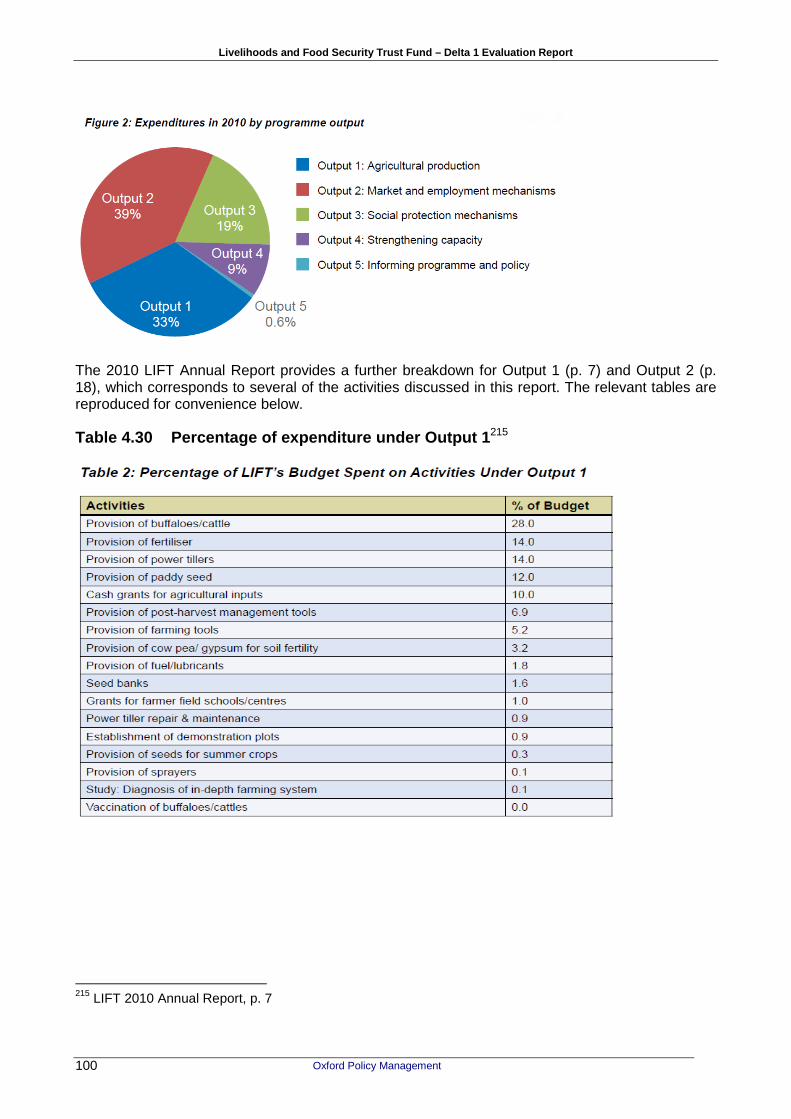
Livelihoods and Food Security Trust Fund – Delta 1 Evaluation Report
Oxford Policy Management 100
The 2010 LIFT Annual Report provides a further breakdown for Output 1 (p. 7) and Output 2 (p. 18), which corresponds to several of the activities discussed in this report. The relevant tables are reproduced for convenience below.
Table 4.30 Percentage of expenditure under Output 1 215
215 LIFT 2010 Annual Report, p. 7
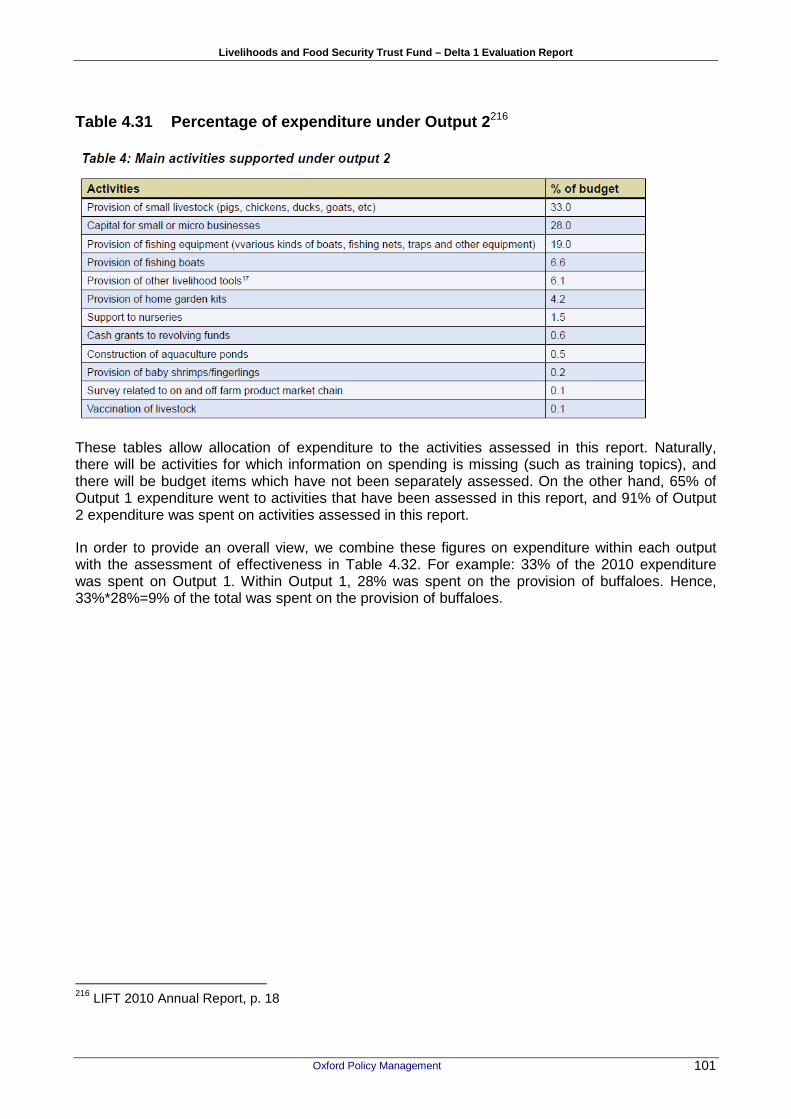
Livelihoods and Food Security Trust Fund – Delta 1 Evaluation Report
Oxford Policy Management 101
Table 4.31 Percentage of expenditure under Output 2 216
These tables allow allocation of expenditure to the activities assessed in this report. Naturally, there will be activities for which information on spending is missing (such as training topics), and there will be budget items which have not been separately assessed. On the other hand, 65% of Output 1 expenditure went to activities that have been assessed in this report, and 91% of Output 2 expenditure was spent on activities assessed in this report.
In order to provide an overall view, we combine these figures on expenditure within each output with the assessment of effectiveness in Table 4.32. For example: 33% of the 2010 expenditure was spent on Output 1. Within Output 1, 28% was spent on the provision of buffaloes. Hence, 33%*28%=9% of the total was spent on the provision of buffaloes.
216 LIFT 2010 Annual Report, p. 18
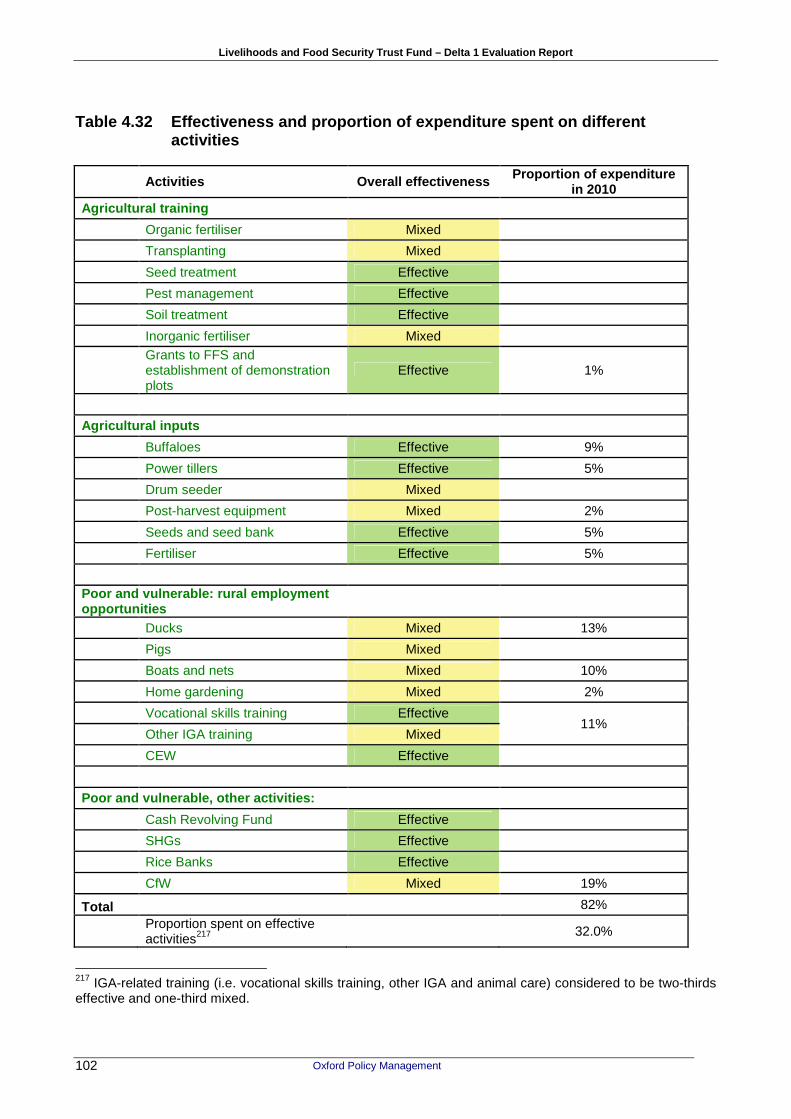
Livelihoods and Food Security Trust Fund – Delta 1 Evaluation Report
Oxford Policy Management 102
Table 4.32 Effectiveness and proportion of expendit ure spent on different activities
Activities Overall effectiveness Prop ortion of expenditure in 2010
Agricultural training
Organic fertiliser Mixed
Transplanting Mixed
Seed treatment Effective
Pest management Effective
Soil treatment Effective
Inorganic fertiliser Mixed
Grants to FFS and establishment of demonstration plots
Effective 1%
Agricultural inputs
Buffaloes Effective 9%
Power tillers Effective 5%
Drum seeder Mixed
Post-harvest equipment Mixed 2%
Seeds and seed bank Effective 5%
Fertiliser Effective 5%
Poor and vulnerab le: rural employment opportunities
Ducks Mixed 13%
Pigs Mixed
Boats and nets Mixed 10%
Home gardening Mixed 2%
Vocational skills training Effective 11%
Other IGA training Mixed
CEW Effective
Poor and vulnerable, other activities:
Cash Revolving Fund Effective
SHGs Effective
Rice Banks Effective
CfW Mixed 19%
Total 82% Proportion spent on effective activities217
32.0%
217 IGA-related training (i.e. vocational skills training, other IGA and animal care) considered to be two-thirds effective and one-third mixed.

Livelihoods and Food Security Trust Fund – Delta 1 Evaluation Report
Oxford Policy Management 103
Activities Overall effectiveness Prop ortion of expenditure in 2010
Proportion spent on activities with mixed success
49.5%
4.8.2 Observations
Various observations can be made with respect to Table 4.32.
There are activities that have been effective and on which a sizeable budget has been expended, namely the provision of buffaloes, power tillers and seeds, i.e. inputs that allowed rice farmers to carry out farming after the destruction of Nargis.
There are also several activities that had a mixed effect, but attracted a substantial amount of funding, namely small livestock provision and the provision of boats and nets.
Many of the training sessions were given in conjunction with other activities and operated in that context. As a stand-alone activity, the training would have been less effective. This poses a challenge for the cost-effectiveness analysis. Here it is best to look at the effectiveness of the training without the costs.
Some further thoughts can nevertheless be ventured, even if of a speculative nature. The seed management training can be considered as particularly cost-effective as it was easy to teach and spread widely. Again, this was possibly a measure that was most effective after the Nargis destruction, when seeds were more likely to be mixed up and when it was even more important to select the best seeds easily and quickly. Once they had been selected, the proportion of poor seeds is likely to decrease and hence the seed treatment is likely to be less critical.
Other activities have been effective, again without knowing the costs, namely the revolving funds and the SHGs.
Finally, there are some activities that attracted a high proportion of funding (such as IGAs), which are best considered as two or even three separate activities. Vocational skills training has been effective, and so has animal care training (if considered as part of the IGAs), whereas some of the small business training had a mixed effect. Yet the distribution of costs between the various sub-activities is not known.
Nevertheless, while this cost-effectiveness analysis is necessarily limited, it still provides some insights as to which activities appear to have been less cost-effective (small livestock, boats, nets) than others (buffaloes, power tillers, training, revolving funds, SHGs, vocational training, CEWs).

Livelihoods and Food Security Trust Fund – Delta 1 Evaluation Report
Oxford Policy Management 104
5 Overall lessons learned and associated recommenda tions
This section first provides brief answers to the research questions from the terms of reference and then draws out the main lessons learned from reviewing the various activities.
5.1 Research questions, addressed in summary
The terms of reference for the study provided a key set of research questions, listed in order of priority,218 with clear distinctions between high-, medium- and lower-priority questions. This section provides very brief answers to these questions, focusing on the most important aspects when answering them.
High-priority research questions:
• What interventions worked best to increase rice farmer income ? (increased production/quality, lower cost inputs, post-harvest processing, rice banks/storage, marketing, transport infrastructure etc.)
o The interventions worked best that enabled farmers to resume full agricultural activity, namely the provision of buffaloes, power tillers, seeds and fertiliser along with training in seed treatment, pest management and soil management.
o This contrasts with the transplanting and fertiliser training, as well as the provision of drum seeders and post-harvest equipment, all of which had mixed results. Taking local conditions more into account as part of the training is likely to increase their usefulness.
• What interventions worked best to increase paddy production ? What were the contributions from increase in area planted versus increase in yields?
o The response to this question will repeat the answer to the previous question. Some of the activities to increase area planted were successful (e.g. embankments or power-tiller provision). Some of the activities to increase paddy yield have been successful (training on seed treatment, pest management, and soil management), whereas others had mixed success (training on fertilisers).
• Assessment of the effectiveness, efficiency and sustainability of different approaches to farmer extension . Assessment of the adoption of different practices/technologies extended (new knowledge, relevant/appropriate, constraints to adoption etc.).
o As stated in the Executive Summary, the best training sessions, as reported by respondents, were those sessions that were very practical and that clearly explained and demonstrated every phase of the agricultural technique being taught. Consistent interaction (such as regular meetings with villagers as part of the FFSs or at least a go-to contact person in the closest town) helped to build the trust and confidence of training participants.
o The systematisation of knowledge spreading, through Farmer Exchange Groups or other informal farmer networks, appeared to be useful in helping knowledge on new techniques to be spread. A further success factor reported by a few of the IPs was the linking of the agricultural training with expertise from the MAS, including MAS extension workers themselves being paid to give the training.
o Importantly, the lack of appropriate tailoring to local conditions played a role in non-adoption of agricultural techniques.
218 Priorities based on meetings with LIFT staff on 13 and 17 October 2011. One adjustment was made as a result of this review and the priorities were agreed.

Livelihoods and Food Security Trust Fund – Delta 1 Evaluation Report
Oxford Policy Management 105
• Assessment of impacts of different interventions on the most poor and vulnerable in the community – what worked best for them?
o One of the crippling constraints for poor people is the need to borrow money at high interest rates, thereby reducing the amount available for investment or even for storing the harvest until prices go up. Accordingly, SHGs and revolving funds that provided loans at lower interest rates were particularly helpful to unlock the cycle of debt.
o In addition, rice banks and vocational skill training, as well as the CEW training, were effective in increasing the income for the poor (sometimes only modestly).
• Food security and nutrition : Links between agricultural production, livelihood support, and food security and nutrition
o Unsurprisingly, there is a close link between increased income through higher yields and increased food security, which was evident both from the qualitative and quantitative results.
Medium-priority questions:
• What worked best among the various IGAs promoted? (For landless households, for women, for men, for the aged or disabled?)
o The CEW training was widely seen as successful. It provided a useful service to villagers at lower costs than a vet and led to a modest income to those trained. The information is not sufficient to distinguish between various segments, and the results per IGA are based on one to two FGDs only. However, crab trap making and stove-makings were among those mentioned as useful.
• What skills training resulted in the best benefits in terms of employment (Increase in number of days men/women were able to find work? Increase in pay?)
o The vocational skills training led to modest incomes, from beauty salons, tailoring, mechanical repair and masonry/carpentry, though in each case the findings are based on one FGD only.
• What is the likelihood that the benefits associated with each type of intervention can/will be sustained ? What are the factors that promote/hinder the sustainability of each?
o The lessons learned from successful training sessions (seed, soil and pest management, animal care and vocational training) can be expected to be used in the future, as they are already adopted now. The provision of inputs for farmers (buffaloes, power tillers, seeds) also appears sustainable. The factors that hinder the adoption and sustainability of other activities are varied (e.g. soil conditions that prevent transplanting, lack of land to grow small livestock, lack of funds to buy fertiliser, etc.).
• Assessment of relative success and cost-effectiveness of the four broad areas of intervention: increasing agricultural production, improving household incomes and employment, providing social protection, and local capacity development. Given the outcomes relative to expenditure, was the balance appropriate?
o The cost-effectiveness assessment compares costs (as far as available per activity) to the effectiveness of activities. On that crude basis, several activities can be considered as costly but effective, namely the provision of buffaloes and power tillers. Others were costly and less effective, such as the provision of livestock as IGAs. For many of the other activities, a clear link between effectiveness and costs cannot be made.

Livelihoods and Food Security Trust Fund – Delta 1 Evaluation Report
Oxford Policy Management 106
Lower-priority questions:
• Assessment of different approaches to supporting CBOs (including: issues of representation of women/landless/vulnerable/minorities; collective ownership of assets – how these worked, management arrangements, equity, transparency/accountability, and sustainability)
o This study did not specifically address this question, as it was marginalised by the scope of other topics. However, what can be said is that in most cases the members of VDCs were well chosen and selected by the communities. The process of selection was usually transparent. People tended to be chosen who were regarded as trustworthy, as they had worked in a community role. This limited the opportunities to introduce new members. Some of the groups were based on livelihood groups (such as fisheries). CBOs often found the training they received was useful (e.g. financial management training).With respect to accountability, many people do not make claims as they do not know who to make complaints and suggestions to.
• What approaches worked best for provision of credit? (Assessed in terms of numbers of new loans provided, costs of administration, loan terms and conditions, average loan size, loan use (consumption, emergencies, investment), level of arrears/default/successful repayment, sustainability after project support ended etc.)
o Revolving funds for cash and SHGs were often effective in providing loans at lower interest rates, in one village even leading the money lender to reduce his interest rates. For example, in some places they allowed farmers to store their harvest longer (meaning less pressure to repay immediately after harvest) and hence to realise higher prices for their crop, thereby directly increasing their income.
• Attribution to LIFT and recovery to pre-Nargis levels of food security and production. What has been the progress made by households towards recovering to pre-Nargis levels of production and livelihood/food security
o Income and food security has recovered to about two-thirds of pre-Nargis levels. A direct attribution to the LIFT interventions is not possible in the absence of a comparison group. At the same time, however, many of the LIFT activities have been effective and many group participants stated that their income increased due to LIFT. Hence, some of the recovery must be due to LIFT though it is not possible to state how much.

Livelihoods and Food Security Trust Fund – Delta 1 Evaluation Report
Oxford Policy Management 107
5.2 Summary of lessons learned and recommendations
Brief sections on lessons learned have been provided for each of LIFT’s key activities analysed in Section 3. Within this section, the aim is to compile, summarise and develop some of those insights in order to provide a comprehensive overview of the main lessons learned during the fieldwork conducted for this evaluation.
A first set of lessons related to the agricultural training . These are set out below:
1. One of the main reasons for lack of adoption of some of the agricultural techniques addressed in the training was the lack of appropriate tailoring to local conditions . More than training appropriate to the Delta area as a whole, findings showed that training should incorporate: - Knowledge of village-level constraints such as: a) land distribution; b) soil conditions; c)
labour supply and demand; and d) access to agricultural markets (this could be done through a rapid assessment before training starts);
- Basic exercises around the costs and benefits (and therefore the affordability ) of each technique in that specific village. Ideally, this would incorporate considerations on the timing of costs and benefits and how these can best be managed to avoid seasonal debt cycles;
- More generally, linkage of agronomic and wider economic training .
2. The best training , as reported by respondents, was very practical and clearly explained and demonstrated every phase of the agricultural technique being taught. Based on the evidence, we recommend: - Continued use of visual aids such as posters, and o f demonstration plots , overall
perceived as a key success factor in helping farmers involved in the training to clearly understand each step and proving the effectiveness of certain techniques to other farmers who had not been involved in the training;
- Comparing practical constraints and advantages of s imilar techniques , including under which circumstances one should be adopted over the other (e.g. organic versus inorganic fertiliser);
- Discussing how to maximise outcomes of a given tech nique in light of farmers’ actual financial and non-financial constraints. For example, if farmers can only afford X amount of fertiliser, at what stage is it best to use it and how is it best used?
3. A success factor that was reported by a few of the IPs was the linking of the agricultural training with expertise from the MAS , including MAS extension workers themselves being paid to give the training. Exploring future and more institutionalised partnerships with the MAS would have the double advantage of: - Helping to sustain MAS’ under-financed extension activities in the Delta area; and - Creating longer-term and sustainable relationships, while tapping into local knowledge
resources.
4. Consistent interaction , or at least the presence of a go-to contact person in the closest town, helped to build the trust and confidence of training participants: - In FFSs, respondents could develop a set of enquiries one week that could be settled the
next. Similarly, many respondents reported having travelled to town with a specimen of their rice paddy/pest to discuss with the contact person identified by LIFT IPs.
Livelihoods and Food Security Trust Fund – Delta 1 Evaluation Report
Oxford Policy Management 108
5. The systematisation of knowledge spreading , through Farmer Exchange Groups, peer-to-peer learning, or other informal farmer networks, appeared to be useful in helping knowledge on new techniques to be spread. - This was sometimes supported by the presence of a physical building (e.g. FFS) in the
village, which fostered ongoing interaction, meetings, place to put posters, etc.
6. There were sometimes trade-offs in the choice of training method for the agricultural training, which should be carefully considered in advance: - Occasional training could include a larger audience and target a wider range of people
(including older, illiterate, ‘busy’ farmers), but such sessions were less effective in building trust and changing mind-sets;
- While being much more effective in their outcomes, regular training could only provide support to a limited number of farmers (not more than 10–15), most often characterised by being young (and therefore ‘enthusiastic’), literate and willing to dedicate a considerable amount of time to participating regularly.
7. As a last and minor point, some training topics proved to be very effective in generating trust both among training participants but also among those who were not trained (basically increasing the credibility of participants). These included the pest management and the seed purification training.
A second set of lessons relate to agricultural and non-agricultural 219 inputs :
1. Regarding the provision of inputs, the most important lesson learned regards the way in which the mode of provision affects outcomes . This is discussed in detail in Section 3.8, highlighting that, overall: - Group ownership of large assets was successful so long as groups were small and
mostly homogenous, clear sharing arrangements were set out in advance (including on maintenance) and no practical constraints were e ncountered ;
- The provision of cash to purchase inputs was overall pr eferred to vouchers (which were inflexible and felt to lead to lower quality) or direct provision (which was only considered efficient for inputs with economies of scale and certified quality).
2. The only ‘unsuccessful’ inputs were those that were not relevant locally or not targeted appropriately . This is an extremely important factor to be considered in future phases of LIFT planning, highlighting the need for a structured and in-depth inception phase to inform future planning and involve communities in decision-making processes. Examples of non-relevant and ill-targeted inputs encountered in the course of this evaluation include: - Drum seeders that were not appropriate to village conditions; - Paddy seeds that were of a variety that was not consumed (and therefore not planted)
locally; - Post-harvest equipment that could not be used because of household requirements to
immediately repay debts upon harvest (though this is less of an issue than other items in this list);
- Pigs that were of the ‘white’ and non-local variety; - Boats and nets provided to people who were not fishermen; - Ducks that were provided to landless households, with no access to tending grounds; and
219 We analysed these together as many of the issues arising are similar. ‘Non-agricultural’ inputs, in this context, include all those inputs provided to poor and vulnerable households (pigs, ducks (livestock if part of agriculture), boats, etc.).

Livelihoods and Food Security Trust Fund – Delta 1 Evaluation Report
Oxford Policy Management 109
- Home gardening inputs and training provided to landless households, with no access to land.
3. The combination of inputs and training was very success ful , especially in the case of livestock extension workers or para-vets, which appear to be a much-needed community resource.
A third set of lessons relates to the revolving funds and SHGs :
1. Evidence from key informants especially stressed that smaller and more homogenous groups were more likely to be successful . Social homogeneity was especially guaranteed within SHGs, with the counter-effect being a worse targeting towards the poorest households.
2. CBO members having problems collecting funds from defaulting group members recommended ensuring more legal backing to revolving fund ‘managers’. Nevertheless, it should be noted that this could also backfire if it becomes a tool to prosecute the poorest (and therefore defaulting) households. This risk is particularly high for livestock-related revolving funds, where high mortality rates sometimes led to generalised default.
An additional set of considerations should also be made:
1. The first relates to the targeting of the LIFT activities. These issues were explored in depth in Section 4.5. The main lessons learned and consequent recommendations include: - Targeting households based on their abilities/capac ity as well as needs/requests (or
at least facilitating the process of gaining that capacity). For example, targeting ducks and home gardening at landless households and boats/nets at people without a fishing background was destined by definition to be a failure;
- Spending more time and effort on the organisation of the initial targeting meeting , making sure all village members are adequately represented (or at least have a chance to be included in the targeting at a later stage). In particular, attempts should be made not to exclude:
� Women (by inviting only one member per household, usually male); � Villagers who live in remote places (who ‘cannot spare the time’); � Other marginalised people (less involved in community activities because of social
stigma, lack of time or incapacity; e.g. single mothers with children, disabled persons, and the elderly, etc.);
- Giving more thought on how to avoid the exclusion of house holds with no local registration card , including households who recently moved to the area and new households that split off from the family home;
- Giving more thought to the exclusion of those who have bee n targeted by previous interventions in the area.
2. The second relates to other overall constraints that households face in returning to pre-Nargis levels of income. The most important cited by respondents are briefly outlined below, not so much as recommendations, but more as barriers that should be addressed in order to facilitate the process of supporting livelihoods in the Delta area . - By far the most frequently cited constraint faced by household s in regaining their
livelihoods as they had been before LIFT was the hi gh interest rates they faced in the area and the way this encouraged a spiral of debt. “Our main constraint is getting capital...

Livelihoods and Food Security Trust Fund – Delta 1 Evaluation Report
Oxford Policy Management 110
With 15% interest rates per month, what can we do?”220 just about summarises the myriad number of quotes that relate to the credit constraints faced by farmers and casual labourers alike. High interest rates and un-helpful re-payment schedules affected respondents in many ways, including having to sell labour in advance at lower rates (casual labourers) and not being able to store paddy to be sold later at a higher prices (farmers).
- A second issue that came up time and time again in the course of the FGDs was the lack of access to markets . This was perceived as having the two-way effect of increasing the price of inputs (affecting quality as well because of monopolies and sometimes meaning some inputs were not available at all, e.g. seeds for home gardening) and decreasing the values of outputs (the few traders around could bargain for very low prices).
- A third overarching issue that affected fisher-folk in particular, was the contracting out of the river . Discussed in more detail in Section 3.5.3, this issue needs to be addressed at a higher level to avoid longer-term consequences for poorer fishermen and their families.
220 Male poor and vulnerable, Kyaun Su, Bogale

Livelihoods and Food Security Trust Fund – Delta 1 Evaluation Report
Oxford Policy Management 111
Annex A Terms of reference
I. Background: UNOPS has been appointed as the Fund Manager for the Livelihood and Food Security Trust Fund (LIFT) in Myanmar. LIFT is a multi-donor fund of US$ 100 million over five years to address food insecurity and income poverty in Myanmar. The Donor Consortium of LIFT comprises Australia, Denmark, the European Community, the Netherlands, New Zealand, Sweden, Switzerland, and the United Kingdom. The overall objective of LIFT is to contribute resources to a livelihoods and food securityprogramme with the aim of making progress towards the achievement of Millennium Development Goal 1221 (the eradication of extreme poverty and hunger) in Myanmar. Working through a trust fund modality, LIFT’s purpose is to increase food availability and incomes of 1-1.5 million target beneficiaries. This is to be achieved through delivering the following programme outputs:
1. Direct agricultural production support provided and used by target individuals 2. Effective market and employment support mechanisms provided and used by target individuals (on
farm, off farm and non-farm) 3. Effective social protection measures provided for the chronically poor of the target households 4. Capacity of local partners strengthened to support livelihoods and food security initiatives 5. Monitoring and evaluation evidence and commissioned studies used to inform programme and policy
development And the following management outputs:
6. Funds are allocated in line with Fund Board policies and are accounted for in a transparent manner 7. Fund flow and partner performance are monitored and evaluated
LIFT is implemented through a variety of local implementing partners (IPs) who were successful in submitting proposals that supported the LIFT purpose in the areas targeted.
II. Justification of consultancy: The first round of LIFT support to IPs took place in 2010 in the Delta region. This is referred to as the Delta I sub-program, and IP activities will all have been completed by the time the evaluation takes place. In total 22 IP projects were supported under Delta I, most of which were for one year’s duration or a little over one year. During that time LIFT provided assistance to 1,300 villages in the Delta, reaching an estimate 150,000 households or 750,000 people as direct beneficiaries. LIFT now wishes to evaluate this initial sub-program, to report on its outcomes to LIFT funding agencies and to learn lessons for future sub-programs. No overall baseline study was undertaken at the commencement of Delta I, with the IPs developing their own baselines many of which were to provide information for IP programming and implementation rather than for comparison with an end-of-project evaluation. These baselines were undertaken using a variety of methods, from random representative household surveys (by UNDP for example) to participatory needs assessments (most of the smaller IPs). Now that Delta I is nearing completion, LIFT needs to evaluate its success and learn lessons for future LIFT and IP projects. The evaluation will follow standard DAC evaluation criteria:222 relevance, effectiveness, efficiency,
221 Reduce by half the proportion of people living on less than a dollar a day; achieve full and productive employment and decent work for all, including women and young people; reduce by half the proportion of people who suffer from hunger. 222 http://www.oecd.org/document/22/0,2340,en_2649_34435_2086550_1_1_1_1,00.html
Livelihoods and Food Security Trust Fund – Delta 1 Evaluation Report
Oxford Policy Management 112
impacts, and sustainability. While all these areas need to be considered in the evaluation, it is the general evaluation of outcomes from the various IP livelihood and food security activities and approaches, and the lessons learned in the process, that will be the major focus. As such the evaluation is designed to provide recommendations and lessons to guide future LIFT activities and livelihood and food security support programs in the Delta region and Myanmar more generally.
III. Development objective: The LIFT goal is: To improve the food and livelihood security of the poorest and most vulnerable people in Myanmar The LIFT purpose is: To increase food availability and incomes of 1-1.5 million target beneficiaries
IV. Immediate objective(s): The objectives of the consultancy are twofold:
a. To assist LIFT to design and implement a survey to evaluate its first phase of activities (known as Delta I), and
b. To analyse and report the findings of the evaluation survey. Individuals or firms will need to cover both objectives and can form associations to enable a full range of expertise to be proposed. The evaluation as well as reviewing LIFT and IP documentation will require field survey work that will include but may not be limited to:
• focus group discussions (FGDs) with community sub-groups in a sub-sample of the 1,300 villages where IP activities took place,
• key informant interviews with knowledgeable stakeholders or experts within or outside the villages selected (eg village leaders, IP staff, government officers, independent technical experts etc)
• completion of village profiles providing basic data on villages selected for the evaluation and the IP interventions in each, and possibly
• a small household survey covering a sample of households in the villages selected for the evaluation. The evaluation is designed to focus on a number of issues that are considered important for providing deeper understanding and useful lessons for future LIFT activities. The 22 different IPs focussed on different interventions and used different approaches towards increasing agricultural production, income generation, social protection and capacity building. Through this evaluation LIFT is now keen to understand which of these interventions and approaches were the most effective and offer the greatest promise for future LIFT projects.223 The key issues to be investigated include but may not be limited to:
o What interventions worked best to increase paddy production? The contributions from increase in area planted versus increase in yields?
o What interventions worked best to increase rice farmer income? (increased production/quality, lower cost inputs, post-harvest processing, rice banks/storage, marketing, transport infrastructure etc)
o What worked best among the various income generation activities (IGAs) promoted? (For landless households, for women, for men, for aged or disabled?)
o What skills training resulted in the best benefits in terms of employment (Increase in number of days men/women were able to find work? Increase in pay?)
o What approaches worked best for provision of credit? (Assessed in terms of numbers of new loans provided, costs of administration, loan terms and conditions, average loan size, loan use
223 In some cases the evaluation team may recommend other interventions or approaches not used by the LIFT IPs that hold promise and should be considered/tested by LIFT in the future.

Livelihoods and Food Security Trust Fund – Delta 1 Evaluation Report
Oxford Policy Management 113
(consumption, emergencies, investment), level of arrears/default/successful repayment, sustainability after project support ended etc)
o Assessment of the effectiveness, efficiency and sustainability of different approaches to farmer extension. Assessment of the adoption of different practices/technologies extended (new knowledge, relevant/appropriate, constraints to adoption etc).
o Assessment of different approaches to supporting community-based organizations (including: issues of representation of women/landless/vulnerable/minorities; collective ownership of assets – how worked, management arrangements, equity, transparency/accountability, sustainability)
o Assessment of impacts of different interventions on the most poor and vulnerable in the community – what worked best for them?
o What is the likelihood that the benefits associated with each type of intervention can/will be sustained? What are the factors that promote/hinder sustainability of each?
o Assessment of relative success and cost effectiveness of the four broad areas of intervention: increasing agricultural production, improving household incomes and employment, providing social protection, and local capacity development. Given the outcomes relative to expenditure, was the balance appropriate?224
The evaluation will also consider the progress made by households in the sampled villages towards recovering to pre-Nargis levels of production and livelihood/food security. Not all of any recovery can be attributable to LIFT which only provided 12 or 15 months of support in the 38 months since Nargis. Other programs also contributed considerable funds for emergency response and recovery in the area. Nevertheless, the evaluation should assess the contribution made by LIFT in the recovery in the villages visited. The selection of villages to include in the evaluation will be purposive; guided by LIFT to ensure the variety of different IP interventions and approaches are adequately covered. While the exact number of villages to include in the survey is yet to be determined, bidders should base their costing on an estimated coverage of 100 of the 1,300 villages where LIFT activities have taken in the Delta 1 sub-program. It is proposed that 100 villages be covered in a simple household survey that would interview 8 households per village (total sample size of 800). More detailed and largely qualitative investigations will take place in a much smaller number of villages (no more than 50) that will include the use of focus group discussions and key informant interviews. Villages will include some of the most easily accessible and some of the most remote of the 1,300 villages. Evaluation teams may need to spend up to 2 or 3 days in villages where the more detailed investigations will take place to undertake the necessary focus group discussions and key informant interviews and visit farms, group facilities and IGA sites etc. The final sample of villages, list of evaluation issues and questions, and approach will be developed by the consultant drawing on the advice of LIFT and its implementing partners.
V. Outputs: PART 1: Design and implementation of the evaluation field work: 1.1 Evaluation inception report The inception report is due two weeks from commencement of OPM work in Myanmar and should briefly cover progress in the following areas:
• The proposed methodology to cover the key evaluation issues and questions (as agreed with LIFT) and the approach to collect information from each stakeholder group (eg beneficiaries of each type of support, non-beneficiaries, landless, women, female headed households, poorest/most vulnerable etc etc)
224 This is part of the assessment of effectiveness and efficiency for each of the main outputs of LIFT (outputs 1 to 4 that are the focus of this evaluation).

Livelihoods and Food Security Trust Fund – Delta 1 Evaluation Report
Oxford Policy Management 114
• A draft of question checklists for FGDs and key information interviews, and field observation record sheets etc, that have been tested and modified following testing (with clear objectives and a strategy for analysis behind each question)225
• A report of the field testing of focus group discussions, key informant interviews, village profile, field observations and questionnaires (if required) indicating all issues and problems encountered and changes proposed to address these
• A report of the training program provided to FGD facilitators, interviewers, field enumerators etc recruited to implement the survey
• A detailed schedule of village visits • A logistics, management and supervision plan ensuring appropriate oversight and quality assurance,
and the most efficient use of personnel and survey resources. 1.2 Field work progress report This progress report is due 2 weeks after commencement of field work and outlines the progress to date against the schedule of village visits and highlights any problems or issues faced. The report should discuss revisions to the evaluation implementation plan, as necessary, based on the experience in the first 2 weeks. 1.3 Field work completion report The field work completion report accompanies the completed village profiles, documentation covering all FGDs, key informant interviews and household/beneficiary surveys (in each of the sampled villages), and provides a summary of what has been completed (eg the names of villages visited for each of the key evaluation issues and the associated IP interventions investigated, and the number of FGDs by sub-group, key informant interviews and questionnaires completed in each), the approach taken (team structure and supervision, logistical arrangements etc), issues faced, actions taken, recommendations and lessons for future livelihood and food security evaluations. It is expected that the evaluation field work will take between 4 weeks to be completed (depending of the number of facilitators interviewers to be employed) and the field work completion report should be submitted 2 weeks thereafter. It should be noted that all hard copies of village profiles, FGD reports, key informant interviews and questionnaires accompanying this report must be carefully ordered, complete, and clearly legible (in the case of questionnaires) All hard copies of village profiles, FGDs, interviews and questionnaires will remain the property of LIFT. PART 2: Analysis and reporting the findings of the evaluation: 2.1 Draft evaluation report A draft of the evaluation report is expected 4 weeks after field work has been completed. The evaluation report should cover the following:
• Introduction • Background to the evaluation • Objectives of the evaluation and key issues investigated • Methodology, resources and budget • Findings of the evaluation by key issue (covering all sources of information: household
questionnaires, FGDs and village profiles) • Conclusions (including consideration of the DAC evaluation criteria) • Recommendations for LIFT and lessons for future livelihood and food security support activities.
Annexes should include the tools used (the checklists of questions for each sub-group for the focus group discussions and for key informant interviews, the village profile format, questionnaires used (English versions), field observation record sheets), documentation for each of the FGDs undertaken with each sub-group in each of the sampled villages,226 and the terms of reference for the study.
225 Again, this will be developed as a collaborative effort with LIFT and will not be the sole responsibility of the contractor. 226 This will be a substantial annex and, if preferred, can be produced as a separate report.
Livelihoods and Food Security Trust Fund – Delta 1 Evaluation Report
Oxford Policy Management 115
The draft report should include a full analysis and tabulation of the questionnaires from the household survey with an assessment of the statistical significance of the results. The consultant will present the initial findings the evaluation at a workshop to be organised by LIFT in Yangon and will keep notes of the issues discussed at the workshop. The evaluation results shall be the intellectual property of UNOPS LIFT and shall not be used or communicated in any way without the prior permission of UNOPS LIFT. 2.1 Final evaluation report The draft evaluation report will be reviewed by LIFT and a final evaluation report will be submitted within 2 weeks of receiving LIFT comments and suggestions. The final evaluation report will incorporate these comments and suggestions plus important issues and recommendations arising from the workshop (discussed above).
VI. Activities: Activities will include but are not necessarily limited to the following tasks: Output 1: Evaluation inception report
• Review LIFT logframe and key indicators • Review general summary information on IP activities conducted in Delta I • Agree key issues to be investigated during the evaluation (in discussion with LIFT technical team) • Develop purposive sample of villages for detailed investigation (no more than 50 villages) to cover
the diversity of IP interventions and approaches for each of the key issues agreed (in consultation with LIFT)
• Develop a methodology and random sample of 100 villages for the purposes of the household survey of 800 households
• Collect all IP secondary information and data on the villages and beneficiaries supported by their projects in the selected villages, plus recent secondary data collected from all other relevant sources
• Develop a planned strategy and approach for each key issue including critical questions, associated indicators (mainly qualitative indicators but also simply collected quantitative indicators) and means of information collection
• Draft the question checklists for FGDs for each sub-group and for key informant interview, revise the village profile format to meet the needs of the evaluation survey, and develop a field observation forms as required (with input from the LIFT office)
• Design simple household questionnaire (with input from the LIFT office) • Translate the English draft of checklists, questionnaires etc into Myanmar language • Recruit and train survey FGD facilitators and interviewers/enumerators • Field test the FGD and key informant checklists, the village profile, questionnaires and field
observation forms (if used) and make revisions to tools and methods as required • Develop a detailed evaluation implementation plan and schedule for covering all villages, supervising
field teams and ensuring high quality completion of all necessary FGDs, key informant interviews, village profiles, questionnaires etc before leaving each village.
Output 2: Field work progress report
• Commence field work and supervision of field teams • Review progress against the evaluation implementation plan, and make revisions to the plan as
required • Raise any important issues or problems with LIFT and address them accordingly.
Output 3: Field work completion report
• Complete field work ensuring all issues are fully investigated according to the agreed strategy and approach using the tools and methods as planned.
• Draft the field work completion report and submit with all completed and documented FGDs, key informant interviews, village profiles, household questionnaires and field observation sheets (if used).

Livelihoods and Food Security Trust Fund – Delta 1 Evaluation Report
Oxford Policy Management 116
Output 4: Draft evaluation report
• Develop a database for the analysis of household surveys, enter data and analyse the information • Analyse the information from other approaches (FGDs, interviews, village profiles etc) • Triangulate the information from the various sources (including secondary information from LIFT and
the IPs concerned) and investigate any inconsistencies to the extent possible • Draft the first draft of the evaluation report to cover the topics and issues required • Prepare a presentation of initial findings and present at a workshop in Yangon to be arranged by
LIFT • Submit the draft evaluation report to LIFT along with all hard copies of questionnaires and field
observation sheets if used Output 5: Final evaluation report
• Incorporate all comments and recommendations received from LIFT and the Yangon workshop into the final report and submit to LIFT.
Survey Modules Three main modules are proposed: (a) a village module to cover village level assets and conditions (schools, health facilities, markets, groups etc) as well as the IP interventions that took place covering all selected villages (b) focus group discussions with different subgroups covering all selected villages (c) key informant interviews (including with IP representatives, village leaders, government representatives from related agencies, private sector representatives involved in relevant value chains, and independent experts) (d) household survey using a simple questionnaire, and possibly (e) observations of agricultural production.
A. Village Profiles These will be based on the existing village profile format developed by LIFT, but with suitable modification to improve relevance. The village profile should also include a summary of the IP interventions that took place in each village (this should be available from secondary sources) but should be validated at the village level. The final format will be developed in consultation with LIFT and field tested.
B. Focus group discussions It is estimated that FGDs will be required in up to 50 villages where IP interventions have taken place. The FGDs will involve discussions with sub-groups within the selected villages. The choice of sub-groups with whom to hold the FGDs will depend in part on the key issues to be investigated in the specific village selected. However, initial thoughts are that in each village separate FGDs could take place with:
• Beneficiaries/participants of each type of IP intervention that took place in each village (men and women separately)
• Non-beneficiaries including landless, female-headed households, poorest/most vulnerable (men and women separately).
For non-beneficiaries discussion will focus on targeting, gender equity, constraints to participation, and recommendations for appropriate livelihood and food security interventions in the future. The final checklists of questions to guide the FGDs for each type of sub-group will be developed in consultation with LIFT and field tested. Areas of enquiry will relate to the specific key issues to be investigated in each village.227 These may include, but may not be limited to:
• What interventions worked best to increase paddy production? What have been the relative costs and benefits on approaches to increase cropped area versus those focused on yield? There have been a range of interventions:
o Provision of inputs (fert, seeds, pesticides) by various means (cash grants, vouchers, direct supply)
227 Note that only some of these issues will be investigated in any one village.

Livelihoods and Food Security Trust Fund – Delta 1 Evaluation Report
Oxford Policy Management 117
o Provision of credit for farmers to purchase inputs, equipment, labor etc o Provision of tillage equipment or draught animals plus seeders, weeders, sprayers, threshers etc o Provision of training in new production technologies:
� Direct seeding using seeders � Appropriate use of organic and inorganic fertilizers � IPM � SRI variants � etc
o Repair of bunds o Irrigation infrastructure o How did these result in increased production – contribution from increase in area versus increase in
yields? • What interventions worked best to increase rice farmer income?
o Increase in production (quantity and/or quality) – and what are the economically optimal levels of fertilizer for smallholder production
o Rice banks – rice banks can have multiple objectives: to increase farm income selling when prices increase, to store seed securely for next sowing, for household food security, and/or to reduce post harvest storage losses (how did they perform under different IP approaches and objectives?)
o Post harvest processing (threshing, storage to reduce losses, and milling) o Market linkages (better prices) o Transport infrastructure (better prices)
• What worked best among the various income generation activities (IGA) promoted? (for landless households? For women? For men? For aged or disabled?). Financial viability and sustainability of each including:
o Livestock – chickens, ducks, pigs, goats o Fishery – wild capture and aquaculture (fish, crab and prawn farming) o Home gardens/horticulture o Integrated farming (using piggery and fish waste with horticulture) o Other rural enterprises supported (through training, inputs/equipment and/or loans)
• What vocational skills training resulted in the best benefits in terms of employment? What skills are being used? (increase in number of days men/women were able to find work? Increase in daily pay?). Have there been any unexpected impacts (such as migration out of the village)?
• What approaches worked best for provision of credit? o Supporting the reach of existing micro credit providers? o Establishing new village savings and loans groups? o Other approaches? o Assessed in terms of numbers of new loans provided, costs of administration, loan terms and
conditions, average loan size, loan use (consumption, emergencies, investment), level of arrears/default/successful repayment, sustainability after project support ended etc
• Assessment of the various different approaches to farmer extension: separating the assessment of the methodology from the assessment of the information extended (ie the extension methodology may be appropriate but the information may have been inappropriate for the farmers, or vice versa). How were participants/beneficiaries selected? Gender equity in approach? Analysis of gender roles in various agricultural activities considered in extension approach and information extended?
• Assessment of different approaches towards community based organizations (CBOs): VDCs, SHGs, FFS, various committees and boards etc
o Establish new groups? o Strengthen existing? o Issues of representation of women/landless/vulnerable/minorities o Most effective approaches to strengthening their capacity in planning/management/financial
management/M&E/social audits o Issues of transparency and accountability in decision-making and financial management o Collective ownership of assets – how worked, management arrangements, equity,
transparency/accountability, sustainability?
Livelihoods and Food Security Trust Fund – Delta 1 Evaluation Report
Oxford Policy Management 118
• Assessment of impacts of different interventions on the most poor and vulnerable in the community – what worked best for them? (including female headed households, people with disabilities, the aged, landless, households with high dependency ratios, etc)
o Support to rice producers that assumed they would hire more labor (Was this the case? Was it significant in terms of impact on livelihoods and food security for landless/poor/vulnerable?)
o IGA with and without credit targeted for the poor/vulnerable? o Skills training o CfW (not only benefits related to wages, but also the distribution of the benefits resulting from the
infrastructure that was created/repaired/improved) o Conditional cash grants etc
• What are the links between agricultural production and/or other livelihood support, and food security and nutrition? Which approaches were aimed specifically at food security? How did they compare in terms of results on household food security with more directly livelihood-oriented interventions?
• What is the likelihood that the benefits associated with each type of intervention can/will be sustained? What are the factors that promote/hinder sustainability of each? Were any of the social protection interventions “transformative” in any way (eg allowing the poor to make productive investments)?
• What has been the progress made by households towards recovering to pre-Nargis levels of production and livelihood/food security. What can be attributable to LIFT support, and what due to other reasons?
FGDs will take place in the language of the majority of residents in any village. FGDs will need to be carefully and accurately recorded (ideally using the words of the respondents and not re-interpreted), recording differences of opinion and different perspectives provided by the different participants. Thorough documentation of every FGD will be required as an annex to the evaluation report (translated accurately into English).
C. Key informant interviews Key informant interviews will cover much the same issues as the FGDs (see above). The list of key informants to interview will be developed as part of the evaluation approach in collaboration with LIFT. Different key informants will be selected for the different key issues to be investigated by the evaluation.
D. Household surveys These will involve a formal household interview using a questionnaire, no longer than 30 minutes in length (on average). The survey may like to consider a methodology to choose women as well as men as respondents – given that they will have different perspectives. Areas of enquiry may include, but may not be limited to:
1. Demography (including family size and ages, sex, occupation, educational status and attendance) 2. Assets/wealth, major source of income/livelihood, access to and ownership of land (by type of land) 3. Nature of support received from LIFT IPs (if any): significance of this support to livelihoods/food
security, sustainability of benefits 4. Participation and targeting: If participated/benefited how did this come about? If not participated, why
not? Constraints to participation. Targeting of the poorest and vulnerable. Participation and benefits to women.
5. Agricultural extension and training: Whether IP agric extension provided new information, was adopted, if adopted resulted in any change in production or income? (based on perception only) If not adopted why not?
6. Agricultural inputs and equipment: Use of agricultural inputs provided by IPs. Use of equipment etc (including power tillers and draught animals). Perception of impact on production (area, yield). Sustainability.
7. Enterprises and employment: Whether IP support enabled households to establish new enterprises, improve profitability of existing enterprises, find new or more employment.
8. Food security and nutrition: Perceptions of impact of IP support on household food security.
VII. Inputs:
Livelihoods and Food Security Trust Fund – Delta 1 Evaluation Report
Oxford Policy Management 119
While the consultant may propose the composition of the team to best undertake the consultancy in the time required, the following is an indication of the types of personnel deemed necessary.
• Social research specialist(s) - with appropriate technical qualifications and expertise • Survey coordinator or manager - with experience in overseeing large socio-economic surveys • Team leaders (there may be for example five team leaders to oversee five teams of four FGD facilitators
/interviewers) – these need to have experience with field surveys • Facilitators/interviewers – these ideally should be experienced in facilitating and documenting FGDs and
in conducting interviews with key informants or households. FGD facilitators will need to promote participation of all participants of the focus group, explore the diversity of responses within the group, and document the discussion thoroughly and objectively (as verbatim as possible and capturing the diversity of responses to each issue investigated).
• Database design/expert • Survey analysts to assist in documenting the evaluation • Editor of the draft and final reports
The consultant will need to provide for ground transport (eg van hire/4WDs) and cover running costs and drivers to move teams to the selected villages. Daily subsistence allowances should be provided to field staff to cover the cost of meals and accommodation etc. The costs of reporting, communications, printing questionnaires, clip boards and pencils etc will also need to be covered. All insurances will be the responsibility of the consultant. The consultant and consultant’s staff will be required to use their own computers and software, and cover the costs of disks and reports to be provided under this consultancy.
VIII. Timing: The consultancy is expected to commence in October 2011 with the field survey work completed by the end of November and the draft evaluation report completed by the end of December 2011. These estimated dates are dependent on the timely delivery of the necessary LIFT support for the design and implementation of the survey.
IX. Reporting: The following reports should be submitted electronically:
1. Evaluation inception report 2. Field work progress report 3. Field work completion report 4. Draft evaluation report 5. Final evaluation report

Livelihoods and Food Security Trust Fund – Delta 1 Evaluation Report
Oxford Policy Management 120
Annex B Development of the research tools and plan
The development of the research tools was directly based on three main inputs:
1. The key research questions linked to the evaluation matrix 2. The theory of change linked to each activity 3. Field testing of draft tools
B.1.1 Evaluation framework
During the inception phase an evaluation framework was developed. It linked the main research questions to the activities. It lists the activities of interest in rows and the evaluation criteria in columns. The most important evaluation criteria – impact on income, food security, sustainability as well as the impact on the poor and vulnerable – are shaded in darker red.228
When evaluating dimensions such as effectiveness and sustainability, we employ the definitions set out by the Development Assistance Committee (DAC), the ‘DAC-criteria’.229
The evaluation framework raises the question as to how the activities were supposed to have had an impact on income and food security. This was done through the development of theories of change, described below.
228 Which of the evaluation criteria where considered to be the most important ones, was decided in a meeting with the UNOPS Programme Team on 17 October 2011 229 see 3.1, p.11 for more detail

Livelihoods and Food Security Trust Fund – Delta 1 Evaluation Report
Oxford Policy Management 121
Figure B.1 Evaluation framework
230This evaluation dimension was not part of the original ToR but included at the suggestion of OPM, as it is considered relevant for the success of an activity.
Main target group of activity
Activity Area Activity Impact on incomes (main evaluation areas shaded in dark)
Impacts on food security
Sus-tainability
Specific impacts on rice farmers
Specific impacts on the poor and vulnerable
Targeting Social mobilisation
Accoun-tability230
Cost effectiveness
Rice farmers
Training through: - Farmer extension groups - Farmer field schools - Demonstration plots - Field days and fairs
Transplanting Which approaches were specifically designed to increase incomes for different socio-economic groups, and how? To what degree did different approaches increase incomes how and why? To what degree has income returned to pre- Nargis levels? What approaches to support employment and/ or income generation worked best?
How were approaches meant to increase food security? To what degree did different approaches increase food security? To what degree has food security returned to pre- Nargis levels?
Which approaches are more / less likely to be sustained in the future? What factors promote or hinder sustainability?
Which approaches were specifically targeted at rice farmers? Which activities did rice farmers perceive as most useful to increase their yields/ increase crop areas/ increase the value of their crops/ reduce costs and increase income? Which activities had most impact on rice farmers? How and why?
Which approaches were specifically targeted the poorest and most vulnerable and how were they designed to do so? Which activities did poor people perceive as most useful to increase or stabilise their income/ guarantee a livelihood? Which activities had most impact on the poorest and most vulnerable? How and why?
What groups and individuals were targeted by the interventions and approaches? Who received support?
What approaches were used to mobilise communities and beneficiaries?
What mechanisms were used to ensure transparency and accountability of IPs to both communities and beneficiaries?
Once the effectiveness of the various activities has been established: is there anything that can be said with respect to the costs relative to the effectiveness for those activities where both costs and effectiveness are available?
Seed treatment
Drum seeder use
Fertiliser use
Post harvest storage/marketing
Rice farmers
Input provision Through cash or vouchers
Seeds
Fertiliser
Tilling: buffaloes/power tiller
Post harvest equipment (bags, storage facilities, threshers)
Other farming equipment: drum seeders
Rice farmers
Increase in area Construction of bunds
Construction of embankments
Poor and vul-nerable
Business development training
Introduction of new products/businesses (vocational training)
Small business management and bookkeeping skills
Poor and vul-nerable
Livelihood inputs and training
Training for livestock extension workers/vets
Small livestock (ducks/pigs/goats)
Fishery inputs (boats, nets, etc)
Home gardening inputs
All Revolving fund In cash
In kind: seeds, buffaloes
In kind: small livestock (pigs, ducks, goats)
All Social protection Rice banks


Livelihoods and Food Security Trust Fund – Delta 1 Evaluation Report
Oxford Policy Management 123
B.1.2 Development of a theory of change
The analysis of LIFT’s impacts builds on a theory of change that recognises the various intermediate ‘steps’ through which the final goals of improving incomes and increasing food availability for households are achieved.
While the large variety of LIFT-funded activities and interventions make it difficult to trace the path through which short and longer term impacts are achieved for each and every activity, it was still important to map out a set of expected outcomes based on the overall LogFrame and on international experience.
In broad terms, for example, activities that were focused on rice farmers – and more specifically on training in agricultural techniques and provision of inputs – aimed at increasing yields, increasing crop area and increasing the value of sales through post-harvest management. These intermediate outcomes are in turn expected to lead to improved incomes and food security.
A separate theory of change was designed for each of the key LIFT areas of intervention, and shared in the Inception Report. Figure B.2 illustratesan example theory of change for agricultural production. It shows theexpected effects of the various activities. The activities are shown in the top half. The different colours in the bottom half indicate the schematised order in which the various effects take place. Note that the two key effects – impact on incomes and food security – are shown in dark red.
When developing the focus group guidelines and the quantitative questionnaire, the theory of change for each key activity was outlined and used as a guide for the development of relevant questions. Importantly, these were also used during the training of fieldworkers to make sure they are aware of which issues it will be most important to probe on.
Figure B.2 Theory of change for agricultural produc tion
Agricultural production
Inputs
Indirect
Cash/vouchers for inputs
Direct
Seeds, fertiliser, tilling, post harvest
equipment, seed storage facilities, other
farming equipment
Training
Farmer extension groups Farmer field schools
On farm paddy trials
Demonstration plots Field days and fairs
Increased food availability Increased food security
Knowledge sharing
Increase paddy yield Increase crop area
Help store yield
Increase value of sales
Increased income
Post harvest management
Increased expenditureAccess to credit
Savings/less debt ings
InvestmentLonger term effects on schooling and health
Increase demand labour
Better technology
Agricultural production
Food intake, dietary diversity
For every activity area.. theory of change
designed and linked to the evaluation framework

Livelihoods and Food Security Trust Fund – Delta 1 Evaluation Report
Oxford Policy Management 124
B.2 Methods adopted
One of the key characteristics of the study was the adoption of a mixed methods approach, with particular importance given to the qualitative evaluation.
B.2.1 Qualitative research
B.2.1.1 Tools The two main methods adopted for the qualitative fieldwork were focus group discussions and semi-structured key informant interviews. Given the wide range of activities to be tested and the fact that there were two main target groups – rice farmers and poor and vulnerable people – the following key informant interview and focus group guides were developed:
• Key informant interview guide for CBO representative/village committee representative
• Key informant interview guide for local implementing partner
• Key informant interview official community leader
• Focus group guide for male rice farmers
• Focus group guide for female rice farmers
• Focus group guide for poor and vulnerable -males
• Focus group guide for poor and vulnerable - females
The focus group guides (which were shared in the Inception Report) contained modules focusedon each of the relevant LIFT activities. They also contained sections which probed more specifically on changes over time in income levels and food security, using participatory mapping tools.
Additional key informant interviews were conducted where relevant with community members who had a particularly important viewpoint. This included, for example, trained para-vets (livestock extension workers), agricultural extension workers, etc.
B.2.1.2 Field testing of draft tools Field testing was conducted by OPM, MSR and LIFT staff in order to assess how group discussions were being facilitated in terms of style; whether the type of FGD and question guides used were appropriate and how they could be adapted and improved; and the capacity of potential MSR team members.
The key issues that came up during both the first observation and the second testing visits included:
• The relevance of the various questions to the different types of respondent groups (male/female, landless/farmers, etc)
• The importance of defining the exact functioning and local understanding of the various activities undertaken by LIFT IPs in the village before starting the focus groups (through KIIS with IPs, etc)
• Problems with the wording of certain questions and exercises
• Need to shorten the length of the instruments and formalise a modular approach
• Approaches to note-taking and recording of discussion, including ways in which participants are identified during the discussion (e.g. numbered badges)
• Issues to be covered during training

Livelihoods and Food Security Trust Fund – Delta 1 Evaluation Report
Oxford Policy Management 125
Findings from the field testing were incorporated into the development of revised FGD guidelines, KII guidelines (and a new version of the quantitative questionnaire)e. These versions were commented by the LIFT team and finalised for translation, with a final version of comments and changes made at the training stage.
B.2.1.3 Selection of research areas and villages fo r the qualitative research In each of the 16 villages visited for the qualitative research, four focus group discussions and various key informant interviews were conducted. The focus groups were selected in relation to the topics of interest for which the village was selected.
For the qualitative research purposive sampling was used to identify villages based on a number of criteria, including the types of projects and approaches implemented in the village, range of IPs, perceived success of projects and approaches implemented. The village selection for the qualitative work went through an interactive process of determining the main themes of interest for the research, and then using a combination of methods to select 16 villages. The methods included:
• database information;
• dialogue with the UNOPS programme Team;
• dialogue with the IPs.
UNOPS was in the possession of three databases that contained specific information on a village level with respect to trainings conducted, inputs provided and community mobilisation carried out. The three databases contained 15,158 activities across 1,101 villages (counting each different MIMU code as a separate village). While there were some concerns that the database may not represent a complete picture of activities, the databases nevertheless provided an excellent starting point for identifying villages in which certain activities of interest had taken place.
In addition, the UNOPS programme team had visited more than 100 villages and suggested several on the basis of that experience. These were then compared against the database and a list of 13 villages was made, which also contained the main activities of interest per village. Feedback from the IPs was sought, with a particular focus on finding villages that could serve as successful example of an approach. Several IPs suggested alternatives, sometimes they would serve as better examples of an activity, and sometimes for logistical reasons.
On the basis of these information, ‘village packages’ were constructed, that contained all the activities per village, the main reasons for selecting the village, the main themes for the focus groups, the focus groups of interest, as well as additional information on the village (number of households, MIMU code, IP, etc.).
B.2.1.4 Sampling of respondents for qualitative res earch For the qualitative component of the research, sampling of respondents was done through snowball sampling, taking advantage of the social networks within villages. Enumerators contacted the village authorities a few days before fieldwork asking to speak to one or two representatives of each interest group for the study. These representatives were then asked to recruit others among their peers who were able to give some time for focus group discussions.
B.2.2 Quantitative research
B.2.2.1 Tools In addition to the qualitative research, a quantitative survey was carried out among 800 households in 100 villages. The interview consisted of two parts:

Livelihoods and Food Security Trust Fund – Delta 1 Evaluation Report
Oxford Policy Management 126
• An initial key informant interview aimed at mapping LIFT activities in that village
• Household interviews
A particular challenge was that it was not known beforehand which activities had taken place in each of the 100 villages nor by which name the villagers would refer to them or the provider of the activities. Apart from villages where the main IPs (UNDP, World Vision and UN-Habit) directly intervened, residents did not know the main IPs. They only knew the sub-IPs and their activities. Moreover, the interventions had often been part of a wider set of interventions and had already been completed prior to the survey. Hence, it was, first of all, necessary to determine which activities were performed and under which name. For this purpose, a key informant interview was carried out in each of the 100 villages. This established the name of the relevant sub-IP and the relevant activities. These were then included and referred to in the household interview. This implied that an element of uncertainty was introduced into the quantitative survey. This posed additional challenges for fieldwork, which MSR mastered well.
B.2.2.2 Sampling For the quantitative survey, villages were selected randomly, using a two stage sampling procedure. Villages were sampled from a village list of 1,142 villages, proportionate to their size. Where household or population information was missing, this was replaced by an average. If either household size or population was known, this information was used to derive the missing value. If both information were missing, the average across all villages was used.
Villages with more than 700 households were considered too large, as there may be the risk that out of the 8 household interviews no one may know about the LIFT activities. They were excluded from the sample, and replaced by smaller villages. In addition, MSR was given a list of replacement villages, which usually consisted of the next village in the village list.
Within each village, the sampling of households was done randomly, using lists obtained by fieldwork teams at the village.231
B.2.2.3 Weights Given that the same number of households was chosen in each village, the resulting sample is self-weighting. This is illustrated by Figure B.3 below. It illustrates the two stages of the sampling procedure. In the first stage, clusters (in our case villages) are selected with a probability proportionate to their size (PPS). In a second step, the same number of households per cluster are selected randomly (in this figure, 5 households are selected, in our study 8 households had been selected). The probability of a household being selected is the likelihood of being selected at the first stage (e.g. 4*100/10,000) multiplied by the probability of being selected at the second stage (e.g. 5/100). In the example below, the resulting selection probability of a household is always 0.002, independent of the size of the initial cluster.
231 These lists were by all accounts fit for purpose, as Myanmar at the time of fieldwork was still a country where control of population movements was considered a priority (e.g. foreigners needed to obtain special permits to visit villages, and locals needed , at least in theory, tell the authorities if they spent the night outside their house).

Livelihoods and Food Security Trust Fund – Delta 1 Evaluation Report
Oxford Policy Management 127
Figure B.3 Self weighted sample 232
The inverse of the selection probability is the weight. Hence, the weight is the same for each selected household.233
B.3 Fieldwork overview
Overall, the qualitative and quantitative fieldwork was carried out smoothly, within the planned timeframe. The main impediment faced by fieldworkers was that harvesting started slightly earlier than expected, meaning there were sometimes difficulties recruiting respondents for focus groups. For focus groups with poor and vulnerable fishermen, similarly, some problems were faced during recruitment. Despite these problems, fieldworkers were extremely flexible.
The qualitative research started on 5 November 2011 following 3 days of training in Yangon. The focus groups were completed on November 23, 2011. As stated above, 16 villages were visited with 4 focus groups conducted in each village and several key informant interviews were conducted as well. 64 FGDs were completed.
The qualitative research was conducted by three teams, each comprising of three members—the leader and two members. The roles of the moderator, the facilitator and the note-taker were rotated among the three members.
232Source: Frerichs, R.R. Rapid Surveys (unpublished), 2004 233 With respect to our study, we need to make two assumptions. First, the figure above implies that both the first and second sampling stage use the same unit of selection, in this case the household. However, in our study the villages were selected on the basis of the population size, rather than number of households per village. At the same time it seems fair to assume that the difference between the two for the purposes of weights is marginal. In fact, the correlation between the population size and number of households is as high as 0.91. A second implicit assumption is that the relative village size in the list used for sampling is sufficiently close to the (relative) village size encountered at the time when the second stage sampling was carried out. The second stage sampling was done during fieldwork, once household lists had been obtained by the fieldwork teams from the village authorities. It is likely that the village authorities also provided the information that underpinned the list of villages used in the first sampling stage (though maybe from a different date). Hence, it seems fair to assume that the relative village size used in the first sampling stage is similar to the one encountered in the second sampling stage. In terms of precision of the information provide by the village authorities, it should be kept in mind that the authorities in Myanmar still ask their citizens to report to authorities whenever they stay a night outside their normal residence. While this rule has not been enforced anymore, it is plausible to assume that the households lists are accurate.
Livelihoods and Food Security Trust Fund – Delta 1 Evaluation Report
Oxford Policy Management 128
The quantitative household interview field work started on November 21, 2011, and was completed on December 3, 2011, taking 13 days in total. Altogether 21interviewers, of whom 6 were supervisors, were employed for the household survey. Six teams were deployed for 100 villages in 8 townships (sample: 800).
A detailed Fieldwork Report has been submitted separately and is available from the authors.
B.4 Analysis
The analysis phase for the qualitative data started in early December, when MSR received the data from the field and started the transcription process. In coordination with OPM, an initial stage of analysis and quality check was then conducted by MSR, focusing on coding and thematically sorting the data on a purposely designed Excel matrix (which can be shared with LIFT upon demand). Once this iterative process was completed, OPM staff started exploring the full richness of the quantitative and qualitative data, integrating and triangulating data of different kinds from different sources, and examining inconsistencies in the data, with on-going input from the MSR research specialist. This process fed into the write-up of this final report.
On 1 and 2 February 2011 workshops were conducted in Yangon with the LIFT programme team and IPs to share and discuss preliminary findings, which in turn informed the subsequent analysis.
B.5 Additional information on selection of villages
The table below shows the criteria for selecting the 16 villages. For each village the activities are highlighted that were conducted in that village (denoted with a green shaded ‘1’). The table allows to see whether all activities have been covered across the selected villages. It also determined the distribution of focus groups across the villages, ensuring that key themes per village would be covered. For example, if there was only one village where a certain activity happened (among the 16) then field team needed to pay particular attention to that.
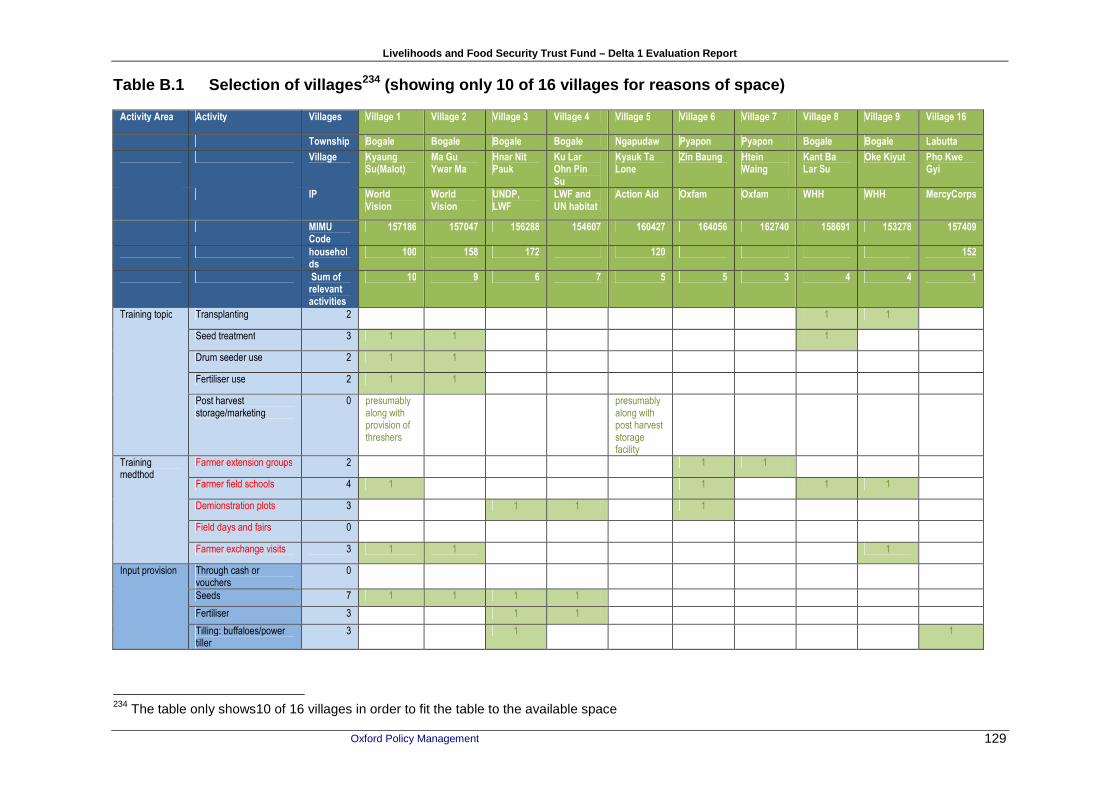
Livelihoods and Food Security Trust Fund – Delta 1 Evaluation Report
Oxford Policy Management 129
Table B.1 Selection of villages 234 (showing only 10 of 16 villages for reasons of spa ce)
Activity Area Activity Villages Village 1 Village 2 Village 3 Village 4 Village 5 Village 6 Village 7 Village 8 Village 9 Village 16
Township Bogale Bogale Bogale Bogale Ngapudaw Pyapon Pyapon Bogale Bogale Labutta
Village Kyaung Su(Malot)
Ma Gu Ywar Ma
Hnar Nit Pauk
Ku Lar Ohn Pin Su
Kyauk Ta Lone
Zin Baung Htein Waing
Kant Ba Lar Su
Oke Kiyut Pho Kwe Gyi
IP World Vision
World Vision
UNDP, LWF
LWF and UN habitat
Action Aid Oxfam Oxfam WHH WHH MercyCorps
MIMU Code
157186 157047 156288 154607 160427 164056 162740 158691 153278 157409
households
100 158 172 120 152
Sum of relevant activities
10 9 6 7 5 5 3 4 4 1
Training topic Transplanting 2 1 1
Seed treatment 3 1 1 1
Drum seeder use 2 1 1
Fertiliser use 2 1 1
Post harvest storage/marketing
0 presumably along with provision of threshers
presumably along with post harvest storage facility
Training medthod
Farmer extension groups 2 1 1
Farmer field schools 4 1 1 1 1
Demionstration plots 3 1 1 1
Field days and fairs 0
Farmer exchange visits 3 1 1 1
Input provision Through cash or vouchers
0
Seeds 7 1 1 1 1
Fertiliser 3 1 1
Tilling: buffaloes/power tiller
3 1 1
234 The table only shows10 of 16 villages in order to fit the table to the available space

Livelihoods and Food Security Trust Fund – Delta 1 Evaluation Report
Oxford Policy Management 130
Activity Area Activity Villages Village 1 Village 2 Village 3 Village 4 Village 5 Village 6 Village 7 Village 8 Village 9 Village 16
Township Bogale Bogale Bogale Bogale Ngapudaw Pyapon Pyapon Bogale Bogale Labutta
Village Kyaung Su(Malot)
Ma Gu Ywar Ma
Hnar Nit Pauk
Ku Lar Ohn Pin Su
Kyauk Ta Lone
Zin Baung Htein Waing
Kant Ba Lar Su
Oke Kiyut Pho Kwe Gyi
Post harvest equipment (bags, storage facilities, threshers)
3 1 1 1
Other farming equipment: drum seeders
2 1 1
Increase in area
Construction of dykes 2 1
Business development training
Introduction of new products/businesses (vocational training)
3 1 1 1
Small business management and bookkeeping skills
1 1
Livelihood inputs and training
Training for livestock extension workers/vets
3 1 1 1
Small livestock (ducks/pigs/goats)
4 1 1 1 1
Fishery inputs (boats, nets, etc)
2 1
Home gardening inputs 0
Revolving fund informatiuon on precise type n/a, but revolving fund activity
8 1 1 1 1 1 1
In cash 1
In kind: seeds, buffaloes 0
In kind: small livestock (pigs, ducks, goats)
0
Social protection
Rice banks 1 1
Livelihoods and Food Security Trust Fund – Delta 1 Evaluation Report
Oxford Policy Management 131
Annex C Principles of accountability within humanit arian response
In the mid-1990s, accountability to disaster-affected populations and the recipients of aid, rather than just donors, started to be recognised as an important element within humanitarian responses, particularly bynon-governmental organisations and UN agencies. As a result, a number of initiatives started to formalise principles of transparency and accountability (amongst others) within guidelines and standards.
The Sphere Project, for instance, developed a set of universal minimum standards in core areas of humanitarian response. The Sphere Handbook aims to improve the quality of humanitarian response and enhance the accountability of the humanitarian system to disaster-affected people, and presents the Humanitarian Charter and Minimum Standards in Humanitarian Response. The Humanitarian Charter includes an emphasis on the importance of agency accountability to affected communities, and the Core Standards and minimum standards articulate what these principles and obligations mean in practice (SPHERE, 2011). The last sentence of the Humanitarian Charter expressly states that “We acknowledge that our fundamental accountability must be to those we seek to assist.” (SPHERE,2011 p24). The Core Standards also include that people have the right to complain to an agency and seek a corresponding response. Formal mechanisms for complaints and redress are an essential component of an agency’s accountability and help populations to re-establish control over their lives (SPHERE, 2011).
Whilst the Sphere Handbook is a voluntary code and a self-regulatory tool for quality and accountability, and the Sphere Project does not operate any compliance mechanism, the Humanitarian Accountability Partnership – International (HAP) Standard in Humanitarian Accountability and Quality Management is now used by agencies to assess accountability and quality management in their operations including, in contrast to the SPHERE Project, through certification. Certification is achieved through a process of independent verification against industry recognised standards and helps agencies achieve and demonstrate their commitment to accountability and quality management (see HAP-I website:http://www.hapinternational.org).
Key principles within all these guidelines and charters address issues such as the participation of affected communities and people in the development of responses, transparency to beneficiaries and wider affected populations and the establishment of complaint and response mechanisms.
Despite accountability to disaster victims and response beneficiaries being a key element of any humanitarian response as outlined above, and a factor that can contribute to increased appropriateness and effectiveness, at the level of the LIFT fund overall there appears to be little substantive application or guidance from the FMO to IPs or wider stakeholders.
When referring to capacity development of local NGOs, for instance, the LIFT 2010 Annual Report states that “Many of the partners applied the concepts of accountability, transparency and participation in project implementation” (LIFT, 2010) but does not provide further details. However, the report also emphasised that internal lessons learned in 2010 included the need, highlighted by the Fund Board, to develop and communicate LIFT policy papers on a number of areas, including beneficiary accountability (LIFT, 2010 p.51).
Although the LIFT 2010 report states this, the LIFT Operational Guidelines of December 2011 also state that the FMO will establish a beneficiary accountability framework to strengthen the role of beneficiary communities in programme planning, designing, implementing, monitoring and evaluation of LIFT (LIFT, 2011).

Livelihoods and Food Security Trust Fund – Delta 1 Evaluation Report
Oxford Policy Management 132
“Beneficiary accountability is a mechanism by which the Fund (FB, FMO and IPs) are held accountable to the communities they serve. The beneficiary accountability framework will facilitate transparency, participation, feedback and learning with communities. A feedback mechanism for beneficiaries will be established and reported on.” (LIFT, 2011).
This implies that although recognised as an issue since relatively early on, guidance on and implementation of fund level accountability policies, frameworks and strategies have still not been fully achieved.
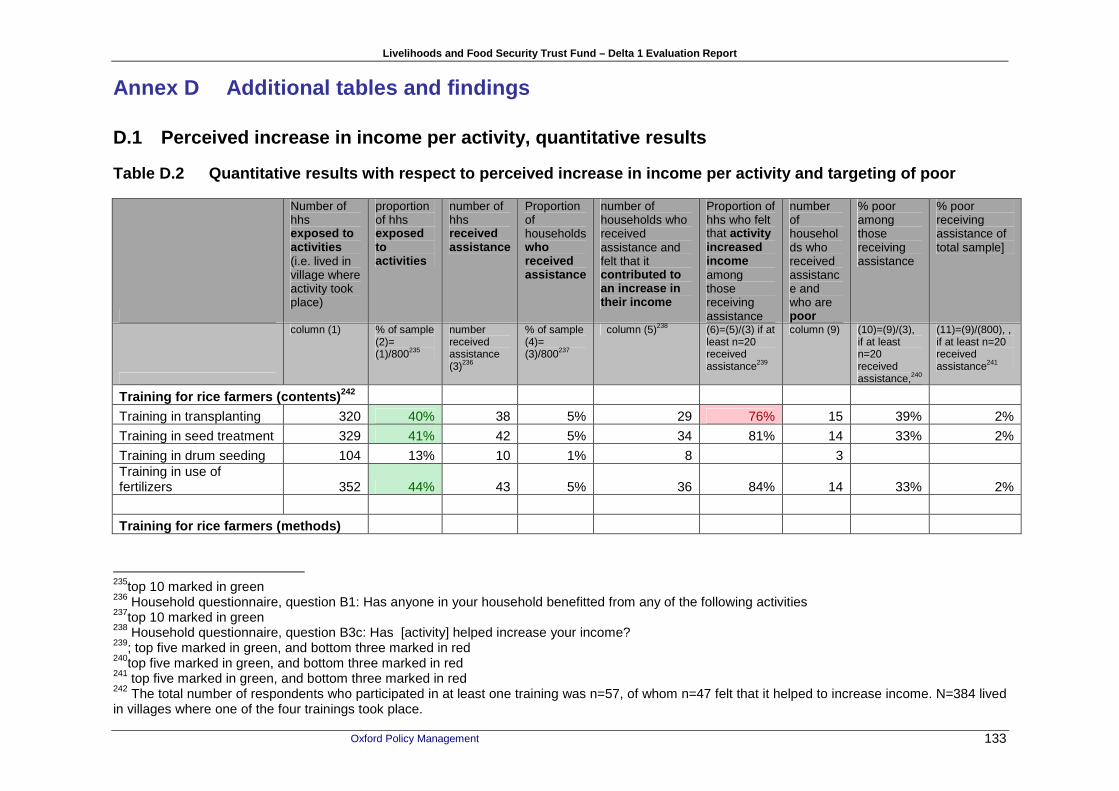
Livelihoods and Food Security Trust Fund – Delta 1 Evaluation Report
Oxford Policy Management 133
Annex D Additional tables and findings
D.1 Perceived increase in income per activity, quan titative results
Table D.2 Quantitative results with respect to perc eived increase in income per activity and targeting of poor
Number of hhs exposed to activities (i.e. lived in village where activity took place)
proportion of hhs exposed to activities
number of hhs received assistance
Proportion of households who received assistance
number of households who received assistance and felt that it contributed to an increase in their income
Proportion of hhs who felt that activity increased income among those receiving assistance
number of households who received assistance and who are poor
% poor among those receiving assistance
% poor receiving assistance of total sample]
column (1) % of sample (2)= (1)/800235
number received assistance (3)236
% of sample (4)= (3)/800237
column (5)238 (6)=(5)/(3) if at least n=20 received assistance239
column (9) (10)=(9)/(3), if at least n=20 received assistance,240
(11)=(9)/(800), , if at least n=20 received assistance241
Training for rice farmers (contents) 242
Training in transplanting 320 40% 38 5% 29 76% 15 39% 2%
Training in seed treatment 329 41% 42 5% 34 81% 14 33% 2%
Training in drum seeding 104 13% 10 1% 8 3 Training in use of fertilizers 352 44% 43 5% 36 84% 14 33% 2%
Training for rice farmers (methods)
235top 10 marked in green 236 Household questionnaire, question B1: Has anyone in your household benefitted from any of the following activities 237top 10 marked in green 238 Household questionnaire, question B3c: Has [activity] helped increase your income? 239; top five marked in green, and bottom three marked in red 240top five marked in green, and bottom three marked in red 241 top five marked in green, and bottom three marked in red 242 The total number of respondents who participated in at least one training was n=57, of whom n=47 felt that it helped to increase income. N=384 lived in villages where one of the four trainings took place.

Livelihoods and Food Security Trust Fund – Delta 1 Evaluation Report
Oxford Policy Management 134
Number of hhs exposed to activities (i.e. lived in village where activity took place)
proportion of hhs exposed to activities
number of hhs received assistance
Proportion of households who received assistance
number of households who received assistance and felt that it contributed to an increase in their income
Proportion of hhs who felt that activity increased income among those receiving assistance
number of households who received assistance and who are poor
% poor among those receiving assistance
% poor receiving assistance of total sample]
column (1) % of sample (2)= (1)/800235
number received assistance (3)236
% of sample (4)= (3)/800237
column (5)238 (6)=(5)/(3) if at least n=20 received assistance239
column (9) (10)=(9)/(3), if at least n=20 received assistance,240
(11)=(9)/(800), , if at least n=20 received assistance241
Demonstration plots/on field trials 200 25% 19 2% 19 3 Farmer extension groups/ Farmer exchange visits 192 24% 24 3% 22 92% 7 29% 1%
Training for poor and vulnerable Training in livestock production 440 55% 56 7% 45 80% 33 59% 4%
Training in fisheries 144 18% 9 1% 7 6 Training in any other vocational skill (e.g. carpentry, shampoo making, tailoring, knitting) 240 30% 12 2% 9 6 Training in small business management/bookkeeping 296 37% 26 3% 22 85% 8 31% 1%
Other training 16 2% 2 0% 2 1
Provision of inputs and means of input provision ma inly for farmers
Provision of seeds 232 29% 48 6% 41 85% 13 27% 2%
Provision of fertilizer 152 19% 19 2% 17 4 Provision of draught animals (buffaloes) 136 17% 15 2% 14 7
Provision of power tillers 184 23% 22 3% 19 86% 6 27% 1% Post harvest equipment (e.g. threshers, storage facilities, bags) 199 25% 28 4% 24 86% 5 18% 1%

Livelihoods and Food Security Trust Fund – Delta 1 Evaluation Report
Oxford Policy Management 135
Number of hhs exposed to activities (i.e. lived in village where activity took place)
proportion of hhs exposed to activities
number of hhs received assistance
Proportion of households who received assistance
number of households who received assistance and felt that it contributed to an increase in their income
Proportion of hhs who felt that activity increased income among those receiving assistance
number of households who received assistance and who are poor
% poor among those receiving assistance
% poor receiving assistance of total sample]
column (1) % of sample (2)= (1)/800235
number received assistance (3)236
% of sample (4)= (3)/800237
column (5)238 (6)=(5)/(3) if at least n=20 received assistance239
column (9) (10)=(9)/(3), if at least n=20 received assistance,240
(11)=(9)/(800), , if at least n=20 received assistance241
Provision of drum seeders 87 11% 11 1% 9 3 Provision of other agricultural inputs,or equipment such as_(backpack sprayers, hand tools 208 26% 24 3% 21 88% 7 29% 1%
Revolving Fund for seeds 104 13% 17 2% 16 4 Revolving Fund for buffaloes 56 7% 3 0% 3 2
Cash to buy inputs 168 21% 73 9% 69 95% 41 56% 5%
Vouchers to buy inputs 8 1% 0 0% 0 0
Provision of inputs and means of input provision fo r poor Provision of small livestock (pigs/ducks/goats) 280 35% 52 7% 40 77% 35 67% 4%
Revolving Fund for cash 217 27% 87 11% 84 97% 38 44% 5% Revolving Fund for livestock 176 22% 44 6% 36 82% 29 66% 4%
Other revolving fund 8 1% 1 0% 1 1
Inputs to start up business 80 10% 11 1% 10 7
Inputs for fisheries 277 35% 54 7% 48 89% 41 76% 5%
Cash for Work
Cash for Work (various activities combined) 336 42% 169 21% 159 94% 98 58% 12%

Livelihoods and Food Security Trust Fund – Delta 1 Evaluation Report
Oxford Policy Management 136
Number of hhs exposed to activities (i.e. lived in village where activity took place)
proportion of hhs exposed to activities
number of hhs received assistance
Proportion of households who received assistance
number of households who received assistance and felt that it contributed to an increase in their income
Proportion of hhs who felt that activity increased income among those receiving assistance
number of households who received assistance and who are poor
% poor among those receiving assistance
% poor receiving assistance of total sample]
column (1) % of sample (2)= (1)/800235
number received assistance (3)236
% of sample (4)= (3)/800237
column (5)238 (6)=(5)/(3) if at least n=20 received assistance239
column (9) (10)=(9)/(3), if at least n=20 received assistance,240
(11)=(9)/(800), , if at least n=20 received assistance241
Construct/improve village footpaths 200 25% 114 14% 103 90% 64 56% 8%
Construct/improve roads 104 13% 58 7% 49 84% 34 59% 4%
Construct/improve jetties 32 4% 12 2% 12 6
Construct/improve bridges 96 12% 21 3% 21 100% 12 57% 2%
Repair/construct culverts 16 2% 7 1% 7 3 Renovation of drinking water ponds 72 9% 28 4% 28 100% 13 46% 2% Construction of aquaculture ponds 8 1% 4 1% 4 3 Construct/improve embankments 24 3% 15 2% 15 8 Construction/renovation of irrigation channels 24 3% 8 1% 8 4
Establishment of nurseries 8 1% 5 1% 5 4
Planting wind break trees 16 2% 9 1% 9 8 Grass and bush cutting which had been a refuge for rats 8 1% 3 0% 3 3 Establishment of demonstration plots 8 1% 1 0% 0 1
Reading example: training in livestock production was the activity that was implemented most widely (columns 1 and 2). 55% of households lived in villages were it happened. However, most of these did not participate in the training (only n=56 or 7% of all households did). The single activities wheremost households participated (columns 3 and 4) were the construction/improvement of village paths (14%) and the Revolving fund for cash (11%). Some activities were felt to contribute to an increase in income particularly well (see
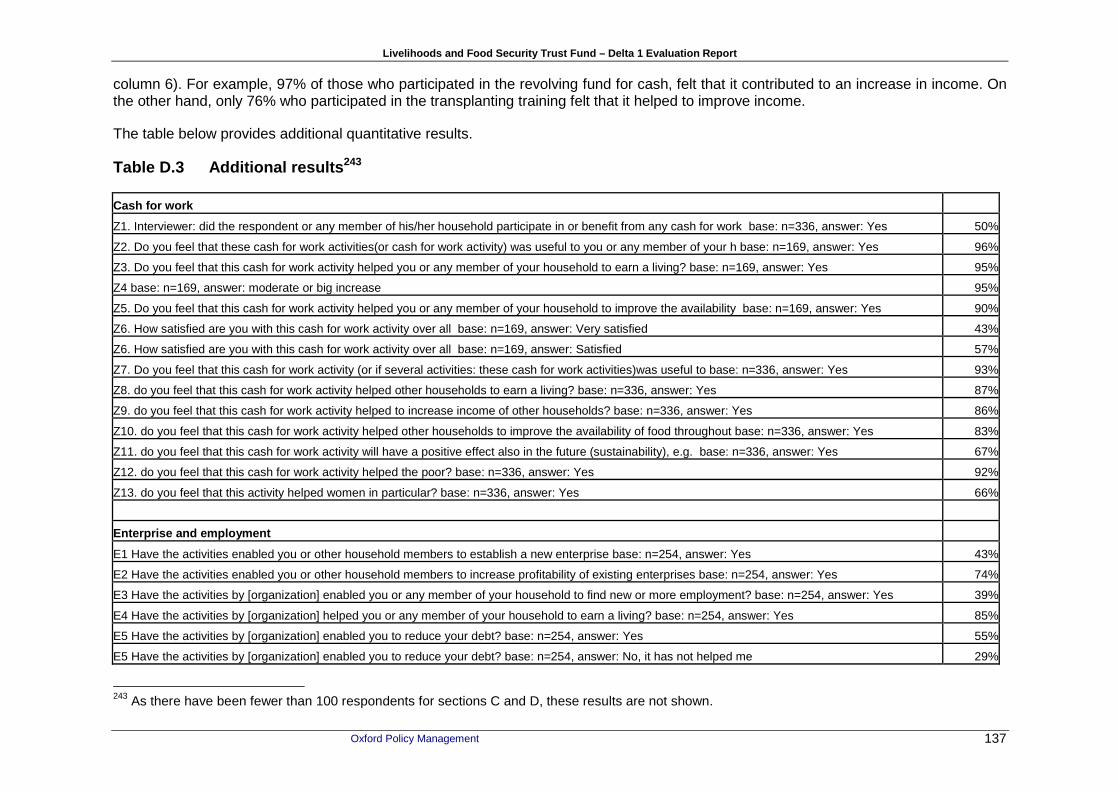
Livelihoods and Food Security Trust Fund – Delta 1 Evaluation Report
Oxford Policy Management 137
column 6). For example, 97% of those who participated in the revolving fund for cash, felt that it contributed to an increase in income. On the other hand, only 76% who participated in the transplanting training felt that it helped to improve income.
The table below provides additional quantitative results.
Table D.3 Additional results 243
Cash for work
Z1. Interviewer: did the respondent or any member of his/her household participate in or benefit from any cash for work base: n=336, answer: Yes 50%
Z2. Do you feel that these cash for work activities(or cash for work activity) was useful to you or any member of your h base: n=169, answer: Yes 96%
Z3. Do you feel that this cash for work activity helped you or any member of your household to earn a living? base: n=169, answer: Yes 95%
Z4 base: n=169, answer: moderate or big increase 95%
Z5. Do you feel that this cash for work activity helped you or any member of your household to improve the availability base: n=169, answer: Yes 90%
Z6. How satisfied are you with this cash for work activity over all base: n=169, answer: Very satisfied 43%
Z6. How satisfied are you with this cash for work activity over all base: n=169, answer: Satisfied 57%
Z7. Do you feel that this cash for work activity (or if several activities: these cash for work activities)was useful to base: n=336, answer: Yes 93%
Z8. do you feel that this cash for work activity helped other households to earn a living? base: n=336, answer: Yes 87%
Z9. do you feel that this cash for work activity helped to increase income of other households? base: n=336, answer: Yes 86%
Z10. do you feel that this cash for work activity helped other households to improve the availability of food throughout base: n=336, answer: Yes 83%
Z11. do you feel that this cash for work activity will have a positive effect also in the future (sustainability), e.g. base: n=336, answer: Yes 67%
Z12. do you feel that this cash for work activity helped the poor? base: n=336, answer: Yes 92%
Z13. do you feel that this activity helped women in particular? base: n=336, answer: Yes 66%
Enterprise and employment
E1 Have the activities enabled you or other household members to establish a new enterprise base: n=254, answer: Yes 43%
E2 Have the activities enabled you or other household members to increase profitability of existing enterprises base: n=254, answer: Yes 74%
E3 Have the activities by [organization] enabled you or any member of your household to find new or more employment? base: n=254, answer: Yes 39%
E4 Have the activities by [organization] helped you or any member of your household to earn a living? base: n=254, answer: Yes 85%
E5 Have the activities by [organization] enabled you to reduce your debt? base: n=254, answer: Yes 55%
E5 Have the activities by [organization] enabled you to reduce your debt? base: n=254, answer: No, it has not helped me 29%
243 As there have been fewer than 100 respondents for sections C and D, these results are not shown.
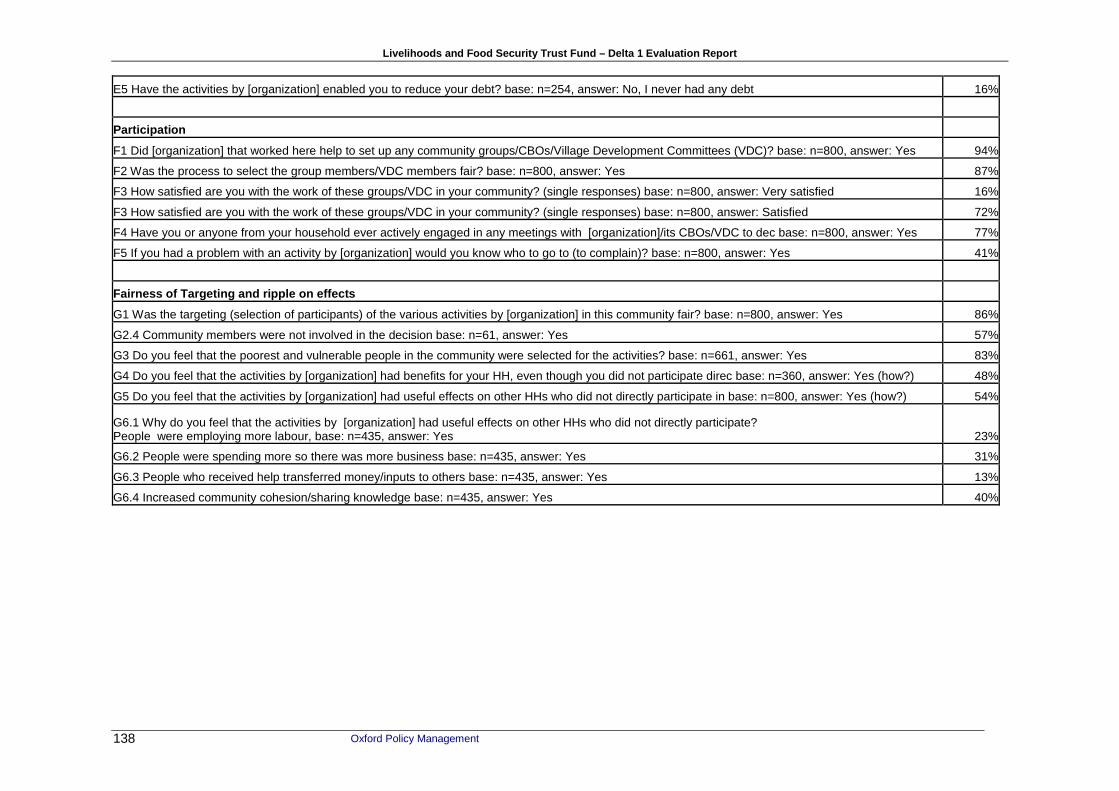
Livelihoods and Food Security Trust Fund – Delta 1 Evaluation Report
Oxford Policy Management 138
E5 Have the activities by [organization] enabled you to reduce your debt? base: n=254, answer: No, I never had any debt 16%
Participation
F1 Did [organization] that worked here help to set up any community groups/CBOs/Village Development Committees (VDC)? base: n=800, answer: Yes 94%
F2 Was the process to select the group members/VDC members fair? base: n=800, answer: Yes 87%
F3 How satisfied are you with the work of these groups/VDC in your community? (single responses) base: n=800, answer: Very satisfied 16%
F3 How satisfied are you with the work of these groups/VDC in your community? (single responses) base: n=800, answer: Satisfied 72%
F4 Have you or anyone from your household ever actively engaged in any meetings with [organization]/its CBOs/VDC to dec base: n=800, answer: Yes 77%
F5 If you had a problem with an activity by [organization] would you know who to go to (to complain)? base: n=800, answer: Yes 41%
Fairness of Targeting and ripple on effects
G1 Was the targeting (selection of participants) of the various activities by [organization] in this community fair? base: n=800, answer: Yes 86%
G2.4 Community members were not involved in the decision base: n=61, answer: Yes 57%
G3 Do you feel that the poorest and vulnerable people in the community were selected for the activities? base: n=661, answer: Yes 83%
G4 Do you feel that the activities by [organization] had benefits for your HH, even though you did not participate direc base: n=360, answer: Yes (how?) 48%
G5 Do you feel that the activities by [organization] had useful effects on other HHs who did not directly participate in base: n=800, answer: Yes (how?) 54%
G6.1 Why do you feel that the activities by [organization] had useful effects on other HHs who did not directly participate? People were employing more labour, base: n=435, answer: Yes 23%
G6.2 People were spending more so there was more business base: n=435, answer: Yes 31%
G6.3 People who received help transferred money/inputs to others base: n=435, answer: Yes 13%
G6.4 Increased community cohesion/sharing knowledge base: n=435, answer: Yes 40%