Embed Size (px)
Citation preview

Delta State Government
FISCAL STRATEGY PAPER (FSP) 2018 - 2020
(Economic and Fiscal Update (EFU), Fiscal Framework andBudget Policy Statement (BPS))
August, 2017

Fiscal Strategy Paper (FSP) 2018-2020 – Delta State Government
ii
Document Control
Document Version Number: EFU-FSP-BPS Delta State 2018 - 2020 v1
Document Prepared By: Delta State Ministry of Economic Planning
Document Approved By:
Date of Approval:
Date of Publication:
Distribution List:

Fiscal Strategy Paper (FSP) 2018-2020 – Delta State Government
iii
Table of Contents
Section 1 Introduction and Background .......................................................................... 11.A Introduction....................................................................................................... 1
1.B Background........................................................................................................ 3Section 2 Economic and Fiscal Update ............................................................................ 6
2.A Economic Overview ............................................................................................ 6
2.B Fiscal Update ................................................................................................... 15Section 3 Fiscal Framework.......................................................................................... 26
3.A Macroeconomic Framework............................................................................... 263.B Fiscal Framework and Assumptions ................................................................... 26
3.C Indicative Three Year Fiscal Framework............................................................. 273.D Fiscal Risks ...................................................................................................... 30
Section 4 Budget Policy Statement ............................................................................... 32
4.A Budget Policy Thrust......................................................................................... 324.B Sector Allocations (3 Year)................................................................................ 32
Section 5 Summary of Key Points and Recommendations .............................................. 34

Fiscal Strategy Paper (FSP) 2018-2020 – Delta State Government
iv
List of Tables
Table 1: Budget Calendar .................................................................................................. 4Table 2: Real GDP Growth - Selected Countries .................................................................. 7
Table 3: Inflation (CPI) - Selected Countries ....................................................................... 7Table 4: Nigeria Key Macroeconomic Indicators ................................................................ 12
Table 5: Nigeria Mineral Statistics .................................................................................... 13
Table 6: Capital Expenditure Budget vs Actual 2012-2015 ................................................. 24Table 7: Debt Position as at 31st December 2015 .............................................................. 25
Table 8: Medium Term Fiscal Framework.......................................................................... 27Table 9: Risk Matrix ........................................................................................................ 30
Table 10: Indicative MDAs Capital Expenditure Ceilings 2018-2020 .................................... 33
List of Figures
Figure 1: MTEF Process ..................................................................................................... 2Figure 2 National Real GDP Growth and Inflation ................................................................ 8
Figure 3 Bonny Light Spot Price ....................................................................................... 10Figure 4 Crude Oil Production .......................................................................................... 11
Figure 5 NGN:USD Exchange Rate ................................................................................... 12
Figure 6: Statutory Allocation (including net derivation)..................................................... 15Figure 7: Other FAAC Transfers ....................................................................................... 16
Figure 8: VAT ................................................................................................................. 17Figure 9: IGR.................................................................................................................. 18
Figure 10: Capital Receipts .............................................................................................. 19Figure 11: Personnel ....................................................................................................... 20
Figure 12: Overheads...................................................................................................... 20
Figure 13: CRF Charges................................................................................................... 21Figure 14: Capital Expenditure ......................................................................................... 22
Figure 15: Capital Expenditure Ratio ................................................................................ 22Figure 16: Delta State Revenue Trend .............................................................................. 29

Fiscal Strategy Paper (FSP) 2018-2020 – Delta State Government
v
Abbreviations
AfDB African Development BankBRICS Brazil, Russia, India, China, South AfricaBIR Board of Internal RevenueBPS Budget Policy StatementCAP ChapterCBN Central Bank of NigeriaCRF Consolidated Revenue FundCRFC Consolidated Revenue Fund ChargeCPIA Country Policy and Institutional AssessmentDMO Debt Management Office (Federal Government)DESOPADEC Delta State Oil Producing Areas Development CommissionDTSG Delta State GovernmentDTHA Delta State House of AssemblyEFU Economic and Fiscal UpdateExCo Executive CouncilFAAC Federal Allocation Accounts CommitteeFDI Foreign Direct InvestmentFRL Fiscal Responsibility LawFSP Fiscal Strategy PaperFX Foreign ExchangeGDP Gross Domestic ProductHE His ExcellencyHoS Head of ServiceIGR Internally Generated RevenueLFN Laws of Federation of NigeriaIMF International Monetary FundIPSAS International Public-Sector Accounting StandardsMDA Ministry, Department and AgenciesMEP Ministry of Economic PlanningMINT Malaysia, Indonesia, Nigeria & TurkeyMoF Ministry of FinanceMTBF Medium Term Budget FrameworkMTEF Medium Term Expenditure FrameworkMTFF Medium Term Fiscal FrameworkMTSS Medium Term Sector StrategyNBS National Bureau of StatisticsNGN Nigeria Naira (Currency)NNPC Nigerian National Petroleum CompanyOAG Office of the Accountant GeneralOAuD Office of the Auditor GeneralODA Official Development AssistanceOECD Organisation for Economic Cooperation and DevelopmentPAYE Pay as You EarnPFM Public Financial Management

Fiscal Strategy Paper (FSP) 2018-2020 – Delta State Government
vi
PITA Personal Income Tax ActPMS PetroleumPPL Public Procurement LawSHoA State House of AssemblyUSD United States Dollar (Currency)VAT Value Added TaxWEO World Economic Outlook

Fiscal Strategy Paper (FSP) 2018-2020 – Delta State Government
Page 1
Section 1 Introduction and Background
1.A Introduction
1. The Fiscal Strategy Paper (FSP) is a key element in the Medium-Term Budget Framework (MTBF) andannual budget process and as such, it determines the aggregate resources available to fund theGovernment’s projects and programmes from a fiscally sustainable perspective.
2. The Economic and Fiscal Update (EFU) provides economic and fiscal analyses which form the basis for theFiscal Forecast, budget planning and preparation process. The EFU also provides an assessment of budgetperformance (both historical and current) and identifies significant factors affecting implementation. It isaimed primarily at policy makers and decision takers in the Delta State Government (DTSG).
3. The Budget Policy Statement (BPS) is the part of the FSP which takes the aggregate resource envelope anddivides this into indicative sector expenditure ceilings which are consistent with the Government’s policypriorities for socioeconomic development. In this way, the FSP becomes an integral part of a policy drivenbudget process.
4. The DTSG decided to adopt the preparation of the FSP for the first time in 2014 as part of the movementtoward a comprehensive MTEF process. This is however the third rolling edition of the document andcovers the period 2018-2020.
1.A.1 Budget Process
5. The budget process describes the budget cycle in a fiscal year. Its conception is informed by the MTEFprocess which has three components namely:
i. Medium Term Fiscal Framework (MTFF)
ii. Medium Term Budget Framework (MTBF)iii. Medium Term Sector Strategies (MTSS)
6. It commences with the conception through preparation, execution, control, monitoring and evaluation andgoes back again to conception for the ensuing year’s budget.
7. The MTEF process is summarised in diagram below:

Fiscal Strategy Paper (FSP) 2018-2020 – Delta State Government
Page 2
Figure 1: MTEF Process
1.A.2 Summary of Document Content
8. In accordance with international best practice in budgeting, the production of a Fiscal Strategy Paper (FSP)is the first step in the budget preparation cycle for Delta State Government (DTSG) for the period 2018-2020.
9. The purpose of this document is three-fold:
i. To provide a backwards looking summary of key economic and fiscal trends that will affect the publicexpenditure in the future - Economic and Fiscal Update;
ii. To set out medium term fiscal objectives and targets, including revenue policy; revenuemobilisation; level of public expenditure; deficit financing and public debt - Fiscal Strategy Paper;and
iii. Provide indicative sector envelopes for the period 2018-2020.10. The EFU is presented in Section 2 of this document. The EFU provides economic and fiscal analysis in
order to inform the budget planning process. It is aimed primarily at budget policy makers and decisiontakers in the Delta State Government. The EFU also provides an assessment of budget performance (bothhistorical and current) and identifies significant factors affecting implementation. It includes:
Overview of Global, National and State Economic Performance
Overview of the Petroleum Sector
Trends in budget performance over the last six years
11. The Fiscal Framework presented in Section 3, is a key element in the DTSG Medium Term ExpenditureFramework (MTEF) process and annual budget process. As such, it determines the resources available tofund the Government’s programmes from a fiscally sustainable perspective.
12. The BPS, presented in Section 4, is the part of the analysis which takes the aggregate resource envelopeand divides this into indicative sector expenditure ceilings which are consistent with the Government’spolicy priorities for socioeconomic development.
Fiscal Strategy Paper (FSP) 2018-2020 – Delta State Government
Page 3
1.A.3 Preparation and Audience
13. The purpose of this document is to provide an informed basis for the 2018-2020 budget preparation cyclefor all of the key Stakeholders, specifically: All Government Ministries, Departments and Agencies (MDA's);
Executive Council (ExCo);
State House of Assembly (SHoA);
International Development Partners;
Civil Society;
Organised Private Sector; and
Public.
14. The preparation of this document was led by the Ministry of Economic Planning between July - August2017, with support from Ministry of Finance, Office of Accountant General and Board of Internal Revenue.It was prepared prior to the annual budget preparation period using data collected from International,National and State organisations.
1.B Background
1.B.1 Legislative and Institutional arrangement for PFM1
15. Legislative Framework for PFM in Delta State - Federal legislation and regulations provide for PFMinstitutions and processes at the sub-national level only to some extent. The 1999 Constitution coverseveral aspects of the PFM system, including the institutional framework for the PFM system, establishmentof the consolidated revenue fund (CRF), authorization of expenditure from the CRF, allocation ofexpenditure responsibilities to tiers of government, allocation of revenue and tax powers to tiers ofgovernment, audit of accounts and legislative scrutiny of the public finances of a state. Thecomplementary acts include: (i) the Finance (Control and Management) Act (CAP 144) of 1990; theRevenue Allocation Act of 1992; the Personal Income Tax Act P8 LFN 2004; Taxes and Levies (ApprovedList for Collection) Act (CAP 21) of 1998; and the Finance (Miscellaneous Taxation Provisions) Act (CAP 30)of 1999. In the sphere of audit, there are standards and guides, namely Public Sector Auditing Standards1997 issued by Auditor-General for the Federation; and Audit Guide for Federal and State GovernmentAuditors produced by Auditors-General in the Federation. Legislation and financial regulations at the sub-national level (i.e. state edicts and local government bye-laws) are expected to complement federal lawsand regulations and to cater for local peculiarities.
16. Delta State regulations and laws complement Federal PFM legislation and regulations to a large extent. Inaddition to extant circulars, the predominant legislation and regulations in use are: Delta State FinancialRegulations 2000; Bendel State Audit Law 1982; Delta State Public Service Rules 2001; and Delta StateCivil Service Commission Regulations. In 2008, the state government passed the Fiscal Responsibility Law(FRL) to provide for the prudent management of the state's resources and secure greater accountabilityand transparency in fiscal operations; and the Public Procurement Law (PPL) to ensure probity,accountability and transparency in public procurement. A new Public Financial Management Bill (2016) hasbeen approved by the State’s Executive Council and will shortly be forwarded for consideration by the StateHouse of Assembly. Besides, an amendment to the Procurement Law has also been sent to the StateHouse of Assembly for consideration and approval before implementation. These reform initiatives of theState Government are geared towards aligning the financial processes with best practices and internationalstandards.
17. The Bendel State Audit Act of 1982 has been updated by the Delta State Government. The draft Audit Bill(2016) recommends consolidation of audit rules. This, with other reform measures is currently beingpursued in order to address the challenges of lack of independence of external audit staff, delay in
1 Based on 2010 PEMFAR Assessment for Delta State

Fiscal Strategy Paper (FSP) 2018-2020 – Delta State Government
Page 4
preparation of audited accounts and enhance the performance of the Public Accounts Committee of theState House of Assembly.
18. Institutional Framework for PFM in Delta State - The Constitution vests executive powers of thestate in the Governor. Executive powers extend to implementation of the Constitution, all laws made bythe Delta State House of Assembly (DTHA) and to all matters with respect to which the DTHA has power tomake laws. With regard to the PFM system, executive powers include discharge of the expenditurefunctions of the state government, revenue mobilization and fiscal management. The Governor canexercise executive powers either directly or through the Deputy Governor, his Commissioners or officers inthe public service of the state.
19. In practice, the State Executive Council (EXCO), the Ministry of Economic Planning (MEP), the Ministry ofFinance, (MoF), the Office of Accountant-General (OAG) under the MoF, the Office of State Auditor-General(OAuG), and the Office of Auditor-General for Local Government all participate in the coordination of thePFM system. The EXCO formulates the priorities of the state government, and considers and recommendsthe state budget to the DTHA. On passage, the Governor signs the appropriation bill into law. The MEPcoordinates state development plans and the annual budget, and issues budget clearance to MDAs. TheMoF has the responsibility for the receipts, custody and disbursement of government funds, and themanagement of government investments in equities and other items of the investment portfolio, and publicdebt. The AG's Office, which is under the MoF, is responsible for the custody of public funds; coordinationof the accounting systems and internal audit in MDAs, and preparation of the State Final Accounts andFinancial Statements. The OAuG (State) audits and certifies the accounts of the State Government andsubmits certified reports to the DTHA. The Local Government AuG (Local Government) performs similarresponsibilities at the local government level.
20. The State Government allows line agencies some autonomy in expenditure control. Line agencies proposetheir budgets based on the guidelines issued by the EXCO through the MEP, and they also execute theirbudgets. There are three main categories of expenditure: personnel costs, overhead costs and capitalexpenditure. The payroll is centralized under the Head of Service (HoS). MDAs receive regular monthlydisbursements for general items of overhead costs. They also receive, as the need arises, funds for otherspecific items of overhead expenditure. MDAs have the responsibility to execute their capital program, butcapital funds are released project by project.
1.B.2 Overview of Budget Calendar
21. Indicative Budget Calendar for Delta State Government is presented below:
Table 1: Budget Calendar
Stage Date (s) Responsibility1st and 2nd Quarter Budget Performance Report July 2017 MEPPreparation of EFU-FSP-BPS Document June –
August 2017MEP
Submission of EFU-FSP-BPS to EXCO for Reviewand Approval
August 2017 MEP
Submission of EFU-FSP-BPS to DTHA August 2017 HEPre-Budget Conference August 2017 MEP and MDA’sStakeholder Consultation (MDAs, CSO’s, otherstakeholders)
August 2017 MDA’s
Issuance of Budget Call Circular with CAPEX /Recurrent envelopes
August, 2017 MEP
Collation of MDA Budget Proposals 1st Week ofSept., 2017
MEP
Bilateral Discussions and Defence 2nd Week ofSept., 2017
Budget DefenceCommittee(MEP/MOF/BIR)
Consolidation of MDA’s Proposals 2nd Week ofSept., 2017
MEP

Fiscal Strategy Paper (FSP) 2018-2020 – Delta State Government
Page 5
EXCO Review and Approval of Draft Budget 3rd Week ofSept., 2017
EXCO
Presentation of Draft Budget to DTHA 1st Week ofOct 2017
HE, The Governor
Budget Defence by MDA’s before DTHA Nov 2017 DTHADebate and Approval of Budget by DTHA Dec 2017 DTHAHE, The Governor’s Assent Dec 2017 HE, The GovernorBudget Breakdown Dec 2017 MEP and MoFDissemination of Budget 1st January
2018MEP
Fiscal Strategy Paper (FSP) 2018-2020 – Delta State Government
Page 6
Section 2 Economic and Fiscal Update
2.A Economic Overview2.A.1 Global Economy22. Based on the IMF's April 2017 WEO Update, global economic activity is picking up with a promising cyclical
recovery in investment, manufacturing, and trade. World growth is expected to rise from 3.1 percent in 2016to 3.5 percent in 2017 and 3.6 percent in 2018, slightly above the October 2016 forecast. Improvedeconomic activities and expectations of a more robust global demand, coupled with agreed restrictions on oilsupply, have helped commodity prices recover from their troughs in early 2016.
23. Higher commodity prices have provided some relief to commodity exporters and helped lift global headlineinflation and reduce deflationary pressures. Also, financial markets have become buoyant and expectcontinued policy support in China along with fiscal expansion and deregulation in the United States. Ifconfidence and market expectation remain strong, short-term growth could indeed surpass forecast.
24. However, these positive developments should not distract economies from binding structural impediments toa stronger recovery and a balance of risks that remains downward sloping, especially over the medium term.Also, Structural problems—such as low productivity growth and high-income inequality — are likely topersist.
25. The adoption of introspective and restrictive policies threatens global economic integration and thecooperative global economic order, which have served the world’s economy, especially emerging marketsand developing economies, well.
26. A rapid growth in interest rate hikes in the United States could tighten financial conditions elsewhere, withpotential U.S. dollar appreciation straining emerging market economies who depend on the dollar or whoseexchange rate are pegged with material balance sheet mismatches.
27. More generally, a reversal in market sentiment and confidence could tighten financial conditions andexacerbate existing vulnerabilities in many emerging market economies, including China—which faces thedaunting challenge of reducing its reliance on credit growth. A dilution of financial regulation may lead tostronger near-term growth but may imperil global financial stability and raise the risk of costly financialcrises down the road. In addition, the threat of deepening geopolitical tensions persists, especially in theMiddle East and North Africa.
28. Against this backdrop, economic policies have an important role to play in curtailing downside risks, securingand sustaining recovery, as stressed in previous WEOs. On the domestic front, policies should promotegrowth in domestic demand, fiscal sustainability and positive balance of payment. These efforts should becomplimented with improvements in productivity through structural reforms, well-targeted infrastructurespending, and other supply-friendly fiscal policy measures; and support those displaced by structuraltransformations, such as technological change and globalization. Also, emerging markets and developingeconomies should adopt sustainable debt paths lic; Adjusting to lower commodity revenues and addressingfinancial vulnerabilities.
29. In conclusion, the world needs a renewed multilateral effort to tackle many common challenges (e.g.Terrorism, global warming, etc.) in an integrated global economy.
30. The economic outlook (GDP growth rate and inflation rate) of some countries are shown in tables 2 and 3below.
Countries selected are chosen to represent G20, BRINCS, MINT, N-11, Petro-economies and other largeAfrican countries.

Fiscal Strategy Paper (FSP) 2018-2020 – Delta State Government
Page 7
Table 2: Real GDP Growth - Selected CountriesCountry
2014 2015 2016 2017 2018 2019 2020 2021Angola 4.8 3.0 0.0 1.3 1.5 1.4 1.5 1.4Brazil 0.5 -3.8 -3.6 0.2 1.7 2.0 2.0 2.0China 7.3 6.9 6.7 6.6 6.2 6.0 5.9 5.8Germany 1.6 1.5 1.8 1.6 1.5 1.4 1.3 1.2Ghana 4.0 3.9 4.0 5.8 9.2 5.9 5.0 5.2Indonesia 5.0 4.9 5.0 5.1 5.3 5.4 5.5 5.5Mexico 2.3 2.6 2.3 1.7 2.0 2.7 2.7 2.7South Africa 1.7 1.3 0.3 0.8 1.6 2.2 2.2 2.2Turkey 5.2 6.1 2.9 2.5 3.3 3.4 3.8 3.8United Kingdom 3.1 2.2 1.8 2.0 1.5 1.6 1.9 1.9United States 2.4 2.6 1.6 2.3 2.5 2.1 1.8 1.7
Actual % Forecast %
Source: IMF’s World Economic Outlook, April 2017.
31. BRICS and MINT countries show an average higher growth than G20 and G7 countries over the period,with Ghana also being particularly better performing.
Table 3: Inflation (CPI) - Selected CountriesCountry
2014 2015 2015 2017 2018 2019 2020 2021Angola 7.3 10.3 32.4 27.0 17.8 13.8 10.9 9.5Brazil 6.3 9.0 8.7 4.4 4.3 4.5 4.5 4.5China 2.0 1.4 2.0 2.4 2.3 2.6 3.0 3.0Germany 0.8 0.1 0.4 2.0 1.7 1.9 2.1 2.2Ghana 15.5 17.2 17.5 12.0 9.0 7.0 6.0 6.0Indonesia 6.4 6.4 3.5 4.5 4.5 4.3 4.1 4.0Mexico 4.0 2.7 2.8 4.8 3.2 3.0 3.0 3.0South Africa 6.1 4.6 6.3 6.2 5.5 5.5 5.5 5.5Turkey 8.9 7.7 7.8 10.1 9.1 8.5 7.9 7.5United Kingdom 1.5 0.1 0.6 2.5 2.6 2.2 2.1 2.0United States 1.6 0.1 1.3 2.7 2.4 2.6 2.3 2.2
Actual % Forecast %
Source: IMF’s WEO, April 2017
32. Ghana and Angola both experienced high inflation rates together with their high real GDP growth. Globallyinflation rates are set to decrease over the next five years as mineral and agriculture prices stabilise.
2.A.2 Africa
33. The sub-Sahara African economic outlook remains clouded recording a sluggish growth averaging 1.4% in2016; the lowest in two decades. About two-thirds of the countries in the region, together accounting for83 percent of the region’s GDP, slowed down – although some countries like Senegal and Kenya stillcontinued to expand strongly. A modest rebound in growth to 2.6 percent is expected in 2017, but eventhat rebound will be to a large extent driven by one-off factors in the three largest countries – a recoveryin oil production in Nigeria, higher public spending ahead of the elections in Angola, and the fading ofdrought effects in South Africa, combined in all three countries with modest improvements in the terms oftrade. At this rate, growth for the region as a whole will continue to fall well short of past trends and barelydeliver any per capita gains.
34. While noting that many countries suffered a very substantial commodity price shock, there has also beeninsufficient policy adjustment to account for broad-based slowdown in growth movement in the region.This is especially the case among commodity exporters, notably oil exporters, such as Angola, Nigeria andthe countries of the Central African Economic and Monetary Union.
35. Vulnerabilities are also emerging in countries that do not rely significantly on commodities for their exports.While these countries – such as Cote d’Ivoire, Kenya, and Senegal – have generally maintained highgrowth rates, their fiscal deficits have been high for years, as governments rightly sought to address socialand infrastructure gaps.

Fiscal Strategy Paper (FSP) 2018-2020 – Delta State Government
Page 8
36. Improvements in commodity prices will provide some breathing space, but will not be enough to addressexisting imbalances among resource-intensive countries.
2.A.3 Nigerian Economy2
Macroeconomic37. From 2004 to 2014, Nigeria economy grew by 7.5% and is next to the two of the world fastest growing
economies of Asia, namely China and India which had grown at 10.4% and 7.6%, respectively over thesame period.
38. The sharp and continuous decline in crude oil prices since mid-2014, along with a failure to diversify thesources of revenue and foreign exchange in the economy, led to a recession in the first quarter of 2016(negative growth rate of -0.4% and -2.1% year-on-year in real terms for first and second quarterrespectively). The challenges in the oil sector, including sabotage of oil export terminals in the Niger Delta,negatively impacted government revenue and export earnings, as well as the fiscal capacity to prevent theeconomy from contracting. The capacity of government spending was equally constrained by lack of fiscalbuffers to absorb the shock, as well as leakages of public resources due to corruption and inefficientspending in the recent past.
39. The Nigerian economy’s dependence on crude oil can quite easily be seen in Figure 2 below. Bonny Lightprices started to drop in the second half of 2014 and, after a short (three month) lag, the Nigerianeconomy began to see falling real GDP growth and growing inflation.
40. As a petrocurrency, the Naira came under significant pressure during 2015 and the Central Bank made adevaluation of the official rate in June 2016 – this had a significant contribution on inflation.
Figure 2 National Real GDP Growth and Inflation
-5%
0%
5%
10%
15%
20%
Jan-
14
Mar
-14
May
-14
Jul-1
4
Sep-
14
Nov-
14
Jan-
15
Mar
-15
May
-15
Jul-1
5
Sep-
15
Nov-
15
Jan-
16
Mar
-16
May
-16
Jul-1
6
Sep-
16
Nov-
16
Jan-
17
Mar
-17
Perc
enta
ge
National Real GDP Growth and Inflation
CBN Inflation Rate (Year on Year) NBS Real GDP (Quarterly Increment)
Data Source and KeyObservations CBN Year-on-Year
Inflation, NBSQuarterly Real GDPGrowth
Point of initialdivergence wasDecember 2014,coinciding with globalCrude Oil Price crash.
Divergenceaccelerated in June2016 which coincidedwith the devaluation ofthe Naira
Inflation peaked at18.72% (year-on-year)in January 2017
Real GDP growth(decline) bottomed outat -2.24% in Q3 2016
Some convergence ofinflation and real GDPgrowth observed in Q12017
2 Source: IMF World Economic Outlook April and July Editions, CBN Statistical Bulletin & Annual Reports, NBSReports and Nigeria Economic Recovery and Growth Plan 2017 - 2020.

Fiscal Strategy Paper (FSP) 2018-2020 – Delta State Government
Page 9
41. Data for Q1 2017 shows real GDP growth was still negative (-0.52%) but it is anticipated that the economywill return to positive growth in Q2 (the next NBS GDP report, for Q2, will be available in late August).
42. In its April 2017 World Economic Outlook (WEO), the IMF (International Monetary Fund) forecasts arecovery in macroeconomic activity in 2017 which should lead to a return to positive growth for the year asa whole. For 2017 and 2018 the forecast real GDP growth rates are 0.8% and 1.9% respectively.
43. The Nigeria Economic Recovery and Growth Plan (ERGP) 2017 – 2020 provides that the real GDP isprojected to grow by 4.62 per cent on average over the plan period of 2017 – 2020, from an estimatedcontraction of 1.54 per cent in 2016. The ERGP also stated that real GDP growth is projected to improvesignificantly to 2.19 per cent in 2017, reaching 7 per cent at the end of the Plan period (i.e. 2020). TheERGP argued that this growth will be driven by a fiscal stimulus helped by an expected increase in oilprices, an increase in non-oil federal receipts, an increase in oil production, and resolution of paymentarrears especially joint venture cash calls. The strong growth during the Plan period will be driven byagriculture and industry, and in the later parts of the Plan period by the services sector as well.
44. Inflation also fell month-on-month for the first five months of 2017 – from 18.72% in January to 16.25% inMay. However, it will take longer to return to the sub-10% level observed up to the end of 2015 – thelatest IMF forecasts for 2017 and 2018 are 17.4% and 17.5% respectively for consumer price inflation(CPI), with the rate remaining as high as 14.5% in 2022.
45. NBS and ERGP 2017 – 2020 documents inflation rate forecast for 2017, 2018 and 2019 are 15.74%,12.42% and 13.39% respectively. The forecast in NBS and ERGP documents are different with the forecastin July 2017, IMF WEO as indicated in paragraph 44 above. The IMF, NBS and ERGP all indicateddecreasing inflation rate.
46. Mineral Sector Performance – Mineral sector performance over the last 18 months has been variable andsignificantly below the price and production levels observed between 2011 and 2014. Global economicuncertainties as well as militancy issues in the Niger Delta have affected price and production respectively.
47. The dynamic of actual price per barrel and the benchmark since 2011 is shown in Figure below.

Fiscal Strategy Paper (FSP) 2018-2020 – Delta State Government
Page 10
Figure 3 Bonny Light Spot Price
$0
$20
$40
$60
$80
$100
$120
$140
Jan-
11M
ay-1
1Se
p-11
Jan-
12M
ay-1
2Se
p-12
Jan-
13M
ay-1
3Se
p-13
Jan-
14M
ay-1
4Se
p-14
Jan-
15M
ay-1
5Se
p-15
Jan-
16M
ay-1
6Se
p-16
Jan-
17M
ay-1
7Se
p-17
Price
per
Bar
rel
Bonny Light Crude Oil Price - Benchmark and Actual
Spot Price (OPEC) Benchmark Price
Data Source and KeyObservations Spot Price from OPEC,
Benchmark from FederalGovernment Budgets
From 2011 to 2014 actualprice was on average 46%higher than Benchmark
Price per barrel dropped from$114 in June 2014 to $48 inJanuary 2015, then to $30 byJanuary 2016
From January 2015 to May2017, the differential has been9%
Price has been fluctuatingbetween $45 and $55 for last12 months
Significant factors affectingboth supply and demand ofcrude oil mean outlook isuncertain
48. Crude Oil prices have been fluctuating between $40 and $60 per barrel for the last 15 months after theyhit a low of $30 in January 2016. There have been both upward and downward pressures on global crudeoil supply and demand resulting from uncertainty in the global economy (for example protection policies ofthe new US administration, Brexit) – this has in turn led to cuts in production from OPEC in late 2016(Nigeria was exempted from the cut).
49. The outlook for the next 18 months (i.e. the remainder of 2017 and all of 2018) suggests the price will stayin the range observed over the last 15 months. The US Energy Information Administration (EIA) June2017 Short-Term Outlook for 2017 for Brent Crude is $52.69 (actual price was $52.74 for Jan-May), withthe forecast for 2018 being $55.61. Bonny Light usually trades marginally above the price of Brent Crudeso an average price of $53-54 for 2017 and around $56-57 (again with some short-term fluctuation).
50. A 25% discount against the forecast price would put the benchmark around $42-45 per barrel for 2018.
51. Crude Oil production has also suffered in the last 15 months as shown in Figure below.

Fiscal Strategy Paper (FSP) 2018-2020 – Delta State Government
Page 11
Figure 4 Crude Oil Production
1
1.2
1.4
1.6
1.8
2
2.2
2.4
2.6
2.8
Jan-
14
Mar
-14
May
-14
Jul-1
4
Sep-
14
Nov-
14
Jan-
15
Mar
-15
May
-15
Jul-1
5
Sep-
15
Nov-
15
Jan-
16
Mar
-16
May
-16
Jul-1
6
Sep-
16
Nov-
16
Jan-
17
Mar
-17
Prod
uctio
n (M
illio
ns B
arre
ls pe
r Day
)
Crude Oil Production - Benchmark and Actual
Actual Production (DPR) Production Benchmark
Data Source and KeyObservations Actual production from
Department of PetroleumResources, Benchmark fromFederal Governmentbudgets
OPEC quota reduced from2.4 MBPD to 2.2 in 2014
Long term trend of around2.2 MBPD over the period
Production has averaged1.8 MBPD since over theperiod Jan-16 to Mar-17,but with significant volatility
Drop in production due toNiger Delta militancy andproduction facilities goingoff line
52. Production averaged 1.7 million barrels per day (MBPD) in the first quarter of 2017 (this is the most recentavailable data), and slightly higher at 1.8 million (1.9 million including condensates) over the 15 monthsfrom January 2016 to March 2017 inclusive. Production has been below the production benchmark (andOEPC quota) every month since March 2014. The issues are largely around block-ins and other militancyissues in the Niger Delta region which have increased since the 2015 elections.
53. It is difficult to forecast where production will go in the next 18 months – although there are attempts toaddress most of the problems affecting productions, until the production level is above the 15-monthaverage of 1.8 MBPD (1.9 million including condensates) for a sustained period. Given the relative peace inthe Niger Delta, a forecast of 2.3 MBPD is being proposed for 2018. Forecasts might be more optimisticfor 2019-2020, however with elections coming up in 2019, there is uncertainty into the medium term.
54. The NGN:USD Exchange rate has stabilised at 305 since the devaluation in June 2016 – the historical trendof the International Foreign Exchange Market (IFEM) rate and the benchmark since 2011 are showing inFigure below.

Fiscal Strategy Paper (FSP) 2018-2020 – Delta State Government
Page 12
Figure 5 NGN:USD Exchange Rate
0
50
100
150
200
250
300
350
Jan-
11M
ay-1
1Se
p-11
Jan-
12M
ay-1
2Se
p-12
Jan-
13M
ay-1
3Se
p-13
Jan-
14M
ay-1
4Se
p-14
Jan-
15M
ay-1
5Se
p-15
Jan-
16M
ay-1
6Se
p-16
Jan-
17M
ay-1
7Se
p-17
Exch
ange
Rat
e (N
GN:U
SD)
NGN:USD Exchange Rate - Benchmark and Actual
Spot Rate (CBN) Benchmark Rate
Data Source and KeyObservations Spot rate from CBN (IFEM
rate), Benchmark fromFederal Government budgets
Little variation betweenbenchmark and actual ratesover last 6 years
NGN:USD FX rate relativelystable from 2011 to end of2014 at around 150 NGN tothe USD
Devaluation from 155 to 197in early 2015 coincided withCrude Oil Price crash, furtherdevaluation in June 2016 toaround 300, stable for thelast 12 months
Recent closing of gapbetween IFEM, BDC andparallel market rates
55. Exchange rates are difficult to forecast – the general principle is that the best estimate of the exchangerate tomorrow is the exchange rate today. In Nigeria’s own specific circumstance, the narrowing of thegap between the official and unofficial rates in recent months suggest the risk of a further devaluation isreducing, whilst growth in crude oil exports, economic growth and falling inflation all present a case forpossible appreciation – therefore the current rate of 305 is best adopted as the basis of 2018-2020benchmarks as things stand (CBN reports and commentaries should be monitored for latest information).
56. The Nigeria key Macroeconomic Indicators are shown in table 4 below.Table 4: Nigeria Key Macroeconomic Indicators
Year 2017 2018 2019 2020
National Inflation (CPI) 15.74% 12.42% 13.39% 9.90%
National real GDP Growth 2.20% 4.80% 4.50% 7.00%
Implied Growth in NCS3 12.80% 13.78% 13.28% 12.71%Implied Growth in CIT2 15.37% 16.54% 15.94% 15.26%Implied Growth in VAT2 10.83% 11.65% 11.23% 10.75%Oil Price (Benchmark) $44.50 $45 $50.00 $52.00Oil Production MBPD (Benchmark) 1.80 2.30 2.00 2.30NGN:USD Exchange Rate (Benchmark) 305 305 305 282
Source: (Economic Outlook) NBS, WEO, IMF; CBN, ERGP 2017 – 2020, and Federal Government FSP 2018-2020
3 Based on Elasticity forecasting (Real GDP and Inflation explanatory variables)

Fiscal Strategy Paper (FSP) 2018-2020 – Delta State Government
Page 13
57. The Nigeria Mineral Statistics is shown in table 5 below.Table 5: Nigeria Mineral Statistics
YearAverage Actual Price USD
(CBN)FAAC Benchmark Price
USDAverage Actual
Production (CBN)2007 74.48 402008 101.41 592009 63.90 45 2.1108332010 80.92 67 2.1108332011 113.76 65 2.46752012 113.47 72 2.0808332013 110.29 79 2.3183332014 100.35 77.5 2.22015 52.65 53 2.132016 382017 44.5
58. The above table shows that over the last five years the FAAC benchmark price for crude oil has almostdoubled from $40 per barrel in 2007 to $79 per barrel in 2013, whereas over the same period prices haveonly increased by around 50% (i.e. 74.48 per barrel to 110.29 per barrel) before decreasing with about50% in 2015.
2.A.4 Delta State Economy4
59. Delta State was created on August 27, 1991 out of the former Bendel State. It is located in the Southernpart of Nigeria between longitude 5’ 00’E and 6’00’E and latitude 5 00’N and 6’30’N. It occupies a land areaof 18,050km2 with a coastline of approximately 163km on the Atlantic Ocean. It is bounded in the East byAnambra and Rivers States, on the North by Edo State, North- West by Ondo State and South by BayelsaState and the Atlantic Ocean. The capital city is Asaba, located at the northern end of the State, whileWarri is the commercial nerve centre. The State currently consists of 25 local government areas thatoperate under 3 senatorial districts.
60. The estimated population of Delta State is 5.1m as at 2013. This is about 3.0% of Nigeria’s population andoccupies only 1.9% of the country’s land mass. It produces over 30% of oil output and about 52% of the159 oilfields comprising of 1,481 oil wells in the country. Delta State oil production currently accounts for asignificant amount of Nigeria’s foreign exchange earnings and government revenue.
61. Delta state has a variety of resources which confer on her significant comparative advantage over otherstates. The Economy is diverse and largely driven by crude oil earnings. There are huge potentials in theformal and informal sectors, such as Agriculture,
4 References:
Agusto, O. (2002): Industry Report- Oil and Gas (Upstream) conducted by Agusto & Co. Limited, April.Delta State Vision 2020 (2011-2020); Published by Delta State Ministry of Economic Planning
Esho, B. (2006): Local Content Policy, Best Thing to Happen to Oil and Gas Sector, The Sun Newspaper,November 23.
Report on Delta State Gross Domestic Product (GDP) 2006-2008; 2009-2013; By the Delta State Ministry ofEconomic Planning.

Fiscal Strategy Paper (FSP) 2018-2020 – Delta State Government
Page 14
Tourism and Entertainment, Commerce and Industry, which hitherto were underdeveloped because of overdependence on crude oil.
62. The GDP reports continue to show that the Oil & Gas sector dominate other sectors in terms ofcontribution to the State’s GDP with a very wide margin. Ironically, other important sectors like Agriculture,Manufacturing, Wholesale and Retail trade whose contributions to the State’s GDP are insignificantcompared to the oil and gas sector, employs the bulk of the state’s work force.
63. Delta State Government has 16% share in Mid-Western Oil. In addition there are other private oilprospecting and commercial enterprises across the state as well as large Federal Governmentestablishments such as Warri refinery, Ekpan Petrochemical Plant and Okpai Gas Plant etc.
64. Delta State provides viable investment environment given its comparative advantages, some of whichinclude: Leading producer of oil & gas
Coastal state with access to four sea ports
Strategically located and accessible to other parts of Nigeria by land, rail, air & sea
Breed of young, educated, & active population
Continuous investment in security by government to create a safe and secure environment
Government commitment on the provision of critical infrastructure to support investors; increasingaccess to key public services such as education, health and security to put the state on a durablehigh growth path to reduce poverty and inequality; and government provision of good governanceto improve the business environment
Presence of two fully operational Airports at Asaba and Osubi
Delta State is developing Special Economic Zones to provide the necessary infrastructure for bothdomestic and foreign investors
65. The new administration is entrenching good governance. The focus is to strengthen governmentinstitutions, processes, and systems in the areas of Public Financial Management, Policy and Strategy,Public Sector Management, Knowledge Management, and Monitoring and Evaluation, towards promotingbetter service delivery.
66. The Fiscal Responsibility Act and the Public Procurement Act were passed into law in 2009. There is arobust financial system, SAP is in use for budget execution and accounting expenditure control; the Statethrough the SEEFOR Project which has a component for integrated financial management informationsystem is working towards implementation of additional modules graduating to end-to-end processincluding human resource, project management, and procurement management. The World Bank in 2010reviewed the State's Procurement System, as a result of their assessment and recommendation, thegovernment has set up a Public Procurement Reform Implementation Committee that is currently drivingthe establishment of the appropriate institution and structure for the operation of the Public ProcurementLaw.
67. On economic and social cohesion, the State Government is providing opportunities for youths, women andunemployed graduates under its job and wealth creation programmes of YAGEP (Youth AgriculturalEntrepreneurs Programme); STEP (Skills Training and Entrepreneurship Programme); and Micro CreditSchemes.
68. The Government is also pursuing an agriculture agenda to diversify the economy of the State. Theagricultural and agribusiness programmes are being implemented through a variety of value chain supportmeasures under the Production and Processing Support Programme (PPSP).

Fiscal Strategy Paper (FSP) 2018-2020 – Delta State Government
Page 15
69. The current administration has developed a monitoring and evaluation framework in the state. The essenceof the framework is to guarantee project execution pace, and have minimal projects being abandoned ordelayed execution. These will bring positive results in the area of project delivery.
70. The government is also playing a major role towards guaranteeing investors’ confidence. Currently, theState is working on the harmonization of taxes and also providing information on guidance forcorporate/income tax towards guaranteeing investors’ confidence in the State. A committee has been putin place for the harmonization/reform of the State tax system and regulation of other taxes/levies. Majorland reforms have been embarked upon ranging from “FAST TRACK 90” to strong focus on land bank andreview of timelines for construction permit to facilitate ease of doing business.
2.B Fiscal Update
2.B.1 Historic Trends
Revenue Side71. The revenue side of this document looks at Statutory Allocation, VAT, IGR, Excess Crude, and Capital
Receipts – budget versus actual for the period 2011-2016 (six years historic) plus the 2017 budget.
Figure 6: Statutory Allocation (including net derivation)
2011 2012 2013 2014 2015 2016 2017Budget 179,174,871,560 159,631,084,121 198,513,285,148 229,315,948,494 137,052,669,603 137,948,341,497 148,939,012,121Actual 145,840,991,909 153,569,227,739 208,150,556,361 188,299,423,043 133,767,527,590 89,117,061,863Performance 81.4% 96.2% 104.9% 82.1% 97.6% 64.6%Growth 5.30% 35.54% -9.54% -28.96% -33.38%
-60.0%
-40.0%
-20.0%
0.0%
20.0%
40.0%
60.0%
80.0%
100.0%
120.0%
0
50,000
100,000
150,000
200,000
250,000
Valu
e (N
GN
Mill
ion)
Year
FAAC Statutory Allocation Budget vs Actual: 2011 - 2017
72. The statutory allocation is a transfer from the Federation Account to States. The revenues flow frommineral sector (NNPC and DPR) and non-mineral sector (Customs and Excise and Companies Tax as well asVAT). The accruals into federation account are then shared between the three tiers of government basedon defined sharing ratios. As an oil producing state, Delta State also attracts a share of “net derivation”which is a share of 13% of mineral revenues.
73. Performance against budget in the above graph does not take into consideration other federation accountstransfers, which is shown separately overleaf. Overall, it has been variable over the period observed – withactual exceeding budget in 2013 (i.e. 104%). The trend in actual receipts was upwards from 2010 to2013, increasing from 108 billion in 2010 to 208 billion in 2013, which represents growth of more than 60%in a four-year period. The large increases in statutory allocation over the period was driven by increases inthe benchmark of crude oil price from $40 to $79 per barrel (average price of crude oil in internationalmarket was $112 in 2013).
74. However, there was significant decline in statutory allocation in 2014 and 2015 due to drop in crude oilprice in the international market. The crude oil prices dropped to about $60 per barrel in the second half of2014 and about $38 per barrel in the last quarter of 2015. From the second half of 2014 to the end of 2015crude oil prices were less than projected benchmarks of $77.5 per barrel for 2014 budget and $53 perbarrel for 2015 budget.

Fiscal Strategy Paper (FSP) 2018-2020 – Delta State Government
Page 16
75. Statutory allocation further declined in 2016 from (N133 billion in 2015 to N87 billion in 2016) because offurther drop in the price of crude oil as well as drop in production caused by militancy issues in the NigerDelta region in the first and second quarters of 2016.
76. The relative peace in the Niger Delta region is beginning to manifest in 2017 performance of statutoryallocation (including net derivation). The first 9 months of 2017 statutory allocation receipt (i.e. fromJanuary to September 2017) is N83.66 billion which is almost at par with the 2016 full year performance ofN89.11 billion. Notwithstanding improved receipt, 74.9% performance on 9 months budget is an indicationthat the 2017 budget of N148.93 billion may not be achieved.
77. The figures for Statutory allocation are gross (i.e. before debt servicing deductions and any otherdeductions), which is done directly by FAAC. For this reason, the actual receipt figures may vary slightlyfrom those in the audited financial statements of the State.
Figure 7: Other FAAC Transfers
2011 2012 2013 2014 2015 2016 2017Budget 0 10,368,915,879 0 0 0 0 0Actual 63,128,481,141 62,542,789,708 17,653,044,618 4,427,865,945 0 0Performance 0.0% 603.2% 0.0% 0.0% 0.0% 0.0%Growth -0.93% -71.77% -74.92% -100.00% 0.00%
-200.0%
-100.0%
0.0%
100.0%
200.0%
300.0%
400.0%
500.0%
600.0%
700.0%
0
10,000
20,000
30,000
40,000
50,000
60,000
70,000
Valu
e (N
GN
Mill
ion)
Year
Other Federation Account Receipts Budget vs Actual: 2011 - 2017
78. Other FAAC transfers including Excess Crude, which is generated from oil sector performance above thebenchmarks, is also received by Delta State based on the same sharing ratios as are used for statutoryallocation. The distribution includes NNPC refunds, augmentations, exchange gains and any otherexcesses.
79. Performance of other distributions has been falling in recent years as the SURE-P programme stopped (in2015) and the build-up of excesses has reduced as benchmarks have decreased and the crude oil price hasbeen volatile.

Fiscal Strategy Paper (FSP) 2018-2020 – Delta State Government
Page 17
Figure 8: VAT
2011 2012 2013 2014 2015 2016 2017Budget 9,927,756,200 9,991,239,535 11,441,860,370 10,376,666,433 11,968,230,716 10,218,715,326 10,515,786,230Actual 8,467,586,865 9,676,839,414 10,124,911,725 9,619,182,846 9,265,096,195 9,265,096,195Performance 85.3% 96.9% 88.5% 92.7% 77.4% 90.7%Growth 14.28% 4.63% -4.99% -3.68% 0.00%
-20.0%
0.0%
20.0%
40.0%
60.0%
80.0%
100.0%
120.0%
0
2,000
4,000
6,000
8,000
10,000
12,000
14,000
Valu
e (N
GN
Mill
ion)
Year
VAT Budget vs Actual: 2011 - 2017
80. VAT is established under an act that states that goods and services are taxed at 5% on an ad valorembasis, and is collected by the Federal Inland Revenue Service. The receipts are then distributed across thethree tiers of government. States receive a combined 50% share, from which Delta receives a share basedon defined ratios.
81. States have little direct influence over the VAT receipts except through their own VAT collection effortwhich is one of the ratios used to determine distributions amongst states.
82. Actual VAT receipts increased year on year up until 2013 due to national GDP growth, but fell slightly in2014, and further dropped in 2015.
83. In the years under consideration, Delta State has performed close to budget, except for 2011 and 2015that recorded 85.3% and 77.4%respectively.
84. The 9 months (January – September 2017) receipt of N8.37 billion is very encouraging. Thus, the106.21% performance in respect of the 2017 VAT budget for 9 months is an indication that the 2017 fullbudget of N10.51 billion will be exceeded.
85. The future trend in national GDP and inflation must be taken into consideration when forecasting VAT forthe period 2018-2020, as well as determining the cause of the drop in 2015.
Fiscal Strategy Paper (FSP) 2018-2020 – Delta State Government
Page 18
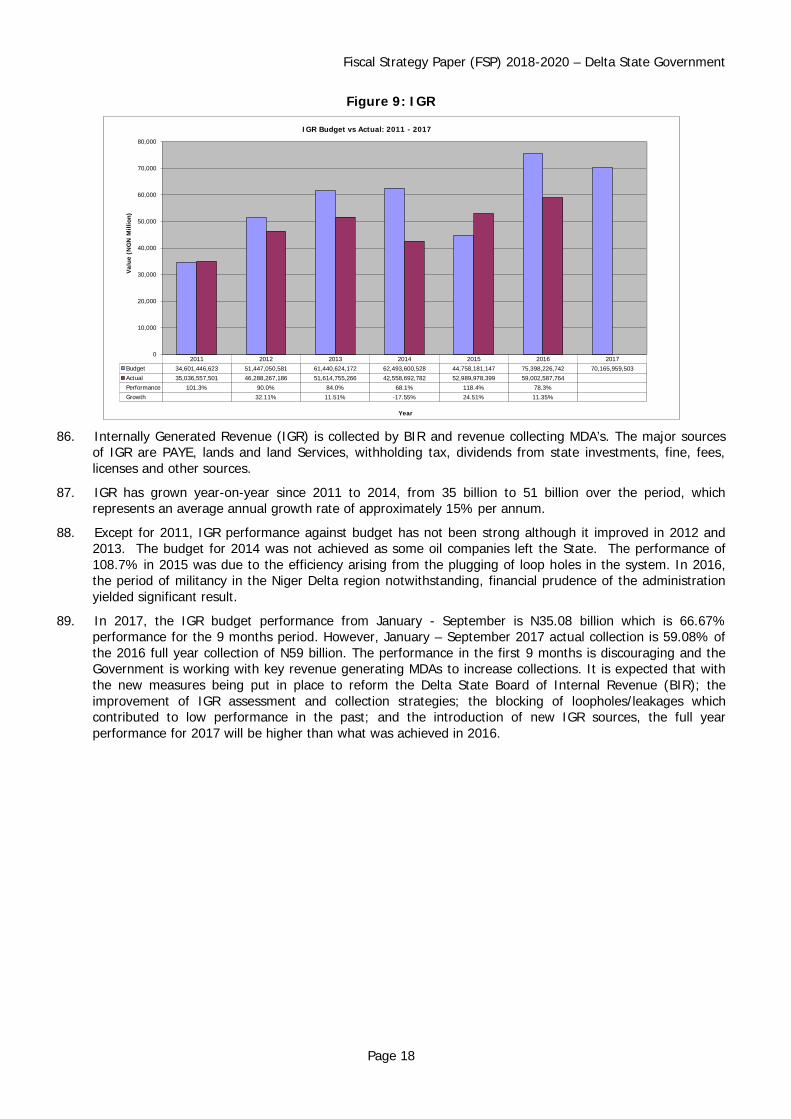
Figure 9: IGR
2011 2012 2013 2014 2015 2016 2017Budget 34,601,446,623 51,447,050,581 61,440,624,172 62,493,600,528 44,758,181,147 75,398,226,742 70,165,959,503Actual 35,036,557,501 46,288,267,186 51,614,755,266 42,558,692,782 52,989,978,399 59,002,587,764Performance 101.3% 90.0% 84.0% 68.1% 118.4% 78.3%Growth 32.11% 11.51% -17.55% 24.51% 11.35%
-40.0%
-20.0%
0.0%
20.0%
40.0%
60.0%
80.0%
100.0%
120.0%
140.0%
0
10,000
20,000
30,000
40,000
50,000
60,000
70,000
80,000
Valu
e (N
GN
Mill
ion)
Year
IGR Budget vs Actual: 2011 - 2017
86. Internally Generated Revenue (IGR) is collected by BIR and revenue collecting MDA’s. The major sourcesof IGR are PAYE, lands and land Services, withholding tax, dividends from state investments, fine, fees,licenses and other sources.
87. IGR has grown year-on-year since 2011 to 2014, from 35 billion to 51 billion over the period, whichrepresents an average annual growth rate of approximately 15% per annum.
88. Except for 2011, IGR performance against budget has not been strong although it improved in 2012 and2013. The budget for 2014 was not achieved as some oil companies left the State. The performance of108.7% in 2015 was due to the efficiency arising from the plugging of loop holes in the system. In 2016,the period of militancy in the Niger Delta region notwithstanding, financial prudence of the administrationyielded significant result.
89. In 2017, the IGR budget performance from January - September is N35.08 billion which is 66.67%performance for the 9 months period. However, January – September 2017 actual collection is 59.08% ofthe 2016 full year collection of N59 billion. The performance in the first 9 months is discouraging and theGovernment is working with key revenue generating MDAs to increase collections. It is expected that withthe new measures being put in place to reform the Delta State Board of Internal Revenue (BIR); theimprovement of IGR assessment and collection strategies; the blocking of loopholes/leakages whichcontributed to low performance in the past; and the introduction of new IGR sources, the full yearperformance for 2017 will be higher than what was achieved in 2016.

Fiscal Strategy Paper (FSP) 2018-2020 – Delta State Government
Page 19
Figure 10: Capital Receipts
2011 2012 2013 2014 2015 2016 2017Budget 30,000,000 100,000,000,000 126,921,344,146 148,552,011,627 59,164,412,963 42,122,872,608 64,836,282,623Actual 18,276,790,948 22,444,468,410 85,901,070,276 56,030,377,509 105,352,628,832 24,341,472,933 0Performance 60922.6% 22.4% 67.7% 37.7% 178.1% 57.8%Growth 22.80% 282.73% -34.77% 88.03% -76.90%
-1 0000. 0%
0.0 %
100 00.0%
200 00.0%
300 00.0%
400 00.0%
500 00.0%
600 00.0%
700 00.0%
0
20,000
40,000
60,000
80,000
100,000
120,000
140,000
160,000
Valu
e (N
GN
Mill
ion)
Year
Other Capital Receipts Budget vs Actual: 2011 - 2017
90. Capital Receipts include grants, loans and all other capital receipts. Loans have been drawn from thecapital market through issuance of bonds, credits from the international development partners, and someshort term bank borrowings. Grants come from international development partners and MDG grants fromfederal government. Capital receipts also includes sale of state assets/investments, and other one-offcredits.
91. Performance against budget over the period has been low. This is because budget and expenditure isrecorded on cash basis, as some development partners funding (loans and grants) are not captured in thebudget or the accounts. However, there was a significant rise in 2015. Out of the 105.3 billion, 69.8 billion(66.25%) accounted for existing loans that were restructured into long term FGN’s Bond, Central Bank’sintervention fund of 20.9 billion for capital expenditure and salary bail out, while the balance of 14.6 billionaccounted for SUBEB and contractors’ guarantee loan for infrastructural development. Please note that the69.8 billion were old bank facilities from previous years which have been restructured to longer tenure andnot available as cash in the year of reporting.
92. Furthermore, loans have been used to bridge the financing gap based on the desires of government withregards to capital expenditure, which in some cases have not been realised.
93. When forecasting loans and grants, due consideration should be given to both realism in terms of whatfacilities can be realistically negotiated with creditors, and the debt sustainability ratios included later in thissection.
Expenditure Side94. On the expenditure side, the document looks at Personnel, Overheads and Capital Expenditure – budget
versus actual for the period 2011-2016, plus the 2017 budget. The historical analysis is based on theoriginal budgets for the period 2011 – 2016. Delta State in some of the years revised/amended the originalbudget without expanding the original budget size.

Fiscal Strategy Paper (FSP) 2018-2020 – Delta State Government
Page 20
Figure 11: Personnel
2011 2012 2013 2014 2015 2016 2017Budget 45,533,777,699 80,564,125,769 57,663,459,536 64,223,825,162 68,531,968,520 68,453,584,572 68,345,546,506Actual 63,957,976,497 63,622,421,551 65,051,102,406 67,329,809,470 67,864,861,224 67,035,674,966Performance 140.46% 78.97% 112.81% 104.84% 99.03% 97.93%Growth -0.52% 2.25% 3.50% 0.79% -1.22%
-20.00%
0.00%
20.00%
40.00%
60.00%
80.00%
100.00%
120.00%
140.00%
160.00%
0
10,000
20,000
30,000
40,000
50,000
60,000
70,000
80,000
90,000
Valu
e (N
GN
Mill
ion)
Year
Personnel Expenditure Budget vs Actual: 2011 - 2017
95. Personnel costs related to the salaries and allowances of public servants and political office holders.96. Personnel costs in 2011 saw a significant increase from N45 billion to N64 billion mainly because of the
increase in the minimum wage and new entrants into the public service. Personnel costs performanceagainst budget was close to budget in 2014, 2015 and 2016 as variance in the 3 years was less than 5%.
97. The Performance from January – September 2017 which is N48.6 billion or 94.82% is very encouraging. Itis anticipated that this trend will continue and the variance at the end of 2017 will be less than 5%.
98. When forecasting personnel costs for 2018-2020, consideration should be given to the on-going Biometricexercise.
Figure 12: Overheads
2011 2012 2013 2014 2015 2016 2017Budget 47,712,864,840 59,712,503,852 52,201,030,693 59,181,061,650 29,609,641,678 30,301,834,179 39,211,379,552Actual 59,349,943,143 58,849,444,455 66,035,515,492 52,886,215,640 46,606,150,627 33,822,224,491Performance 124.39% 98.55% 126.50% 89.36% 157.40% 111.62%Growth -0.84% 12.21% -19.91% -11.87% -27.43%
-50.00%
0.00%
50.00%
100.00%
150.00%
200.00%
0
10,000
20,000
30,000
40,000
50,000
60,000
70,000
Valu
e (N
GN
Mill
ion)
Year
Overhead Expenditure Budget vs Actual: 2011 - 2017
99. Overhead expenditure relates to the operational costs incurred by MDA’s. A proportion of these, classifiedas regular overheads are released monthly to MDA’s for the day-today running costs. Non-regularoverheads relate to periodic activities of government.
100. In all years except 2012 and 2014, overhead expenditure exceeded the original budget. In 2012, the actualwas very close (marginally below) budget. Major reason for the over expenditure compared to originalbudget in 2012, was unforeseen activities that were funded from overhead costs.

Fiscal Strategy Paper (FSP) 2018-2020 – Delta State Government
Page 21
101. There were continuous drop in actual overhead expenditure from 2014 to 2016 due to prudentmanagement, reduction in overheads occasioned by fiscal constraints, and centralized spending on someoperations of government.
102. The performance from January – September 2017 which is N23.65 billion or 80.45% is very encouraging.It is anticipated that this trend will continue and the actual overhead expenditure at the end of 2017 will beless than actual overhead expenditure for 2016.
Figure 13: CRF Charges
2011 2012 2013 2014 2015 2016 2017Budget 41,427,706,881 40,569,967,479 36,201,030,693 38,327,553,261 64,603,103,611 54,536,934,205 54,536,934,205Actual 47,193,848,127 40,000,563,784 41,581,478,472 62,221,987,389 148,653,488,028 42,508,785,563Performance 113.92% 98.60% 114.86% 162.34% 230.10% 77.94%Growth -15.24% 3.95% 49.64% 138.91% -71.40%
-100.00%
-50.00%
0.00%
50.00%
100.00%
150.00%
200.00%
250.00%
0
20,000
40,000
60,000
80,000
100,000
120,000
140,000
160,000
Valu
e (N
GN
Mill
ion)
Year
CRF Charges Budget vs Actual: 2011 - 2017
103. Consolidated Revenue Fund (CRF) charges includes pensions and gratuities, public debt charges, stategovernment transfer to local governments, consolidated salaries of judicial officers, members ofcommissions and members of the DTHA. The 2015 actual is a direct consequence of restructured loans intoFGN Bond as shown in Figure 6.
104. The CRF charges in years 2011, 2013, 2014 and 2015 exceeded the original budget. In 2012 and 2016,CRF charges were less than budget.
105. There was a significant increase in CRF charges in 2015 because of substantial increases in public debtcharges. Some of the debt charges are currently being revalidated.
106. The performance from January – September 2017 which is N31.98 billion or 84.53% is consistent with the2016 performance. It is anticipated that this trend will continue and the actual CRF charges at the end of2017 will be close to actual CRF charges for 2016.
107. An accurate forecasting of debt repayment is critical for the Delta State FSP 2018-2020.

Fiscal Strategy Paper (FSP) 2018-2020 – Delta State Government
Page 22
Figure 14: Capital Expenditure
2011 2012 2013 2014 2015 2016 2017Budget 227,229,724,963 256,371,486,458 252,375,219,359 289,001,787,008 90,198,780,620 114,886,803,217 136,443,379,649Actual 113,833,485,480 129,879,005,056 160,234,272,800 112,090,486,902 46,506,458,323 49,066,199,317Performance 50.10% 50.66% 63.49% 38.79% 51.56% 42.71%Growth 14.10% 23.37% -30.05% -58.51% 5.50%
-80.00%
-60.00%
-40.00%
-20.00%
0.00%
20.00%
40.00%
60.00%
80.00%
0
50,000
100,000
150,000
200,000
250,000
300,000
350,000
Valu
e (N
GN
Mill
ion)
Year
Capital Expenditure Budget vs Actual: 2011 - 2017
108. Capital Expenditure relates to public investments and development programmes of government.109. Capital Expenditure performance from 2011 to 2015 has averaged a little over 50%. This is largely due to
a short-fall in capital receipts and the need to fund recurrent expenditure monthly. For 2016, the lowperformance of 42.71% is attributed to the crash in international oil price and fall in production level due tothe crises in the Niger Delta Region. Although the percentage achievement was relatively low comparativelybut the outcome and impact of the interventions are enormous as it was focused and need based.
110. For the first 9 months (i.e. from January to September, 2017) actual capital expenditure is N22.79 billionwhich is 33.41% performance. The trend is consistent with the performance in 2015 and 2016.
111. When considering the aggregate resource envelope for 2018-2020, it is important to be realistic otherwisesectors will be given unrealistic envelopes for planning purposes and will not be able to implementprogrammes and projects in their MTSSs.
Figure 15: Capital Expenditure Ratio
2011 2012 2013 2014 2015 2016Budget 63% 59% 63% 64% 36% 43%Actual 40% 44% 48% 38% 15% 25%
0%
10%
20%
30%
40%
50%
60%
70%
Capi
tal E
xpen
ditu
re R
atio
Year
Capital Expenditure Ratio Budget and Actual: 2011 - 2017
112. The ratio of capital expenditure rose over the period 2011 to 2013 from 40% to 48% but decreased againin 2014 and 2015 to 38% and 15% respectively and increased to 25% in 2016. The actual capitalexpenditure ratio has been significantly below budget throughout the period, largely due to non-realisationof capital receipts which would have funded the projected amount of capital expenditure.

Fiscal Strategy Paper (FSP) 2018-2020 – Delta State Government
Page 23
By Sector5
113. The total actual capital expenditure increased from approximately N130 billion in 2012 to N160 billion in2013 and decreased to N112 billion and N46.5 billion in 2014 and 2015 respectively. Expenditure by mainsectors has been relatively variable although economic sector has commanded the largest share of actualcapital expenditure in all but one of the years shown.
114. Transport (infrastructure) sector had a significant level of capital expenditure in 2012 and 2013. In 2015,the capital expenditure on Transport (infrastructure) decreased significantly.
115. Education has commanded the highest expenditure amongst the social sector, but had significant dip in2014 and 2015. The other three sectors (Health, Social Development and Information and Culture) haveall decreased by 2014 compared to 2012.
116. Actual Capital Expenditure on General Administrative has decreased from N17 billion in 2012 to N9 billionin 2015.
117. A summary of budgeted and actual capital expenditure for the period 2012 - 2015 including performancesummaries is included in the tables on the pages below.
118. Economic and Environmental sectors have been the priority of government since 2012 based on the capitalexpenditure allocations, particularly transport, urban and regional planning, and sewerage. DESOPADEC,which spends funds on development projects in the oil producing communities, also received 23.82% ofthe actual capital expenditure.
119. Agriculture, livestock and sewerage sectors have performed most poorly against budget whereas the bestperforming sectors were Education, General Administration (others) and DESPODEC.
120. The capital expenditure performance figures below are based on releases (cash accounting) not actualproject implementation therefore they may not reflect actual progress of projects.
121. In terms of performance against budget, DOSAPADEC and other general administration have enjoyed highallocations against budget (close to 100%). On the whole, performance of capital budget has been poor(less than 50%), agriculture and social development being particularly poor performing.
5 The disaggregated 2016 actual budget performance report is not available, hence the sector analysis stoppedwith 2015.

Fiscal Strategy Paper (FSP) 2018-2020 – Delta State Government
Page 24
Table 6: Capital Expenditure Budget vs Actual 2012-2015Capital Expenditure by Administrative ClassificationNo. Sector 2012 Budget 2012 Actual 2013 Budget 2013 Actual 2014 Budget 2014 Actual 2015 Budget 2015 Actual Performance Average Budget Average Actual
1 Economic 88,478,125,971 42,027,003,076 79,052,878,380 51,942,302,658 99,455,944,354 53,325,578,312 11,638,658,769 8,118,047,809 55.78% 27.83% 34.62%2 Agriculture 5,811,554,439 311,554,439 5,490,243,280 78,379,527 2,464,048,505 831,752,308 3,056,673,865 1,862,127,226 18.33% 1.68% 0.69%3 Livestock 212,873,924 16,787,317 344,611,690 16,567,866 416,382,501 28,140,415 100,284,099 23,686,375 7.93% 0.11% 0.02%4 Forestry 127,184,813 997,500 501,631,734 282,653,523 1,268,404,850 97,926,262 23,000,000 61,241,600 23.06% 0.19% 0.10%5 Fisheries 116,900,657 7,728,118 204,725,835 35,273,889 200,723,880 2,000,000 42,500,000 25,601,924 12.50% 0.06% 0.02%6 Industry 7,453,639,251 1,484,149,864 6,343,857,364 4,956,065,769 4,663,714,551 499,164,176 478,036,664 322,792,168 38.34% 1.89% 1.62%7 Energy 4,901,376,375 1,582,996,022 3,199,808,795 2,423,870,192 4,327,569,728 408,688,987 443,463,920 235,852,287 36.14% 1.29% 1.04%8 Commerce, Coop Tourism & Finance 8,577,513,450 1,303,062,195 15,174,934,712 13,023,087,960 5,203,982,702 492,528,514 646,244,617 811,149,088 52.80% 2.96% 3.48%9 Transport 61,277,083,062 37,319,727,621 47,793,064,970 31,126,403,933 80,911,117,637 50,965,377,650 6,848,455,604 4,775,597,141 63.09% 19.66% 27.67%
10 Social 50,644,639,538 18,960,574,551 46,984,952,781 20,874,334,022 58,593,493,421 10,372,744,958 12,254,394,689 7,581,182,747 34.30% 16.83% 12.87%11 Education 30,165,156,594 13,928,055,334 27,095,266,504 14,458,842,423 31,874,755,397 5,978,650,726 9,045,732,096 6,347,903,581 41.47% 9.81% 9.07%12 Health 14,125,034,536 3,152,440,063 11,553,584,511 3,938,984,905 20,063,485,706 2,842,096,018 1,924,983,910 878,363,775 22.68% 4.76% 2.41%13 Information and Culture 1,175,356,728 609,280,434 3,533,026,936 827,926,706 1,675,343,282 856,333,860 363,189,451 91,004,668 35.34% 0.67% 0.53%14 Social Development 5,179,091,680 1,270,798,720 4,803,074,830 1,648,579,987 4,979,909,036 695,664,354 920,489,232 263,910,724 24.42% 1.59% 0.86%15 Environmental 55,028,612,276 14,883,527,029 166,817,564,931 33,718,520,095 56,741,211,681 5,816,673,091 16,434,487,671 6,858,302,815 20.77% 29.47% 13.65%16 Water Resources & Water Dev 4,486,274,846 2,019,451,416 5,756,925,200 1,455,620,106 3,199,839,950 594,938,857 549,038,616 269,913,606 31.02% 1.40% 0.97%17 Sewerage 11,785,536,402 3,292,782,623 128,954,272,139 3,066,067,739 12,296,126,995 910,208,748 3,566,142,584 956,041,713 5.25% 15.64% 1.83%18 Housing 783,739,252 444,538,238 2,869,280,809 720,576,769 4,034,215,020 741,009,565 888,947,254 518,175,631 28.27% 0.86% 0.54%19 Urban & Regional Planning 37,878,750,888 9,071,212,127 28,936,107,744 28,380,065,304 37,037,986,806 3,554,860,490 11,318,467,129 5,090,725,265 40.02% 11.51% 10.27%20 Community Development 94,310,888 55,542,625 300,979,039 96,190,178 173,042,910 15,655,431 111,892,088 23,446,600 28.05% 0.07% 0.04%21 General Administration 25,220,108,673 17,758,934,742 38,078,623,267 21,845,717,846 34,211,137,554 18,841,956,266 17,371,239,491 9,017,311,321 58.72% 11.48% 15.03%22 Building 9,865,049,989 2,631,790,435 12,075,022,563 2,704,335,119 11,411,013,862 2,039,139,887 2,035,380,641 1,321,122,388 24.58% 3.54% 1.94%23 Others 15,355,058,684 15,127,144,307 26,003,600,704 19,141,382,727 22,800,123,692 16,802,816,379 15,335,858,850 7,696,188,933 73.93% 7.94% 13.09%24 Others 36,500,000,000 36,500,000,000 36,500,000,000 31,853,398,180 39,000,000,000 23,552,469,276 32,000,000,000 15,013,434,217 74.25% 14.39% 23.82%25 DESOPADEC 36,500,000,000 36,500,000,000 36,500,000,000 31,853,398,180 39,000,000,000 23,552,469,276 32,000,000,000 15,013,434,217 74.25% 14.39% 23.82%
Total 255,871,486,458 130,130,039,398 367,434,019,359 160,234,272,801 288,001,787,010 111,909,421,903 89,698,780,620 46,588,278,908 44.84% 100.00% 100.00%

Fiscal Strategy Paper (FSP) 2018-2020 – Delta State Government
Page 25
2.B.2 Debt Position6
122. A summary of the consolidated debt position for Delta State Government is provided in thetable below.
Table 7: Debt Position as at 31st December 2015Debt Sustainability Analysis
A DSA RATIO SCENARIOS: Sustainability Thresholds As at 31st December 2015Solvency Ratios Percentage
1 Total Domestic Debt/Total Recurrent Revenue 50% 59.63%2 Total Domestic Debt/IGR 150% 235.86%3 Total External Debt/Total Revenue 50% 0.44%4 Total Public Debt/Total Revenue 100% 60.06%5 Total Public Debt/State GDP Ratio 40% No GDP Figure Available
Liquidity Ratios6 External Debt Service/Total Revenue 10% 0.10%7 Total Debt Service/Total Revenue 15% 62.98%8 Domestic Debt Service/IGR 10% 248.72%
2015 ActualB PUBLIC DEBT DATA AS AT 31st DECEMBER 2015 Naira1 Total Domestic Debt 119,940,474,9182 Total External Debt 875,264,8393 Total Public Debt 120,815,739,757
4 Total Domestic Debt Service 2015 126,478,066,6725 Total External Debt Service in 2015 196,451,1116 Total Public Debt Service 126,674,517,783
C STATE GDP FOR 20151 State GDP 0
123. The external stock is related to loans from IBRD (International Bank for Reconstruction andDevelopment), IDA (International Development Association) and AfDB (African DevelopmentBank). Deductions for servicing external debt are deducted directly from Statutory Allocationand passed to the Federal Debt Management Office (DMO) to service the debt.
124. Internal debt stock is related to infrastructure development bond of 50 billion NGN taken outin 2011 at an interest rate of 14% and a term of 7 years, commercial bank loan of 42.74billion NGN, and judgement debt of 173.85 million NGN. Although the State has surpassed thesustainable threshold, these benchmark figures are also obsolete given the development inthe macroeconomic space over the said period.
6 The Debt positon and analysis is also as at 31st December, 2015.

Fiscal Strategy Paper (FSP) 2018-2020 – Delta State Government
Page 26
Section 3 Fiscal Framework
3.A Macroeconomic Framework
125. National Inflation (Consumer Prices) and real GDP growth are taken from the NBS and ERGP2017 - 2020 documents. The crude oil production benchmark is based on the 2017 Federalbudget assumptions. However, the daily projected oil production was reduced to 1.9mbpdbecause of Nigeria performance in the last 2 years. The production benchmark, oil price andNGN:USD exchange rate of N305:$1 for 2018 - 2020 is based on the proposed price andexchange rate in the Federal Fiscal Strategy Paper 2018 - 2020. The fundamentals for theDelta State Macroeconomic Framework are explained in detail in paragraphs 36 – 57 above.
Macro-Economic FrameworkItem 2018 2019 2020National Inflation 12.42% 13.39% 9.90%National Real GDP Growth 4.80% 4.50% 7.00%Oil Production Benchmark (MBPD) 2.30 2.00 2.30Oil Price Benchmark $45.00 $50.00 $52.00NGN:USD Exchange Rate 305 305 305
3.B Fiscal Framework and Assumptions
Policy Statement126. The overriding thrust of Delta State moving forward is sustainable development. The principal
goal is to use available resources to develop the non-oil sector of the state economy to reduceits high dependence on crude oil and gas revenues.
127. The strategic framework and economic direction in this regard, is hinged on the S.M.A.R.T.agenda. This is underpinned by five building blocks of economic growth strategy; effectivemaximization of resources; fiscal adjustment strategy; maximization of private investment andpublic spending; human capital development and effective collaboration, cooperation andsequencing of activities. The focus is to use the opportunity of the current economic situationto diversify the economic base of the state and pursue economic growth and developmentbased on the non-oil sector. Thus, the emphasis is being shifted to such sectors asagriculture, tourism and entertainment, commerce and industry.
Objectives and Targets128. The key targets from a fiscal perspective are:
A medium term target of 60-40 for infrastructure investment to Recurrent Expenditure(in favour of capital items) through reduced recurrent expenditure;
A medium term target to increase the proportion of recurrent revenue flowing from IGR(hence reducing dependence on federal transfers), and longer term to fund allrecurrent expenditure through IGR;
Bring debt position in line with federal debt management office benchmarks;
Complete all ongoing projects in the long term to avoid abandoning of projects;
Budget for pending contractual commitments in line with IPSAS requirements;
Create efficiencies in business processes to reduce wastage through establishment ofbest practice in public procurement processes.

Fiscal Strategy Paper (FSP) 2018-2020 – Delta State Government
Page 27
3.C Indicative Three Year Fiscal Framework
129. The indicative three-year fiscal framework for the period 2018 - 2020 is presented in the tablebelow.
Table 8: Medium Term Fiscal FrameworkRecurrent Revenue 2018 2019 2020Statutory Allocation/Net Derivation 168,056,627,329 186,500,620,290 194,642,342,810VAT 10,767,532,297 11,049,456,914 11,423,353,072IGR 71,360,419,715 78,838,398,756 86,872,027,609Other Federation Account Receipts 10,000,000,000 10,000,000,000 10,000,000,000Total Recurrent Revenue 260,184,579,341 286,388,475,961 302,937,723,491
Recurrent ExpenditureCRF Charges 54,536,934,205 54,536,934,205 54,536,934,205Personnel 69,060,152,349 70,441,355,396 71,850,182,504Overheads 37,289,002,501 39,153,452,626 41,111,125,257Total 160,886,089,055 164,131,742,227 167,498,241,967
Transfer to Capital Account 99,298,490,286 122,256,733,734 135,439,481,525
Capital ReceiptsGrants 2,250,000,000 2,250,000,000 2,250,000,000Other Capital Receipts 0 0 0Total 2,250,000,000 2,250,000,000 2,250,000,000
ReservesContingency Reserve 0 0 0Planning Reserve 0 0 0Total Reserves 0 0 0
Capital Expenditure 123,648,490,286 149,506,733,734 167,689,481,525Discretional Funds 123,648,490,286 149,506,733,734 167,689,481,525Non-Discretional Funds 0 0 0
Net Financing 22,100,000,000 25,000,000,000 30,000,000,000
Total Budget Size 284,534,579,341 313,638,475,961 335,187,723,491
RatiosGrowth in Recurrent Revenue 21.01% 10.07% 5.78%Growth in Recurrent Expenditure 1.98% 2.02% 2.05%Capital Expenditure Ratio 43.46% 47.67% 50.03%Deficit to Total Expenditure 7.77% 7.97% 8.95%
Fiscal Strategy Paper (FSP) 2018-2020 – Delta State Government
Page 28
3.C.1 Assumptions
130. Statutory Allocation/Net Derivation – is estimated using an elasticity based forecastusing the oil price of $45 per barrel (pb), NGN:USD Exchange benchmarks of N305 to $1 andproduction benchmark of 2.3 million barrels per day (mbpd). The NGN:USD exchange rate andcrude oil price are consistent with the benchmark contained in the federal fiscal strategy paper2015-2017. The production of 2.3 mbpd estimated for 2018 is in line with the advice of theNational Economic Council. For non-oil revenue, it is assumed that the current reforms by theFederal Government, especially in Federal Inland Revenue and Nigeria Custom Services willincrease the non-oil revenue flowing to the federation account.
131. VAT – is based on elasticity forecast using the combined change in GDP and inflation rate.The estimate for 2018 is in line with the current rate of collections. This forecast should berevisited if there are any changes to the VAT rates as proposed in the ERGP 2017 - 2020.
132. Other FAAC Distributions. It is assumed that the exchange rate will appreciate slightly inthe medium term and the exchange gains will continue to be distributed. It is assumed thatexcess revenue from other sources will also be shared by the three tiers of Government. Anotional figure on N10 billion is the estimate for 2018.
133. Internally Generated Revenue (IGR) – the IGR performance for half year 2017 is higherthan the performance for 2014, 2015 and 2016. 2018 – 2020 IGR forecast is based on a 3-year moving average growth rate. When compared to other moving averages and elasticitybased forecasts, the 3 year moving average gave a figure that was in consistent with the 2017half year performance.
134. Grants – SUBEB is assumed at N2 billion per annum from 2018 -2020.
135. Financing (Net Loans) – Net financing of N22b for 2018 including commercial bank loan.136. CRF Charges – includes current pension liabilities plus contributions, gratuities, internal and
external loan principal repayments, LG pension contribution, 10% IGR to LG, LG educationfund and statutory emoluments. Contributory Pensions are assumed to grow at the same rateas personnel costs, LG IGR transfer is a function of IGR in the fiscal framework and debtrepayment is based on figures from the state DMO. All other items are assumed to remainthe same as basis as 2017 budget.
137. Personnel – first quarter January – March 2017 figures indicates that personnel cost grew byabout 2% over the amount spent from January – March 2016. 2% growth is thereforeassumed in 2018 and 2020 based on the current growth rate.
138. Overheads – first quarter January – March 2017 figures indicates that overhead cost grewby about 4.5% over the amount spent from January – March 2016. 5% growth is thereforeassumed in 2018 and 2020 based on the current growth rate.
139. Capital Expenditure – This is based on recurrent account surplus and capital receipts.
3.C.2 Fiscal Trends
140. Based on the above envelope, plus actual figures for 2012-2017 (using the same basis forforecasting as noted in the sub-sections within section 3.B), the trend from historical actual toforecast can be seen for revenue in the line graph below.

Fiscal Strategy Paper (FSP) 2018-2020 – Delta State Government
Page 29
Figure 16: Delta State Revenue Trend
2011 Actual 2012 Actual 2013 Actual 2014 Actual 2015 Actual 2016 Actual 2017 Forecast 2018 Forecast 2019 Forecast 2020 ForecastStat.Allocation 145,840,991,90 153,569,227,73 208,150,556,36 188,299,423,04 133,767,527,59 89,117,061,863 131,991,600,17 168,056,627,32 186,500,620,29 194,642,342,81VAT 8,467,586,865 9,676,839,414 10,124,911,725 9,619,182,846 9,265,096,195 9,265,096,195 10,421,706,202 10,767,532,297 11,049,456,914 11,423,353,072Total IGR 35,036,557,501 46,288,267,186 51,614,755,266 42,558,692,782 52,989,978,399 59,002,587,764 62,604,017,710 71,360,419,715 78,838,398,756 86,872,027,609Other FederationAccount Receipts 63,128,481,141 62,542,789,708 17,653,044,618 4,427,865,945 0 0 10,000,000,000 10,000,000,000 10,000,000,000 10,000,000,000
Capital Receipts 50,000,000,000 22,444,468,410 85,901,070,276 56,030,377,509 0 24,341,472,933 64,450,000,000 24,350,000,000 27,250,000,000 32,250,000,000
0
50,000
100,000
150,000
200,000
250,000M
illio
n N
aira
Year
Revenue Trend: Actual 2011 - 2016 and Forecast 2017 - 2020

Fiscal Strategy Paper (FSP) 2018-2020 – Delta State Government
Page 30
3.D Fiscal Risks
141. The analysis and forecasting basis as laid out above implies some fiscal risks, including butnot limited to:
Table 9: Risk Matrix
Risk Likelihood Impact Mitigation and Reaction
Delta State’s StatutoryAllocation/Net Derivation isdirectly linked to the level ofoil production in the state.Any shock (as currentlybeing experienced) to oilproduction will result indecreased Statutory transferand will also threaten IGRdue to decreased secondaryeconomic activity in the state
Very High Very High 1. Projections for 2018-2020 areconservative2. To build on efforts to decreasereliance on oil based revenues overthe medium term3. Diversification of IGR sources
Threat of terrorism increasesthe cost of security (reducingfunds for capitaldevelopment) and poses athreat to economic activitynationally (Federal transfersaffected)
High High 1. Youth employment2. Improved internal securitythrough investment, stakeholderconsultation, training of securitypersonnel
Threat to economic activityand business of governmentin the state due to ecologicalfactors including erosion andflood
Medium Medium 1. Reliance of meteorologicalforecasts2. Pro-active on forecasts
3. Appropriate spending to maintainassets and create new assets thathelp build ecological resilience
4. Public awareness on climatechange and resilience and otherenvironment issues
Threat to oil revenues fromglobal economic and politicalfactors, resulting in drop inoil revenue
High Very High 1. Reduced reliance on Oil revenuesthrough long term policies such asDelta Beyond Oil which buildeconomic independence andincrease IGR
2. Increased efficiency in recurrentexpenditure to allow maximumfunding for Capital Expenditure3. Setting aside between 5% and10% of total recurrent revenue ascontingency reserve fund. Fund setaside to build the State reserve fund
Inaccurate estimation ofresources resulting inoverestimation of
Medium/High
High 1. Scientific forecasting techniquesused to estimate recurrent revenue

Fiscal Strategy Paper (FSP) 2018-2020 – Delta State Government
Page 31
expenditure envelope 2. Awareness raising on importanceof prudent budgeting to allstakeholders
3. Clear policy of prioritisation forcapital expenditure projects4. Linkage of revenue sources(particularly capital receipts) tospecific projects
5. Clear and transparent budgetdocumentation in line with IPSASrequirements and international bestpractice
142. It should be noted that no budget is without risk. The ongoing implementation of the 2017budget should be closely monitored, as well as the security situation and their impact onthe fiscal and economic outlook.
Fiscal Strategy Paper (FSP) 2018-2020 – Delta State Government
Page 32
Section 4 Budget Policy Statement
4.A Budget Policy Thrust
143. This administration has a clear vision of what it wants to do in the life of its tenure ascaptured in the S.M.A.R.T. agenda – the focus is on employment opportunities, aflourishing agriculture and agro-business sector, effective health and education systems,renewed urban infrastructure and enhanced security and peace to bolster economic growthand development. The agenda has five policy thrusts:
Strategic wealth creation projects and provisions of jobs for all Deltans; Meaningful peace building platforms aimed at political and social harmony;
Agricultural reforms and accelerated industrialisation;
Relevant health and education policies; and
Transform environment through urban renewal.
4.B Sector Allocations (3 Year)
144. The total forecast budget size for 2018 fiscal year as explained in Section 3.C above isN284,534,579,341 of which the sum of N123,648,490,286 will be for capitalexpenditure. Based on the principles of prudent fiscal management the sum ofN13,862,206,504 is proposed to be set aside as planning/contingency reserve.Consequently, the allocated total fund for 2018 budget is N270,672,372,837 of whichthe sum of N109,786,283,782 will be for capital expenditure.
145. Based on the budget policy thrust derived from the S.M.A.R.T agenda of the currentadministration an indicative capital allocation to the MDAs for 2018 is shown in table 10below.

Fiscal Strategy Paper (FSP) 2018-2020 – Delta State Government
Page 33
Table 10: Indicative MDAs Capital Expenditure Ceilings 2018-2020MDA % 2018 2019 2020
Total Capital Expenditure 100% 109,786,283,782 127,121,561,647 167,689,481,525Directorate of Government House 3.76% 4,126,500,964 4,778,076,355 6,302,889,426Deputy Governor’s Office 0.16% 177,251,575 205,239,636 270,737,141Delta State Capital Territory 2.54% 2,783,540,311 3,223,061,926 4,251,627,940State Emergency Management Agency 0.03% 36,831,496 42,647,197 56,257,068Direct Labour Agency 0.65% 708,917,442 820,855,659 1,082,812,845Job Creation Office 2.73% 2,999,977,186 3,473,674,231 4,582,217,392Secretary to the State Government Headquarters 0.77% 848,474,778 982,449,128 1,295,975,150Directorate of Cabinet and Administration 0.01% 14,272,205 16,525,789 21,799,614Delta State Pension Bureau 0.02% 20,349,402 23,562,576 31,082,030Local Government Pension Bureau 0.02% 24,861,260 28,786,858 37,973,521Bureau of Special Duties Hqtrs 0.36% 390,670,622 452,357,597 596,717,110Directorate of Establishment and Pension 0.05% 49,736,215 57,589,575 75,967,961Directorate of Political and Security 0.03% 35,450,315 41,047,927 54,147,428State House of Assembly 0.59% 646,215,148 748,252,659 987,040,269House of Assembly Commission 0.03% 31,767,165 36,783,208 48,521,721Ministry of Information Main 0.30% 333,463,157 386,117,061 509,337,433Orientation and Communication 0.03% 27,623,622 31,985,398 42,192,801Office of the Head of Service 0.06% 60,771,968 70,367,875 92,824,163Office of the Auditor General State 0.08% 82,870,866 95,956,194 126,578,404Office of the Auditor General Local Government 0.06% 67,126,276 77,725,530 102,529,843Civil Service Commission 0.02% 18,231,591 21,110,363 27,847,249Local Government Service Commission 0.01% 11,651,644 13,491,441 17,796,924Delta State Independent Electoral Commission 0.02% 22,697,409 26,281,335 34,668,418Ministry of Agriculture & Natural Resources Hqtrs 0.63% 687,762,482 796,360,327 1,050,500,392Ministry of Finance Hqtrs 3.35% 3,676,723,715 4,257,279,182 5,615,891,824Office of the Accountant General 0.06% 66,204,614 76,658,337 101,122,080Board of Internal Revenue 1.01% 1,104,944,880 1,279,415,915 1,687,712,050Ministry of Commerce and Industry Hqtrs 2.23% 2,452,688,564 2,839,968,617 3,746,279,221Directorate of Science and Technology Hqtrs 0.38% 414,836,762 480,339,576 633,628,894Directorate of Transport Hqtrs 0.97% 1,063,867,192 1,231,852,051 1,624,969,273Ministry of Energy Hqtrs 1.00% 1,093,435,056 1,266,088,687 1,670,131,745Rural Development Agency 0.53% 586,043,758 678,580,193 895,133,440Ministry of Oil and Gas Hqtrs 0.16% 170,761,615 197,724,910 260,824,263Ministry of Works Hqtrs 27.28% 29,951,150,491 34,680,443,607 45,747,908,790Directorate of Culture and Tourism Hqtrs 0.40% 442,208,149 512,032,911 675,436,427Ministry of Economic Planning Hqtrs 2.13% 2,343,170,663 2,713,157,816 3,578,999,672Ministry of Water Resources Hqtrs 1.18% 1,298,467,451 1,503,495,741 1,983,301,794Ministry of Housing Hqtrs 2.50% 2,745,972,185 3,179,561,785 4,194,245,731Ministry of Lands, Survey & Urban Development Hqtrs 1.57% 1,721,323,148 1,993,120,444 2,629,178,950Judiciary Service Commission 0.01% 8,148,968 9,435,692 12,446,876High Court of Justice 0.87% 959,193,783 1,110,650,689 1,465,089,287Customary Court of Appeal 0.42% 463,438,662 536,615,727 707,864,282Ministry of Justice Hqtrs 0.13% 138,073,662 159,875,523 210,896,115DESOPADEC 23.48% 25,782,047,209 29,853,038,019 39,379,947,843Directorate of Youth Development Hqtr 0.19% 208,742,504 241,702,990 318,836,935Ministry of Women Affairs and Social Development Hqtrs0.29% 318,595,624 368,901,941 486,628,503Ministry of Basic and Secondary Education 7.56% 8,296,500,916 9,606,520,198 12,672,219,963Ministry of Higher Education 2.05% 2,255,573,548 2,611,729,097 3,445,202,312Ministry of Health Hqtrs 4.87% 5,342,458,157 6,186,033,451 8,160,163,615Ministry of Environment Hqtrs 2.08% 2,278,504,337 2,638,280,663 3,480,227,199Delta State Sports Commission 0.29% 314,905,321 364,628,939 480,991,871Directorate of Local Government 0.06% 69,041,276 79,942,908 105,454,846Directorate of Chieftaincy Affairs 0.01% 12,246,472 14,180,193 18,705,475

Fiscal Strategy Paper (FSP) 2018-2020 – Delta State Government
Page 34
Section 5 Summary of Key Points and Recommendations146. Below is summary of key points arising in this document:
The State should sustain its PFM reform programme particularly as it relates to theimplementation of IPSAS, update to the SAP based SIFMIS and budget reforms, aswell as targeting enhanced IGR performance in order to achieve its fiscal and budgetpolicy objective and priorities;
The State must continue to monitor performance of its mineral based revenues inorder to ensure estimates are consistent with the latest development globally andwithin the Federal Government’s budget process (i.e. any changes to the crude oilbenchmarks (production quota and price) as well as exchange rate for 2018 andbeyond);
Better data recording and sharing between PFM oversight agencies will enable theState to have a clearer picture of its current fiscal position and hence help makebetter informed decisions.