Embed Size (px)
Citation preview
DemandDemand
1212thth Economics Economics
Chapter 4 Section 1Chapter 4 Section 1

DemandDemand
DemandDemand – the desire to own something – the desire to own something and the ability to pay for it.and the ability to pay for it.
DemandDemand
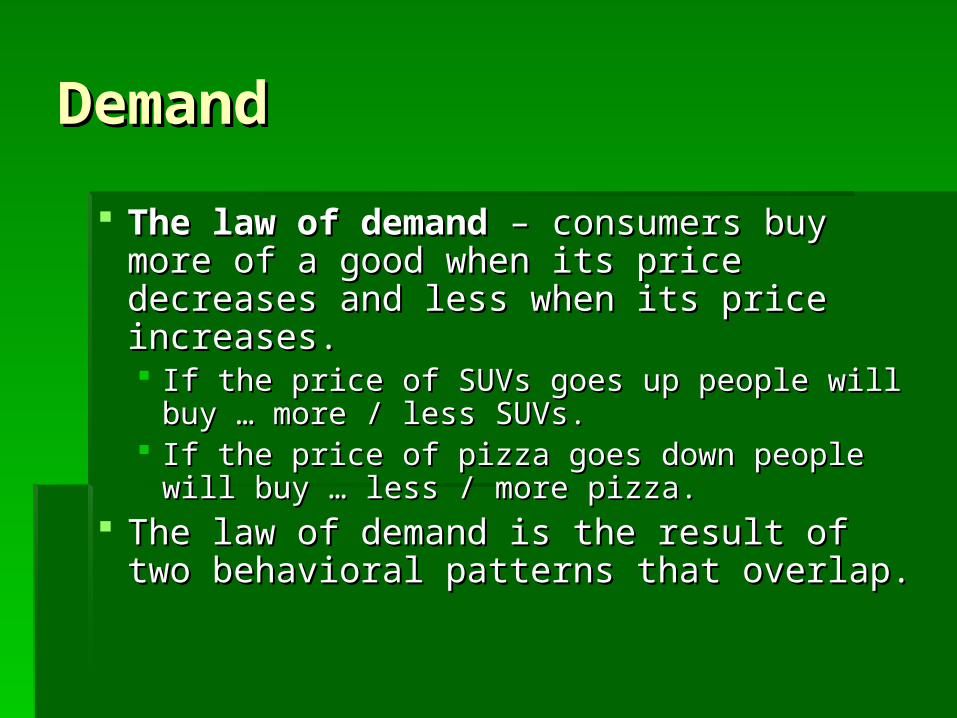
The law of demandThe law of demand – consumers buy – consumers buy more of a good when its price decreases more of a good when its price decreases and less when its price increases. and less when its price increases. If the price of SUVs goes up people will buy If the price of SUVs goes up people will buy
… more / less SUVs.… more / less SUVs. If the price of pizza goes down people will If the price of pizza goes down people will
buy … less / more pizza.buy … less / more pizza. The law of demand is the result of two The law of demand is the result of two
behavioral patterns that overlap.behavioral patterns that overlap.
DemandDemand
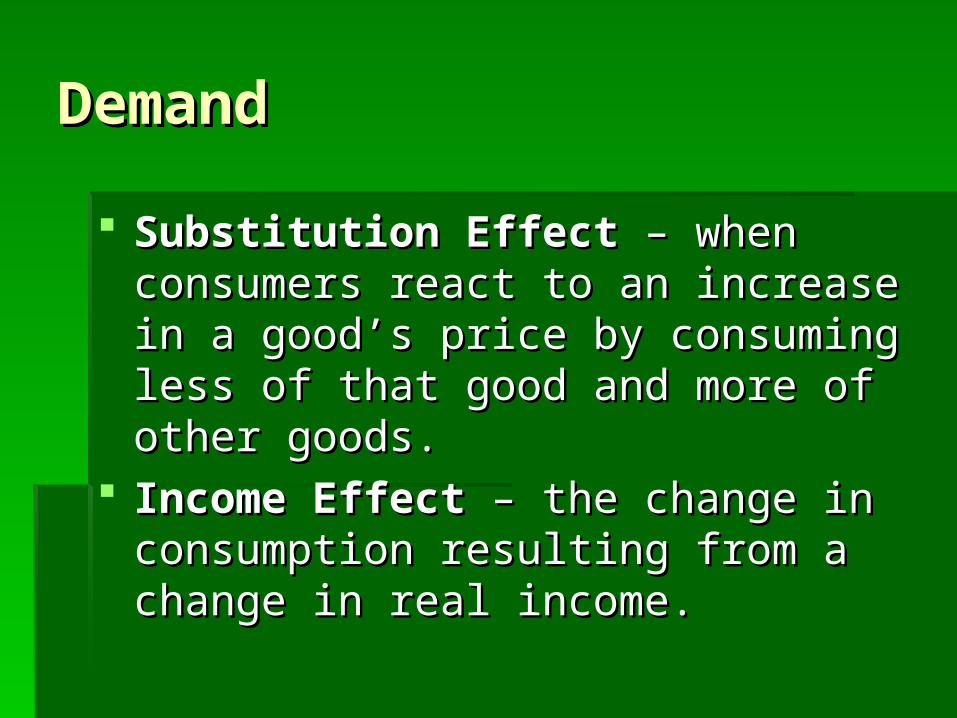
Substitution EffectSubstitution Effect – when consumers – when consumers react to an increase in a good’s price by react to an increase in a good’s price by consuming less of that good and more of consuming less of that good and more of other goods.other goods.
Income EffectIncome Effect – the change in – the change in consumption resulting from a change in consumption resulting from a change in real income.real income.
DemandDemand
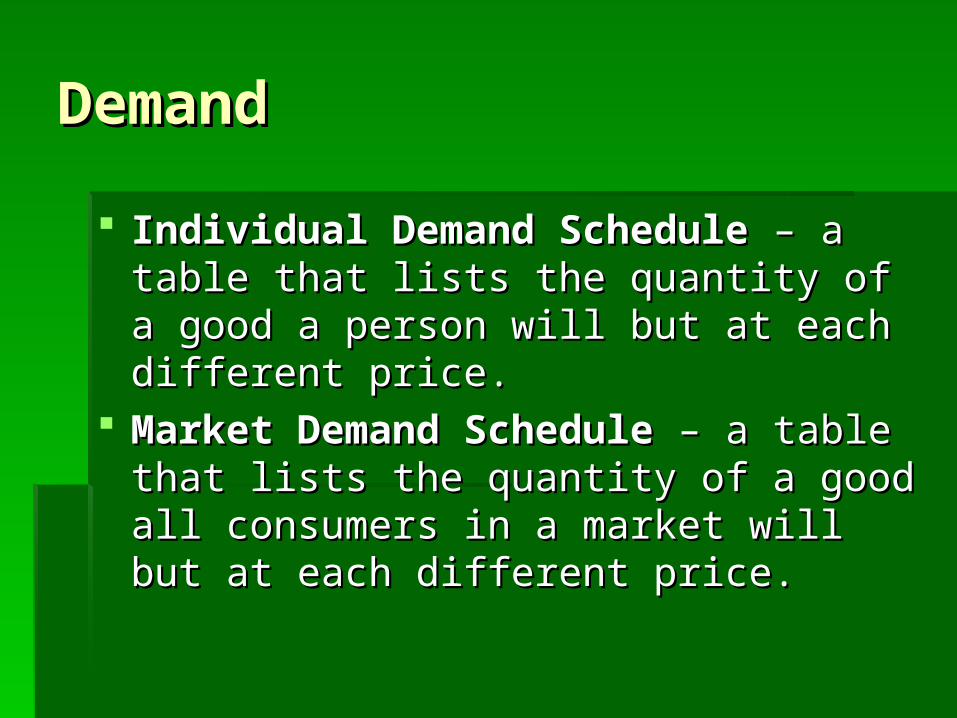
Individual Demand ScheduleIndividual Demand Schedule – a table – a table that lists the quantity of a good a person that lists the quantity of a good a person will but at each different price.will but at each different price.
Market Demand ScheduleMarket Demand Schedule – a table that – a table that lists the quantity of a good all consumers lists the quantity of a good all consumers in a market will but at each different in a market will but at each different price.price.
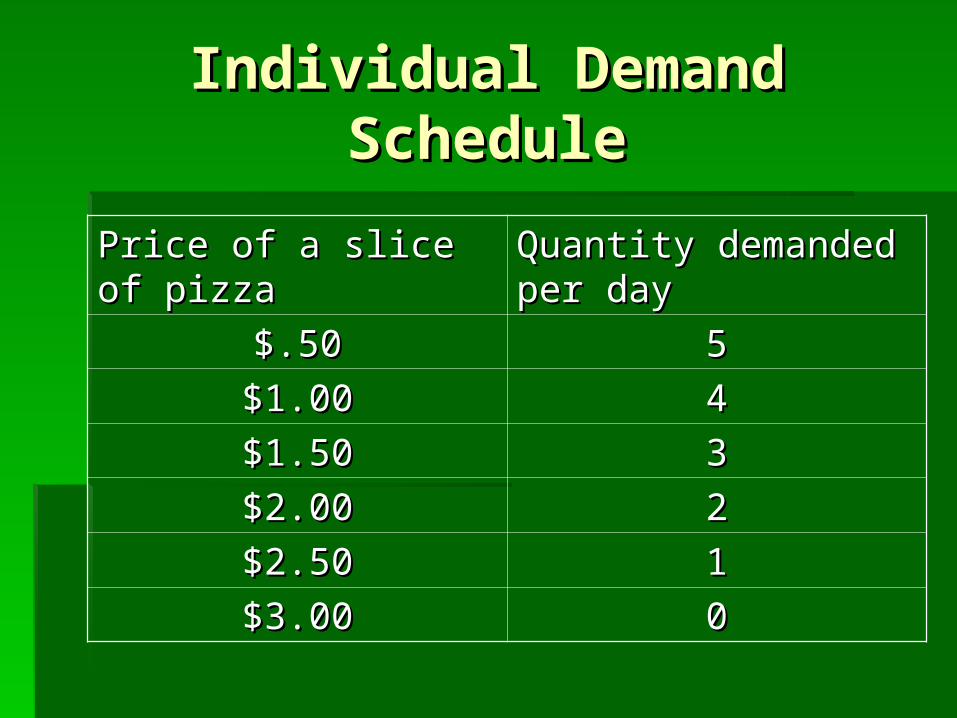
Individual Demand Individual Demand ScheduleSchedule
Price of a slice of pizzaPrice of a slice of pizza Quantity demanded per Quantity demanded per dayday
$.50$.50 55
$1.00$1.00 44
$1.50$1.50 33
$2.00$2.00 22
$2.50$2.50 11
$3.00$3.00 00
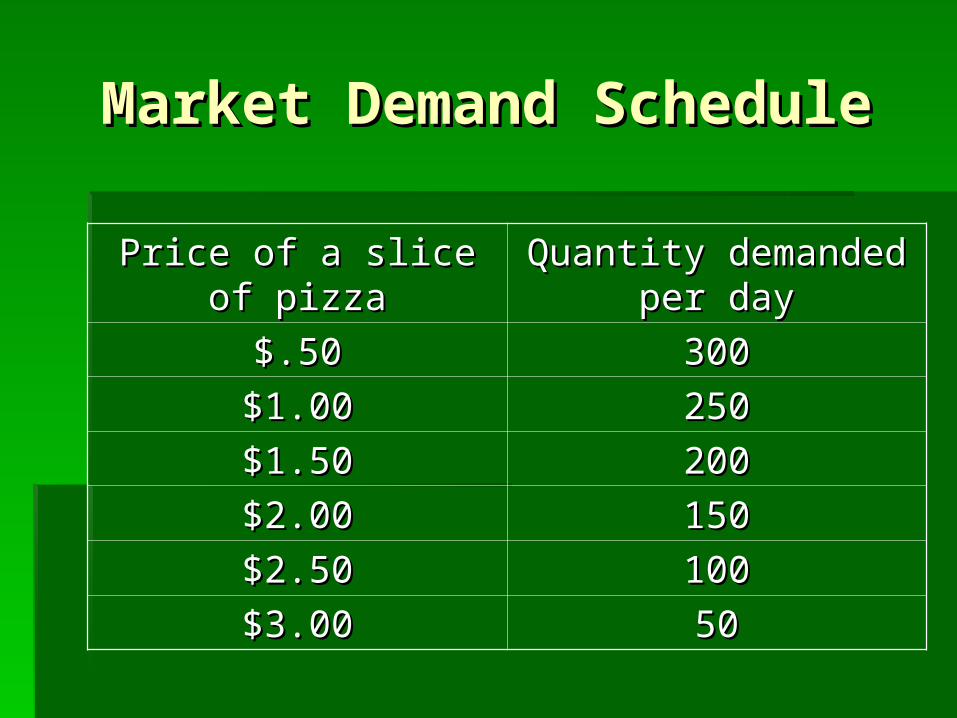
Market Demand ScheduleMarket Demand Schedule
Price of a slice of pizzaPrice of a slice of pizza Quantity demanded per Quantity demanded per dayday
$.50$.50 300300
$1.00$1.00 250250
$1.50$1.50 200200
$2.00$2.00 150150
$2.50$2.50 100100
$3.00$3.00 5050
DemandDemand
Demand CurveDemand Curve – a graphic representation of a – a graphic representation of a demand schedule. The demand curve shows demand schedule. The demand curve shows only the relationship between the price of the only the relationship between the price of the good and the quantity that will be purchased. It good and the quantity that will be purchased. It assumes all other factors that may influence assumes all other factors that may influence demand (price of other goods, income, or demand (price of other goods, income, or quality of the good) are held constant. quality of the good) are held constant.
All demand schedules and curves reflect the All demand schedules and curves reflect the law of demand.law of demand.
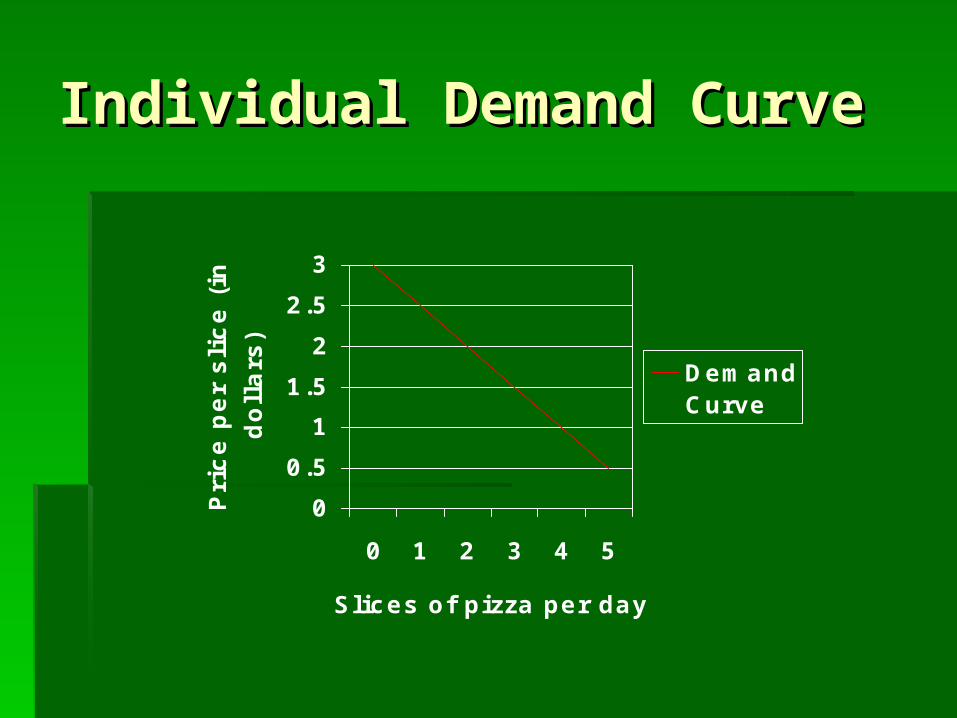
Individual Demand CurveIndividual Demand Curve
0
0.5
1
1.5
2
2.5
3
0 1 2 3 4 5
Slices of pizza per day
Pri
ce
pe
r sli
ce
(in
do
lla
rs)
DemandCurve
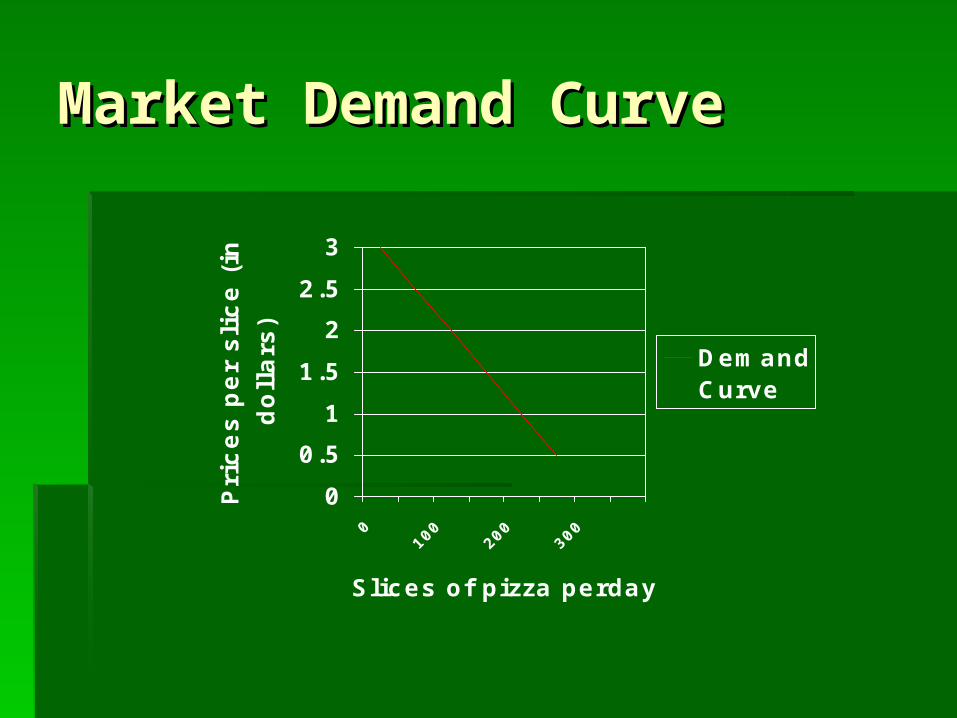
Market Demand CurveMarket Demand Curve
0
0.5
1
1.5
2
2.5
3
010
020
030
0
Slices of pizza perday
Pri
ce
s p
er
sli
ce
(in
do
lla
rs)
DemandCurve

Shifts of the Shifts of the Demand CurveDemand CurveChapter 4 Section 2Chapter 4 Section 2
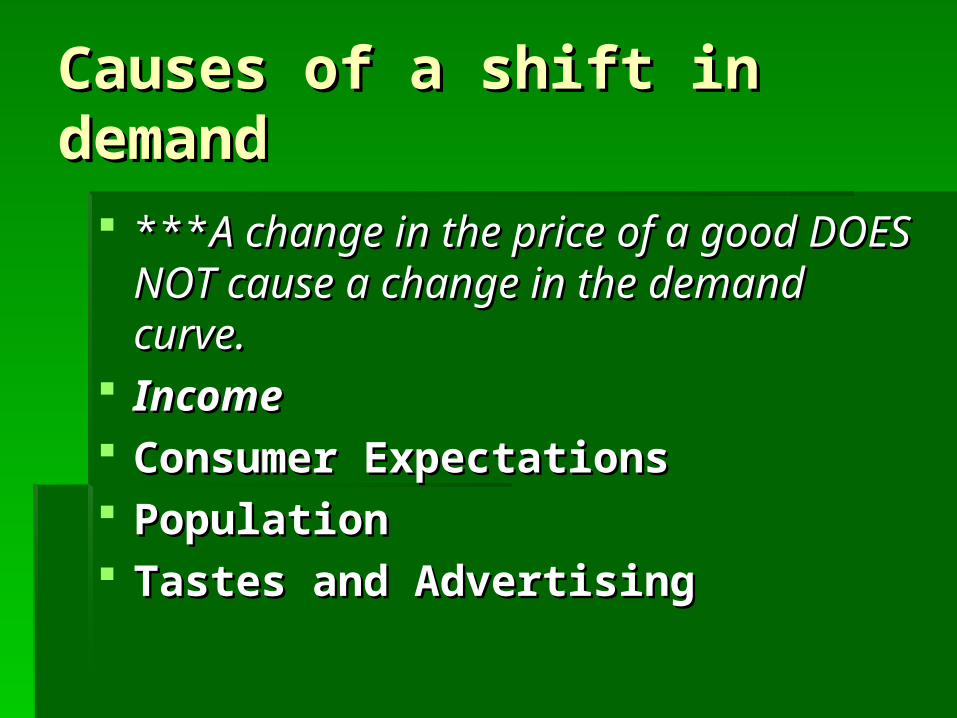
Causes of a shift in Causes of a shift in demanddemand
******A change in the price of a good DOES A change in the price of a good DOES NOT cause a change in the demand NOT cause a change in the demand curve.curve.
IncomeIncome Consumer ExpectationsConsumer Expectations PopulationPopulation Tastes and AdvertisingTastes and Advertising
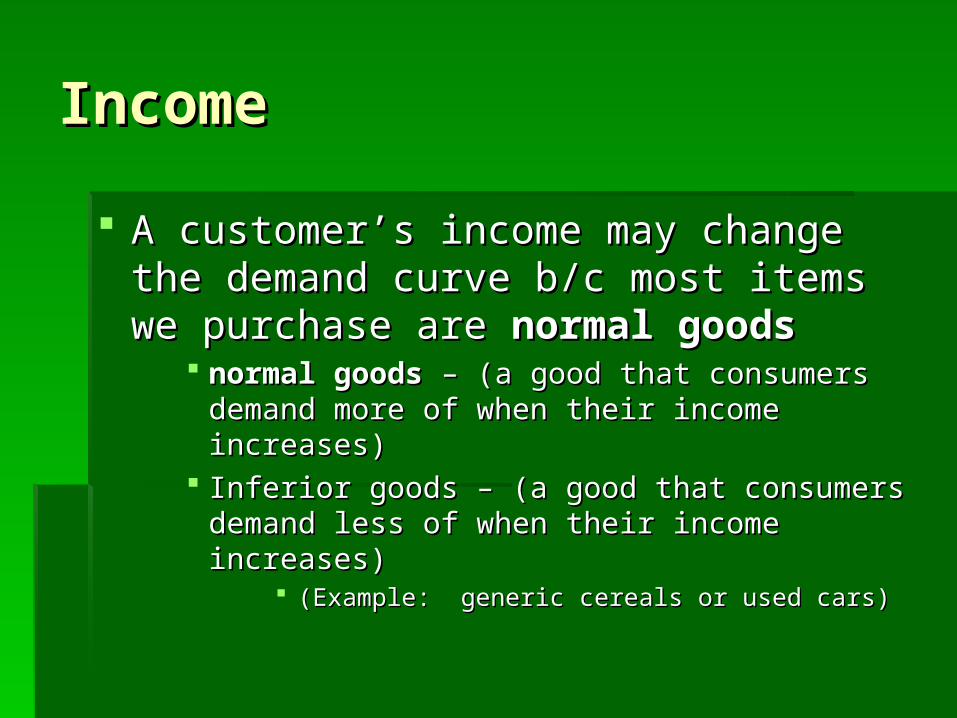
IncomeIncome
A customer’s income may change the A customer’s income may change the demand curve b/c most items we demand curve b/c most items we purchase are purchase are normal goodsnormal goods
normal goodsnormal goods – (a good that consumers – (a good that consumers demand more of when their income increases) demand more of when their income increases)
Inferior goods – (a good that consumers demand Inferior goods – (a good that consumers demand less of when their income increases)less of when their income increases)
(Example: generic cereals or used cars) (Example: generic cereals or used cars)
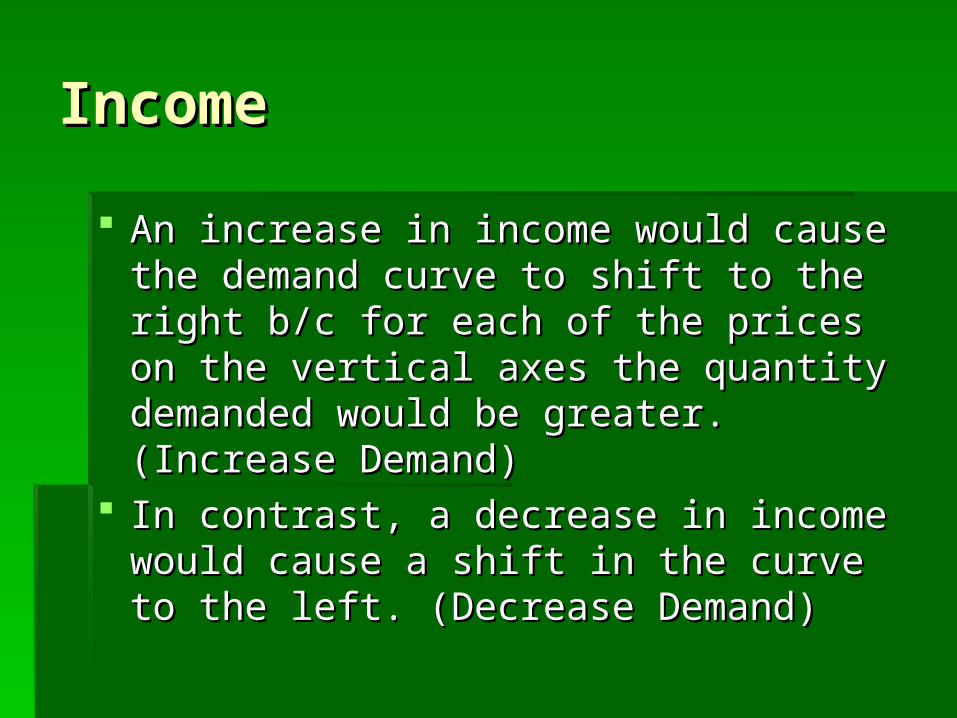
IncomeIncome
An increase in income would cause the An increase in income would cause the demand curve to shift to the right b/c for demand curve to shift to the right b/c for each of the prices on the vertical axes each of the prices on the vertical axes the quantity demanded would be greater. the quantity demanded would be greater. (Increase Demand)(Increase Demand)
In contrast, a decrease in income would In contrast, a decrease in income would cause a shift in the curve to the left. cause a shift in the curve to the left. (Decrease Demand) (Decrease Demand)
Consumer Expectations Consumer Expectations
The current demand for a good is The current demand for a good is positively related to its future price. positively related to its future price.
If you expect the price to rise, your current If you expect the price to rise, your current demand will rise, meaning you will buy the good demand will rise, meaning you will buy the good sooner. If you expect the price to decrease, you sooner. If you expect the price to decrease, you current demand will drop, and you will wait for the current demand will drop, and you will wait for the lower price.lower price.
Population Population
Changes in the size of the population will Changes in the size of the population will affect the demand of certain products. affect the demand of certain products.
For example, when soldiers returned from WWII, For example, when soldiers returned from WWII, record numbers of them married and had record numbers of them married and had children causing an increase in demand for baby children causing an increase in demand for baby products, producing the generation known as the products, producing the generation known as the “Baby boomers” “Baby boomers”
Consumer Tastes and Consumer Tastes and Advertising Advertising
Changes in taste and preferences cannot Changes in taste and preferences cannot be explained by changes in income or be explained by changes in income or population.population.
Advertising is considered a factor that Advertising is considered a factor that shifts demand curves b/c it plays an shifts demand curves b/c it plays an important role in trends.important role in trends.
Elasticity of Elasticity of DemandDemandChapter 4 Section 3Chapter 4 Section 3
Elasticity of DemandElasticity of Demand
Elasticity of Demand – a measure of how Elasticity of Demand – a measure of how consumers react to a change in price.consumers react to a change in price.
(the way consumers respond to price (the way consumers respond to price changes.)changes.)
Elasticity of DemandElasticity of Demand
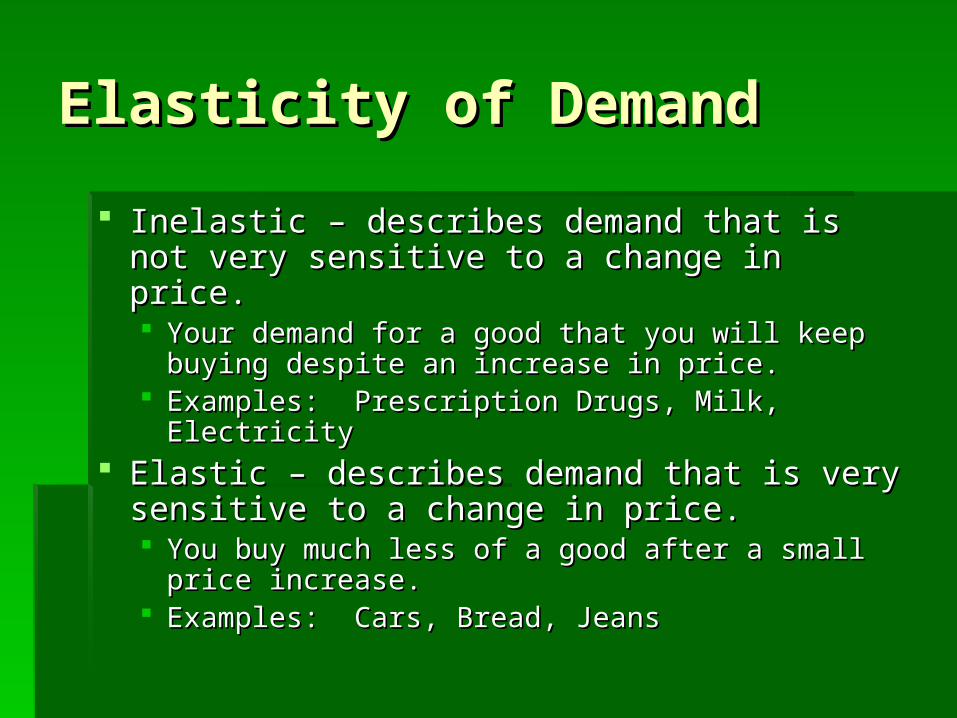
Inelastic – describes demand that is not very Inelastic – describes demand that is not very sensitive to a change in price.sensitive to a change in price. Your demand for a good that you will keep buying Your demand for a good that you will keep buying
despite an increase in price.despite an increase in price. Examples: Prescription Drugs, Milk, ElectricityExamples: Prescription Drugs, Milk, Electricity
Elastic – describes demand that is very Elastic – describes demand that is very sensitive to a change in price.sensitive to a change in price. You buy much less of a good after a small price You buy much less of a good after a small price
increase.increase. Examples: Cars, Bread, JeansExamples: Cars, Bread, Jeans
Calculating ElasticityCalculating Elasticity
Take the percentage change in the Take the percentage change in the demand of a good, and divide this demand of a good, and divide this number by the percentage change in the number by the percentage change in the price of the good.price of the good.
Calculating ElasticityCalculating Elasticity
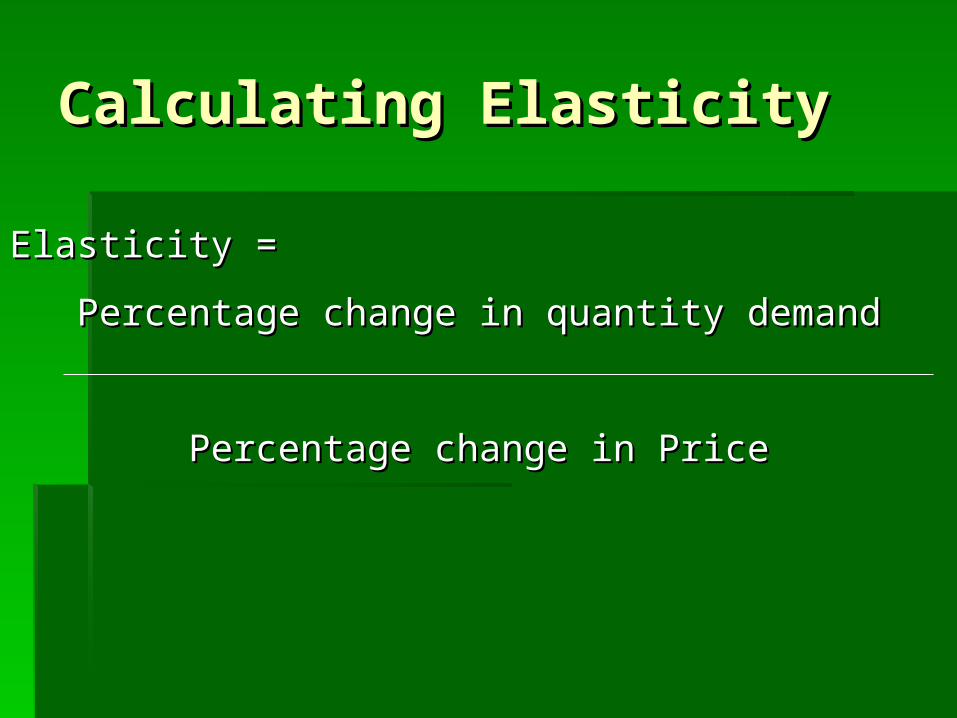
Elasticity =Elasticity =
Percentage change in quantity demandPercentage change in quantity demand
Percentage change in PricePercentage change in Price

Calculating ElasticityCalculating Elasticity
Percentage Change =
Original Number – New Number
x 100
Original Number
Calculating ElasticityCalculating Elasticity
0
1
2
3
4
5
6
7
5 10 15 20 25 30
Quantity
Pri
ce
Demand
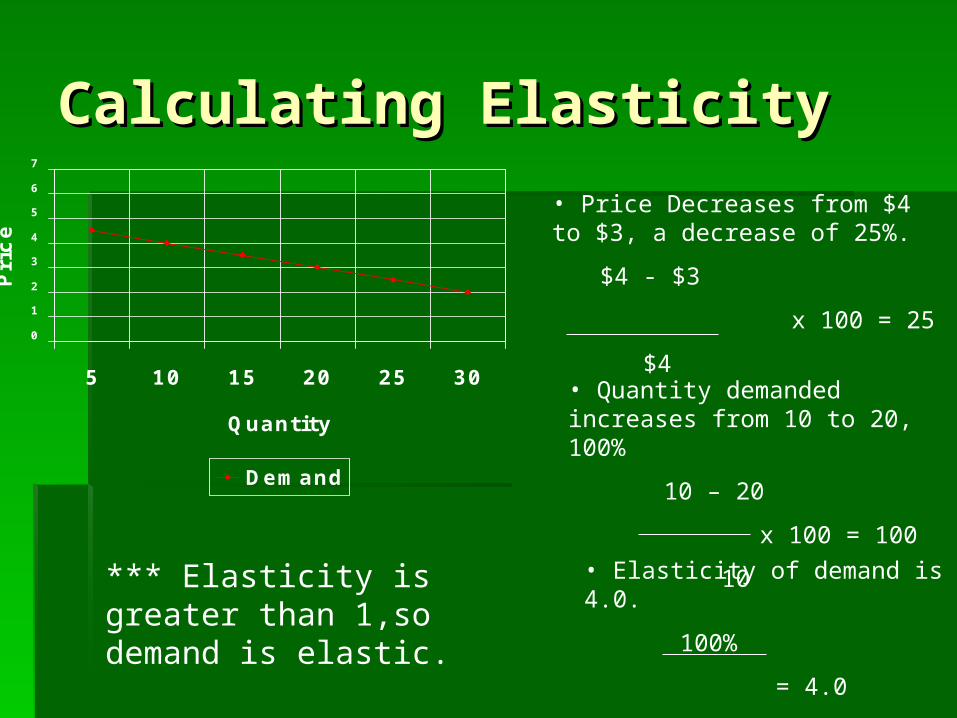
• Price Decreases from $4 to $3, a decrease of 25%.
$4 - $3
x 100 = 25
$4• Quantity demanded increases from 10 to 20, 100%
10 – 20
x 100 = 100
10• Elasticity of demand is 4.0.
100%
= 4.0
25%
*** Elasticity is greater than 1,so demand is elastic.
Elasticity of DemandElasticity of Demand
If elasticity is If elasticity is greatergreater than one, the than one, the demand is elastic.demand is elastic.
If elasticity is If elasticity is lessless than one, the demand than one, the demand is inelastic.is inelastic.
If elasticity is If elasticity is equalequal to one, the demand to one, the demand is unitary elastic.is unitary elastic. Unitary elastic – describes demand whose Unitary elastic – describes demand whose
elasticity is equal to one.elasticity is equal to one.
Factors Affecting Factors Affecting ElasticityElasticity
Availability of SubstitutesAvailability of Substitutes Relative ImportanceRelative Importance Necessities vs. LuxuriesNecessities vs. Luxuries Change over TimeChange over Time
Availability of SubstitutesAvailability of Substitutes
If there are few substitutes for a good, If there are few substitutes for a good, then even though the price rises greatly, then even though the price rises greatly, you may still buy that good.you may still buy that good. For example, if your favorite band is giving a For example, if your favorite band is giving a
concert, there really is no substitute no concert, there really is no substitute no matter the price of a ticket.matter the price of a ticket.
Relative ImportanceRelative Importance
How much of your budget do you spend How much of your budget do you spend on one good.on one good. For example, if you spend half of your For example, if you spend half of your
budget on a prescription drug that you can’t budget on a prescription drug that you can’t live without and the price of that drug goes live without and the price of that drug goes up you will have to drastically cut back on up you will have to drastically cut back on other goods.other goods.
Necessities vs. LuxuriesNecessities vs. Luxuries
Whether a person considers a good a Whether a person considers a good a necessity or a luxury.necessity or a luxury. For example, a cell phone may be considered a For example, a cell phone may be considered a
necessity to you and you will continue to pay for that necessity to you and you will continue to pay for that cell phone even if the price increases. However for cell phone even if the price increases. However for me, if the price of my cell phone goes up I may talk me, if the price of my cell phone goes up I may talk less or discontinue my use of the phone all together.less or discontinue my use of the phone all together.
Because it is easy to reduce the quantity of luxuries Because it is easy to reduce the quantity of luxuries demanded, the demand is elastic.demanded, the demand is elastic.
Change over TimeChange over Time
When a price changes, consumers often When a price changes, consumers often need time to change their shopping need time to change their shopping habits.habits.
Because they cannot respond quickly to Because they cannot respond quickly to price changes, their demand is inelastic price changes, their demand is inelastic in the short term.in the short term.
Total RevenueTotal Revenue
Read Pages 95-96 for the test.Read Pages 95-96 for the test.