Embed Size (px)
Citation preview

Demand Defrost Strategies in Supermarket Refrigeration Systems
Interim Report
Submitted to:
Refrigeration Project Team Retail Energy Alliance
Prepared by:
Brian A. Fricke, Ph.D., and Vishal Sharma Oak Ridge National Laboratory
Oak Ridge, TN
5 October 2011

i
Table of Contents List of Figures ............................................................................................................................................... iii
Acknowledgments ........................................................................................................................................ iv
1. Goals and Objectives ................................................................................................................................. 1
2. Motivation and Benefits of Demand Defrost ............................................................................................ 1
Outline of Interim Report ......................................................................................................................... 2
3. Types of Defrost ........................................................................................................................................ 3
Off-Cycle Defrost ....................................................................................................................................... 3
Electric Defrost .......................................................................................................................................... 4
Hot Gas Defrost ......................................................................................................................................... 4
Other Defrost Methods ............................................................................................................................. 4
4. Factors Affecting Defrost Frequency and Energy Use .............................................................................. 5
5. Energy Use of Current Defrosting Strategies ............................................................................................ 7
Low Temperature Glass-Doored Reach-In Case ....................................................................................... 7
Low Temperature Coffin/Island Case ....................................................................................................... 9
6. Defrost Control Strategies ...................................................................................................................... 11
Time-Temperature Control ..................................................................................................................... 11
Time-Pressure Control ....................................................................................................................... 12
Temperature Measurement ................................................................................................................... 12
Airflow Measurement ............................................................................................................................. 13
Humidity Measurement .......................................................................................................................... 13
Refrigerant Mass Flow Rate .................................................................................................................... 13
Comparison of Air-Side and Refrigerant-Side Heat Transfer .................................................................. 14
Thermal Insulation Effect ........................................................................................................................ 14
Optical Sensors........................................................................................................................................ 14
Artificial Intelligence ............................................................................................................................... 17
Other ....................................................................................................................................................... 18
7. Discussion ................................................................................................................................................ 19
Energy Use of Current Defrosting Strategies .......................................................................................... 19
Analysis of Defrost Control Strategies .................................................................................................... 20

ii
Time-Temperature Control ................................................................................................................. 20
Temperature Measurement ............................................................................................................... 20
Airflow Measurement ......................................................................................................................... 20
Humidity Measurement ...................................................................................................................... 21
Refrigerant Mass Flow ........................................................................................................................ 21
Comparison of Air-side and Refrigerant-Side Heat Transfer .............................................................. 21
Optical Sensors .................................................................................................................................... 21
Artificial Intelligence ........................................................................................................................... 22
Summary ............................................................................................................................................. 22
8. Next Steps ............................................................................................................................................... 23
Bibliography ................................................................................................................................................ 24
iii
List of Figures Figure 1. Effect of frost accumulation and air velocity on air pressure drop across an evaporator coil
(Stoecker 1998). ............................................................................................................................................ 6
Figure 2. Commercially available optical ice sensor (New Avionics Corporation 2011). ........................... 17

iv
Acknowledgments The authors would like to thank the U.S. Department of Energy for its support of this project. The
authors would also like to thank the support of the members of the Refrigeration Project Team of the
Retail Energy Alliance.
This document was prepared by the Oak Ridge National Laboratory, Building Equipment Research
Group, Energy & Transportation Science Division.

1
Demand Defrost Strategies in Supermarket Refrigeration Systems
1. Goals and Objectives The objective of this project was to determine the potential energy savings associated with
implementing demand defrost strategies to defrost supermarket refrigerated display case evaporators,
as compared to the widely accepted current practice of controlling display case defrost cycles with a
preset timer. The defrost heater energy use of several representative display case types was evaluated.
In addition, demand defrost strategies for refrigerated display cases as well as those used in residential
refrigerator/freezers were evaluated.
Furthermore, it is anticipated that future work will include identifying a preferred defrost strategy, with
input from Retail Energy Alliance members. Based on this strategy, a demand defrost system will be
designed which is suitable for supermarket refrigerated display cases. Limited field testing of the
preferred defrost strategy will be performed in a supermarket environment.
2. Motivation and Benefits of Demand Defrost Retail food stores and supermarkets operate their refrigeration systems continuously to maintain proper
food storage conditions within their refrigerated display cases and storage areas. Inevitably, moist air
will be entrained within the refrigerated display cases and storage areas. Since the temperatures of the
evaporators within the display cases and storage areas are below 32°F (0°C), which is lower than the
dew point of the entrained air, water vapor within the air will condense and freeze on the evaporator
surfaces, forming frost (Lawrence and Evans 2008). Over time, the frost accumulation on the evaporator
is sufficient to both impede heat transfer and to dramatically decrease the airflow through the
evaporator, leading to a decrease in the refrigerating capacity. Thus, in order to maintain system
performance and proper storage temperatures within the display cases and storage areas, evaporators
require periodic heating to melt and remove the frost (Tassou, Datta and Marriott 2001).
Defrosting of refrigerated display case evaporators may be achieved by several methods. For medium
temperature display cases, defrosting is often accomplished by simply interrupting the flow of
refrigerant to the evaporator. The frost then melts naturally as the evaporator fans blow air over the
evaporator surfaces. Electrical resistance heaters are commonly used to defrost low-temperature
display cases, and in a few circumstances, they may even be used to defrost medium-temperature
display cases. Electric heating elements are placed in front of the evaporator or embedded within the
evaporator. During an electric defrost cycle, the refrigerant flow to the evaporator is interrupted, the
electric heating elements are energized, and the evaporator fans blow hot air over the evaporator
surfaces to melt the frost. In another defrost technique known as hot gas defrost, high temperature
refrigerant vapor from the compressor discharge is routed through the evaporator via a series of valves

2
and piping. The high temperature vapor provides the required heating to melt the frost which has
accumulated on the evaporator coils.
Defrosting of supermarket display case evaporators is commonly controlled by a preset time cycle.
Defrosts are typically scheduled to occur every six or eight hours, with a duration of 20 to 30 minutes.
This method has the advantage of simplicity, reliability and low cost. However, a time-based defrosting
strategy is determined from worst case conditions to ensure complete defrosting under extreme
conditions. Thus, unnecessary defrost cycles will likely occur, thereby reducing the energy efficiency of
the refrigeration system (Tassou, Datta and Marriott 2001).
A significant amount of energy is required to defrost the evaporators in refrigerated display cases. Mei
et al. (2002) report that electric defrost heaters can account for up to 25% of the total electrical energy
consumption of refrigerated display cases. A review of manufacturers’ data indicates that electric
defrost energy consumption can range from 10% to 30% of the total display case energy consumption,
with an average of approximately 20% (Hill Phoenix 2011) (Hussmann 2011). Furthermore, defrosting
adds heat to the refrigerated display cases, which must be removed by the refrigeration system after
termination of the defrost cycle, thereby increasing compressor operation and energy use.
Defrosting also negatively impacts the shelf-life of food items in the refrigerated display cases. The
temperature of the food items within the display case increases during defrosting since heat is added
during this process. Food temperatures in certain locations within the display case may increase to
levels above those which are considered safe. According to the FDA Food Code, foods which require
refrigeration to limit pathogenic microorganism growth or toxin formation must be maintained at 41°F
(5°C) or lower (FDA 2009). In addition, the fluctuation of temperature experienced by the food items as
display cases cycle between cooling and defrosting can also cause product weight loss and deterioration
in appearance (Lawrence and Evans 2008).
An automatic defrost system that initiates defrost and varies the interval between defrosts according to
actual need is referred to as a demand defrost system (Allard and Heinzen 1988). There is clearly an
opportunity to reduce supermarket refrigeration system energy consumption by utilization of demand-
controlled case evaporator defrost. In addition, optimization of defrosting will minimize the deleterious
impact that temperature cycling has on food safety and quality.
Outline of Interim Report This interim report describes the progress made on this project to-date, including a review of demand
defrost technologies as well as an evaluation of current defrost energy use in supermarkets and the
potential energy savings associated with the implementation of demand defrost.
The following outline summarizes the remaining content of this report.
Section 3, Types of Defrost
A summary of methods used to defrost refrigerated display case evaporators is given.

3
Section 4, Factors Affecting Defrost Frequency and Energy Use
A discussion is given regarding the factors which affect the quantity of ice deposited on
refrigerated display case evaporator coils, which, in turn, affects the frequency and energy
use of the defrost system.
Section 5, Energy Use of Current Defrosting Strategies
An evaluation is given of the energy use associated with the defrosting of refrigerated
display case evaporators. The defrost energy consumption analysis is performed for several
types of low temperature refrigerated display cases.
Section 6, Defrost Control Strategies
A summary is given of various demand defrost strategies which have been used in
commercial and domestic refrigeration applications.
Section 7, Discussion
A discussion is given regarding the application of various demand defrost strategies to
refrigerated display cases.
Section 8, Next Steps
Based on the results presented in this interim progress report, future work for this project is
proposed.
3. Types of Defrost The most common defrost methods used in supermarket applications include off-cycle defrost, electric
defrost and hot gas defrost. Other methods of defrost have been investigated, including cool vapor
defrost and warm liquid defrost, but these techniques are not commonly utilized in supermarket
applications.
Off-Cycle Defrost The most basic defrost method is the off-cycle defrost, in which the refrigerant flow to the evaporator is
interrupted. The evaporator fans then blow air across the frosted evaporator, thereby melting the
accumulated frost. Since this method relies on the circulation of relatively warm air over the evaporator
to melt the frost, this technique is limited to only medium temperature applications.
The off-cycle defrost method has the advantage of being energy efficient because no additional heating
is required to melt the frost. However, complete defrosting of an evaporator does require a
considerable amount of time using the off-cycle defrosting technique.

4
Electric Defrost Electric defrost methods make use of electrical heating elements which are mounted adjacent to the
evaporator coil or integrated into the evaporator coil. During a defrost cycle, the refrigerant flow to the
evaporator is interrupted and the heating elements are energized. The evaporator fans then blow hot
air over the evaporator surface. Radiation, conduction and/or convection heat transfer between the
heating elements, air and the evaporator causes the frost to melt.
Since heat is being added externally to the evaporator, only a portion of the heat generated is used to
melt the frost. The remaining portion of the heat is transferred to the refrigerated space and the food
products. As illustrated in Section 5, approximately 1% or more of the heat generated by the electric
defrost heaters goes into melting the frost while the remaining excess heat is transferred to the air and
food products within the display case. This excess heat must then be removed when the refrigeration
system resumes operation after the defrost cycle.
Compared to off-cycle defrosting, the electric defrost method is relatively quick. In addition, electric
defrost has low first cost but high operating cost.
Hot Gas Defrost In the hot gas defrost method, the liquid refrigerant flow to the evaporator is first interrupted via a
solenoid valve and the evaporator fans are turned off. Then, the hot gas defrost solenoid opens, which
allows high pressure, high temperature refrigerant gas from the compressor discharge to flow into the
evaporator. As the hot refrigerant gas flows through the evaporator, it condenses, thus releasing its
latent heat. This warms the evaporator and melts the frost (Hoffenbecker, Klein and Reindl 2005).
Compared to electric defrosting, hot gas defrosting can remove the accumulated frost approximately 1.5
times faster (Rainwater 2009). In addition, since the evaporator is being heated from the inside, the
amount of excess heat transferred to the display case and food products is less than that associated
with electric defrost. It has been estimated that only 15% to 25% of the heat generated by hot gas
defrost goes into melting the frost while the remaining excess heat is transferred to the air and food
products within the display case (Niederer 1976).
Other Defrost Methods One disadvantage of the hot gas defrost method is that the high temperature refrigerant vapor comes
into contact with the low temperature evaporator and its associated piping. This can result in thermal
shock which, over time, can lead to cracks and leaks in the refrigerant piping near the evaporator. In an
effort to reduce the effects of thermal shock, cool vapor defrost and warm liquid defrost methods have
been proposed (Gage and Kazachki 2002) (Baxter and Mei 2002) (Mei, et al. 2002). In the cool vapor
defrost system, saturated vapor from the liquid receiver is directed through the evaporator while in the
warm liquid defrost system, saturated liquid from the liquid receiver is directed through the evaporator.
The temperature of the saturated vapor or the saturated liquid is not nearly as high as that of the
compressor discharge gas, so the effect of thermal shock with a cool vapor defrost system or a warm
liquid defrost system is reduced. While these defrost techniques can prolong equipment life as
compared to hot gas defrost, they are not commonly used in supermarket applications.

5
It is suggested that supermarket display case evaporators should be defrosted in stages. That is, rather
than defrosting all the evaporators in a display case line-up at the same time, groups of evaporators in
the line-up should be defrosted in a staggered fashion. By staging or staggering the defrost of the
display case evaporators, less demand is placed on the refrigeration system following a defrost and
display case temperature fluctuations are reduced. In a similar vein, it has been suggested that a
“modular” defrost could be implemented, in which a single display case incorporates two evaporators,
rather than one, and each evaporator is defrosted independently from the other (RTTC n.d.). The
modular defrost was found to reduce product temperature swings while slightly increasing the
compressor energy use of the refrigeration system
4. Factors Affecting Defrost Frequency and Energy Use The relative humidity within a supermarket greatly affects the amount of frost formation on display case
evaporators (Tassou, Datta and Marriott 2001). Thus, relative humidity is directly related to the
required defrosting frequency and associated energy use. Several studies have reported on the energy
use associated with defrost heaters as a function of supermarket relative humidity (Tassou and Datta
1999) (Henderson and Khattar 1999) (Kosar and Dumitrescu 2005). Other factors which influence the
rate of frost formation on evaporator coils include ambient air temperature, evaporator fin spacing, and
air flow rate (Bullard and Chandrasekharan 2004). The Refrigeration and Thermal Test Center operated
by Southern California Edison has extensively investigated the impacts of energy efficient technologies
for refrigerated display cases, including defrost strategies, low emissivity shields, anti-sweat heater
control, and display case design (RTTC n.d.) (RTTC n.d.) (RTTC 1997) (RTTC 1997) (Faramarzi, Coburn and
Sarhadian 2000) (Sarhadian, et al. 2004) (Mitchell 2005) (Rauss, Mitchell and Faramarzi 2008). These
reports provide
Tassou and Datta (1999) performed both field and laboratory investigations to quantify the effect of
supermarket humidity on the frost accumulation on the evaporators of medium temperature vertical
multi-deck display cases. For a supermarket located in Airdrie, UK, where the summertime store relative
humidity ranged from 45% to 55% and the wintertime store relative humidity ranged from 22% to 25%,
it was found that twice as much defrost condensate was collected from a multi-deck dairy display case in
the summer as compared to the winter. Thus, the diary case studied at this supermarket theoretically
required 50% fewer defrost cycles in the winter as compared to the summer.
In laboratory testing, Tassou and Datta (1999) found that for a medium temperature open display case,
frost accumulation increased exponentially with increasing relative humidity. After a display case being
studied had operated for a six hour period, 2.2 gallons (8.4 liters) of condensate were collected following
a defrost cycle when the relative humidity was 65% while 1.7 gallons (6.3 liters) of condensate were
collected at 45% relative humidity. Thus, a 23% reduction in condensate collection was observed when
the relative humidity was reduced from 65% to 45%. On the other hand, condensate data presented by
Faramarzi et al. (2000) exhibits a linear trend with relative humidity. They noted a 61.7% reduction in
condensate collection from an open, medium temperature meat case when the relative humidity was
reduced from 55% to 35%, while a 73.2% reduction in condensate collection occurred from an open,
medium temperature dairy case when the relative humidity was reduced from 55% to 35%.
6
From the database review performed by Kosar and Dumitrescu (2005), it was found that if proactive
measures were taken, then defrost electrical energy savings anywhere from 0% to 7.4% could be
achieved by using temperature terminated electric defrost rather than time-terminated defrost in low-
temperature display cases, if the store relative humidity was maintained at 35% rather than 55%.
Thus, it can be seen that the ambient conditions within the supermarket can greatly influence the
frequency and duration of defrost cycles. Since these conditions are environmental and seasonal in
nature, they cannot be strictly controlled by the supermarket operator. Thus, demand defrost strategies
are required for the energy efficient operation of supermarket refrigeration systems.
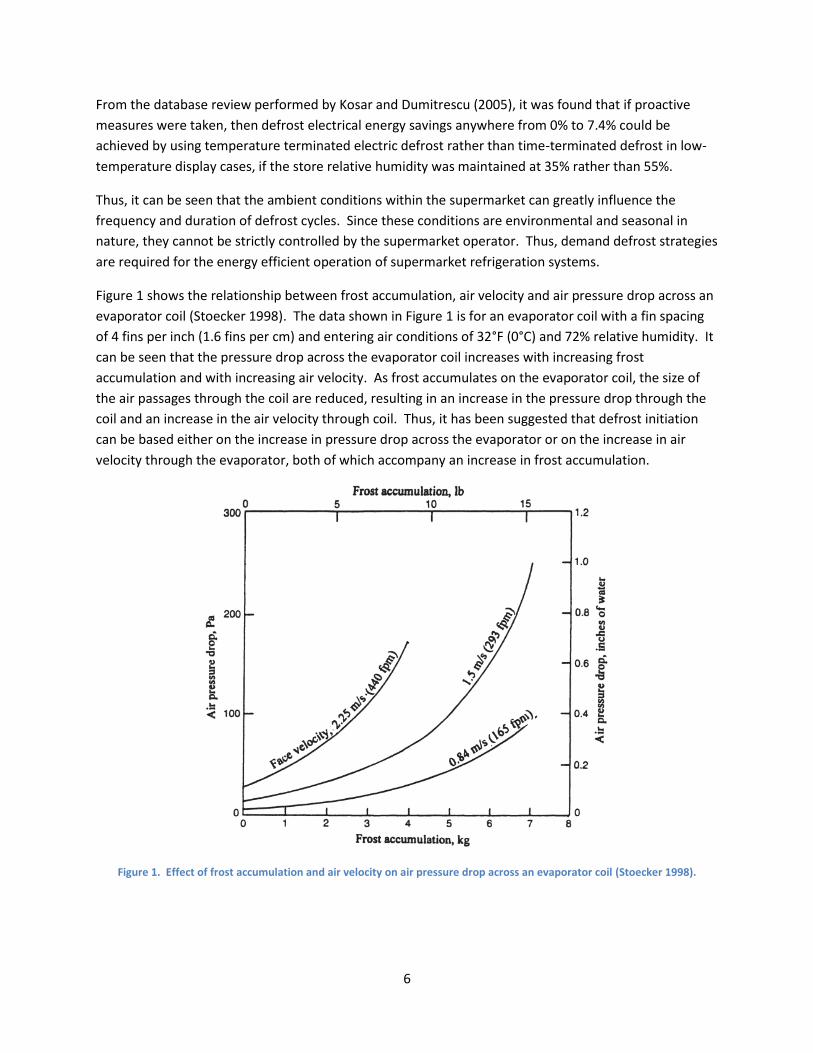
Figure 1 shows the relationship between frost accumulation, air velocity and air pressure drop across an
evaporator coil (Stoecker 1998). The data shown in Figure 1 is for an evaporator coil with a fin spacing
of 4 fins per inch (1.6 fins per cm) and entering air conditions of 32°F (0°C) and 72% relative humidity. It
can be seen that the pressure drop across the evaporator coil increases with increasing frost
accumulation and with increasing air velocity. As frost accumulates on the evaporator coil, the size of
the air passages through the coil are reduced, resulting in an increase in the pressure drop through the
coil and an increase in the air velocity through coil. Thus, it has been suggested that defrost initiation
can be based either on the increase in pressure drop across the evaporator or on the increase in air
velocity through the evaporator, both of which accompany an increase in frost accumulation.
Figure 1. Effect of frost accumulation and air velocity on air pressure drop across an evaporator coil (Stoecker 1998).

7
5. Energy Use of Current Defrosting Strategies In order to estimate the potential energy savings associated with implementing demand defrost
strategies in supermarket refrigerated display cases, the energy consumption of the electric defrost
systems for two types of frozen food display cases was determined. The display case types studied
include following:
Low temperature glass-doored reach-in case
Low temperature coffin/island case
For each display case type listed above, the defrost strategy was identified and the energy consumption
of the defrost strategy was obtained from manufacturers’ data. Using this data, the energy required to
melt the frost during one defrost cycle was determined. Next, the excess heat supplied by the defrost
heater during one defrost cycle was estimated. Then, the energy required by the compressor to remove
this excess heat was determined. Finally, the annual energy usage associated with the defrosting
operation was calculated, which includes the direct electrical energy consumption of the electric defrost
heater and the energy consumption of the compressor which is required to remove the excess defrost
heat.
The energy consumption of defrost systems for medium temperature cases was not investigated since
these types of cases typically employ off-cycle defrost. No significant energy consumption is associated
with off-cycle defrosting. As previously noted, electric defrost heaters account for approximately 20% of
the energy consumption of refrigerated display cases. However, in medium temperature applications,
this energy could be saved through the use of off-cycle defrosting. Nevertheless, it should be noted that
the energy consumption associated with off-cycle defrost is not equal to zero, since compressor and fan
energy will be required to cool the display case and food products after each defrost cycle.
Low Temperature Glass-Doored Reach-In Case The temperature and defrost specifications for a typical low temperature glass-doored reach-in case are
as follows (Hussmann 2009):
Evaporator temperature: -19°F (-28.3°C)
Drain temperature: 41°F (5°C) (assumed)
Rated display case load: 584 Btu/(hr·ft)
Defrost water: 0.60 lb/(ft·day)
Electric defrost power: 320 W/ft
Suggested defrost schedule: one defrost per day, maximum of one hour in duration
First, the energy required to melt 0.60 lb/(ft·day) of frost, ̇melt, is determined as follows:
23,12, ttcmmLttcmQ upffpmelt
(1)
where ̇ is the mass flow rate of water, cp,f is the specific heat of ice [0.502 Btu/(lb·°F) or 2.11 J/(g·°C)],
cp,u is the specific heat of liquid water [1.00 Btu/(lb·°F) or 4.18 J/(g·°C)], Lf is the latent heat of fusion of

8
water (144 Btu/lb or 334 J/g), t1 is the initial temperature of the frost (-19°F or -28.3°C), t2 is the freezing
point of water (32°F or 0°C), and t3 is the temperature of the condensate leaving the display case (41°F
or 5°C). Thus, the energy required to melt 0.60 lb/(ft·day) of frost is 107 Btu/(day·ft) or 4.44 Btu/(hr·ft).
As specified by the display case manufacturer, the rate of heat supplied by the electric defrost heater is
320 W/ft or 1092 Btu/(hr·ft). Assuming that each defrost period is one hour in length, the defrost
heater energy in excess of that required to melt the frost is:
Btu/ft088,1defrost
hr1fthrBtu/44.4fthrBtu/092,1
excessq (2)
Since the defrost period is assumed to be one hour per day, the refrigeration system operates 23 hours
per day. Thus, assuming that the excess heat, qexcess, must be removed by the refrigeration system over
a 23 hour period, the additional heat load on the refrigeration system due to defrost, Δ ̇df, is:
fthrBtu/3.47hr23
1
ft
Btu088,1
dfQ (3)
Thus, the additional power required by the compressor, Δ ̇comp, to overcome the heat added by the
defrost can be estimated as follows:
COP
QW
df
comp
(4)
where Δ ̇df is the additional heat added by defrost and COP is the coefficient of performance of the
refrigeration system. The COP of the low temperature refrigeration system may be estimated using the
procedure given in AHRI Standard 1200 (AHRI 2008). In this procedure, the adjusted dew point
temperature of the low temperature refrigeration system is determined, which is 3°F (1.7°C) less than
the rated evaporating temperature of the display case. In this instance, the adjusted dew point
temperature would be −19°F − 3°F = −22°F. From AHRI Standard 1200, the coefficient of performance of
the refrigeration system is estimated to be 1.96 (AHRI 2008). Thus, the additional power required by the
compressor to remove the defrost heat is:
fthrBtu/1.2496.1
fthrBtu/3.47
compW (5)
Assuming that the compressor does not operate during the one hour defrost cycle, the additional annual
energy consumption of the compressor which is required to remove the excess defrost heat is:
ftyearBtu/320,202year
days365
day
hours operating23fthrBtu/1.24
compW (6)

9
Thus, over the period of one year, the additional compressor energy consumption required to remove
the excess defrost heat is estimated to be 59.3 kWh/(year·ft).
Assuming that each defrost period is one hour in length, the direct electrical energy consumed by the
electrical defrost heater for one year is:
ftyearkWh/117year
defrosts365
defrost
hr1W/ft320
dfE (7)
Finally, the total electrical energy consumption for the electric defrost of a low temperature glass-
doored reach-in case is estimated to be:
ftyearkWh/176
ftyearkWh/3.59ftyearkWh/117
compdftotal WEE
(8)
Thus, for the low temperature glass-doored reach-in case, it is estimated that the energy consumption
associated with electrical defrost is 176 kWh/(year·ft). This energy consumption includes both the direct
energy associated with operating the defrost heater and the energy consumed by the compressor to
remove the excess defrost heat from the display case.
Low Temperature Coffin/Island Case The temperature and defrost specifications for a typical low temperature coffin case are as follows
(Hussmann 2010):
Evaporator temperature: -20°F (-28.9°C)
Drain temperature: 41°F (5°C) (assumed)
Rated display case load: 550 Btu/(hr·ft)
Defrost water: 1.7 lb/(ft·day)
Electric defrost power: 455 W/ft
Suggested defrost schedule: one defrost per day, maximum of one hour in duration
First, the energy required to melt 1.7 lb/(ft·day) of frost, ̇melt, is determined as follows:
23,12, ttcmmLttcmQ upffpmelt (9)
where ̇ is the mass flow rate of water, cp,f is the specific heat of ice [0.502 Btu/(lb·°F) or 2.11 J/(g·°C)],
cp,u is the specific heat of liquid water [1.00 Btu/(lb·°F) or 4.18 J/(g·°C)], Lf is the latent heat of fusion of
water (144 Btu/lb or 334 J/g), t1 is the initial temperature of the frost (-19°F or -28.3°C), t2 is the freezing
point of water (32°F or 0°C), and t3 is the temperature of the condensate leaving the display case (41°F
or 5°C). Thus, the energy required to melt 1.7 lb/(ft·day) of frost is 308 Btu/(day·ft) or 12.8 Btu/(hr·ft).

10
As specified by the display case manufacturer, the rate of heat supplied by the electric defrost heater is
455 W/ft or 1553 Btu/(hr·ft). Assuming that each defrost period is one hour in length, the defrost
heater energy in excess of that required to melt the frost is:
Btu/ft540,1defrost
hr1fthrBtu/8.12fthrBtu/553,1
excessq (10)
Since the defrost period is assumed to be one hour per day, the refrigeration system operates 23 hours
per day. Thus, assuming that the excess heat, qexcess, must be removed by the refrigeration system over
a 23 hour period, the additional heat load on the refrigeration system due to defrost, Δ ̇df, is:
fthrBtu/0.67hr23
1
ft
Btu540,1
dfQ (11)
Thus, the additional power required by the compressor, Δ ̇comp, to overcome the heat added by the
defrost can be estimated as follows:
COP
QW
df
comp
(12)
where Δ ̇df is the additional heat added by defrost and COP is the coefficient of performance of the
refrigeration system. Assuming that the coefficient of performance of the refrigeration system is 1.93,
based on the procedures given in AHRI Standard 1200 (AHRI 2008), the additional power required by the
compressor to remove the defrost heat is:
fthrBtu/7.3493.1
fthrBtu/0.67
compW (13)
Assuming that the compressor does not operate during the one hour defrost cycle, the additional annual
energy consumption of the compressor which is required to remove the excess defrost heat is:
ftyearBtu/307,291year
days365
day
hours operating23fthrBtu/7.34
compW (14)
Thus, over the period of one year, the additional compressor energy consumption required to remove
the excess defrost heat is estimated to be 85.4 kWh/(year·ft).
Assuming that each defrost period is one hour in length, the direct electrical energy consumed by the
electrical defrost heater for one year is:
ftyearkWh/166year
defrosts365
defrost
hr1W/ft455
dfE (15)

11
Finally, the total electrical energy consumption for the electric defrost of a low temperature coffin case
is estimated to be:
ftyearkWh/251
ftyearkWh/4.85ftyearkWh/166
compdftotal WEE
(16)
Thus, for the low temperature coffin case, it is estimated that the energy consumption associated with
electrical defrost is 251 kWh/(year·ft). This energy consumption includes both the direct energy
associated with operating the defrost heater and the energy consumed by the compressor to remove
the excess defrost heat from the display case.
The analysis performed above assumes that electric defrost is implemented in the refrigerated display
cases. Laboratory testing has shown that the overall electrical energy use for hot gas defrost of low
temperature refrigerated display cases can be less than 20% of that required by direct electric defrost
(Palmer and Crompton 2003).
6. Defrost Control Strategies The use of demand defrost strategies has been investigated in several applications including domestic
refrigerators, heat pumps and commercial refrigerated display cases. The techniques to initiate and
terminate defrost cycles which have been studied include the following:
Time-temperature controlled defrost
Air pressure differential or air flow rate across the evaporator
Temperature difference between the air and the evaporating surface
Air-side and refrigerant-side heat transfer comparison
Refrigerant flow rate measurement
Fan power measurement
Optical or acoustic measurement of ice thickness
Artificial intelligence-based defrost control systems.
A discussion of several of these demand defrost techniques is given below.
Time-Temperature Control The most basic and commonly used defrost control strategy for supermarket applications is the timed
defrost. The refrigerated display case evaporators are defrosted according to a predefined defrost
schedule in which a timer both initiates and terminates the defrost cycle. Since this strategy is not
based on the actual amount of frost present on the evaporator, it is possible that the defrost cycle is
either insufficient in duration such that the frost is not completely removed during the defrost cycle or it
is excessive in duration such that significantly more heating is supplied than that which is required to
remove the frost.

12
The efficiency of the timed defrost strategy may be improved by using a temperature-controlled
termination. In this technique, the defrost cycle is terminated when the evaporator temperature has
reached a predetermined temperature, or when the defrost cycle has reached a predetermined
duration, whichever occurs first. The temperature termination allows the defrost cycle to end earlier
than that which would have occurred with only a timer. However, since the evaporator temperature is
only used to terminate a defrost cycle, the possibility still exists that a defrost cycle will be initiated
when none is required.
Time-Pressure Control As an alternative to temperature-controlled termination, defrost may also be terminated based on
pressure. In this technique, the defrost cycle is terminated when the evaporator pressure has reached a
predetermined pressure deemed sufficient to melt all of the frost, or when the defrost cycle has
reached a predetermined duration, whichever occurs first. The pressure termination allows the defrost
cycle to end earlier than that which would have occurred with only a timer. However, since the
evaporator pressure is only used to terminate a defrost cycle, the possibility still exists that a defrost
cycle will be initiated when none is required.
Temperature Measurement Borton and Walker (1993) discuss a demand defrost strategy that is based on the temperature
difference between the display case discharge and return air. Their demand defrost controller measures
the air curtain temperature at the outlet of the discharge and the inlet of the return to determine if
defrost is needed. If the difference between these temperature measurements is greater than a
predetermined set point for a sustained period of time, and a minimum amount of time has elapsed
since the last defrost, then defrost is initiated. Furthermore, defrost is initiated if the elapsed time since
the last defrost exceeds a specified maximum time between defrosts. The defrost cycle is terminated
either on the basis of time or evaporator temperature (Borton and Walker 1991). The defrost controller
was field tested in a supermarket with a sales area of 60,000 ft2 (5,570 m2), controlling the defrost of the
low temperature display cases. Based on the results of the field testing at this supermarket, it was
estimated that the demand defrost controller could reduce the annual energy consumption by
20,000 kWh for hot gas defrost systems and 62,000 kWh for electric defrost systems (including the
energy savings of both the electric defrost heaters and the compressors).
Topper et al. (2001) describe a technique for demand defrost in which the air temperature within the
refrigerated display case and the refrigerant temperature within the evaporator are measured. If the
difference between the air temperature and the refrigerant temperature exceeds a predetermined
threshold, then defrost is initiated. Since the rate of heat transfer between the air and the evaporator is
reduced as ice builds up on the evaporator, the temperature of the air within the display case increases.
Therefore, the temperature difference between the refrigerant and the air is indicative of frost
formation on the evaporator. In the method described by Topper et al. (2001), a coefficient is used to
modify the minimum temperature difference used to initiate defrost. For example, if doors are used on
the display case, the time between defrost cycles may be extended if the frequency of door openings is
low. Thus, the defrost threshold may be relaxed by modifying the value of the defrost coefficient.

13
Topper et al. suggested that the defrost cycle should be terminated based on refrigerant temperature
exceeding a predetermined value or the defrost time exceeding a predetermined value (typically 45
minutes). The performance of this demand defrost system was not reported.
Airflow Measurement Jarrett (1972) designed a fluid amplifier which can monitor the air pressure difference across the
evaporator to detect the accumulation of frost on the evaporator and to initiate the defrost cycle. The
fluid amplifier was tested in a domestic refrigerator, and it was shown that the device was capable of
detecting the need for defrost based on the pressure difference across the evaporator. The original
timed defrost controller installed in the domestic refrigerator initiated defrost every seven hours. With
the fluid amplifier demand defrost controller, the interval between defrost cycles could be extended by
three or four times that of the timed defrost interval when the door of the refrigerator or freezer was
not opened and no loads were present within the refrigerator or freezer.
Hahn and Broyles (1968) utilized a technique in which the defrost cycle for a domestic refrigerator was
initiated based on air-flow monitoring. Two separate and parallel air flow paths were created within the
refrigerator: one air flow path contained the evaporator while the other air flow path (the reference
channel) was clear of obstructions. The flow rate differential between these two flow paths was
monitored by measuring the temperature of heated elements placed in each of the flow paths. As the
air flow within the evaporator channel decreases due to frost formation, the temperature of the sensing
element in the evaporator flow path increases. In addition, the air flow through the reference channel
increases as the flow through the evaporator channel decreases. Thus, the temperature of the sensing
element in the reference channel decreases. After a predetermined difference exists between the
temperatures of the sensing elements, the defrost cycle is initiated. The defrost cycle is terminated
when the temperature of the evaporator reaches a sufficiently high value to ensure that all the frost has
been removed. Hahn and Broyles tested the demand defrost system in a domestic refrigerator both in
the laboratory and in the field. They found that the system initiated defrost cycles as often as three
times a day under high temperature and high humidity conditions, and as seldom as once in 15 days
under low humidity and very low usage.
Humidity Measurement Bell (1978) describes a humidity controlled technique used to initiate the defrost cycle for domestic
refrigerator applications. A timing circuit was designed to vary the time between defrost cycles based
upon the relative humidity in the refrigerated space. If the refrigerated space were maintained at 100%
relative humidity, the time between defrosts was set to be 12 hours. As the relative humidity in the
refrigerated space decreased, the time interval between defrosts increased. In experimental testing
with a domestic refrigerator, it was found that the demand defrost system was capable of initiating
defrost in 12 hours during severe usage and defrost could be delayed for several weeks under very light
usage.
Refrigerant Mass Flow Rate Lawrence (2004) and Lawrence and Evans (2008) describe a demand defrost technique in which the
control system detects the variation in refrigerant flow through an evaporator to determine if defrost is
14
needed. As frost builds on an evaporator, the amount of heat which can be removed by the evaporator
decreases. When the frost accumulation has finally become too great, the thermostatic expansion valve
which controls the flow of refrigerant through the evaporator is unable to maintain a stable flow of
refrigerant through the evaporator. The expansion valve opens and closes rapidly, or “hunts”, as it tries
to maintain the proper superheat at the evaporator outlet. Lawrence and Evans developed an algorithm
which determines the onset of this flow instability based on measuring the superheat at the exit of the
evaporator.
The algorithm developed by Lawrence and Evans was tested in a laboratory setting using an 8.2 ft
(2.5 m) low temperature coffin case with electric defrost. It was found that, on average, the demand
defrost algorithm initiated defrost every 38.8 hours, whereas the display case manufacturer suggested
that the case be defrosted every eight hours. Therefore, it was estimated that the annual defrost
energy use of the 8.2 ft (2.5 m) coffin case, using the demand defrost algorithm, would be 538 kWh
versus 1960 kWh for the standard defrost every 8 hours. This results in an electrical defrost energy
savings of 73%.
Comparison of Air-Side and Refrigerant-Side Heat Transfer Thybo et al. (2002) were able to determine the onset of evaporator icing in refrigerated display cases
using a technique which compared the air-side and the refrigerant-side heat transfer. By measuring the
temperature and pressure of the refrigerant entering and exiting the evaporator, as well as the
refrigerant flow rate, the refrigerant-side heat transfer can be calculated. In addition, by measuring the
temperature of air entering and exiting the evaporator, and using air flow rate data provided by the
display case manufacturer, the air-side heat transfer can be calculated. Thybo et al. (2002) suggest that
by monitoring the residual, i.e., the difference between the measured air-side heat transfer and the
refrigerant-side heat transfer, faults in the refrigeration system can be detected. When the residual is
significantly different than zero, then a fault has occurred in the refrigeration system. This methodology
was tested on a coffin-type display case in a laboratory setting and it was found that it was possible to
determine the onset of a refrigeration system fault such as evaporator coil icing or a malfunctioning
evaporator fan.
Thermal Insulation Effect Llewelyn (1984) briefly describes a demand defrost technique which is based on the thermal insulation
effect of the frost layer. Two sensors are used in the system: one in intimate contact with the
evaporator coil and one positioned in the outlet air stream from the evaporator. However, no
information is provided on how the system operates or how well the system performs.
Optical Sensors Paone and Rossi (1991) report on the use of fiber-optic sensors to determine ice thickness and to
control the operation of the defrost cycle. Two types of fiber-optic sensors are discussed: reflection
type sensors and transmission type sensors.
Reflection type sensors shine light on the ice surface and receive the reflected light from the ice surface.
The intensity of the reflected light is proportional to the distance between the sensor and the ice

15
surface. The output voltage of the sensor is proportional to the intensity of the reflected light, and thus,
this voltage may be used to determine the distance between the sensor and ice surface, or the thickness
of the ice. Reflection type sensors produce a continuous output between the minimum and maximum
ice thickness. Reflection type sensors must be mounted perpendicular to the ice formation for proper
operation.
Transmission type sensors consist of a separate light transmitting device and a light receiving device.
The transmitter and receiver are mounted parallel to the evaporator surface and in line-of-sight of each
other, at a certain distance above the evaporator surface. As ice grows, it eventually blocks the
transmission of light from the transmitter to the receiver. The output voltage from the transmission
type sensor is a step function indicating that the ice is either below or above the line-of-sight of the
transducer and receiver.
Paone and Rossi (1991) noted that the output voltage of the reflection type sensor was strongly affected
by the surface reflection coefficient of the ice surface. Since the ice surface may take on various
textures depending on how the ice is formed, thereby leading to various surface reflection coefficients,
uncertainties can exist in the measured ice thickness. On the other hand, the transmission type sensor
generates an ON/OFF signal depending upon whether the ice has grown to a sufficient thickness to block
the light traveling from the transmitter to the receiver. Thus, ice surface quality does not affect the
output of a transmission type sensor.
During testing of a transmission type optical sensor in a domestic refrigeration application, Paone and
Rossi (1991) noted that humidity condensed and ice formed on the lenses of the fiber-optic sensor
heads. This could comprise the reliability of the sensor output. However, this problem was remedied by
mounting a cylindrical duct on the fiber-optic head. The cylindrical duct reduced the convective motion
near the sensor heads, allowing the humidity to diffuse along the length of the tube before it reached
the sensor head. For the domestic refrigerator application, it was found that a duct of 4 mm in diameter
and 30 mm in length was sufficient to eliminate ice formation on the sensor heads.
Paone and Rossi (1991) concluded that measuring ice thickness and controlling defrost cycles with a
transmission type fiber-optic sensor was technically feasible in a domestic refrigeration application.
However, the unit cost of the sensors, which was reported to be US$100 to US$150, would add
substantially to the cost domestic refrigerators. Since the price of a typical domestic refrigerator can
range from $400 to $800, an additional $100 to $150 for a transmission type fiber optic demand defrost
sensor is economically unfeasible in that application. Furthermore, Paone and Rossi (1991) did not
report on the long-term performance and reliability of the sensor in harsh environments such as that
encountered in refrigerated display cases.
Byun et al. (Byun, et al. 2006) have investigated the use of photo-couplers to detect frost build-up on
the evaporator coils of heat pumps. In their laboratory study, the evaporator coil was divided into nine
zones and an infrared emitter and receiver were placed in the center of each of the nine zones, between
the evaporator fins. Multiple photo-couplers were employed across the face of the evaporator to
accurately detect the initiation and propagation of frost.

16
As compared to the standard timed defrost cycle, Byun et al. found that the photo-coupler defrost
system increased the heating period of the heat pump by 7% to 9%. In addition, the defrosting period
was reduced by 18% to 74% using the photo-coupler defrost system. While Byun et al. note that the
photo-coupler defrost system was effective in laboratory studies, the system was not tested extensively
in the field to determine its reliability.
Wang et al. (2010) describe the use of a micro-camera and image processing technology to determine
the thickness of frost on a cold surface. The accuracy of the microscopic image system was reported to
be 0.01 mm. The system was laboratory-based, and not optimized for field or commercial use.
Xiao et al. (2009) and Xiao et al. (2010) characterize the performance of a photoelectric device for
determining frost layer thickness. It was found that the photoelectric device could accurately estimate
frost height. A defrost control strategy was suggested, based on the use of photoelectric technology.
While the system was effective in laboratory studies, the system was not tested extensively in the field
to determine its reliability.
The Refrigeration and Thermal Test Center at Southern California Edison has tested an optical demand
defrost technology in a medium temperature open vertical refrigerated display case (Mitchell 2005).
The technology consists of a light emitting diode (LED) which transmits light through a fiber optic cable.
The light output from the fiber optic cable is focused on a lens which reflects light back to the fiber optic
cable. The lens is mounted near the fins of an evaporator so that frost accumulates on the lens,
coincident with frost formation on the evaporator. The frost accumulation on the lens affects the
amount of light which is reflected back to the fiber optic cable and when the intensity of the reflected
light reaches a preset threshold, a defrost cycle can be initiated. During testing, it was noted that water
droplet adhesion on the optical detector caused the optical demand defrost system to erratically initiate
defrost cycles. In addition, at one point during testing, the defrost system failed to initiate defrost when
the entire evaporator was frosted. Finally, the optical demand defrost system was unable to maintain
the temperature within the refrigerated display case below acceptable levels. Thus, RTTC concluded
that the optical demand defrost system was not reliable for supermarket refrigeration applications.
A commercially available optical frost sensor is available, shown in Figure 2 (New Avionics Corporation
2011). It is claimed that this device is capable of detecting various types of moisture including ice, snow,
frost and condensation based upon optical opacity and optical refraction via its 3 mm diameter optical
probe. An optional heating element to de-ice the optical sensor is available. The optical sensor is placed
between any two evaporator fins to determine when the evaporator has frosted. The device then
generates a control signal which is used by the refrigeration system to initiate a defrost cycle.

17
Figure 2. Commercially available optical ice sensor (New Avionics Corporation 2011).
Artificial Intelligence Allard and Heinzen (1981) (1988) propose a demand defrost technique in which the time required to
defrost the coil is monitored and the time periods between defrosting are adjusted accordingly. If the
actual defrost time is shorter than a predetermined optimal time, then not enough frost was allowed to
accumulate on the evaporator. Thus, the defrost controller increases the amount of time between
successive defrost periods so that more frost will accumulate. On the other hand, if the actual defrost
time is longer than the predetermined optimal time, too much frost accumulated on the evaporator.
Thus, the defrost controller decreases the amount of time between successive defrost periods. The
demand defrost controller was field tested in a domestic refrigerator and it was found that over an
extended period of time, the controller had reduced the frequency of defrost by nearly a factor of four.
Working with Johnson Controls/Encore, EPRI developed a proprietary defrost control algorithm for
refrigerated display cases that learns continuously from the current defrost behavior to schedule the
next defrost (Hindmond and Henderson 1998). The method is sensorless and uses the computing power
of the energy management system to perform the defrost scheduling calculations. Thus, new sensors
are not required to be installed to use this system.
The demand defrost technology developed by Hindmond and Henderson was field-tested at two
supermarkets. One supermarket, located in New Jersey, had a plan area of 33,000 ft2 (3,070 m2) and
included 244 linear feet (74 m) of display cases and 863 ft2 (80 m2) of walk-in freezers serviced by a total
of 123 kW of electric defrost. The remainder of the display cases and walk-ins at the New Jersey
supermarket used off-cycle defrost. The other supermarket, located in Florida, had a plan area of
26,000 ft2 (2,420 m2) and included 236 linear feet (72 m) of display case and 1,705 ft2 (158 m2) of walk-
ins serviced by hot gas defrost. The remainder of the display cases (160 ft or 49 m) and walk-ins (932 ft2
or 87 m2) at the Florida supermarket used off-cycle defrost.
At the New Jersey supermarket, the Hindmond and Henderson demand defrost controller was able to
increase the time between defrosts from one day to three days. The electric defrost heater operation
was reduced by 63% on average. It was estimated that if the demand defrost controller were installed
on all the electric defrost cases in the supermarket, the total direct energy savings would be 25,000 kWh
18
per year. By including the indirect savings associated with compressor energy use, the total savings was
estimated to 38,000 kWh per year.
The results presented for the Florida supermarket were mixed. Hindmond and Henderson noted that a
majority, but not all, refrigerated display case zones exhibited the expected behavior that defrost
operation increases with increasing relative humidity. It was noted that perhaps the method of defrost
termination, which was based on analog temperature sensors, was either not functioning properly or
not optimally configured. Thus, additional testing of the demand defrost controller was planned to be
performed at the Florida supermarket.
Datta and Tassou (2002) developed a demand defrost controller for refrigerated display cases based on
artificial intelligence and inexpensive sensors such as temperature probes and a timer. Based on
laboratory experiments performed on a medium temperature, multi-deck display case, Datta and Tassou
found that the velocity of the air exiting the evaporator coil was the best indicator of frost accumulation
on the coil. The velocity of the exiting air was found to decrease with increasing frost accumulation. In
addition, Datta and Tassou found that the evaporator temperature as well as the entering and exiting air
temperature at the evaporator decreased with increasing frost accumulation.
Datta and Tassou noted that robust velocity probes, such as hot-wire anemometers, are very expensive
and thus are not feasible for use in demand defrost controllers for refrigerated display cases. Therefore,
they proposed to use the ambient temperature and relative humidity, evaporator temperature, entering
and exiting air temperature at the evaporator and the time between defrosts to as input to an artificial
intelligence based demand defrost controller. While these quantities are not as good a predictor of
frost accumulation as is the velocity of the air exiting the evaporator, the sensors for measuring these
quantities are much less expensive.
Using a Multi-Layered Perceptron (MLP) artificial neural network model, a demand defrost controller
was developed and tested in a laboratory setting. It was found that the demand defrost controller
produced a defrost energy savings of 25% for ambient space conditions of 72°F (22°C) and 55% RH. In
addition, defrost energy savings of 50% were achieved for ambient space conditions of 72°F (22°C) and
35% RH. For the medium temperature, multi-deck case studied, the number of defrost cycles per day
was reduced from four at 72°F (22°C) and 65% RH to three at 72°F (22°C) and 45% RH, and to 2 at 72°F
(22°C) and 35% RH. Furthermore, it was found that demand defrost had no adverse effect on product
temperature as compared to timed defrost.
While the technique was successful in the laboratory, Datta and Tassou did not investigate the
effectiveness of the demand defrost controller in a supermarket setting. They noted that other
controllers, which are dependent on ambient space temperature and relative humidity, are being
investigated for implementation in refrigerated display cases.
Other For domestic refrigeration applications, Knoop et al. (1988) developed a methodology to estimate the
time interval between defrosts based on the number and duration of refrigerator door openings. In this
method, door openings and their duration are monitored. Then, a new time between defrosts is

19
calculated based on the door opening duration times and the compressor run time. It was found that
this technique could vary the defrost interval from 19 hours to 152 hours.
Bejan et al. (1994) derived theoretical equations to determine the optimal on/off sequence for
operating a domestic refrigerator and its defrost system. These equations provide a means to
theoretically determine the minimal power required by the refrigerator, while maintaining the
prescribed temperature of the cold space and removing the frost build-up.
Verma et al. (2002) describe various design strategies which could be used to reduce the performance
degradation due to frosting of display case evaporators. They show that the interval between defrosts
could be dramatically increased by using variable speed evaporator fans to maintain constant airflow
over the evaporator. In addition, fin staging was also shown to result in significant performance
improvements, particularly at low air velocities and high inlet humidities where most of the frosting
occurs near the front of the evaporator.
Liu et al. (2006) describe the use of an anti-frosting paint to effectively retard frost nucleation and
decrease frost deposition rate on cold surfaces. For low air relative humidity, less than 60%, and cold
surface temperature of 14°F (−10°C), the coated surface remained frost-free for over 3 hours while the
uncoated surface was completely covered by a dense and thick layer of frost. While this technique does
not eliminate frost formation, it does delay the formation of frost, thus potentially lengthening the
duration between defrost cycles.
7. Discussion The most common defrost methods used in supermarket applications each have their own advantages
and disadvantages. Off-cycle defrost requires the least amount of energy to operate but it is limited in
use to only medium or high temperature refrigerated display cases. In addition, the cost of
implementation for off-cycle defrost is very low. Electric defrost has low initial cost, but the operating
cost is relatively high. However, approximately 1% or more of the heat generated by the electric defrost
heaters goes into melting the frost while the remaining excess heat is transferred to the air and food
products within the display case. Compared to off-cycle and electric defrost, hot gas defrost can quickly
defrost low and medium temperature display case evaporators. However, hot gas defrost can
potentially damage refrigerant piping and evaporators through thermal shock. In addition, hot gas
defrost has high installation costs, but its operating costs are lower than that of electric defrost. To
minimize the impact of thermal shock associated with hot gas defrost, warm liquid defrosting or cool
vapor defrosting may be used. However, these methods are not commonly used in supermarket
applications.
Energy Use of Current Defrosting Strategies The energy use associated with electric defrosting of low temperature reach-in display cases and low
temperature coffin cases was estimated assuming that a timed initiation/termination defrost strategy
was utilized. These energy estimates include the direct electrical energy consumption of the electric
defrost heater as well as the additional energy consumption of the compressor which is required to

20
remove the excess defrost heat. It was found that the electrical energy consumption associated with
the electrical defrost of low temperature reach-in cases was 176 kWh/(year·ft). Furthermore, the
electrical energy consumption associated with the electrical defrost of low temperature coffin cases was
estimated to be 251 kWh/(year·ft).
Assuming that a typical 45,000 ft2 supermarket contains 268 ft of low temperature reach-in cases and
128 ft of coffin cases (Westphalen, et al. 1996), the total electrical energy consumption associated with
the electrical defrosting of these display cases would be approximately 79,300 kWh/year.
Implementation of demand defrost strategies for refrigerated display cases has been reported to reduce
defrost heater operation by 50% to 73% (Tassou and Datta 1999) (Lawrence and Evans 2008) (Hindmond
and Henderson 1998). Thus, for a typical 45,000 ft2 supermarket, the total annual electrical energy
savings realized from the implementation of demand defrost would be between 39,650 kWh and
57,900 kWh. This agrees well with field data presented by Hindmond and Henderson (1998), in which
they reported an estimated annual electrical energy savings of 38,000 kWh for a 33,000 ft2 supermarket
which implemented demand defrost.
Assuming an average cost of $0.103 per kWh for electricity (EIA 2011), the typical 45,000 ft2
supermarket could save between $4,080 to $5,960 annually in electrical energy costs by implementing a
demand defrost strategy for low temperature display cases. For a similar supermarket equipped with
hot gas defrost, the savings is anticipated to be less than half of these values, and in fact, according to
Palmer and Crompton (2003), could perhaps be less than 20% of these values.
Analysis of Defrost Control Strategies A variety of defrost initiation and termination schemes have been developed for commercial and
domestic refrigeration applications. Most of these demand defrost techniques lack the robustness
required for supermarket environments and the systems are difficult to service and maintain. A
successful demand defrost system for refrigerated display cases would be easy to install and maintain
and would make use of simple, low-cost, robust sensors and controllers.
Time-Temperature Control
While it is not energy efficient, the timed initiation/termination defrost control strategy is most often
used in supermarket applications because it has the lowest first cost as well as being simple, robust and
easy to maintain.
Temperature Measurement
Demand defrost strategies based on the measurement of evaporator air inlet and outlet temperatures
require the use of simple, durable temperature sensors. Since at a minimum, only two sensors are
required, it is expect that these sensors can be easily installed within a refrigerated display case.
Maintenance of these sensors would be minimal, however, sensor replacement may be difficult.
Airflow Measurement
The measurement of airflow requires relatively complex airflow sensors which may not be sufficiently
robust for application in refrigerated display cases. The long-term reliability and durability of airflow
sensors is expected to be low.

21
Humidity Measurement
Fluctuations in domestic refrigerator humidity levels are expected to be low and the overall humidity
level would be relatively uniform with time, since, in domestic refrigeration applications, the frequency
of usage and door openings is relatively low compared to that of commercial refrigerated display cases.
Thus, demand defrost methods based on humidity measurement may work well only in low-use
domestic refrigeration applications. Furthermore, the slow response time and relatively low accuracy,
particularly at high humidity levels, of inexpensive humidity sensors may not provide reliable control in
the high humidity environment of refrigerated display cases. However, the current trend in better
humidity control within supermarkets, particularly in the areas near the refrigerated display cases, may
be sufficient to overcome the weaknesses of humidity-based demand defrost strategies.
Refrigerant Mass Flow
Estimation of the stability of refrigerant flow through an evaporator, based on the measurement of
superheat at the evaporator outlet, requires the use of a simple, durable temperature sensor. However,
the temperature data must be analyzed by a control module to determine the onset of flow instability.
This control module will increase the initial cost of this demand defrost system and may require training
for proper installation and operation.
Comparison of Air-side and Refrigerant-Side Heat Transfer
The technique proposed by Thybo et al. (2002) to determine the onset of refrigeration system faults by
comparing the heat transfer on the refrigerant and air sides of the evaporator requires multiple
temperature and pressure sensors, as well as mass flow sensors. The installation and maintenance of
these sensors would be difficult. In addition, a control module would be required to process the data.
Thus, the initial cost of this system would be high. Due to the complexity of the system, the long-term
reliability of the system would be low.
Defrost strategies based on simpler air-side heat transfer measurements could be feasible in commercial
refrigeration applications. In a simpler system, a heat flux sensor coupled with temperature sensors
that measure air temperature and evaporator fin temperature could be used to determine the thermal
resistance of the frost layer as it develops on the evaporator surface. A sufficiently high thermal
resistance could then be used to initiate a defrost cycle. The required temperature and heat flux
sensors would be inexpensive and could be incorporated into an easily-installable device which mounts
on the evaporator.
Optical Sensors
Optical sensors can accurately determine the quantity of frost accumulated on an evaporator in a
specific location. However, multiple optical sensors would be required to accurately determine the
accumulation of frost over the entire evaporator. The durability of the optical sensors is expected to be
low in refrigerated display case applications. In addition, if multiple optical sensors are used, the
complexity of the system would be high and the long-term reliability of the system would be low. As
noted by the RTTC during testing of an optical demand defrost system, the failure of the system in a
relatively clean laboratory environment casts doubt on the system’s ability to perform in a “dirty”
supermarket environment (Mitchell 2005). If manufacturers’ were to overcome the reliability issues
22
associated with optical demand defrost methods, it could be reasonably expected that optical sensors
using LEDs, along with modern electronics, could be used to produce a low cost and commercially viable
demand defrost system.
Artificial Intelligence
The success of an artificial intelligence based demand defrost strategy depends upon the complexity of
the system. Rather complex artificial intelligence based demand defrost systems, such as that suggested
by Datta and Tassou (2002), which require the use of several temperature and humidity sensors as well
as a control module which analyzes the collected data, may not be commercially viable. The installation
and maintenance of the numerous sensors would be difficult. In addition, the initial cost of the system
would be high. Due to the complexity of the system, the long-term reliability of the system would be
low. Refrigeration system installers and supermarket personnel may require training to properly install
and operate this type of defrost system.
However, simpler artificial intelligence based defrost strategies which modify the time between cycles
based on the duration of previous defrost cycles, such as that used by Hindmond and Henderson (1998),
require only a control module which performs the required calculations and initiates and terminates
defrost using a simple, durable temperature sensor. The temperature sensor and electronic controls for
such a system are not inherently more complex than that required for simple time/temperature-
termination defrost and they could conceivably be used to produce a low cost and commercial viable
demand defrost system.
Summary
The most basic and commonly used defrost control strategy for supermarket applications is the timed
defrost. The refrigerated display case evaporators are defrosted according to a predefined defrost
schedule in which a timer both initiates and terminates the defrost cycle. Since this strategy is not
based on the actual amount of frost present on the evaporator, it is possible that the defrost cycle is
either insufficient in duration such that the frost is not completely removed during the defrost cycle or it
is excessive in duration such that significantly more heating is supplied than that which is required to
remove the frost.
In an effort to reduce the energy consumption and detrimental effects associated with timed defrost,
the use of demand defrost has been attempted in supermarket refrigeration applications with little
reported success. The demand defrost technologies have thus far been found to be unreliable in the
rough environments found within refrigerated display cases. It has also been noted that demand
defrost tends to work well when the display case and defrost system are new, however, over time, the
case and the defrost sensor become dirty and the defrost system fails to work correctly.
Given the success of modern demand defrost controls in residential heat pumps and air-conditioners, it
would appear that these technologies could be adapted to commercial refrigeration applications in an
effort to reduce energy consumption associated with defrost. Demand defrost strategies applicable to
supermarket refrigeration that appear to be robust, easy to install and low cost include air-side heat
transfer measurement methods, optical sensor-based methods, and artificial-intelligence based

23
methods. These methods make use of inexpensive and robust sensors (temperature sensors, heat flux
sensors, LED optical sensors) and the required control electronics would be relatively straightforward to
develop, resulting in a low cost defrost system. Nevertheless, at a minimum, it is suggested that
refrigerated display cases should incorporate defrost controls which consist of timed initiation with
temperature termination.
8. Next Steps With input from Retail Energy Alliance members, a preferred defrost strategy will be identified and,
based on this strategy, a demand defrost system suitable for supermarket refrigerated display cases will
be designed. Limited field testing of the preferred defrost strategy will be performed in a supermarket
environment.
24
Bibliography AHRI. Standard 1200, Performance Rating of Commercial Refrigerated Display Merchandisers and
Storage Cabinets. Arlington, VA: Air-Conditioning and Refrigeration Institute, 2008.
Allard, J.J., and R.A. Heinzen. Defrosting System using Actual Defrosting Time as a Controlling Parameter.
United States of America Patent 4,251,988. February 24, 1981.
Allard, John, and Robert Heinzen. "Adaptive defrost." IEEE Transactions on Industry Applications 24, no.
1 (1988): 39-42.
Baxter, V.D., and V.C. Mei. "Warm Liquid Defrosting Technology for Supermarket Display Cases." New
Technologies in Commercial Refrigeration. Urbana, IL: International Institute of Refrigeration,
2002. 147-151.
Bejan, A., J.V.C. Vargas, and J.S. Lim. "When to Defrost a Refrigerator, and When to Remove the Scale
from the Heat Exchanger of a Power Plant." International Journal of Heat and Mass Transfer 37,
no. 3 (1994): 523-532.
Bell, C.A. "Investigation of a Demand-Actuated Defrost System for Residential Refrigerators." Energy 3,
no. 4 (1978): 479-483.
Borton, D.N., and D.H. Walker. Demand Defrost Controller for Refrigerated Display Cases. United States
of America Patent 4,993,233. February 19, 1991.
Borton, D.N., and D.H. Walker. Development of a Demand Defrost Controller. Energy Authority Report
93-14, New York, NY: New York State Energy Research and Development Authority, 1993.
Bullard, C., and R. Chandrasekharan. Analysis of Design Tradeoffs for Display Case Evaporators.
ORNL/TM-2004/157, Oak Ridge, TN: Oak Ridge National Laboratory, 2004.
Byun, J.-S., C.-D. Jeon, J.-H. Jung, and J. Lee. "The application of photo-coupler for frost detecting in an
air-source heat pump." International Journal of Refrigeration 29, no. 2 (2006): 191-198.
Datta, Debarati, and Savvas Tassou. "Implementation of a defrost on demand control strategy on a retail
display cabinet." New Technologies in Commercial Refrigeration. Urbana, IL: International
Institute of Refrigeration, 2002. 218-226.
EIA. U.S. Energy Information Administration - Independent Statistics and Analysis. 2011.
www.eia.doe.gov (accessed February 25, 2011).
Faramarzi, R., B.A. Coburn, and R. Sarhadian. A Study of Energy Efficient Solutions for Anti-Sweat
Heaters. Final Report, Refrigeration Technology and Test Center, Irwindale, CA: Southern
California Edison, 2000.
Faramarzi, R., R. Sarhadian, and R.S. Sweetser. "Assessment of Indoor Relative Humidity Variations on
the Energy Use and Thermal Performance of Supermarkets' Refrigerated Display Cases."

25
Proceedings of the 2000 ACEEE Summer Study on Energy Efficiency in Buildings: Efficiency and
Sustainability. Pacific Grove, CA: American Council for an Energy-Efficient Economy, 2000. 3.125-
3.136.
FDA. Food Code 2009. College Park, MD: U.S. Department of Health and Human Services, Food and Drug
Administration, 2009.
Gage, C.L., and G.S. Kazachki. "Warm-Liquid Defrost for Commercial Food Display Cases: Experimental
Investigation at 32.2°C Condensing." New Technologies in Commercial Refrigeration. Urbana, IL:
International Institute of Refrigeration, 2002. 169-178.
Hahn, T.W., and J.D. Broyles. "Electronic refrigeration defrost control - Report of performance." IEEE
Transaction on Industry and General Applications 4, no. 1 (1968): 114-119.
Henderson, H.I., and M. Khattar. "Measured Impacts of Supermarket Humidity Level on Defrost
Performance and Refrigerating System Energy Use." ASHRAE Transaction 105, no. 1 (1999): 508-
520.
Hill Phoenix. 2011. http://www.hillphoenix.com (accessed August 2011).
Hindmond, J., and H. Henderson. Refrigerated Display Case Demand Defrost Controller: Field
Demonstration Results. TR-112121, Palo Alto, CA: Electric Power Research Institute, 1998.
Hoffenbecker, N., S.A. Klein, and D.T. Reindl. "Hot gas defrost model development and validation."
International Journal of Refrigeration 28, no. 4 (2005): 605-615.
Hussmann. 2011. http://www.hussmann.com (accessed August 2011).
Hussmann. Technical Data Sheet: FW. Bridgeton, MO: Hussmann Corporation, 2010.
Hussmann. Technical Data Sheet: RLT with Innovator Doors. Bridgeton, MO: Hussmann Corporation,
2009.
Jarrett, J.H. "A New Demand Defrost Control for Domestic Forced Draft Refrigerator/Freezers and
Freezers." IEEE Transactions on Industry Applications IA-8, no. 3 (1972): 356-364.
Knoop, D.E., A.T. Tershak, and M. Thieneman. "An Adaptive Demand Defrost and Two-Zone Control and
Monitor System for Refrigeration Products." IEEE Transactions on Industry Applications 24, no. 2
(1988): 337-342.
Kosar, Douglas, and Octavian Dumitrescu. "Humidity Effects on Supermarket Refrigerated Case Energy
Performance: A Database Review." ASHRAE Transactions 111, no. 1 (2005): 1051-1060.
Lawrence, J.M.W. Defrost Control Method and Apparatus. United States of America Patent 6,718,778.
April 13, 2004.

26
Lawrence, J.M.W., and J.A. Evans. "Refrigerant flow instability as a means to predict the need for
defrosting the evaporator in a retail display freezer cabinet." International Journal of
Refrigeration 31, no. 1 (2008): 107-112.
Liu, Z., H. Wang, X. Zhang, S. Meng, and C. Ma. "An experimental study on minimizing frost deposition on
a cold surface under natural convection conditions by use of a novel anti-frosting paint. Part I.
Anti-frosting performance and comparison with the uncoated metallic surface." International
Journal of Refrigeration 29, no. 2 (2006): 229-236.
Llewelyn, D.S. "A significant advance in defrost control." International Journal of Refrigeration 7, no. 5
(1984): 334-335.
Mei, V.C., F.C. Chen, R.E. Domitrovic, and B.D. Braxton. "Warm liquid defrosting for supermarket
refrigerated display cases." ASHRAE Transactions 108, no. 1 (2002): 669-672.
Mitchell, S. Optical Demand Defrost. Final Report, Project ET04.10, Refrigeration Technology and Test
Center (RTTC), Irwindale, CA: Southern California Edison, 2005.
Neshan, M. "Personal Communication." Las Vegas, NV, February 3, 2011.
New Avionics Corporation. "Ice Meister Model 9734 Industrial Ice Detecting Sensor System." 2011.
http://www.newavionics.com/9734_ind.html (accessed March 25, 2011).
Niederer, D.H. "Frosting and Defrosting Effects on Coil Heat Transfer." ASHRAE Transaction 82, no. 1
(1976): 467-473.
Palmer, J., and A. Crompton. IEA Annex 26: Advanced Supermarket Refrigeration and HVAC Systems -
Final UK Report on Phase 2 Studies. Birmingham, UK: FaberMaunsell, 2003.
Paone, N., and G. Rossi. "Fiber-optic ice sensors for refrigeration." Proceedings of SPIE - The
International Society for Optical Engineering 1511 (1991): 129-139.
Rainwater, J.H. "Five Defrost Methods for Commercial Refrigeration." ASHRAE Journal 51, no. 3 (2009):
38-51.
Rauss, D., S. Mitchell, and R. Faramarzi. "Cool retrofit solutions in refrigerated display cases."
Proceedings of the 2008 ACEEE Summer Study on Energy Efficiency in Buildings: Scaling Up:
Building Tomorrow's Solutions. Pacific Grove, CA: American Council for an Energy-Efficient
Economy, 2008. 9.233-9.244.
RTTC. Effects of the Low Emissivity Shields on Performance and Power Use of a Refrigerated Display
Case. Refrigeration and Thermal Test Center (RTTC), Irwindale, CA: Southern California Edison,
1997.

27
RTTC. Effects on the FDA's 1993 Food Code on the Performance and Power Use of a Refrigerated Display
Case. Refrigeration and Thermal Test Center (RTTC), Irwindale, CA: Southern California Edison,
1997.
RTTC. Evaluation of Modular Defrost. Refrigeration and Thermal Test Center (RTTC), Irwindale, CA:
Southern California Edison, n.d.
RTTC. Proper Product Loading in Display Cases Impacts Food Safety and Energy Efficiency. Refrigeration
and Thermal Test Center (RTTC), Irwindale, CA: Southern California Edison, n.d.
Sarhadian, R., R. Faramarzi, B.A. Coburn, J. Lutton, H. Navaz, and D. Walker. "Paving the path for a new
generation of high-efficiency supermarket refrigerated display cases." Proceedings of the 2004
ACEEE Summer Study on Energy Efficiency in Buildings: Breaking Out of the Box. Pacific Grove,
CA: American Council for an Energy-Efficient Economy, 2004. 3.275-3.286.
Stoecker, W.F. Industrial Refrigeration Handbook. New York: McGraw-Hill, 1998.
Tassou, S.A., and D. Datta. "Influence of Supermarket Environmental Parameters on the Frosting and
Defrosting of Vertical Multideck Display Cabinets." ASHRAE Transactions 105, no. 1 (1999): 491-
496.
Tassou, S.A., D. Datta, and D. Marriott. "Frost formation and defrost control parameters for open
multideck refrigerated food display cabinets." Proceedings of the Institution of Mechanical
Engineers, Part A, Journal of Power and Energy 215 (2001): 213-222.
Thybo, C., B.D. Rasmussen, and R. Izadi-Zamanabadi. "Detecting Air Circulation Faults in Refrigerated
Display Cabinets." New Technologies in Commercial Refrigeration. Urbana, IL: International
Institute of Refrigeration, 2002. 211-217.
Topper, R., R. Gilliom, J. Sanders, and J. Breland. Microprocessor Controlled Demand Defrost for a
Cooled Enclosure. United States of America Patent 6,205,800. March 27, 2001.
Verma, P., C.W. Bullard, and P.S. Hrnjak. "Design Strategies for Reducing Performance Degradation due
to Frosting of Display Case Heat Exchangers." New Technologies in Commercial Refrigeration.
Urbana, IL: International Institute of Refrigeration, 2002. 227-237.
Wang, D., T. Tao, S. Kang, and G. Xu. "Non-contact frost thickness measurement by using a micro-
camera and image processing technology." Proceedings of the 2010 IEEE, International
Conference on Mechantronics and Automation. Xi'an, China: Institute of Electrical and
Electronics Engineers, 2010. 288-293.
Westphalen, D., R.A. Zogg, A.F. Varone, and M.A. Foran. Energy savings potential for commercial
refrigeration equipment. Washington, D.C.: Building Equipment Division, Office of Building
Technologies, U.S. Department of Energy, 1996.
28
Xiao, J., W. Wang, Q.C. Guo, and Y.H. Zhao. "An experimental study of the correlation for predicting frost
height in applying the photoelectric technology." International Journal of Refrigeration 33, no. 5
(2010): 1006-1014.
Xiao, J., W. Wang, Y.H. Zhao, and F.R. Zhang. "An analysis of the feasibility and characteristics of
photoelectric technique applied in defrost-control." International Journal of Refrigeration 32,
no. 6 (2009): 1350-1357.