Embed Size (px)
Citation preview
DEMAND FOR HIGHER EDUCATION PROGRAMS: THE IMPACT OF THE BOLOGNA PROCESS
ANA RUTE CARDOSO MIGUEL PORTELA
CARLA SÁ FERNANDO ALEXANDRE
CESIFO WORKING PAPER NO. 2081 CATEGORY 4: LABOUR MARKETS
AUGUST 2007
PRESENTED AT CESIFO VENICE SUMMER INSTITUTE, WORKSHOP ON ‘INNOVATION AND HIGHER EDUCATION’, JULY 2007
An electronic version of the paper may be downloaded • from the SSRN website: www.SSRN.com • from the RePEc website: www.RePEc.org
• from the CESifo website: Twww.CESifo-group.org/wp T
CESifo Working Paper No. 2081
DEMAND FOR HIGHER EDUCATION PROGRAMS: THE IMPACT OF THE BOLOGNA PROCESS
Abstract
The Bologna process aims at creating a European Higher Education Area where inter-country mobility of students and staff, as well as workers holding a degree, is facilitated. While several aspects of the process deserve wide public support, the reduction of the length of the first cycle of studies to three years, in several continental European countries where it used to last for four or five years, is less consensual. The paper checks the extent of public confidence in the restructuring of higher education currently underway, by looking at its implications on the demand for academic programs in Portugal. Precise quantification of the demand for each academic program is facilitated by the rules of access to higher education, in a nation-wide competition, where candidates must list up to six preferences of institution and program. We use regression analysis applied to count data, estimating negative binomial models. Results indicate that the programs that restructured to follow the Bologna principles were subject to higher demand than comparable programs that did not restructure, as if Bologna were understood as a quality stamp. This positive impact was reinforced if the institution was a leader, i.e. the single one in the country that restructured that program. Still an additional increase in demand was experienced by large programs that restructured to offer an integrated master degree, thus conforming to Bologna principles while not reducing the program duration.
JEL Code: I28, I21, F14.
Keywords: education policy, European Higher Education Area, economic, social and cultural integration, count data.
Ana Rute Cardoso IZA
Schaumburg-Lippe-Str. 7/9 Germany – 53113 Bonn
Miguel Portela School of Economics University of Minho Campus de Gualtar
Portugal – 4710-057 Braga [email protected]
Carla Sá
School of Economics University of Minho Campus de Gualtar
Portugal – 4710-057 Braga [email protected]
Fernando Alexandre School of Economics University of Minho Campus de Gualtar
Portugal – 4710-057 Braga [email protected]
March 2007 We are grateful to Paulo Guimarães, Dan Hamermesh, and Pedro Portugal for their comments on an earlier version of the paper, and to Nelson Areal for constructive interaction.
1 Introduction
The Bologna process is a far-reaching reform, involving currently 45 countries, which
aims at the creation of a European Higher Education Area by 2010. Major steps in
that direction, currently underway, include the creation of a comparable structure of
academic degrees, mutual recognition of diplomas and course units, the assessment of
academic institutions and programs based on common quality standards, and direct
incentives to geographical mobility of students and staff. Implementation of a common
structure of academic degrees means that some continental European countries are
having to move from a four- or five-year first cycle of studies into a shorter three-year
one, which led to controversy. On the one hand, the advantages of having a degree
recognized in a wider geographical space are praised, together with the redevelopment
of curricula that makes learning more student-centered and focused on the development
of competencies, while enabling earlier entrance into the labor market. On the other
hand, distrust has been expressed over the academic contents and adequacy to labor
market needs of the competencies transmitted in a shorter three-year period, with fears
that the employability of graduates will be reduced, when compared to graduates of
the longer cycle.
This study aims at checking the degree of public confidence in the restructuring of
the first cycle of higher education studies currently taking place under the Bologna
process. More precisely, we concentrate on the reaction of students, to analyze the
impact of the Bologna restructuring on demand for academic programs by candidates
to higher education. We focus on the Portuguese system.
We take advantage, first of all, of the legal setting in Portugal, where institutions
were given the option to adjust their academic programs to the Bologna curricula
starting in the academic year 2006/07, or to defer adjustment to one of the two following
years. Therefore, in 2006/07 a group of early implementers coexists with a group
of academic programs that still have not undergone change, and students were free
to choose where they would like to be admitted. Under this setting, the decisions
by academic institutions and students can be analyzed in the conventional signaling
framework (Gibbons, 1992; Salanie, 2000). Academic institutions decide whether to
adopt immediately the Bologna principles and students decide whether to apply to a
Bologna program. Institutions are in this case the informed players, who have insider
1
information on program quality, which they can choose to reveal (or not) by means of
signals. Interestingly, in the public debate surrounding the Bologna changes, the idea
that institutions that adapted first were signaling their readiness for change and their
higher quality, was often stressed. Prospective students, on the other hand, are free
to apply to a particular institution and they are presumably interested in attending
an institution that guarantees a certain education quality (Long, 2004). Whereas the
program quality is institution’s private information, the decision to conform to the
Bologna principles is publicly observed. Under this framework, our main purpose is to
test whether students sort out academic programs by looking at whether the curriculum
has been adapted to Bologna.
Secondly, the analysis is facilitated by the system of access to higher education in
Portugal. Candidates must clearly rank up to six choices of institution and academic
program, and a national competition follows, run by the Ministry of Science, Technol-
ogy and Higher Education (MSTHE), which allocates candidates based on their relative
performance and the number of available vacancies posted by each institution for each
program. Thirdly, we have a comprehensive dataset on the application process, which
renders this analysis feasible.
The paper proceeds describing the main characteristics of the Bologna process in
the international context, in section 2.1. Sections 2.2 and 2.3 concentrate on Portugal,
to present the higher education system and describe the implementation of the Bologna
process, showing how it provides good conditions for economic analysis under the basic
signaling framework. The empirical strategy is presented in the following sections:
section 3.1 presents the data set and section 3.2 describes the method and major
problems to be tackled. Section 4 discusses the results, before concluding comments
are presented.
2 Implementation of the Bologna process
2.1 International context
The 1960s and 1970s witnessed in Europe an expansion of the higher education system.
Since then, the number of students has increased rapidly and new types of higher
education programs have been created (e.g., professional higher education). Meanwhile,
an increasing number of students decided to go abroad for at least part of their higher
2
education. With rising international mobility of students, European countries started
considering the coordination of their higher education systems. At the same time,
globalization and increased international competition highlighted the importance of
making European higher education institutions attractive to the world. Initial steps
towards the coordination of European higher education systems were taken with the
signature of the Sorbonne declaration by the Ministers in charge of higher education
of France, Italy, United Kingdom and Germany, in 1998, and later, in 1999, with
the signature of the Bologna declaration. These steps were followed by Ministerial
Conferences at Prague 2001, Berlin 2003, and Bergen 2005.
The Bologna process aims at creating a European Higher Education Area, where
internal mobility of students, teachers, and administrative staff is facilitated, whose
competitiveness attracts students from outside and contributes to the broader aim of
turning Europe into a leading knowledge-based society. For a discussion of the benefits
of degree standardization and harmonization and of international mobility, in creating
competitive European higher education institutions see, among others, van der Ploeg
and Veugelers (2007). The main pillars of the process include:
• Comparability of the degree structure, based on three cycles: the bachelor degree
(three years, according to the dominant model), the master (normally two years),
and the doctorate.
• Mutual recognition of degrees, other awards, and course units. Further to a com-
parable degree structure, a system of academic credits was created, whose accumu-
lation and transferability across countries is guaranteed, enabling mutual recogni-
tion of degrees, other academic qualifications, and periods of study abroad. In the
same line, a Diploma Supplement was introduced, which describes the degree and
qualifications obtained, in terms of workload, level, and learning outcomes. The
overall aim is to improve transparency of higher education degrees and to render
more flexible progression into further studies and access to the labor market, while
improving the attractiveness of the European higher education system.
• Assessment and accreditation of institutions and academic programs based on
shared quality standards and procedures.
• Development of mobility programs by student, teaching, research and administra-
tive staff, including measures such as the portability of national loans and grants.
3
• External dimension of the process, through exchange and cooperation with other
parts of the world (for example, Latin American and the Caribbean).
Even though the process is far-reaching and multifaceted, much attention has been
devoted to the changes in the degree structure. Indeed, according to the model that
predominated in several continental European countries, the first higher education
degree was obtained after four to five years of successful study. Therefore, the curricula
changes necessary to bring the first degree down to three-years are being implemented
amidst some controversy.
On one hand, the advantages of having a comparable degree structure are stressed,
as the system becomes more transparent and obstacles to the mobility of students and
workers are reduced. However, the new curricula are often interpreted as a compressed
version of the longer programs, and critics claim that there will not be enough time
for assimilation, reflection and a critical approach to learning, which will undermine
the quality of the degree. Under these circumstances, the employability of the new
graduates might be reduced, when competing with graduates from the previous system
of a longer first cycle. Moreover, there is the fear that public funding will be restricted
to the first (three-year) cycle, thus imposing a higher burden on students if they want to
progress beyond the first degree, when compared to the system that used to guarantee
public funding for four or five years.
The relevance attached to this issue varies across scientific fields, with the problem
usually not raised in the humanities, while it is highlighted in several countries for
occupations regulated by professional bodies (Reichert and Tauch, 2005) and subject
to specific European Union coordination mechanisms (see the case of architecture and
health sciences).
Between optimism and skepticism, it is not certain how the behavior of students
and labor market agents will change during the period of adjustment to the Bologna
changes in higher education curricula.
2.2 Portuguese higher education system: organization and admission pro-
cedures
Portugal has a binary higher education system comprising universities and polytechnic
schools.1 The former aim at providing general academic education and they are in
1As well as the military and police institutions, and the Open University (institution for distance learning).
4
charge of most research activity, whereas the latter are traditionally more vocationally
oriented. This study concentrates on the publicly funded higher education system,
which comprises 14 universities and 26 polytechnics.2
Most higher education institutions are located in the densely populated coastal
area. The capital, Lisbon, harbors four universities; among the remaining universities,
three are located in the north (Braga/Guimaraes, Oporto and Vila Real), three in
the center (Aveiro, Coimbra and Covilha), two in the south (Evora, Faro) and two
in the islands (Azores and Madeira). Polytechnics are the result of a policy of local
development promotion. Though more evenly spread over the country, there is still
some concentration by the coastal line.
Enrollment in higher education is limited by a system of numerus clausus. The
number of vacancies is defined yearly by each institution, subject to communication
to the MSTHE.3 The application process takes place at the centralized national level.
Each candidate ranks up to six priorities, each comprising a pair institution/program.
The nation-wide competition that follows allocates the candidates based on their grade
point average and the stated ranking of preferences.
Successful completion of secondary education is a prerequisite for admission into
higher education by students younger than 23 years.4 In addition, candidates must
pass national admission exams. Definition of the number of exams, their subjects, the
minimum classification required, the weighting scheme to compute the final grade point
average, and the minimum grade point average required, rests with each institution.5
In any case, the number of exams required must be one or two, and the computation of
the final grade point average (expressed in a scale of 0 to 200) for ranking the applicants
to each institution and program must obey the following rules: the grade point average
at completion of secondary school, which takes into consideration the three final years
of secondary school, must have a weight of at least 50 percent; the specific national
2The private system comprises 55 universities and 60 polytechnics, but most of these institutions are of smalldimension, offering a very restricted number of study programs, in one or two areas. This sub-system is not subject toanalysis here, first of all because private providers have more freedom to define the application and admission rules (forexample, the timing for applications is very different, with several private institutions defining the application phasesuch that students can still apply after they know the results from the public sector contest). Secondly, there is nocentralized application procedure in the private sector, thus making it very difficult to collect enough and comparabledata for analysis.
3Who can, under special circumstances, change the proposal. For a few programs, joint approval by this Ministryand a second one is required.
425 years old, until 2005. Older candidates who do not hold a secondary school degree are subject to a different setof exams specific to each program.
5In special cases where physical, vocational or other abilities are relevant, other specific admission requirements mayapply (pre-requisitos).
5
admission exam(s) must have a weight of at least 35 percent.6
Certain admission exams are known to place tougher requirements on the applicants.
Traditionally hard subjects are: mathematics, where only 26% of the students obtained
in 2006 a passing grade (27% in 2005, and 31% in 2004 and 2003); physics, where the
share of students passing the exam was 30%, 47%, 37%, and 22%, respectively in 2006,
2005, 2004, and 2003; and chemistry, where those shares were, respectively, 35%, 52%,
41% and 53%.
The allocation of candidates comprises two major phases: the first one takes place in
July/August; the second takes place in August/September and includes the vacancies
that have not been filled in the first phase. Students who were not successful in the
first phase, or who were successful but wish to change the institution/program where
they were placed, and those who had not applied in the first phase (either because they
did not yet fulfill all the requirements or because, though fulfilling the requirements,
had decided not to apply), are eligible to apply in the second phase.
2.3 The Bologna process in Portugal: a signaling framework
The implementation of the Bologna process, led by the Portuguese MSTHE, is part of
a process of reorganization and rationalization of the higher education system (OECD,
2006), taking place in a framework of growing imbalances between demand and sup-
ply. In fact, the number of students enrolled in higher education doubled during the
1990s, with enrollment in public universities increasing by 62% (MSTHE, 2006) and
the remaining being absorbed through expansion of public polytechnics and the private
sector. However, since then a number of factors have combined to generate excess of
capacity and increasing competition for students between institutions. Among these
factors, the MSTHE (2006) stresses: the decline in the number of candidates, due
to demographic changes; the increasingly strict admission conditions, following the
reintroduction of national admission exams and minimum grades; and the increased
number of vacancies, due to large investments made in the public sector.
This increased competition motivated strategies of differentiation by institutions,
namely by defining different entry conditions, with the most recognized institutions
setting higher entrance standards and, therefore, targeting different segments of the
student population (MSTHE, 2006). The speed of adjustment to the Bologna process
6If other special requirements apply, they cannot be attached a weight larger that 15 percent.
6
has often been pointed out as an instrument in this strategy of differentiation. Like
in other continental European countries, the reduction of the length of the first cycle
of studies was one of the more debated Bologna changes. The common duration of a
higher education degree used to be in Portugal five years, until mid-1990s, when it was
reduced to four years; the Bologna process further imposes a reduction to three years.
There is nevertheless the possibility to keep the duration of a program longer. Whereas
the first cycle (licenciatura) has a normal duration of three years and the second cycle
(mestrado) has a normal duration of one and a half or two years, in special cases it is
feasible to offer a combined degree, the so-called integrated master, lasting for five to
six years.
Institutions could choose to start implementing the Bologna curricula changes in
the academic year of 2006/07 or one of the two following years. Some institutions saw
the prompt implementation of the Bologna process as an opportunity to establish or
reinforce a reputation of an up-to-date institution, whose graduates would benefit from
the opportunities of a wider labor market. Institutions taking the lead might gain a
comparative advantage over the late-comers, not just attracting more applicants in the
first year after restructuring, but also gaining a reputation beneficial for future years.
Other institutions, instead, opted to delay the process, arguing that changes should be
thought over, and that the labor market would penalize the graduates from the new
shorter first cycle. Table 5 shows that about 43% of the study programs have adjusted
to the Bologna principles. Table 6 further disaggregates that number by institution.
The decision by the University of Coimbra to defer to 2007/08 the adoption of the
new model (with exceptions authorized for programs on which a national consensus
for change had been reached among institutions) is evident in the table, as is the fact
that University of Madeira did not adapt any of its programs. This decision contrasted
to that of Universidade Nova de Lisboa and ISCTE, which moved ahead restructuring
most of its programs.
Previous research has suggested that the demand for higher education programs
depends on program quality and prestige (e.g., Long, 2004), which in turn reflects
on individuals labor market performance (e.g., Black and Smith, 2004). However, as
identified in the OECD’s review of the Portuguese higher education system, “the level
of public information on course content, program goals, quality and opportunities and
graduate employment is inadequate or unavailable”(OECD, 2006: 27). For example, it
7
was just in 2006 that a formal independent accreditation agency was announced, start-
ing activity in 2007. The lack of independent institutions delivering publicly available
quality assessments implies that students lack precise guidance in their choice processes.
In this context, the decision regarding adoption of the Bologna principles can be
analyzed in the framework of the conventional signaling model, where students can infer
the quality of the academic program by checking whether it has been reformulated
to follow the Bologna principles.7 In the signaling process between institutions and
students, the former is the informed player, having insider information on program
quality. Even though quality is not synonymous with being in the leading group of
Bologna adopters, in the public discussions it has often been highlighted that readiness
for change towards international standards and fulfillment of stricter quality guidelines,
provides an indication of academic quality. Moreover, the quality of the academic
program and its ability to adapt to Bologna rules may be positively correlated, if both
depend on the quality of the research activities developed in a department or even
the readiness to work of its staff members. Having allowed institutions to choose the
moment to implement the Bologna principles, the Portuguese higher education sector
provides a good illustration of the strategic problem of institutions.
Students may themselves have opted for contrasting strategies. Some may associate
Bologna with a quality stamp and a guarantee of recognition of the degree in a wider
geographical space, yielding better employment opportunities, whereas others may
attach a higher reputation to a more established longer program. The candidates to
a higher education degree will be the agent we consider, and their demand for higher
education programs the precise indicator under scrutiny. The aim is to check whether
students read the Bologna signal as an indicator of program quality.
This analysis is rendered feasible by the fact that admission into higher education
in Portugal is strictly regulated and implemented through a nation-wide competition,
where candidates must clearly state their preferences for institutions and academic
programs. Demand can thus be quantified in an unequivocal way.
7For an example of a signaling game applied to the higher education system, see Mizrahi and Mehrez (2002).
8
3 Empirical strategy
3.1 Data set
The data used is made publicly available by the MSTHE, on a web site of the Depart-
ment of Higher Education (DGES) dedicated to announce the results of the process of
allocation of candidates to higher education programs.8
Data for the academic years 2003/2004 to 2006/2007 have been collected. The
following variables are available: overall demand for each program (total number of
students listing the pair institution/program among their preferences, irrespective of
its ranking), as well as the number of students who have selected each program as
their first choice, second choice and so forth (up to a maximum of six choices); number
of vacancies available at each program in each of the two stages of the application
process; national admission exams required by the program, with the major ones being
mathematics, physics, chemistry, biology and portuguese; the field of study of the
program.9
Table 5 in appendix provides descriptive statistics on the dataset. The second
phase of application involves, as expected, remarkably less applicants, since it can be
considered the residual phase. A declining trend in the number of applications can
be detected between 2003 and 2005, with an increase in the number of applicants
the following year. A declining proportion of programs required an entrance exam on
maths, physics, chemistry, biology or portuguese. The share of applicants to each field
of study has remained rather stable over time.
3.2 Model under estimation
Two alternative concepts are used to quantify the demand for each program at an
institution:
• Hits: number of applicants who placed that program in that institution among
their choices (irrespective of its ranking, from first to sixth).
• First choice: number of applicants who placed that institution and program as
their first choice.8Direccao Geral do Ensino Superior, at http://www.acessoensinosuperior.pt. Throughout the text, a program is
meant to refer to a pair institution/academic program, unless otherwise explicitly explained.9We have consistently used the classification adopted by the Ministry in 2006, which includes ten areas: agriculture,
architecture, natural sciences, law and social sciences, economics and business, sports and arts, education, humanities,health, and technologies.
9
The dependent variable in our model is thus a nonnegative integer. The distribution
of the variable is in both cases skewed to the left. As such, an adequate tool to model
the process is the count data regression analysis (Cameron and Trivedi, 1998).
Given the panel structure of the data, we started with the fixed effects Poisson
model, to take into account unobserved heterogeneity across academic programs. The
descriptive statistics reveal that the dependent variable presents raw overdispersion.
This indicates that the negative binomial regression model might be more appropriate
for our data, since it relaxes the hypothesis of equal mean and variance. The results of
formal overdispersion tests indeed show clearly that a negative binomial specification
is more appropriate.10
However, Allison and Waterman (2002) point out that the fixed-effects negative
binomial model, as defined by Hausman et al. (1984), is not a fixed-effects model in
the usual sense, because the fixed effect applies to the overdispersion parameter, rather
than to the covariates. That is, that model specification solves the overdispersion
problem, but does not guarantee that the program-specific effects are conditioned out
of the likelihood. Guimaraes further shows that in the parameterization proposed by
Hausman et al. (1984) “the individual fixed effects will cancel out only if [...] there
is a specific functional relation between the individual fixed effect and the individual
overdispersion parameter”(Guimaraes, 2006: 4), which is not necessarily true. As such,
a test for the null hypothesis of successful removal of the fixed effects is required. To
our knowledge, the only test available is that proposed by Guimaraes (2006). When
applied to our data, that test rejects the null hypothesis. Nevertheless, according to the
simulations performed by Guimaraes (2006), the test is not recommended for samples
with small time dimensions, as is our case.11
Gathering all the arguments and evidence, we have decided to implement in the
analysis that follows the strategy by Allison and Waterman (2002), which consists on
estimation on the pooled sampled of an unconditional negative binomial model with
dummy variables to account for the fixed effects. We report below the results of this
10The test is based on the idea that a fixed effects Poisson model can be seen as a multinomial model (see Guimaraesand Lindrooth, 2005), implying that testing for overdispersion in the multinomial model can achieve testing for overdis-persion in the Poisson model. We then use a Pearson test for the null hypothesis of no overdispersion in the multinomialmodel, which is rejected at any ordinary level of significance in all the specifications reported later. The overdispersiontest was implemented using the Stata command multin.
11According to Guimaraes (2006: 7) “with panels as large as 1000 individuals the test requires at least 20 observationsper individual to adequately control for type I error.”
10
model.12 Following Cameron and Trivedi (1998), the model is specified as
Pr (Y = y|µ, α) =Γ (y + α−1)
Γ (y + 1) Γ (α−1)
(
α−1
α−1 + µ
)
α−1 (
µ
α−1 + µ
)
y
(1)
where y is the count for our dependent variable, µ = exp(xβ), α ≥ 0 is the overdisper-
sion parameter, Γ(.) is the gamma function, and x is a vector of regressors, including a
dummy variable for each study program. This specification assumes constant disper-
sion within groups, equal to 1 + αµ. The mean and variance of y are defined as µ and
µ + αµ2, respectively.
The vector of regressors x, the program attributes, includes, first of all, whether
it requires a national admission exam in a particular subject (dummy variables for
mathematics, physics, chemistry, biology and portuguese). Controlling for the sub-
jects required as admission exams is particularly relevant. Indeed, a generally poor
performance in the admission exam in a certain subject reduces the size of the pop-
ulation that can potentially apply to programs requiring that exam. Secondly, we
controlled for the scientific field of the program (captured by 9 dummy variables). Dif-
ferent scientific fields reacted differently to the implementation of the Bologna process
(consider for example the contrast between humanities and other fields). Estimation
of the model including field-specific dummy variables can control for these differences.
We also control for the phase of the application process, with a dummy variable equal
to one in the second phase, since this is a residual phase, for vacancies not previously
filled and students who were not placed in the first phase or who wish to be placed
elsewhere. Given sharp differences in the dimension of the different programs and
across institutions, we also control for the size of the program (number of vacancies
posted). The crucial variable, Bologna06, achieves the value one if the program was
restructured to adapt to the Bologna principles, and zero otherwise.
All the specifications include a fixed effect for each program. The model thus ac-
counts for endogenous adoption of the new academic model. In fact, the timing and
extent of adaptation to the Bologna principles may be viewed as a political decision
by the direction of the program at each institution, which may self-select into restruc-
turing promptly or delaying adjustment, based on, among other factors, expectations
about demand for their programs. These program-specific effects capture as well fac-
12The results are similar to those obtained with the fixed-effects Poisson or negative binomial models. All sets ofresults are available from the authors upon request.
11
tors other than its strategy, such as the amount of resources, reputation, or regional
conditions.
Three variables were used to capture the group of Bologna adopters:
• Bologna implementer: a program at an institution, which has been restructured
according to the Bologna process.
• Bologna leader: a Bologna implementer, who was the only institution in the coun-
try that restructured that academic program. This group of early-implementers
has set itself apart from the other institutions in the country, making an early
move and most likely expecting to gain from its timing. It is a group more likely
to be affected (either gaining or losing) by the change.
• Bologna implementer without shortening the duration of the program (integrated
master): the possibility used by some institutions to restructure a program while
nevertheless keeping a duration longer than the normal Bologna duration for the
first cycle is explicitly taken into account. We distinguish between programs that
reduced their duration and those that, though having restructured to conform to
the Bologna principles, offer a joint first and second cycle degree, thus keeping a
longer duration.
Comparison of the first and last specifications allows in particular to check the relevance
attached by candidates to the stamp and reputation associated with Bologna, and to
the change in the duration of the program.
4 Impact of the Bologna process
This section presents results of the estimation of the negative binomial model just
described. Alternative specifications of the model are reported, using in every case the
variable hits to quantify the demand for a program, i.e. the total number of candidates
that listed the program among their preferences, irrespective of its rank position. The
first specification controls for the phase in the application process, program size, the
set of admission exams required, field of study and a time trend. Specification 2 further
allows the time trend to diverge across fields of study. Specification 3 further checks
whether the impact of the Bologna process was different across fields of study.
12
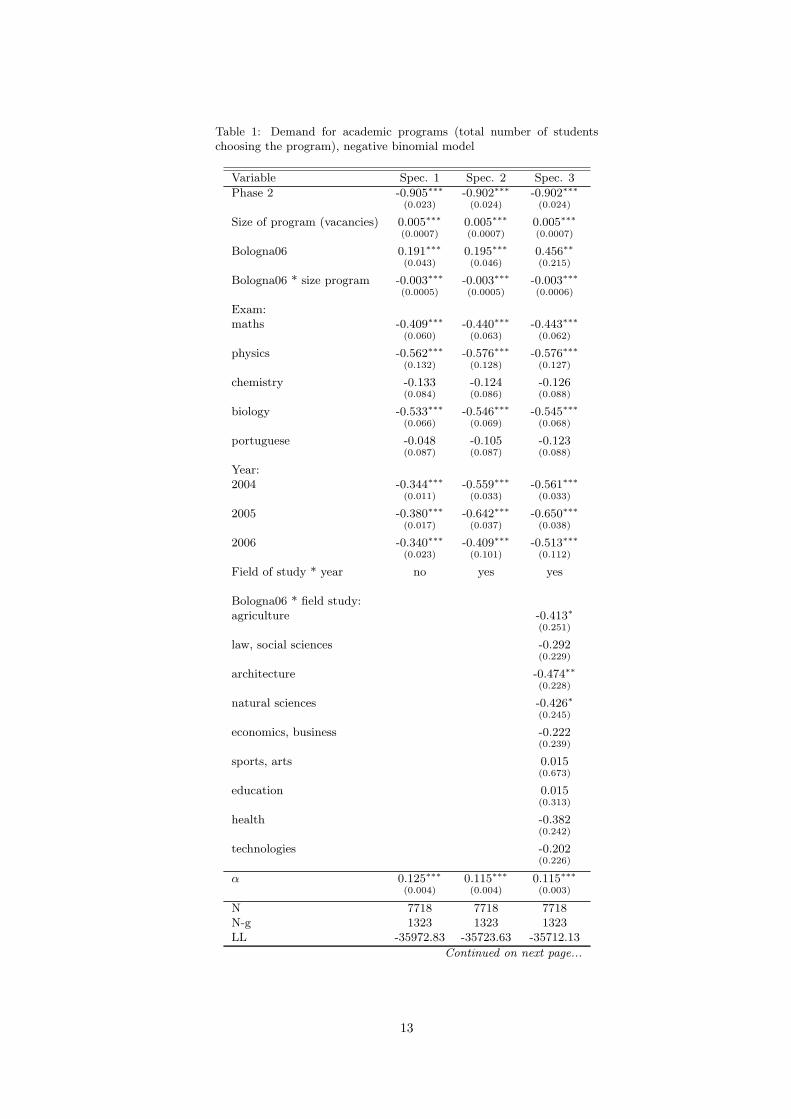
Table 1: Demand for academic programs (total number of studentschoosing the program), negative binomial model
Variable Spec. 1 Spec. 2 Spec. 3
Phase 2 -0.905∗∗∗ -0.902∗∗∗ -0.902∗∗∗
(0.023) (0.024) (0.024)
Size of program (vacancies) 0.005∗∗∗ 0.005∗∗∗ 0.005∗∗∗
(0.0007) (0.0007) (0.0007)
Bologna06 0.191∗∗∗ 0.195∗∗∗ 0.456∗∗
(0.043) (0.046) (0.215)
Bologna06 * size program -0.003∗∗∗ -0.003∗∗∗ -0.003∗∗∗
(0.0005) (0.0005) (0.0006)
Exam:maths -0.409∗∗∗ -0.440∗∗∗ -0.443∗∗∗
(0.060) (0.063) (0.062)
physics -0.562∗∗∗ -0.576∗∗∗ -0.576∗∗∗
(0.132) (0.128) (0.127)
chemistry -0.133 -0.124 -0.126(0.084) (0.086) (0.088)
biology -0.533∗∗∗ -0.546∗∗∗ -0.545∗∗∗
(0.066) (0.069) (0.068)
portuguese -0.048 -0.105 -0.123(0.087) (0.087) (0.088)
Year:2004 -0.344∗∗∗ -0.559∗∗∗ -0.561∗∗∗
(0.011) (0.033) (0.033)
2005 -0.380∗∗∗ -0.642∗∗∗ -0.650∗∗∗
(0.017) (0.037) (0.038)
2006 -0.340∗∗∗ -0.409∗∗∗ -0.513∗∗∗
(0.023) (0.101) (0.112)
Field of study * year no yes yes
Bologna06 * field study:agriculture -0.413∗
(0.251)
law, social sciences -0.292(0.229)
architecture -0.474∗∗
(0.228)
natural sciences -0.426∗
(0.245)
economics, business -0.222(0.239)
sports, arts 0.015(0.673)
education 0.015(0.313)
health -0.382(0.242)
technologies -0.202(0.226)
α 0.125∗∗∗ 0.115∗∗∗ 0.115∗∗∗
(0.004) (0.004) (0.003)
N 7718 7718 7718N-g 1323 1323 1323LL -35972.83 -35723.63 -35712.13
Continued on next page...
13
... table 1 continued
Variable Spec. 1 Spec. 2 Spec. 3
Significance levels: ∗ : 10% ∗∗ : 5% ∗ ∗ ∗ : 1%. Standard er-rors in parentheses: Huber-White adjusted standard errors, consideringclustering of observations within each academic program for differentmoments in time. N is the number of observations, N-g is the numberof groups institution/program, and LL stands for log-likelihood. Allregressions include program-specific dummy variables.
As a preliminary remark, note that this set of results clearly indicates the presence
of overdispersion (see the value and significance of the estimated α parameter). This
is evidence in favor of the negative binomial specification.
As expected, larger programs (posting more vacancies) are subject to larger de-
mand. Also quite naturally, the second phase gathers a remarkably lower number of
applications, since it is a residual phase. The demand for a higher education program
is strongly affected by the performance of the candidates in the national admission
exams. Requirement of an admission exam on biology, mathematics or physics lowers
the demand for the program. Overall demand for university programs declined until
2005 (relative to 2003, the omitted category), recovering in 2006.
Programs that restructured to follow the Bologna principles were subject to an
increase in demand, when compared to programs that did not restructure. More pre-
cisely, those that restructured were subject to 21% (= exp(0.191)) higher demand (see
specification 1). This effect (slowly) decreases with the dimension of the academic pro-
gram (note that the magnitude of the coefficient on the size of the program interacted
with the Bologna dummy variable is negative, although small in absolute value). The
previous results are robust to the introduction (in specification 2) of controls for the
different trend over time in demand across scientific fields.
Specification 3 further allows the impact of the adoption of the Bologna principles
to be heterogeneous across scientific fields. This is particularly relevant if one keeps in
mind that different areas welcomed with different degrees of enthusiasm or skepticism
the changes. We find that in the humanities (the omitted category), restructuring of the
programs according to the Bologna process was associated with a 58% (= exp(0.456))
increase in demand (see the coefficient on the overall Bologna dummy); that impact
was not significantly different for programs in law, economics and business, sports
and arts, education, and technology. The impact was negative for programs in the
architecture area, since its estimated coefficient is negative and outweighs the positive
14
Bologna effect observed for the base category.13
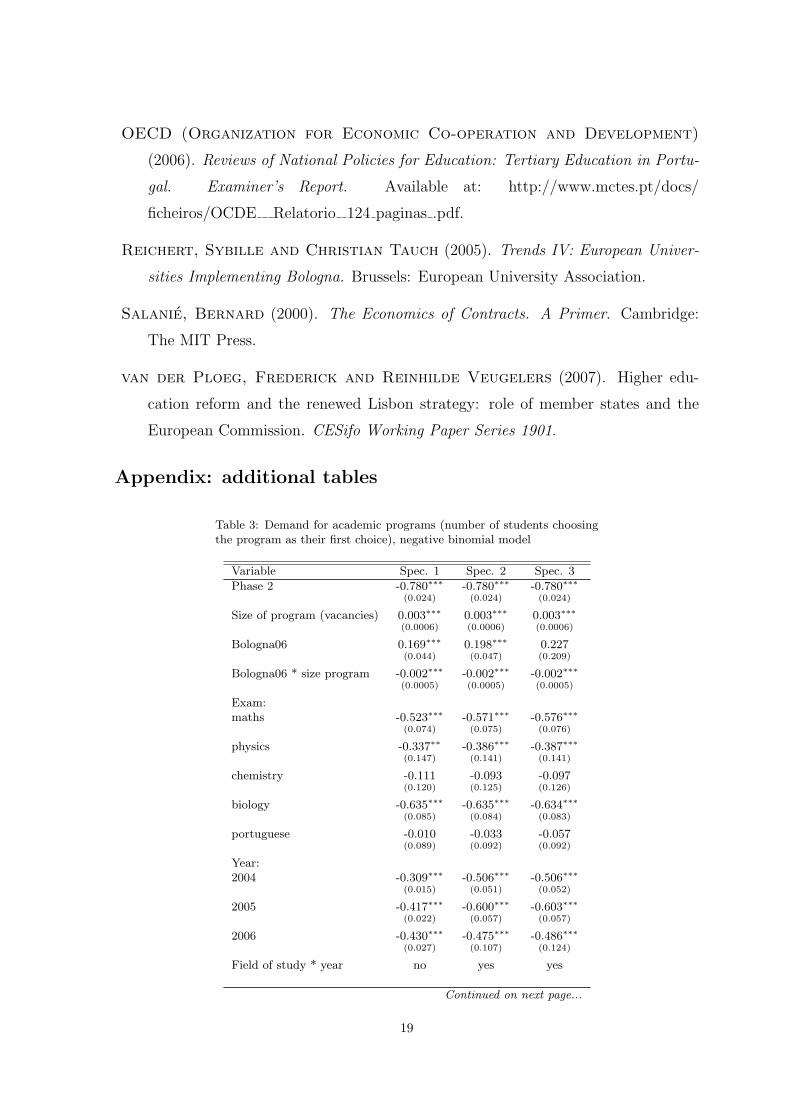
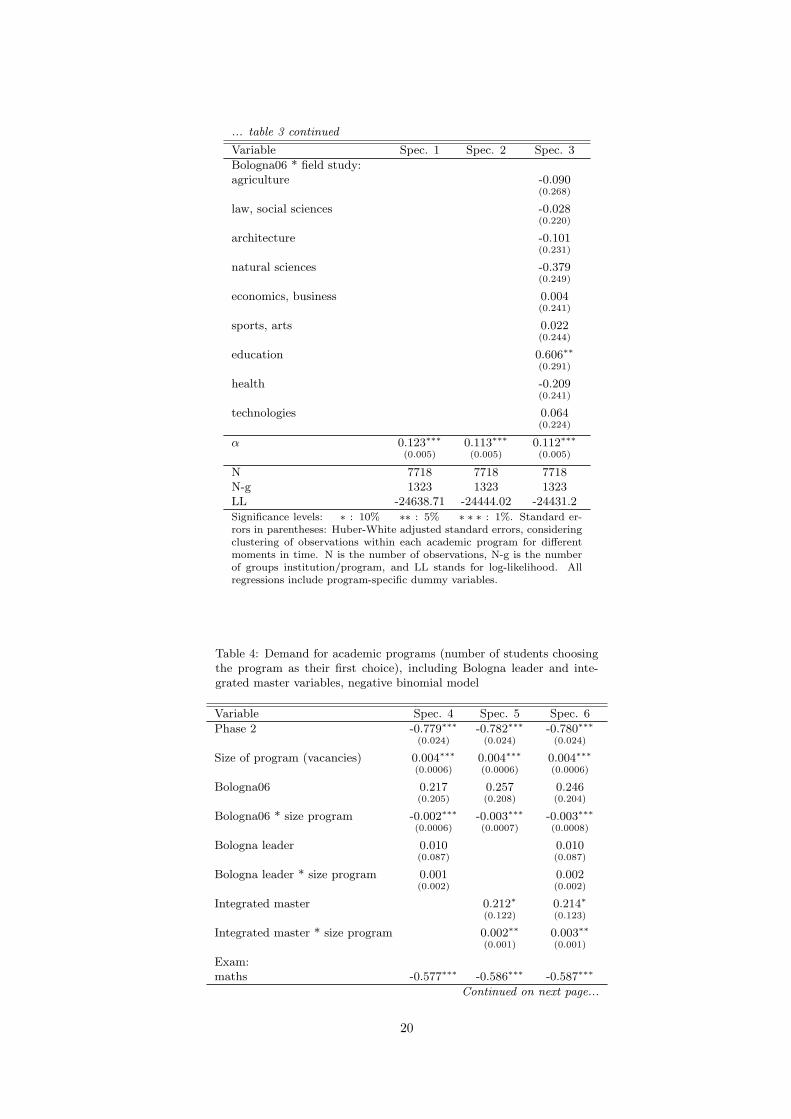
Table 3 in appendix reports comparable results considering as dependent variable the
number of applicants who ranked the program as their first choice. Specifications 1 and
2 report findings similar to the previous ones: having restructured to follow Bologna
is associated with a 18% to 22% (that is, exp(0.169) and exp(0.198), respectively)
increase in the demand for a program. Specification 3 highlights the positive impact
of the Bologna restructuring on the first choice of programs by candidates in the field
of education.
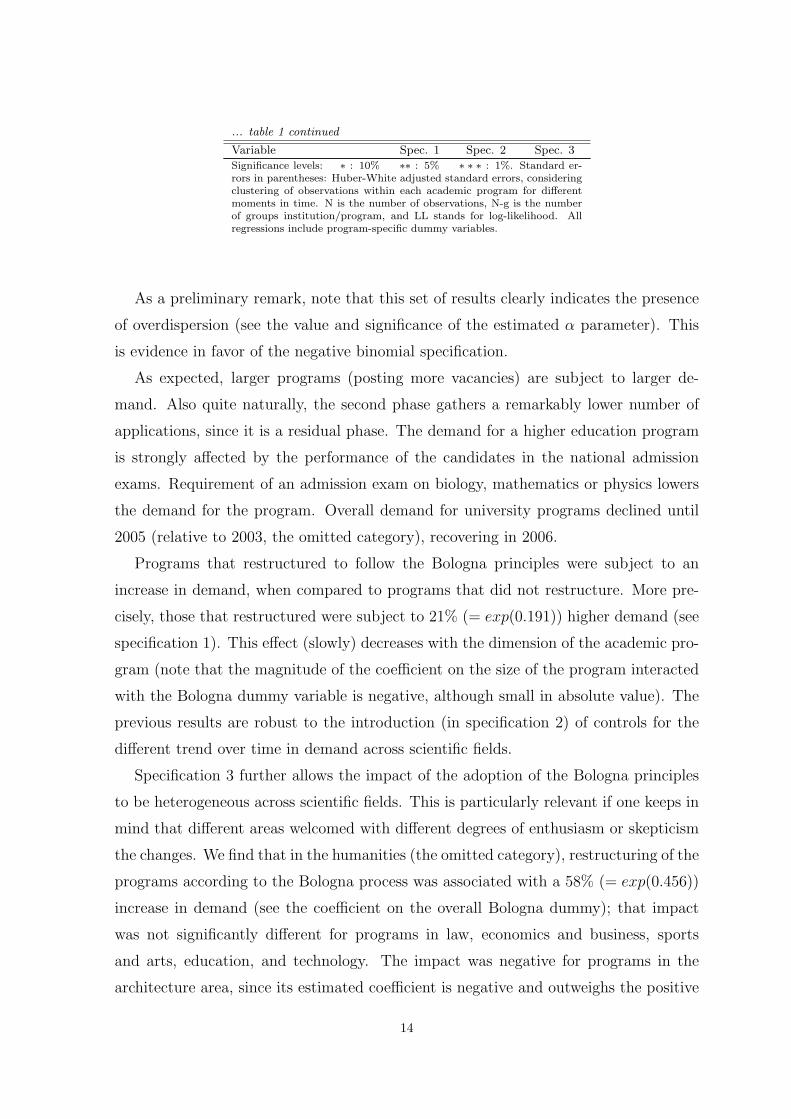
We further checked whether the impact of the Bologna process could be different,
depending on the intensity of the changes. First of all, we considered whether being a
national leader in a certain program implementing the Bologna curricula was associated
with some benefit (or penalty) in terms of demand by prospective students (specifica-
tion 4 in table 2). Secondly, we checked whether restructuring to offer a joint first and
second cycle degree (the so-called integrated master) of a longer duration yielded some
benefit in terms of demand (specification 5). Then we considered simultaneously those
two variables.
The first column in table 2 indeed reveals that being a leader in the implementation
of the Bologna curricula led to an increase in demand for a program, above the increase
experienced by Bologna implementers in general. This effect holds irrespective of the
size of the program.
As to the impact of restructuring to offer an integrated master program, results
indicate that there was a positive impact on demand for programs that restructured and
kept a long duration, above the impact for Bologna implementers in general; however,
this increase in demand took place only for large programs.
Once we check jointly the impact of being a Bologna leader and the impact of
having restructured to offer a long integrated master program, the previous results hold:
national leaders in the adoption of the Bologna curricula attracted more applicants than
Bologna changers in general, and a further increase in demand was directed at large
programs that became an integrated master under the Bologna setting.
13This study area includes not just strictly architecture, but also programs such as design.
15
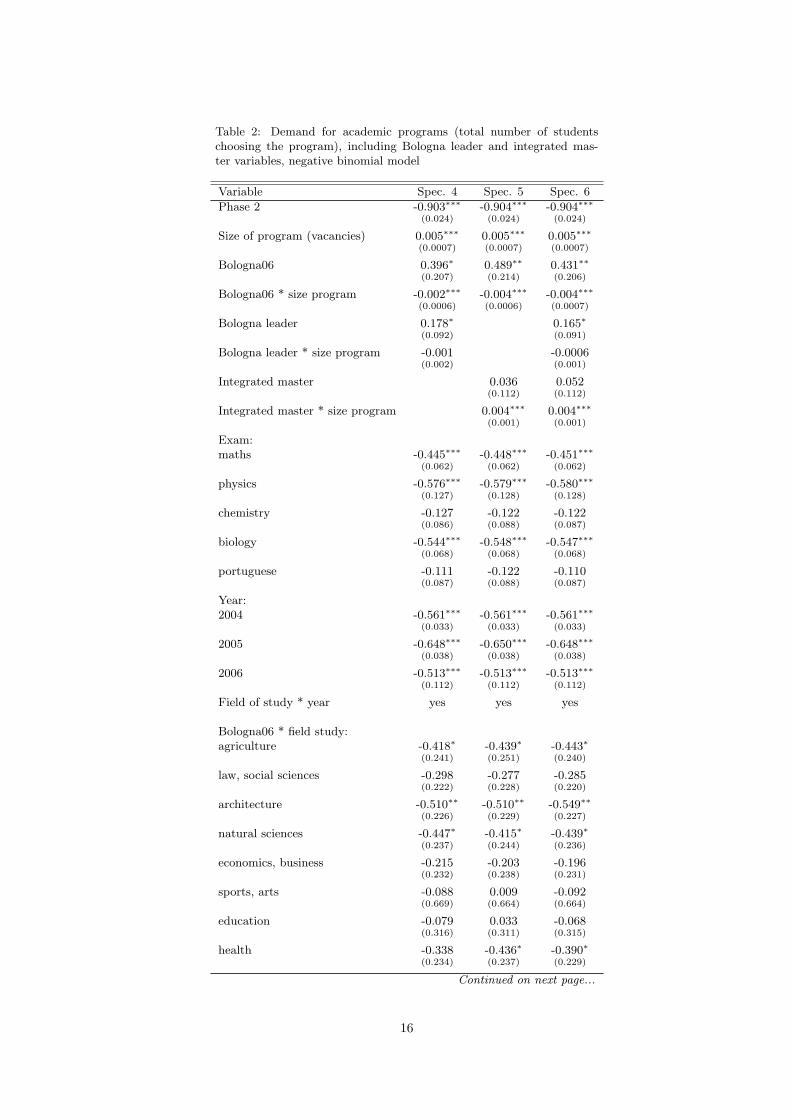
Table 2: Demand for academic programs (total number of studentschoosing the program), including Bologna leader and integrated mas-ter variables, negative binomial model
Variable Spec. 4 Spec. 5 Spec. 6
Phase 2 -0.903∗∗∗ -0.904∗∗∗ -0.904∗∗∗
(0.024) (0.024) (0.024)
Size of program (vacancies) 0.005∗∗∗ 0.005∗∗∗ 0.005∗∗∗
(0.0007) (0.0007) (0.0007)
Bologna06 0.396∗ 0.489∗∗ 0.431∗∗
(0.207) (0.214) (0.206)
Bologna06 * size program -0.002∗∗∗ -0.004∗∗∗ -0.004∗∗∗
(0.0006) (0.0006) (0.0007)
Bologna leader 0.178∗ 0.165∗
(0.092) (0.091)
Bologna leader * size program -0.001 -0.0006(0.002) (0.001)
Integrated master 0.036 0.052(0.112) (0.112)
Integrated master * size program 0.004∗∗∗ 0.004∗∗∗
(0.001) (0.001)
Exam:maths -0.445∗∗∗ -0.448∗∗∗ -0.451∗∗∗
(0.062) (0.062) (0.062)
physics -0.576∗∗∗ -0.579∗∗∗ -0.580∗∗∗
(0.127) (0.128) (0.128)
chemistry -0.127 -0.122 -0.122(0.086) (0.088) (0.087)
biology -0.544∗∗∗ -0.548∗∗∗ -0.547∗∗∗
(0.068) (0.068) (0.068)
portuguese -0.111 -0.122 -0.110(0.087) (0.088) (0.087)
Year:2004 -0.561∗∗∗ -0.561∗∗∗ -0.561∗∗∗
(0.033) (0.033) (0.033)
2005 -0.648∗∗∗ -0.650∗∗∗ -0.648∗∗∗
(0.038) (0.038) (0.038)
2006 -0.513∗∗∗ -0.513∗∗∗ -0.513∗∗∗
(0.112) (0.112) (0.112)
Field of study * year yes yes yes
Bologna06 * field study:agriculture -0.418∗ -0.439∗ -0.443∗
(0.241) (0.251) (0.240)
law, social sciences -0.298 -0.277 -0.285(0.222) (0.228) (0.220)
architecture -0.510∗∗ -0.510∗∗ -0.549∗∗
(0.226) (0.229) (0.227)
natural sciences -0.447∗ -0.415∗ -0.439∗
(0.237) (0.244) (0.236)
economics, business -0.215 -0.203 -0.196(0.232) (0.238) (0.231)
sports, arts -0.088 0.009 -0.092(0.669) (0.664) (0.664)
education -0.079 0.033 -0.068(0.316) (0.311) (0.315)
health -0.338 -0.436∗ -0.390∗
(0.234) (0.237) (0.229)
Continued on next page...
16
... table 2 continued
Variable Spec. 4 Spec. 5 Spec. 6
technologies -0.198 -0.265 -0.265(0.219) (0.227) (0.220)
α 0.115∗∗∗ 0.115∗∗∗ 0.114∗∗∗
(0.003) (0.003) (0.003)
N 7718 7718 7718N-g 1323 1323 1323LL -35706.39 -35698.47 -35692.73
Significance levels: ∗ : 10% ∗∗ : 5% ∗ ∗ ∗ : 1%. Standard errorsin parentheses: Huber-White adjusted standard errors, considering cluster-ing of observations within each academic program for different moments intime. N is the number of observations, N-g is the number of groups insti-tution/program, and LL stands for log-likelihood. All regressions includeprogram-specific dummy variables.
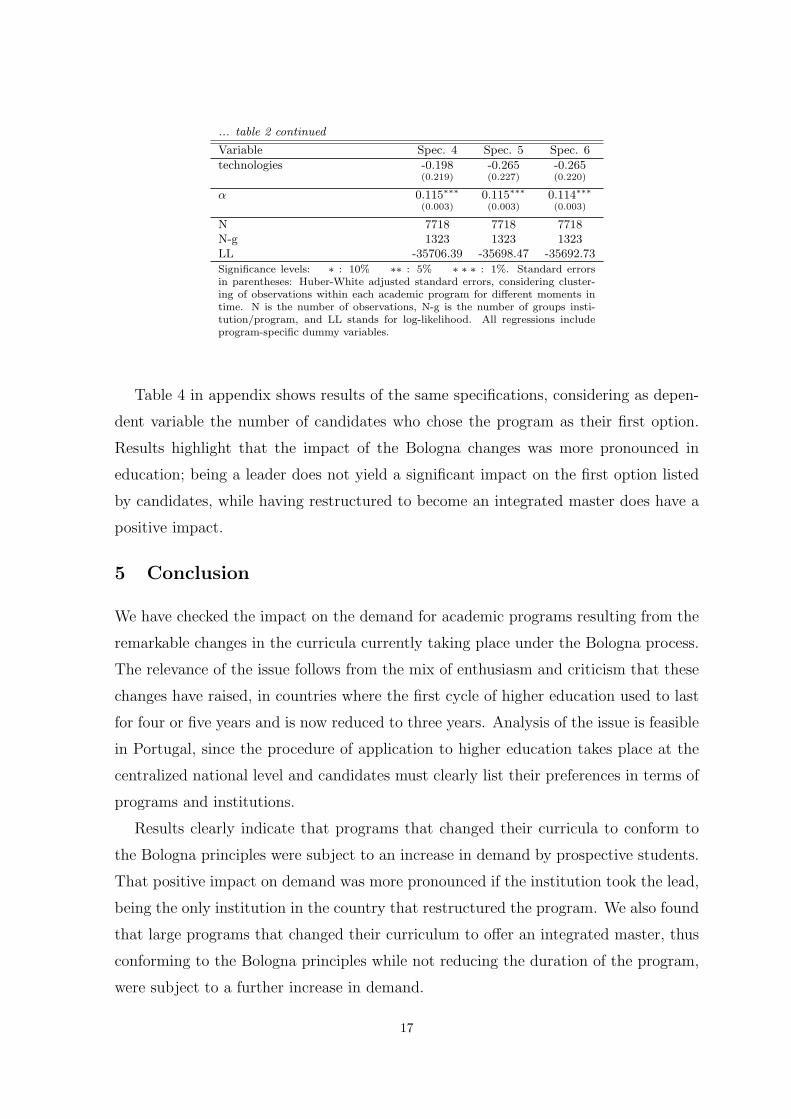
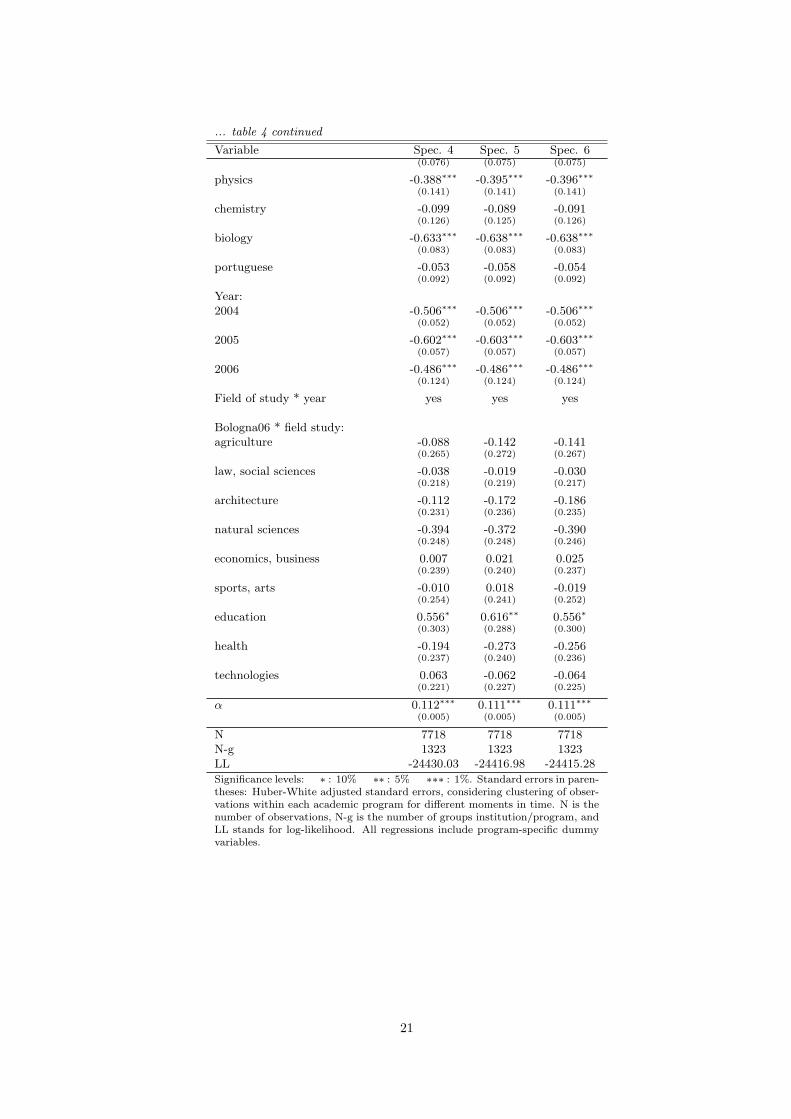
Table 4 in appendix shows results of the same specifications, considering as depen-
dent variable the number of candidates who chose the program as their first option.
Results highlight that the impact of the Bologna changes was more pronounced in
education; being a leader does not yield a significant impact on the first option listed
by candidates, while having restructured to become an integrated master does have a
positive impact.
5 Conclusion
We have checked the impact on the demand for academic programs resulting from the
remarkable changes in the curricula currently taking place under the Bologna process.
The relevance of the issue follows from the mix of enthusiasm and criticism that these
changes have raised, in countries where the first cycle of higher education used to last
for four or five years and is now reduced to three years. Analysis of the issue is feasible
in Portugal, since the procedure of application to higher education takes place at the
centralized national level and candidates must clearly list their preferences in terms of
programs and institutions.
Results clearly indicate that programs that changed their curricula to conform to
the Bologna principles were subject to an increase in demand by prospective students.
That positive impact on demand was more pronounced if the institution took the lead,
being the only institution in the country that restructured the program. We also found
that large programs that changed their curriculum to offer an integrated master, thus
conforming to the Bologna principles while not reducing the duration of the program,
were subject to a further increase in demand.
17
References
Allison, Paul and Waterman (2002). Fixed-effects negative binomial regression
models. Sociological Methodology, 32(1): 247-265.
Black, Dan A. and Jeffrey A. Smith (2004). How robust is the evidence on
the effects of college quality? Evidence from matching. Journal of Econometrics,
121(1-2): 99-124.
Cameron, A. Colin and Pravin K. Trivedi (1998). Regression Analysis of
Count Data. Cambridge: Cambridge University Press.
Gibbons, Robert (1992). A Primer in Game Theory. London: Prentice Hall.
Guimaraes, Paulo (2006). The fixed effects negative binomial model revisited.
Medical University of South Carolina, mimeo.
Guimaraes, Paulo and Richard Lindrooth (2005). Dirichlet-multinomial re-
gression. Medical University of South Carolina, mimeo, available at:
http://129.3.20.41/eps/em/papers/0509/0509001.pdf.
Hausman, Jerry, Bronwyn H. Hall and Zvi Griliches (1984). Economet-
ric models for count data with an application to the patents-R&D relationship.
Econometrica, 52(4): 909-938.
Long, Bridget Terry (2004). How have college decisions changed over time? An
application of the conditional logistic choice model. Journal of Econometrics,
121(1-2): 271-296.
MSTHE (Ministry of Science, technology and Higher Education) (2006).
Reviews of National Policies for Education: Tertiary Education in Portugal. Back-
ground Report. Available at: http://www.mctes.pt/docs/
ficheiros/EDU EC 2006 26.pdf.
Mizrahi, Shlomo and Abraham Mehrez (2002) Managing quality in higher
education systems via minimal quality requirements: signaling and control. Eco-
nomics of Education Review, 21(1): 53-62.
18
OECD (Organization for Economic Co-operation and Development)
(2006). Reviews of National Policies for Education: Tertiary Education in Portu-
gal. Examiner’s Report. Available at: http://www.mctes.pt/docs/
ficheiros/OCDE Relatorio 124 paginas .pdf.
Reichert, Sybille and Christian Tauch (2005). Trends IV: European Univer-
sities Implementing Bologna. Brussels: European University Association.
Salanie, Bernard (2000). The Economics of Contracts. A Primer. Cambridge:
The MIT Press.
van der Ploeg, Frederick and Reinhilde Veugelers (2007). Higher edu-
cation reform and the renewed Lisbon strategy: role of member states and the
European Commission. CESifo Working Paper Series 1901.
Appendix: additional tables
Table 3: Demand for academic programs (number of students choosingthe program as their first choice), negative binomial model
Variable Spec. 1 Spec. 2 Spec. 3
Phase 2 -0.780∗∗∗ -0.780∗∗∗ -0.780∗∗∗
(0.024) (0.024) (0.024)
Size of program (vacancies) 0.003∗∗∗ 0.003∗∗∗ 0.003∗∗∗
(0.0006) (0.0006) (0.0006)
Bologna06 0.169∗∗∗ 0.198∗∗∗ 0.227(0.044) (0.047) (0.209)
Bologna06 * size program -0.002∗∗∗ -0.002∗∗∗ -0.002∗∗∗
(0.0005) (0.0005) (0.0005)
Exam:maths -0.523∗∗∗ -0.571∗∗∗ -0.576∗∗∗
(0.074) (0.075) (0.076)
physics -0.337∗∗ -0.386∗∗∗ -0.387∗∗∗
(0.147) (0.141) (0.141)
chemistry -0.111 -0.093 -0.097(0.120) (0.125) (0.126)
biology -0.635∗∗∗ -0.635∗∗∗ -0.634∗∗∗
(0.085) (0.084) (0.083)
portuguese -0.010 -0.033 -0.057(0.089) (0.092) (0.092)
Year:2004 -0.309∗∗∗ -0.506∗∗∗ -0.506∗∗∗
(0.015) (0.051) (0.052)
2005 -0.417∗∗∗ -0.600∗∗∗ -0.603∗∗∗
(0.022) (0.057) (0.057)
2006 -0.430∗∗∗ -0.475∗∗∗ -0.486∗∗∗
(0.027) (0.107) (0.124)
Field of study * year no yes yes
Continued on next page...
19
... table 3 continued
Variable Spec. 1 Spec. 2 Spec. 3
Bologna06 * field study:agriculture -0.090
(0.268)
law, social sciences -0.028(0.220)
architecture -0.101(0.231)
natural sciences -0.379(0.249)
economics, business 0.004(0.241)
sports, arts 0.022(0.244)
education 0.606∗∗
(0.291)
health -0.209(0.241)
technologies 0.064(0.224)
α 0.123∗∗∗ 0.113∗∗∗ 0.112∗∗∗
(0.005) (0.005) (0.005)
N 7718 7718 7718N-g 1323 1323 1323LL -24638.71 -24444.02 -24431.2
Significance levels: ∗ : 10% ∗∗ : 5% ∗ ∗ ∗ : 1%. Standard er-rors in parentheses: Huber-White adjusted standard errors, consideringclustering of observations within each academic program for differentmoments in time. N is the number of observations, N-g is the numberof groups institution/program, and LL stands for log-likelihood. Allregressions include program-specific dummy variables.
Table 4: Demand for academic programs (number of students choosingthe program as their first choice), including Bologna leader and inte-grated master variables, negative binomial model
Variable Spec. 4 Spec. 5 Spec. 6
Phase 2 -0.779∗∗∗ -0.782∗∗∗ -0.780∗∗∗
(0.024) (0.024) (0.024)
Size of program (vacancies) 0.004∗∗∗ 0.004∗∗∗ 0.004∗∗∗
(0.0006) (0.0006) (0.0006)
Bologna06 0.217 0.257 0.246(0.205) (0.208) (0.204)
Bologna06 * size program -0.002∗∗∗ -0.003∗∗∗ -0.003∗∗∗
(0.0006) (0.0007) (0.0008)
Bologna leader 0.010 0.010(0.087) (0.087)
Bologna leader * size program 0.001 0.002(0.002) (0.002)
Integrated master 0.212∗ 0.214∗
(0.122) (0.123)
Integrated master * size program 0.002∗∗ 0.003∗∗
(0.001) (0.001)
Exam:maths -0.577∗∗∗ -0.586∗∗∗ -0.587∗∗∗
Continued on next page...
20
... table 4 continued
Variable Spec. 4 Spec. 5 Spec. 6(0.076) (0.075) (0.075)
physics -0.388∗∗∗ -0.395∗∗∗ -0.396∗∗∗
(0.141) (0.141) (0.141)
chemistry -0.099 -0.089 -0.091(0.126) (0.125) (0.126)
biology -0.633∗∗∗ -0.638∗∗∗ -0.638∗∗∗
(0.083) (0.083) (0.083)
portuguese -0.053 -0.058 -0.054(0.092) (0.092) (0.092)
Year:2004 -0.506∗∗∗ -0.506∗∗∗ -0.506∗∗∗
(0.052) (0.052) (0.052)
2005 -0.602∗∗∗ -0.603∗∗∗ -0.603∗∗∗
(0.057) (0.057) (0.057)
2006 -0.486∗∗∗ -0.486∗∗∗ -0.486∗∗∗
(0.124) (0.124) (0.124)
Field of study * year yes yes yes
Bologna06 * field study:agriculture -0.088 -0.142 -0.141
(0.265) (0.272) (0.267)
law, social sciences -0.038 -0.019 -0.030(0.218) (0.219) (0.217)
architecture -0.112 -0.172 -0.186(0.231) (0.236) (0.235)
natural sciences -0.394 -0.372 -0.390(0.248) (0.248) (0.246)
economics, business 0.007 0.021 0.025(0.239) (0.240) (0.237)
sports, arts -0.010 0.018 -0.019(0.254) (0.241) (0.252)
education 0.556∗ 0.616∗∗ 0.556∗
(0.303) (0.288) (0.300)
health -0.194 -0.273 -0.256(0.237) (0.240) (0.236)
technologies 0.063 -0.062 -0.064(0.221) (0.227) (0.225)
α 0.112∗∗∗ 0.111∗∗∗ 0.111∗∗∗
(0.005) (0.005) (0.005)
N 7718 7718 7718N-g 1323 1323 1323LL -24430.03 -24416.98 -24415.28
Significance levels: ∗ : 10% ∗∗ : 5% ∗∗∗ : 1%. Standard errors in paren-theses: Huber-White adjusted standard errors, considering clustering of obser-vations within each academic program for different moments in time. N is thenumber of observations, N-g is the number of groups institution/program, andLL stands for log-likelihood. All regressions include program-specific dummyvariables.
21
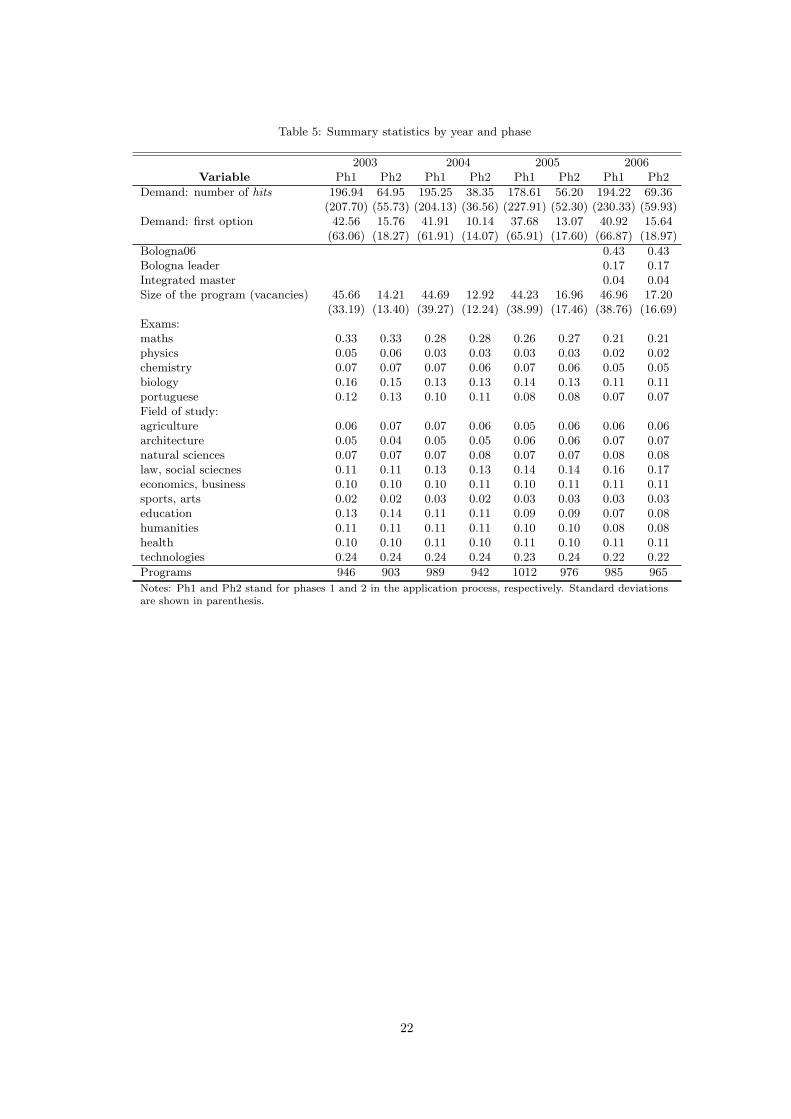
Table 5: Summary statistics by year and phase
2003 2004 2005 2006Variable Ph1 Ph2 Ph1 Ph2 Ph1 Ph2 Ph1 Ph2
Demand: number of hits 196.94 64.95 195.25 38.35 178.61 56.20 194.22 69.36(207.70) (55.73) (204.13) (36.56) (227.91) (52.30) (230.33) (59.93)
Demand: first option 42.56 15.76 41.91 10.14 37.68 13.07 40.92 15.64(63.06) (18.27) (61.91) (14.07) (65.91) (17.60) (66.87) (18.97)
Bologna06 0.43 0.43Bologna leader 0.17 0.17Integrated master 0.04 0.04Size of the program (vacancies) 45.66 14.21 44.69 12.92 44.23 16.96 46.96 17.20
(33.19) (13.40) (39.27) (12.24) (38.99) (17.46) (38.76) (16.69)Exams:maths 0.33 0.33 0.28 0.28 0.26 0.27 0.21 0.21physics 0.05 0.06 0.03 0.03 0.03 0.03 0.02 0.02chemistry 0.07 0.07 0.07 0.06 0.07 0.06 0.05 0.05biology 0.16 0.15 0.13 0.13 0.14 0.13 0.11 0.11portuguese 0.12 0.13 0.10 0.11 0.08 0.08 0.07 0.07Field of study:agriculture 0.06 0.07 0.07 0.06 0.05 0.06 0.06 0.06architecture 0.05 0.04 0.05 0.05 0.06 0.06 0.07 0.07natural sciences 0.07 0.07 0.07 0.08 0.07 0.07 0.08 0.08law, social sciecnes 0.11 0.11 0.13 0.13 0.14 0.14 0.16 0.17economics, business 0.10 0.10 0.10 0.11 0.10 0.11 0.11 0.11sports, arts 0.02 0.02 0.03 0.02 0.03 0.03 0.03 0.03education 0.13 0.14 0.11 0.11 0.09 0.09 0.07 0.08humanities 0.11 0.11 0.11 0.11 0.10 0.10 0.08 0.08health 0.10 0.10 0.11 0.10 0.11 0.10 0.11 0.11technologies 0.24 0.24 0.24 0.24 0.23 0.24 0.22 0.22
Programs 946 903 989 942 1012 976 985 965
Notes: Ph1 and Ph2 stand for phases 1 and 2 in the application process, respectively. Standard deviationsare shown in parenthesis.
22
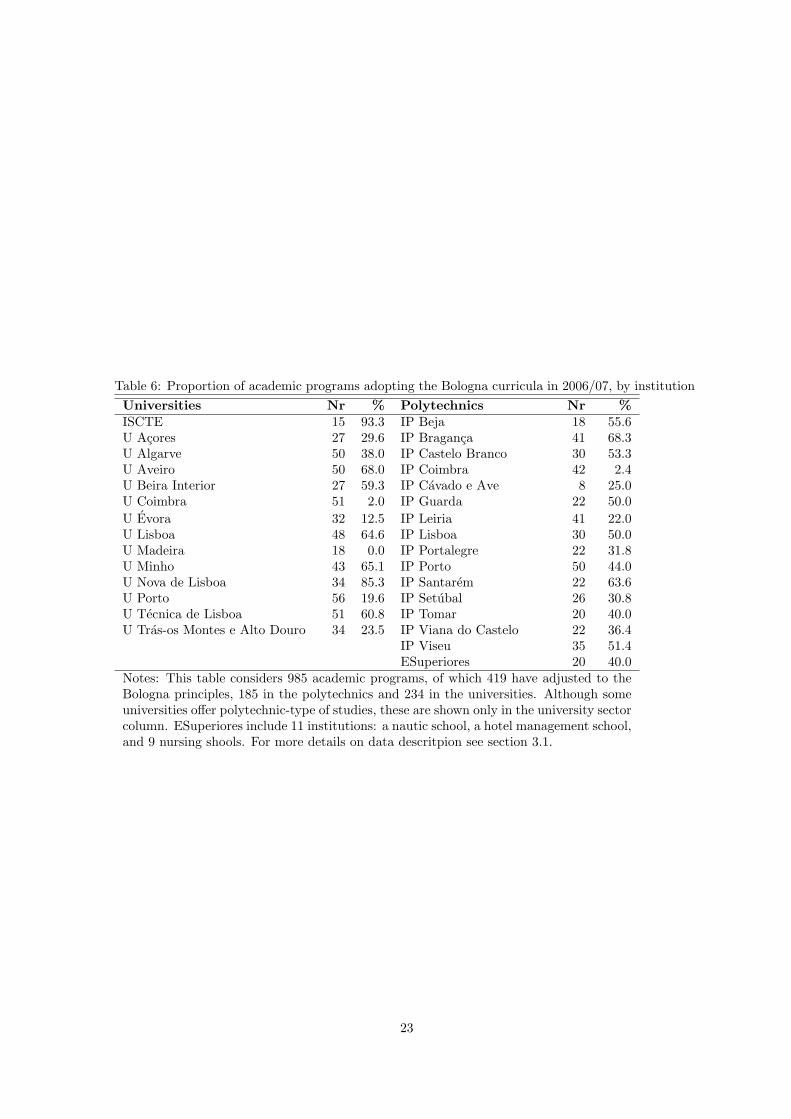
Table 6: Proportion of academic programs adopting the Bologna curricula in 2006/07, by institution
Universities Nr % Polytechnics Nr %
ISCTE 15 93.3 IP Beja 18 55.6U Acores 27 29.6 IP Braganca 41 68.3U Algarve 50 38.0 IP Castelo Branco 30 53.3U Aveiro 50 68.0 IP Coimbra 42 2.4U Beira Interior 27 59.3 IP Cavado e Ave 8 25.0U Coimbra 51 2.0 IP Guarda 22 50.0
U Evora 32 12.5 IP Leiria 41 22.0U Lisboa 48 64.6 IP Lisboa 30 50.0U Madeira 18 0.0 IP Portalegre 22 31.8U Minho 43 65.1 IP Porto 50 44.0U Nova de Lisboa 34 85.3 IP Santarem 22 63.6U Porto 56 19.6 IP Setubal 26 30.8U Tecnica de Lisboa 51 60.8 IP Tomar 20 40.0U Tras-os Montes e Alto Douro 34 23.5 IP Viana do Castelo 22 36.4
IP Viseu 35 51.4ESuperiores 20 40.0
Notes: This table considers 985 academic programs, of which 419 have adjusted to theBologna principles, 185 in the polytechnics and 234 in the universities. Although someuniversities offer polytechnic-type of studies, these are shown only in the university sectorcolumn. ESuperiores include 11 institutions: a nautic school, a hotel management school,and 9 nursing shools. For more details on data descritpion see section 3.1.
23
CESifo Working Paper Series for full list see Twww.cesifo-group.org/wp T (address: Poschingerstr. 5, 81679 Munich, Germany, [email protected])
___________________________________________________________________________ 2016 Torsten Persson and Guido Tabellini, The Growth Effect of Democracy: Is it
Heterogenous and how can it be Estimated?, June 2007 2017 Lorenz Blume, Jens Müller, Stefan Voigt and Carsten Wolf, The Economic Effects of
Constitutions: Replicating – and Extending – Persson and Tabellini, June 2007 2018 Hartmut Egger and Gabriel Felbermayr, Endogenous Skill Formation and the Source
Country Effects of International Labor Market Integration, June 2007 2019 Bruno Frey, Overprotected Politicians, June 2007 2020 Jan Thomas Martini, Rainer Niemann and Dirk Simons, Transfer Pricing or Formula
Apportionment? Tax-Induced Distortions of Multinationals’ Investment and Production Decisions, June 2007
2021 Andreas Bühn, Alexander Karmann and Friedrich Schneider, Size and Development of
the Shadow Economy and of Do-it-yourself Activities in Germany, June 2007 2022 Michael Rauscher and Edward B. Barbier, Biodiversity and Geography, June 2007 2023 Gunther Schnabl, Exchange Rate Volatility and Growth in Emerging Europe and East
Asia, June 2007 2024 Erkki Koskela and Ronnie Schöb, Tax Progression under Collective Wage Bargaining
and Individual Effort Determination, June 2007 2025 Jay Pil Choi and Marcel Thum, The Economics of Politically Connected Firms, June
2007 2026 Jukka Pirttilä and Roope Uusitalo, Leaky Bucket in the Real World: Estimating
Inequality Aversion Using Survey Data, June 2007 2027 Ruslan Lukach, Peter M. Kort and Joseph Plasmans, Strategic R&D with Knowledge
Spillovers and Endogenous Time to Complete, June 2007 2028 Jarko Fidrmuc, Neil Foster and Johann Scharler, Labour Market Rigidities, Financial
Integration and International Risk Sharing in the OECD, June 2007 2029 Bernardina Algieri and Thierry Bracke, Patterns of Current Account Adjustment –
Insights from Past Experience, June 2007 2030 Robert Dur and Hein Roelfsema, Social Exchange and Common Agency in
Organizations, June 2007
2031 Alexander Libman and Lars P. Feld, Strategic Tax Collection and Fiscal
Decentralisation: The Case of Russia, June 2007 2032 Øystein Foros, Hans Jarle Kind and Greg Shaffer, Resale Price Maintenance and
Restrictions on Dominant Firm and Industry-Wide Adoption, June 2007 2033 Jan K. Brueckner and Kurt Van Dender, Atomistic Congestion Tolls at Concentrated
Airports? Seeking a Unified View in the Internalization Debate, June 2007 2034 Viet Do and Ngo Van Long, International Outsourcing under Monopolistic
Competition: Winners and Losers, June 2007 2035 Nadia Fiorino and Roberto Ricciuti, Determinants of Direct Democracy, June 2007 2036 Burkhard Heer and Alfred Maussner, Inflation and Output Dynamics in a Model with
Labor Market Search and Capital Accumulation, June 2007 2037 Konstantinos Angelopoulos, Jim Malley and Apostolis Philippopoulos, Public
Education Expenditure, Growth and Welfare, June 2007 2038 Maarten Bosker, Steven Brakman, Harry Garretsen and Marc Schramm, Adding
Geography to the New Economic Geography, June 2007 2039 Steffen Henzel, Oliver Hülsewig, Eric Mayer and Timo Wollmershäuser, The Price
Puzzle Revisited: Can the Cost Channel Explain a Rise in Inflation after a Monetary Policy Shock?, July 2007
2040 Rosario Crinò, Service Offshoring and White-Collar Employment, July 2007 2041 Carsten Hefeker and Michael Neugart, Labor Market Regulation and the Legal System,
July 2007 2042 Bart Cockx and Muriel Dejemeppe, Is the Notification of Monitoring a Threat to the
Unemployed? A Regression Discontinuity Approach, July 2007 2043 Alfons J. Weichenrieder, Profit Shifting in the EU: Evidence from Germany, July 2007 2044 Annika Alexius and Bertil Holmlund, Monetary Policy and Swedish Unemployment
Fluctuations, July 2007 2045 Axel Dreher, Jan-Egbert Sturm and Jakob de Haan, Does High Inflation Cause Central
Bankers to Lose their Job? Evidence Based on a New Data Set, July 2007 2046 Guglielmo Maria Caporale and Luis A. Gil-Alana, Long Run and Cyclical Dynamics in
the US Stock Market, July 2007 2047 Alessandro Balestrino, It is a Theft but not a Crime, July 2007 2048 Daniel Becker and Michael Rauscher, Fiscal Competition in Space and Time: An
Endogenous-Growth Approach, July 2007
2049 Yannis M. Ioannides, Henry G. Overman, Esteban Rossi-Hansberg and Kurt
Schmidheiny, The Effect of Information and Communication Technologies on Urban Structure, July 2007
2050 Hans-Werner Sinn, Please Bring me the New York Times – On the European Roots of
Richard Abel Musgrave, July 2007 2051 Gunther Schnabl and Christian Danne, A Role Model for China? Exchange Rate
Flexibility and Monetary Policy in Japan, July 2007 2052 Joseph Plasmans, Jorge Fornero and Tomasz Michalak, A Microfounded Sectoral
Model for Open Economies, July 2007 2053 Vesa Kanniainen and Panu Poutvaara, Imperfect Transmission of Tacit Knowledge and
other Barriers to Entrepreneurship, July 2007 2054 Marko Koethenbuerger, Federal Tax-Transfer Policy and Intergovernmental Pre-
Commitment, July 2007 2055 Hendrik Jürges and Kerstin Schneider, What Can Go Wrong Will Go Wrong: Birthday
Effects and Early Tracking in the German School System, July 2007 2056 Bahram Pesaran and M. Hashem Pesaran, Modelling Volatilities and Conditional
Correlations in Futures Markets with a Multivariate t Distribution, July 2007 2057 Walter H. Fisher and Christian Keuschnigg, Pension Reform and Labor Market
Incentives, July 2007 2058 Martin Altemeyer-Bartscher, Dirk T. G. Rübbelke and Eytan Sheshinski, Policies to
Internalize Reciprocal International Spillovers, July 2007 2059 Kurt R. Brekke, Astrid L. Grasdal and Tor Helge Holmås, Regulation and Pricing of
Pharmaceuticals: Reference Pricing or Price Cap Regulation?, July 2007 2060 Tigran Poghosyan and Jakob de Haan, Interest Rate Linkages in EMU Countries: A
Rolling Threshold Vector Error-Correction Approach, July 2007 2061 Robert Dur and Klaas Staal, Local Public Good Provision, Municipal Consolidation,
and National Transfers, July 2007 2062 Helge Berger and Anika Holler, What Determines Fiscal Policy? Evidence from
German States, July 2007 2063 Ernesto Reuben and Arno Riedl, Public Goods Provision and Sanctioning in Privileged
Groups, July 2007 2064 Jan Hanousek, Dana Hajkova and Randall K. Filer, A Rise by Any Other Name?
Sensitivity of Growth Regressions to Data Source, July 2007
2065 Yin-Wong Cheung and Xing Wang Qian, Hoarding of International Reserves: Mrs
Machlup’s Wardrobe and the Joneses, July 2007 2066 Sheilagh Ogilvie, ‘Whatever Is, Is Right’?, Economic Institutions in Pre-Industrial
Europe (Tawney Lecture 2006), August 2007 2067 Floriana Cerniglia and Laura Pagani, The European Union and the Member States:
Which Level of Government Should Do what? An Empirical Analysis of Europeans’ Preferences, August 2007
2068 Alessandro Balestrino and Cinzia Ciardi, Social Norms, Cognitive Dissonance and the
Timing of Marriage, August 2007 2069 Massimo Bordignon, Exit and Voice. Yardstick versus Fiscal Competition across
Governments, August 2007 2070 Emily Blanchard and Gerald Willmann, Political Stasis or Protectionist Rut? Policy
Mechanisms for Trade Reform in a Democracy, August 2007 2071 Maarten Bosker and Harry Garretsen, Trade Costs, Market Access and Economic
Geography: Why the Empirical Specification of Trade Costs Matters, August 2007 2072 Marco Runkel and Guttorm Schjelderup, The Choice of Apportionment Factors under
Formula Apportionment, August 2007 2073 Jay Pil Choi, Tying in Two-Sided Markets with Multi-Homing, August 2007 2074 Marcella Nicolini, Institutions and Offshoring Decision, August 2007 2075 Rainer Niemann, The Impact of Tax Uncertainty on Irreversible Investment, August
2007 2076 Nikitas Konstantinidis, Gradualism and Uncertainty in International Union Formation,
August 2007 2077 Maria Bas and Ivan Ledezma, Market Access and the Evolution of within Plant
Productivity in Chile, August 2007 2078 Friedrich Breyer and Stefan Hupfeld, On the Fairness of Early Retirement Provisions,
August 2007 2079 Scott Alan Carson, Black and White Labor Market Outcomes in the 19th Century
American South, August 2007 2080 Christian Bauer, Paul De Grauwe and Stefan Reitz, Exchange Rates Dynamics in a
Target Zone – A Heterogeneous Expectations Approach, August 2007 2081 Ana Rute Cardoso, Miguel Portela, Carla Sá and Fernando Alexandre, Demand for
Higher Education Programs: The Impact of the Bologna Process, August 2007