Embed Size (px)
Citation preview
3 Giannini Foundation of Agricultural Economics bull University of California
for changes in California egg pur-chases We net out such factors by using changes for comparable stores in Washington as counterfactuals We use the fact that infected eggs
could be traced to the box level to establish a clear definition of the treatment and follow a panel of over 600 stores during a four-year period Further given the geographical dis-tribution of infected eggs we are able to measure potential spillovers to unaffected areas of California
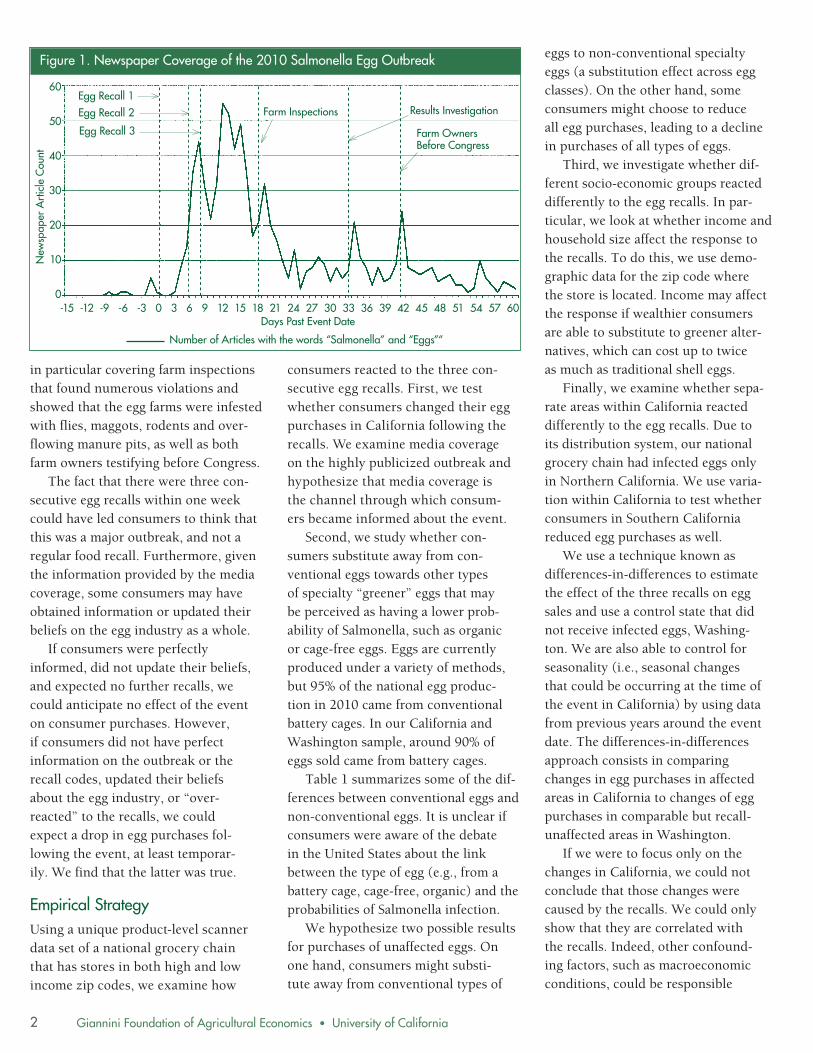
Findings We begin by plotting the evolution of daily sales around the ldquoevent weekrdquo (August 13ndashAugust 20 2010) in Cali-fornia Figure 2 plots changes in egg purchases (in quantities of egg boxes sold) for all shell eggs for stores in California only The category all shell eggs includes 2 classes (all tradi-tional or value-added specialty eggs) and 7 subclasses (traditional large traditional extra-large traditional jumbo specialty brown specialty organic specialty cage-free and spe-cialty nutrient-enhanced) The figure plots data starting 30 days before the ldquoevent dayrdquo (here defined as August 13 2010 the day of the first egg recall) up to 35 days after the event day Changes in egg purchases take into
account price as well as factors that are constant across stores aggregation levels and day of the week (eg sales are always higher on weekends) Egg sales show a large drop a few days after the first recall and a small increase between the second egg recall and the third recall Sales reach their lowest level in the time period around 11 days after the first egg recall This suggests that if egg purchases decreased due to the egg recalls there was a small (days) time-lag between the time the recalls were made and the time that the effect was reflected in lower purchases in stores Using our econometric model we
proceed to formally test the effect of
Conventional Eggs Non-Conventional Eggs
Table Conventional and Non-Conventional Eggs
bull 95 of the egg production in 2010 came from conventional battery cages
bull Conventional battery cages are stacks of cages that can be up to two stories high and keep about six hens to a cage
bull Each hen gets on average 67 square inches of floor space (about frac34 of a sheet of a notebook paper)
bull Hens are unable to fully stretch their wings and have no access to natural light
bull As many as 100000 birds may be grouped together under a single roof (USDA)
bull 5 of egg production comes from non-conventional production methods
bull Methods are classified by
O how eggs are raised (eg cage-free free-range pasture-raised) andor
O by what birds are fed (eg organic vegetarian-fed no hormones no antibiotics)
bull A single egg box usually contains more than one label (eg ldquoCage-Free Kosher and Vegetarian-fed hensrdquo)
Sources United Egg Producers (UEP) and USDA ERS
the three egg recalls and find a 9 significant reduction in egg sales in California Given an overall price elasticity for eggs in US households of around -01 this sales reduction is comparable to an almost 100 increase in price Consistent with a rather inelastic demand the effect is very similar with and without prices We find that the decrease in sales
was driven by a drop in purchases of traditional large shell eggs and find no evidence of substitution toward other greener type of eggs such as organic or cage-free eggs More specifically we
find that purchases of large traditional shell eggs significantly decreased by 10 in California in the month fol-lowing the event Large traditional eggs had the largest market share of sales in our sample in 2009 (around 70) Sales of the other types of eggs do not change significantly due to the recalls For jumbo brown cage-free and nutrient-enhanced eggs (with very small 2009 baseline sales) we find no significant effects of the recalls Sales for extra-large traditional shell eggs and for organic eggs seem higher but the recalls still have no significant effect
Figure 2 Daily Changes in Egg Purchases Following the Egg Recalls
04
02
0
-02
Farm Inspection Egg Recall 3
Egg Recall 1
Egg Recall 2
-30 -25 -20 -15 -10 -5 0 5 7 10 15 18 20 25 30 35
Days Past August 13 2010
Cha
nge
in E
gg P
urch
ases
-04
All Shell Eggs
Giannini Foundation of Agricultural Economics bull University of California
When matching each grocery store with the socio-economic characteristics of the zip code in which it is located we are able to investigate heterogeneous effects of the recall We study whether income and household size affect the response to the recalls where income is the demeaned average income in the zip code in which the store is located (in 10000 USD) and household size is the demeaned average household size in the zip code in which the store is located Socio-economic data come from the 2000 US Census While we find no correlation with income we do find that areas that had a larger than average household size decreased egg purchases significantly more
A caveat to the results is that it is possible that more affluent customshyers diverted egg purchases to farmersrsquo markets or high-end grocery stores after the egg recalls and thus the estishymates would suffer from selection bias The data allow only for the identificashytion of effects with purchases undershytaken at the national grocery chain
We also find differentiated effects among Northern and Southern Calishyfornian stores Although the national grocery chain had infected eggs only in Northern California we find that Southern Californian stores had lower egg sales as well The overall sales reduction in Southern California was half as large as the reduction in Northshyern California and is consistent with media and reputation effects being sigshynificant determinants of demand even in the absence of an actual food recall
Studies on the effects of safety warnings on spinach (Arnade et al 2009) beef (Schlenker and Villas-Boas 2009) or fish (Shimshack et al 2007) have also found significant consumer responses However the persistence of the effect may vary depending on the type of good and availability of subshystitutes For example while the effect of a safety warning on spinach had a
long-term effect our results for eggs suggest that the effect was temporary
To test the robustness of our findshyings we perform several checks First we test the sensitivity of the baseline results to various assumpshytions about the seasonality paramshyeters We use only data for one year before the recall (2009) instead of using as above all previous years (2007 2008 and 2009) This yields very similar drops in purchases as when we include all previous years
Second we test the sensitivity of the baseline results to using Washington as a control state by excluding data from Washington and using stores in Southshyern California as controls The ratioshynale is that we may assume that stores in Southern California have similar trends to stores in Northern California Once again using Southern California stores as counterfactuals for Northern California store patterns yields very similar estimates of the egg recalls
Third we test the sensitivity of the baseline results to using only one month after the event week We obtain data on a second post-event month and include a total of eight weeks after the event week for all years While this additional robustness check gives us similar results to the ones from the main specification we find that the effect lasted more than one month
Conclusion Consistent with previous literature on the effects of foodborne disease outbreaks food scares and governshyment warnings our results show that consumers do respond to outbreaks at least temporarily Moreover not only did consumers reduce their purshychases of affected products they also did not switch to unaffected alternashytives As a result overall egg purchases dropped These findings have policy implications for consumers producshyers and policymakers They show that
consumers do respond to recalls and that these responses are an incentive for firms to invest in risk reduction and to comply with existing regulations They also contribute to a discussion on the need for additional investments in food safety product tracking and the enforcement of existing regulashytions in order to improve the availshyability of safe products for consumers
Suggested Citation
Toledo Chantal and Sofia Berto Villas-Boas Food Borne Disease Outbreaks and Consumer Purchases ARE Update 17(1) (2013) 1-4 University of California Giannini Foundation of Agricultural Economics
Chantal Toledo is a post-doctoral fellow at the Energy Biosciences Institute and Sofia Berto Villas-Boas is an associate professor in the ARE department both at UC Berkeley They can be contacted by email at chantaltoledoberkeleyedu and sberto berkeleyedu respectively This article is based on the paper ldquoFood Borne Disease Outbreaks Consumer Purchases and Product Preferences The Case of the 2010 Salmonella Egg Outbreak in the USrdquo We thank the Giannini Foundation for funding this project and the national retailer for providing the data
For additional information the authors recommend
Arnade C L Calvin and F Kuchler ldquoConsumer Response to a Food Safety Shock The 2006 Food- Borne Illness Outbreak of E coli O157 H7 Linked to Spinachrdquo Review of Agricultural Economics 31(4) (2009) 734-750
Schlenker W and S Villas-Boas ldquoConsumer and Market Responses to Mad Cow Diseaserdquo American Journal of Agricultural Economics 91(4) (2009) 1140-1152
Shimshack J M Ward and T Beatty ldquoMercury Advisories Information Education and Fish Consumptionrdquo Journal of Environmental Economics and Management 53(2) (2007) 158-179
4
5 Giannini Foundation of Agricultural Economics bull University of California
1995
2001
1999
1997
2009
2007
2011
1994
2004
2002
1998
1996
2008
2006
2010
2012
Avocado Board (HAB) These funds are
Commission (CAC) and up to 85 of importer assessments to the certified
60
40
30
20
10
2005
2003
2000
Per Capita Consumption
Real Price (centslb)
80
50
40
30
10
0
Demand Growth and Commodity Promotions for Fresh Hass Avocados Hoy F Carman Tina L Saitone and Richard J Sexton
for imports and forwarded to the Hass Figure 1 Per Capita Consumption and Real Producer Price for Fresh Avocados
then allocated to programs and activishy70
ties designed to increase the demand 50
for Hass avocados in the US market 60
Cents per Lb
Per Capita Consumption
The HAB uses 15 of the assessments to fund activities such as nutrition research marketing and information programs intended to benefit all avocado producers It rebates 85 of domestic
20assessments to the California Avocado
Shipments of fresh Hass avocados to the US have increased dramatically in recent years primarily in response to the opening of the US market to imports from Mexico Inflation-adjusted prices received by California growers have nonetheless remained nearly constant on average despite considerable year-to-year volatility Our analysis shows that consumer demand growth fueled in part by a successful industry promotion program has prevented falling prices
California avocado growersrsquo long-standing program to fund advertising and promotion
programs for their fruit was extended to include imports of fresh avocados through the Hass Avocado Promoshytion Research and Information Act signed into law on October 23 2000 Mandatory program assessments of 25 cents per pound on all Hass avocados sold in the US market commenced effective January 2 2003 under the Hass Avocado Promotion Research and Information Order (HAPRIO)
The assessment is collected by first handlers for California producshytion and by the US Customs Service
operating under the HAB the Chilean Avocado Importers Association (CAIA) the Mexican Hass Avocado Importers Association (MHAIA) and the Perushyvian Avocado Commission (PAC)
This article summarizes the evalushyation of the economic impact of promotional expenditures conducted under HABrsquos auspices on US demand for fresh avocados and estimates proshyducer returns from the expenditures for the second five years of the HABrsquos operashytionsmdashthe period from 2008 through 2012 We estimated an aggregate annual model of demand for fresh avocados in the United States A market simulation model was constructed using results from estimation of the annual model and utilized to estimate benefits and costs from the promotion program
Supply and Demand of Avocados Since HAB assessments to support avoshycado promotion began in 2003 avocado imports and total US supplies (Hass and other varieties) have continued to increase to a record total of over 16 billion pounds in 2012 Mexican avocado exports to the US increased significantly after Mexico gained year-round access to all states except
California and Florida in 2005 and to all states in 2007 Mexican imports of 9338 million pounds accounted for over 58 of the total US supply of fresh avocados and for 867 of total fresh avocado imports in 2012 Market share for imports increased from 30 in 2000 to 67 in 2012
The US demand for avocados has grown substantially in the ten years since the HAB began funding promoshytional programs in January 2003 As shown in Figure 1 US consumpshytion has exceeded two pounds per capita annually since 2001 exceedshying three pounds per capita in 2005 four pounds per capita in 2010 and five pounds per capita in 2012
Figure 1 also depicts the average price per pound in real (inflationshyadjusted base year 1982-84) terms received by California growers for these same years The farm-level demand for avocados is widely acknowledged to be quite price inelastic with empirishycal estimates typically near -025 In the absence of substantial demand growth one would have thus expected sharply lower prices to accompany an increase in avocado supply of over 200 But despite the real grower price
importer associations for their own proshymotion programs There are currently
Source USDA NASS three certified importer associations
00
Giannini Foundation of Agricultural Economics bull University of California
Table 1 US Avocado Promotional Expenditures by Organization 2003ndash2012
Year CAC CAIA MHAIA PAC HAB Total
-------------------------- 1000 dollars ----------------------shy
2003 8682 1427 0 0 146 10256
2004 10756 3010 700 0 859 15325
2005 11838 5743 2900 0 2603 23084
2006 10499 2661 4500 0 2562 20222
2007 9205 3865 6247 0 3097 22413
5-YR Sub-total 50980 16705 14347 0 9268 91300
2008 10470 3819 7141 0 3102 24532
2009 6559 5405 13995 0 4646 30604
2010 8780 2351 13379 0 5908 30418
2011 9004 3732 11419 0 3555 27710
2012 11632 1994 17713 952 4220 36510
5-YR Sub-total 46444 17301 63647 952 21430 149774
Grand Total 97425 34006 77993 952 30698 241073
exhibiting considerable year-to-year volatility (characteristic of a comshymodity with inelastic demand) it has on average remained stable over this time period reflecting the substantial demand growth that has occurred
Avocado Promotions Initiation of assessments on all Hass avocados sold in the US market in 2003 and increasing Hass avocado imports has significantly increased the availability of funds for proshymotion programs Table 1 shows
promotional expenditures by year for avocados from the US (CAC) Chile (CAIA) Mexico (MHAIA) and Peru (PAC) plus promotional expenshyditures made by the HAB itself
During the HABrsquos first five years of operation 2003 through 2007 CAIA MHAIA and HAB spent $4032 milshylion promoting avocados in addition to $5098 million spent by California producers Total CAC promotional expenditures for the next five years 2008ndash2012 decreased just over 10 as a result of relatively small crops
Model 1 (GLS) Model 2 (GLS)
Variable Estimate t-stat Estimate t-stat
Table 2 Annual Model Regression Results
Model 3 (2SLS)
Estimate t-stat
Model 4 (2SLS)
Estimate t-stat
California FOB Price (centslb)
-0012 -367 -0015 -528
Per Capita Income 0276 192 -0287 -362
Total Promotion 0113 418 0049 219
Time Trend 0214 817
Constant -1633 -071 5279 475
Durbin-Watson Statistic 1310 1465
Observations 19 19
Adjusted R2 0981 0986
-0011 -164
-0155 -185
0052 248
0180 640
3349 233
-
18
0993
-0001 -020
0077 293
0132 746
0754 188
-
18
0982
Advertising Elasticity 0354 0153 0163 0241
in 2009 and 2011 But promotional expenditures by HAB and country orgashynizations financed by fresh avocado imports raised average avocado proshymotion from $1826 million annually from 2003 to 2007 to $2995 million annually from 2008 to 2012 (table 1)
Promotion Evaluation Carman Li and Sexton (CLS 2009) conducted the first evaluation of the HAB promotion programs for the five-year period from 2003 through 2007 CLS found that advertising and promotion funded under the HAB increased the demand for fresh avocashydos during the programrsquos first five years of operation and yielded a favorable rate of return to avocado producers Annual Demand for Avocados
Economic theory posits that demand for a commodity is a function of that commodityrsquos price prices of goods that are used as substitutes or complements for the commodity and consumer income Successful promotions can also be an important factor in expanding demand for a product We estimated annual per capita fresh avocado demand as a function of price per capita income a time trend and total HAB and CAC promotions The annual model analysis utilized data from 1994ndash2012 Table 2 contains the annual demand model results for four model specifications
Model 1 in table 2 includes real fob price real per capita income and real promotion expenditures as explanashytory variables Model 2 adds a linear time trend YEAR to Model 1 Models 3 and 4 are adjusted to account for the fact that price and consumption are likely jointly determined These models use US Chilean and Mexishycan avocado acreage as instrumental variables (ie a proxy) for price Real promotion expenditures represent the key variable of interest in all 4 models
In all cases promotion expendishytures have a statistically significant and positive impact on per capita US
6
7 Giannini Foundation of Agricultural Economics bull University of California
Figure 2 Avocado Promotion Simulation Model
Pt
Prsquot
Pshyt
St
Srsquot
C B
A
avocado consumption The estimated coefficients for promotion expenditures range from 0049 (model 2) to 0113 (model 1) Models 3 and 4 which have the best statistical properties among the models yield intermediate values for the promotion coefficient of 0052 and 0077 depending upon whether per capita income is included in the model
Because the magnitude of the estishymated coefficients depends upon the choice of units to measure the model variables it is desirable to convert the coefficients to elasticities which measure estimated percentage impacts and thus are unitless The estimated promotion elasticities evaluated at the data means range from 0153 (model 2) to 0354 (model 1) (see table 2)
The other variables included in the model perform much as economic theory would predict and estimates are also consistent with prior work The one exception is the impact of the income variable when it is included in a model with the time trend These two variables are highly correlated and in essence it is impossible to isoshylate the unique impacts of growth in consumersrsquo incomes on avocado conshysumption from other economic factors that are captured in the trend term
Cost-Benefit Analysis of Promotional Expenditures
The annual demand analysis presshyents strong evidence that generic promotion of fresh avocados has worked to increase the demand for fresh avocados in the United States The additional question to ask howshyever is whether the expenditures have ldquopaid offrdquo in the sense of yielding benshyefits to producers from the demand enhancement that exceed the money expended to fund the programs
The average benefit-cost ratio (ABCR) from a promotion program consists of the total incremental profit to producers generated by the program over a specified time period divided by the total incremental costs borne
Prdquot
05
Q D Drsquot Qrsquot t t
by producers to fund a program The ABCR is the key measure of whether a program was successful with ABCR gt 10 defining a successful program
The marginal benefit-cost ratio (MBCR) measures the incremental profit to producers generated from a small expansion or contraction of a promotion program MBCR answers the question of whether expansion of the promotion program would have increased producer profits with MBCR gt 10 indicating a program that could have been profitably expanded
Substantial diagnostic tests pershyformed by CLS (2009) in their evaluation of avocado promotion supshyported use of a linear demand model which we thus also utilized For the linear model ABCR = MBCR and the two questions ldquowas the program profitshyablerdquo and ldquocould it have been profitably expandedrdquo are one and the same
Our strategy in estimating ABCR and MBCR for the promotion proshygrams conducted under HABrsquos auspices was to simulate the impact of a small hypothetical increase in the HAB assessment rate from the curshyrent level of $0025lb to $003lb ie an increase of one-half cent per pound and estimate the benefits and costs to avocado growers from that assessment expansion based upon the
results of the annual demand analysis The simulation framework is
depicted in figure 2 The model begins with demand and supply functions for avocados that depict the US market for a given year t Thus demand Dt is total US demand in year t on a per capita basis Supply St is total supply to the US market in year t from all sources Under the current program total US consumption in year t given functions St and Dt is Qt and grower price is Pt Implementation of a one-half cent per pound expansion in the program assessment increases producer costs per pound by that half cent Srsquo t as depicted in figure 2
The hypothetical increase in assessshyment generates incremental funds for promotions equal to the change in assessment multiplied by total shipments to the US market The marginal impact of the additional promotional expenditure on demand is determined by the regression coefshyficient for the promotion variable which is reported for alternative model specifications in table 2
The new demand curve is illustrated in figure 2 by Drsquo t The new market equilibrium is found at the intersecshytion of curves Srsquo t and Drsquo t at point A in figure 2 Thus the model predicts that equilibrium price in year t would have
Giannini Foundation of Agricultural Economics bull University of California
risen to Prsquo t and sales have risen to Qrsquo t with the incremental assessment
Producer benefits from the hyposhythetical expansion of the promotion program are measured in terms of the change in producer surplus (PS) PS is the same as producer variable profits namely revenue (producer price x output) minus the variable production costs associated with producing and selling the output
We seek to measure the change in PS associated with the hypothetical expansion of the promotion program In figure 2 PS after the program expansion is PSrsquo = Prsquo t x Qrsquo tndash 0BQrsquo t but we must also account for the additional promoshytion expenditure which is represented geometrically by the rectangle Prsquot Prdquo t AB=(Prsquo tndash Prdquo t)Qrsquo t Thus the net increase in PS to producers from expansion of the promotion program is ΔPS = PSrsquo ndash (Prsquo t ndash Prdquo t) Qrsquo t which is represhysented by the shaded area in figure 2
Information required to estimate ΔPS consists of (i) an estimate of the marginal impact of promotional expenshyditures on demand (ii) an estimate of the slope or price elasticity isinD of the grower-level demand curve and (iii) an estimate of the slope or price elasticshyity isinS of grower supply of avocados to the US market The results of the econometric estimates reported in table 2 provide estimates of (i) and (ii)
We evaluated these considerations and specified three alternative values 05 10 and 20 as representing a plausible range of values for isinS Among the demand models included in table 2 we selected models 1 and 3 for use in the simulation Benefits and costs were estimated for each of the five years 2008ndash2012 under evaluation
The model was implemented by fitshyting the demand and supply functions to the actual values observed for the real grower price and per capita consumpshytion for each year of the review period St was then shifted vertically to Srsquo t by the half-cent incremental assessment for
each year and D was shifted horizon-t
tally to Drsquo t by the estimated promotion coefficient times the funds generated by the incremental assessment producing the equilibrium at point A in figure 2 and enabling us to compute the hyposhythetical changes in P and Q and the ΔPS
Total net producer benefits are reported for each model by compoundshying the annual benefits and costs over the five-year period to 2012 using a 3 real rate of interest The estimated benefit-cost ratios in this study range from 212 to 928 The lower bound is associated with model 3 which has a small coefficient for promotion relative to model 1 and the most elastic supply response isinS=20 The average annual increase in the grower price due to promotions for this simulation is 26 The upper bound of 928 is associshyated with demand model 1 which has a high coefficient for promotion and with the most inelastic supply response isinS=05 The average annual price increase for this simulation is 123
Space considerations preclude us from discussing results of the disagshygregate model estimated using scanner data Those results are available upon request from the authors and showed a statistically significant positive impact of promotions on weekly sales in those market areas receiving promotions through the HAB thus reinforcing the results from the annual model
Conclusion Fresh avocados have seen remarkshyable growth in consumption per capita in the US rising from about 15 pounds during the decade of the 1990s to over 5 pounds in 2012 This rapid increase in imports to the US and commensurate consumption has been achieved while keeping real grower prices relatively constant on average over this time period Such an outcome is only possible with substantial growth in fresh avocado demand in the US over this time
The econometric analysis of annual fresh avocado demand conducted in this study provides strong statistical evishydence of this demand growth and support for the proposition that promoshytion expenditures have been an important causal factor Benefit-cost analysis conducted based upon these econometric estimates yielded estimated average and marginal benefit-cost ratios in the range of 212 to 928 We conshyclude with considerable confidence that the promotion programs conducted unshyder the HABrsquos auspices have been successful in both expanding demand for fresh avocados in the US and yieldshying a very favorable return to those funding the program
Suggested Citation
Carman HF TL Saitone and R J Sexton 2013 Demand Growth and Commodity Promotions for Fresh Hass Avocados ARE Update 17(1)5shy8 University of California Giannini Foundation of Agricultural Economics
Hoy F Carman (carmanprimalucdavisedu) is a professor emeritus Tina L Saitone (saitone primalucdavisedu) is a project economist and Richard J Sexton (richprimalucdavisedu) is a professor and chair all in the ARE department at UC Davis
For additional information the authors recommend
Carman HF L Li and RJ Sexton (2009) ldquoAn Economic Evaluation of the Hass Avocado Promotion Orderrsquos First Five Yearsrdquo University of California Giannini Foundation of Agricultural Economics Giannini Foundation Research Report 351
Carman HF L Li and RJ Sexton ldquoCan Improved Market Information Benefit Both Producers and Consumers Evidence from the Hass Avocado Boardrsquos Internet Information Programrdquo ARE Update 13(4) 2010
Li Lan HF Carman and R J Sexton ldquoRetailer Pricing Practices for Fresh Avocadosrdquo ARE Update 10(1) 2006
8
9 Giannini Foundation of Agricultural Economics bull University of California
Chinarsquos Growing Role in Agricultural Trade Colin A Carter and Sandro Steinbach
This article discusses developments in Chinarsquos agricultural trade and implications for the United States We highlight areas in which China has become a major exporter of agricultural products the global importance of these exports and factors that underlie the export trends In addition we reference market access issues faced by Chinarsquos agricultural exports
China produces over 20 of the worldrsquos cereal grains 25 of the worldrsquos meat and 50 of the
worldrsquos vegetables China is the worldrsquos largest agricultural economy and it ranks as the top global producer of pork wheat rice tea cotton tomatoes potatoes eggs wool apples walnuts and fish etc In fact the annual value of Chinarsquos agricultural output is about two and one-half times the US total
After joining the World Trade Organization (WTO) in 2001 China increased its trade dependence on agrishyculture As of 2011 it was the fourth largest exporter and second largest importer of agricultural products in the world according to WTO trade statistics Its import growth has been driven by a shift in its domestic producshytion mix and changing consumer diets with rising incomes and urbanization Chinarsquos substantial increase in fruit and vegetable production is a major factor behind it agricultural export growth
In agriculture Chinarsquos major policy objectives are focused on increasing
grain production and starting the transition to larger-scale farms China has a relatively low set of agricultural import tariffs compared to other WTO members and domestic support to agriculture in China remains less than that for many developed countries
Changing Trade Structure With imports growing faster than exports during the post-WTO accesshysion years China reversed its longshytime status as a net agricultural exporter to that of a net importing country since 2004 Most of Chinarsquos increased imports came from soyshybeans and cotton Today cotton and soybeans account for over 40 of Chinarsquos agricultural imports a very concentrated portfolio China is the worldrsquos largest importer of soybeans and cotton accounting for over 60 of global soybean imports and approxishymately 40 of cotton imports
It was expected that Chinarsquos producshytion and trade of agricultural products would be significantly affected by WTO entry and this has turned out to be the case Chinarsquos agricultural exports have increased by more than 12 annushyally Import growth has averaged 19 per annum while total agricultural trade has grown by more than 16 per annum from 2002 to 2011 These are truly impressive annual growth rates
The changing structure of Chinarsquos agricultural exports has been domishynated by very strong growth in exports of horticultural products (eg garlic
apples pears and citrus) semi-processed food products (eg animal products pet food) and aquaculture (eg fish fillets) Table 1 shows the annual growth in exports for various agricultural categories from 2001shy2011 From top to bottom the annual growth rate was 18 for horticulshytural exports 14 for semi-processed foods 13 for aquaculture 12 for processed (eg apple juice proshycessed tomatoes) and less than 2 for bulk items such as tea or tobacco
Regarding accomplishments in world markets Chinarsquos exports of aquashyculture products have grown from 8 of the world market in 2001 to 14 of the market in 2011mdasha remarkable achievement China is very successshyful at exporting frozen fish fillets of various types including salmon There is a large fish processing industry in China that imports whole salmon and other fish from the US Russia and elsewhere and then in turn reshyexports fish fillets Another category that is also a strong export performer is horticultural products rising from 25 to 56 of world exports more than doubling its market share
Chinarsquos trade patterns have been affected by concerns over food safety with some food products For instance the melamine-spiked milk scandal of 2008 has led to a surge in Chinarsquos imports of milk powdermdashChinarsquos skim milk powder imports were up about 50 just in the past year contributing to higher milk powder prices in world
Table 1 Annual Growth Rates of Chinarsquos Agricultural Exports Since WTO Accession
Aquaculture Bulk Processed Horticulture Semi-Processed
2001ndash2011 Annual Growth Rate in Value of Exports
133 17 122 180 145
Source Compiled from UN COMTRADE data
Giannini Foundation of Agricultural Economics bull University of California
Table 2 Export and Import Trade Growth Rate of Chinarsquos Labor-Intensive
Agricultural Products 2001ndash2011
Aquaculture Livestock Horticulture
Exports 133 77 180
Imports 135 158 210
Source Compiled from UN COMTRADE data
markets China is responding to the food safety issue and has reorganized its food safety regulatory system modshyeled on the FDA in the United States
Chinarsquos agricultural trade is more and more in line with its comparashytive advantage and it has noticeably increased imports of land-intensive agricultural products But what about its trade in labor-intensive products Although exports of labor-intensive agricultural products did increase quite fast after WTO accession (espeshycially for fruits and vegetables) the rate of increase for these years was lower than imports of land-intensive agricultural products For instance the annual export growth rate for labor-intensive fruits and vegetables was 22 and 167 respectively At the same time imports of land-intensive soybeans and cotton grew by 25 and 357 respectively
Surprisingly the import growth of labor-intensive agricultural prodshyucts was also quite highmdashin fact greater than the export growth rate of these products for the same period Aquacultural exports grew by 133 slightly less than its import growth
of 135 Horticultural exports grew by an impressive 18 per annum but horticultural imports grew even faster at 21 per annum (Table 2)
So what do all these numbers sugshygest regarding Chinarsquos trade First land-intensive imports are growing faster than labor-intensive exports Second for labor-intensive products imports are actually growing faster than exports There are three likely facshytors behind these trends First there is growing domestic demand for high-valued agricultural products including labor-intensive imports increasing with income and urbanization Second Chinarsquos agricultural labor is shifting away from agriculture to the higher paying manufacturing and service secshytors Third Chinarsquos labor-intensive agricultural exports face headwinds in world markets due to trade barrishyers and perceptions of poor quality
China-US Agricultural Trade The United States enjoys an agriculshytural trade surplus with China which exceeded $20 billion in 2012 This is partly a result of reduced import trade barriers in China and growing
Table 3 Major USndashChina Agricultural Products Traded Bilaterally in 2012
US Exports to China US Imports from China
Item Value (Mil) Item Value (Mil)
Soybeans $15374
Cotton $3686
Corn $1658
Hides and Skins $1219
Frozen Swine Offal $744
Apple Juice $561
Dog and Cat Food $467
Frozen Tilapia Fillets $444
Canned Citrus $233
Frozen Salmon Fillets $216
Source USDA FAS GAIN Report 2252013 based on China Customs Data
incomes and urbanization China is the most important market for US agricultural exports (accounting for 172 of US agricultural exports in 2012) and the third most important supplier of US agricultural imports (with a market share equal to 42 of US agricultural imports in 2012)
Table 3 shows that based on the value of trade the top five US agrishycultural exports to China (in order of importance) are soybeans cotton corn hidesskins and swine offal On the other hand the top five US imports from China are apple juice dog and cat food frozen tilapia fillets canned citrus and frozen salmon fillets It is notable that the sum total of Chinarsquos agricultural exports to the United States represents only two-thirds of the value of just one single item that the United States sells to Chinamdashsoybeans
China is an emerging competishytor for US farmers in some specialty crops and China has a positive trade balance with the United States on horticultural crops although the total dollar value is a relatively small share of total agricultural trade Figure 1 shows China had a trade surplus of $40 million in horticultural products with the United States in 2011 down from $157 million in Chinarsquos favor in 2007 The 2011 $40 million surplus is only 1 of the value of agricultural trade between the United States and China Chinarsquos growing demand for almonds pistachios and walnuts is a positive development for US agrishyculture And per capita consumption of these specialty crops is still very low in China For instance per capita consumption of almonds in China is only about 5 of the US figure
US food products enjoy a certain advantage in China and there are growshying opportunities for US products considered to be high quality Howshyever price remains an obstacle for US products in the China market Chinese consumers spend about 20
10
11 Giannini Foundation of Agricultural Economics bull University of California
Exports Imports Trade Balance
of their disposable income on food consumed at home compared to less than 7 of income spent on at-home food in the US on average
Impediments to Chinarsquos Exports Impediments to foreign market access are an issue for Chinese agribusiness firms For instance Chinarsquos agriculshytural exports of horticultural products have been adversely affected by anti-dumping (AD) investigations against them launched by firms in both developing and developed countries Globally there have been about 23 AD cases against Chinarsquos agriculture since that market opened up in the early 1980s and many of the AD actions in agriculture have targeted horticulshytural productsmdashresulting in very high tariff rates against Chinese exports
Most anti-dumping cases are nothshying more than hidden protectionism Under US AD law China is treated as a ldquonon-market economyrdquo and as a result its exporters have been assessed tariffs higher than typical AD rates applied to so-called market economies US AD cases against Chinarsquos exports have targeted imports of fresh garlic preserved mushrooms apple juice concentrate shrimp and crawfish tail meat With the exceptions of honey and shrimp these cases have had mixed success at keeping out Chinese exports for more than a few years
But in each and every case the US consumer has paid higher prices as a result of the dumping orders Honey from China has clearly been kept out Chinarsquos share of US honey imports was around 30 when the AD case was initiated in 2000 and today that market share is near zero Instead the US imports honey from India a higher-cost supplier This is called trade diversion good for the honey industry in India and the United States but costly for US consumers
Figure 1 Chinarsquos Trade Balance with the US in Horticulture
Millions of Current US$
400
350
300
250
200
150
100
50
0
Source Compiled from UN COMTRADE data2001
Conclusion After more than a decade following
2002
WTO accession the value of Chinarsquos agricultural trade has increased drashy
2003
matically and China has turned into a net importer of agricultural products and now ranks as the number one
2004
foreign market for US agriculture 2005
Although considerable resource shifts have taken place from land-intensive towards labor-intensive agricultural products in both production and trade this transfer remains well below the potential This is partly due to trade barriers facing Chinarsquos exports of labor-intensive agricultural products
Food animal and plant safety are rightfully a concern of importshying countries but have unfortunately been used like AD for protectionist purposes There is considerable intershyest in the impacts of Chinarsquos rising income growth a growing middle class and urbanization and the associshyated changes in dietary patterns and food imports These variables will only fully come into play if Chinarsquos trading partners are willing to recognize that international trade is a two-way street
2008
2007
2006
2011
2010
2009
Suggested Citation
Carter Colin A and Sandro Steinbach 2013 Chinarsquos Growing Role in Agricultural Trade ARE Update 17(1)9shy11 University of California Giannini Foundation of Agricultural Economics
Colin A Carter is a professor in the ARE department at UC Davis and the director of the Giannini Foundation of Agricultural Economics He can be reached by e-mail at cacarterucdavisedu Sandro Steinbach is a MS candidate in the ARE department at UC Davis who can be contacted at sandro primalucdavisedu
For additional information the authors recommend
httpdimsumsblogspotcom
wwwusccgovHearingshearingshychinarsquos-agricultural-policy-andshyus-access-chinarsquos-market
Department of Agricultural and Resource EconomicsshyUC Davis One Shields Avenue Davis CA 95616 GPBS
Agricultural and Resource Economics
UPDATE
Co-Editors
Richard Sexton Sofia Berto Villas-Boas
David Zilberman
Managing Editor and Desktop Publishershy
Julie McNamara
Published by the Giannini Foundation of Agricultural Economics
httpgianniniucopedu
ARE Update is published six times per year by the Giannini Foundation of Agricultural Economics University of California
Domestic subscriptions are available free of charge to interested parties To subscribe to ARE Update by mail contact
Julie McNamara Outreach Coordinator Giannini Foundation of Agricultural Economics Department of Agricultural and Resource Economics University of California One Shields Avenue Davis CA 95616 E-mail julieprimalucdavisedu Phone 530-752-5346
To receive notification when new issues of the ARE Update are available online submit an e-mail request to join our listserv to julieprimalucdavisedu
Articles published herein may be reprinted in their entirety with the authorrsquos or editorsrsquo permission Please credit the Giannini Foundation of Agricultural Economics University of California
ARE Update is available online at httpgianniniucopeduare-update
The University of California is an Equal OpportunityAffirmative Action employer
Giannini Foundation of Agricultural Economics bull University of California
When matching each grocery store with the socio-economic characteristics of the zip code in which it is located we are able to investigate heterogeneous effects of the recall We study whether income and household size affect the response to the recalls where income is the demeaned average income in the zip code in which the store is located (in 10000 USD) and household size is the demeaned average household size in the zip code in which the store is located Socio-economic data come from the 2000 US Census While we find no correlation with income we do find that areas that had a larger than average household size decreased egg purchases significantly more
A caveat to the results is that it is possible that more affluent customshyers diverted egg purchases to farmersrsquo markets or high-end grocery stores after the egg recalls and thus the estishymates would suffer from selection bias The data allow only for the identificashytion of effects with purchases undershytaken at the national grocery chain
We also find differentiated effects among Northern and Southern Calishyfornian stores Although the national grocery chain had infected eggs only in Northern California we find that Southern Californian stores had lower egg sales as well The overall sales reduction in Southern California was half as large as the reduction in Northshyern California and is consistent with media and reputation effects being sigshynificant determinants of demand even in the absence of an actual food recall
Studies on the effects of safety warnings on spinach (Arnade et al 2009) beef (Schlenker and Villas-Boas 2009) or fish (Shimshack et al 2007) have also found significant consumer responses However the persistence of the effect may vary depending on the type of good and availability of subshystitutes For example while the effect of a safety warning on spinach had a
long-term effect our results for eggs suggest that the effect was temporary
To test the robustness of our findshyings we perform several checks First we test the sensitivity of the baseline results to various assumpshytions about the seasonality paramshyeters We use only data for one year before the recall (2009) instead of using as above all previous years (2007 2008 and 2009) This yields very similar drops in purchases as when we include all previous years
Second we test the sensitivity of the baseline results to using Washington as a control state by excluding data from Washington and using stores in Southshyern California as controls The ratioshynale is that we may assume that stores in Southern California have similar trends to stores in Northern California Once again using Southern California stores as counterfactuals for Northern California store patterns yields very similar estimates of the egg recalls
Third we test the sensitivity of the baseline results to using only one month after the event week We obtain data on a second post-event month and include a total of eight weeks after the event week for all years While this additional robustness check gives us similar results to the ones from the main specification we find that the effect lasted more than one month
Conclusion Consistent with previous literature on the effects of foodborne disease outbreaks food scares and governshyment warnings our results show that consumers do respond to outbreaks at least temporarily Moreover not only did consumers reduce their purshychases of affected products they also did not switch to unaffected alternashytives As a result overall egg purchases dropped These findings have policy implications for consumers producshyers and policymakers They show that
consumers do respond to recalls and that these responses are an incentive for firms to invest in risk reduction and to comply with existing regulations They also contribute to a discussion on the need for additional investments in food safety product tracking and the enforcement of existing regulashytions in order to improve the availshyability of safe products for consumers
Suggested Citation
Toledo Chantal and Sofia Berto Villas-Boas Food Borne Disease Outbreaks and Consumer Purchases ARE Update 17(1) (2013) 1-4 University of California Giannini Foundation of Agricultural Economics
Chantal Toledo is a post-doctoral fellow at the Energy Biosciences Institute and Sofia Berto Villas-Boas is an associate professor in the ARE department both at UC Berkeley They can be contacted by email at chantaltoledoberkeleyedu and sberto berkeleyedu respectively This article is based on the paper ldquoFood Borne Disease Outbreaks Consumer Purchases and Product Preferences The Case of the 2010 Salmonella Egg Outbreak in the USrdquo We thank the Giannini Foundation for funding this project and the national retailer for providing the data
For additional information the authors recommend
Arnade C L Calvin and F Kuchler ldquoConsumer Response to a Food Safety Shock The 2006 Food- Borne Illness Outbreak of E coli O157 H7 Linked to Spinachrdquo Review of Agricultural Economics 31(4) (2009) 734-750
Schlenker W and S Villas-Boas ldquoConsumer and Market Responses to Mad Cow Diseaserdquo American Journal of Agricultural Economics 91(4) (2009) 1140-1152
Shimshack J M Ward and T Beatty ldquoMercury Advisories Information Education and Fish Consumptionrdquo Journal of Environmental Economics and Management 53(2) (2007) 158-179
4
5 Giannini Foundation of Agricultural Economics bull University of California
1995
2001
1999
1997
2009
2007
2011
1994
2004
2002
1998
1996
2008
2006
2010
2012
Avocado Board (HAB) These funds are
Commission (CAC) and up to 85 of importer assessments to the certified
60
40
30
20
10
2005
2003
2000
Per Capita Consumption
Real Price (centslb)
80
50
40
30
10
0
Demand Growth and Commodity Promotions for Fresh Hass Avocados Hoy F Carman Tina L Saitone and Richard J Sexton
for imports and forwarded to the Hass Figure 1 Per Capita Consumption and Real Producer Price for Fresh Avocados
then allocated to programs and activishy70
ties designed to increase the demand 50
for Hass avocados in the US market 60
Cents per Lb
Per Capita Consumption
The HAB uses 15 of the assessments to fund activities such as nutrition research marketing and information programs intended to benefit all avocado producers It rebates 85 of domestic
20assessments to the California Avocado
Shipments of fresh Hass avocados to the US have increased dramatically in recent years primarily in response to the opening of the US market to imports from Mexico Inflation-adjusted prices received by California growers have nonetheless remained nearly constant on average despite considerable year-to-year volatility Our analysis shows that consumer demand growth fueled in part by a successful industry promotion program has prevented falling prices
California avocado growersrsquo long-standing program to fund advertising and promotion
programs for their fruit was extended to include imports of fresh avocados through the Hass Avocado Promoshytion Research and Information Act signed into law on October 23 2000 Mandatory program assessments of 25 cents per pound on all Hass avocados sold in the US market commenced effective January 2 2003 under the Hass Avocado Promotion Research and Information Order (HAPRIO)
The assessment is collected by first handlers for California producshytion and by the US Customs Service
operating under the HAB the Chilean Avocado Importers Association (CAIA) the Mexican Hass Avocado Importers Association (MHAIA) and the Perushyvian Avocado Commission (PAC)
This article summarizes the evalushyation of the economic impact of promotional expenditures conducted under HABrsquos auspices on US demand for fresh avocados and estimates proshyducer returns from the expenditures for the second five years of the HABrsquos operashytionsmdashthe period from 2008 through 2012 We estimated an aggregate annual model of demand for fresh avocados in the United States A market simulation model was constructed using results from estimation of the annual model and utilized to estimate benefits and costs from the promotion program
Supply and Demand of Avocados Since HAB assessments to support avoshycado promotion began in 2003 avocado imports and total US supplies (Hass and other varieties) have continued to increase to a record total of over 16 billion pounds in 2012 Mexican avocado exports to the US increased significantly after Mexico gained year-round access to all states except
California and Florida in 2005 and to all states in 2007 Mexican imports of 9338 million pounds accounted for over 58 of the total US supply of fresh avocados and for 867 of total fresh avocado imports in 2012 Market share for imports increased from 30 in 2000 to 67 in 2012
The US demand for avocados has grown substantially in the ten years since the HAB began funding promoshytional programs in January 2003 As shown in Figure 1 US consumpshytion has exceeded two pounds per capita annually since 2001 exceedshying three pounds per capita in 2005 four pounds per capita in 2010 and five pounds per capita in 2012
Figure 1 also depicts the average price per pound in real (inflationshyadjusted base year 1982-84) terms received by California growers for these same years The farm-level demand for avocados is widely acknowledged to be quite price inelastic with empirishycal estimates typically near -025 In the absence of substantial demand growth one would have thus expected sharply lower prices to accompany an increase in avocado supply of over 200 But despite the real grower price
importer associations for their own proshymotion programs There are currently
Source USDA NASS three certified importer associations
00
Giannini Foundation of Agricultural Economics bull University of California
Table 1 US Avocado Promotional Expenditures by Organization 2003ndash2012
Year CAC CAIA MHAIA PAC HAB Total
-------------------------- 1000 dollars ----------------------shy
2003 8682 1427 0 0 146 10256
2004 10756 3010 700 0 859 15325
2005 11838 5743 2900 0 2603 23084
2006 10499 2661 4500 0 2562 20222
2007 9205 3865 6247 0 3097 22413
5-YR Sub-total 50980 16705 14347 0 9268 91300
2008 10470 3819 7141 0 3102 24532
2009 6559 5405 13995 0 4646 30604
2010 8780 2351 13379 0 5908 30418
2011 9004 3732 11419 0 3555 27710
2012 11632 1994 17713 952 4220 36510
5-YR Sub-total 46444 17301 63647 952 21430 149774
Grand Total 97425 34006 77993 952 30698 241073
exhibiting considerable year-to-year volatility (characteristic of a comshymodity with inelastic demand) it has on average remained stable over this time period reflecting the substantial demand growth that has occurred
Avocado Promotions Initiation of assessments on all Hass avocados sold in the US market in 2003 and increasing Hass avocado imports has significantly increased the availability of funds for proshymotion programs Table 1 shows
promotional expenditures by year for avocados from the US (CAC) Chile (CAIA) Mexico (MHAIA) and Peru (PAC) plus promotional expenshyditures made by the HAB itself
During the HABrsquos first five years of operation 2003 through 2007 CAIA MHAIA and HAB spent $4032 milshylion promoting avocados in addition to $5098 million spent by California producers Total CAC promotional expenditures for the next five years 2008ndash2012 decreased just over 10 as a result of relatively small crops
Model 1 (GLS) Model 2 (GLS)
Variable Estimate t-stat Estimate t-stat
Table 2 Annual Model Regression Results
Model 3 (2SLS)
Estimate t-stat
Model 4 (2SLS)
Estimate t-stat
California FOB Price (centslb)
-0012 -367 -0015 -528
Per Capita Income 0276 192 -0287 -362
Total Promotion 0113 418 0049 219
Time Trend 0214 817
Constant -1633 -071 5279 475
Durbin-Watson Statistic 1310 1465
Observations 19 19
Adjusted R2 0981 0986
-0011 -164
-0155 -185
0052 248
0180 640
3349 233
-
18
0993
-0001 -020
0077 293
0132 746
0754 188
-
18
0982
Advertising Elasticity 0354 0153 0163 0241
in 2009 and 2011 But promotional expenditures by HAB and country orgashynizations financed by fresh avocado imports raised average avocado proshymotion from $1826 million annually from 2003 to 2007 to $2995 million annually from 2008 to 2012 (table 1)
Promotion Evaluation Carman Li and Sexton (CLS 2009) conducted the first evaluation of the HAB promotion programs for the five-year period from 2003 through 2007 CLS found that advertising and promotion funded under the HAB increased the demand for fresh avocashydos during the programrsquos first five years of operation and yielded a favorable rate of return to avocado producers Annual Demand for Avocados
Economic theory posits that demand for a commodity is a function of that commodityrsquos price prices of goods that are used as substitutes or complements for the commodity and consumer income Successful promotions can also be an important factor in expanding demand for a product We estimated annual per capita fresh avocado demand as a function of price per capita income a time trend and total HAB and CAC promotions The annual model analysis utilized data from 1994ndash2012 Table 2 contains the annual demand model results for four model specifications
Model 1 in table 2 includes real fob price real per capita income and real promotion expenditures as explanashytory variables Model 2 adds a linear time trend YEAR to Model 1 Models 3 and 4 are adjusted to account for the fact that price and consumption are likely jointly determined These models use US Chilean and Mexishycan avocado acreage as instrumental variables (ie a proxy) for price Real promotion expenditures represent the key variable of interest in all 4 models
In all cases promotion expendishytures have a statistically significant and positive impact on per capita US
6
7 Giannini Foundation of Agricultural Economics bull University of California
Figure 2 Avocado Promotion Simulation Model
Pt
Prsquot
Pshyt
St
Srsquot
C B
A
avocado consumption The estimated coefficients for promotion expenditures range from 0049 (model 2) to 0113 (model 1) Models 3 and 4 which have the best statistical properties among the models yield intermediate values for the promotion coefficient of 0052 and 0077 depending upon whether per capita income is included in the model
Because the magnitude of the estishymated coefficients depends upon the choice of units to measure the model variables it is desirable to convert the coefficients to elasticities which measure estimated percentage impacts and thus are unitless The estimated promotion elasticities evaluated at the data means range from 0153 (model 2) to 0354 (model 1) (see table 2)
The other variables included in the model perform much as economic theory would predict and estimates are also consistent with prior work The one exception is the impact of the income variable when it is included in a model with the time trend These two variables are highly correlated and in essence it is impossible to isoshylate the unique impacts of growth in consumersrsquo incomes on avocado conshysumption from other economic factors that are captured in the trend term
Cost-Benefit Analysis of Promotional Expenditures
The annual demand analysis presshyents strong evidence that generic promotion of fresh avocados has worked to increase the demand for fresh avocados in the United States The additional question to ask howshyever is whether the expenditures have ldquopaid offrdquo in the sense of yielding benshyefits to producers from the demand enhancement that exceed the money expended to fund the programs
The average benefit-cost ratio (ABCR) from a promotion program consists of the total incremental profit to producers generated by the program over a specified time period divided by the total incremental costs borne
Prdquot
05
Q D Drsquot Qrsquot t t
by producers to fund a program The ABCR is the key measure of whether a program was successful with ABCR gt 10 defining a successful program
The marginal benefit-cost ratio (MBCR) measures the incremental profit to producers generated from a small expansion or contraction of a promotion program MBCR answers the question of whether expansion of the promotion program would have increased producer profits with MBCR gt 10 indicating a program that could have been profitably expanded
Substantial diagnostic tests pershyformed by CLS (2009) in their evaluation of avocado promotion supshyported use of a linear demand model which we thus also utilized For the linear model ABCR = MBCR and the two questions ldquowas the program profitshyablerdquo and ldquocould it have been profitably expandedrdquo are one and the same
Our strategy in estimating ABCR and MBCR for the promotion proshygrams conducted under HABrsquos auspices was to simulate the impact of a small hypothetical increase in the HAB assessment rate from the curshyrent level of $0025lb to $003lb ie an increase of one-half cent per pound and estimate the benefits and costs to avocado growers from that assessment expansion based upon the
results of the annual demand analysis The simulation framework is
depicted in figure 2 The model begins with demand and supply functions for avocados that depict the US market for a given year t Thus demand Dt is total US demand in year t on a per capita basis Supply St is total supply to the US market in year t from all sources Under the current program total US consumption in year t given functions St and Dt is Qt and grower price is Pt Implementation of a one-half cent per pound expansion in the program assessment increases producer costs per pound by that half cent Srsquo t as depicted in figure 2
The hypothetical increase in assessshyment generates incremental funds for promotions equal to the change in assessment multiplied by total shipments to the US market The marginal impact of the additional promotional expenditure on demand is determined by the regression coefshyficient for the promotion variable which is reported for alternative model specifications in table 2
The new demand curve is illustrated in figure 2 by Drsquo t The new market equilibrium is found at the intersecshytion of curves Srsquo t and Drsquo t at point A in figure 2 Thus the model predicts that equilibrium price in year t would have
Giannini Foundation of Agricultural Economics bull University of California
risen to Prsquo t and sales have risen to Qrsquo t with the incremental assessment
Producer benefits from the hyposhythetical expansion of the promotion program are measured in terms of the change in producer surplus (PS) PS is the same as producer variable profits namely revenue (producer price x output) minus the variable production costs associated with producing and selling the output
We seek to measure the change in PS associated with the hypothetical expansion of the promotion program In figure 2 PS after the program expansion is PSrsquo = Prsquo t x Qrsquo tndash 0BQrsquo t but we must also account for the additional promoshytion expenditure which is represented geometrically by the rectangle Prsquot Prdquo t AB=(Prsquo tndash Prdquo t)Qrsquo t Thus the net increase in PS to producers from expansion of the promotion program is ΔPS = PSrsquo ndash (Prsquo t ndash Prdquo t) Qrsquo t which is represhysented by the shaded area in figure 2
Information required to estimate ΔPS consists of (i) an estimate of the marginal impact of promotional expenshyditures on demand (ii) an estimate of the slope or price elasticity isinD of the grower-level demand curve and (iii) an estimate of the slope or price elasticshyity isinS of grower supply of avocados to the US market The results of the econometric estimates reported in table 2 provide estimates of (i) and (ii)
We evaluated these considerations and specified three alternative values 05 10 and 20 as representing a plausible range of values for isinS Among the demand models included in table 2 we selected models 1 and 3 for use in the simulation Benefits and costs were estimated for each of the five years 2008ndash2012 under evaluation
The model was implemented by fitshyting the demand and supply functions to the actual values observed for the real grower price and per capita consumpshytion for each year of the review period St was then shifted vertically to Srsquo t by the half-cent incremental assessment for
each year and D was shifted horizon-t
tally to Drsquo t by the estimated promotion coefficient times the funds generated by the incremental assessment producing the equilibrium at point A in figure 2 and enabling us to compute the hyposhythetical changes in P and Q and the ΔPS
Total net producer benefits are reported for each model by compoundshying the annual benefits and costs over the five-year period to 2012 using a 3 real rate of interest The estimated benefit-cost ratios in this study range from 212 to 928 The lower bound is associated with model 3 which has a small coefficient for promotion relative to model 1 and the most elastic supply response isinS=20 The average annual increase in the grower price due to promotions for this simulation is 26 The upper bound of 928 is associshyated with demand model 1 which has a high coefficient for promotion and with the most inelastic supply response isinS=05 The average annual price increase for this simulation is 123
Space considerations preclude us from discussing results of the disagshygregate model estimated using scanner data Those results are available upon request from the authors and showed a statistically significant positive impact of promotions on weekly sales in those market areas receiving promotions through the HAB thus reinforcing the results from the annual model
Conclusion Fresh avocados have seen remarkshyable growth in consumption per capita in the US rising from about 15 pounds during the decade of the 1990s to over 5 pounds in 2012 This rapid increase in imports to the US and commensurate consumption has been achieved while keeping real grower prices relatively constant on average over this time period Such an outcome is only possible with substantial growth in fresh avocado demand in the US over this time
The econometric analysis of annual fresh avocado demand conducted in this study provides strong statistical evishydence of this demand growth and support for the proposition that promoshytion expenditures have been an important causal factor Benefit-cost analysis conducted based upon these econometric estimates yielded estimated average and marginal benefit-cost ratios in the range of 212 to 928 We conshyclude with considerable confidence that the promotion programs conducted unshyder the HABrsquos auspices have been successful in both expanding demand for fresh avocados in the US and yieldshying a very favorable return to those funding the program
Suggested Citation
Carman HF TL Saitone and R J Sexton 2013 Demand Growth and Commodity Promotions for Fresh Hass Avocados ARE Update 17(1)5shy8 University of California Giannini Foundation of Agricultural Economics
Hoy F Carman (carmanprimalucdavisedu) is a professor emeritus Tina L Saitone (saitone primalucdavisedu) is a project economist and Richard J Sexton (richprimalucdavisedu) is a professor and chair all in the ARE department at UC Davis
For additional information the authors recommend
Carman HF L Li and RJ Sexton (2009) ldquoAn Economic Evaluation of the Hass Avocado Promotion Orderrsquos First Five Yearsrdquo University of California Giannini Foundation of Agricultural Economics Giannini Foundation Research Report 351
Carman HF L Li and RJ Sexton ldquoCan Improved Market Information Benefit Both Producers and Consumers Evidence from the Hass Avocado Boardrsquos Internet Information Programrdquo ARE Update 13(4) 2010
Li Lan HF Carman and R J Sexton ldquoRetailer Pricing Practices for Fresh Avocadosrdquo ARE Update 10(1) 2006
8
9 Giannini Foundation of Agricultural Economics bull University of California
Chinarsquos Growing Role in Agricultural Trade Colin A Carter and Sandro Steinbach
This article discusses developments in Chinarsquos agricultural trade and implications for the United States We highlight areas in which China has become a major exporter of agricultural products the global importance of these exports and factors that underlie the export trends In addition we reference market access issues faced by Chinarsquos agricultural exports
China produces over 20 of the worldrsquos cereal grains 25 of the worldrsquos meat and 50 of the
worldrsquos vegetables China is the worldrsquos largest agricultural economy and it ranks as the top global producer of pork wheat rice tea cotton tomatoes potatoes eggs wool apples walnuts and fish etc In fact the annual value of Chinarsquos agricultural output is about two and one-half times the US total
After joining the World Trade Organization (WTO) in 2001 China increased its trade dependence on agrishyculture As of 2011 it was the fourth largest exporter and second largest importer of agricultural products in the world according to WTO trade statistics Its import growth has been driven by a shift in its domestic producshytion mix and changing consumer diets with rising incomes and urbanization Chinarsquos substantial increase in fruit and vegetable production is a major factor behind it agricultural export growth
In agriculture Chinarsquos major policy objectives are focused on increasing
grain production and starting the transition to larger-scale farms China has a relatively low set of agricultural import tariffs compared to other WTO members and domestic support to agriculture in China remains less than that for many developed countries
Changing Trade Structure With imports growing faster than exports during the post-WTO accesshysion years China reversed its longshytime status as a net agricultural exporter to that of a net importing country since 2004 Most of Chinarsquos increased imports came from soyshybeans and cotton Today cotton and soybeans account for over 40 of Chinarsquos agricultural imports a very concentrated portfolio China is the worldrsquos largest importer of soybeans and cotton accounting for over 60 of global soybean imports and approxishymately 40 of cotton imports
It was expected that Chinarsquos producshytion and trade of agricultural products would be significantly affected by WTO entry and this has turned out to be the case Chinarsquos agricultural exports have increased by more than 12 annushyally Import growth has averaged 19 per annum while total agricultural trade has grown by more than 16 per annum from 2002 to 2011 These are truly impressive annual growth rates
The changing structure of Chinarsquos agricultural exports has been domishynated by very strong growth in exports of horticultural products (eg garlic
apples pears and citrus) semi-processed food products (eg animal products pet food) and aquaculture (eg fish fillets) Table 1 shows the annual growth in exports for various agricultural categories from 2001shy2011 From top to bottom the annual growth rate was 18 for horticulshytural exports 14 for semi-processed foods 13 for aquaculture 12 for processed (eg apple juice proshycessed tomatoes) and less than 2 for bulk items such as tea or tobacco
Regarding accomplishments in world markets Chinarsquos exports of aquashyculture products have grown from 8 of the world market in 2001 to 14 of the market in 2011mdasha remarkable achievement China is very successshyful at exporting frozen fish fillets of various types including salmon There is a large fish processing industry in China that imports whole salmon and other fish from the US Russia and elsewhere and then in turn reshyexports fish fillets Another category that is also a strong export performer is horticultural products rising from 25 to 56 of world exports more than doubling its market share
Chinarsquos trade patterns have been affected by concerns over food safety with some food products For instance the melamine-spiked milk scandal of 2008 has led to a surge in Chinarsquos imports of milk powdermdashChinarsquos skim milk powder imports were up about 50 just in the past year contributing to higher milk powder prices in world
Table 1 Annual Growth Rates of Chinarsquos Agricultural Exports Since WTO Accession
Aquaculture Bulk Processed Horticulture Semi-Processed
2001ndash2011 Annual Growth Rate in Value of Exports
133 17 122 180 145
Source Compiled from UN COMTRADE data
Giannini Foundation of Agricultural Economics bull University of California
Table 2 Export and Import Trade Growth Rate of Chinarsquos Labor-Intensive
Agricultural Products 2001ndash2011
Aquaculture Livestock Horticulture
Exports 133 77 180
Imports 135 158 210
Source Compiled from UN COMTRADE data
markets China is responding to the food safety issue and has reorganized its food safety regulatory system modshyeled on the FDA in the United States
Chinarsquos agricultural trade is more and more in line with its comparashytive advantage and it has noticeably increased imports of land-intensive agricultural products But what about its trade in labor-intensive products Although exports of labor-intensive agricultural products did increase quite fast after WTO accession (espeshycially for fruits and vegetables) the rate of increase for these years was lower than imports of land-intensive agricultural products For instance the annual export growth rate for labor-intensive fruits and vegetables was 22 and 167 respectively At the same time imports of land-intensive soybeans and cotton grew by 25 and 357 respectively
Surprisingly the import growth of labor-intensive agricultural prodshyucts was also quite highmdashin fact greater than the export growth rate of these products for the same period Aquacultural exports grew by 133 slightly less than its import growth
of 135 Horticultural exports grew by an impressive 18 per annum but horticultural imports grew even faster at 21 per annum (Table 2)
So what do all these numbers sugshygest regarding Chinarsquos trade First land-intensive imports are growing faster than labor-intensive exports Second for labor-intensive products imports are actually growing faster than exports There are three likely facshytors behind these trends First there is growing domestic demand for high-valued agricultural products including labor-intensive imports increasing with income and urbanization Second Chinarsquos agricultural labor is shifting away from agriculture to the higher paying manufacturing and service secshytors Third Chinarsquos labor-intensive agricultural exports face headwinds in world markets due to trade barrishyers and perceptions of poor quality
China-US Agricultural Trade The United States enjoys an agriculshytural trade surplus with China which exceeded $20 billion in 2012 This is partly a result of reduced import trade barriers in China and growing
Table 3 Major USndashChina Agricultural Products Traded Bilaterally in 2012
US Exports to China US Imports from China
Item Value (Mil) Item Value (Mil)
Soybeans $15374
Cotton $3686
Corn $1658
Hides and Skins $1219
Frozen Swine Offal $744
Apple Juice $561
Dog and Cat Food $467
Frozen Tilapia Fillets $444
Canned Citrus $233
Frozen Salmon Fillets $216
Source USDA FAS GAIN Report 2252013 based on China Customs Data
incomes and urbanization China is the most important market for US agricultural exports (accounting for 172 of US agricultural exports in 2012) and the third most important supplier of US agricultural imports (with a market share equal to 42 of US agricultural imports in 2012)
Table 3 shows that based on the value of trade the top five US agrishycultural exports to China (in order of importance) are soybeans cotton corn hidesskins and swine offal On the other hand the top five US imports from China are apple juice dog and cat food frozen tilapia fillets canned citrus and frozen salmon fillets It is notable that the sum total of Chinarsquos agricultural exports to the United States represents only two-thirds of the value of just one single item that the United States sells to Chinamdashsoybeans
China is an emerging competishytor for US farmers in some specialty crops and China has a positive trade balance with the United States on horticultural crops although the total dollar value is a relatively small share of total agricultural trade Figure 1 shows China had a trade surplus of $40 million in horticultural products with the United States in 2011 down from $157 million in Chinarsquos favor in 2007 The 2011 $40 million surplus is only 1 of the value of agricultural trade between the United States and China Chinarsquos growing demand for almonds pistachios and walnuts is a positive development for US agrishyculture And per capita consumption of these specialty crops is still very low in China For instance per capita consumption of almonds in China is only about 5 of the US figure
US food products enjoy a certain advantage in China and there are growshying opportunities for US products considered to be high quality Howshyever price remains an obstacle for US products in the China market Chinese consumers spend about 20
10
11 Giannini Foundation of Agricultural Economics bull University of California
Exports Imports Trade Balance
of their disposable income on food consumed at home compared to less than 7 of income spent on at-home food in the US on average
Impediments to Chinarsquos Exports Impediments to foreign market access are an issue for Chinese agribusiness firms For instance Chinarsquos agriculshytural exports of horticultural products have been adversely affected by anti-dumping (AD) investigations against them launched by firms in both developing and developed countries Globally there have been about 23 AD cases against Chinarsquos agriculture since that market opened up in the early 1980s and many of the AD actions in agriculture have targeted horticulshytural productsmdashresulting in very high tariff rates against Chinese exports
Most anti-dumping cases are nothshying more than hidden protectionism Under US AD law China is treated as a ldquonon-market economyrdquo and as a result its exporters have been assessed tariffs higher than typical AD rates applied to so-called market economies US AD cases against Chinarsquos exports have targeted imports of fresh garlic preserved mushrooms apple juice concentrate shrimp and crawfish tail meat With the exceptions of honey and shrimp these cases have had mixed success at keeping out Chinese exports for more than a few years
But in each and every case the US consumer has paid higher prices as a result of the dumping orders Honey from China has clearly been kept out Chinarsquos share of US honey imports was around 30 when the AD case was initiated in 2000 and today that market share is near zero Instead the US imports honey from India a higher-cost supplier This is called trade diversion good for the honey industry in India and the United States but costly for US consumers
Figure 1 Chinarsquos Trade Balance with the US in Horticulture
Millions of Current US$
400
350
300
250
200
150
100
50
0
Source Compiled from UN COMTRADE data2001
Conclusion After more than a decade following
2002
WTO accession the value of Chinarsquos agricultural trade has increased drashy
2003
matically and China has turned into a net importer of agricultural products and now ranks as the number one
2004
foreign market for US agriculture 2005
Although considerable resource shifts have taken place from land-intensive towards labor-intensive agricultural products in both production and trade this transfer remains well below the potential This is partly due to trade barriers facing Chinarsquos exports of labor-intensive agricultural products
Food animal and plant safety are rightfully a concern of importshying countries but have unfortunately been used like AD for protectionist purposes There is considerable intershyest in the impacts of Chinarsquos rising income growth a growing middle class and urbanization and the associshyated changes in dietary patterns and food imports These variables will only fully come into play if Chinarsquos trading partners are willing to recognize that international trade is a two-way street
2008
2007
2006
2011
2010
2009
Suggested Citation
Carter Colin A and Sandro Steinbach 2013 Chinarsquos Growing Role in Agricultural Trade ARE Update 17(1)9shy11 University of California Giannini Foundation of Agricultural Economics
Colin A Carter is a professor in the ARE department at UC Davis and the director of the Giannini Foundation of Agricultural Economics He can be reached by e-mail at cacarterucdavisedu Sandro Steinbach is a MS candidate in the ARE department at UC Davis who can be contacted at sandro primalucdavisedu
For additional information the authors recommend
httpdimsumsblogspotcom
wwwusccgovHearingshearingshychinarsquos-agricultural-policy-andshyus-access-chinarsquos-market
Department of Agricultural and Resource EconomicsshyUC Davis One Shields Avenue Davis CA 95616 GPBS
Agricultural and Resource Economics
UPDATE
Co-Editors
Richard Sexton Sofia Berto Villas-Boas
David Zilberman
Managing Editor and Desktop Publishershy
Julie McNamara
Published by the Giannini Foundation of Agricultural Economics
httpgianniniucopedu
ARE Update is published six times per year by the Giannini Foundation of Agricultural Economics University of California
Domestic subscriptions are available free of charge to interested parties To subscribe to ARE Update by mail contact
Julie McNamara Outreach Coordinator Giannini Foundation of Agricultural Economics Department of Agricultural and Resource Economics University of California One Shields Avenue Davis CA 95616 E-mail julieprimalucdavisedu Phone 530-752-5346
To receive notification when new issues of the ARE Update are available online submit an e-mail request to join our listserv to julieprimalucdavisedu
Articles published herein may be reprinted in their entirety with the authorrsquos or editorsrsquo permission Please credit the Giannini Foundation of Agricultural Economics University of California
ARE Update is available online at httpgianniniucopeduare-update
The University of California is an Equal OpportunityAffirmative Action employer
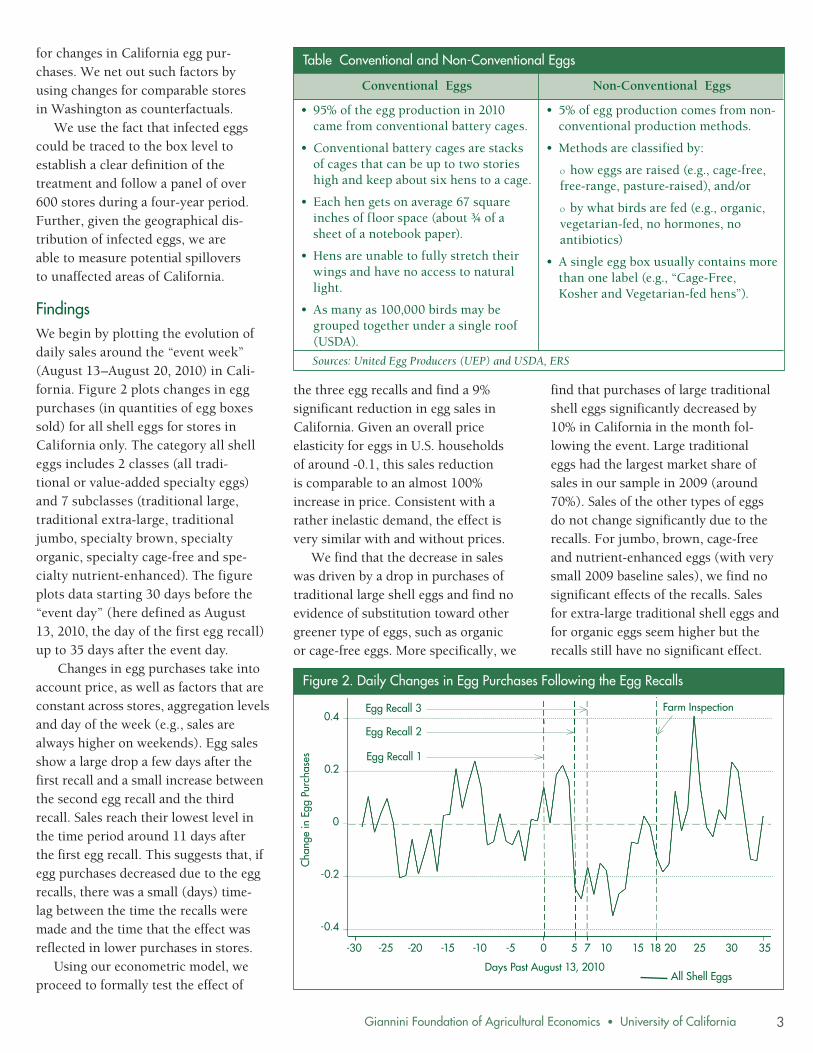
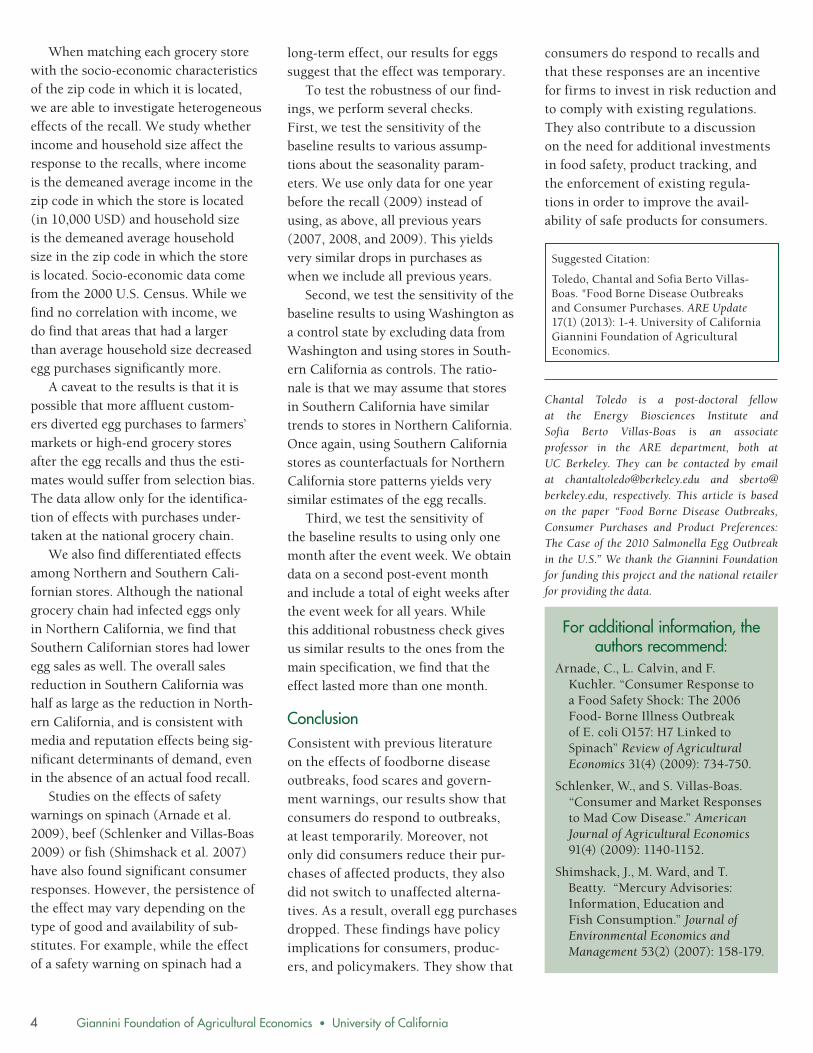
Giannini Foundation of Agricultural Economics bull University of California
Table 1 US Avocado Promotional Expenditures by Organization 2003ndash2012
Year CAC CAIA MHAIA PAC HAB Total
-------------------------- 1000 dollars ----------------------shy
2003 8682 1427 0 0 146 10256
2004 10756 3010 700 0 859 15325
2005 11838 5743 2900 0 2603 23084
2006 10499 2661 4500 0 2562 20222
2007 9205 3865 6247 0 3097 22413
5-YR Sub-total 50980 16705 14347 0 9268 91300
2008 10470 3819 7141 0 3102 24532
2009 6559 5405 13995 0 4646 30604
2010 8780 2351 13379 0 5908 30418
2011 9004 3732 11419 0 3555 27710
2012 11632 1994 17713 952 4220 36510
5-YR Sub-total 46444 17301 63647 952 21430 149774
Grand Total 97425 34006 77993 952 30698 241073
exhibiting considerable year-to-year volatility (characteristic of a comshymodity with inelastic demand) it has on average remained stable over this time period reflecting the substantial demand growth that has occurred
Avocado Promotions Initiation of assessments on all Hass avocados sold in the US market in 2003 and increasing Hass avocado imports has significantly increased the availability of funds for proshymotion programs Table 1 shows
promotional expenditures by year for avocados from the US (CAC) Chile (CAIA) Mexico (MHAIA) and Peru (PAC) plus promotional expenshyditures made by the HAB itself
During the HABrsquos first five years of operation 2003 through 2007 CAIA MHAIA and HAB spent $4032 milshylion promoting avocados in addition to $5098 million spent by California producers Total CAC promotional expenditures for the next five years 2008ndash2012 decreased just over 10 as a result of relatively small crops
Model 1 (GLS) Model 2 (GLS)
Variable Estimate t-stat Estimate t-stat
Table 2 Annual Model Regression Results
Model 3 (2SLS)
Estimate t-stat
Model 4 (2SLS)
Estimate t-stat
California FOB Price (centslb)
-0012 -367 -0015 -528
Per Capita Income 0276 192 -0287 -362
Total Promotion 0113 418 0049 219
Time Trend 0214 817
Constant -1633 -071 5279 475
Durbin-Watson Statistic 1310 1465
Observations 19 19
Adjusted R2 0981 0986
-0011 -164
-0155 -185
0052 248
0180 640
3349 233
-
18
0993
-0001 -020
0077 293
0132 746
0754 188
-
18
0982
Advertising Elasticity 0354 0153 0163 0241
in 2009 and 2011 But promotional expenditures by HAB and country orgashynizations financed by fresh avocado imports raised average avocado proshymotion from $1826 million annually from 2003 to 2007 to $2995 million annually from 2008 to 2012 (table 1)
Promotion Evaluation Carman Li and Sexton (CLS 2009) conducted the first evaluation of the HAB promotion programs for the five-year period from 2003 through 2007 CLS found that advertising and promotion funded under the HAB increased the demand for fresh avocashydos during the programrsquos first five years of operation and yielded a favorable rate of return to avocado producers Annual Demand for Avocados
Economic theory posits that demand for a commodity is a function of that commodityrsquos price prices of goods that are used as substitutes or complements for the commodity and consumer income Successful promotions can also be an important factor in expanding demand for a product We estimated annual per capita fresh avocado demand as a function of price per capita income a time trend and total HAB and CAC promotions The annual model analysis utilized data from 1994ndash2012 Table 2 contains the annual demand model results for four model specifications
Model 1 in table 2 includes real fob price real per capita income and real promotion expenditures as explanashytory variables Model 2 adds a linear time trend YEAR to Model 1 Models 3 and 4 are adjusted to account for the fact that price and consumption are likely jointly determined These models use US Chilean and Mexishycan avocado acreage as instrumental variables (ie a proxy) for price Real promotion expenditures represent the key variable of interest in all 4 models
In all cases promotion expendishytures have a statistically significant and positive impact on per capita US
6
7 Giannini Foundation of Agricultural Economics bull University of California
Figure 2 Avocado Promotion Simulation Model
Pt
Prsquot
Pshyt
St
Srsquot
C B
A
avocado consumption The estimated coefficients for promotion expenditures range from 0049 (model 2) to 0113 (model 1) Models 3 and 4 which have the best statistical properties among the models yield intermediate values for the promotion coefficient of 0052 and 0077 depending upon whether per capita income is included in the model
Because the magnitude of the estishymated coefficients depends upon the choice of units to measure the model variables it is desirable to convert the coefficients to elasticities which measure estimated percentage impacts and thus are unitless The estimated promotion elasticities evaluated at the data means range from 0153 (model 2) to 0354 (model 1) (see table 2)
The other variables included in the model perform much as economic theory would predict and estimates are also consistent with prior work The one exception is the impact of the income variable when it is included in a model with the time trend These two variables are highly correlated and in essence it is impossible to isoshylate the unique impacts of growth in consumersrsquo incomes on avocado conshysumption from other economic factors that are captured in the trend term
Cost-Benefit Analysis of Promotional Expenditures
The annual demand analysis presshyents strong evidence that generic promotion of fresh avocados has worked to increase the demand for fresh avocados in the United States The additional question to ask howshyever is whether the expenditures have ldquopaid offrdquo in the sense of yielding benshyefits to producers from the demand enhancement that exceed the money expended to fund the programs
The average benefit-cost ratio (ABCR) from a promotion program consists of the total incremental profit to producers generated by the program over a specified time period divided by the total incremental costs borne
Prdquot
05
Q D Drsquot Qrsquot t t
by producers to fund a program The ABCR is the key measure of whether a program was successful with ABCR gt 10 defining a successful program
The marginal benefit-cost ratio (MBCR) measures the incremental profit to producers generated from a small expansion or contraction of a promotion program MBCR answers the question of whether expansion of the promotion program would have increased producer profits with MBCR gt 10 indicating a program that could have been profitably expanded
Substantial diagnostic tests pershyformed by CLS (2009) in their evaluation of avocado promotion supshyported use of a linear demand model which we thus also utilized For the linear model ABCR = MBCR and the two questions ldquowas the program profitshyablerdquo and ldquocould it have been profitably expandedrdquo are one and the same
Our strategy in estimating ABCR and MBCR for the promotion proshygrams conducted under HABrsquos auspices was to simulate the impact of a small hypothetical increase in the HAB assessment rate from the curshyrent level of $0025lb to $003lb ie an increase of one-half cent per pound and estimate the benefits and costs to avocado growers from that assessment expansion based upon the
results of the annual demand analysis The simulation framework is
depicted in figure 2 The model begins with demand and supply functions for avocados that depict the US market for a given year t Thus demand Dt is total US demand in year t on a per capita basis Supply St is total supply to the US market in year t from all sources Under the current program total US consumption in year t given functions St and Dt is Qt and grower price is Pt Implementation of a one-half cent per pound expansion in the program assessment increases producer costs per pound by that half cent Srsquo t as depicted in figure 2
The hypothetical increase in assessshyment generates incremental funds for promotions equal to the change in assessment multiplied by total shipments to the US market The marginal impact of the additional promotional expenditure on demand is determined by the regression coefshyficient for the promotion variable which is reported for alternative model specifications in table 2
The new demand curve is illustrated in figure 2 by Drsquo t The new market equilibrium is found at the intersecshytion of curves Srsquo t and Drsquo t at point A in figure 2 Thus the model predicts that equilibrium price in year t would have
Giannini Foundation of Agricultural Economics bull University of California
risen to Prsquo t and sales have risen to Qrsquo t with the incremental assessment
Producer benefits from the hyposhythetical expansion of the promotion program are measured in terms of the change in producer surplus (PS) PS is the same as producer variable profits namely revenue (producer price x output) minus the variable production costs associated with producing and selling the output
We seek to measure the change in PS associated with the hypothetical expansion of the promotion program In figure 2 PS after the program expansion is PSrsquo = Prsquo t x Qrsquo tndash 0BQrsquo t but we must also account for the additional promoshytion expenditure which is represented geometrically by the rectangle Prsquot Prdquo t AB=(Prsquo tndash Prdquo t)Qrsquo t Thus the net increase in PS to producers from expansion of the promotion program is ΔPS = PSrsquo ndash (Prsquo t ndash Prdquo t) Qrsquo t which is represhysented by the shaded area in figure 2
Information required to estimate ΔPS consists of (i) an estimate of the marginal impact of promotional expenshyditures on demand (ii) an estimate of the slope or price elasticity isinD of the grower-level demand curve and (iii) an estimate of the slope or price elasticshyity isinS of grower supply of avocados to the US market The results of the econometric estimates reported in table 2 provide estimates of (i) and (ii)
We evaluated these considerations and specified three alternative values 05 10 and 20 as representing a plausible range of values for isinS Among the demand models included in table 2 we selected models 1 and 3 for use in the simulation Benefits and costs were estimated for each of the five years 2008ndash2012 under evaluation
The model was implemented by fitshyting the demand and supply functions to the actual values observed for the real grower price and per capita consumpshytion for each year of the review period St was then shifted vertically to Srsquo t by the half-cent incremental assessment for
each year and D was shifted horizon-t
tally to Drsquo t by the estimated promotion coefficient times the funds generated by the incremental assessment producing the equilibrium at point A in figure 2 and enabling us to compute the hyposhythetical changes in P and Q and the ΔPS
Total net producer benefits are reported for each model by compoundshying the annual benefits and costs over the five-year period to 2012 using a 3 real rate of interest The estimated benefit-cost ratios in this study range from 212 to 928 The lower bound is associated with model 3 which has a small coefficient for promotion relative to model 1 and the most elastic supply response isinS=20 The average annual increase in the grower price due to promotions for this simulation is 26 The upper bound of 928 is associshyated with demand model 1 which has a high coefficient for promotion and with the most inelastic supply response isinS=05 The average annual price increase for this simulation is 123
Space considerations preclude us from discussing results of the disagshygregate model estimated using scanner data Those results are available upon request from the authors and showed a statistically significant positive impact of promotions on weekly sales in those market areas receiving promotions through the HAB thus reinforcing the results from the annual model
Conclusion Fresh avocados have seen remarkshyable growth in consumption per capita in the US rising from about 15 pounds during the decade of the 1990s to over 5 pounds in 2012 This rapid increase in imports to the US and commensurate consumption has been achieved while keeping real grower prices relatively constant on average over this time period Such an outcome is only possible with substantial growth in fresh avocado demand in the US over this time
The econometric analysis of annual fresh avocado demand conducted in this study provides strong statistical evishydence of this demand growth and support for the proposition that promoshytion expenditures have been an important causal factor Benefit-cost analysis conducted based upon these econometric estimates yielded estimated average and marginal benefit-cost ratios in the range of 212 to 928 We conshyclude with considerable confidence that the promotion programs conducted unshyder the HABrsquos auspices have been successful in both expanding demand for fresh avocados in the US and yieldshying a very favorable return to those funding the program
Suggested Citation
Carman HF TL Saitone and R J Sexton 2013 Demand Growth and Commodity Promotions for Fresh Hass Avocados ARE Update 17(1)5shy8 University of California Giannini Foundation of Agricultural Economics
Hoy F Carman (carmanprimalucdavisedu) is a professor emeritus Tina L Saitone (saitone primalucdavisedu) is a project economist and Richard J Sexton (richprimalucdavisedu) is a professor and chair all in the ARE department at UC Davis
For additional information the authors recommend
Carman HF L Li and RJ Sexton (2009) ldquoAn Economic Evaluation of the Hass Avocado Promotion Orderrsquos First Five Yearsrdquo University of California Giannini Foundation of Agricultural Economics Giannini Foundation Research Report 351
Carman HF L Li and RJ Sexton ldquoCan Improved Market Information Benefit Both Producers and Consumers Evidence from the Hass Avocado Boardrsquos Internet Information Programrdquo ARE Update 13(4) 2010
Li Lan HF Carman and R J Sexton ldquoRetailer Pricing Practices for Fresh Avocadosrdquo ARE Update 10(1) 2006
8
9 Giannini Foundation of Agricultural Economics bull University of California
Chinarsquos Growing Role in Agricultural Trade Colin A Carter and Sandro Steinbach
This article discusses developments in Chinarsquos agricultural trade and implications for the United States We highlight areas in which China has become a major exporter of agricultural products the global importance of these exports and factors that underlie the export trends In addition we reference market access issues faced by Chinarsquos agricultural exports
China produces over 20 of the worldrsquos cereal grains 25 of the worldrsquos meat and 50 of the
worldrsquos vegetables China is the worldrsquos largest agricultural economy and it ranks as the top global producer of pork wheat rice tea cotton tomatoes potatoes eggs wool apples walnuts and fish etc In fact the annual value of Chinarsquos agricultural output is about two and one-half times the US total
After joining the World Trade Organization (WTO) in 2001 China increased its trade dependence on agrishyculture As of 2011 it was the fourth largest exporter and second largest importer of agricultural products in the world according to WTO trade statistics Its import growth has been driven by a shift in its domestic producshytion mix and changing consumer diets with rising incomes and urbanization Chinarsquos substantial increase in fruit and vegetable production is a major factor behind it agricultural export growth
In agriculture Chinarsquos major policy objectives are focused on increasing
grain production and starting the transition to larger-scale farms China has a relatively low set of agricultural import tariffs compared to other WTO members and domestic support to agriculture in China remains less than that for many developed countries
Changing Trade Structure With imports growing faster than exports during the post-WTO accesshysion years China reversed its longshytime status as a net agricultural exporter to that of a net importing country since 2004 Most of Chinarsquos increased imports came from soyshybeans and cotton Today cotton and soybeans account for over 40 of Chinarsquos agricultural imports a very concentrated portfolio China is the worldrsquos largest importer of soybeans and cotton accounting for over 60 of global soybean imports and approxishymately 40 of cotton imports
It was expected that Chinarsquos producshytion and trade of agricultural products would be significantly affected by WTO entry and this has turned out to be the case Chinarsquos agricultural exports have increased by more than 12 annushyally Import growth has averaged 19 per annum while total agricultural trade has grown by more than 16 per annum from 2002 to 2011 These are truly impressive annual growth rates
The changing structure of Chinarsquos agricultural exports has been domishynated by very strong growth in exports of horticultural products (eg garlic
apples pears and citrus) semi-processed food products (eg animal products pet food) and aquaculture (eg fish fillets) Table 1 shows the annual growth in exports for various agricultural categories from 2001shy2011 From top to bottom the annual growth rate was 18 for horticulshytural exports 14 for semi-processed foods 13 for aquaculture 12 for processed (eg apple juice proshycessed tomatoes) and less than 2 for bulk items such as tea or tobacco
Regarding accomplishments in world markets Chinarsquos exports of aquashyculture products have grown from 8 of the world market in 2001 to 14 of the market in 2011mdasha remarkable achievement China is very successshyful at exporting frozen fish fillets of various types including salmon There is a large fish processing industry in China that imports whole salmon and other fish from the US Russia and elsewhere and then in turn reshyexports fish fillets Another category that is also a strong export performer is horticultural products rising from 25 to 56 of world exports more than doubling its market share
Chinarsquos trade patterns have been affected by concerns over food safety with some food products For instance the melamine-spiked milk scandal of 2008 has led to a surge in Chinarsquos imports of milk powdermdashChinarsquos skim milk powder imports were up about 50 just in the past year contributing to higher milk powder prices in world
Table 1 Annual Growth Rates of Chinarsquos Agricultural Exports Since WTO Accession
Aquaculture Bulk Processed Horticulture Semi-Processed
2001ndash2011 Annual Growth Rate in Value of Exports
133 17 122 180 145
Source Compiled from UN COMTRADE data
Giannini Foundation of Agricultural Economics bull University of California
Table 2 Export and Import Trade Growth Rate of Chinarsquos Labor-Intensive
Agricultural Products 2001ndash2011
Aquaculture Livestock Horticulture
Exports 133 77 180
Imports 135 158 210
Source Compiled from UN COMTRADE data
markets China is responding to the food safety issue and has reorganized its food safety regulatory system modshyeled on the FDA in the United States
Chinarsquos agricultural trade is more and more in line with its comparashytive advantage and it has noticeably increased imports of land-intensive agricultural products But what about its trade in labor-intensive products Although exports of labor-intensive agricultural products did increase quite fast after WTO accession (espeshycially for fruits and vegetables) the rate of increase for these years was lower than imports of land-intensive agricultural products For instance the annual export growth rate for labor-intensive fruits and vegetables was 22 and 167 respectively At the same time imports of land-intensive soybeans and cotton grew by 25 and 357 respectively
Surprisingly the import growth of labor-intensive agricultural prodshyucts was also quite highmdashin fact greater than the export growth rate of these products for the same period Aquacultural exports grew by 133 slightly less than its import growth
of 135 Horticultural exports grew by an impressive 18 per annum but horticultural imports grew even faster at 21 per annum (Table 2)
So what do all these numbers sugshygest regarding Chinarsquos trade First land-intensive imports are growing faster than labor-intensive exports Second for labor-intensive products imports are actually growing faster than exports There are three likely facshytors behind these trends First there is growing domestic demand for high-valued agricultural products including labor-intensive imports increasing with income and urbanization Second Chinarsquos agricultural labor is shifting away from agriculture to the higher paying manufacturing and service secshytors Third Chinarsquos labor-intensive agricultural exports face headwinds in world markets due to trade barrishyers and perceptions of poor quality
China-US Agricultural Trade The United States enjoys an agriculshytural trade surplus with China which exceeded $20 billion in 2012 This is partly a result of reduced import trade barriers in China and growing
Table 3 Major USndashChina Agricultural Products Traded Bilaterally in 2012
US Exports to China US Imports from China
Item Value (Mil) Item Value (Mil)
Soybeans $15374
Cotton $3686
Corn $1658
Hides and Skins $1219
Frozen Swine Offal $744
Apple Juice $561
Dog and Cat Food $467
Frozen Tilapia Fillets $444
Canned Citrus $233
Frozen Salmon Fillets $216
Source USDA FAS GAIN Report 2252013 based on China Customs Data
incomes and urbanization China is the most important market for US agricultural exports (accounting for 172 of US agricultural exports in 2012) and the third most important supplier of US agricultural imports (with a market share equal to 42 of US agricultural imports in 2012)
Table 3 shows that based on the value of trade the top five US agrishycultural exports to China (in order of importance) are soybeans cotton corn hidesskins and swine offal On the other hand the top five US imports from China are apple juice dog and cat food frozen tilapia fillets canned citrus and frozen salmon fillets It is notable that the sum total of Chinarsquos agricultural exports to the United States represents only two-thirds of the value of just one single item that the United States sells to Chinamdashsoybeans
China is an emerging competishytor for US farmers in some specialty crops and China has a positive trade balance with the United States on horticultural crops although the total dollar value is a relatively small share of total agricultural trade Figure 1 shows China had a trade surplus of $40 million in horticultural products with the United States in 2011 down from $157 million in Chinarsquos favor in 2007 The 2011 $40 million surplus is only 1 of the value of agricultural trade between the United States and China Chinarsquos growing demand for almonds pistachios and walnuts is a positive development for US agrishyculture And per capita consumption of these specialty crops is still very low in China For instance per capita consumption of almonds in China is only about 5 of the US figure
US food products enjoy a certain advantage in China and there are growshying opportunities for US products considered to be high quality Howshyever price remains an obstacle for US products in the China market Chinese consumers spend about 20
10
11 Giannini Foundation of Agricultural Economics bull University of California
Exports Imports Trade Balance
of their disposable income on food consumed at home compared to less than 7 of income spent on at-home food in the US on average
Impediments to Chinarsquos Exports Impediments to foreign market access are an issue for Chinese agribusiness firms For instance Chinarsquos agriculshytural exports of horticultural products have been adversely affected by anti-dumping (AD) investigations against them launched by firms in both developing and developed countries Globally there have been about 23 AD cases against Chinarsquos agriculture since that market opened up in the early 1980s and many of the AD actions in agriculture have targeted horticulshytural productsmdashresulting in very high tariff rates against Chinese exports
Most anti-dumping cases are nothshying more than hidden protectionism Under US AD law China is treated as a ldquonon-market economyrdquo and as a result its exporters have been assessed tariffs higher than typical AD rates applied to so-called market economies US AD cases against Chinarsquos exports have targeted imports of fresh garlic preserved mushrooms apple juice concentrate shrimp and crawfish tail meat With the exceptions of honey and shrimp these cases have had mixed success at keeping out Chinese exports for more than a few years
But in each and every case the US consumer has paid higher prices as a result of the dumping orders Honey from China has clearly been kept out Chinarsquos share of US honey imports was around 30 when the AD case was initiated in 2000 and today that market share is near zero Instead the US imports honey from India a higher-cost supplier This is called trade diversion good for the honey industry in India and the United States but costly for US consumers
Figure 1 Chinarsquos Trade Balance with the US in Horticulture
Millions of Current US$
400
350
300
250
200
150
100
50
0
Source Compiled from UN COMTRADE data2001
Conclusion After more than a decade following
2002
WTO accession the value of Chinarsquos agricultural trade has increased drashy
2003
matically and China has turned into a net importer of agricultural products and now ranks as the number one
2004
foreign market for US agriculture 2005
Although considerable resource shifts have taken place from land-intensive towards labor-intensive agricultural products in both production and trade this transfer remains well below the potential This is partly due to trade barriers facing Chinarsquos exports of labor-intensive agricultural products
Food animal and plant safety are rightfully a concern of importshying countries but have unfortunately been used like AD for protectionist purposes There is considerable intershyest in the impacts of Chinarsquos rising income growth a growing middle class and urbanization and the associshyated changes in dietary patterns and food imports These variables will only fully come into play if Chinarsquos trading partners are willing to recognize that international trade is a two-way street
2008
2007
2006
2011
2010
2009
Suggested Citation
Carter Colin A and Sandro Steinbach 2013 Chinarsquos Growing Role in Agricultural Trade ARE Update 17(1)9shy11 University of California Giannini Foundation of Agricultural Economics
Colin A Carter is a professor in the ARE department at UC Davis and the director of the Giannini Foundation of Agricultural Economics He can be reached by e-mail at cacarterucdavisedu Sandro Steinbach is a MS candidate in the ARE department at UC Davis who can be contacted at sandro primalucdavisedu
For additional information the authors recommend
httpdimsumsblogspotcom
wwwusccgovHearingshearingshychinarsquos-agricultural-policy-andshyus-access-chinarsquos-market
Department of Agricultural and Resource EconomicsshyUC Davis One Shields Avenue Davis CA 95616 GPBS
Agricultural and Resource Economics
UPDATE
Co-Editors
Richard Sexton Sofia Berto Villas-Boas
David Zilberman
Managing Editor and Desktop Publishershy
Julie McNamara
Published by the Giannini Foundation of Agricultural Economics
httpgianniniucopedu
ARE Update is published six times per year by the Giannini Foundation of Agricultural Economics University of California
Domestic subscriptions are available free of charge to interested parties To subscribe to ARE Update by mail contact
Julie McNamara Outreach Coordinator Giannini Foundation of Agricultural Economics Department of Agricultural and Resource Economics University of California One Shields Avenue Davis CA 95616 E-mail julieprimalucdavisedu Phone 530-752-5346
To receive notification when new issues of the ARE Update are available online submit an e-mail request to join our listserv to julieprimalucdavisedu
Articles published herein may be reprinted in their entirety with the authorrsquos or editorsrsquo permission Please credit the Giannini Foundation of Agricultural Economics University of California
ARE Update is available online at httpgianniniucopeduare-update
The University of California is an Equal OpportunityAffirmative Action employer
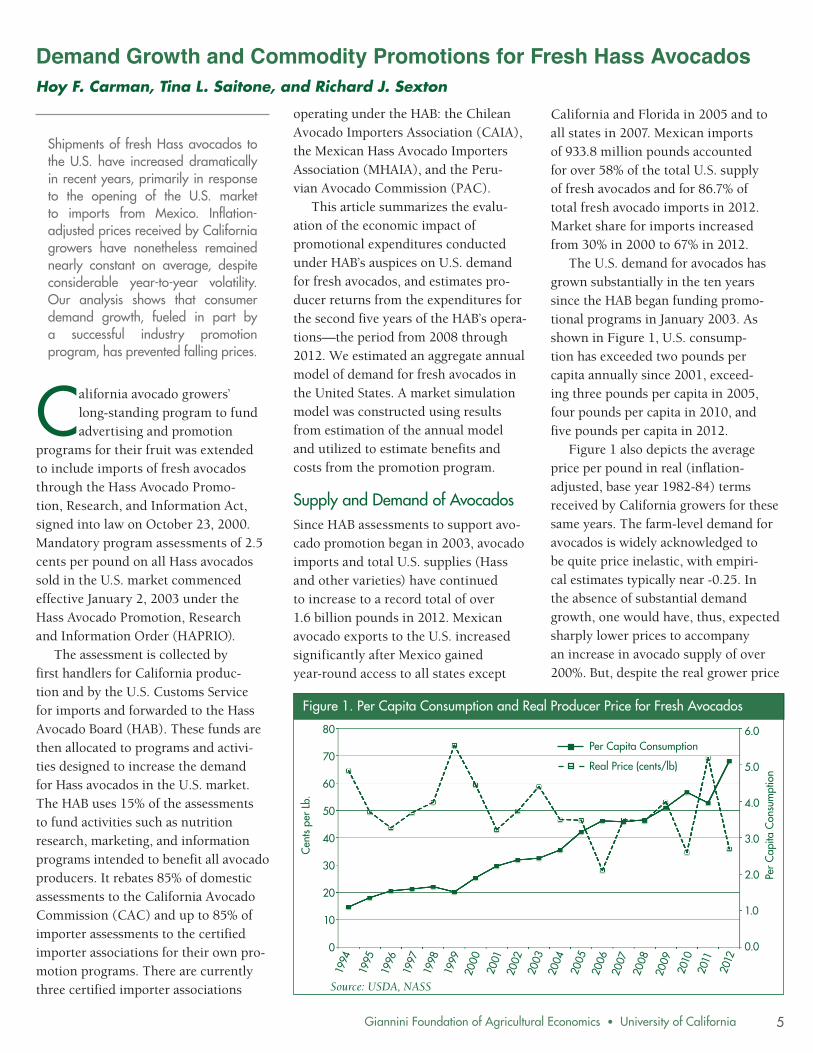
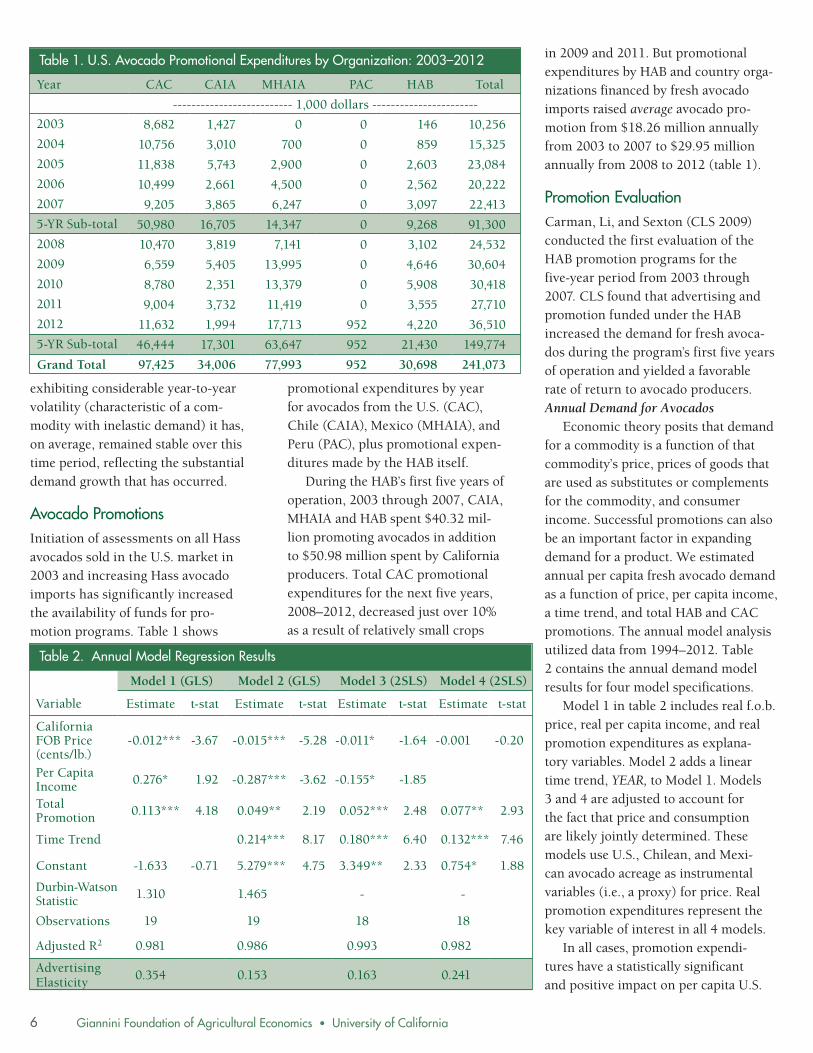
Giannini Foundation of Agricultural Economics bull University of California
risen to Prsquo t and sales have risen to Qrsquo t with the incremental assessment
Producer benefits from the hyposhythetical expansion of the promotion program are measured in terms of the change in producer surplus (PS) PS is the same as producer variable profits namely revenue (producer price x output) minus the variable production costs associated with producing and selling the output
We seek to measure the change in PS associated with the hypothetical expansion of the promotion program In figure 2 PS after the program expansion is PSrsquo = Prsquo t x Qrsquo tndash 0BQrsquo t but we must also account for the additional promoshytion expenditure which is represented geometrically by the rectangle Prsquot Prdquo t AB=(Prsquo tndash Prdquo t)Qrsquo t Thus the net increase in PS to producers from expansion of the promotion program is ΔPS = PSrsquo ndash (Prsquo t ndash Prdquo t) Qrsquo t which is represhysented by the shaded area in figure 2
Information required to estimate ΔPS consists of (i) an estimate of the marginal impact of promotional expenshyditures on demand (ii) an estimate of the slope or price elasticity isinD of the grower-level demand curve and (iii) an estimate of the slope or price elasticshyity isinS of grower supply of avocados to the US market The results of the econometric estimates reported in table 2 provide estimates of (i) and (ii)
We evaluated these considerations and specified three alternative values 05 10 and 20 as representing a plausible range of values for isinS Among the demand models included in table 2 we selected models 1 and 3 for use in the simulation Benefits and costs were estimated for each of the five years 2008ndash2012 under evaluation
The model was implemented by fitshyting the demand and supply functions to the actual values observed for the real grower price and per capita consumpshytion for each year of the review period St was then shifted vertically to Srsquo t by the half-cent incremental assessment for
each year and D was shifted horizon-t
tally to Drsquo t by the estimated promotion coefficient times the funds generated by the incremental assessment producing the equilibrium at point A in figure 2 and enabling us to compute the hyposhythetical changes in P and Q and the ΔPS
Total net producer benefits are reported for each model by compoundshying the annual benefits and costs over the five-year period to 2012 using a 3 real rate of interest The estimated benefit-cost ratios in this study range from 212 to 928 The lower bound is associated with model 3 which has a small coefficient for promotion relative to model 1 and the most elastic supply response isinS=20 The average annual increase in the grower price due to promotions for this simulation is 26 The upper bound of 928 is associshyated with demand model 1 which has a high coefficient for promotion and with the most inelastic supply response isinS=05 The average annual price increase for this simulation is 123
Space considerations preclude us from discussing results of the disagshygregate model estimated using scanner data Those results are available upon request from the authors and showed a statistically significant positive impact of promotions on weekly sales in those market areas receiving promotions through the HAB thus reinforcing the results from the annual model
Conclusion Fresh avocados have seen remarkshyable growth in consumption per capita in the US rising from about 15 pounds during the decade of the 1990s to over 5 pounds in 2012 This rapid increase in imports to the US and commensurate consumption has been achieved while keeping real grower prices relatively constant on average over this time period Such an outcome is only possible with substantial growth in fresh avocado demand in the US over this time
The econometric analysis of annual fresh avocado demand conducted in this study provides strong statistical evishydence of this demand growth and support for the proposition that promoshytion expenditures have been an important causal factor Benefit-cost analysis conducted based upon these econometric estimates yielded estimated average and marginal benefit-cost ratios in the range of 212 to 928 We conshyclude with considerable confidence that the promotion programs conducted unshyder the HABrsquos auspices have been successful in both expanding demand for fresh avocados in the US and yieldshying a very favorable return to those funding the program
Suggested Citation
Carman HF TL Saitone and R J Sexton 2013 Demand Growth and Commodity Promotions for Fresh Hass Avocados ARE Update 17(1)5shy8 University of California Giannini Foundation of Agricultural Economics
Hoy F Carman (carmanprimalucdavisedu) is a professor emeritus Tina L Saitone (saitone primalucdavisedu) is a project economist and Richard J Sexton (richprimalucdavisedu) is a professor and chair all in the ARE department at UC Davis
For additional information the authors recommend
Carman HF L Li and RJ Sexton (2009) ldquoAn Economic Evaluation of the Hass Avocado Promotion Orderrsquos First Five Yearsrdquo University of California Giannini Foundation of Agricultural Economics Giannini Foundation Research Report 351
Carman HF L Li and RJ Sexton ldquoCan Improved Market Information Benefit Both Producers and Consumers Evidence from the Hass Avocado Boardrsquos Internet Information Programrdquo ARE Update 13(4) 2010
Li Lan HF Carman and R J Sexton ldquoRetailer Pricing Practices for Fresh Avocadosrdquo ARE Update 10(1) 2006
8
9 Giannini Foundation of Agricultural Economics bull University of California
Chinarsquos Growing Role in Agricultural Trade Colin A Carter and Sandro Steinbach
This article discusses developments in Chinarsquos agricultural trade and implications for the United States We highlight areas in which China has become a major exporter of agricultural products the global importance of these exports and factors that underlie the export trends In addition we reference market access issues faced by Chinarsquos agricultural exports
China produces over 20 of the worldrsquos cereal grains 25 of the worldrsquos meat and 50 of the
worldrsquos vegetables China is the worldrsquos largest agricultural economy and it ranks as the top global producer of pork wheat rice tea cotton tomatoes potatoes eggs wool apples walnuts and fish etc In fact the annual value of Chinarsquos agricultural output is about two and one-half times the US total
After joining the World Trade Organization (WTO) in 2001 China increased its trade dependence on agrishyculture As of 2011 it was the fourth largest exporter and second largest importer of agricultural products in the world according to WTO trade statistics Its import growth has been driven by a shift in its domestic producshytion mix and changing consumer diets with rising incomes and urbanization Chinarsquos substantial increase in fruit and vegetable production is a major factor behind it agricultural export growth
In agriculture Chinarsquos major policy objectives are focused on increasing
grain production and starting the transition to larger-scale farms China has a relatively low set of agricultural import tariffs compared to other WTO members and domestic support to agriculture in China remains less than that for many developed countries
Changing Trade Structure With imports growing faster than exports during the post-WTO accesshysion years China reversed its longshytime status as a net agricultural exporter to that of a net importing country since 2004 Most of Chinarsquos increased imports came from soyshybeans and cotton Today cotton and soybeans account for over 40 of Chinarsquos agricultural imports a very concentrated portfolio China is the worldrsquos largest importer of soybeans and cotton accounting for over 60 of global soybean imports and approxishymately 40 of cotton imports
It was expected that Chinarsquos producshytion and trade of agricultural products would be significantly affected by WTO entry and this has turned out to be the case Chinarsquos agricultural exports have increased by more than 12 annushyally Import growth has averaged 19 per annum while total agricultural trade has grown by more than 16 per annum from 2002 to 2011 These are truly impressive annual growth rates
The changing structure of Chinarsquos agricultural exports has been domishynated by very strong growth in exports of horticultural products (eg garlic
apples pears and citrus) semi-processed food products (eg animal products pet food) and aquaculture (eg fish fillets) Table 1 shows the annual growth in exports for various agricultural categories from 2001shy2011 From top to bottom the annual growth rate was 18 for horticulshytural exports 14 for semi-processed foods 13 for aquaculture 12 for processed (eg apple juice proshycessed tomatoes) and less than 2 for bulk items such as tea or tobacco
Regarding accomplishments in world markets Chinarsquos exports of aquashyculture products have grown from 8 of the world market in 2001 to 14 of the market in 2011mdasha remarkable achievement China is very successshyful at exporting frozen fish fillets of various types including salmon There is a large fish processing industry in China that imports whole salmon and other fish from the US Russia and elsewhere and then in turn reshyexports fish fillets Another category that is also a strong export performer is horticultural products rising from 25 to 56 of world exports more than doubling its market share
Chinarsquos trade patterns have been affected by concerns over food safety with some food products For instance the melamine-spiked milk scandal of 2008 has led to a surge in Chinarsquos imports of milk powdermdashChinarsquos skim milk powder imports were up about 50 just in the past year contributing to higher milk powder prices in world
Table 1 Annual Growth Rates of Chinarsquos Agricultural Exports Since WTO Accession
Aquaculture Bulk Processed Horticulture Semi-Processed
2001ndash2011 Annual Growth Rate in Value of Exports
133 17 122 180 145
Source Compiled from UN COMTRADE data
Giannini Foundation of Agricultural Economics bull University of California
Table 2 Export and Import Trade Growth Rate of Chinarsquos Labor-Intensive
Agricultural Products 2001ndash2011
Aquaculture Livestock Horticulture
Exports 133 77 180
Imports 135 158 210
Source Compiled from UN COMTRADE data
markets China is responding to the food safety issue and has reorganized its food safety regulatory system modshyeled on the FDA in the United States
Chinarsquos agricultural trade is more and more in line with its comparashytive advantage and it has noticeably increased imports of land-intensive agricultural products But what about its trade in labor-intensive products Although exports of labor-intensive agricultural products did increase quite fast after WTO accession (espeshycially for fruits and vegetables) the rate of increase for these years was lower than imports of land-intensive agricultural products For instance the annual export growth rate for labor-intensive fruits and vegetables was 22 and 167 respectively At the same time imports of land-intensive soybeans and cotton grew by 25 and 357 respectively
Surprisingly the import growth of labor-intensive agricultural prodshyucts was also quite highmdashin fact greater than the export growth rate of these products for the same period Aquacultural exports grew by 133 slightly less than its import growth
of 135 Horticultural exports grew by an impressive 18 per annum but horticultural imports grew even faster at 21 per annum (Table 2)
So what do all these numbers sugshygest regarding Chinarsquos trade First land-intensive imports are growing faster than labor-intensive exports Second for labor-intensive products imports are actually growing faster than exports There are three likely facshytors behind these trends First there is growing domestic demand for high-valued agricultural products including labor-intensive imports increasing with income and urbanization Second Chinarsquos agricultural labor is shifting away from agriculture to the higher paying manufacturing and service secshytors Third Chinarsquos labor-intensive agricultural exports face headwinds in world markets due to trade barrishyers and perceptions of poor quality
China-US Agricultural Trade The United States enjoys an agriculshytural trade surplus with China which exceeded $20 billion in 2012 This is partly a result of reduced import trade barriers in China and growing
Table 3 Major USndashChina Agricultural Products Traded Bilaterally in 2012
US Exports to China US Imports from China
Item Value (Mil) Item Value (Mil)
Soybeans $15374
Cotton $3686
Corn $1658
Hides and Skins $1219
Frozen Swine Offal $744
Apple Juice $561
Dog and Cat Food $467
Frozen Tilapia Fillets $444
Canned Citrus $233
Frozen Salmon Fillets $216
Source USDA FAS GAIN Report 2252013 based on China Customs Data
incomes and urbanization China is the most important market for US agricultural exports (accounting for 172 of US agricultural exports in 2012) and the third most important supplier of US agricultural imports (with a market share equal to 42 of US agricultural imports in 2012)
Table 3 shows that based on the value of trade the top five US agrishycultural exports to China (in order of importance) are soybeans cotton corn hidesskins and swine offal On the other hand the top five US imports from China are apple juice dog and cat food frozen tilapia fillets canned citrus and frozen salmon fillets It is notable that the sum total of Chinarsquos agricultural exports to the United States represents only two-thirds of the value of just one single item that the United States sells to Chinamdashsoybeans
China is an emerging competishytor for US farmers in some specialty crops and China has a positive trade balance with the United States on horticultural crops although the total dollar value is a relatively small share of total agricultural trade Figure 1 shows China had a trade surplus of $40 million in horticultural products with the United States in 2011 down from $157 million in Chinarsquos favor in 2007 The 2011 $40 million surplus is only 1 of the value of agricultural trade between the United States and China Chinarsquos growing demand for almonds pistachios and walnuts is a positive development for US agrishyculture And per capita consumption of these specialty crops is still very low in China For instance per capita consumption of almonds in China is only about 5 of the US figure
US food products enjoy a certain advantage in China and there are growshying opportunities for US products considered to be high quality Howshyever price remains an obstacle for US products in the China market Chinese consumers spend about 20
10
11 Giannini Foundation of Agricultural Economics bull University of California
Exports Imports Trade Balance
of their disposable income on food consumed at home compared to less than 7 of income spent on at-home food in the US on average
Impediments to Chinarsquos Exports Impediments to foreign market access are an issue for Chinese agribusiness firms For instance Chinarsquos agriculshytural exports of horticultural products have been adversely affected by anti-dumping (AD) investigations against them launched by firms in both developing and developed countries Globally there have been about 23 AD cases against Chinarsquos agriculture since that market opened up in the early 1980s and many of the AD actions in agriculture have targeted horticulshytural productsmdashresulting in very high tariff rates against Chinese exports
Most anti-dumping cases are nothshying more than hidden protectionism Under US AD law China is treated as a ldquonon-market economyrdquo and as a result its exporters have been assessed tariffs higher than typical AD rates applied to so-called market economies US AD cases against Chinarsquos exports have targeted imports of fresh garlic preserved mushrooms apple juice concentrate shrimp and crawfish tail meat With the exceptions of honey and shrimp these cases have had mixed success at keeping out Chinese exports for more than a few years
But in each and every case the US consumer has paid higher prices as a result of the dumping orders Honey from China has clearly been kept out Chinarsquos share of US honey imports was around 30 when the AD case was initiated in 2000 and today that market share is near zero Instead the US imports honey from India a higher-cost supplier This is called trade diversion good for the honey industry in India and the United States but costly for US consumers
Figure 1 Chinarsquos Trade Balance with the US in Horticulture
Millions of Current US$
400
350
300
250
200
150
100
50
0
Source Compiled from UN COMTRADE data2001
Conclusion After more than a decade following
2002
WTO accession the value of Chinarsquos agricultural trade has increased drashy
2003
matically and China has turned into a net importer of agricultural products and now ranks as the number one
2004
foreign market for US agriculture 2005
Although considerable resource shifts have taken place from land-intensive towards labor-intensive agricultural products in both production and trade this transfer remains well below the potential This is partly due to trade barriers facing Chinarsquos exports of labor-intensive agricultural products
Food animal and plant safety are rightfully a concern of importshying countries but have unfortunately been used like AD for protectionist purposes There is considerable intershyest in the impacts of Chinarsquos rising income growth a growing middle class and urbanization and the associshyated changes in dietary patterns and food imports These variables will only fully come into play if Chinarsquos trading partners are willing to recognize that international trade is a two-way street
2008
2007
2006
2011
2010
2009
Suggested Citation
Carter Colin A and Sandro Steinbach 2013 Chinarsquos Growing Role in Agricultural Trade ARE Update 17(1)9shy11 University of California Giannini Foundation of Agricultural Economics
Colin A Carter is a professor in the ARE department at UC Davis and the director of the Giannini Foundation of Agricultural Economics He can be reached by e-mail at cacarterucdavisedu Sandro Steinbach is a MS candidate in the ARE department at UC Davis who can be contacted at sandro primalucdavisedu
For additional information the authors recommend
httpdimsumsblogspotcom
wwwusccgovHearingshearingshychinarsquos-agricultural-policy-andshyus-access-chinarsquos-market
Department of Agricultural and Resource EconomicsshyUC Davis One Shields Avenue Davis CA 95616 GPBS
Agricultural and Resource Economics
UPDATE
Co-Editors
Richard Sexton Sofia Berto Villas-Boas
David Zilberman
Managing Editor and Desktop Publishershy
Julie McNamara
Published by the Giannini Foundation of Agricultural Economics
httpgianniniucopedu
ARE Update is published six times per year by the Giannini Foundation of Agricultural Economics University of California
Domestic subscriptions are available free of charge to interested parties To subscribe to ARE Update by mail contact
Julie McNamara Outreach Coordinator Giannini Foundation of Agricultural Economics Department of Agricultural and Resource Economics University of California One Shields Avenue Davis CA 95616 E-mail julieprimalucdavisedu Phone 530-752-5346
To receive notification when new issues of the ARE Update are available online submit an e-mail request to join our listserv to julieprimalucdavisedu
Articles published herein may be reprinted in their entirety with the authorrsquos or editorsrsquo permission Please credit the Giannini Foundation of Agricultural Economics University of California
ARE Update is available online at httpgianniniucopeduare-update
The University of California is an Equal OpportunityAffirmative Action employer
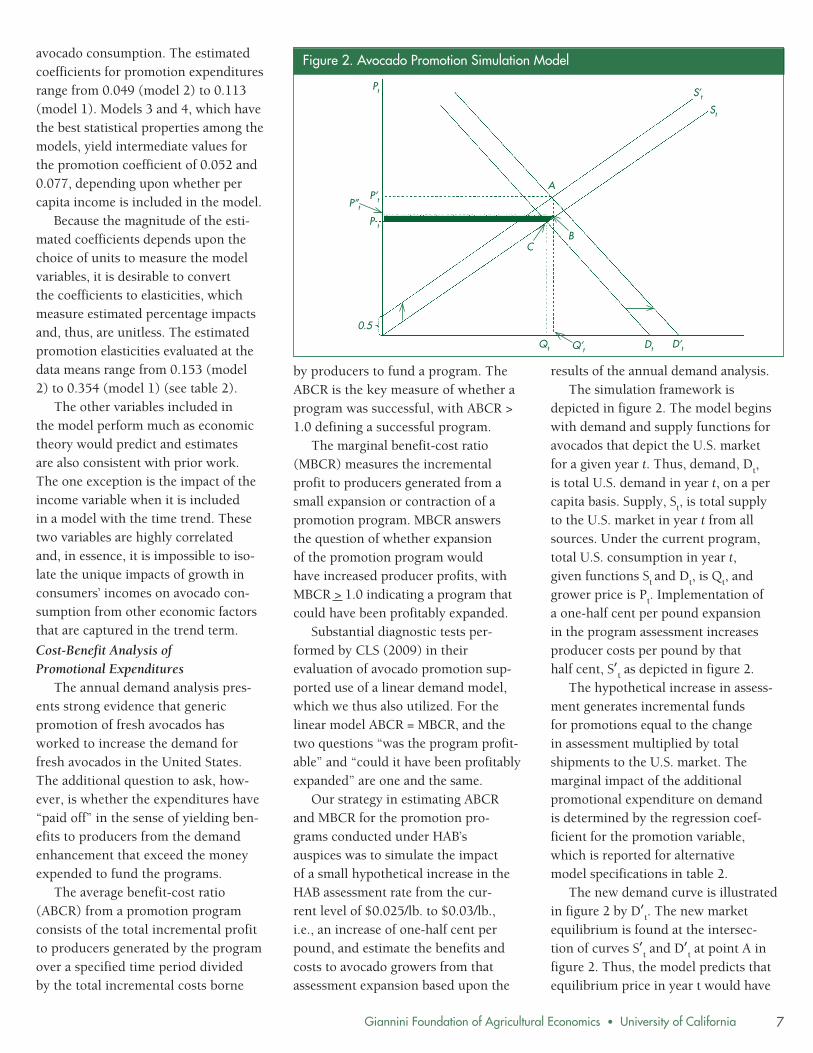
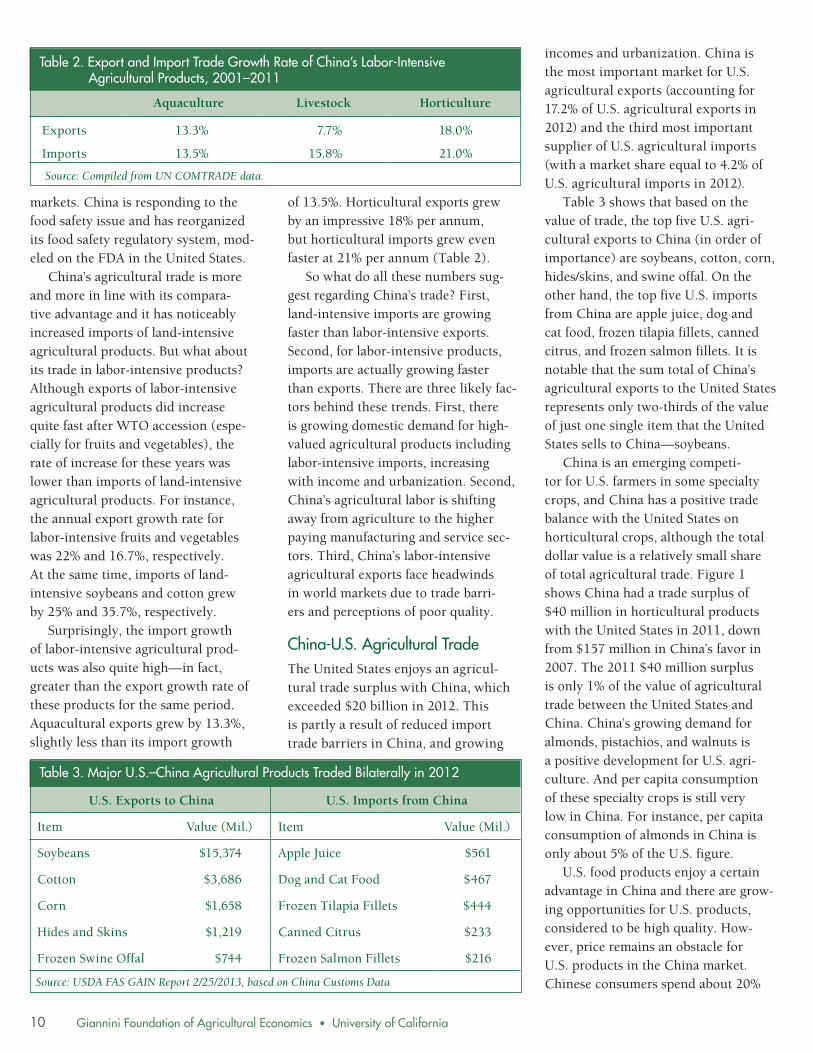
![The avocado genome informs deep angiosperm phylogeny ... · Hass cultivar [otherwise known as Mendez No. 1 (6, 9)], as well as wild avocados of the West Indian variety ( P. americana](https://img.pdfslide.net/doc/110x75/5e8aad8aaf1c8b11251ddb0b/the-avocado-genome-informs-deep-angiosperm-phylogeny-hass-cultivar-otherwise.jpg)