Embed Size (px)
Citation preview

1
Demand scenarios and innovation projects at Electricity North West
Dr Geraldine Bryson and Dr Rita Shaw

2
Agenda
Summary and questions
Introducing Electricity North West Future demand
Rising to the challenge with innovation

3
Introducing Electricity North West
4.9 million
25 terawatt hours
2.4 million
£12 billion of network assets
56 000 km of network 96 bulk supply substations 363 primary substations 33 000 transformers

4
Our heritage
Privatisation: Norweb plc
North West Water
takeover of Norweb: United Utilities
Norweb supply
business sold
Sale of United Utilities
Electricity to private
investors
1948 1990 1995 2000 2007 2010
£
Electricity national-isation:
North West Electricity
Board
Acquisition of UU Electricity
Services:

5
The GB energy market
But network businesses are the only ones with price regulation
Free Market
Generation Trading
Regulated
Transmission Distribution
Free Market
Retail
All large generators, suppliers and networks are regulated

6
Total to be spent on the
network 2015 - 2023
RIIO regulatory framework
£1.8 BILLION
£24.6 BILLION
£10
8%
Almost 800k
30%
Total to be spent on the network 2015 - 2023
Resulting annual average savings in consumer bills
The power distribution part of a dual fuel bill
The length of our power network
Network reliability increase since 2002
ED1 = Electricity Distribution
14 DNO areas Eight years
RIIO =
Revenue = Incentives + Innovation + Outputs

7
90% complaints resolved in
one day
Improve services for
vulnerable and priority service
register customers
Reduce carbon footprint by
10%
Site security investment
Maintain overall
network health Improve overall
reliability
Some of our output commitments in RIIO
Customer service Environment Social Safety Reliability

8
How big should our network be?
Big issues in the next year Future scenarios
Feeding into the business Understanding the past

9
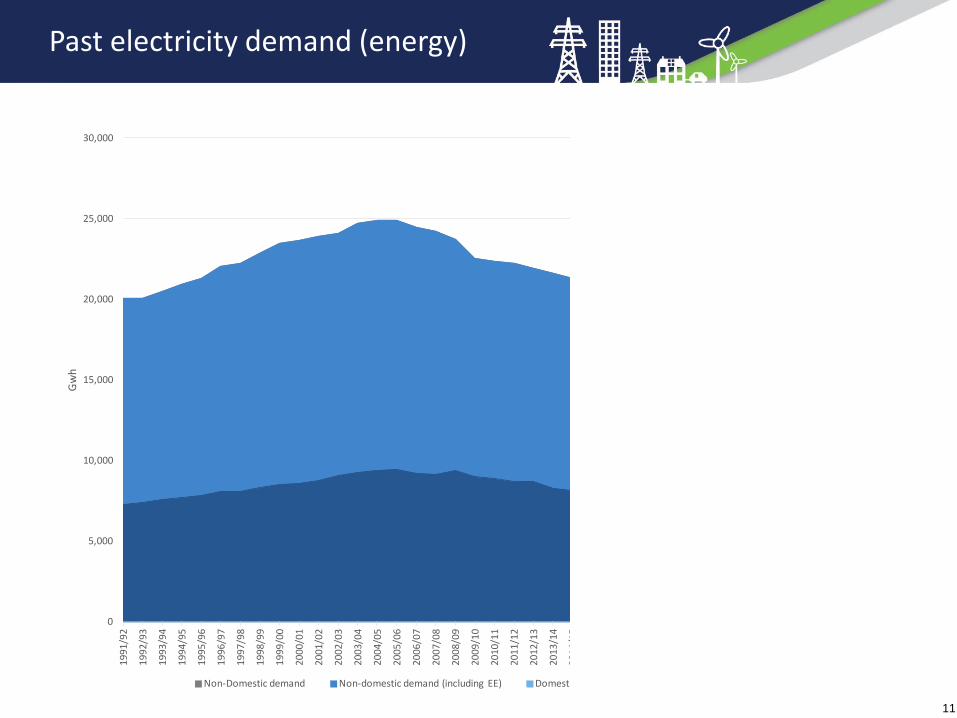
Understand past peak demand
GSP, BSP and primary substations
Metered load in each half hour Affected by weather and
generation Manually identify the ‘normal’
annual peak
The ‘Load Allocation’ system estimates load in each half hour
Rest of network = HV feeders, distribution subs, LV feeders

10
Outlook for future demand
Why could demand go up?
Why could demand fall?
11
Past electricity demand (energy)
0
5,000
10,000
15,000
20,000
25,000
30,00019
91/9
2
1992
/93
1993
/94
1994
/95
1995
/96
1996
/97
1997
/98
1998
/99
1999
/00
2000
/01
2001
/02
2002
/03
2003
/04
2004
/05
2005
/06
2006
/07
2007
/08
2008
/09
2009
/10
2010
/11
2011
/12
2012
/13
2013
/14
2014
/15
Gw
h
Non-Domestic demand Non-domestic demand (including EE) Domesti

12
... And 2015 central projection
0
5,000
10,000
15,000
20,000
25,000
30,00019
91/9
2
1992
/93
1993
/94
1994
/95
1995
/96
1996
/97
1997
/98
1998
/99
1999
/00
2000
/01
2001
/02
2002
/03
2003
/04
2004
/05
2005
/06
2006
/07
2007
/08
2008
/09
2009
/10
2010
/11
2011
/12
2012
/13
2013
/14
2014
/15
2015
/16
2016
/17
2017
/18
2018
/19
2019
/20
2020
/21
2021
/22
2022
/23
2023
/24
2024
/25
2025
/26
2026
/27
2027
/28
2028
/29
2029
/30
2030
/31
Gw
h
Non-Domestic demand Non-domestic demand (including EE) Domestic demand Domestic demand (including EE)
Projections

13
Scenarios for future peaks
Significant uncertainty,
so not just a single best-view
Plausible combination of:
Background trends – econometric and policy analysis
Incremental effect of electric vehicles and heat pumps

14
Electricity North West scenarios 2016
3,000
3,500
4,000
4,500
5,000
5,500
6,000
20
03
-04
20
04
-05
20
05
-06
20
06
-07
20
07
-08
20
08
-09
20
09
-10
20
10
-11
20
11
-12
20
12
-13
20
13
-14
20
14
-15
20
15
-16
20
16
-17
20
17
-18
20
18
-19
20
19
-20
20
20
-21
20
21
-22
20
22
-23
20
23
-24
20
24
-25
20
25
-26
20
26
-27
20
27
-28
20
28
-29
20
29
-30
20
30
-31
MV
A
Aggregate of weather-corrected annual BSP peak demandsHistory and scenarios
Measured demand (corrected for weather, but not DG)
True demand (corrected for weather and exporting DG)
Active Economy - 2016 scenario
Green Ambition - 2016 scenario
BEST VIEW - 2016 scenario
Focus on Efficiency - 2016 scenario
Annual update requirement – methodologies being updated
‘ATLAS’ project expanding beyond focus on peak demand

15
The need for our network
Views of future demand and generation affect our plans for network capacity
Allowed range of voltage around statutory limits
– demand, generation, reactive
Thermal ratings of equipment
– forward and reverse power flows
Fault-level ratings for network protection
Standards of security of supply including asset redundancy, automation, generation contribution and demand response
Many ways to meet customers’ capacity
needs

16
Ageing asset base
Age profile of assets
- 50.0
100.0 150.0 200.0 250.0 300.0 350.0 400.0 450.0
Curr
ent r
epla
cem
ent c
ost (
£m)
Estimated year of installation

17
The network operator ‘Trilemma’
Connecting low carbon generation and electrification of heat and transport
Why innovate – what's the problem?
Smart solutions are the key to unlocking this puzzle
Resilience of the network to keep the lights on
Network costs and solutions to fuel poverty and vulnerable customers
Smart Solutions
Reliability
Affordability Sustainability
18
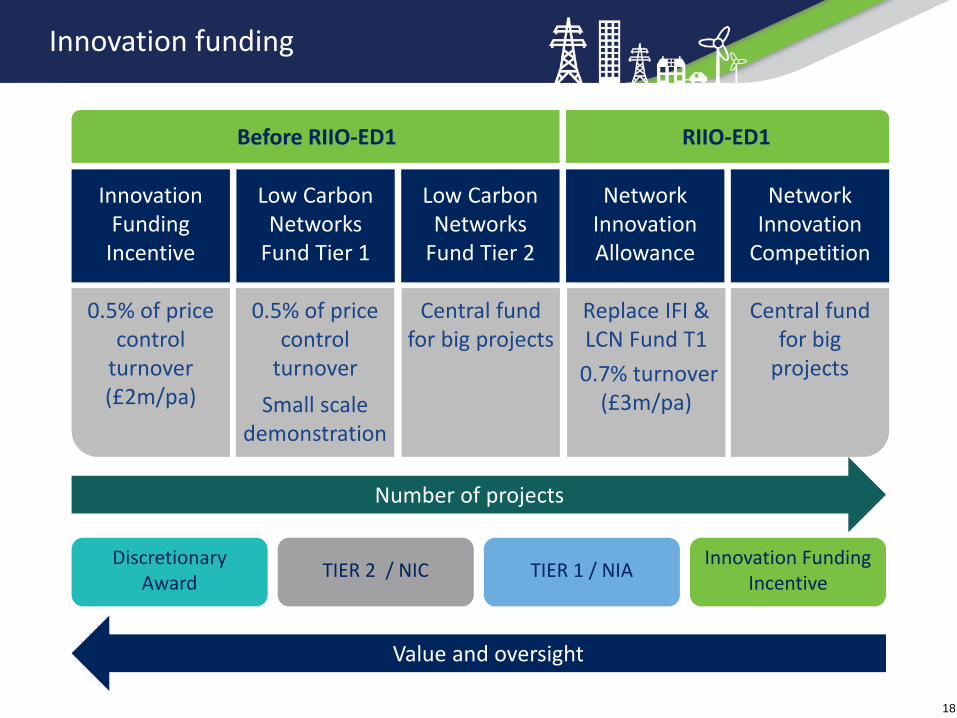
Innovation funding
Replace IFI & LCN Fund T1
0.7% turnover (£3m/pa)
Network Innovation Allowance
Low Carbon Networks
Fund Tier 1
0.5% of price control
turnover Small scale
demonstration
Innovation Funding
Incentive
0.5% of price control
turnover (£2m/pa)
Before RIIO-ED1 RIIO-ED1
Central fund for big
projects
Network Innovation
Competition
Low Carbon Networks
Fund Tier 2
Central fund for big projects
Discretionary Award TIER 2 / NIC TIER 1 / NIA Innovation Funding
Incentive
Number of projects
Value and oversight

19
Our innovation strategy
Delivering value to
customers
Maximise use of existing
assets
Innovative solutions
to real problems Proven
technology deployable
today
Generate value for
customers now
Offer new services and
choice for the future
‘Fit and forget’

20
Innovation track record
Five consecutive successful second tier
/ NIC bids £ Only DNO to spend all of our innovation allowance
Leading our industry to a low carbon future
Collaborative partnerships with SMEs, universities and National Grid
Stimulating supply chain development

21
Second Tier LCN Fund/NIC projects

22
Capacity to Customers
Capacity to Customers
Utilised capacity
New commercial contracts
Combines proven technology and new commercial contracts
Innovative demand side response contracts
Remote control equipment on HV circuit and close the NOP
Technical innovation
Latent capacity
Current demand
Effectively doubles the available capacity of the circuit
Enhanced network management software
Capacity to Customers unlocks latent capacity on the electricity network
Facilitates connection of new demand and generation without reinforcement
Allow us to control a customer’s consumption on a
circuit at the time of fault

23
Mitigates excessive voltages when generation is high and demand is low
Provides a demand reduction
capability to support system
balancing
Reduces demand at time of system peak
Customer Load Active System Services
System balancing support
Demand reduction
Voltage control
CLASS is seeking to demonstrate that electricity demand can be managed by controlling voltage…without any discernible impacts on customers

24
Smart Street
New controllable switching devices stabilise voltage
Low cost Quick fit Minimal disruption Low carbon Low loss Invisible to customers Faster connection of low carbon technologies
W C L W
Allows us to lower voltage levels
Enables networks and appliances to work in harmony

25
Respond
Respond is the first UK demonstration of an active fault level management solution that avoids traditional network reinforcement
REAL TIME ASSESSMENT TOOL
POTENTIAL FAULT CURRENT
RATING
World first in commercial fault
level management
services

26
Celsius
Retrofit thermal
monitoring Retrofit cooling
Problem
Under-used capacity
Thermal pinchpoints Reduced costs
Extra capacity
Reduced carbon
Thermal Ratings Tool
Celsius Solution
Increased demand
Understanding asset
temperature

27
First tier projects
Seven smaller scale projects – £6 million invested
Voltage management on low voltage busbars
The ‘Bidoyng’ smart fuse
Low voltage integrated automation
Low voltage protection and communications
Fault current active management
Combined online transformer monitoring
Low voltage network solutions

28
Network Innovation Allowance (NIA) projects
Leading or supporting £16 million of NIA projects so far
Combined on-line transformer monitoring
Demand scenarios / ATLAS
Distribution asset thermal modelling
Sentinel
VOLL
Smart Grid Forum work stream 7
Asset risk optimisation
Overhead line ratings
Avatar

29
Innovation to business as usual
Bidoyng smart fuse - single-shot auto-recloser
WEEZAP - world leading LV vacuum circuit breaker

30
Capacity to Customers and beyond
When is C2C cost effective ...?
... or when should we reinforce?
Working with University of Manchester to develop economic methodology

31
Example outputs (hypothetical case)
02468
1012141618
Num
ber o
f occ
urre
nces
Cost (£)
Strategy A Total NPC Weighted over All Scenarios
0
10
20
30
40
50
60
70
Num
ber o
f occ
urre
nces
Cost (£)
Strategy B Total NPC Weighted over All Scenarios
DSR is always cheaper, but with greater uncertainty in total cost (width of distribution)
Net present cost (x- axis is cost, y-axis is probability)
DSR
Rein
forc
emen
t

32
Want to know more?
Thank you for your time and attention
www.enwl.co.uk/innovation
0800 195 4141
@ElecNW_News
linkedin.com/company/electricity-north-west
facebook.com/ElectricityNorthWest
youtube.com/ElectricityNorthWest
e