Embed Size (px)
Citation preview
Demand Side Flexibility Annual Report 2017
02
1 Introduction – report outline and headlines from 2017 4
2 Power Responsive programme overview 6
3 Demand side flexibility achievements: provider insights and industry changes 9
3.1 Insights from market actors and flexibility providers 93.2 Policy, regulatory and industry-led developments 10
4 Metrics illustrating participation in demand side flexibility 124.1 Overall demand side flexibility participation 134.2 Balancing Services: April 2016 – March 2017 13 a. Short Term Operating Reserve 14 b. Fast Reserve 16 c. Demand Turn Up 17 d. Firm Frequency Response 18 e. Enhanced Frequency Response 194.3 Capacity Market 204.4 The Association for Decentralised Energy’s self-reporting survey 214.5 Self-dispatch activity and developing markets 24
5 Future development in demand side flexibility opportunities 26 Annex A: Power Responsive Steering Group members 27 Annex B: Glossary 28
Contents
03
Welcome to the 2017 Power Responsive Annual Report.
Since the publication of the 2016 Annual Report, we have seen an acceleration of activity by industry players, improved awareness among Industrial and Commercial (I&C) energy users and increased DSF participation in contracted markets. There have also been many significant policy, regulatory and industry-led developments.
For more information on Power Responsive, visit www.powerresponsive.com.
The 2017 Power Responsive Annual Report has been written on behalf of the Power Responsive Steering Group by the environmental charity Sustainability First, in collaboration with National Grid. It is designed for an informed audience of electricity market actors, policymakers, and demand side providers.
Demand side response (DSR) by flexible load shifting (e.g. heating/cooling systems, business operations and appliances).
DSR by onsite generation.
DSR by onsite energy storage.
Distributed generation – for export.
Distributed energy storage – for export.
National Grid uses the term demand side flexibility (DSF) to encompass five categories of flexible response:
The pace of change in the industry is an exciting challenge, and one that compels whole industry collaboration and markets that can be accessed by all technologies. As we transition to a low-carbon and digitised world, DSF has an increasingly important role. Electricity system needs are evolving on both a transmission and distribution level, and we need additional sources of flexibility to meet these needs – from an increasingly diverse range of technologies.
The 2017 Annual Report provides the opportunity to reflect on significant developments over the last 12 months – both within the Power Responsive programme and from wider initiatives – and to look ahead and signpost the milestones relevant to flexibility stakeholders.
Progress has been made across DSF – DSR distributed generation and energy storage. However, there are still barriers to accessing the full potential of these flexibility sources. In order to fully understand and assess the growth in participation, it is necessary to ascertain the extent to which parties are pursuing flexibility opportunities.
The 2017 Annual Report presents metrics for DSF participation in various markets, and considers the steps needed in the year ahead to unlock barriers and maximise future potential.
Power Responsive was launched in 2015 by National Grid, with the ambition of supporting the growth of demand side participation in GB electricity markets. Now in its third year, priorities for the programme include continued awareness-raising among I&C customers, building confidence in flexibility opportunities, and supporting the evolution of flexibility markets. With innovations in technology solutions, the programme is also exploring the opportunities for domestic DSR and flexibility from electric vehicles.
I would like to extend my warm thanks to those who have engaged with and contributed to the Power Responsive programme over recent years, and I look forward to our continued collaboration.
1
2
3
4
5
Demand Side Flexibility
Message from Cathy McClay (National Grid System Operator), Chair of the Power Responsive Steering Group
04
Introduction
The last 18 months have seen GB transition from the traditional electricity system of the past to operating as the system of the future. Although this presents challenges for system operation, it creates the environment for innovation and the opportunity to engage in different ways.
One such opportunity is to harness the potential of new sources of flexibility. DSF providers – I&C energy users, small-scale generation and electricity storage – are key in ensuring the market can continue to meet consumer expectations and deliver energy when needed. We are also starting to see a growing interest in domestic-level DSF, including smart charging of electric vehicles and two-way charging solutions (Vehicle to Grid).
Power Responsive was set up in 2015 as a collaborative programme, facilitated by National Grid, working with business customers and the wider industry to increase participation in various forms of DSF in GB’s electricity markets. The purpose of this Annual Report is to celebrate the success of the programme so far and set expectations for the future.
For more information, visit www.powerresponsive.com.
DSR is where levels of electricity demand are changed (increased, reduced or shifted) at a particular moment in time in response to an external signal (such as a change in price or a message). Customers can decide whether to react to these signals or override them.
National Grid uses the wider term DSF (DSF) to include five categories of flexible response: 1. DSR by flexible load shifting (e.g. heating/cooling systems, business
operations and appliances) 2. DSR by onsite generation 3. DSR by onsite energy storage 4. Distributed generation – for export 5. Distributed energy storage – for export
More information on definitions is available in Section 4.
In future, this is likely to expand into smaller-scale applications, such as domestic DSR and electric vehicle solutions.
Report outline The report is designed for an audience with some knowledge of DSF, with the purpose of reflecting on the progress and changes relevant to demand side providers, highlighting the remaining challenges and upcoming activity for 2018. The report also presents metrics for benchmarking demand side participation in flexibility services.
The content covers:• The Power Responsive programme – achievements over 2017 and engagement activity for the coming year (Section 2);
• Insights from market actors on the current state of play for DSF (Section 3.1) and highlights of recent policy, regulatory and industry-led initiatives supporting or impacting DSF (Section 3.2);• Metrics on demand side participation in explicit (Capacity Market and National Grid Balancing Services) and implicit (network charge avoidance) markets and opportunities, creating a benchmark against which to assess growth (Section 4); and• The future outlook on developments for DSF (Section 5).
1.0
05
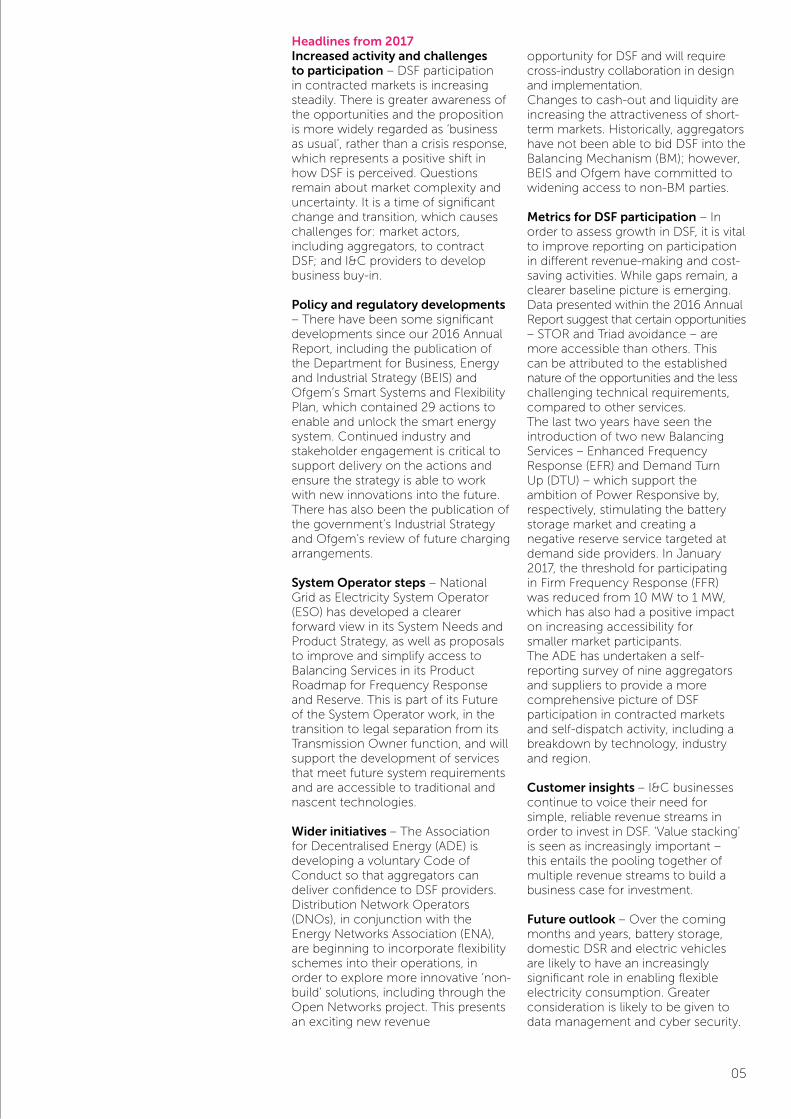
Headlines from 2017Increased activity and challenges to participation – DSF participation in contracted markets is increasing steadily. There is greater awareness of the opportunities and the proposition is more widely regarded as ‘business as usual’, rather than a crisis response, which represents a positive shift in how DSF is perceived. Questions remain about market complexity and uncertainty. It is a time of significant change and transition, which causes challenges for: market actors, including aggregators, to contract DSF; and I&C providers to develop business buy-in.
Policy and regulatory developments – There have been some significant developments since our 2016 Annual Report, including the publication of the Department for Business, Energy and Industrial Strategy (BEIS) and Ofgem’s Smart Systems and Flexibility Plan, which contained 29 actions to enable and unlock the smart energy system. Continued industry and stakeholder engagement is critical to support delivery on the actions and ensure the strategy is able to work with new innovations into the future. There has also been the publication of the government’s Industrial Strategy and Ofgem’s review of future charging arrangements.
System Operator steps – National Grid as Electricity System Operator (ESO) has developed a clearer forward view in its System Needs and Product Strategy, as well as proposals to improve and simplify access to Balancing Services in its Product Roadmap for Frequency Response and Reserve. This is part of its Future of the System Operator work, in the transition to legal separation from its Transmission Owner function, and will support the development of services that meet future system requirements and are accessible to traditional and nascent technologies.
Wider initiatives – The Association for Decentralised Energy (ADE) is developing a voluntary Code of Conduct so that aggregators can deliver confidence to DSF providers. Distribution Network Operators (DNOs), in conjunction with the Energy Networks Association (ENA), are beginning to incorporate flexibility schemes into their operations, in order to explore more innovative ‘non-build’ solutions, including through the Open Networks project. This presents an exciting new revenue
opportunity for DSF and will require cross-industry collaboration in design and implementation. Changes to cash-out and liquidity are increasing the attractiveness of short-term markets. Historically, aggregators have not been able to bid DSF into the Balancing Mechanism (BM); however, BEIS and Ofgem have committed to widening access to non-BM parties.
Metrics for DSF participation – In order to assess growth in DSF, it is vital to improve reporting on participation in different revenue-making and cost- saving activities. While gaps remain, a clearer baseline picture is emerging. Data presented within the 2016 Annual Report suggest that certain opportunities – STOR and Triad avoidance – are more accessible than others. This can be attributed to the established nature of the opportunities and the less challenging technical requirements, compared to other services.The last two years have seen the introduction of two new Balancing Services – Enhanced Frequency Response (EFR) and Demand Turn Up (DTU) – which support the ambition of Power Responsive by, respectively, stimulating the battery storage market and creating a negative reserve service targeted at demand side providers. In January 2017, the threshold for participating in Firm Frequency Response (FFR) was reduced from 10 MW to 1 MW, which has also had a positive impact on increasing accessibility for smaller market participants. The ADE has undertaken a self-reporting survey of nine aggregators and suppliers to provide a more comprehensive picture of DSF participation in contracted markets and self-dispatch activity, including a breakdown by technology, industry and region.
Customer insights – I&C businesses continue to voice their need for simple, reliable revenue streams in order to invest in DSF. ‘Value stacking’ is seen as increasingly important – this entails the pooling together of multiple revenue streams to build a business case for investment.
Future outlook – Over the coming months and years, battery storage, domestic DSR and electric vehicles are likely to have an increasingly significant role in enabling flexible electricity consumption. Greater consideration is likely to be given to data management and cyber security.
06
Power Responsive programme overview2.0
In Year 2 (June 2016–17) Power Responsive moved beyond initial awareness-raising with I&C energy users to focus on tangible deliverables that would improve markets and address barriers. The programme’s activities are underpinned by three fundamental objectives: raising awareness and stakeholder engagement; building confidence in flexibility opportunities; and supporting the evolution of flexibility markets.
While Power Responsive has historically focused activities on I&C energy users, attention is shifting to the potential of smaller-scale buildings and domestic-level DSR, including smart charging of electric vehicles and two-way charging solutions (Vehicle to Grid). We anticipate that this will become more prominent in the coming year and, as such, these opportunities will be incorporated into Power Responsive’s engagement activities.
Engagement channelsPower Responsive is overseen by a high-level Steering Group, meeting quarterly. Bringing together representatives of relevant DSF stakeholder groups, the Steering Group sets the strategic direction, objectives and priorities of the programme.
Two working groups ran throughout Year 2 of the programme: the DSR Provider Group and the Storage Working Group, which have been amalgamated to create a new Power Responsive Flexibility Forum, aiming to encourage industry collaboration across all DSF technologies. A metrics sub-group met over the summer to inform the 2017 Annual Report and DSF metrics.
This section provides an insight into the objectives of the Power Responsive programme, achievements during Year 2, priorities for Year 3, and a summary of engagement channels.

07
• Scottish business workshop to build confidence in the customer journey for DSF.
• Open forum working groups for DSF providers and electricity storage attracted 300 attendees.
• Over 2,000 individuals registered for the Power Responsive distribution list.
• DSF investor event, with discussions centred on the benefits of longer-term contracts that deliver certainty versus closer to real-time procurement for greater agility.
• Power Responsive 2016 Annual Report with baseline metrics on demand side participation.
• DSR Short Guide and joint training guide with Major Energy Users’ Council (MEUC) offered clear and simplified information on realising opportunities.
• Supported development of the ADE’s voluntary Code of Conduct for aggregators.
• Simplification of Balancing Services by the National Grid System Operator.
• System Operator developed new routes to market for energy balancing, including DTU and EFR.
• Informed BEIS and Ofgem’s Smart Systems and Flexibility Plan to help reduce barriers to DSF participation in GB electricity markets.
• Collaboration between the System Operator and DNOs to understand the commercial principles that facilitate innovative network management by future Distribution System Operators (DSOs).
• Executive discussion, highlighting strategic issues to be addressed through Power Responsive.
Achievements during Year 2 (June 2016–17)The table below summarises the achievements and activities from Year 2 across the programme’s three objectives.
Wider awareness- raising
Building confidence in flexibility opportunities
Future evolution of flexibility markets
Year 3 activities build on the achievements from the previous year of Power Responsive, with a focus on sector-specific engagement and potential flexibility from domestic assets.

08
• Continue raising awareness of opportunities and next steps for participation in demand side opportunities, with a focus on sector-specific engagement to target harder-to-reach customer segments.
• Continue to evolve the new Flexibility Forum, amalgamating the Storage and DSR Working Groups, and supporting whole industry collaboration.
• 2017 Power Responsive Annual Report to support improved information provision, including more detailed metrics on DSF participation.
• Supporting implementation of the ADE’s voluntary Code of Conduct.
• National Grid market information improvements, including website updates and improvements in historic balancing information.
• Align with Charging Futures Forum (CFF), considering reform of electricity network charging.
• Progress on actions outlined in BEIS and Ofgem’s Smart Systems and Flexibility Plan.
• Communication and engagement platform for National Grid’s Balancing Services Product Simplification process, including consultation on approach and proposals for market changes.
• Engagement platform for ENA work, including the paper on Commercial Principles for Contracted Flexibility, seeking to inform a whole system approach to optimising flexibility across transmission and distribution networks.
Awareness and engagement
Activities for Year 3 (June 2017–18)The table below summarises the upcoming activities and actions from the Power Responsive programme and wider initiatives.
Building confidence in flexibility opportunities
Future evolution of flexibility markets
09
It is widely recognised that DSF has an important role to play in enabling GB’s transition to a low-carbon economy. As we decarbonise and decentralise our generation sources, flexible energy use – through load shifting, the use of small-scale generation and storage – will help to ensure the market can continue to meet consumer expectations and deliver energy when needed.
The Power Responsive programme, and many market actors, are striving for a level playing field across technologies – traditional, emerging, large and small – to enable equal access to flexibility opportunities and facilitate a diverse range of technologies in the GB energy industry.
This section presents insights from flexibility providers on the current state of play for DSF and a consolidated view of the policy, regulatory and industry-led changes initiated to help achieve growth in DSF.
Demand side flexibility achievements: provider insights and industry changes3.0
3.1 Insights from market actors and flexibility providersThe Power Responsive Steering Group represents the broad range of interests in DSF (see Annex A). Members and other market actors have shared insights on the opportunities and remaining challenges facing demand side providers.
Customers are enlightened about flexibility opportunities and perceptions have shiftedFeedback suggests that the opportunity for DSF is now widely recognised, with broad understanding amongst I&C customers. This can be attributed to ongoing engagement activity across Power Responsive, aggregators, trade associations and other organisations representing customers and their interests.
Confidence is fundamental to investment, and simplicity is paramountThe overall picture remains complex for many, with a number of routes to market available, and some market participants facing challenges with uncertainty around payback. Many customers successfully participate in DSF schemes, either independently or through working with aggregators, suppliers or third parties. Nonetheless, it can be challenging for energy users
to secure broader business buy-in to DSF projects, meaning untapped potential remains.
I&C customers continue to strongly voice their need for simple, reliable revenue streams in order to invest in DSF. There is still some way to go to reconcile end users’ needs and the state of today’s demand side markets. However, new markets and services are emerging at both a transmission and distribution level, with a focus on simplicity and transparency for providers.
Clear guidance is needed in light of the inherent complexity of service stackingDuring this time of transition, the need to stack revenue streams and innovate with routes to market has become clear. Multiple network organisations are seeking to procure services from DSF, including the System Operator, DNOs or future DSOs, and energy suppliers. As a result, continued collaboration across transmission and distribution is necessary in order to deliver a coherent proposition for flexibility providers. Aggregators and other third parties also have a key role in supporting I&C customers to navigate complexities in the industry.
10
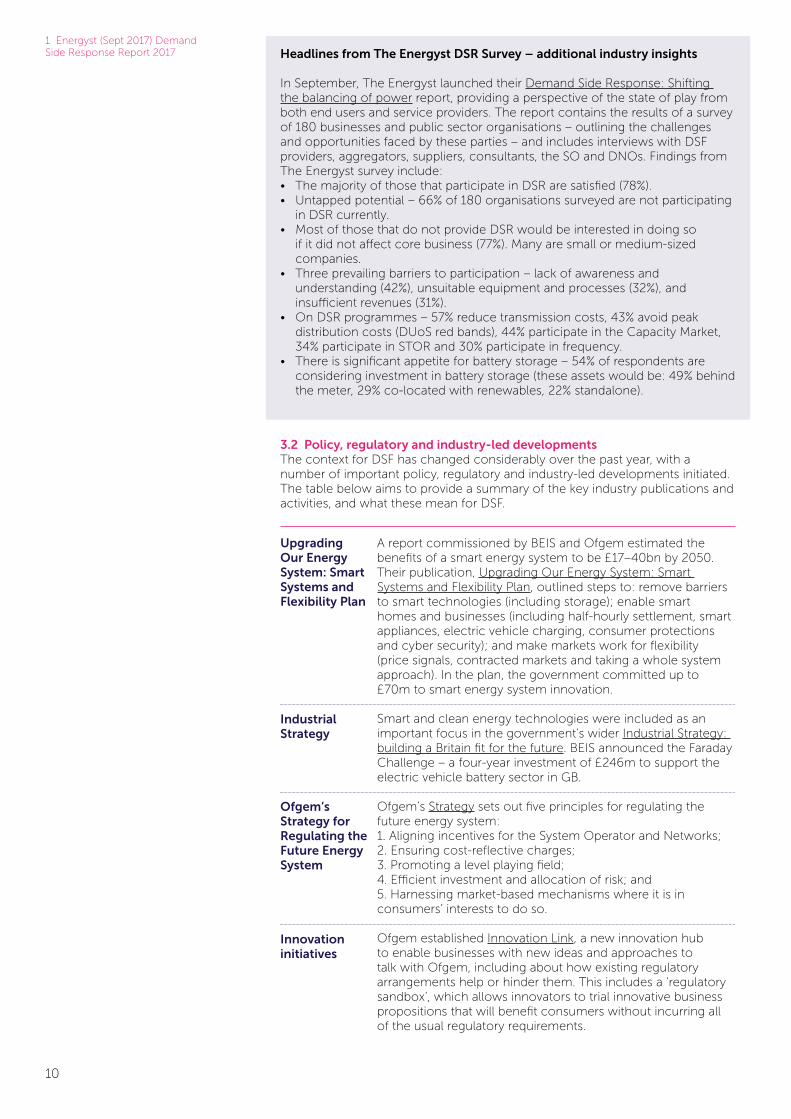
Headlines from The Energyst DSR Survey – additional industry insights
In September, The Energyst launched their Demand Side Response: Shifting the balancing of power report, providing a perspective of the state of play from both end users and service providers. The report contains the results of a survey of 180 businesses and public sector organisations – outlining the challenges and opportunities faced by these parties – and includes interviews with DSF providers, aggregators, suppliers, consultants, the SO and DNOs. Findings from The Energyst survey include:• The majority of those that participate in DSR are satisfied (78%).• Untapped potential – 66% of 180 organisations surveyed are not participating
in DSR currently. • Most of those that do not provide DSR would be interested in doing so
if it did not affect core business (77%). Many are small or medium-sized companies.
• Three prevailing barriers to participation – lack of awareness and understanding (42%), unsuitable equipment and processes (32%), and insufficient revenues (31%).
• On DSR programmes – 57% reduce transmission costs, 43% avoid peak distribution costs (DUoS red bands), 44% participate in the Capacity Market, 34% participate in STOR and 30% participate in frequency.
• There is significant appetite for battery storage – 54% of respondents are considering investment in battery storage (these assets would be: 49% behind the meter, 29% co-located with renewables, 22% standalone).
A report commissioned by BEIS and Ofgem estimated the benefits of a smart energy system to be £17–40bn by 2050. Their publication, Upgrading Our Energy System: Smart Systems and Flexibility Plan, outlined steps to: remove barriers to smart technologies (including storage); enable smart homes and businesses (including half-hourly settlement, smart appliances, electric vehicle charging, consumer protections and cyber security); and make markets work for flexibility (price signals, contracted markets and taking a whole system approach). In the plan, the government committed up to £70m to smart energy system innovation.
Smart and clean energy technologies were included as an important focus in the government’s wider Industrial Strategy: building a Britain fit for the future. BEIS announced the Faraday Challenge – a four-year investment of £246m to support the electric vehicle battery sector in GB.
Ofgem’s Strategy sets out five principles for regulating the future energy system: 1. Aligning incentives for the System Operator and Networks; 2. Ensuring cost-reflective charges; 3. Promoting a level playing field; 4. Efficient investment and allocation of risk; and 5. Harnessing market-based mechanisms where it is in consumers’ interests to do so.
Ofgem established Innovation Link, a new innovation hub to enable businesses with new ideas and approaches to talk with Ofgem, including about how existing regulatory arrangements help or hinder them. This includes a ‘regulatory sandbox’, which allows innovators to trial innovative business propositions that will benefit consumers without incurring all of the usual regulatory requirements.
Upgrading Our Energy System: Smart Systems and Flexibility Plan
Industrial Strategy
Ofgem’s Strategy for Regulating the Future Energy System
Innovation initiatives
1 Energyst (Sept 2017) Demand Side Response Report 2017
3.2 Policy, regulatory and industry-led developmentsThe context for DSF has changed considerably over the past year, with a number of important policy, regulatory and industry-led developments initiated. The table below aims to provide a summary of the key industry publications and activities, and what these mean for DSF.
11
Future role of SO
Capacity Market changes
Targeted Charging Review and update on residual charging arrangements
Electricity network access and forward-looking charges
Electricity Settlement Reform
Elexon Code modifications
ENA’s Open Networks project
Code of Conduct for demand side aggregators and suppliers
There is still some way to go to reconcile end users’ needs and the state of today’s demand side markets. However, new markets and services are emerging at both a transmission and distribution level, with a focus on simplicity and transparency for providers.
Following consultation, Ofgem released confirmation that National Grid will proceed with the separation of its ESO and Electricity Transmission Owner functions. From April 2019, the ESO will be a legally separate entity within the National Grid Group to support the new roles of the ESO – i.e. to facilitate industry transformation that works for all and to drive consumer benefits. As part of this, National Grid ESO has commenced its System Needs and Product Strategy work, including plans to simplify and standardise Balancing Services, improving guidance, transparency and competition.
BEIS consulted on improvements to the Capacity Market framework, including enabling the stacking of revenues. It proposed a de-rating of storage according to the duration it can generate at its full connection capacity before recharging (the aim being to reward storage capacity appropriately and reduce the risk of insufficient capacity).
Ofgem’s Targeted Charging Review (TCR) and Significant Code Review (SCR) are considering the reform of residual network charges for transmission and distribution for both generation and demand, ensuring that charging methodologies meet the interests of consumers both now and in the future. This includes the set up of a new CFF.
In their Reform of electricity network access and forward-looking charges: a working paper, Ofgem considered options to define more explicitly the arrangements for access to the networks, and to improve the forward-looking elements of network charging – i.e. providing signals to users about how their behaviours can increase or reduce future costs to the network.
Ofgem’s Electricity Settlement Reform SCR set out the process and timetable for a potential move to market-wide, half-hourly settlement of domestic and smaller non-domestic consumers. Ofgem expects to make a decision regarding if, when and how to implement this change by the end of 2019.
There have been a number of recent code modifications with implications for DSF, including:• P344 – aligns the Balancing and Settlement Code with the European Balancing Project TERRE (Trans European Replacement Reserves Exchange) to enable the set up of a platform for reserve services for TSOs across Europe.• P355 – BM Lite – was proposed to allow smaller generators to offer energy to the System Operator for energy balancing, in competition with the larger BM units already in the market. This is now on hold, as provisions in P344 should enable all the functionality required.• P354 – considers the issue of spill and non-spill to ensure non-BM participants do not benefit or suffer from additional energy imbalance that derives from their accurate delivery of a service instruction.
The ENA’s Open Networks project will enable the UK and Ireland’s electricity networks to move from their traditional role of simply delivering electricity to one where they are a platform for new smart energy technologies – the ‘DNO to DSO transition’. This creates new revenue opportunities for DSF providers in specific areas of the network, driven by the locational requirements of DNOs.
The ADE has developed a voluntary industry-led Code of Conduct for aggregators and suppliers, which addresses five areas: sales and marketing; proposals and pre-contractual information; contract; technical due diligence and site visit; and complaints. The Code will be implemented in mid-2018.
12
Metrics illustrating participation in demand side flexibility4.0A major development for the 2017 Power Responsive Annual Report has been our more detailed work on metrics to build on those in last year’s report. For example, we can now offer a more detailed view of demand side participation in the Capacity Market and National Grid’s Balancing Services. Where possible, metrics are presented for tendered and accepted volume (MW) and utilised volume (MWh) on an individual service basis, broken down by technology type. Costs are included for availability (i.e. being on standby to provide a service) and utilisation (i.e. providing a service). We have included an overview of prices (lowest and highest) paid per unit for availability. Figures are provided for April 2016–March 2017, except for DTU, for which they cover the duration of British Summer Time 2017.
The ADE also undertook a self-reporting survey of aggregators and suppliers to offer a more comprehensive picture of DSF participation in different markets (reserve, frequency response, capacity, wholesale and network cost avoidance). This considered the assets delivering flexibility, the sectors participating and the regional spread of activity across GB.
Defining demand side flexibility – breakdown by technologyDSR is where electricity demand is changed (increased, reduced or shifted) at a particular moment in time in response to an external signal (such as a change in price or a message). National Grid uses the wider term ‘DSF’ to include five categories of flexible response: 1. DSR by load response – load shifting or temporary demand reduction or
increase (e.g. heating/cooling systems, business operations and appliances).2. DSR by distributed generation (onsite) – standby, back-up or other
distributed and dispatchable generation, including Combined Heat and Power (CHP) – with a primary purpose to support a source of local demand.
3. DSR by storage (onsite) – use of energy storage assets (either offsetting demand or exporting to the network) where the primary purpose of the asset is for the support of a local source of demand.
4. Distributed generation (for export) – distributed and dispatchable generation, including CHP – not aligned with a source of demand.
5. Storage (for export) – use of energy storage assets that only export to the network and that are not aligned to an associated source of demand.
Where possible, these categories have been used to classify the technology types participating in individual services. However, due to the format of raw data, other categorisations have been used, including BM and non-Balancing Mechanism (NBM). • BM – the BM is an additional tool for balancing the system, in relation to commercial Balancing Services. Through the BM, each power station makes a price bid by which to reduce or increase the power they offer. This BM category here represents larger players delivering services through this route. • NBM – the NBM refers to DSF providers or assets who do not – or currently cannot – participate in the BM, and includes the five categories above.
DSR Capacity Market Units (CMUs) can be classified as either Proven (if they have passed a DSR test prior to prequalification for the Capacity Market auction) or Unproven (if they have not yet passed a DSR test). Capacity Market reporting does not recognise ‘DSF’ as a category.
13
Some gaps remain in our data (including consistent technology categorisation across services). Nevertheless, a clearer baseline picture is beginning to emerge. We have included more detailed metrics this year than in the 2016 report, so it is not possible to make direct comparisons. But we intend to make year-on-year comparisons in the 2018 report. Going forward, steps to improve data gathering and reporting will be pursued by the National Grid System Operator.
National Grid has taken a lead on developing metrics through Power Responsive. However, there remains a wider question as to the metrics and indicators needed to assess DSF markets in the future, and which parties are best placed to do this. This includes how demand side markets might fit into Ofgem’s State of the Markets report, which offers a wider view of GB wholesale and retail markets.
4.1 Overall demand side flexibility participationDSF is becoming mainstream, particularly with increased storage participation in contracted markets and as the benefits of co-locating storage with other DSF solutions are realised. As a result of increased participation in certain services, such
as FFR, the liquidity of markets is increasing and this drives competition and delivers value for end consumers. From the perspective of service providers, it is important to consider how to access multiple revenue streams and routes to market in order to develop innovative businesses cases and funding approaches.
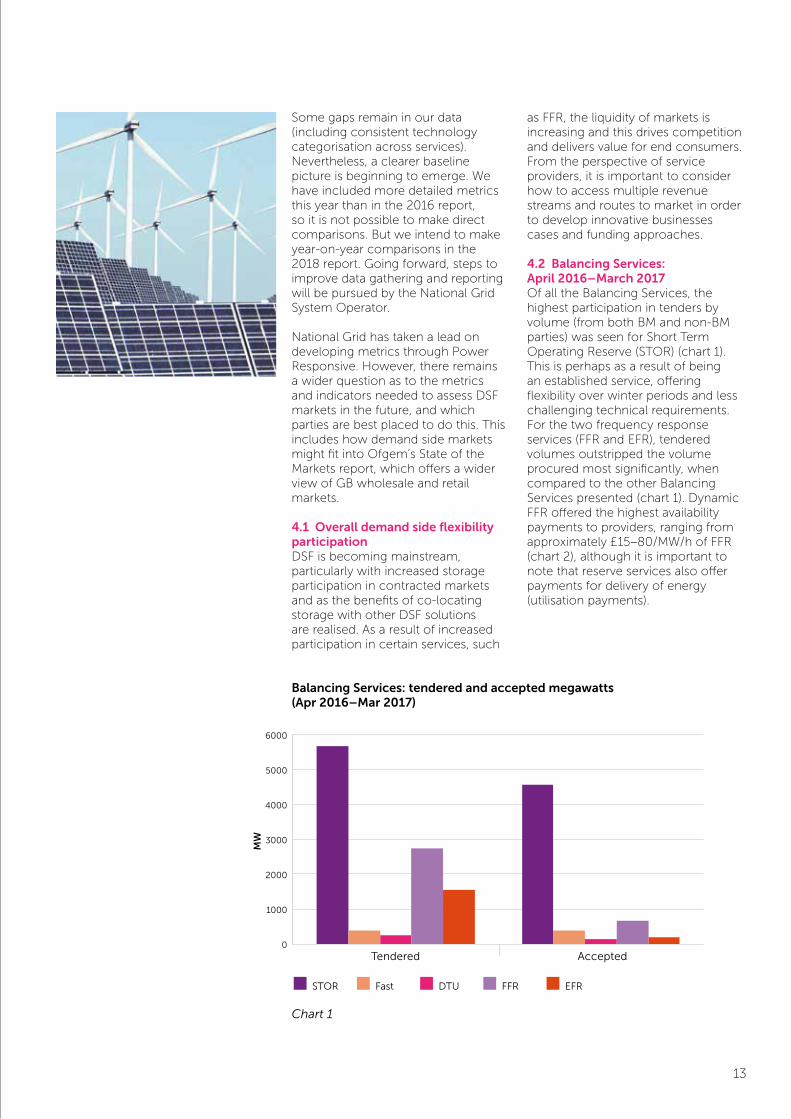
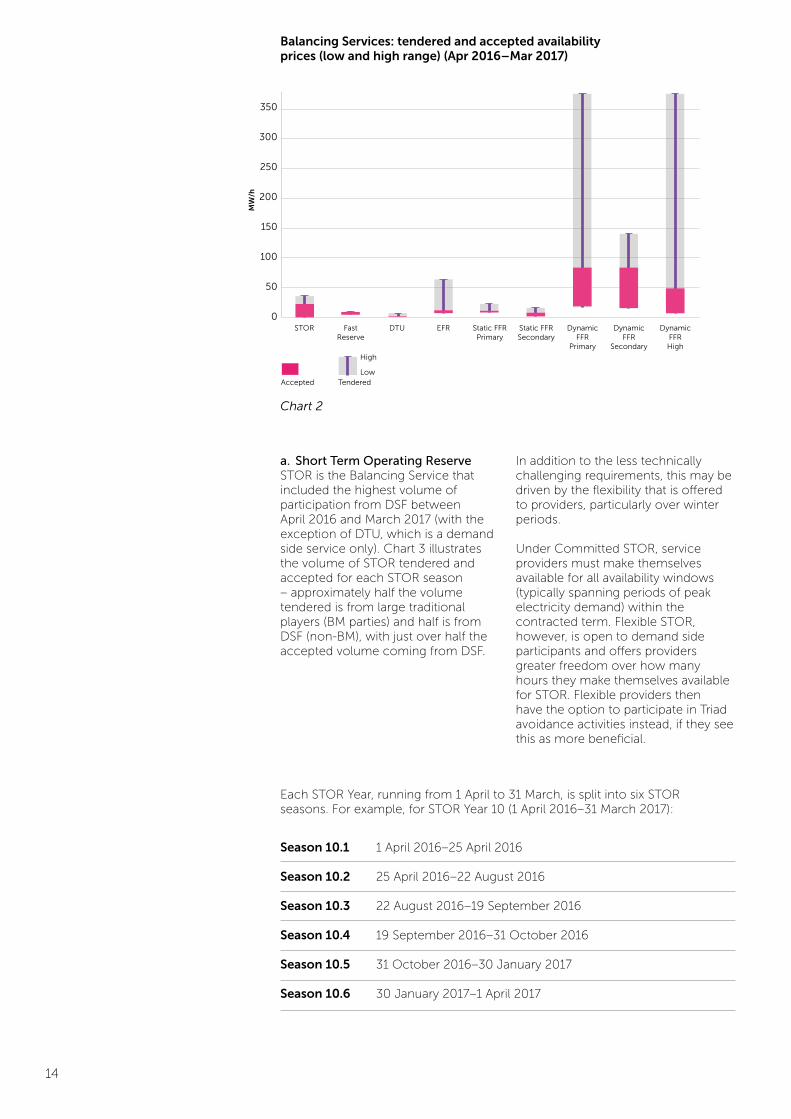
4.2 Balancing Services: April 2016–March 2017Of all the Balancing Services, the highest participation in tenders by volume (from both BM and non-BM parties) was seen for Short Term Operating Reserve (STOR) (chart 1). This is perhaps as a result of being an established service, offering flexibility over winter periods and less challenging technical requirements. For the two frequency response services (FFR and EFR), tendered volumes outstripped the volume procured most significantly, when compared to the other Balancing Services presented (chart 1). Dynamic FFR offered the highest availability payments to providers, ranging from approximately £15–80/MW/h of FFR (chart 2), although it is important to note that reserve services also offer payments for delivery of energy (utilisation payments).
6000
5000
4000
3000
2000
1000
0
Balancing Services: tendered & accepted megawatts (Apr 2016 - Mar 2017)
Tendered
STOR Fast DTU FFR EFR
Accepted
MW
Balancing Services: tendered and accepted megawatts (Apr 2016–Mar 2017)
Chart 1
14
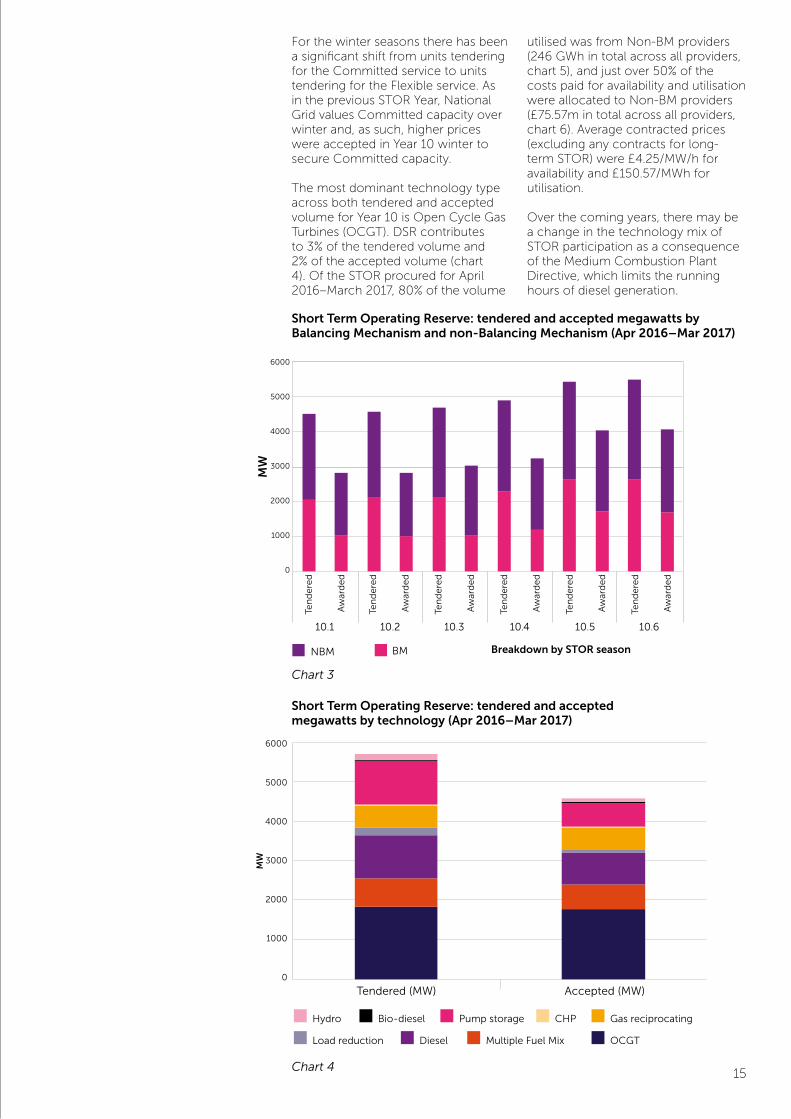
a. Short Term Operating Reserve STOR is the Balancing Service that included the highest volume of participation from DSF between April 2016 and March 2017 (with the exception of DTU, which is a demand side service only). Chart 3 illustrates the volume of STOR tendered and accepted for each STOR season – approximately half the volume tendered is from large traditional players (BM parties) and half is from DSF (non-BM), with just over half the accepted volume coming from DSF.
In addition to the less technically challenging requirements, this may be driven by the flexibility that is offered to providers, particularly over winter periods.
Under Committed STOR, service providers must make themselves available for all availability windows (typically spanning periods of peak electricity demand) within the contracted term. Flexible STOR, however, is open to demand side participants and offers providers greater freedom over how many hours they make themselves available for STOR. Flexible providers then have the option to participate in Triad avoidance activities instead, if they see this as more beneficial.
Season 10.1 1 April 2016–25 April 2016
Season 10.2 25 April 2016–22 August 2016
Season 10.3 22 August 2016–19 September 2016
Season 10.4 19 September 2016–31 October 2016
Season 10.5 31 October 2016–30 January 2017
Season 10.6 30 January 2017–1 April 2017
STOR FastReserve
DTU EFR Static FFRPrimary
Static FFRSecondary
Dynamic FFR
Primary
Dynamic FFR
Secondary
Dynamic FFRHigh
Balancing Services: tendered and accepted availability prices (low and high range) (Apr 2016 - Mar 2017)
Accepted Tendered
High
Low
350
300
250
200
150
100
50
0
MW
/h
Each STOR Year, running from 1 April to 31 March, is split into six STOR seasons. For example, for STOR Year 10 (1 April 2016–31 March 2017):
Balancing Services: tendered and accepted availability prices (low and high range) (Apr 2016–Mar 2017)
Chart 2
15
For the winter seasons there has been a significant shift from units tendering for the Committed service to units tendering for the Flexible service. As in the previous STOR Year, National Grid values Committed capacity over winter and, as such, higher prices were accepted in Year 10 winter to secure Committed capacity.
The most dominant technology type across both tendered and accepted volume for Year 10 is Open Cycle Gas Turbines (OCGT). DSR contributes to 3% of the tendered volume and 2% of the accepted volume (chart 4). Of the STOR procured for April 2016–March 2017, 80% of the volume
utilised was from Non-BM providers (246 GWh in total across all providers, chart 5), and just over 50% of the costs paid for availability and utilisation were allocated to Non-BM providers (£75.57m in total across all providers, chart 6). Average contracted prices (excluding any contracts for long-term STOR) were £4.25/MW/h for availability and £150.57/MWh for utilisation.
Over the coming years, there may be a change in the technology mix of STOR participation as a consequence of the Medium Combustion Plant Directive, which limits the running hours of diesel generation.
Ten
de
red
Aw
ard
ed
Ten
de
red
Aw
ard
ed
Ten
de
red
Aw
ard
ed
Ten
de
red
Aw
ard
ed
Ten
de
red
Aw
ard
ed
Ten
de
red
Aw
ard
ed
10.1 10.2 10.3 10.4 10.5 10.6
6000
5000
4000
3000
2000
1000
0
NBM BM
STOR: tendered & accepted megawatts by Balancing Mechanism and non-Balancing Mechanism (Apr 2016 - Mar 2017)
MW
Breakdown by STOR season
6000
5000
4000
3000
2000
1000
0
Tendered (MW) Accepted (MW)
STOR: tendered & accepted megawatts by technology (Apr 2016 - Mar 2017)
Hydro Bio-diesel Pump storage CHP Gas reciprocating
Load reduction Diesel Multiple Fuel Mix OCGT
MW
Short Term Operating Reserve: tendered and accepted megawatts by Balancing Mechanism and non-Balancing Mechanism (Apr 2016–Mar 2017)
Short Term Operating Reserve: tendered and accepted megawatts by technology (Apr 2016–Mar 2017)
Chart 3
Chart 4

16
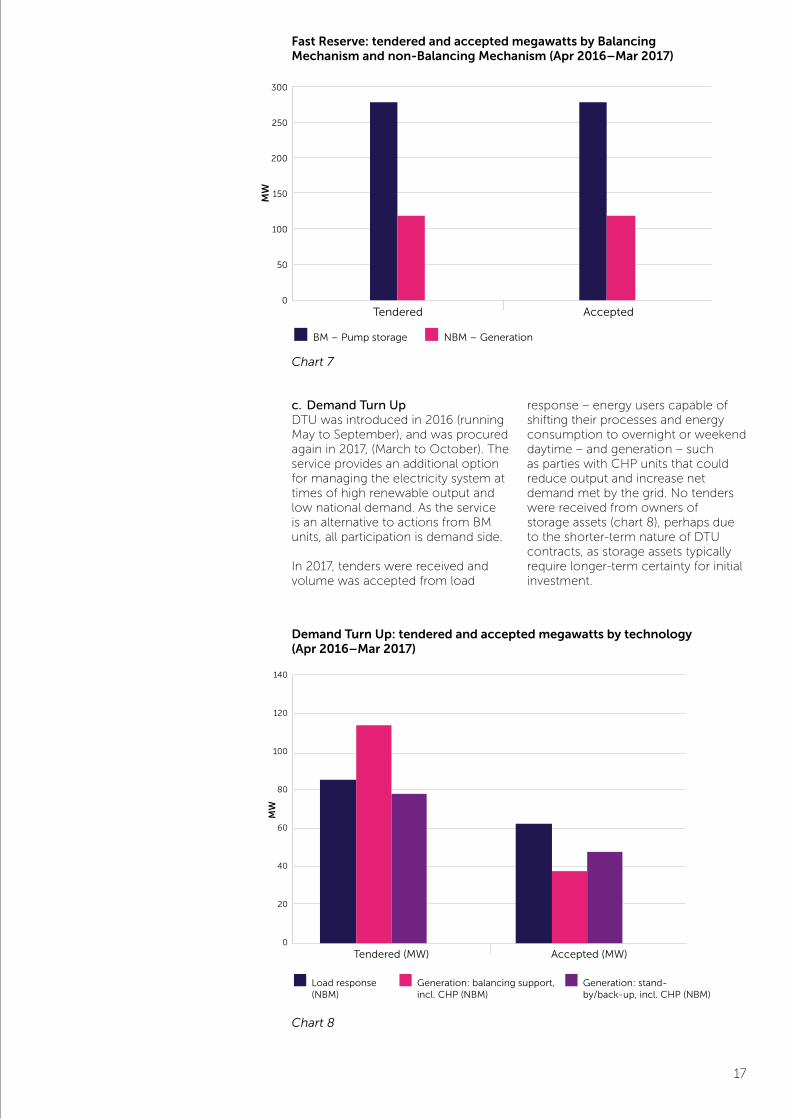
b. Fast ReserveThe level of DSF participating in Fast Reserve remains low. This is in part due to participants opting to pursue frequency response services and also because the entry threshold for the monthly tenders is 50 MW. Of the tender submissions received, 100% of the volume offered from both BM and non-BM units was accepted (chart 7). Non-BM participation is solely from gas reciprocating engines.
National Grid’s work on the Platform for Ancillary Services is creating a web-based system to aggregate the monitoring and dispatch of non-BM providers and assets. This system will be trialled first on Fast Reserve in summer 2018, and, if successful, it will be rolled out to STOR.
BM spend NBM spend
45
40
35
30
25
20
15
10
5
0
Utilisation (£)Availability (£)
STOR: Spend by Balancing Mechanism and non-Balancing Mechanism (Apr 2016 - Mar 2017)
£m
52,903
437
9,524
15,2883
13,445
17,182
Generation (Balancing Mechanism)
Load response (NBM)
CHP (NBM)
Generation: balancing support (NBM)
Generation: standby/back-up (NBM)
Energy storage: balancing support (NBM)
Energy storage: standby/back-up (NBM)
Other (NBM)
STOR: utilisation (MWh) by technology (Apr 2016 - Mar 2017)Short Term Operating Reserve: utilisation (MWh) by technology (Apr 2016–Mar 2017)
Short Term Operating Reserve: spend by Balancing Mechanism and non-Balancing Mechanism (Apr 2016–Mar 2017)
Chart 5
Chart 6
17
c. Demand Turn UpDTU was introduced in 2016 (running May to September), and was procured again in 2017, (March to October). The service provides an additional option for managing the electricity system at times of high renewable output and low national demand. As the service is an alternative to actions from BM units, all participation is demand side.
In 2017, tenders were received and volume was accepted from load
response – energy users capable of shifting their processes and energy consumption to overnight or weekend daytime – and generation – such as parties with CHP units that could reduce output and increase net demand met by the grid. No tenders were received from owners of storage assets (chart 8), perhaps due to the shorter-term nature of DTU contracts, as storage assets typically require longer-term certainty for initial investment.
300
250
200
150
100
50
0Tendered Accepted
Fast Reserve: tendered and accepted megawatts by Balancing Mechanism and non-Balancing Mechanism (Apr 2016 - Mar 2017)
BM – Pump storage NBM – Generation
MW
140
120
100
80
60
40
20
0
Tendered (MW) Accepted (MW)
Demand Turn Up: tendered & accepted megawatts by technology (Apr 2016 - Mar 2017)
Load response (NBM)
Generation: balancing support, incl. CHP (NBM)
Generation: stand-by/back-up, incl. CHP (NBM)
MW
Fast Reserve: tendered and accepted megawatts by Balancing Mechanism and non-Balancing Mechanism (Apr 2016–Mar 2017)
Demand Turn Up: tendered and accepted megawatts by technology (Apr 2016–Mar 2017)
Chart 7
Chart 8
18
2500
2000
1500
1000
500
0Tendered Accepted
Firm Frequency Response: tendered & accepted megawatts by Balancing Mechanism and non-Balancing Mechanism (Apr 2016 - Mar 2017)
BM NBM Dynamic Static
MW
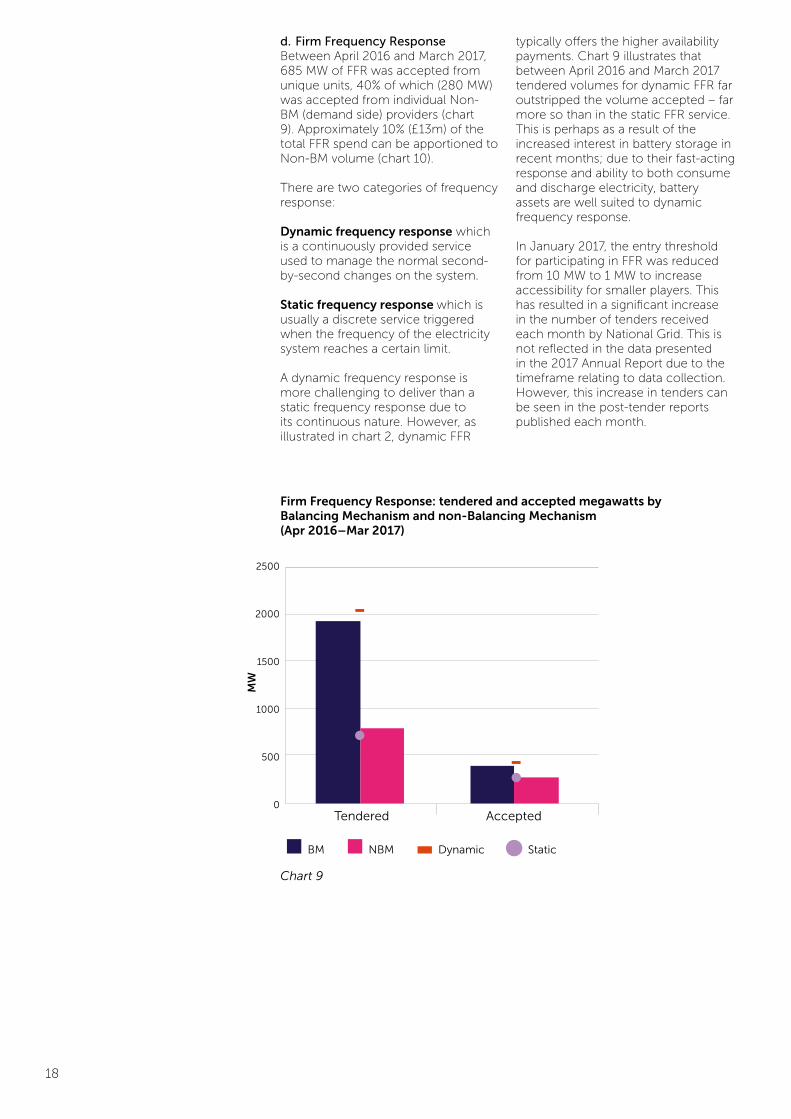
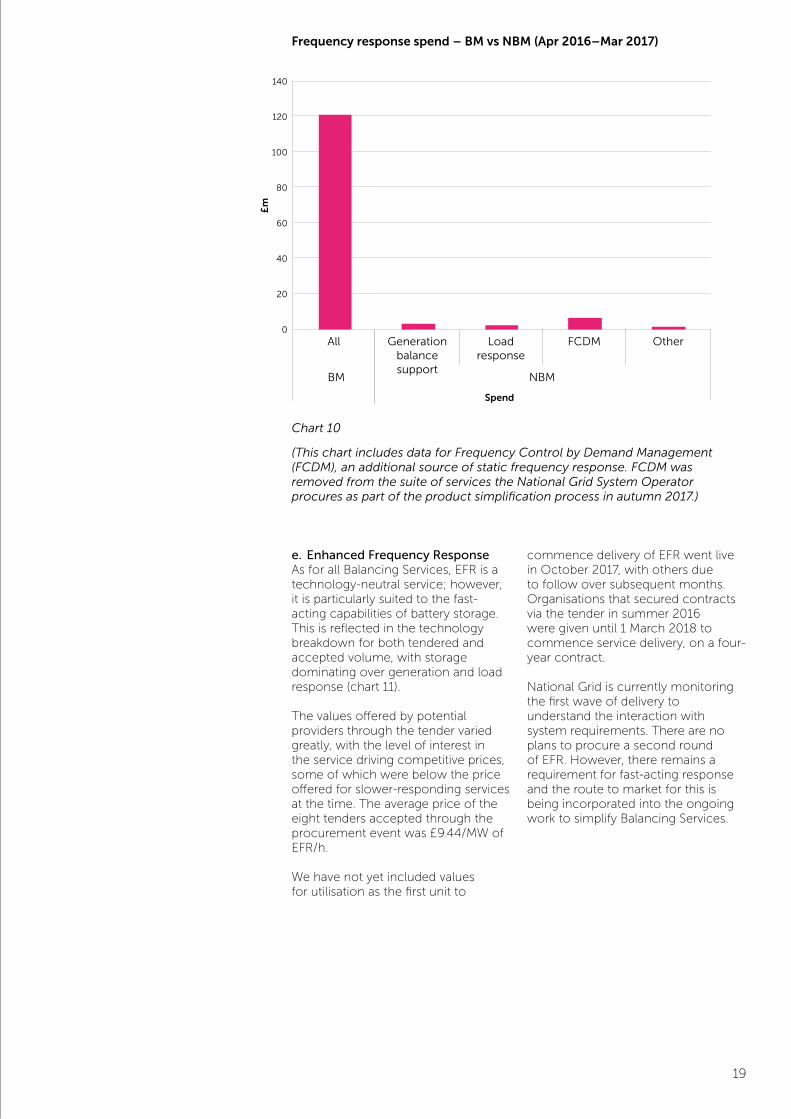
d. Firm Frequency ResponseBetween April 2016 and March 2017, 685 MW of FFR was accepted from unique units, 40% of which (280 MW) was accepted from individual Non-BM (demand side) providers (chart 9). Approximately 10% (£13m) of the total FFR spend can be apportioned to Non-BM volume (chart 10).
There are two categories of frequency response:
Dynamic frequency response which is a continuously provided service used to manage the normal second- by-second changes on the system.
Static frequency response which is usually a discrete service triggered when the frequency of the electricity system reaches a certain limit.
A dynamic frequency response is more challenging to deliver than a static frequency response due to its continuous nature. However, as illustrated in chart 2, dynamic FFR
typically offers the higher availability payments. Chart 9 illustrates that between April 2016 and March 2017 tendered volumes for dynamic FFR far outstripped the volume accepted – far more so than in the static FFR service. This is perhaps as a result of the increased interest in battery storage in recent months; due to their fast-acting response and ability to both consume and discharge electricity, battery assets are well suited to dynamic frequency response.
In January 2017, the entry threshold for participating in FFR was reduced from 10 MW to 1 MW to increase accessibility for smaller players. This has resulted in a significant increase in the number of tenders received each month by National Grid. This is not reflected in the data presented in the 2017 Annual Report due to the timeframe relating to data collection. However, this increase in tenders can be seen in the post-tender reports published each month.
Firm Frequency Response: tendered and accepted megawatts by Balancing Mechanism and non-Balancing Mechanism (Apr 2016–Mar 2017)
Chart 9
19
140
120
100
80
60
40
20
0
FFR Cost - BM v NBM (Apr 2016 - Mar 2017)
All Generationbalance support
Loadresponse
FCDM Other
NBMBM
Spend
£m
(This chart includes data for Frequency Control by Demand Management (FCDM), an additional source of static frequency response. FCDM was removed from the suite of services the National Grid System Operator procures as part of the product simplification process in autumn 2017.)
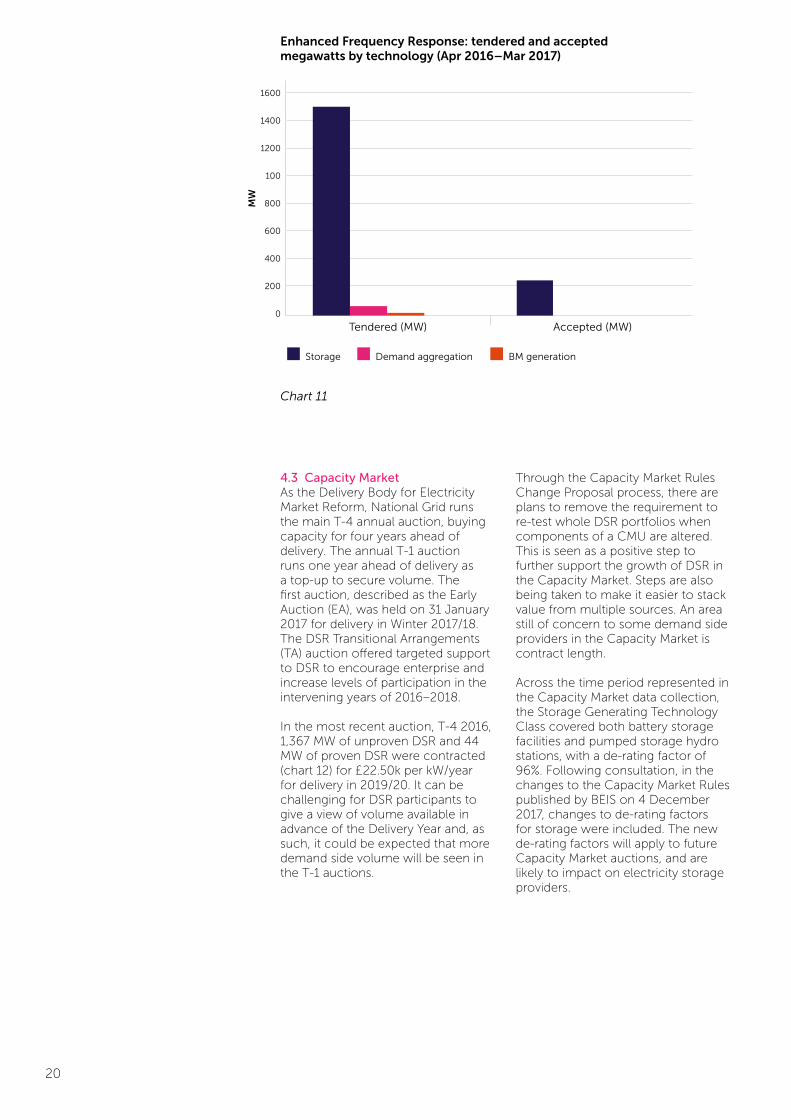
e. Enhanced Frequency Response As for all Balancing Services, EFR is a technology-neutral service; however, it is particularly suited to the fast-acting capabilities of battery storage. This is reflected in the technology breakdown for both tendered and accepted volume, with storage dominating over generation and load response (chart 11).
The values offered by potential providers through the tender varied greatly, with the level of interest in the service driving competitive prices, some of which were below the price offered for slower-responding services at the time. The average price of the eight tenders accepted through the procurement event was £9.44/MW of EFR/h.
We have not yet included values for utilisation as the first unit to
commence delivery of EFR went live in October 2017, with others due to follow over subsequent months. Organisations that secured contracts via the tender in summer 2016 were given until 1 March 2018 to commence service delivery, on a four- year contract.
National Grid is currently monitoring the first wave of delivery to understand the interaction with system requirements. There are no plans to procure a second round of EFR. However, there remains a requirement for fast-acting response and the route to market for this is being incorporated into the ongoing work to simplify Balancing Services.
Frequency response spend – BM vs NBM (Apr 2016–Mar 2017)
Chart 10
20
1600
1400
1200
100
800
600
400
200
0
Tendered (MW) Accepted (MW)
Enhanced Frequency Response: tendered & accepted megawatts by technology (Apr 2016 - Mar 2017)
Storage Demand aggregation BM generation
MW
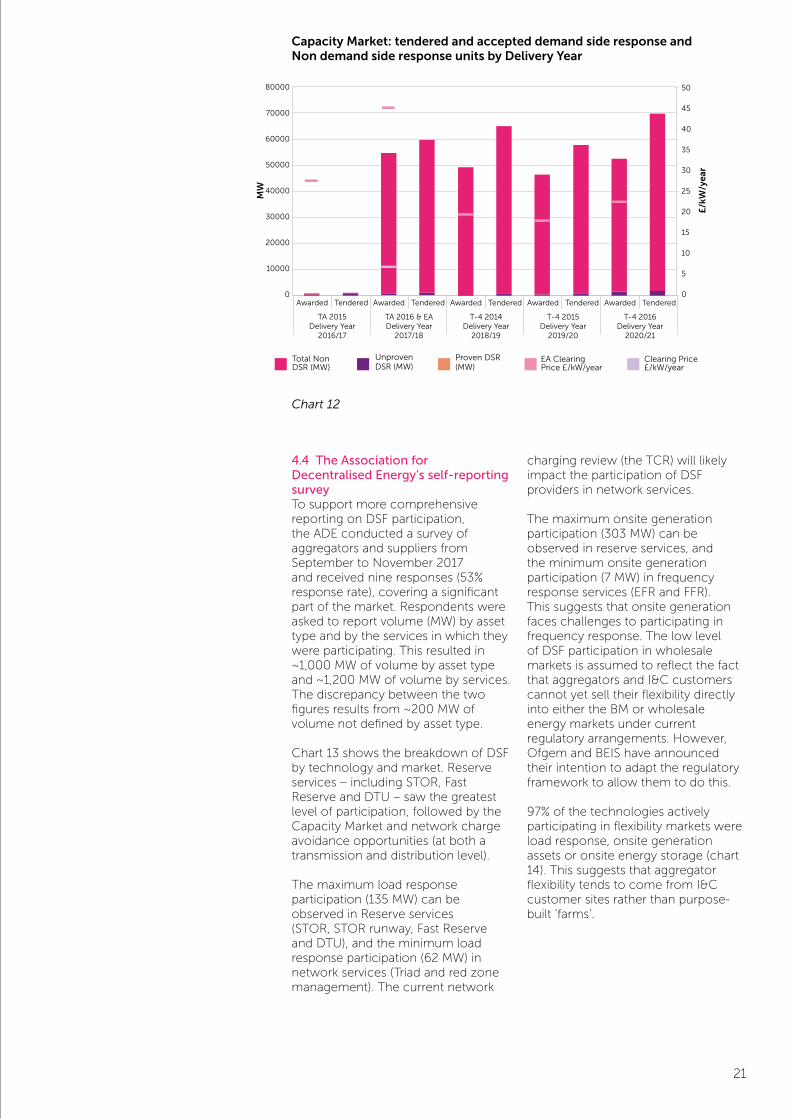
4.3 Capacity Market As the Delivery Body for Electricity Market Reform, National Grid runs the main T-4 annual auction, buying capacity for four years ahead of delivery. The annual T-1 auction runs one year ahead of delivery as a top-up to secure volume. The first auction, described as the Early Auction (EA), was held on 31 January 2017 for delivery in Winter 2017/18. The DSR Transitional Arrangements (TA) auction offered targeted support to DSR to encourage enterprise and increase levels of participation in the intervening years of 2016–2018.
In the most recent auction, T-4 2016, 1,367 MW of unproven DSR and 44 MW of proven DSR were contracted (chart 12) for £22.50k per kW/year for delivery in 2019/20. It can be challenging for DSR participants to give a view of volume available in advance of the Delivery Year and, as such, it could be expected that more demand side volume will be seen in the T-1 auctions.
Through the Capacity Market Rules Change Proposal process, there are plans to remove the requirement to re-test whole DSR portfolios when components of a CMU are altered. This is seen as a positive step to further support the growth of DSR in the Capacity Market. Steps are also being taken to make it easier to stack value from multiple sources. An area still of concern to some demand side providers in the Capacity Market is contract length.
Across the time period represented in the Capacity Market data collection, the Storage Generating Technology Class covered both battery storage facilities and pumped storage hydro stations, with a de-rating factor of 96%. Following consultation, in the changes to the Capacity Market Rules published by BEIS on 4 December 2017, changes to de-rating factors for storage were included. The new de-rating factors will apply to future Capacity Market auctions, and are likely to impact on electricity storage providers.
Enhanced Frequency Response: tendered and accepted megawatts by technology (Apr 2016–Mar 2017)
Chart 11
21
Awarded Tendered
TA 2015Delivery Year
2016/17
Awarded Tendered
TA 2016 & EADelivery Year
2017/18
Awarded Tendered
T-4 2014Delivery Year
2018/19
Awarded Tendered
T-4 2015Delivery Year
2019/20
Awarded Tendered
T-4 2016Delivery Year
2020/21
80000
70000
60000
50000
40000
30000
20000
10000
0
50
45
40
35
30
25
20
15
10
5
0
£/k
W/y
ear
MW
Total Non DSR (MW)
Unproven DSR (MW)
Proven DSR (MW)
EA Clearing Price £/kW/year
Clearing Price £/kW/year
Capacity Market: tendered & accepted DSR and Non DSR units by Delivery Year
4.4 The Association for Decentralised Energy’s self-reporting survey To support more comprehensive reporting on DSF participation, the ADE conducted a survey of aggregators and suppliers from September to November 2017 and received nine responses (53% response rate), covering a significant part of the market. Respondents were asked to report volume (MW) by asset type and by the services in which they were participating. This resulted in ~1,000 MW of volume by asset type and ~1,200 MW of volume by services. The discrepancy between the two figures results from ~200 MW of volume not defined by asset type.
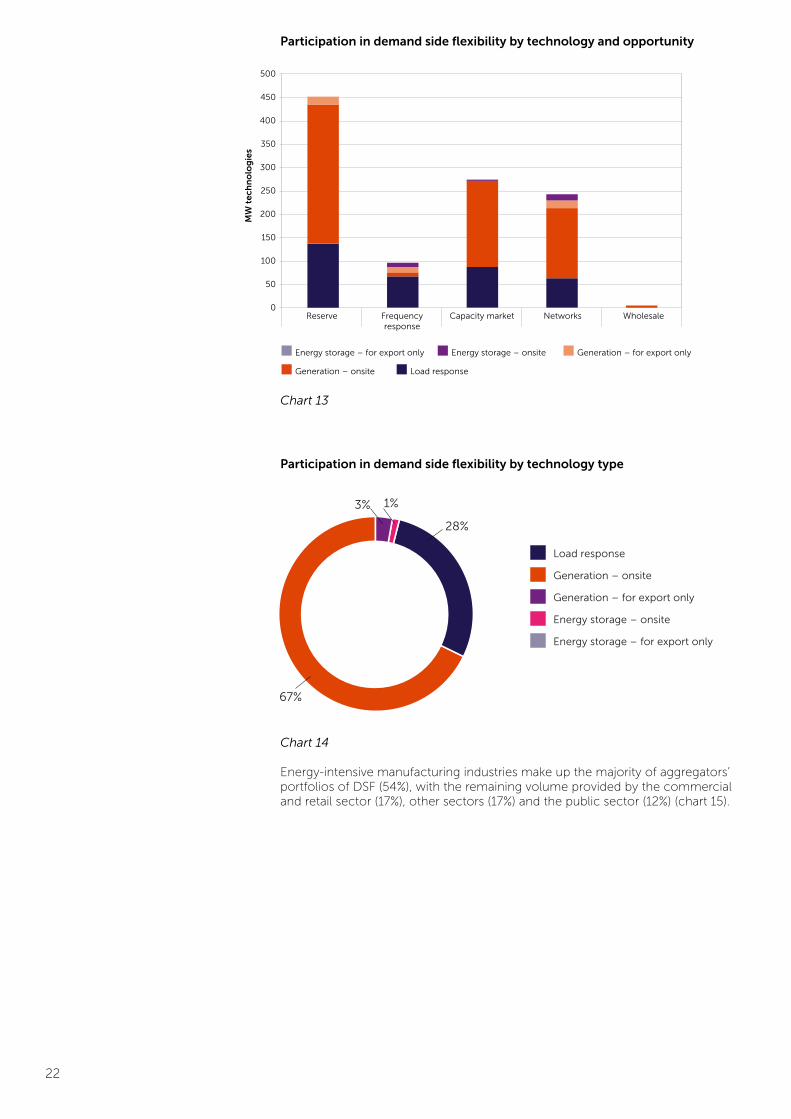
Chart 13 shows the breakdown of DSF by technology and market. Reserve services – including STOR, Fast Reserve and DTU – saw the greatest level of participation, followed by the Capacity Market and network charge avoidance opportunities (at both a transmission and distribution level).
The maximum load response participation (135 MW) can be observed in Reserve services (STOR, STOR runway, Fast Reserve and DTU), and the minimum load response participation (62 MW) in network services (Triad and red zone management). The current network
charging review (the TCR) will likely impact the participation of DSF providers in network services.
The maximum onsite generation participation (303 MW) can be observed in reserve services, and the minimum onsite generation participation (7 MW) in frequency response services (EFR and FFR). This suggests that onsite generation faces challenges to participating in frequency response. The low level of DSF participation in wholesale markets is assumed to reflect the fact that aggregators and I&C customers cannot yet sell their flexibility directly into either the BM or wholesale energy markets under current regulatory arrangements. However, Ofgem and BEIS have announced their intention to adapt the regulatory framework to allow them to do this.
97% of the technologies actively participating in flexibility markets were load response, onsite generation assets or onsite energy storage (chart 14). This suggests that aggregator flexibility tends to come from I&C customer sites rather than purpose- built ‘farms’.
Capacity Market: tendered and accepted demand side response and Non demand side response units by Delivery Year
Chart 12
22
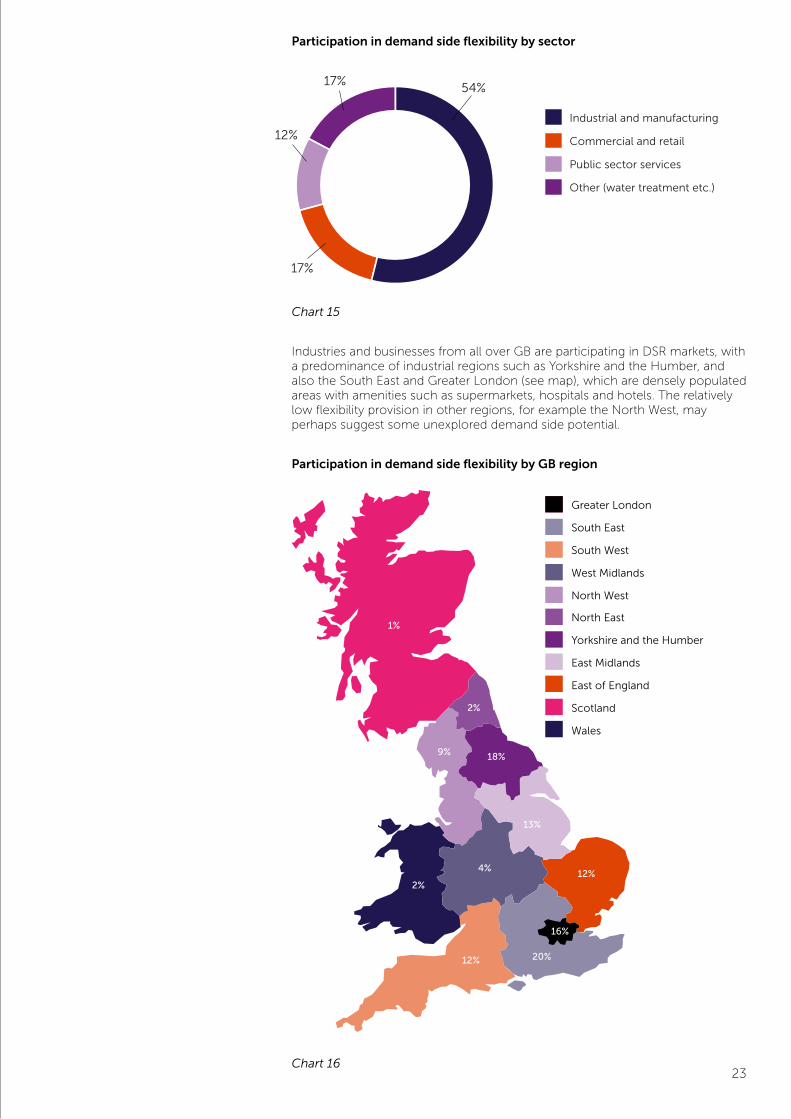
Energy-intensive manufacturing industries make up the majority of aggregators’ portfolios of DSF (54%), with the remaining volume provided by the commercial and retail sector (17%), other sectors (17%) and the public sector (12%) (chart 15).
Reserve Frequency response
Capacity market Networks Wholesale
500
450
400
350
300
250
200
150
100
50
0
Energy storage – for export only
Generation – onsite Load response
Energy storage – onsite Generation – for export only
Demand Side Response provision by technology and market
MW
tec
hn
olo
gie
s
Load response
Generation – onsite
Generation – for export only
Energy storage – onsite
Energy storage – for export only
3%
67%
1%
28%
Demand Side Response Provision by Technology
Participation in demand side flexibility by technology and opportunity
Participation in demand side flexibility by technology type
Chart 13
Chart 14
23
Industries and businesses from all over GB are participating in DSR markets, with a predominance of industrial regions such as Yorkshire and the Humber, and also the South East and Greater London (see map), which are densely populated areas with amenities such as supermarkets, hospitals and hotels. The relatively low flexibility provision in other regions, for example the North West, may perhaps suggest some unexplored demand side potential.
Industrial and manufacturing
Commercial and retail
Public sector services
Other (water treatment etc.)
Demand side Response provision by sector
17%
12%
17%
54%
Greater London
20%12%
4%12%
13%
9%
1%
2%
South East
South West
West Midlands
North West
North East
Yorkshire and the Humber
East Midlands
East of England
Scotland
Wales
16%
18%
2%
Participation in demand side flexibility by sector
Participation in demand side flexibility by GB region
Chart 15
Chart 16
24
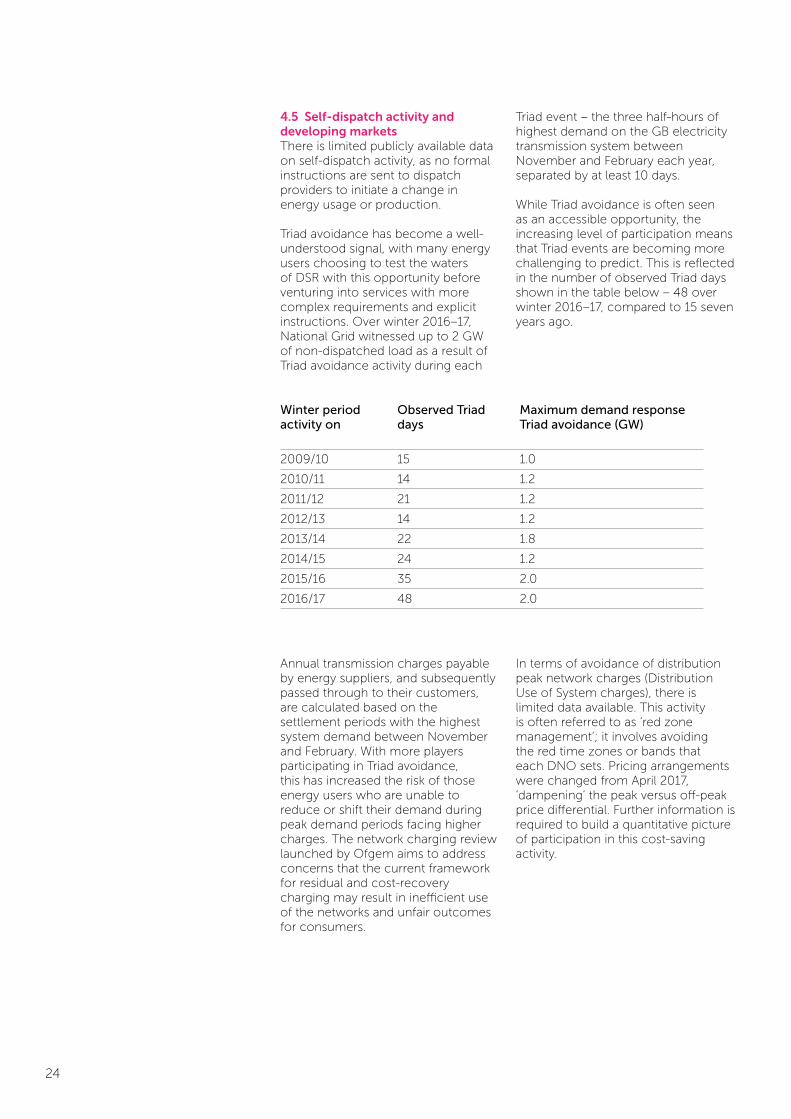
4.5 Self-dispatch activity and developing markets There is limited publicly available data on self-dispatch activity, as no formal instructions are sent to dispatch providers to initiate a change in energy usage or production.
Triad avoidance has become a well-understood signal, with many energy users choosing to test the waters of DSR with this opportunity before venturing into services with more complex requirements and explicit instructions. Over winter 2016–17, National Grid witnessed up to 2 GW of non-dispatched load as a result of Triad avoidance activity during each
Triad event – the three half-hours of highest demand on the GB electricity transmission system between November and February each year, separated by at least 10 days.
While Triad avoidance is often seen as an accessible opportunity, the increasing level of participation means that Triad events are becoming more challenging to predict. This is reflected in the number of observed Triad days shown in the table below – 48 over winter 2016–17, compared to 15 seven years ago.
Annual transmission charges payable by energy suppliers, and subsequently passed through to their customers, are calculated based on the settlement periods with the highest system demand between November and February. With more players participating in Triad avoidance, this has increased the risk of those energy users who are unable to reduce or shift their demand during peak demand periods facing higher charges. The network charging review launched by Ofgem aims to address concerns that the current framework for residual and cost-recovery charging may result in inefficient use of the networks and unfair outcomes for consumers.
In terms of avoidance of distribution peak network charges (Distribution Use of System charges), there is limited data available. This activity is often referred to as ‘red zone management’; it involves avoiding the red time zones or bands that each DNO sets. Pricing arrangements were changed from April 2017, ‘dampening’ the peak versus off-peak price differential. Further information is required to build a quantitative picture of participation in this cost-saving activity.
Winter period Observed Triad Maximum demand response activity on days Triad avoidance (GW)
2009/10 15 1.0
2010/11 14 1.2
2011/12 21 1.2
2012/13 14 1.2
2013/14 22 1.8
2014/15 24 1.2
2015/16 35 2.0
2016/17 48 2.0

25
26
Future developments in demand side flexibility opportunities5.0In the third year of Power Responsive we are beginning to see clearer shaping of the policy, regulatory and industry-led developments that commenced in 2017. Likely developments in 2018 include: • Further steps to simplify and future-proof Balancing Services as the National Grid System Operator’s Product Standardisation Roadmap is established and delivered;• New local markets emerging with the transition from DNO to DSO and continued work under the umbrella of the ENA’s Open Networks project; • Continued engagement through the CFF and the impact of half-hourly settlement of smaller business customers (load profiles 5–8) in wholesale markets;• Implementation of the ADE’s voluntary Code of Conduct for aggregators and suppliers;• Consideration of the impact of the Medium Combustion Plant Directive on back-up diesel generation;• New actors entering the market, perhaps most specifically battery storage technologies;• Consideration of the infrastructure required to realise flexibility opportunities from electric vehicles; • Further innovation by DSF providers and aggregation intermediaries, including that arising out of the government’s innovation competitions and Ofgem’s Innovation Link and regulatory sandbox; and• Further consideration of wider system risks, including cyber security.
The Power Responsive Steering Group continues to take an overview of developments in DSF markets and shape the strategic direction of the Power Responsive programme – focusing on the main enablers and barriers to progress in this period of transition. Due to the significant level of change surrounding DSF, the Steering Group is reviewing its strategy, which is to be released in early 2018. This will ensure that the programme’s objectives remain relevant and deliver benefits to DSF and end consumers.
As always, feedback is welcome from wider stakeholders. We want to work collaboratively, continue to raise awareness and provide clarity on DSF opportunities.
National Grid – Power Responsive contacts:[email protected]@nationalgrid.com
With thanks to Sustainability First for their continued contribution to the Power Responsive programme and to the ADE who gathered self-reported data from demand side providers for this report.
Disclaimer: This report should not be taken as investment advice in demand side markets on the part of Sustainability First, the ADE or the National Grid System Operator.
27
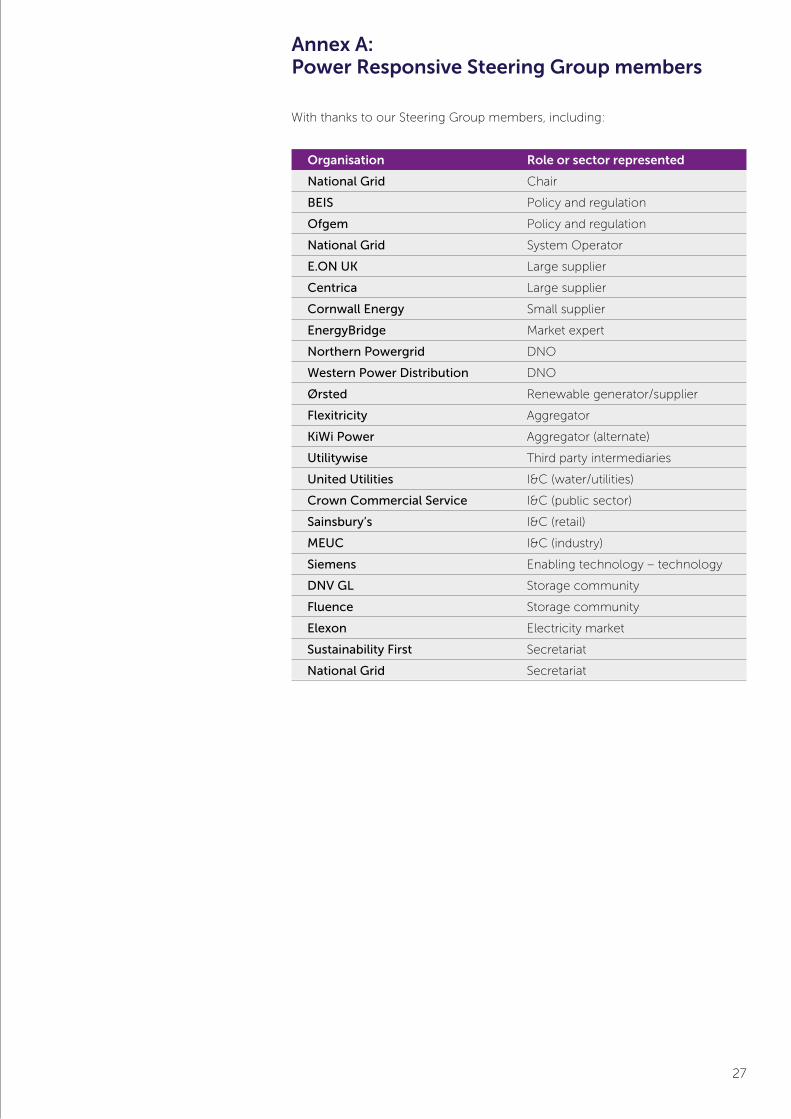
Annex A: Power Responsive Steering Group members
Organisation Role or sector represented
National Grid Chair
BEIS Policy and regulation
Ofgem Policy and regulation
National Grid System Operator
E.ON UK Large supplier
Centrica Large supplier
Cornwall Energy Small supplier
EnergyBridge Market expert
Northern Powergrid DNO
Western Power Distribution DNO
Ørsted Renewable generator/supplier
Flexitricity Aggregator
KiWi Power Aggregator (alternate)
Utilitywise Third party intermediaries
United Utilities I&C (water/utilities)
Crown Commercial Service I&C (public sector)
Sainsbury’s I&C (retail)
MEUC I&C (industry)
Siemens Enabling technology – technology
DNV GL Storage community
Fluence Storage community
Elexon Electricity market
Sustainability First Secretariat
National Grid Secretariat
With thanks to our Steering Group members, including:
28
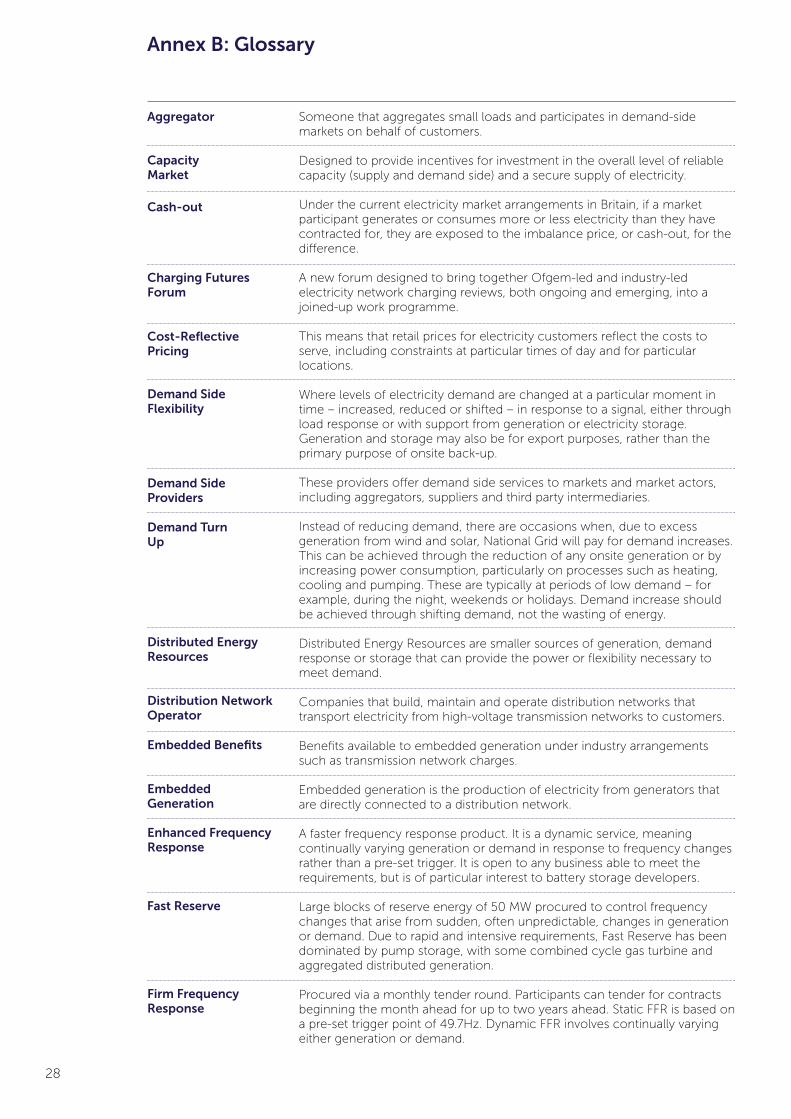
Annex B: Glossary
Aggregator
Charging Futures Forum
Capacity Market
Cash-out
Cost-Reflective Pricing
Demand Side Flexibility
Demand Side Providers
Distributed Energy Resources
Demand Turn Up
Distribution Network Operator
Embedded Benefits
Embedded Generation
Enhanced Frequency Response
Fast Reserve
Firm Frequency Response
Someone that aggregates small loads and participates in demand-side markets on behalf of customers.
Designed to provide incentives for investment in the overall level of reliable capacity (supply and demand side) and a secure supply of electricity.
Under the current electricity market arrangements in Britain, if a market participant generates or consumes more or less electricity than they have contracted for, they are exposed to the imbalance price, or cash-out, for the difference.
A new forum designed to bring together Ofgem-led and industry-led electricity network charging reviews, both ongoing and emerging, into a joined-up work programme.
This means that retail prices for electricity customers reflect the costs to serve, including constraints at particular times of day and for particular locations.
Where levels of electricity demand are changed at a particular moment in time – increased, reduced or shifted – in response to a signal, either through load response or with support from generation or electricity storage. Generation and storage may also be for export purposes, rather than the primary purpose of onsite back-up.
These providers offer demand side services to markets and market actors, including aggregators, suppliers and third party intermediaries.
Instead of reducing demand, there are occasions when, due to excess generation from wind and solar, National Grid will pay for demand increases. This can be achieved through the reduction of any onsite generation or by increasing power consumption, particularly on processes such as heating, cooling and pumping. These are typically at periods of low demand – for example, during the night, weekends or holidays. Demand increase should be achieved through shifting demand, not the wasting of energy.
Distributed Energy Resources are smaller sources of generation, demand response or storage that can provide the power or flexibility necessary to meet demand.
Companies that build, maintain and operate distribution networks that transport electricity from high-voltage transmission networks to customers.
Benefits available to embedded generation under industry arrangements such as transmission network charges.
Embedded generation is the production of electricity from generators that are directly connected to a distribution network.
A faster frequency response product. It is a dynamic service, meaning continually varying generation or demand in response to frequency changes rather than a pre-set trigger. It is open to any business able to meet the requirements, but is of particular interest to battery storage developers.
Large blocks of reserve energy of 50 MW procured to control frequency changes that arise from sudden, often unpredictable, changes in generation or demand. Due to rapid and intensive requirements, Fast Reserve has been dominated by pump storage, with some combined cycle gas turbine and aggregated distributed generation.
Procured via a monthly tender round. Participants can tender for contracts beginning the month ahead for up to two years ahead. Static FFR is based on a pre-set trigger point of 49.7Hz. Dynamic FFR involves continually varying either generation or demand.
29
Frequency Response
Medium Combustion Plant Directive
Half-Hourly Settlement
Industrial and Commercial Customers
Reserve Services
Short Term Operating Reserve
Supplemental Balancing Reserve
System Operator
Targeted Charging Review
Third Party Intermediaries
Transmission Network Owner
Triad Avoidance
Significant Code Review
System frequency is a continuously changing variable that is determined and controlled by the second-by-second balance between system demand and total generation. National Grid must maintain a frequency of +/- 1% of 50Hz at all times, so procures frequency services in readiness to manage fluctuations in electricity demand or generation from forecast volumes or to withstand faults to the network or connected generation.
The electricity settlement process places incentives on suppliers to buy energy to meet their customers’ demand in each half hour of the day. With advanced meters, business customers are increasingly able to have their electricity consumption settled on a half-hourly basis.
This refers to large business customers of electricity, including those manufacturing goods and those serving customers. We include public sector organisations in this category.
EU legislation restricting emissions of certain pollutants from combustion plants with a rated thermal input equal to or greater than 1 megawatt and less than 50 MW. This impacts diesel plants – resulting in limited running hours for commercial gain.
In order to deal with unforeseen changes in demand or lack of generation, National Grid requires access to additional sources of power in the form of generation or demand reduction. The response time and duration is typically longer for reserve services than frequency.
This is a service for the provision of additional active power from generation and/or DSR. STOR is needed because, at certain times of the day, National Grid needs reserve power in the form of either generation and/or demand reduction in order to be able to deal with actual demand being greater than forecast demand and/or plant failure.
Supplemental Balancing Reserve is targeted at generators who would otherwise be closed, mothballed or generally unavailable to the market, and would only be used as a last resort by the System Operator after all commercial balancing actions have been taken.
The SCR mechanism is designed to facilitate complex and significant changes to the codes that energy companies are required to abide by. It enables Ofgem to undertake a review of a code-based issue and play a leading role in facilitating code changes through a review process.
Manages the national electricity system on a second-by-second basis to ensure supply meets demand and maintain a steady frequency.
An Ofgem review to consider the reform of residual charging for transmission and distribution, for both generation and demand, to ensure it meets the interests of consumers both now and in the future.
Organisations or individuals that give energy-related advice aimed at helping customers to buy energy and/or manage their energy needs. Companies that build, maintain and operate transmission networks, transporting electricity at a high voltage across the country.
Reducing consumption at periods where peak winter national demand is forecast, in order to proportionally reduce Transmission Network Use of System changes.

30
Notes

31

www.powerresponsive.com