Embed Size (px)
Citation preview
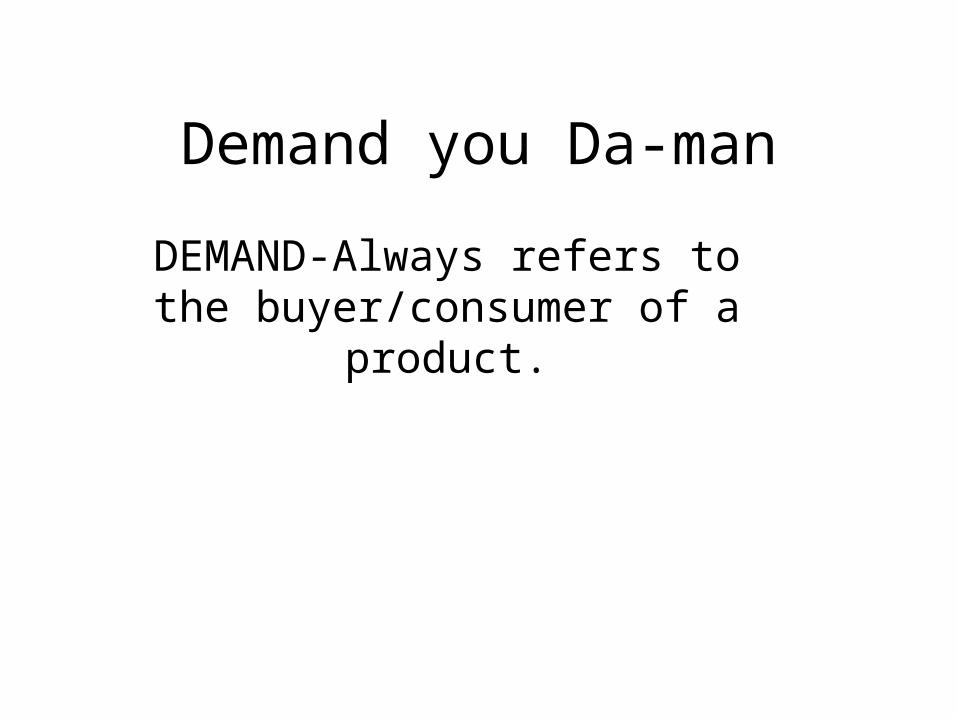
Demand you Da-man
DEMAND-Always refers to the buyer/consumer of a product.
• Supply and Demand Song
Lyrics
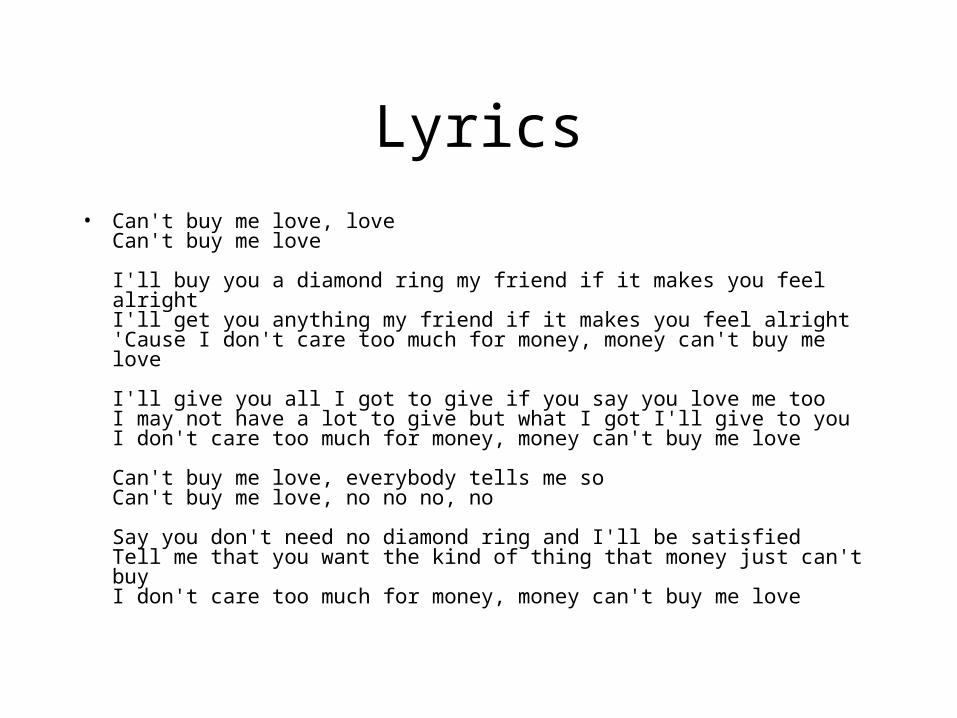
• Can't buy me love, love Can't buy me love
I'll buy you a diamond ring my friend if it makes you feel alright I'll get you anything my friend if it makes you feel alright 'Cause I don't care too much for money, money can't buy me love
I'll give you all I got to give if you say you love me too I may not have a lot to give but what I got I'll give to you I don't care too much for money, money can't buy me love
Can't buy me love, everybody tells me so Can't buy me love, no no no, no
Say you don't need no diamond ring and I'll be satisfied Tell me that you want the kind of thing that money just can't buy I don't care too much for money, money can't buy me love
• Does money have any intrinsic value? What are the functions of money? How does demand for money affect its supply? How do you think the supply of money versus the supply of diamonds has changed since the since the Beatles wrote this song? What's the reason for the difference? Although money can’t buy love, money can buy a diamond ring. How does the money supply change today if you pay for the diamond ring with credit as opposed to a debit card?
• My boss he's a probable bore.Put me hands and knees on scrubable floor.Do it right receive the lions share bliss.Know all too well just where that ration is.Learned a lot about the company doe.Learned less about receiving it though.Saw how it came to those who always sat pretty.Don't need it.Supply and demand.My girl had a probable cause or so she said and took a probable pause.I was dumped for occupying her time.I asked her why and what was next in line.She said "Shiny hair that's my life ambitionbut I'll devote my time to a new omission the rizzle-razzle kitsch of paranoid city".Don't need it.Supply and demand.Supply and demand.
• Draw a supply and demand diagram that shows the boss receiving “the lions share bliss” while someone who scrubs floors gets much less. In other words, what factors would affect supply and demand such that CEO’s receive 300 times the compensation of average workers? Are CEO’s paid too much?
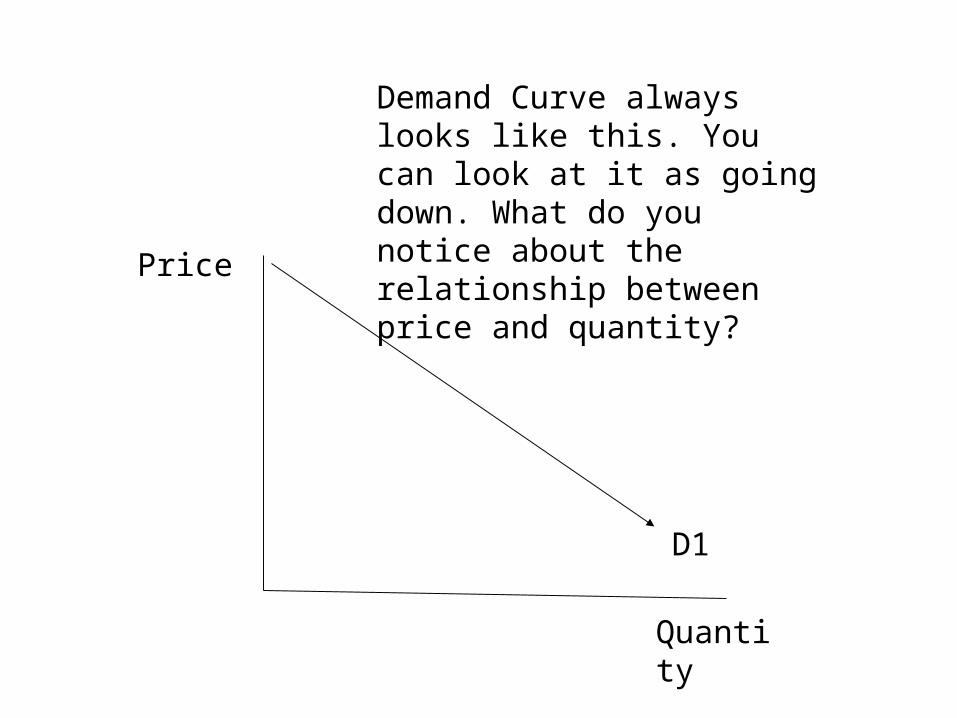
Demand Curve always looks like this. You can look at it as going down. What do you notice about the relationship between price and quantity?
D1
Price
Quantity
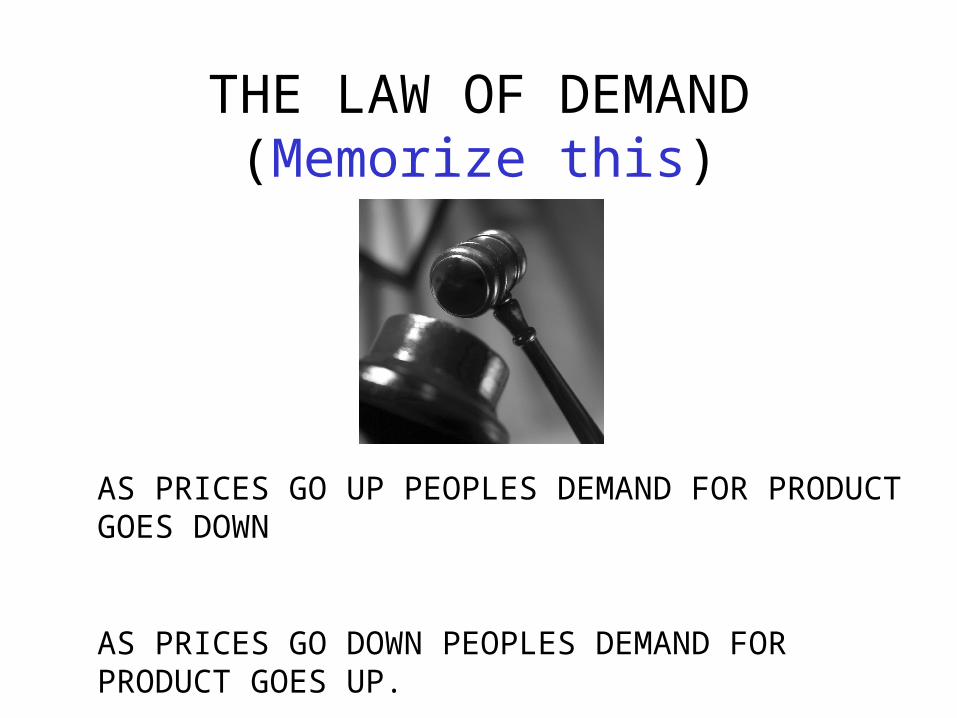
THE LAW OF DEMAND (Memorize this)
AS PRICES GO UP PEOPLES DEMAND FOR PRODUCT GOES DOWN
AS PRICES GO DOWN PEOPLES DEMAND FOR PRODUCT GOES UP.
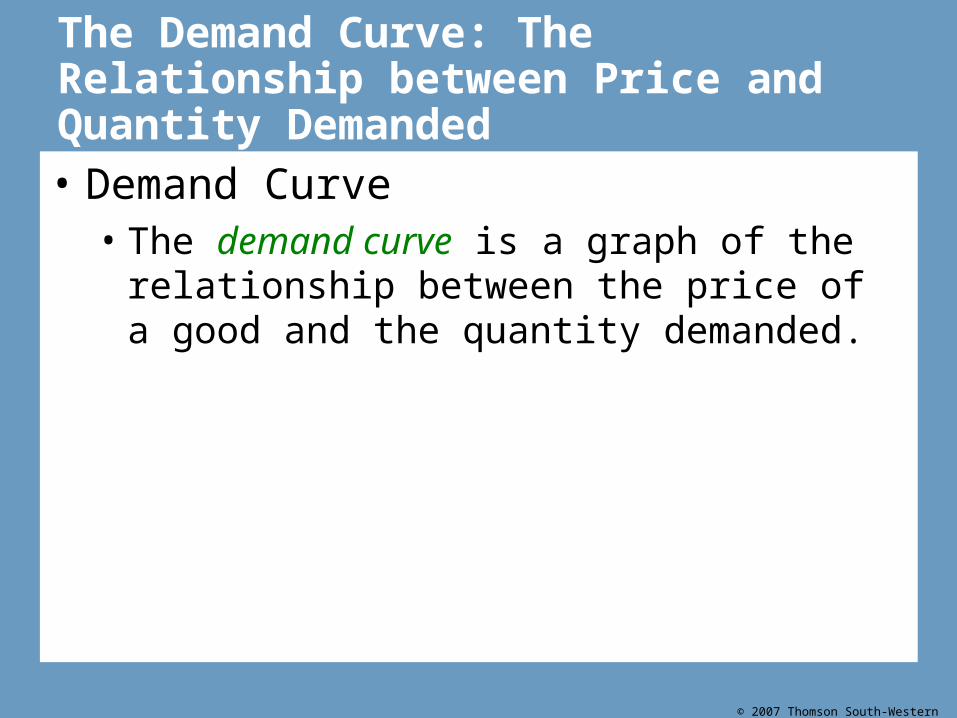
The Demand Curve: The Relationship between Price and
Quantity Demanded
• Demand Schedule – The demand schedule is a table that shows the
relationship between the price of the good and the quantity demanded.
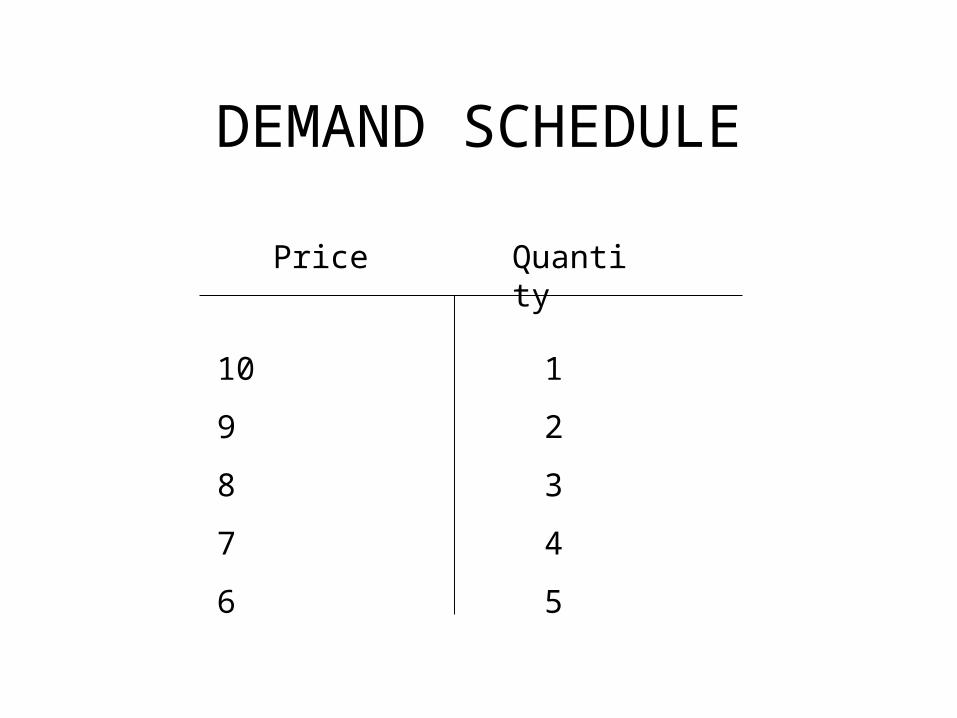
DEMAND SCHEDULE
Price Quantity
10
9
8
7
6
1
2
3
4
5
© 2007 Thomson South-Western
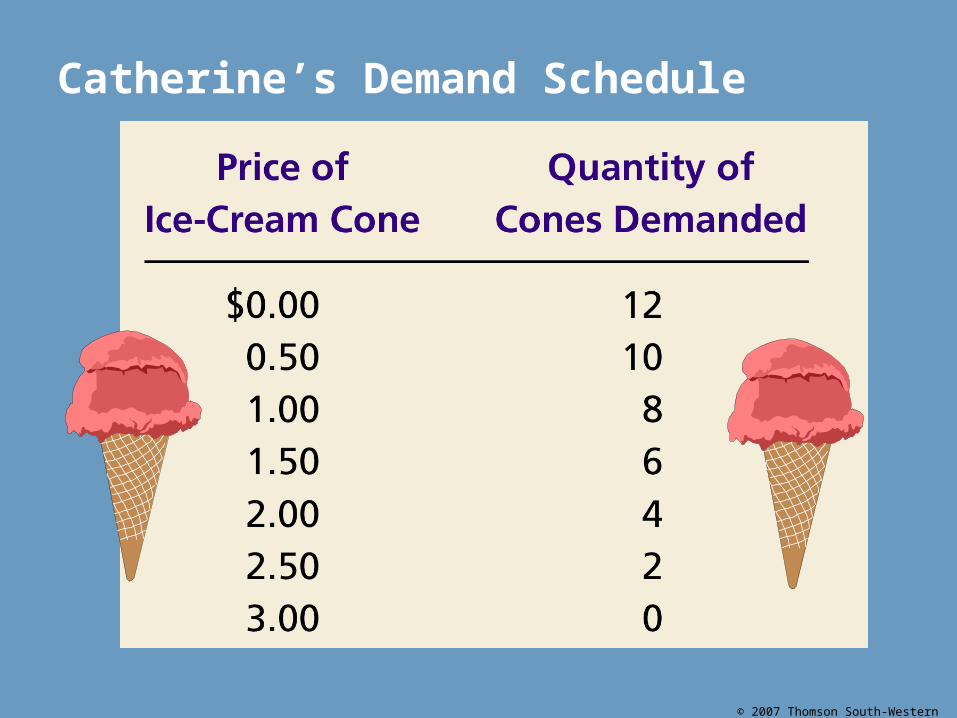
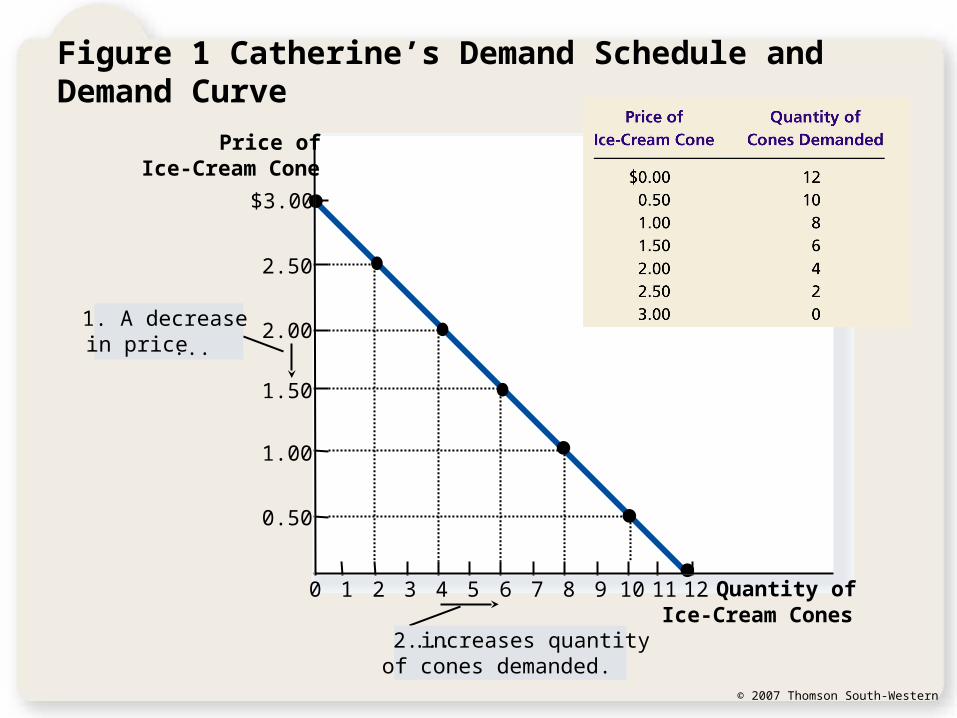
Catherine’s Demand Schedule
© 2007 Thomson South-Western
The Demand Curve: The Relationship between Price and Quantity Demanded
• Demand Curve • The demand curve is a graph of the relationship
between the price of a good and the quantity demanded.
© 2007 Thomson South-Western
Figure 1 Catherine’s Demand Schedule and Demand Curve
Price ofIce-Cream Cone
0
2.50
2.00
1.50
1.00
0.50
1 2 3 4 5 6 7 8 9 10 11 Quantity ofIce-Cream Cones
$3.00
12
1. A decrease in price ...
2. ... increases quantity of cones demanded.
© 2007 Thomson South-Western
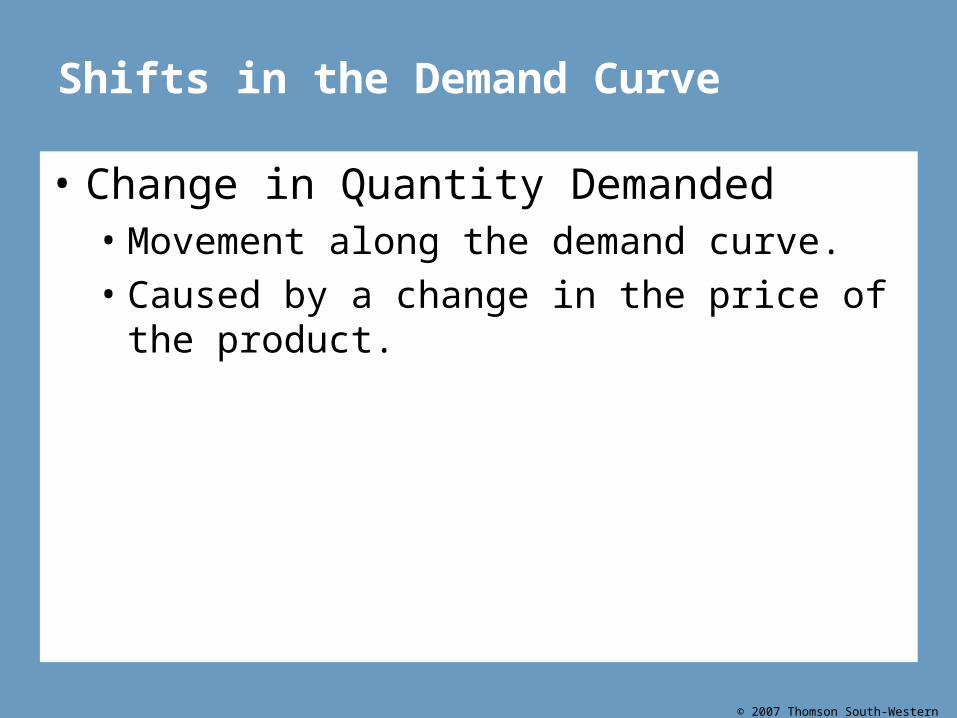
Shifts in the Demand Curve
• Change in Quantity Demanded• Movement along the demand curve.• Caused by a change in the price of the product.
© 2007 Thomson South-Western
0
D
Price of Ice-Cream Cones
Quantity of Ice-Cream Cones
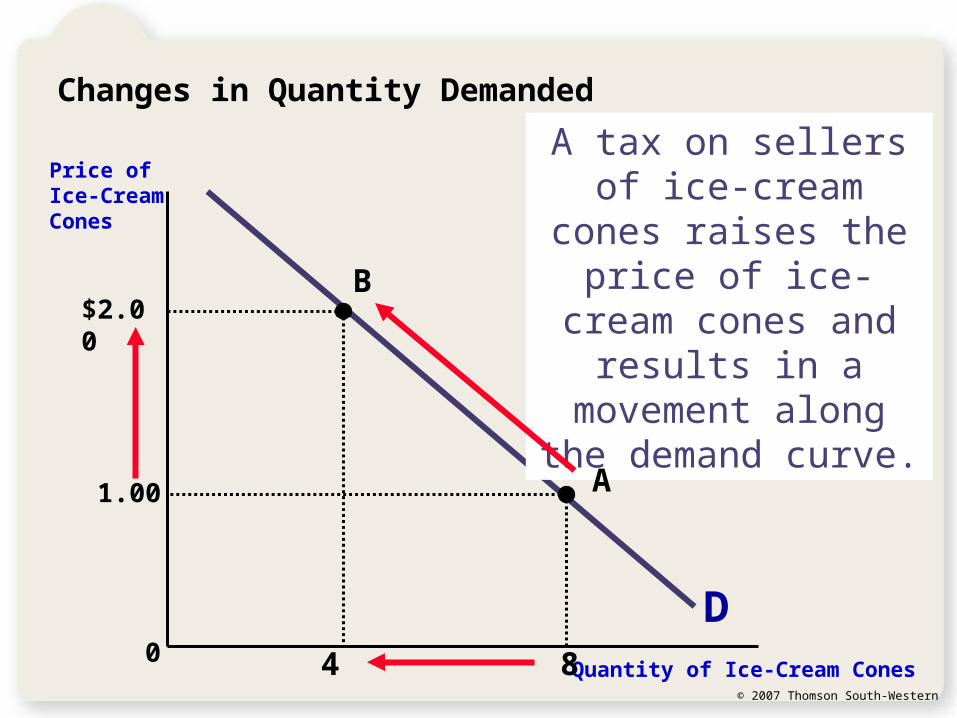
A tax on sellers of ice-cream cones raises the
price of ice-cream cones and results in a movement along the
demand curve.
A
B
8
1.00
$2.00
4
Changes in Quantity Demanded
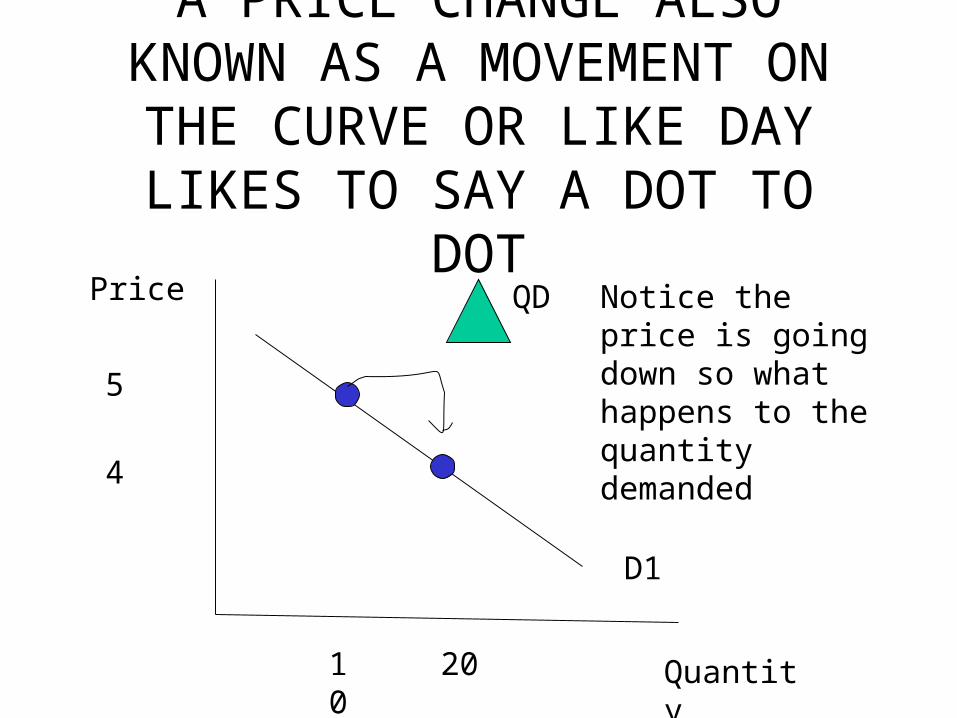
A PRICE CHANGE ALSO KNOWN AS A MOVEMENT ON
THE CURVE OR LIKE DAY LIKES TO SAY A DOT TO DOT
QD
D1
Notice the price is going down so what happens to the quantity demanded
Price
Quantity
5
4
10 20
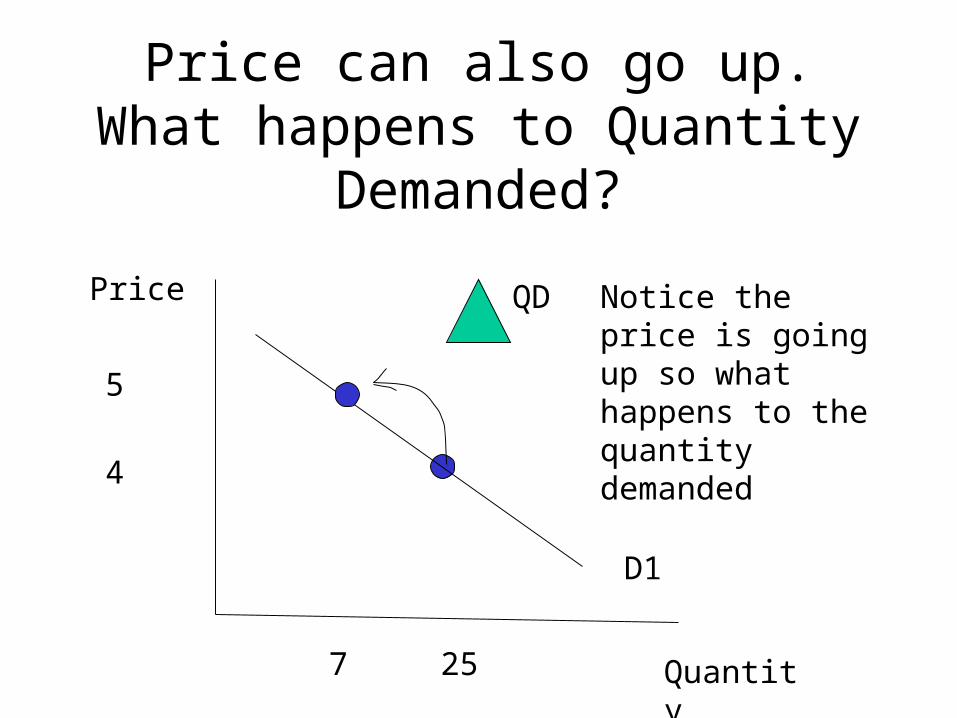
Price can also go up. What happens to Quantity Demanded?
Notice the price is going up so what happens to the quantity demanded
5
4
7 25 Quantity
QD
D1
Price
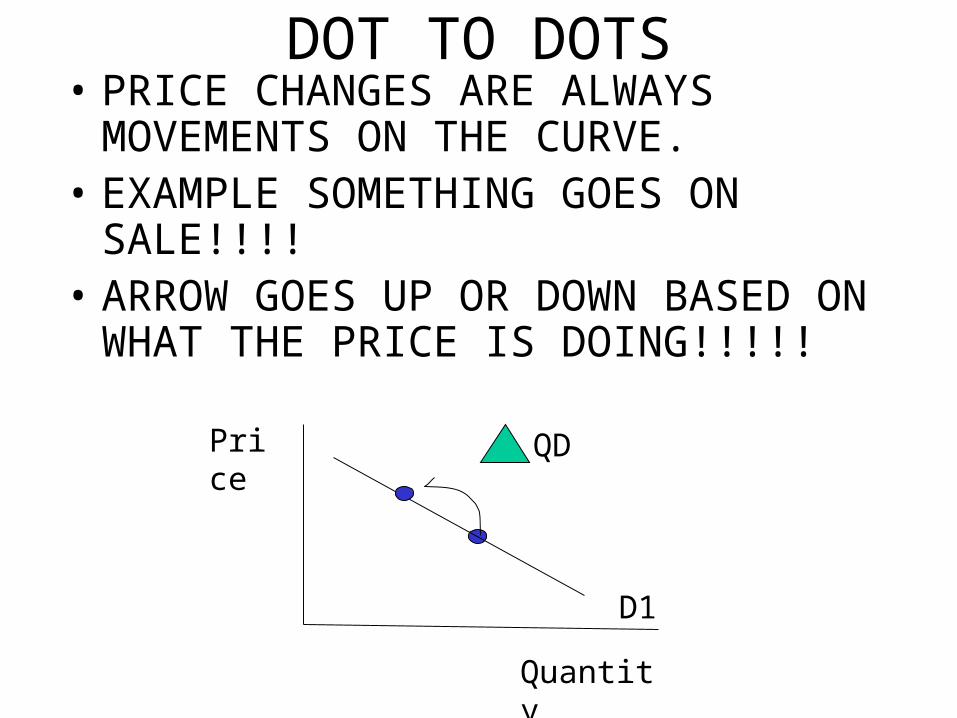
DOT TO DOTS• PRICE CHANGES ARE ALWAYS
MOVEMENTS ON THE CURVE.• EXAMPLE SOMETHING GOES ON
SALE!!!!• ARROW GOES UP OR DOWN BASED ON
WHAT THE PRICE IS DOING!!!!!
QD
D1
Price
Quantity
QD
D1
Price
Quantity
QD
D1
Price
Quantity
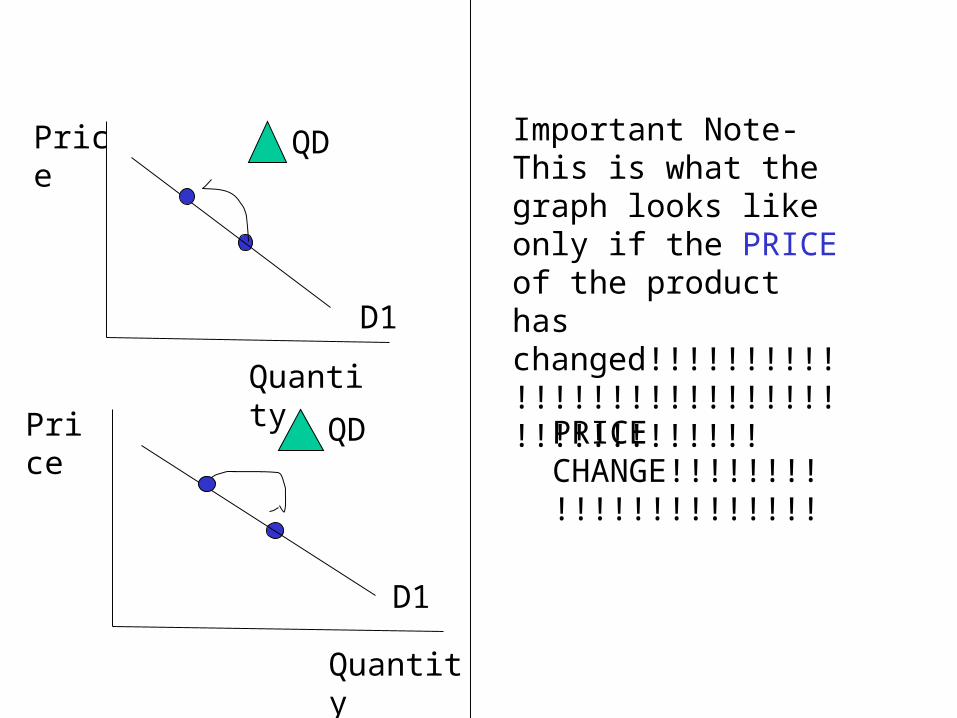
Important Note- This is what the graph looks like only if the PRICE of the product has changed!!!!!!!!!!!!!!!!!!!!!!!!!!!!!!!!!!!!!!!!
PRICE CHANGE!!!!!!!!!!!!!!!!!!!!!!
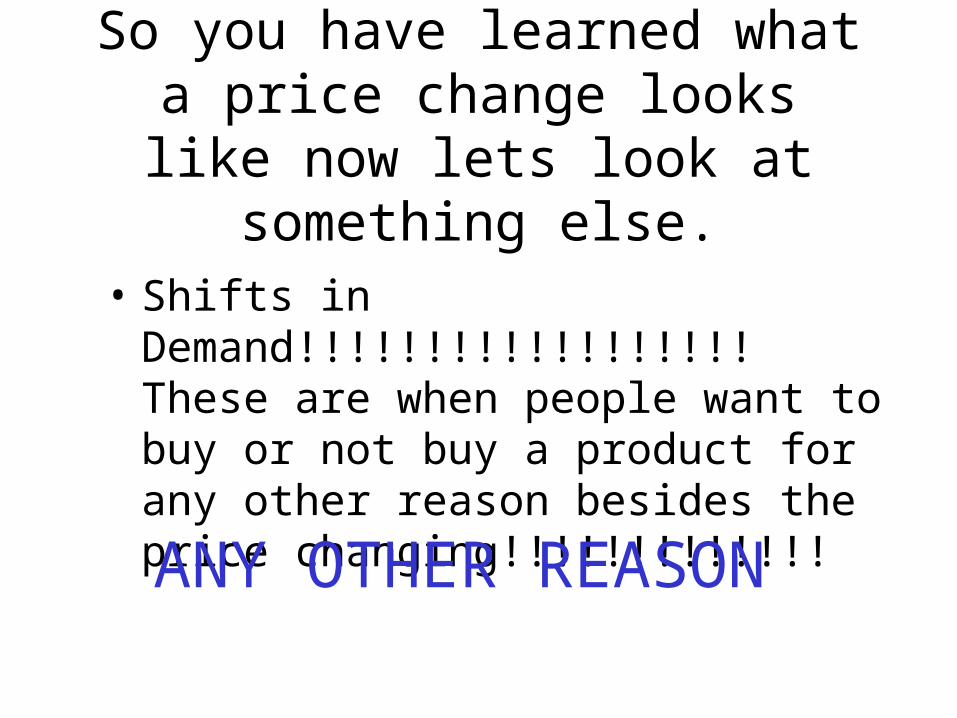
So you have learned what a price change looks like now lets look at
something else.
• Shifts in Demand!!!!!!!!!!!!!!!!!! These are when people want to buy or not buy a product for any other reason besides the price changing!!!!!!!!!!!!!
ANY OTHER REASON
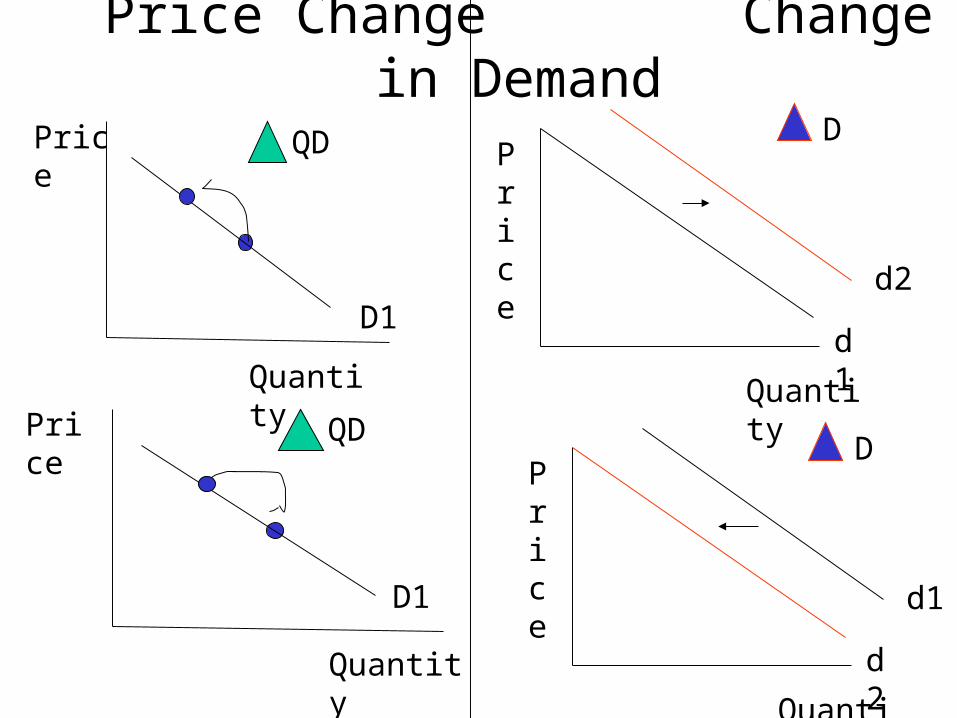
Price Change Change in Demand
d1
d2
DPrice
Quantity
QD
D1
Price
Quantity
QD
D1
Price
Quantity d2
d1
DPrice
Quantity
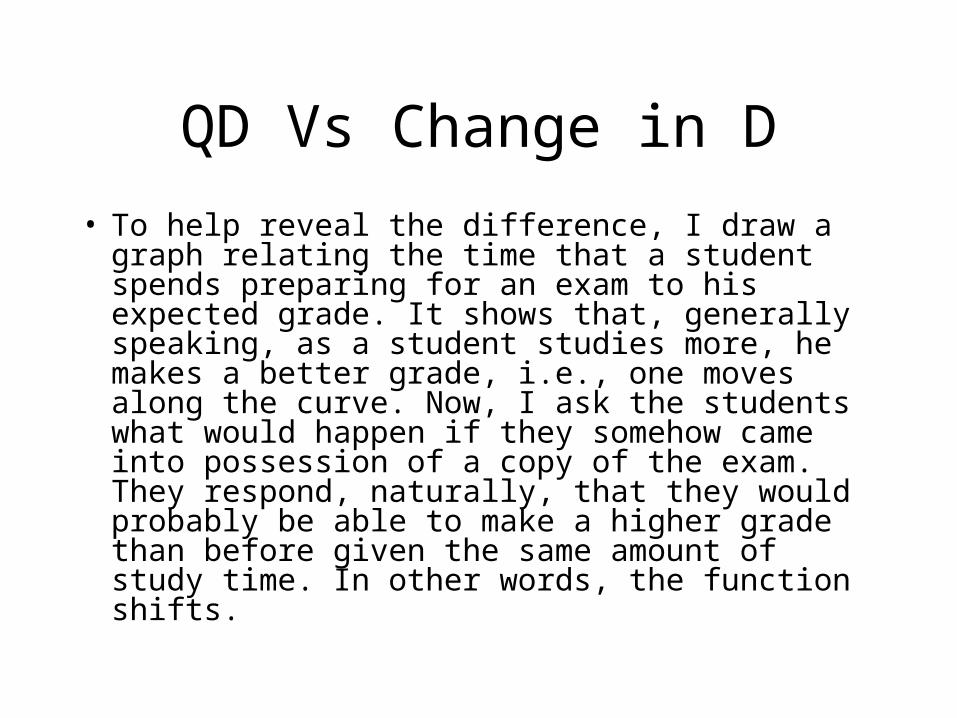
QD Vs Change in D
• To help reveal the difference, I draw a graph relating the time that a student spends preparing for an exam to his expected grade. It shows that, generally speaking, as a student studies more, he makes a better grade, i.e., one moves along the curve. Now, I ask the students what would happen if they somehow came into possession of a copy of the exam. They respond, naturally, that they would probably be able to make a higher grade than before given the same amount of study time. In other words, the function shifts.
© 2007 Thomson South-Western
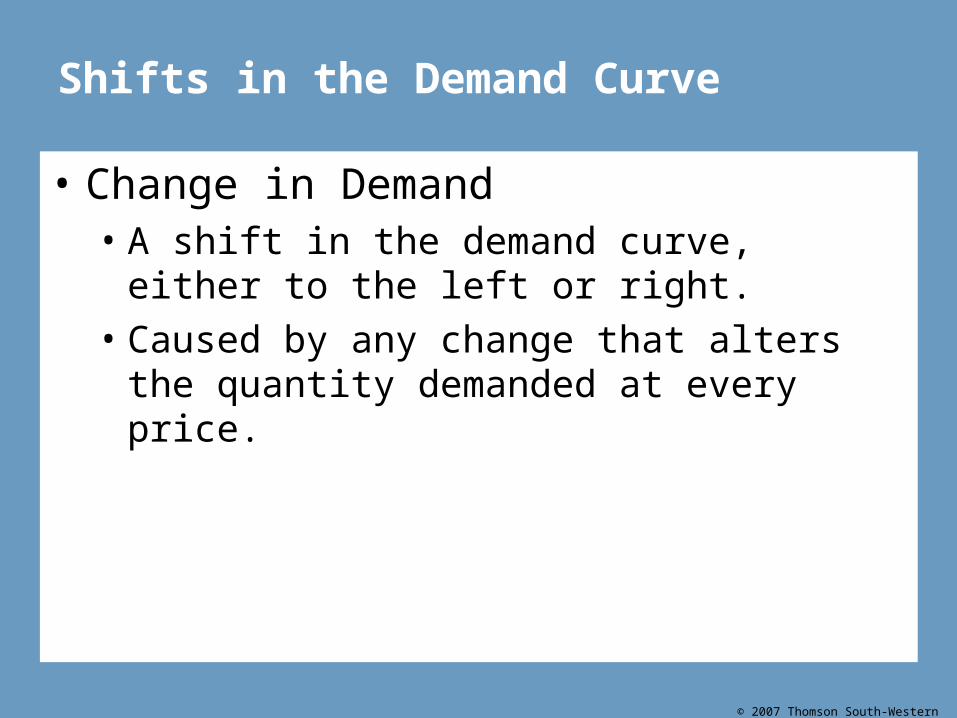
Shifts in the Demand Curve
• Change in Demand• A shift in the demand curve, either to the left or
right.• Caused by any change that alters the quantity
demanded at every price.
d1
d2
DPrice
Quantity
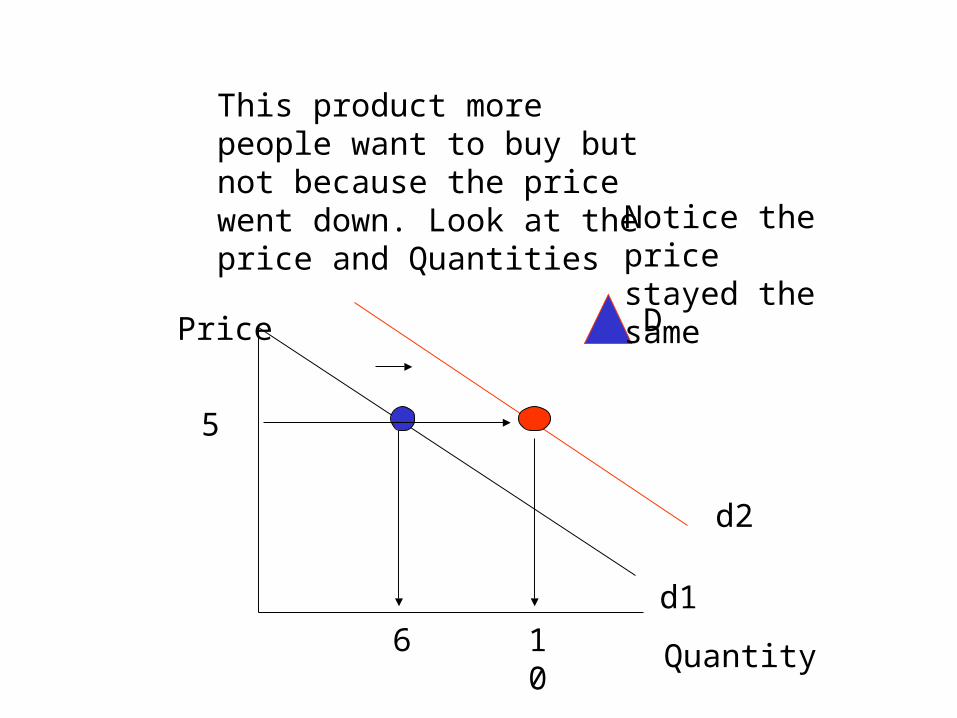
This product more people want to buy but not because the price went down. Look at the price and Quantities
5
6 10
Notice the price stayed the same
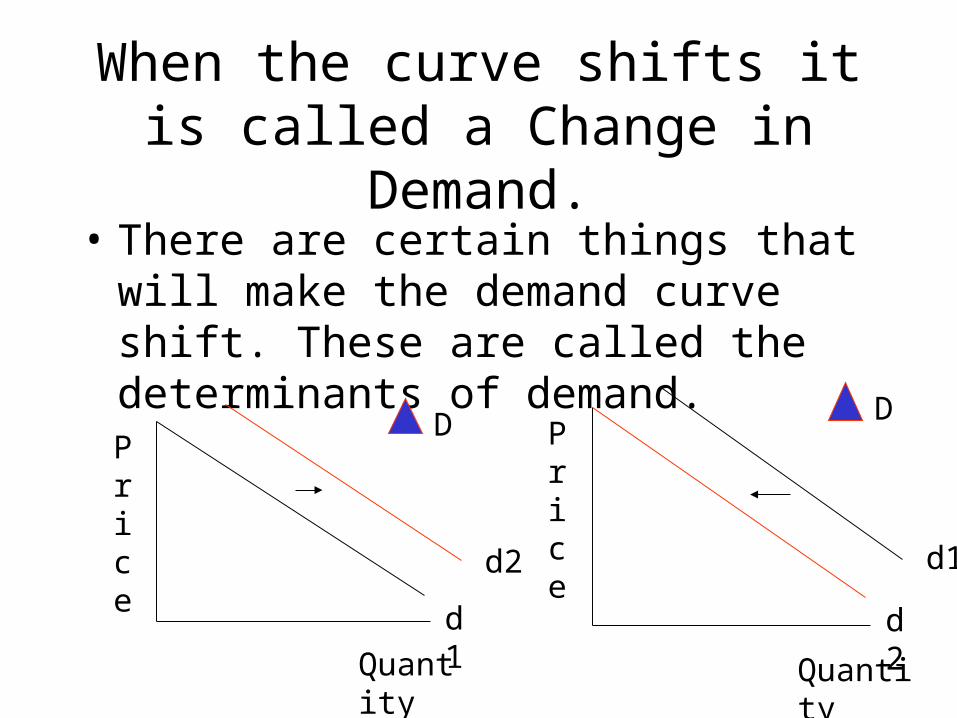
When the curve shifts it is called a Change in Demand.
• There are certain things that will make the demand curve shift. These are called the determinants of demand.
d1
d2
DPrice
Quantityd2
d1
DPrice
Quantity
Shifts in the Demand Curve
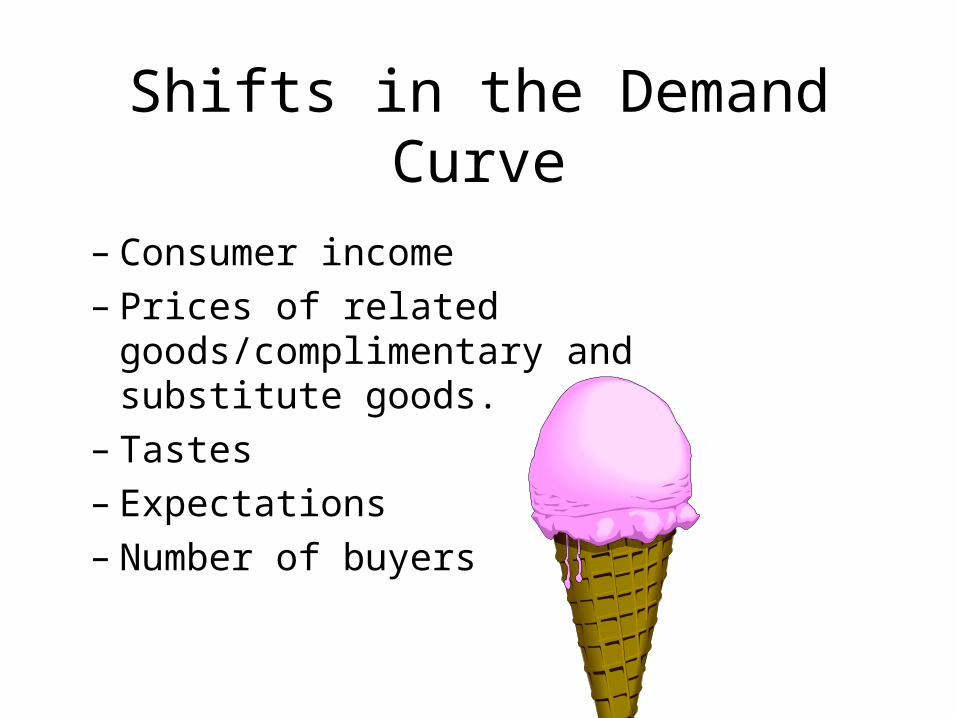
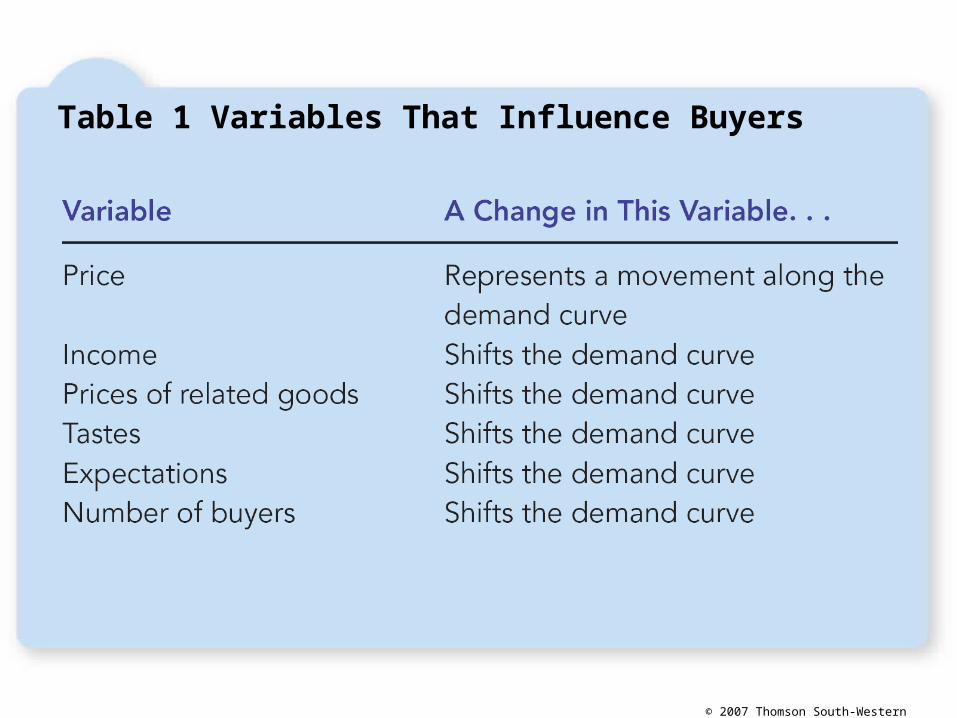
– Consumer income– Prices of related goods/complimentary and
substitute goods.– Tastes– Expectations– Number of buyers
Expectations• College students are often a poor down‑trodden lot who must pinch pennies to get by
and often subsist for most of their college careers on oatmeal or macaroni and cheese. They have to walk around in old rags. (Playing up the poverty of students gets sympathetic attention!) They endure this extreme deprivation until the last semester of their senior year. Then they start to apply for jobs and go to interviews. You can easily tell who is doing well in the job search process, they are the students who go out for pizza and beer and who begin to sport flashy new clothes! You can also distinguish between majors, accounting and computer science majors with high expectations will go out for pizza frequently, philosophy majors perhaps once or twice! Why does this occur? It is because good interviews give students confidence that in a few months their era of poverty will draw to a close. It is not necessary to even receive their first paycheck for these students to begin to alter their consumption patterns. Most have some slight reserve of cash, and the mere expectation of fat checks in a few months is enough to loose the bands on their coffers. Those without any nest egg may be inclined to borrow a bit, knowing that repayment will be easy. Budding accountants and systems analysts can, of course, be more prodigal since the size of the paycheck they anticipate is substantially fatter than that expected by the average philosophy major. Expectations of the future are a broad and powerful demand shifter not limited to expectations of future prices of a specific good.
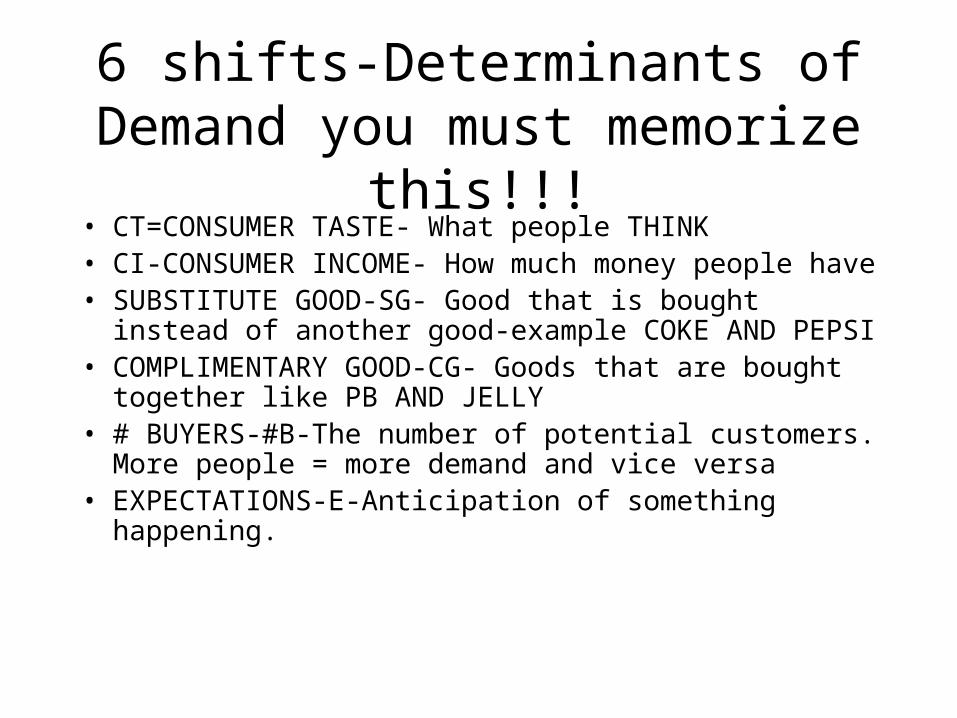
6 shifts-Determinants of Demand you must memorize this!!!
• CT=CONSUMER TASTE- What people THINK• CI-CONSUMER INCOME- How much money people
have• SUBSTITUTE GOOD-SG- Good that is bought instead of
another good-example COKE AND PEPSI• COMPLIMENTARY GOOD-CG- Goods that are bought
together like PB AND JELLY• # BUYERS-#B-The number of potential customers. More
people = more demand and vice versa• EXPECTATIONS-E-Anticipation of something
happening.
© 2007 Thomson South-Western
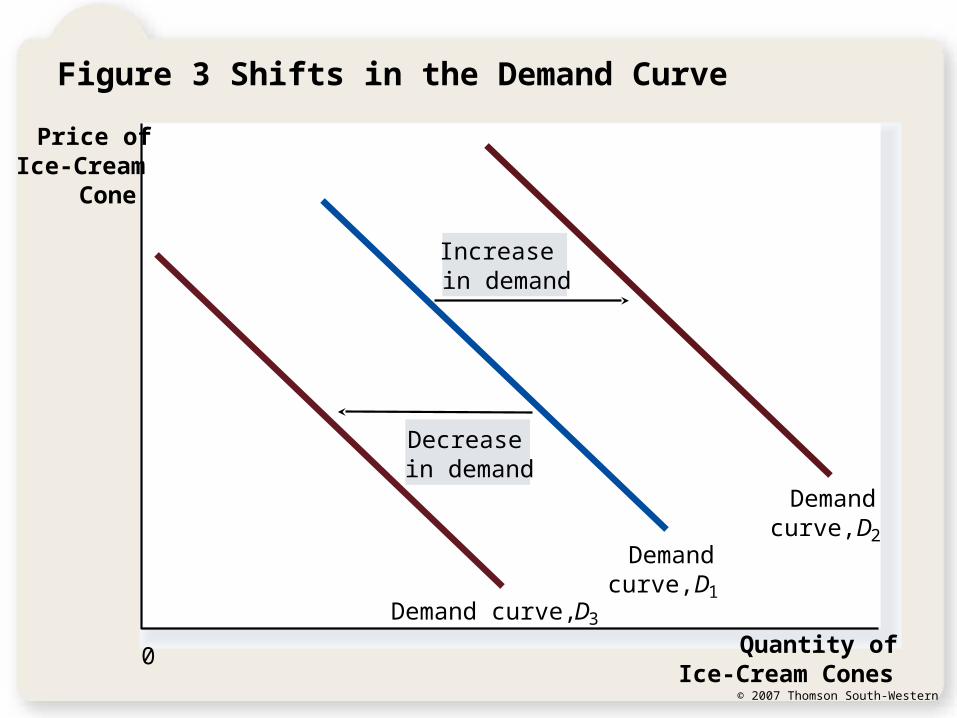
Figure 3 Shifts in the Demand Curve
Price ofIce-Cream
Cone
Quantity ofIce-Cream Cones
Increasein demand
Decreasein demand
Demand curve, D3
Demandcurve, D1
Demandcurve, D2
0
© 2007 Thomson South-Western
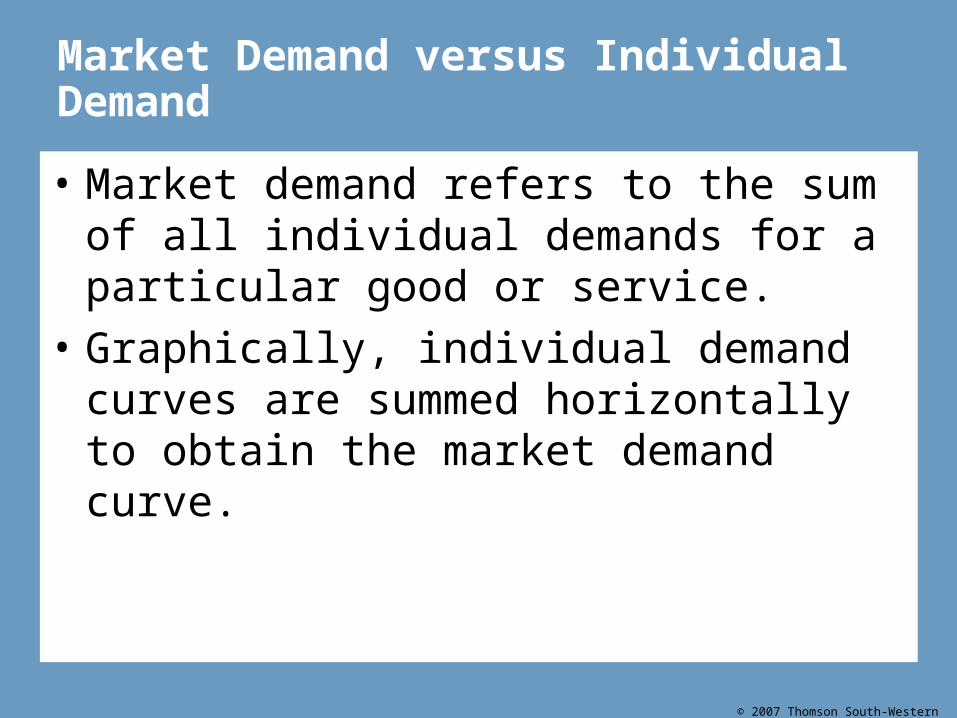
Market Demand versus Individual Demand
• Market demand refers to the sum of all individual demands for a particular good or service.
• Graphically, individual demand curves are summed horizontally to obtain the market demand curve.
© 2007 Thomson South-Western
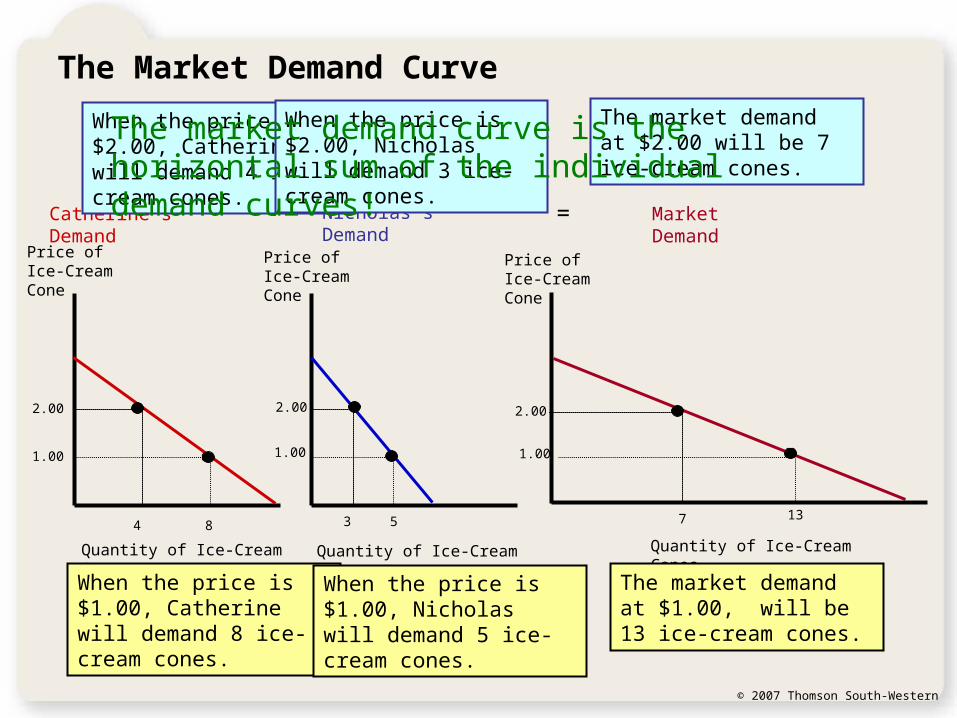
The Market Demand Curve
Price of Ice-Cream Cone
Price of Ice-Cream Cone
Price of Ice-Cream Cone
2.00 2.00 2.00
4 3 7
1.00 1.001.00
8 5 13
Quantity of Ice-Cream Cones Quantity of Ice-Cream Cones Quantity of Ice-Cream Cones
Catherine’s Demand Nicholas’s Demand Market Demand+ =
When the price is $2.00, Catherine will demand 4 ice-cream cones.
When the price is $2.00, Nicholas will demand 3 ice-cream cones.
The market demand at $2.00 will be 7 ice-cream cones.
When the price is $1.00, Catherine will demand 8 ice-cream cones.
When the price is $1.00, Nicholas will demand 5 ice-cream cones.
The market demand at $1.00, will be 13 ice-cream cones.
The market demand curve is the horizontal sum of the individual demand curves!
© 2007 Thomson South-Western
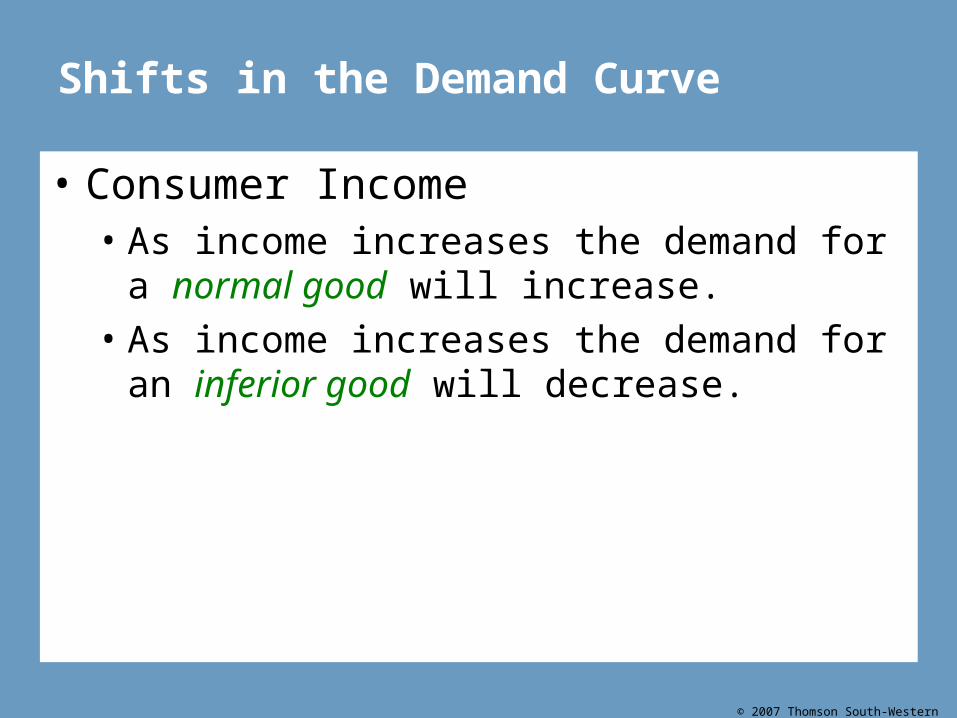
Shifts in the Demand Curve
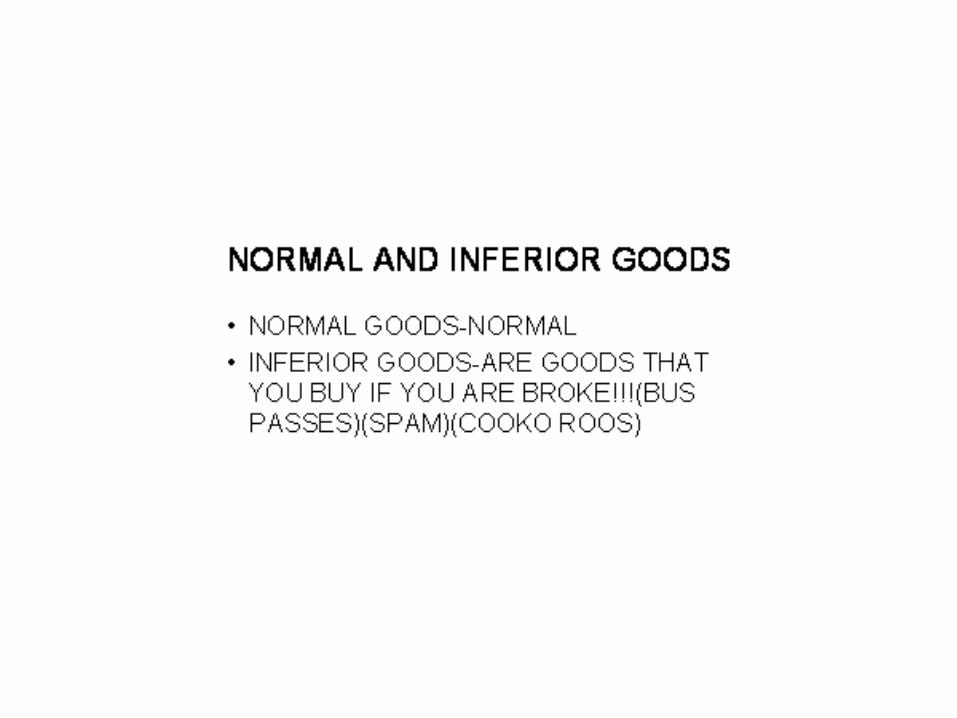
• Consumer Income• As income increases the demand for a normal good
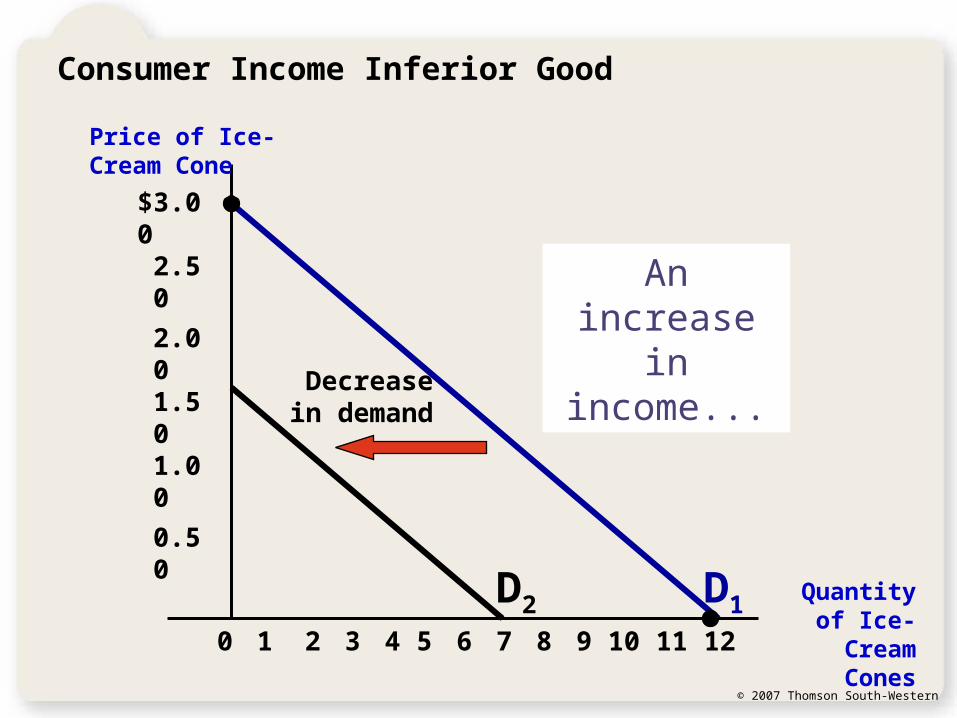
will increase.• As income increases the demand for an inferior
good will decrease.
© 2007 Thomson South-Western
$3.002.50
2.001.501.00
0.50
21 3 4 5 6 7 8 9 10 1211
Price of Ice-Cream Cone
Quantity of Ice-Cream Cones
0
Increasein demand
An increase in income...
D1
D2
Consumer Income Normal Good
© 2007 Thomson South-Western
$3.002.50
2.001.501.00
0.50
21 3 4 5 6 7 8 9 10 1211
Price of Ice-Cream Cone
Quantity of Ice-Cream
Cones0
Decreasein demand
An increase in income...
D1D2
Consumer Income Inferior Good
© 2007 Thomson South-Western
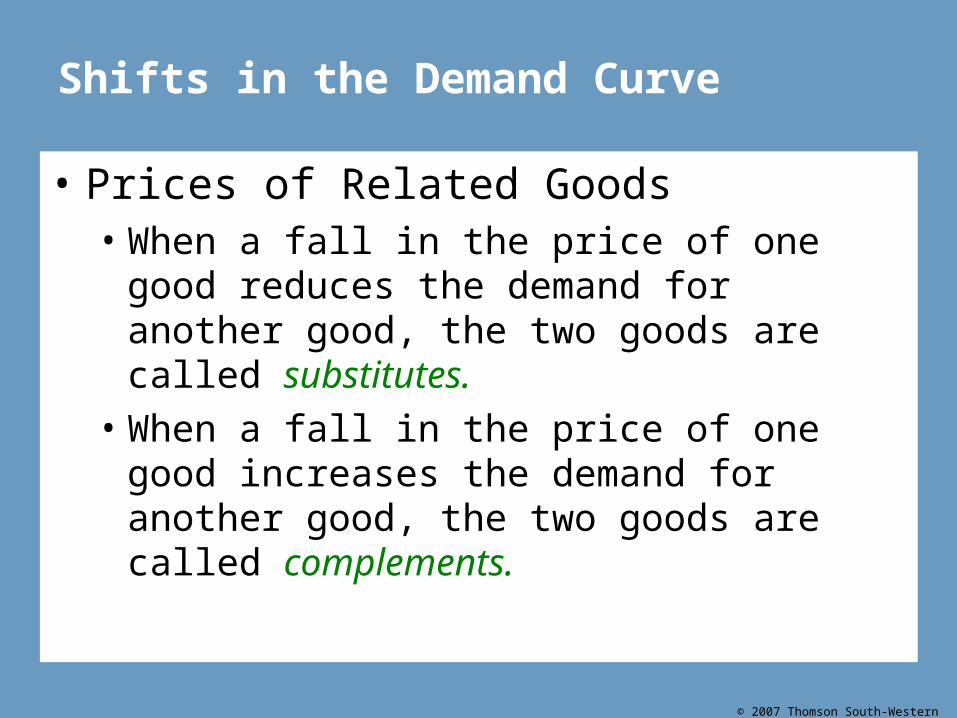
Shifts in the Demand Curve
• Prices of Related Goods• When a fall in the price of one good reduces the
demand for another good, the two goods are called substitutes.
• When a fall in the price of one good increases the demand for another good, the two goods are called complements.
© 2007 Thomson South-Western
Table 1 Variables That Influence Buyers
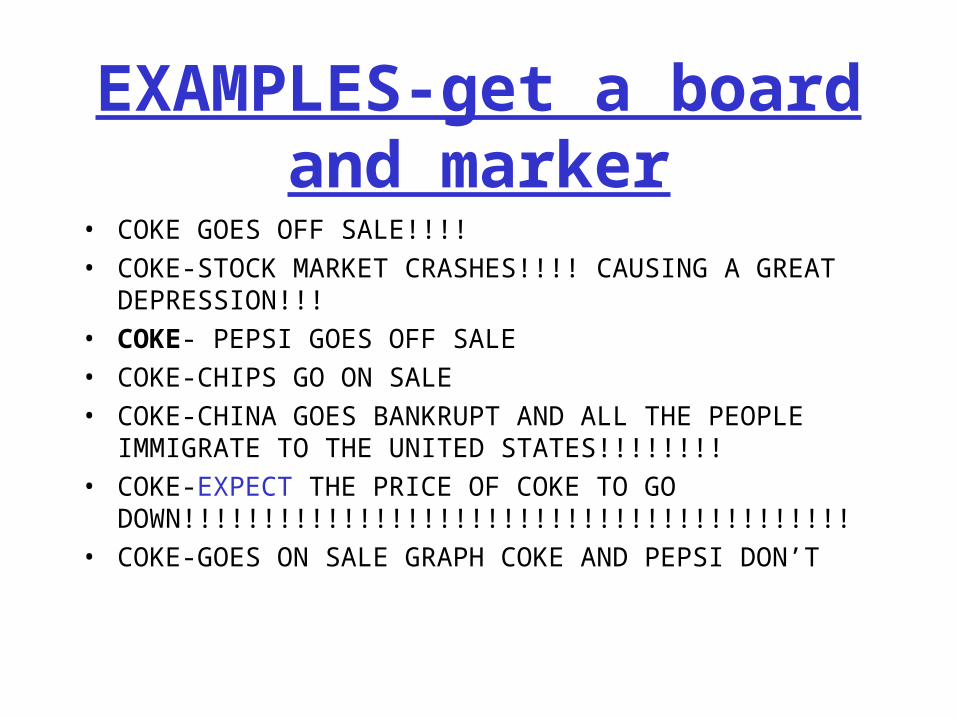
EXAMPLES-get a board and marker
• COKE GOES OFF SALE!!!!
• COKE-STOCK MARKET CRASHES!!!! CAUSING A GREAT DEPRESSION!!!
• COKE- PEPSI GOES OFF SALE
• COKE-CHIPS GO ON SALE
• COKE-CHINA GOES BANKRUPT AND ALL THE PEOPLE IMMIGRATE TO THE UNITED STATES!!!!!!!!
• COKE-EXPECT THE PRICE OF COKE TO GO DOWN!!!!!!!!!!!!!!!!!!!!!!!!!!!!!!!!!!!!!!!!!!
• COKE-GOES ON SALE GRAPH COKE AND PEPSI DON’T
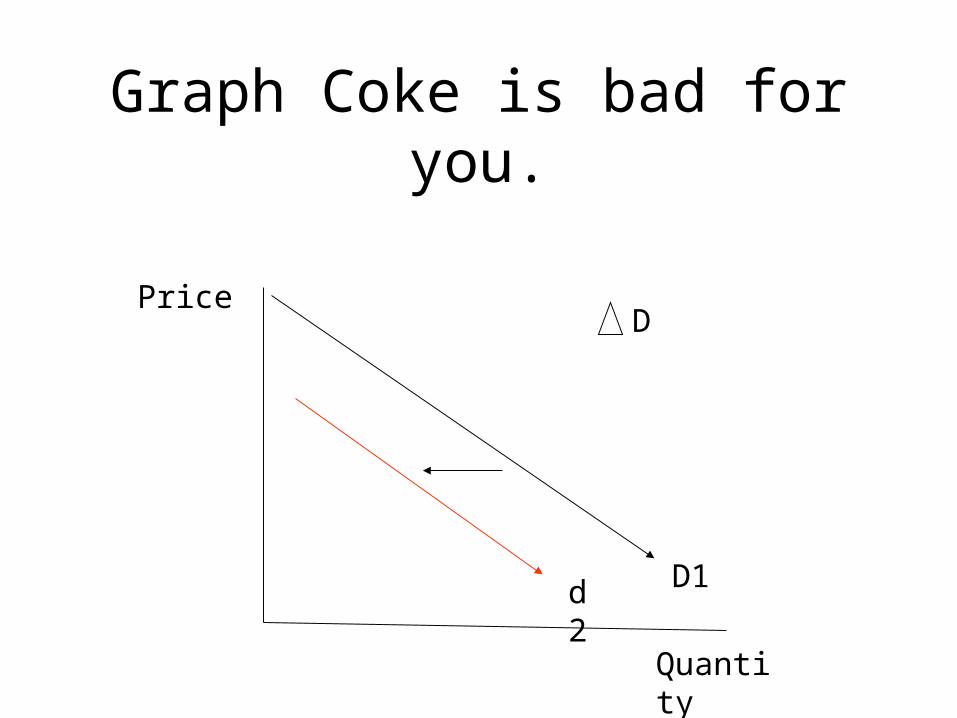
Graph Coke is bad for you.
D1
Price
Quantity
d2
D
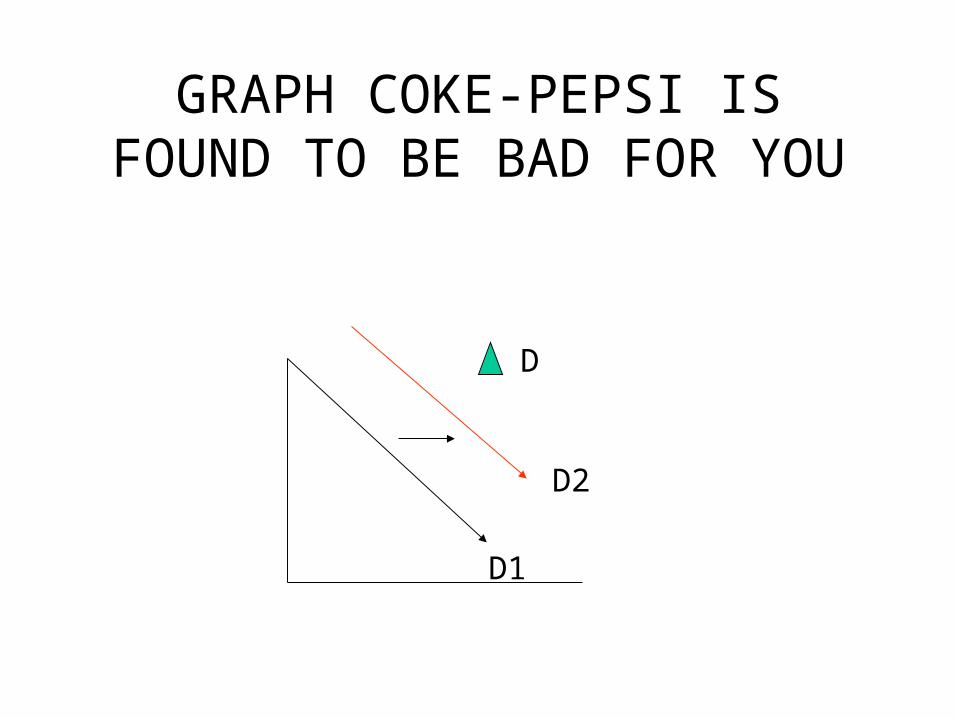
GRAPH COKE-PEPSI IS FOUND TO BE BAD FOR YOU
D1
D2
D
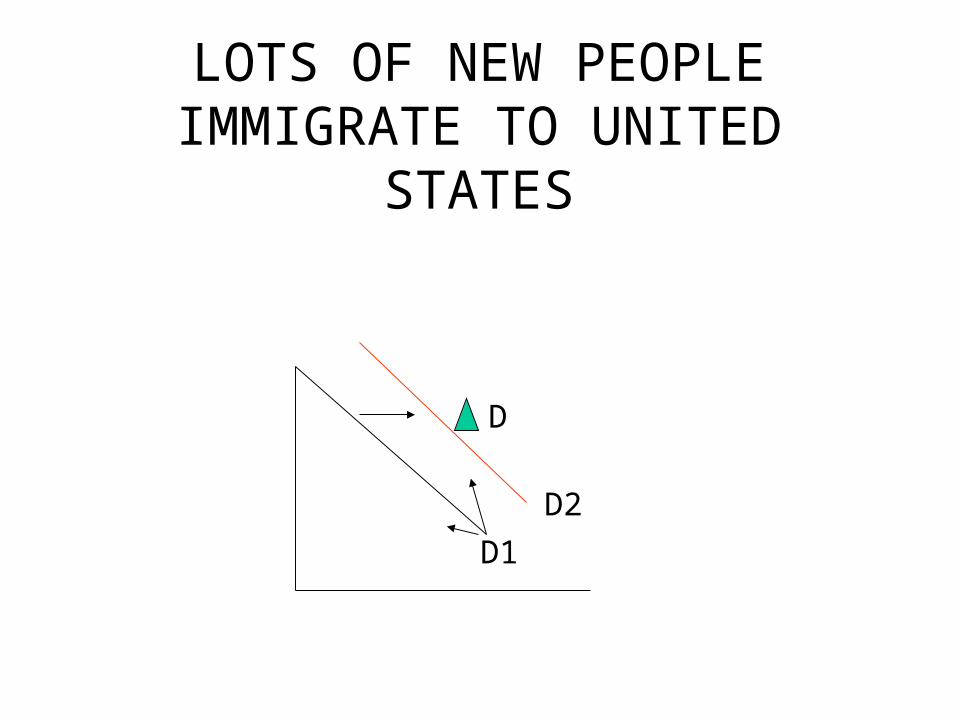
LOTS OF NEW PEOPLE IMMIGRATE TO UNITED
STATES
D1
D2
D
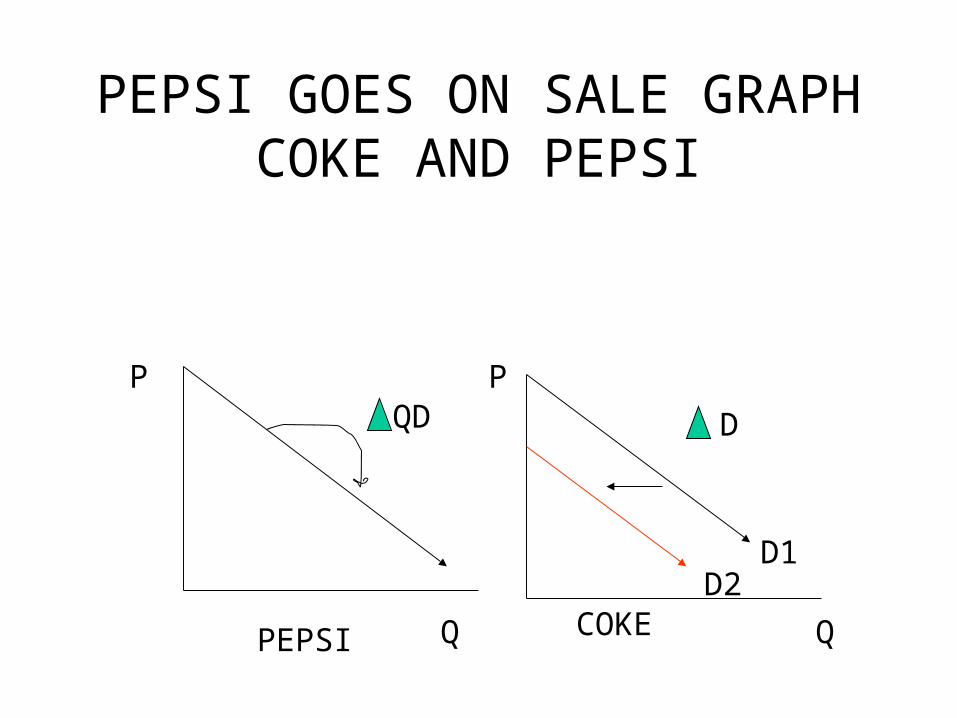
PEPSI GOES ON SALE GRAPH COKE AND PEPSI
PEPSI COKE
D1
QD D
D2
P
Q
P
Q
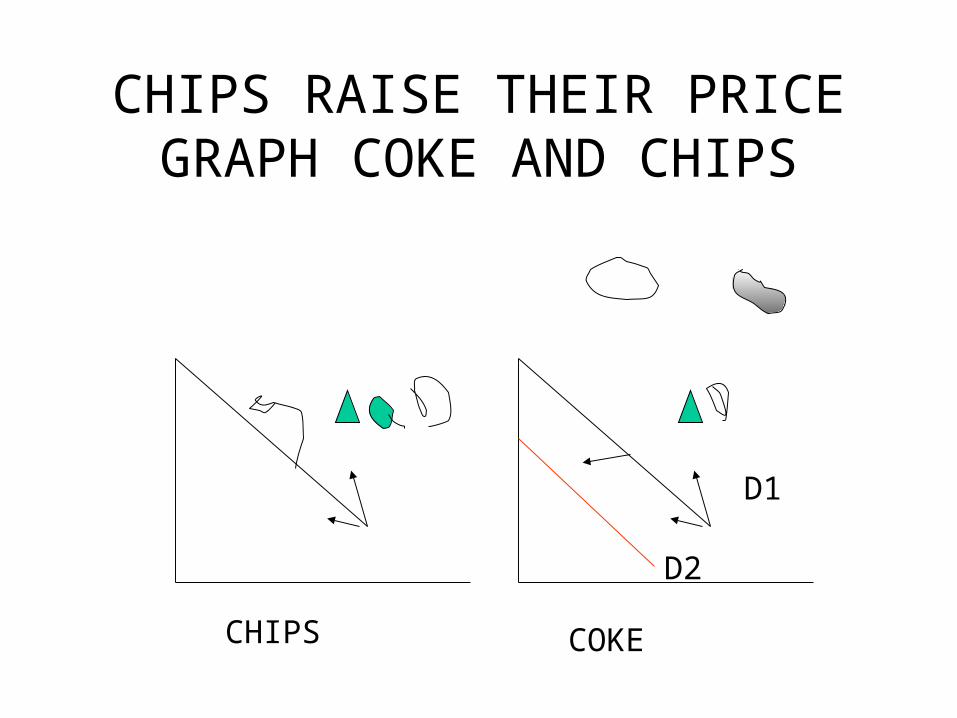
CHIPS RAISE THEIR PRICE GRAPH COKE AND CHIPS
CHIPS COKE
D1
D2
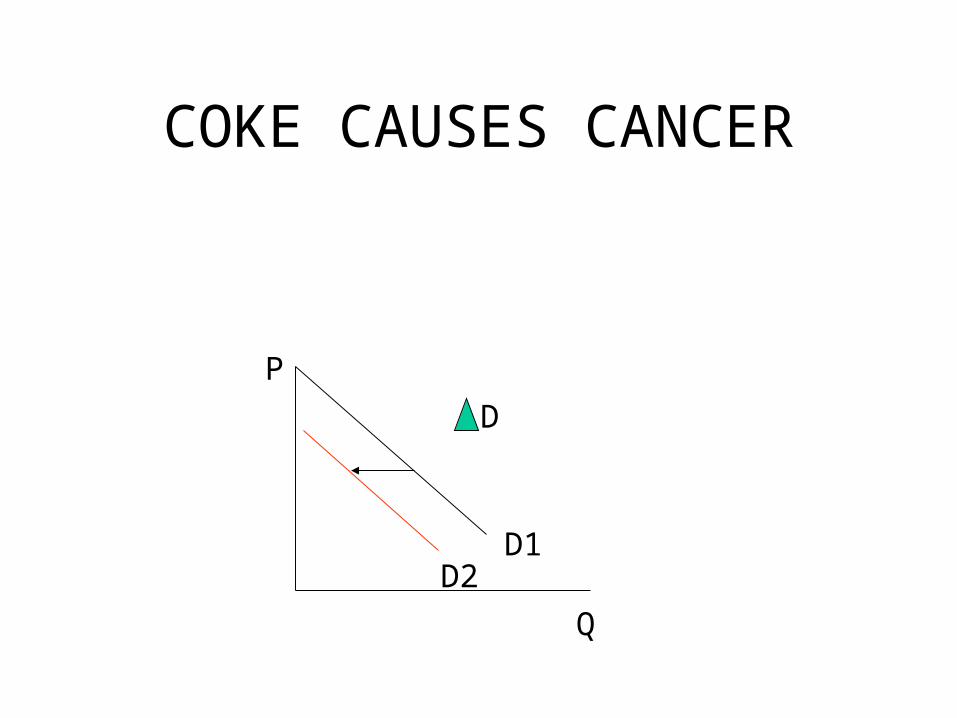
COKE CAUSES CANCER
D
D1D2
P
Q
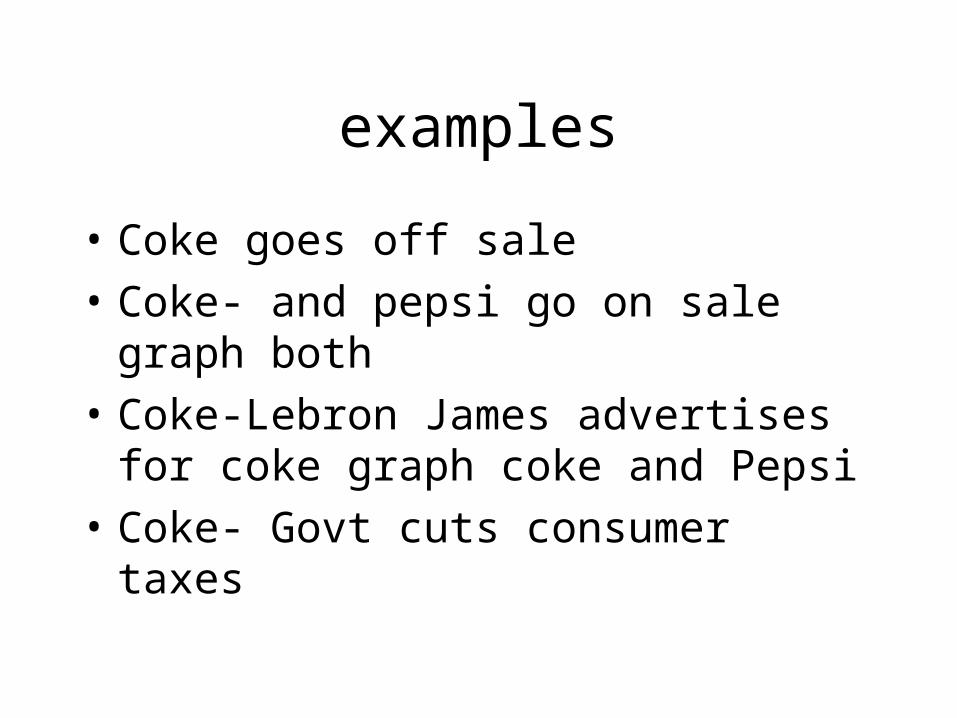
examples
• Coke goes off sale
• Coke- and pepsi go on sale graph both
• Coke-Lebron James advertises for coke graph coke and Pepsi
• Coke- Govt cuts consumer taxes
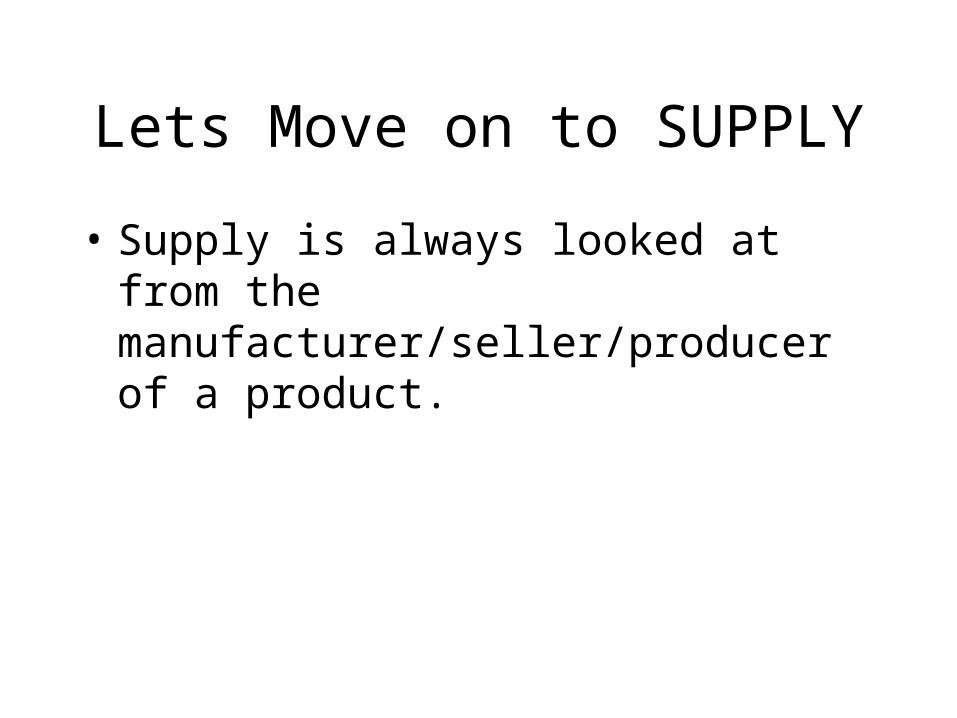
Lets Move on to SUPPLY
• Supply is always looked at from the manufacturer/seller/producer of a product.
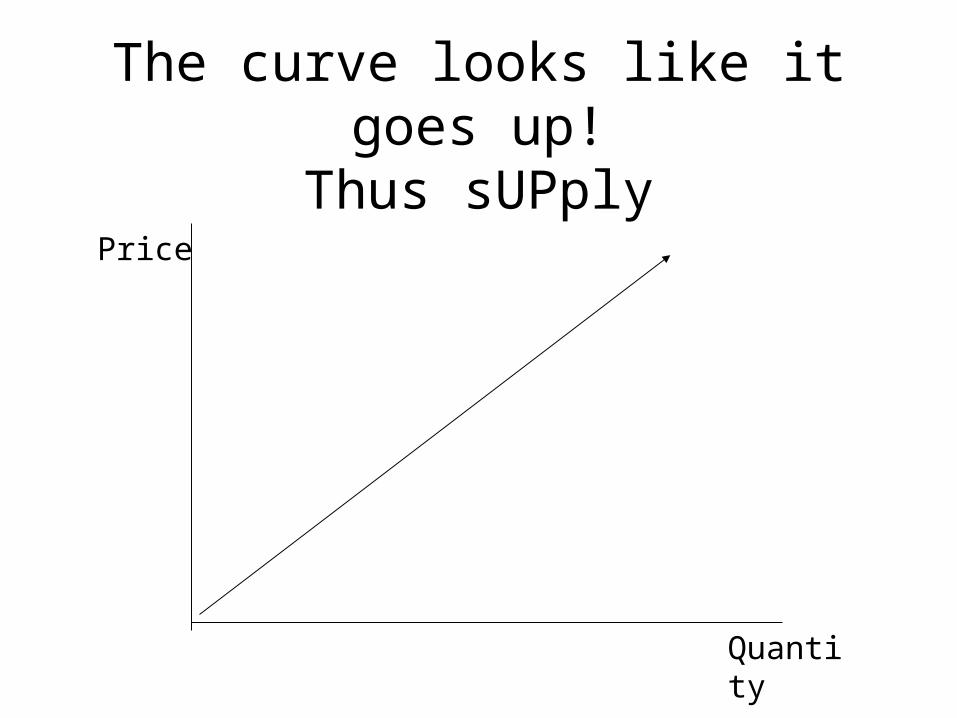
The curve looks like it goes up!Thus sUPply
Price
Quantity
© 2007 Thomson South-Western
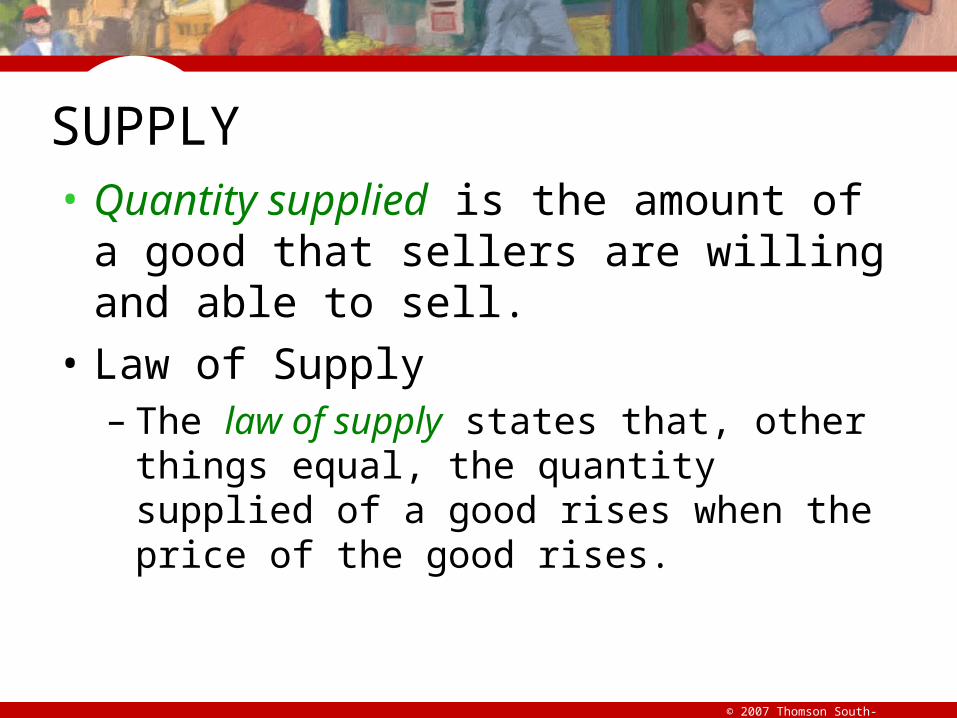
SUPPLY• Quantity supplied is the amount of a good that
sellers are willing and able to sell.
• Law of Supply– The law of supply states that, other things equal,
the quantity supplied of a good rises when the price of the good rises.
© 2007 Thomson South-Western
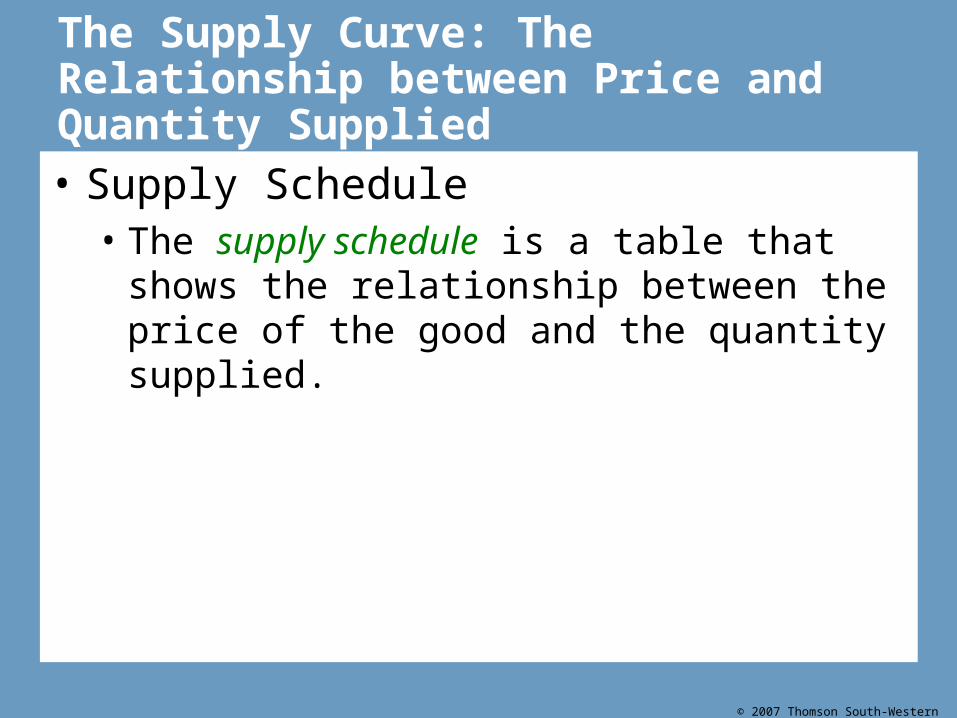
The Supply Curve: The Relationship between Price and Quantity Supplied
• Supply Schedule• The supply schedule is a table that shows the
relationship between the price of the good and the quantity supplied.
© 2007 Thomson South-Western
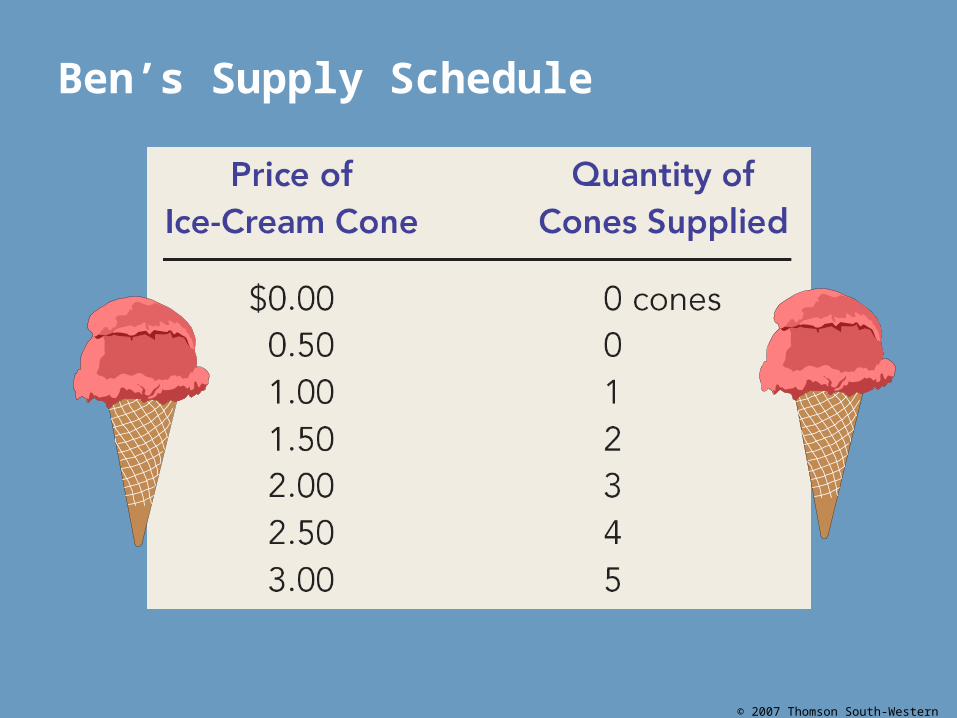
Ben’s Supply Schedule
© 2007 Thomson South-Western
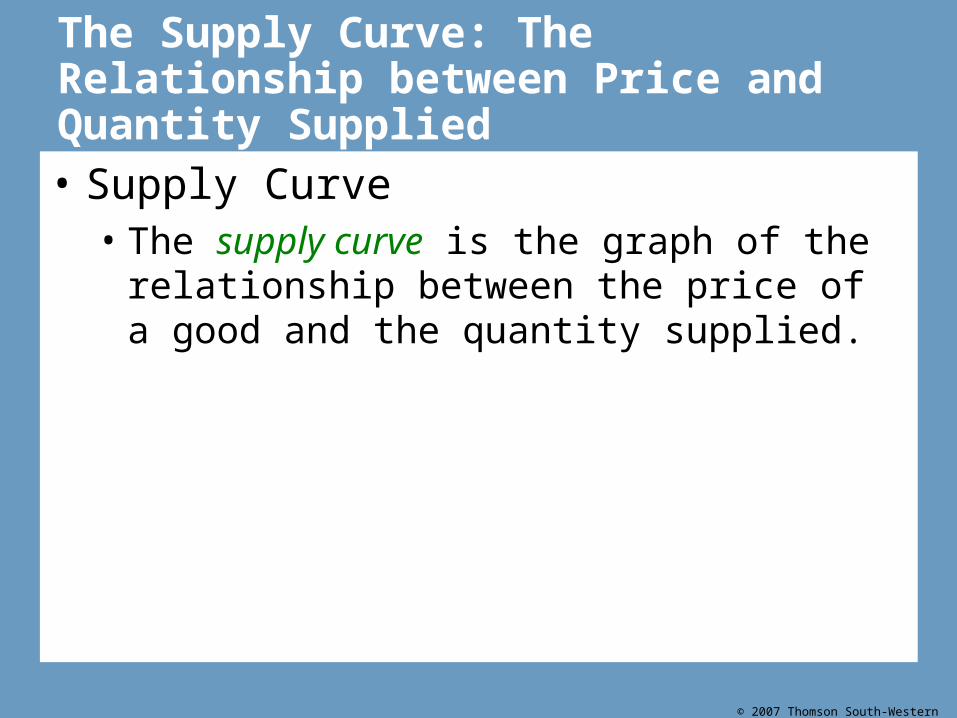
The Supply Curve: The Relationship between Price and Quantity Supplied
• Supply Curve• The supply curve is the graph of the relationship
between the price of a good and the quantity supplied.
© 2007 Thomson South-Western
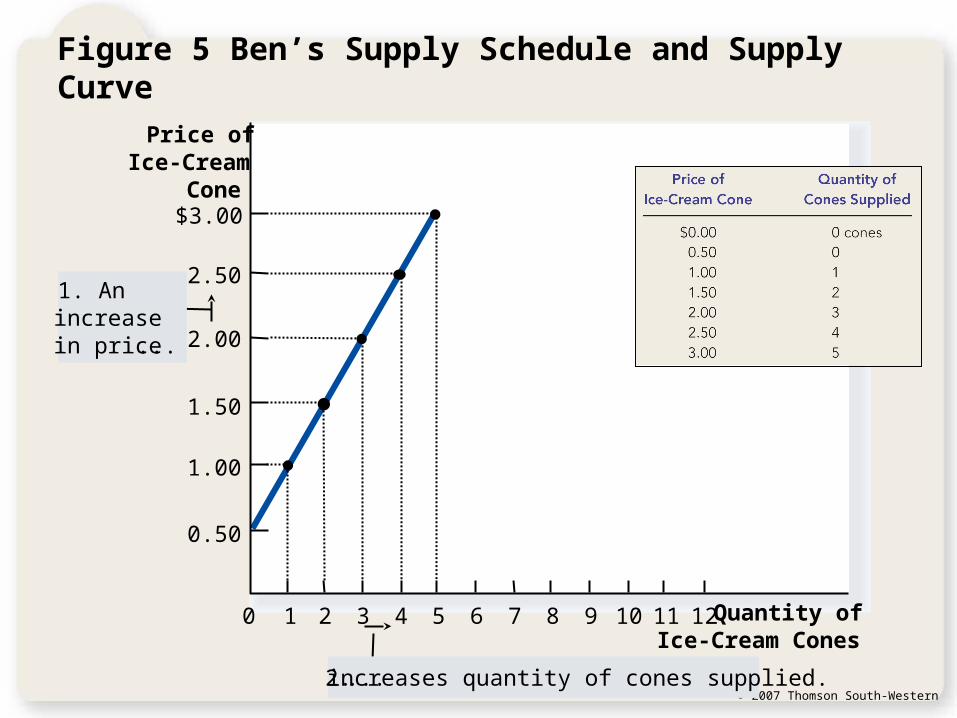
Figure 5 Ben’s Supply Schedule and Supply Curve
Price ofIce-Cream
Cone
0
2.50
2.00
1.50
1.00
1 2 3 4 5 6 7 8 9 10 11 Quantity ofIce-Cream Cones
$3.00
12
0.50
1. Anincrease in price ...
2. ... increases quantity of cones supplied.
© 2007 Thomson South-Western
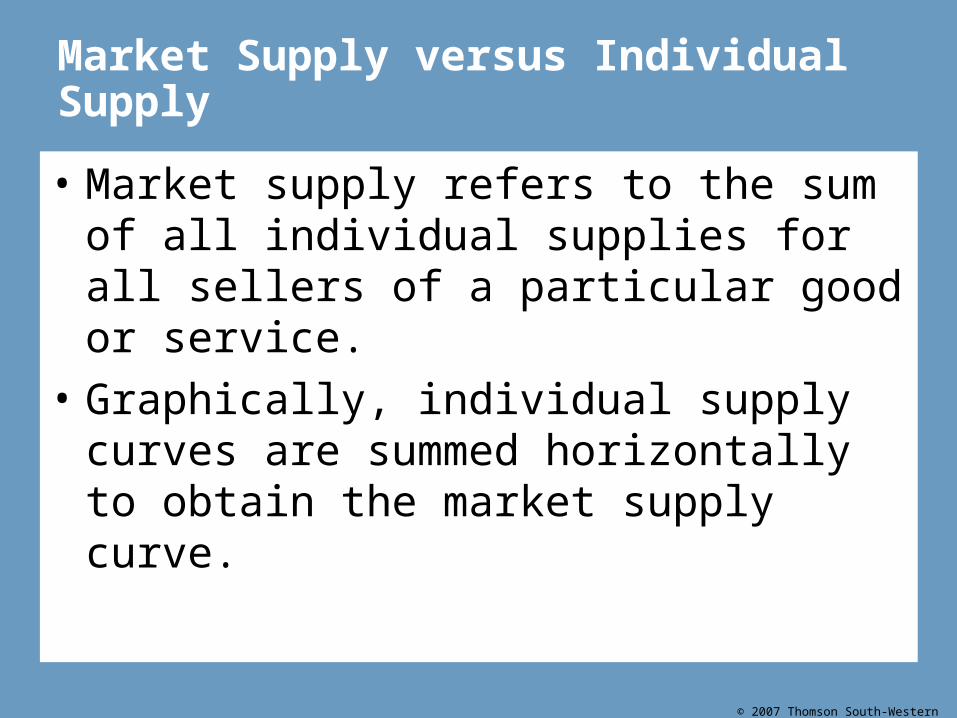
Market Supply versus Individual Supply
• Market supply refers to the sum of all individual supplies for all sellers of a particular good or service.
• Graphically, individual supply curves are summed horizontally to obtain the market supply curve.
© 2007 Thomson South-Western
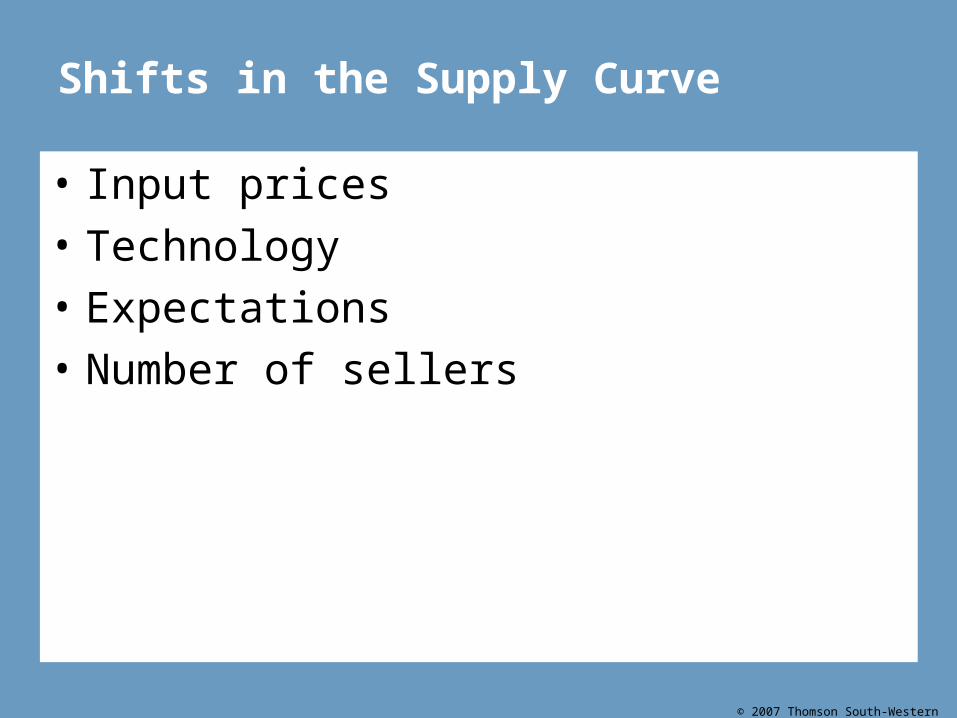
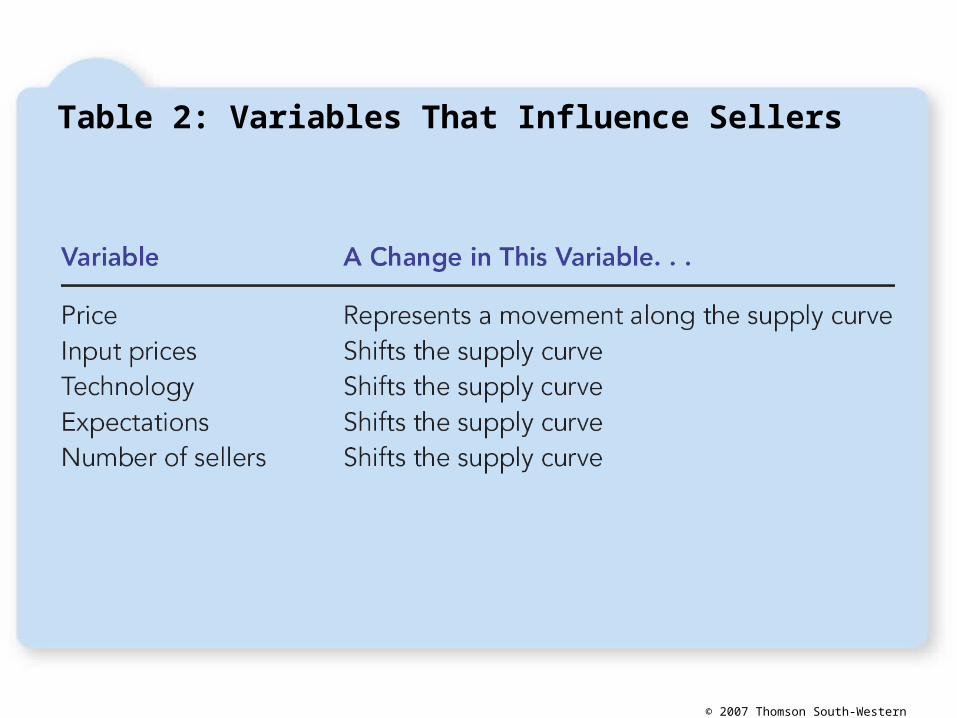
Shifts in the Supply Curve
• Input prices
• Technology
• Expectations
• Number of sellers
© 2007 Thomson South-Western
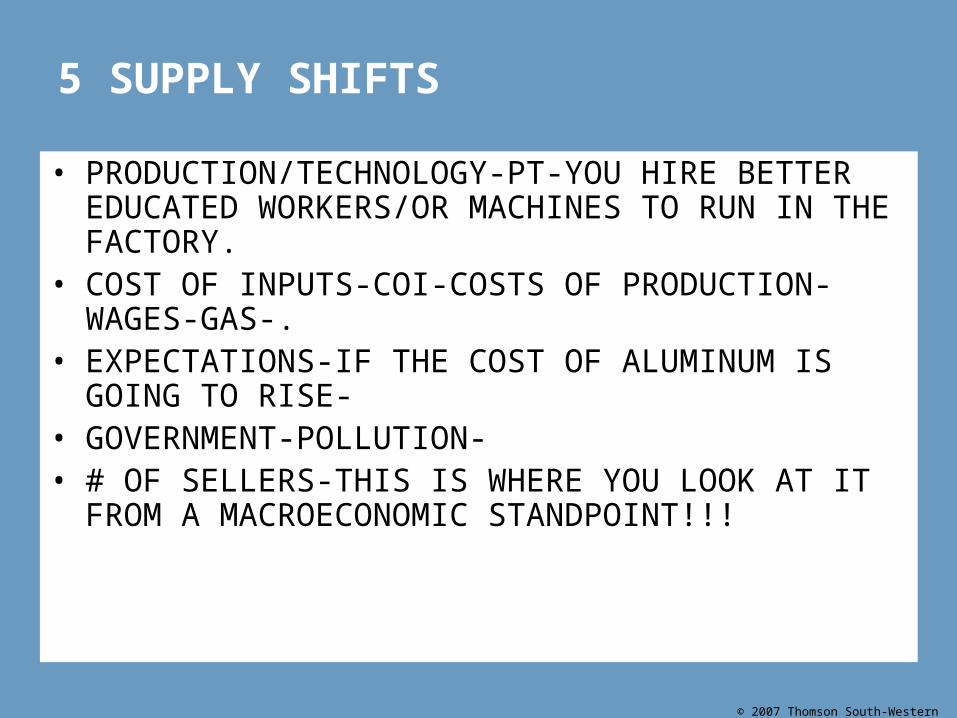
5 SUPPLY SHIFTS
• PRODUCTION/TECHNOLOGY-PT-YOU HIRE BETTER EDUCATED WORKERS/OR MACHINES TO RUN IN THE FACTORY.
• COST OF INPUTS-COI-COSTS OF PRODUCTION-WAGES-GAS-.
• EXPECTATIONS-IF THE COST OF ALUMINUM IS GOING TO RISE-
• GOVERNMENT-POLLUTION-• # OF SELLERS-THIS IS WHERE YOU LOOK AT IT FROM
A MACROECONOMIC STANDPOINT!!!
© 2007 Thomson South-Western
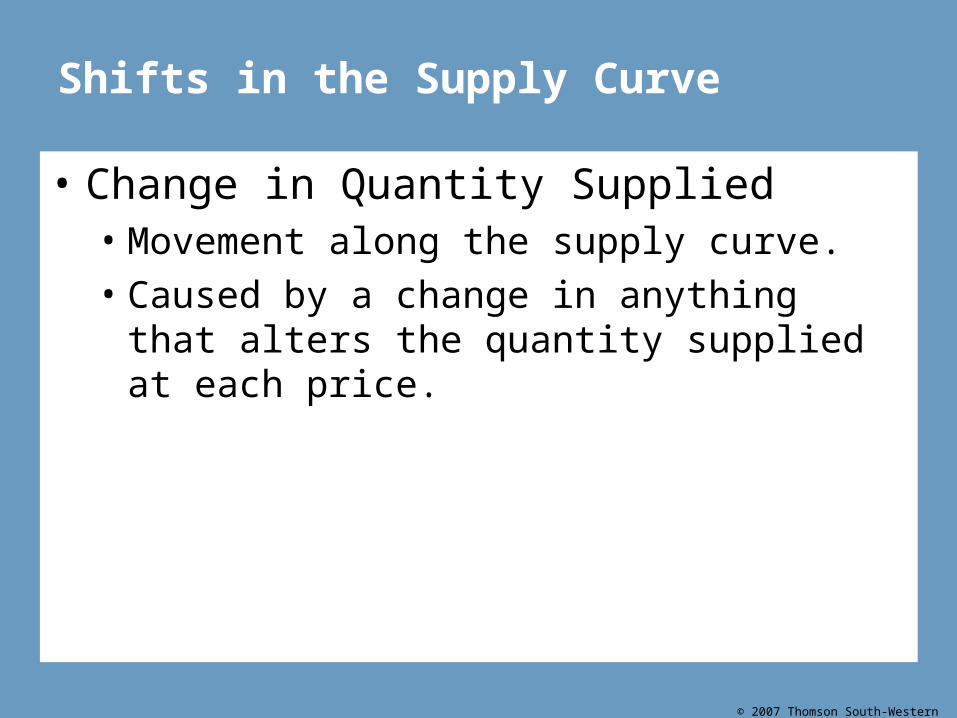
Shifts in the Supply Curve
• Change in Quantity Supplied• Movement along the supply curve.• Caused by a change in anything that alters the
quantity supplied at each price.
© 2007 Thomson South-Western
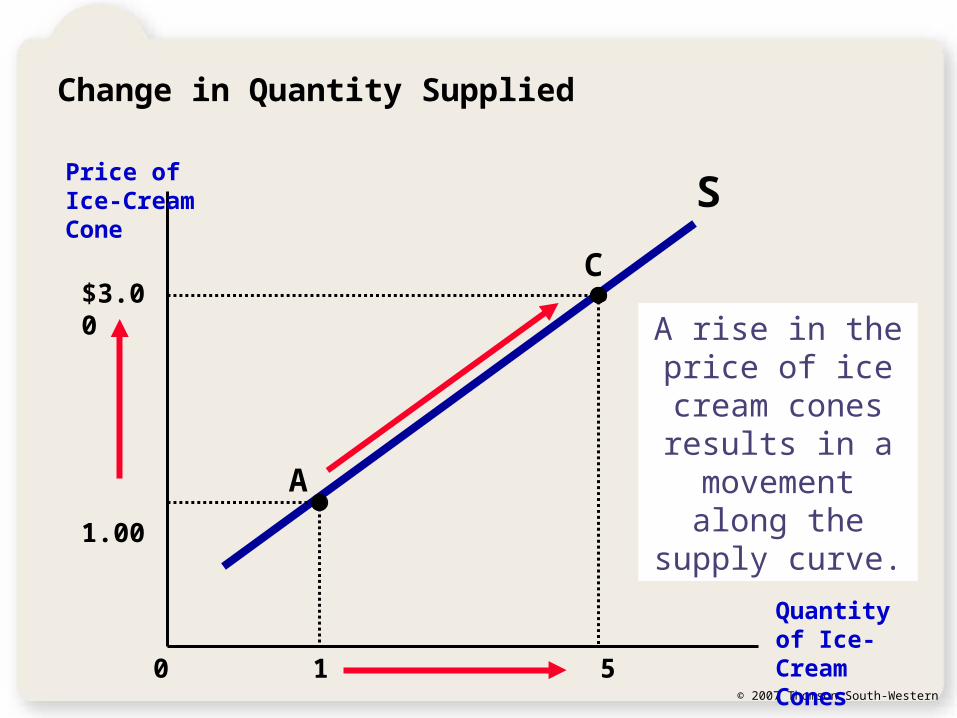
1 5
Price of Ice-Cream Cone
Quantity of Ice-Cream Cones0
S
1.00A
C$3.00 A rise in the price
of ice cream cones results in a movement along the supply curve.
Change in Quantity Supplied
© 2007 Thomson South-Western
Shifts in the Supply Curve
• Change in Supply• A shift in the supply curve, either to the left or right.
• Caused by a change in a determinant other than
price.
© 2007 Thomson South-Western
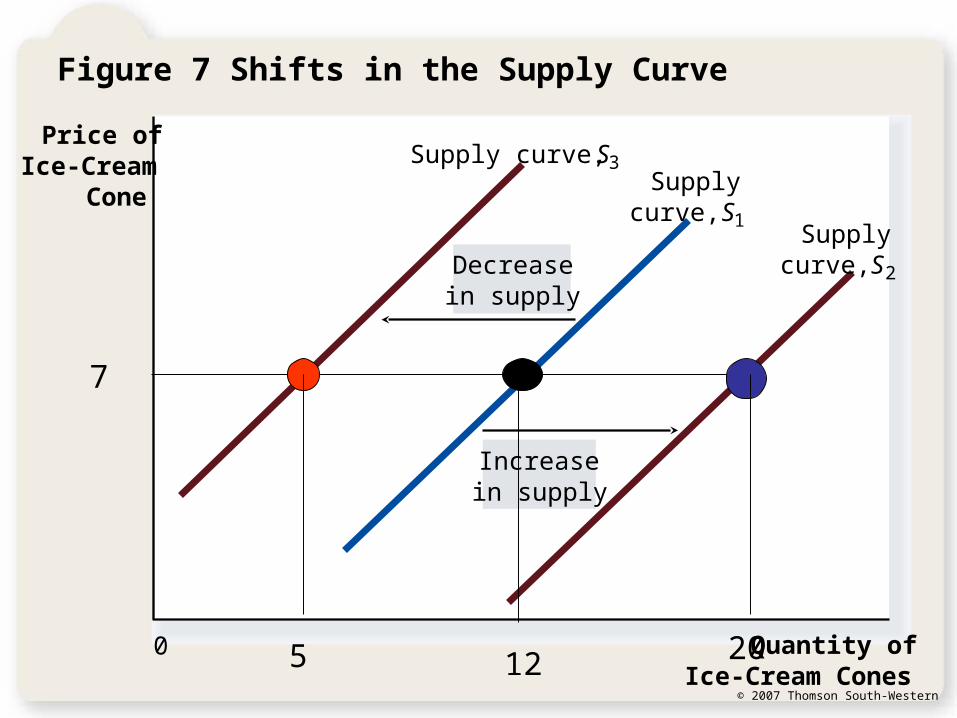
Figure 7 Shifts in the Supply Curve
Price ofIce-Cream
Cone
Quantity ofIce-Cream Cones
0
Increasein supply
Decreasein supply
Supply curve, S3
curve, Supply
S1Supply
curve, S2
7
5 12 20
© 2007 Thomson South-Western
Table 2: Variables That Influence Sellers
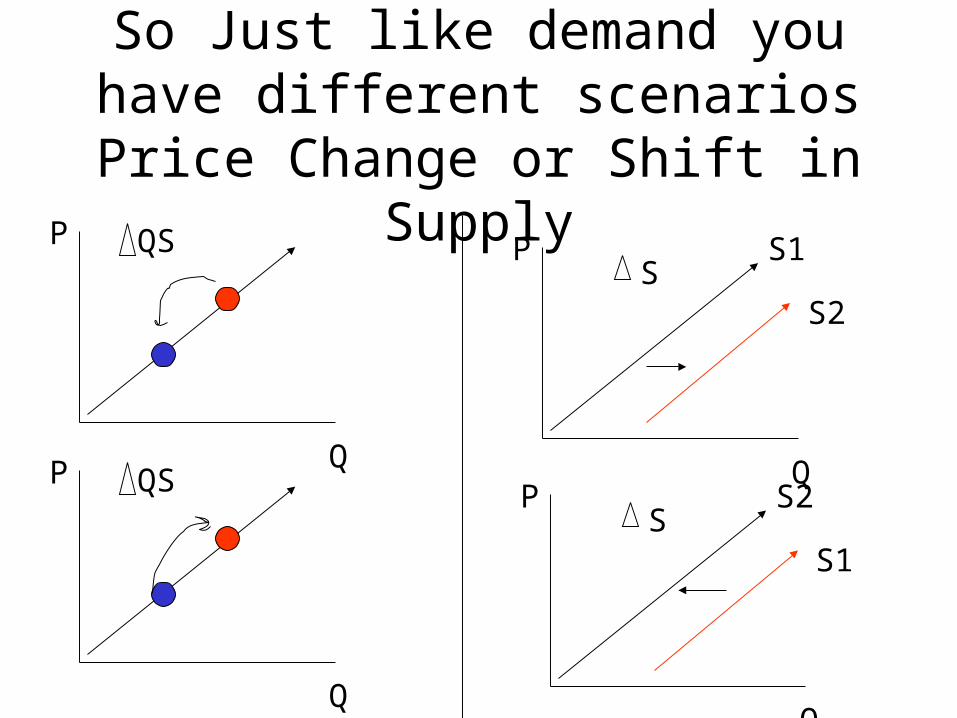
So Just like demand you have different scenarios
Price Change or Shift in SupplyP
Q
QS
P
Q
QS
P
Q
SS2
S1
P
Q
SS1
S2
SOFT DRINK INDUSTRYCOKE GOES OUT OF BUSINESS
S1S2
S
6
8 15
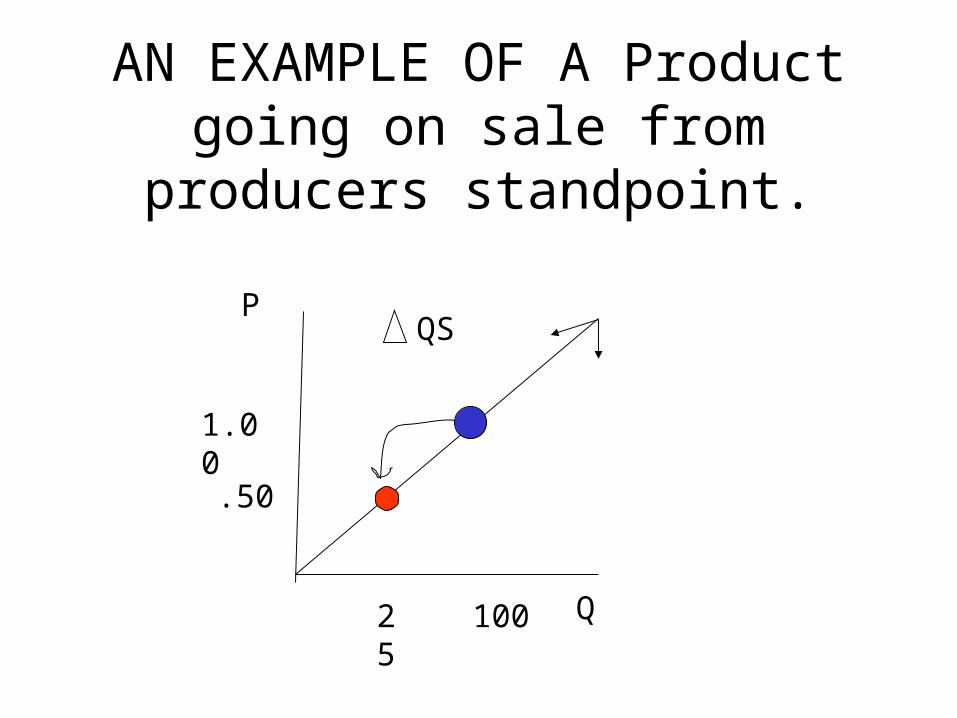
AN EXAMPLE OF A Product going on sale from producers standpoint.
1.00
100
P
Q
.50
25
QS
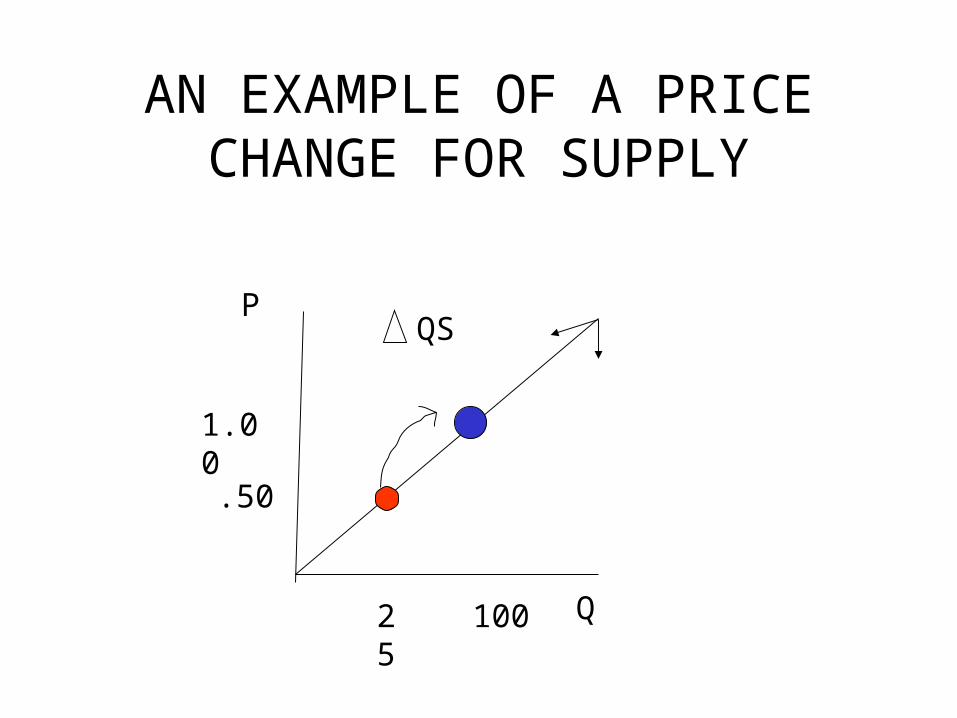
AN EXAMPLE OF A PRICE CHANGE FOR SUPPLY
1.00
100
P
Q
.50
25
QS
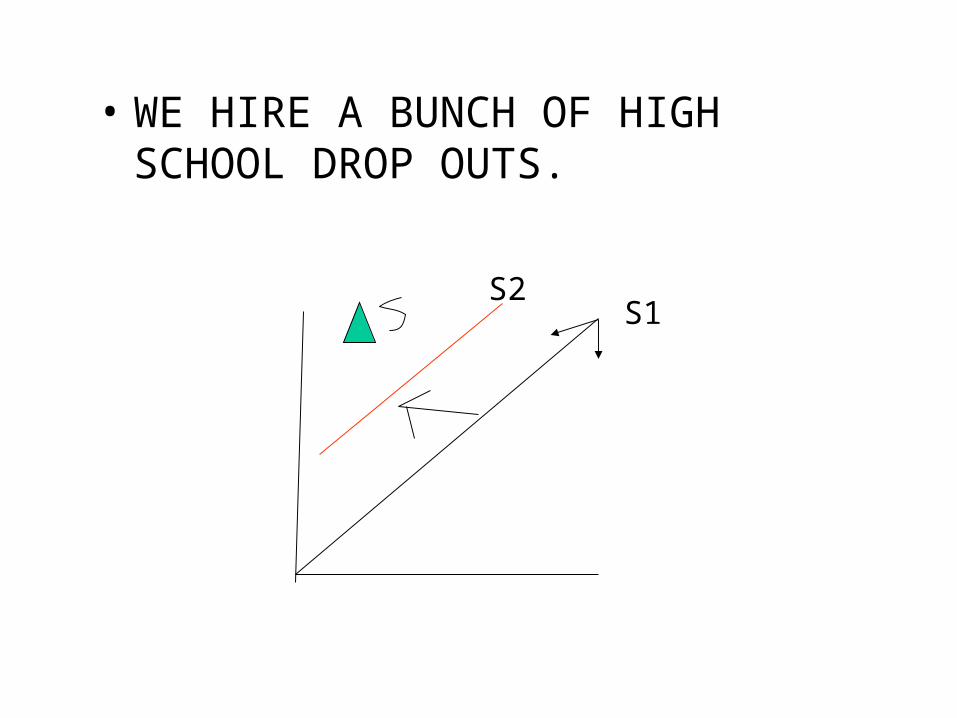
• WE HIRE A BUNCH OF HIGH SCHOOL DROP OUTS.
S1S2
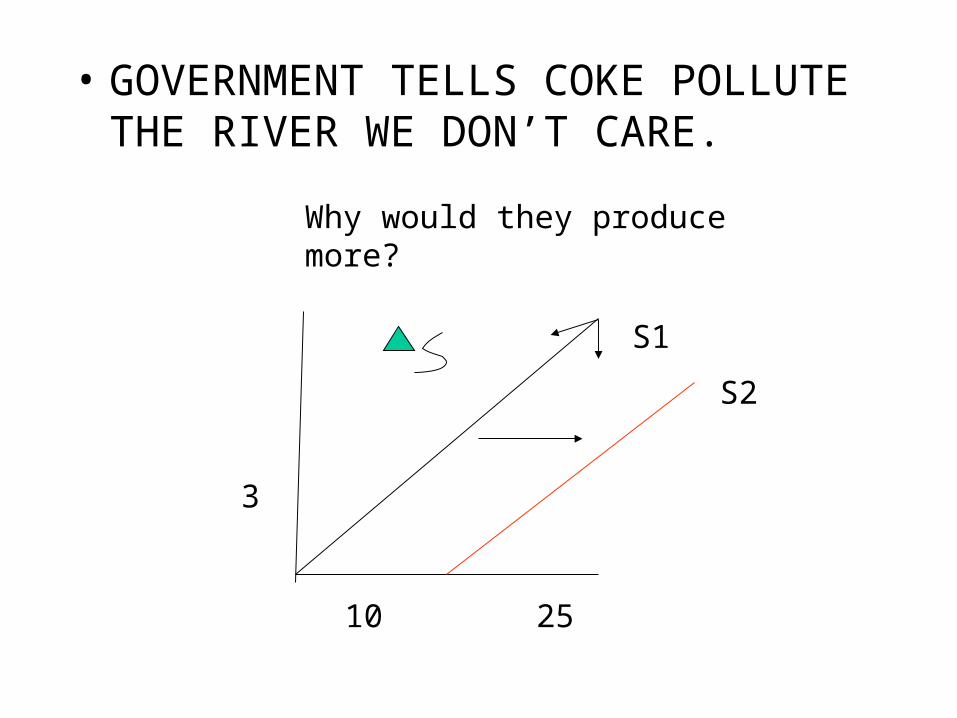
• GOVERNMENT TELLS COKE POLLUTE THE RIVER WE DON’T CARE.
S1
S2
Why would they produce more?
3
10 25
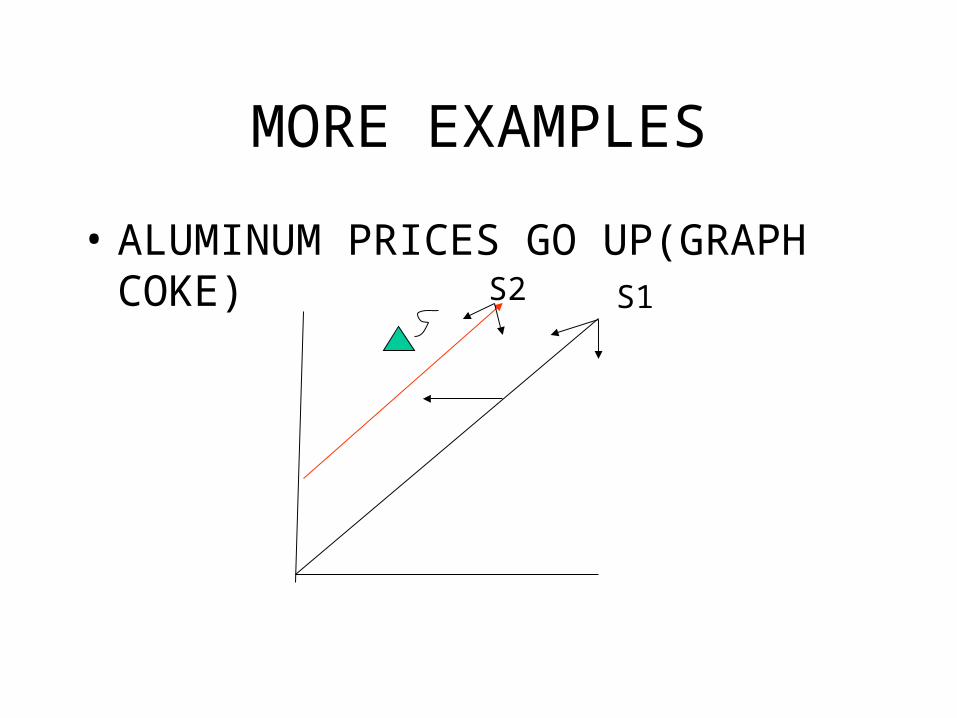
MORE EXAMPLES
• ALUMINUM PRICES GO UP(GRAPH COKE) S1S2
MORE EXAMPLES
• MINIMUM WAGE GOES UP GRAPH COKE!( GRAPH TWO OF THEM!!
• COKE LOWERS ITS PRICE GRAPH IT FROM A SUPPLIER AND CONSUMER STANDPOINT
• Coke raises its price-graph both curves!!!!!please get it right!!!
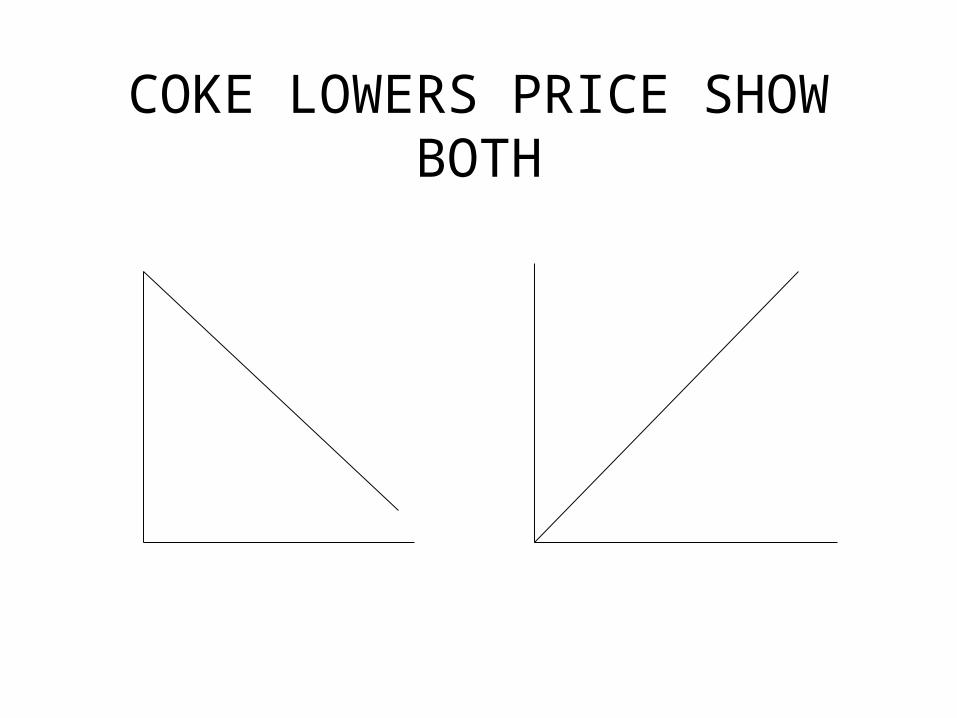
COKE LOWERS PRICE SHOW BOTH
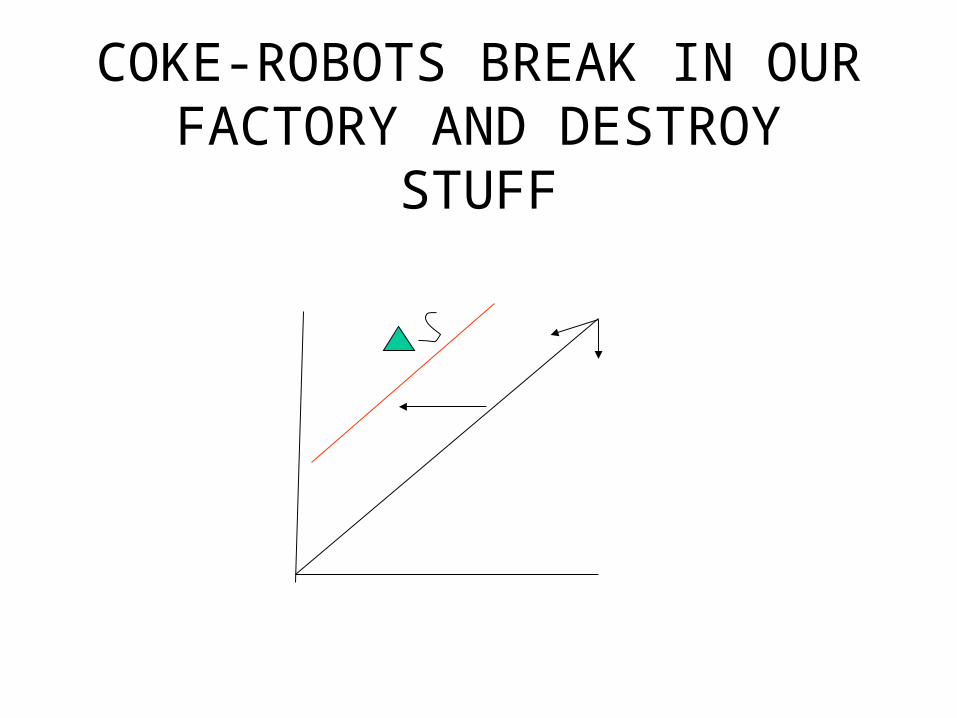
COKE-ROBOTS BREAK IN OUR FACTORY AND DESTROY
STUFF
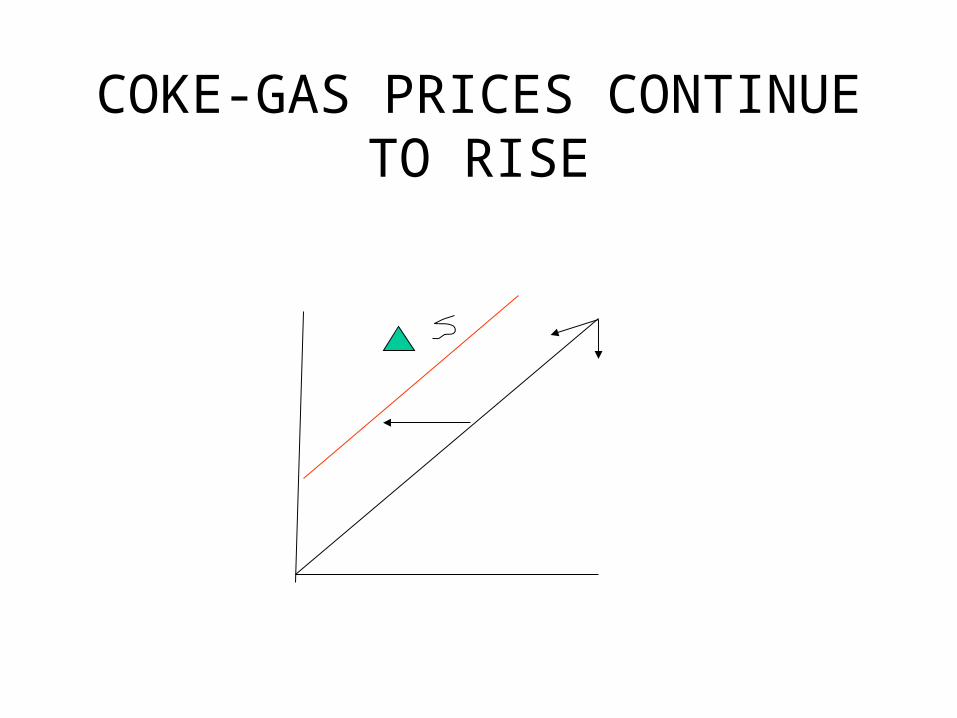
COKE-GAS PRICES CONTINUE TO RISE
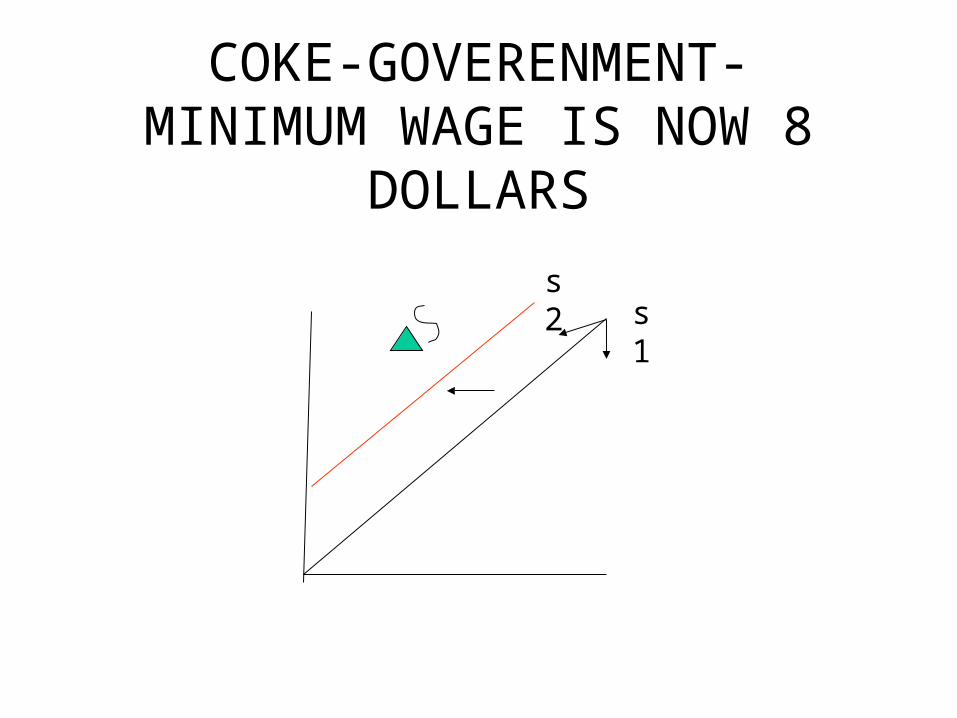
COKE-GOVERENMENT- MINIMUM WAGE IS NOW 8
DOLLARS
s1s2
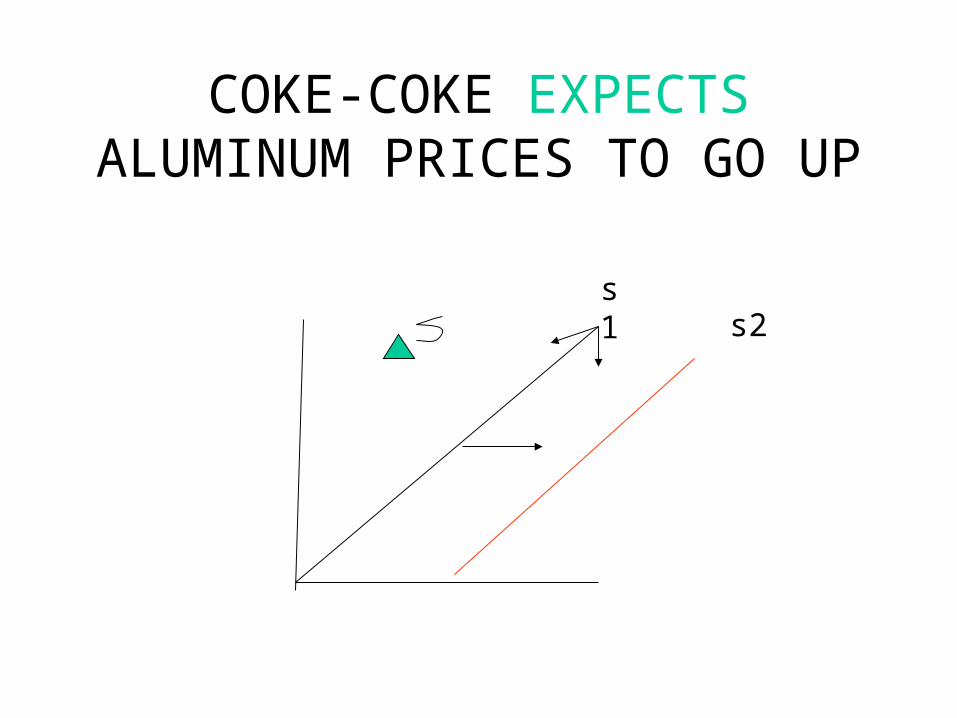
COKE-COKE EXPECTS ALUMINUM PRICES TO GO UP
s1s2
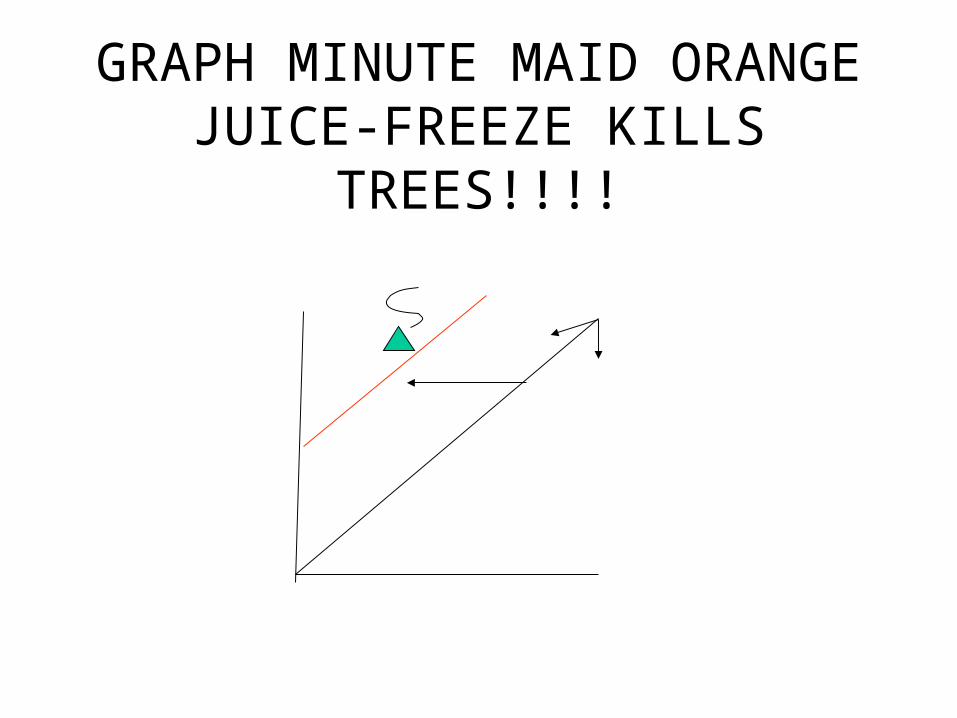
GRAPH MINUTE MAID ORANGE JUICE-FREEZE KILLS TREES!!!!
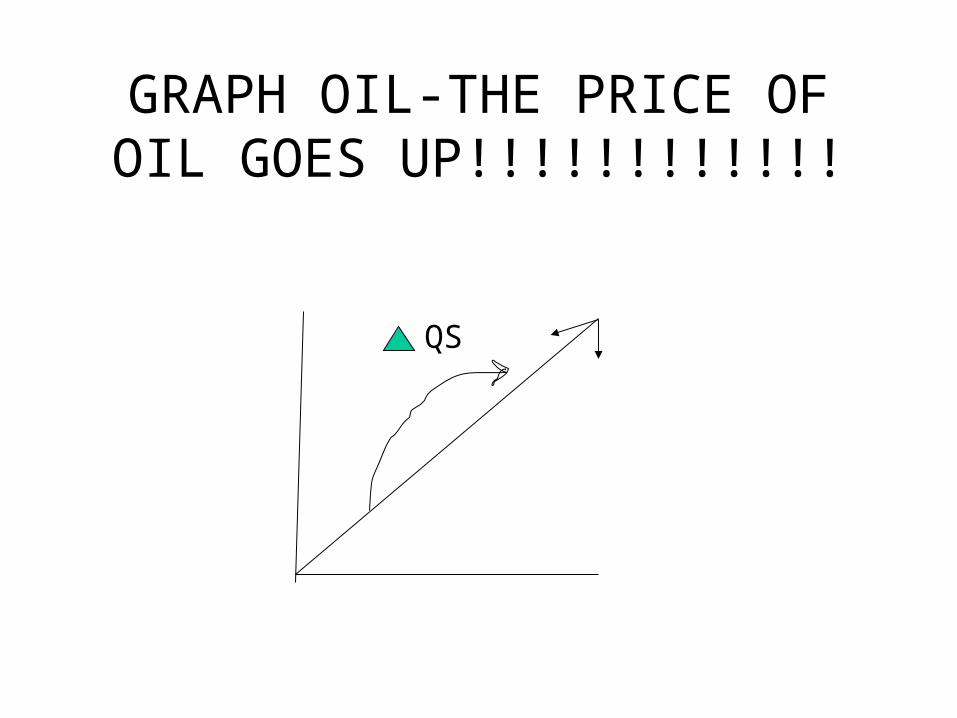
GRAPH OIL-THE PRICE OF OIL GOES UP!!!!!!!!!!!!
QS
Get Board and Markers and get started. I know you did it yesterday.
It is good practice.• 1. Show 100 people wanting coke for 2 dollars.• 2. Show coke producing 200 cokes for 3 dollars.• 3. Show coke producing 300 cokes for 4 dollars and then
the price going up to 5 dollars and them producing 600.• 4. Show 1000 people wanting ipods at 50 dollars and then
their price going up to 299 and 200 people wanting them.• 5. Show 1000 people wanting ipods at 200 dollars and then
they are found to cause cancer so only 100 people want them.
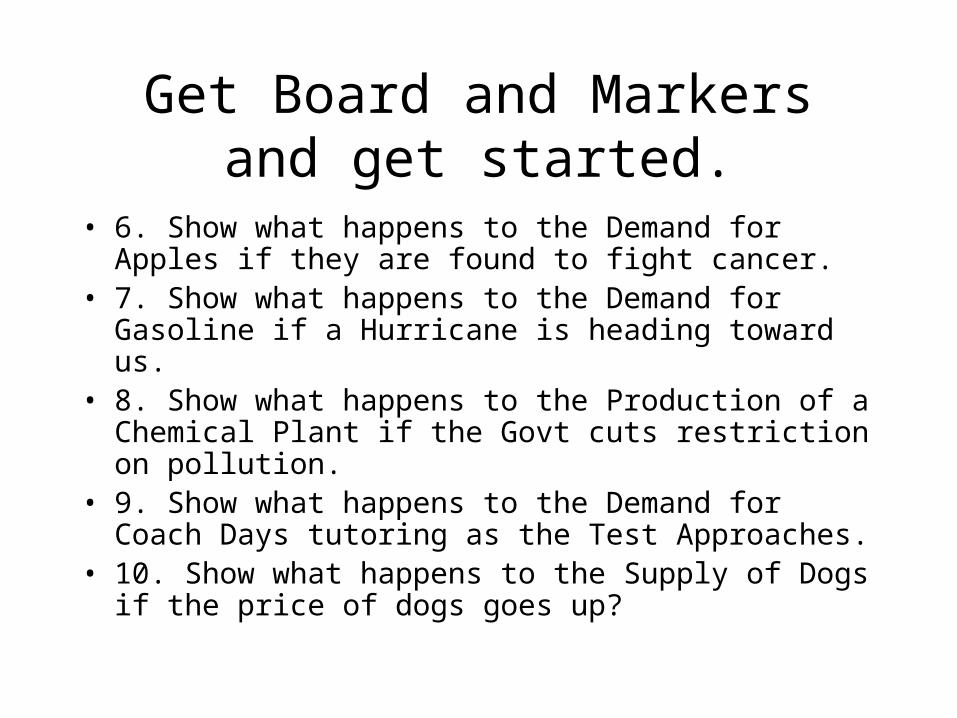
• 6. Show what happens to the Demand for Apples if they are found to fight cancer.
• 7. Show what happens to the Demand for Gasoline if a Hurricane is heading toward us.
• 8. Show what happens to the Production of a Chemical Plant if the Govt cuts restriction on pollution.
• 9. Show what happens to the Demand for Coach Days tutoring as the Test Approaches.
• 10. Show what happens to the Supply of Dogs if the price of dogs goes up?
Get Board and Markers and get started.
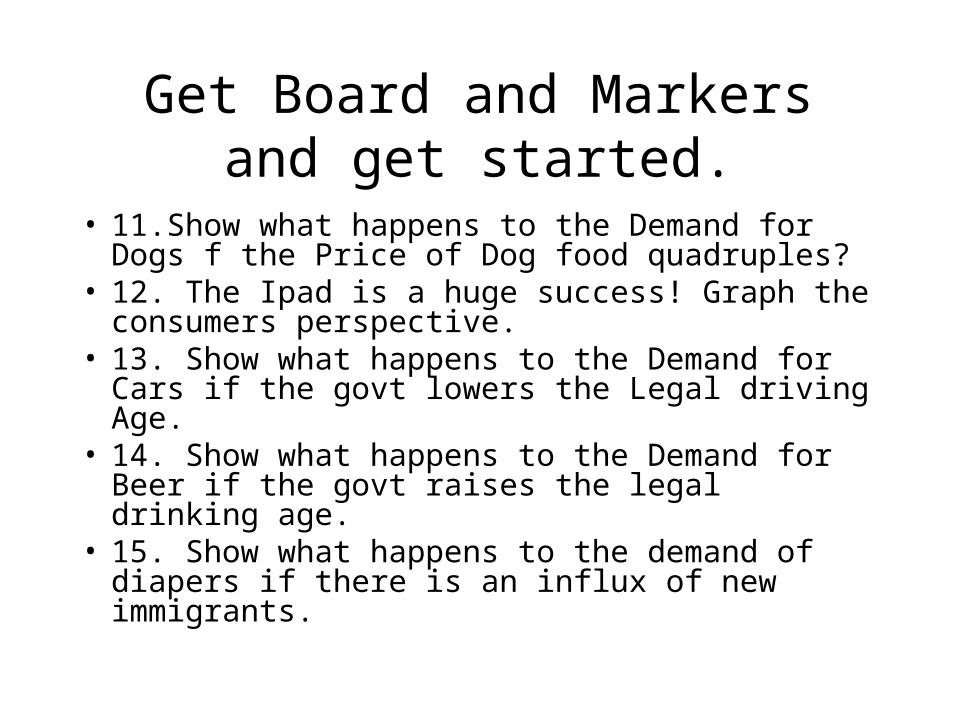
• 11.Show what happens to the Demand for Dogs f the Price of Dog food quadruples?
• 12. The Ipad is a huge success! Graph the consumers perspective.
• 13. Show what happens to the Demand for Cars if the govt lowers the Legal driving Age.
• 14. Show what happens to the Demand for Beer if the govt raises the legal drinking age.
• 15. Show what happens to the demand of diapers if there is an influx of new immigrants.
Get Board and Markers and get started.
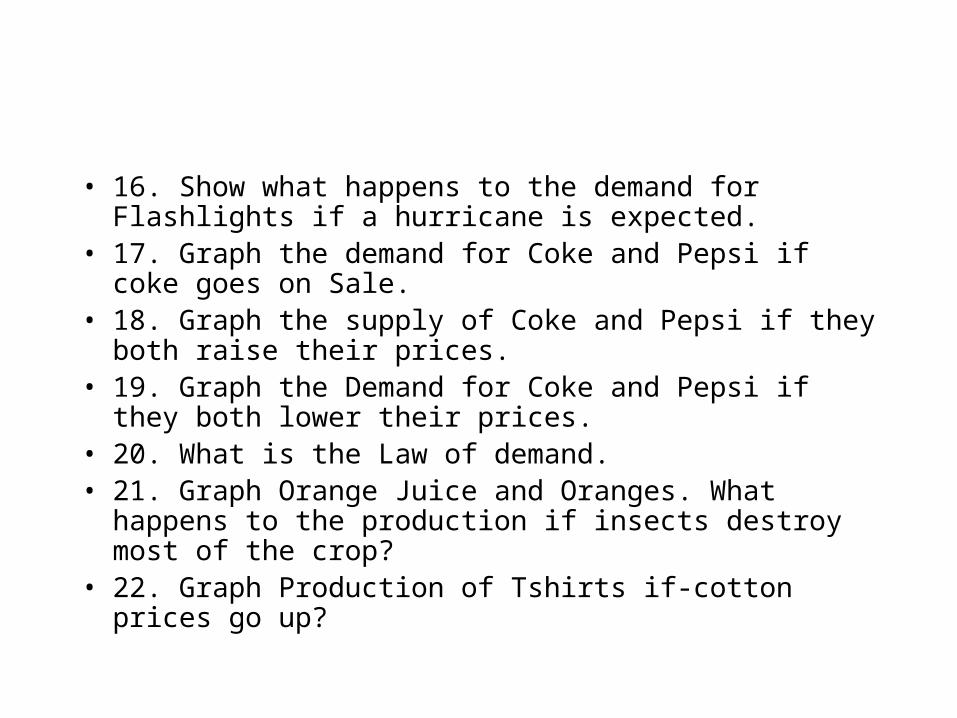
• 16. Show what happens to the demand for Flashlights if a hurricane is expected.
• 17. Graph the demand for Coke and Pepsi if coke goes on Sale.
• 18. Graph the supply of Coke and Pepsi if they both raise their prices.
• 19. Graph the Demand for Coke and Pepsi if they both lower their prices.
• 20. What is the Law of demand.• 21. Graph Orange Juice and Oranges. What happens to the
production if insects destroy most of the crop?• 22. Graph Production of Tshirts if-cotton prices go up?
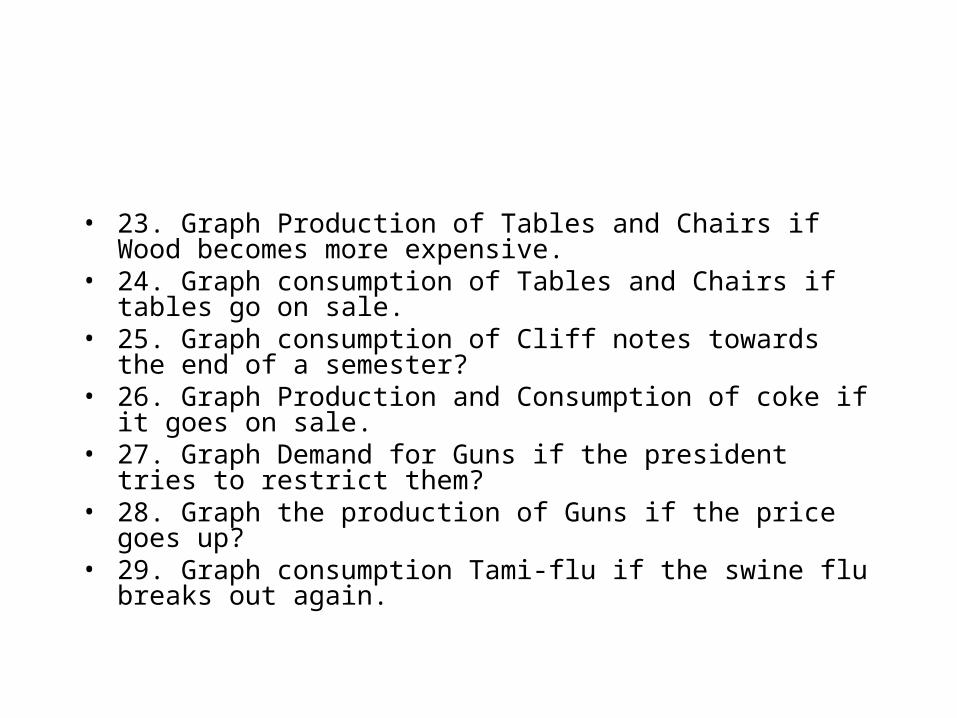
• 23. Graph Production of Tables and Chairs if Wood becomes more expensive.
• 24. Graph consumption of Tables and Chairs if tables go on sale.• 25. Graph consumption of Cliff notes towards the end of a semester?• 26. Graph Production and Consumption of coke if it goes on sale.• 27. Graph Demand for Guns if the president tries to restrict them?• 28. Graph the production of Guns if the price goes up?• 29. Graph consumption Tami-flu if the swine flu breaks out again.
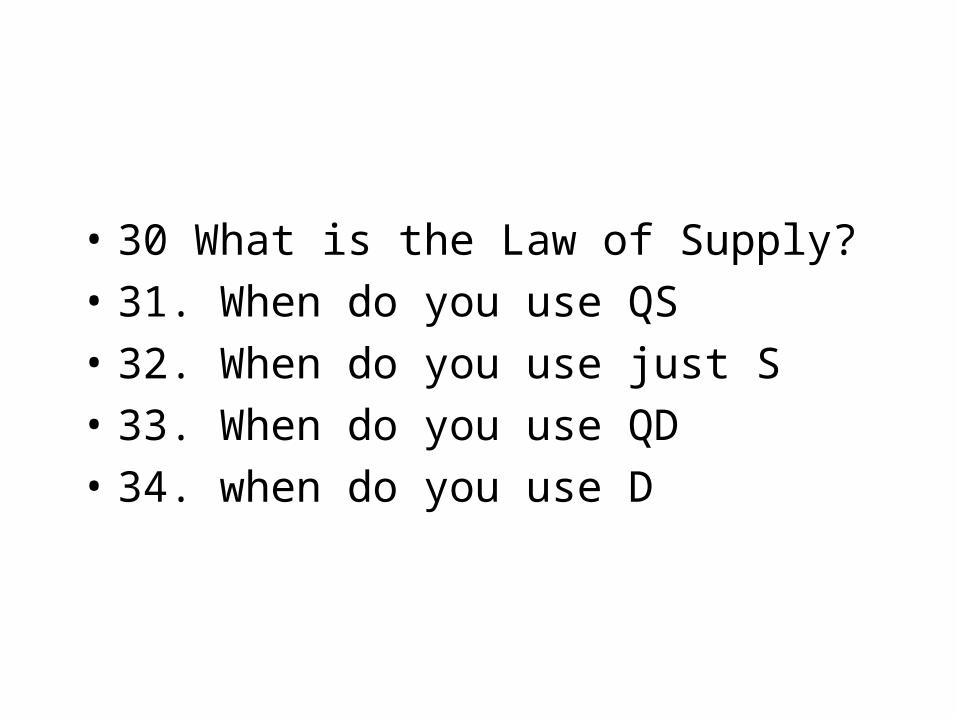
• 30 What is the Law of Supply?
• 31. When do you use QS
• 32. When do you use just S
• 33. When do you use QD
• 34. when do you use D
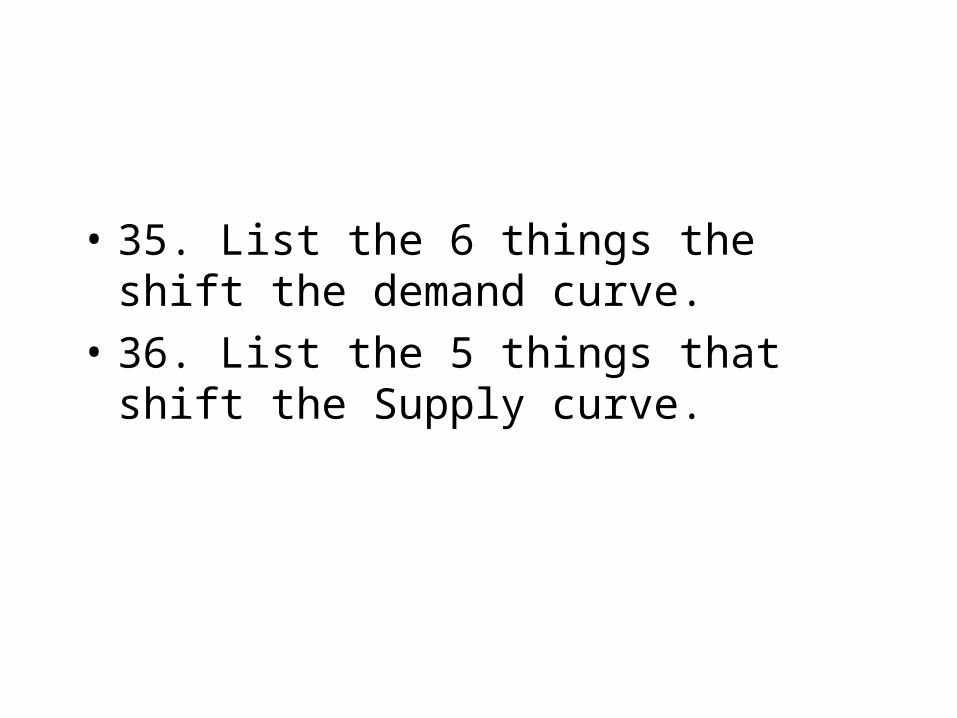
• 35. List the 6 things the shift the demand curve.
• 36. List the 5 things that shift the Supply curve.

Practice»
» Cars Trucks
• Mexico 1000 2000
• USA 300 300• 37.AAC• 38.AAT• 39.CAC• 40.CAT• 41.What does it cost Mexico to make 1 truck?• 42.Who imports Cars?
Practice»
» Cars Trucks
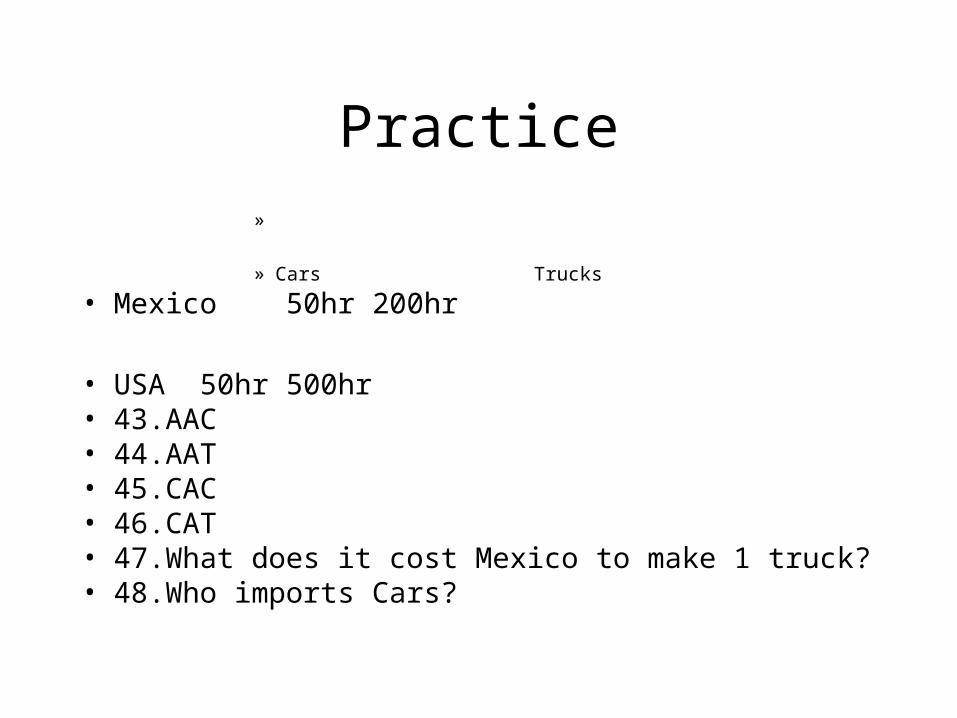
• Mexico 50hr 200hr
• USA 50hr 500hr• 43.AAC• 44.AAT• 45.CAC• 46.CAT• 47.What does it cost Mexico to make 1 truck?• 48.Who imports Cars?
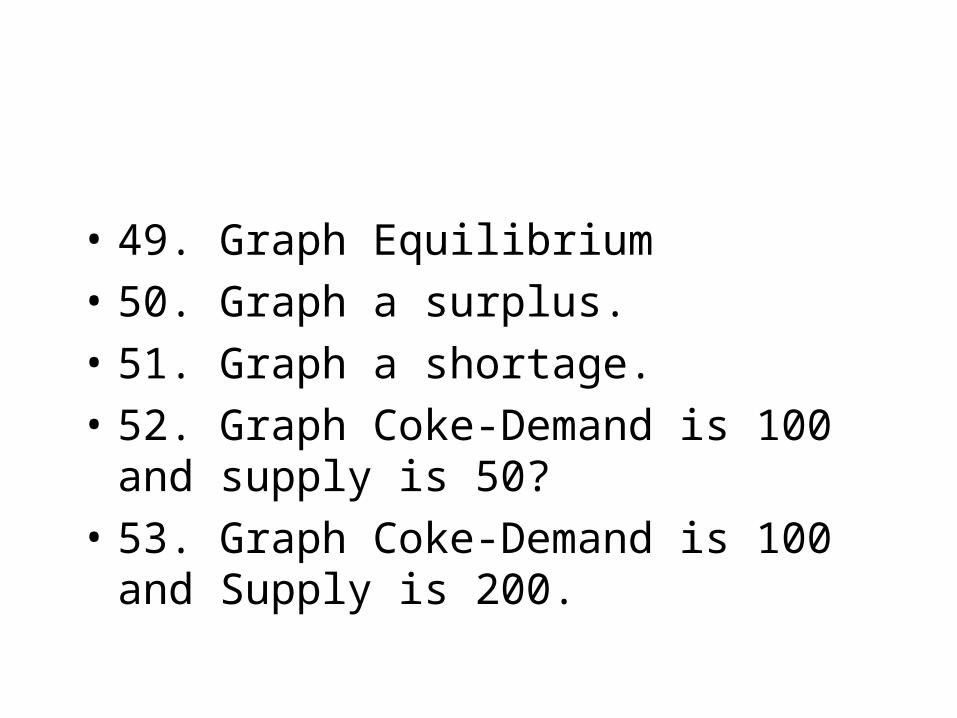
• 49. Graph Equilibrium
• 50. Graph a surplus.
• 51. Graph a shortage.
• 52. Graph Coke-Demand is 100 and supply is 50?
• 53. Graph Coke-Demand is 100 and Supply is 200.
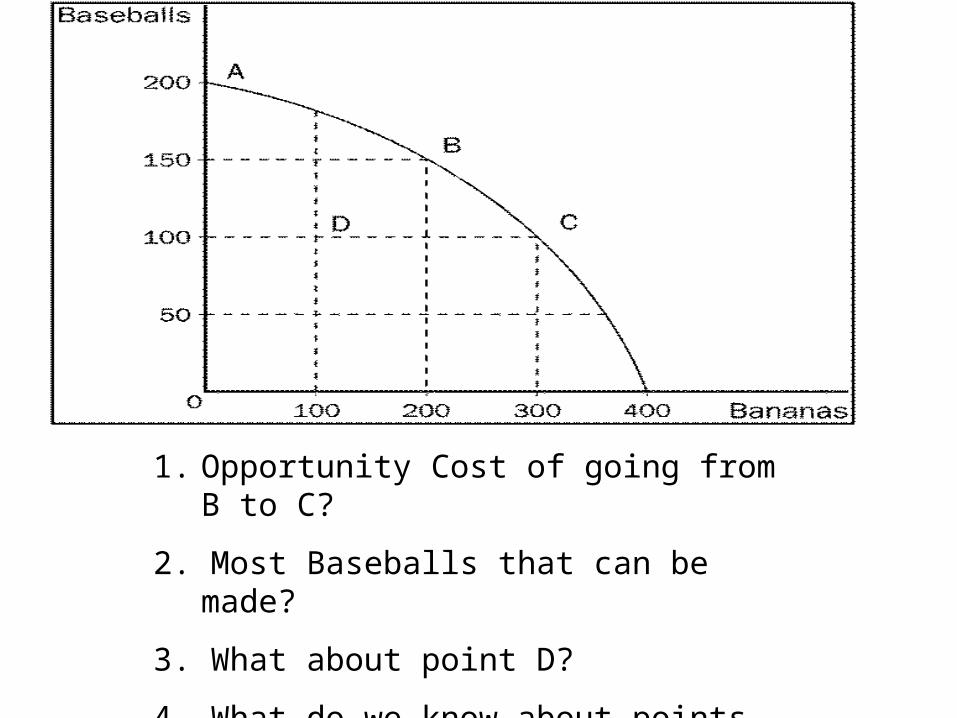
1. Opportunity Cost of going from B to C?
2. Most Baseballs that can be made?
3. What about point D?
4. What do we know about points A, B, C?
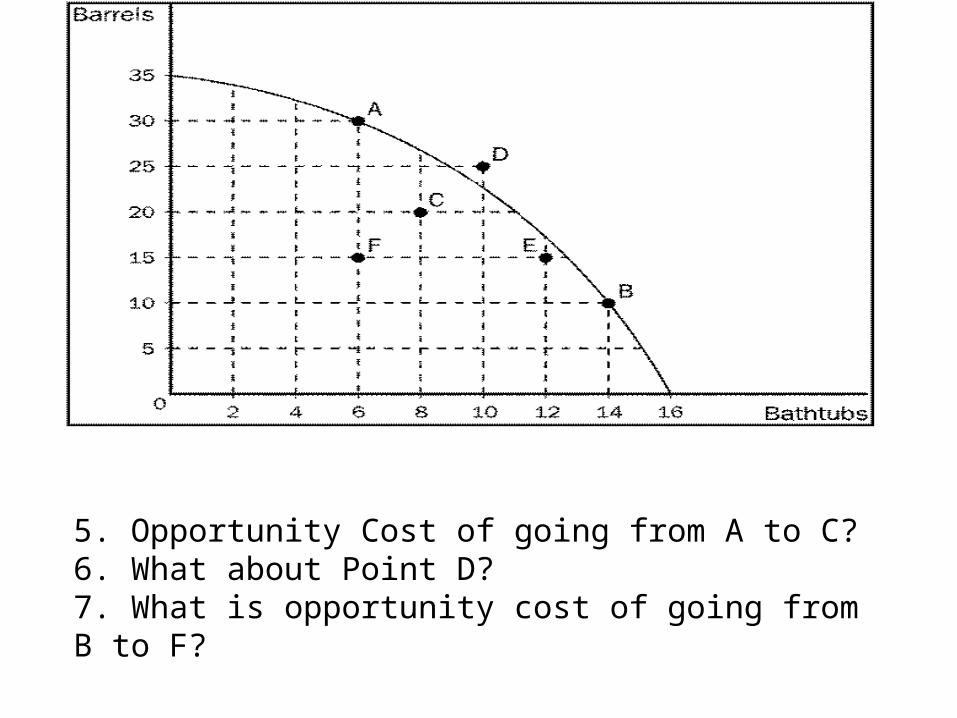
5. Opportunity Cost of going from A to C?6. What about Point D?7. What is opportunity cost of going from B to F?
CAFÉ EQUILIBRIUM
• SUEPLY AND DEMAN FINNALY MEET AT EQUILIBRIUM. HOW SWEET NOW EVERYONE IS HAPPY.
• CONSUMERS HAVE ENOUGH PRODUCTS AND SUPPLIERS HAVE SOLD ALL THAT THEY HAVE MADE
© 2007 Thomson South-Western
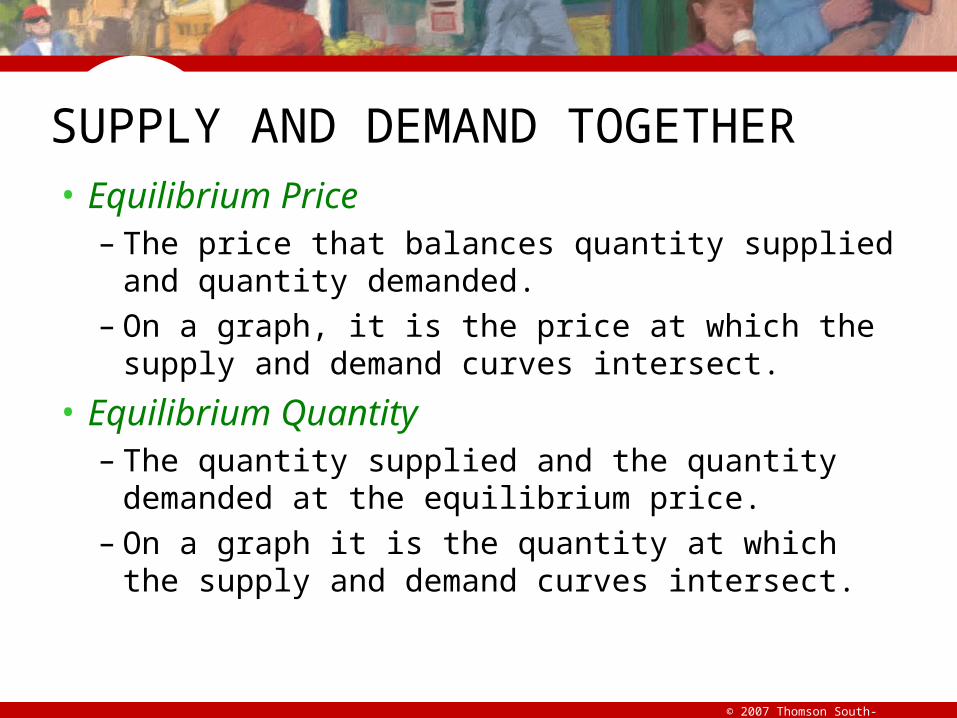
SUPPLY AND DEMAND TOGETHER
• Equilibrium refers to a situation in which the price has reached the level where quantity supplied equals quantity demanded.
© 2007 Thomson South-Western
SUPPLY AND DEMAND TOGETHER
• Equilibrium Price– The price that balances quantity supplied and quantity
demanded. – On a graph, it is the price at which the supply and
demand curves intersect.
• Equilibrium Quantity– The quantity supplied and the quantity demanded at
the equilibrium price. – On a graph it is the quantity at which the supply and
demand curves intersect.
© 2007 Thomson South-Western
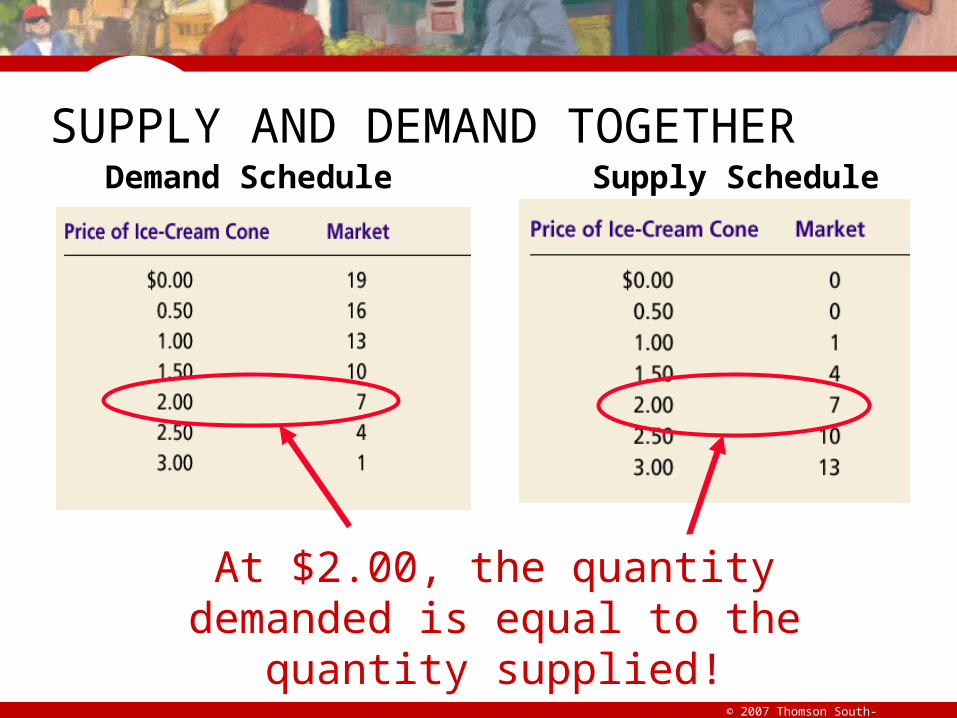
At $2.00, the quantity demanded is equal to the quantity supplied!
SUPPLY AND DEMAND TOGETHERDemand Schedule
Supply Schedule
© 2007 Thomson South-Western
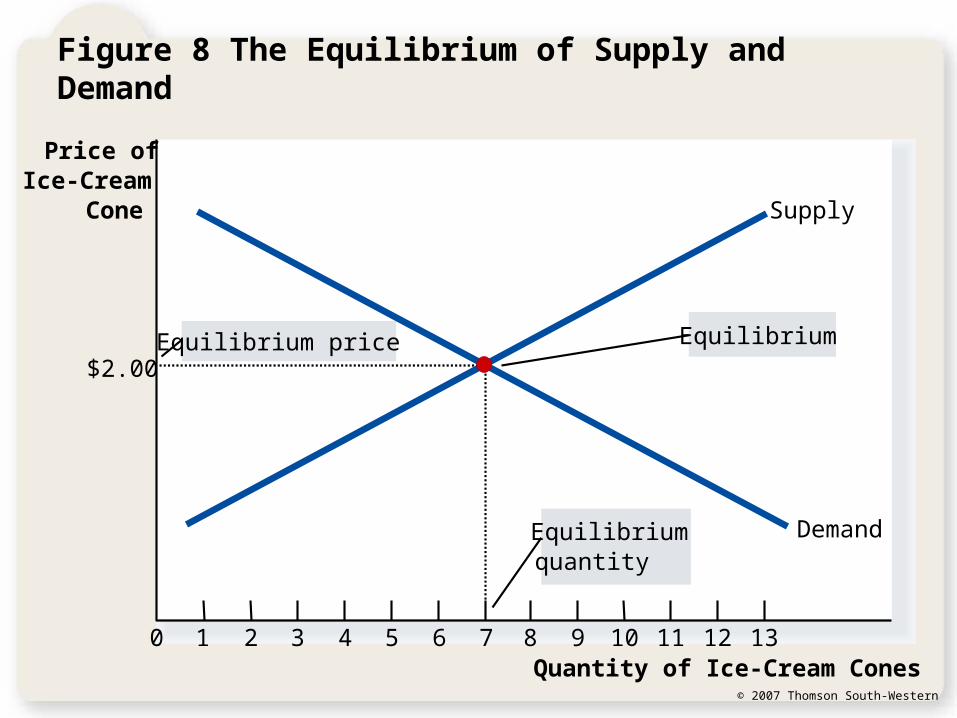
Figure 8 The Equilibrium of Supply and Demand
Price ofIce-Cream
Cone
0 1 2 3 4 5 6 7 8 9 10 11 12Quantity of Ice-Cream Cones
13
Equilibriumquantity
Equilibrium price Equilibrium
Supply
Demand
$2.00
© 2007 Thomson South-Western
• Song link
© 2007 Thomson South-Western
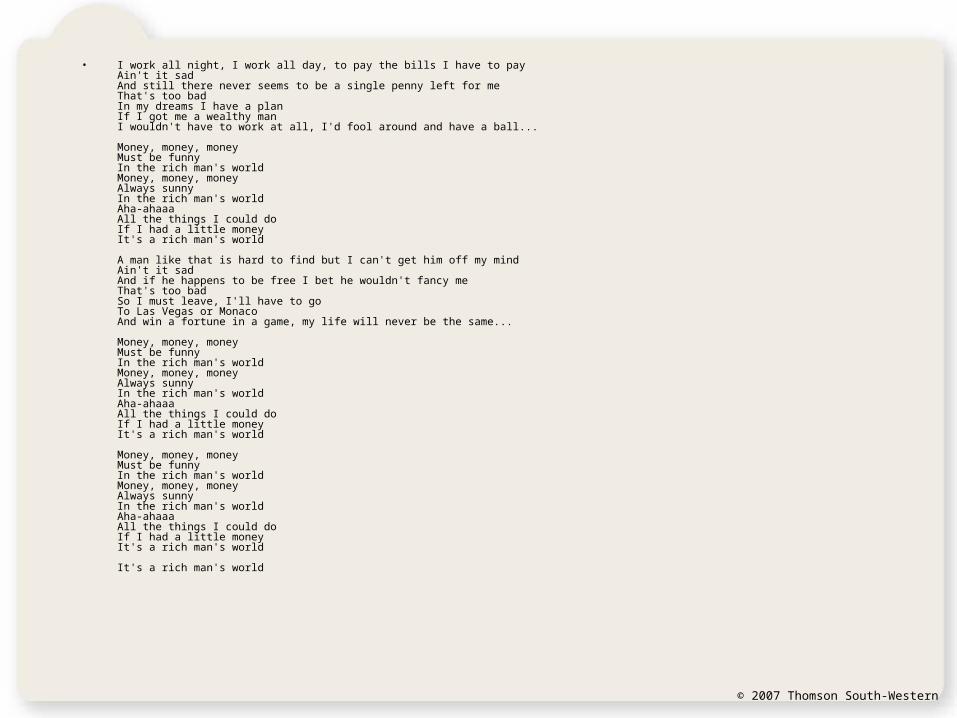
• I work all night, I work all day, to pay the bills I have to payAin't it sadAnd still there never seems to be a single penny left for meThat's too badIn my dreams I have a planIf I got me a wealthy manI wouldn't have to work at all, I'd fool around and have a ball...
Money, money, moneyMust be funnyIn the rich man's worldMoney, money, moneyAlways sunnyIn the rich man's worldAha-ahaaaAll the things I could doIf I had a little moneyIt's a rich man's world
A man like that is hard to find but I can't get him off my mindAin't it sadAnd if he happens to be free I bet he wouldn't fancy meThat's too badSo I must leave, I'll have to goTo Las Vegas or MonacoAnd win a fortune in a game, my life will never be the same...
Money, money, moneyMust be funnyIn the rich man's worldMoney, money, moneyAlways sunnyIn the rich man's worldAha-ahaaaAll the things I could doIf I had a little moneyIt's a rich man's world
Money, money, moneyMust be funnyIn the rich man's worldMoney, money, moneyAlways sunnyIn the rich man's worldAha-ahaaaAll the things I could doIf I had a little moneyIt's a rich man's world
It's a rich man's world
© 2007 Thomson South-Western
• Draw a supply and demand diagram that shows the boss receiving “the lions share bliss” while someone who scrubs floors gets much less. In other words, what factors would affect supply and demand such that CEO’s receive 300 times the compensation of average workers? Are CEO’s paid too much?
© 2007 Thomson South-Western
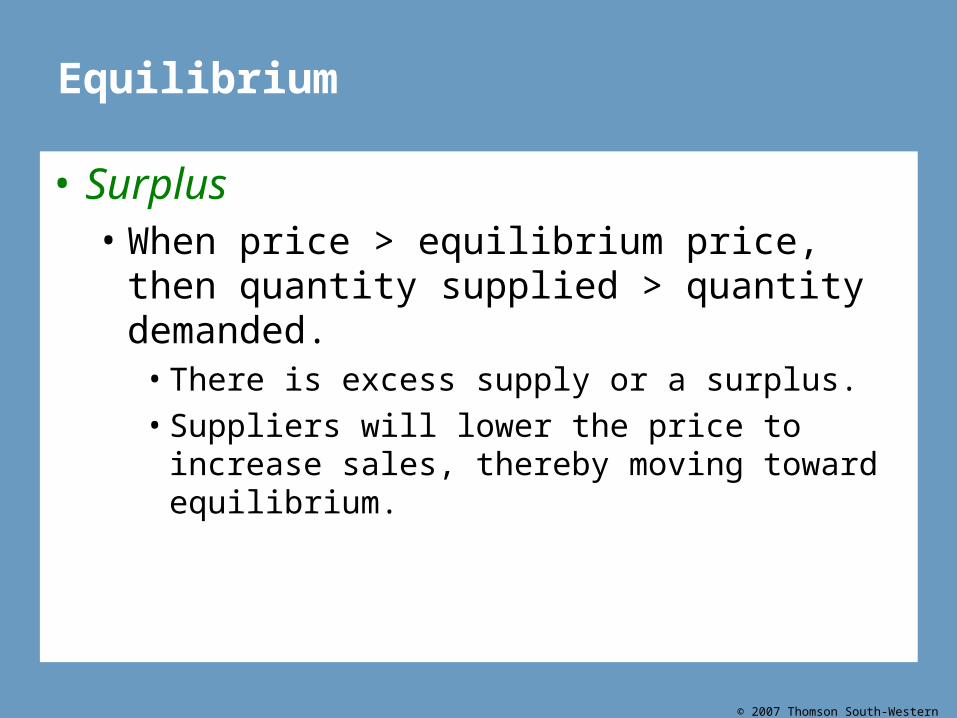
Equilibrium
• Surplus• When price > equilibrium price, then quantity
supplied > quantity demanded. • There is excess supply or a surplus.
• Suppliers will lower the price to increase sales, thereby moving toward equilibrium.
© 2007 Thomson South-Western
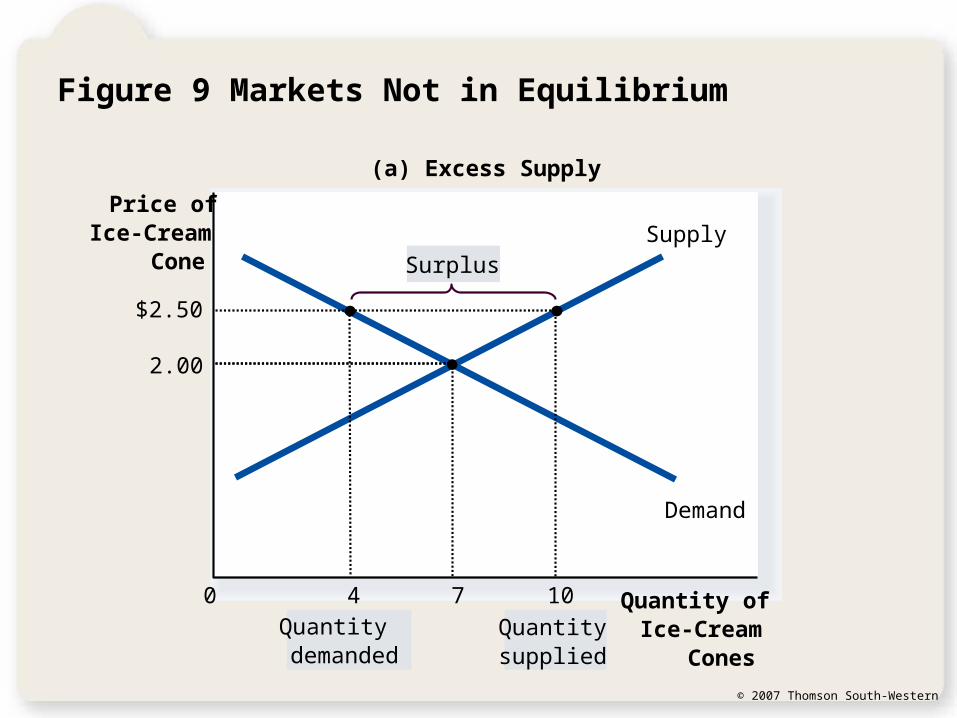
Figure 9 Markets Not in Equilibrium
Price ofIce-Cream
Cone
0
Supply
Demand
(a) Excess Supply
Quantitydemanded
Quantitysupplied
Surplus
Quantity ofIce-Cream
Cones
4
$2.50
10
2.00
7
© 2007 Thomson South-Western
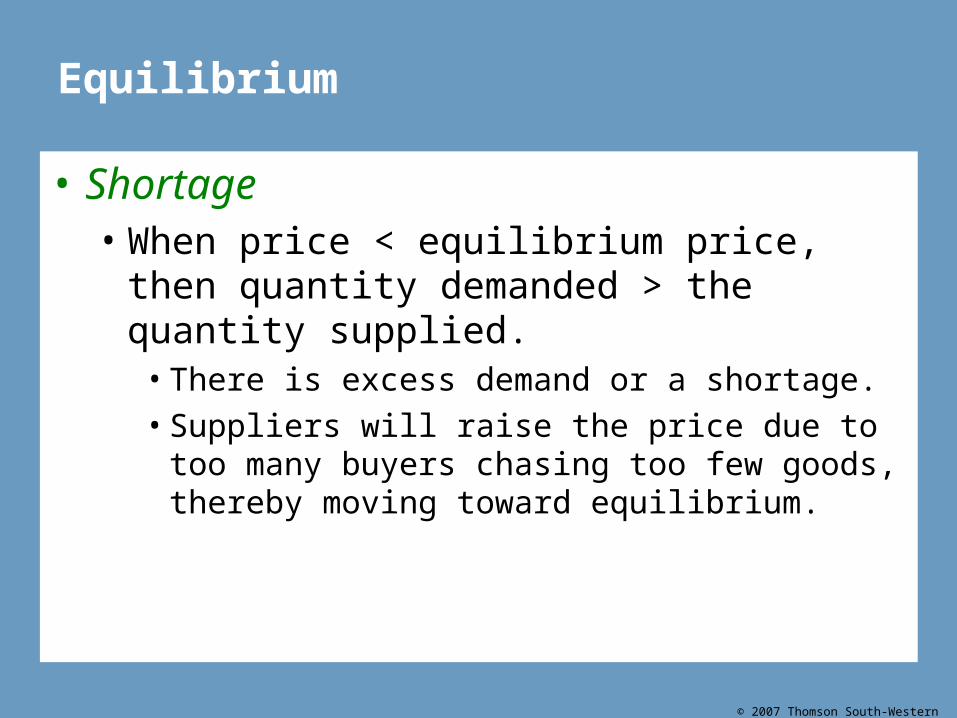
Equilibrium
• Shortage• When price < equilibrium price, then quantity
demanded > the quantity supplied. • There is excess demand or a shortage.
• Suppliers will raise the price due to too many buyers chasing too few goods, thereby moving toward equilibrium.
© 2007 Thomson South-Western
Figure 9 Markets Not in Equilibrium
Price ofIce-Cream
Cone
0 Quantity ofIce-Cream
Cones
Supply
Demand
(b) Excess Demand
Quantitysupplied
Quantitydemanded
1.50
10
$2.00
74
Shortage
© 2007 Thomson South-Western
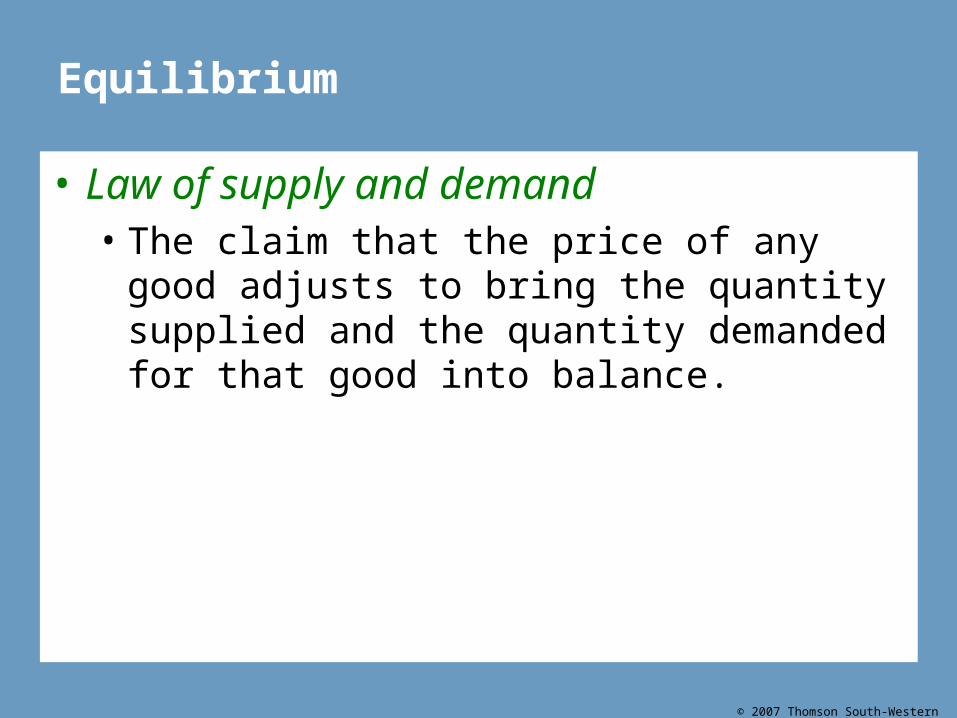
Equilibrium
• Law of supply and demand• The claim that the price of any good adjusts to bring
the quantity supplied and the quantity demanded for that good into balance.
© 2007 Thomson South-Western
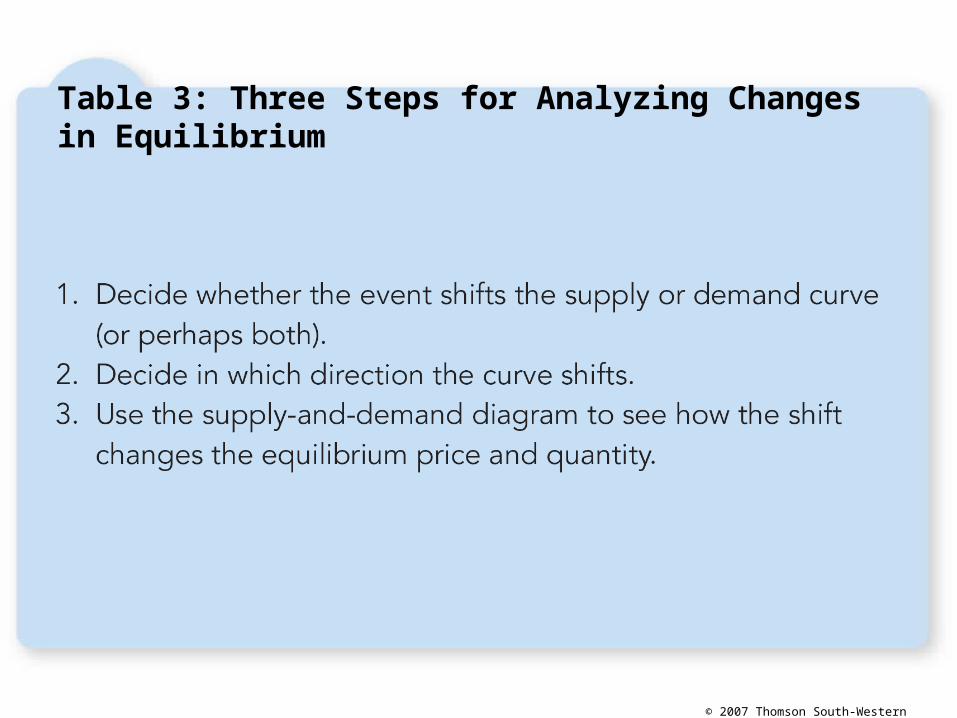
Table 3: Three Steps for Analyzing Changes in Equilibrium
© 2007 Thomson South-Western
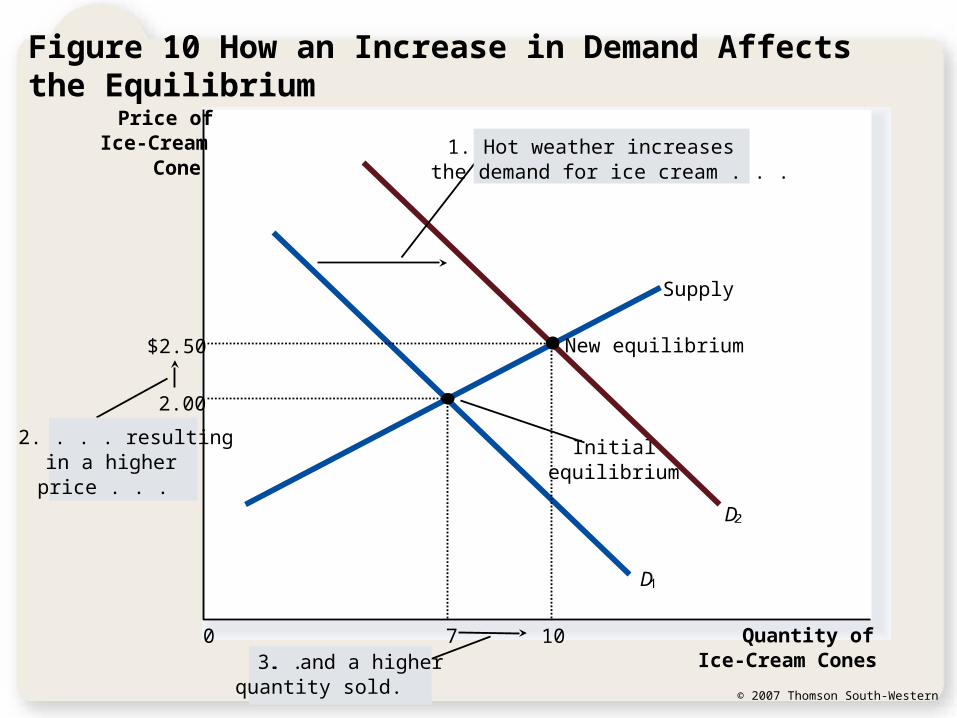
Figure 10 How an Increase in Demand Affects the Equilibrium
Price ofIce-Cream
Cone
0 Quantity of Ice-Cream Cones
Supply
Initialequilibrium
D
D
3. . . . and a higherquantity sold.
2. . . . resultingin a higherprice . . .
1. Hot weather increasesthe demand for ice cream . . .
2.00
7
New equilibrium$2.50
10
© 2007 Thomson South-Western
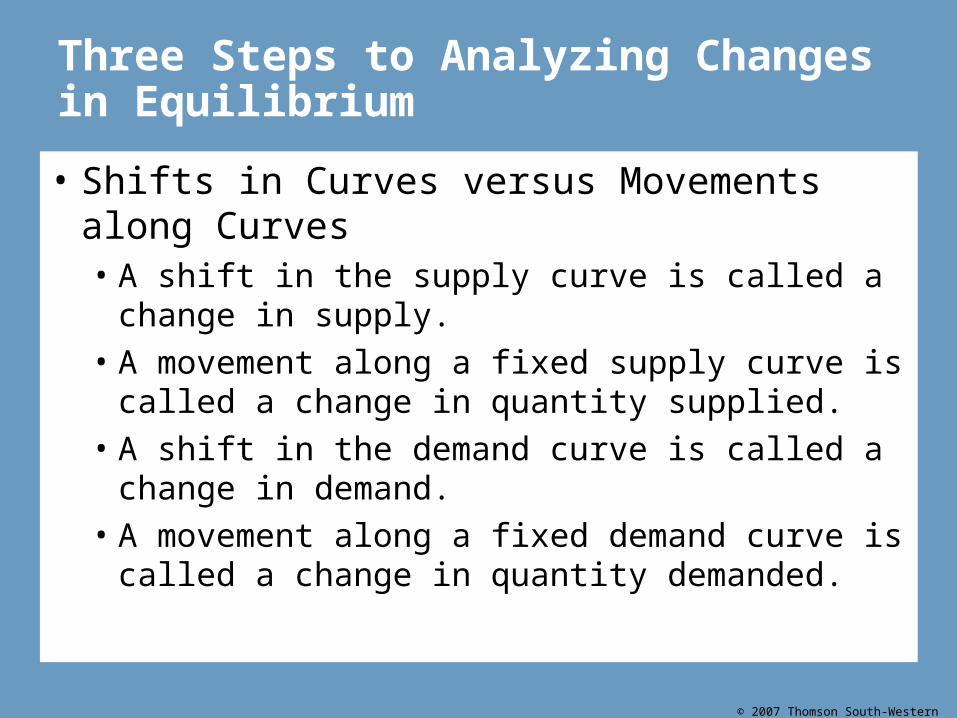
Three Steps to Analyzing Changes in Equilibrium
• Shifts in Curves versus Movements along Curves• A shift in the supply curve is called a change in
supply.• A movement along a fixed supply curve is called a
change in quantity supplied.• A shift in the demand curve is called a change in
demand.• A movement along a fixed demand curve is called a
change in quantity demanded.
© 2007 Thomson South-Western
Figure 11 How a Decrease in Supply Affects the Equilibrium
Price ofIce-Cream
Cone
0 Quantity of Ice-Cream Cones
Demand
Newequilibrium
Initial equilibrium
S1
S2
2. . . . resultingin a higherprice of icecream . . .
1. An increase in theprice of sugar reducesthe supply of ice cream. . .
3. . . . and a lowerquantity sold.
2.00
7
$2.50
4
© 2007 Thomson South-Western
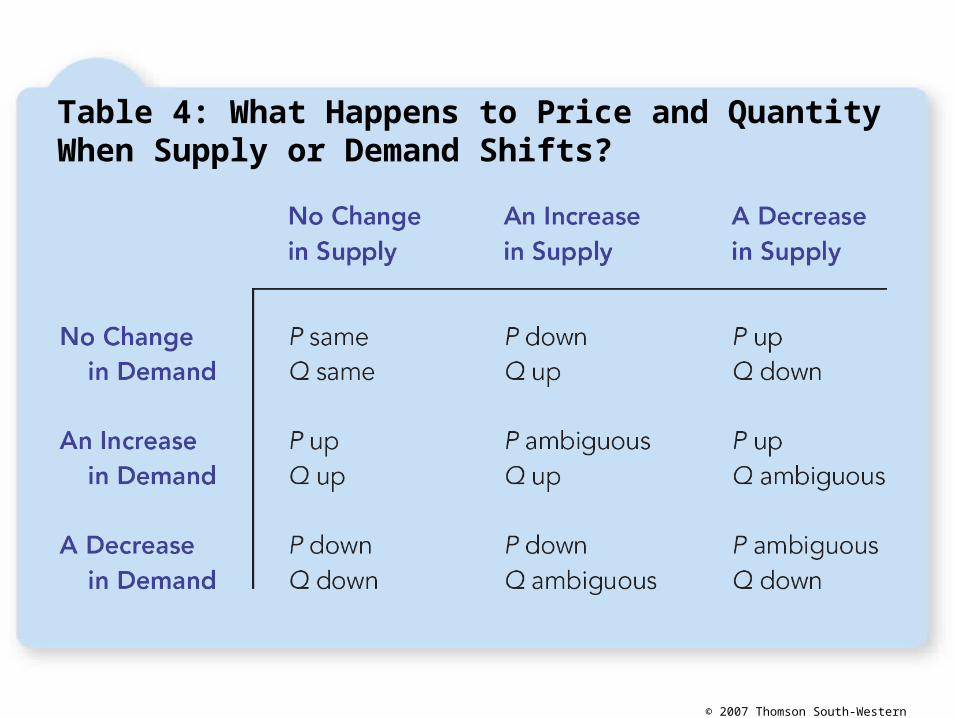
Table 4: What Happens to Price and Quantity When Supply or Demand Shifts?
Summary
© 2007 Thomson South-Western
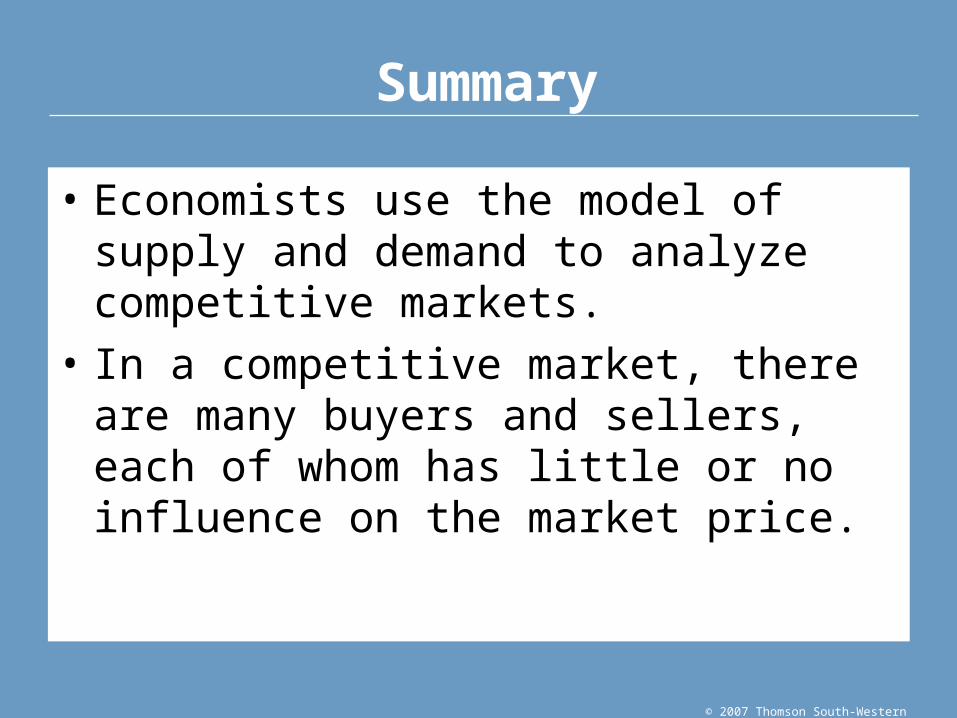
• Economists use the model of supply and demand to analyze competitive markets.
• In a competitive market, there are many buyers and sellers, each of whom has little or no influence on the market price.
Summary
© 2007 Thomson South-Western
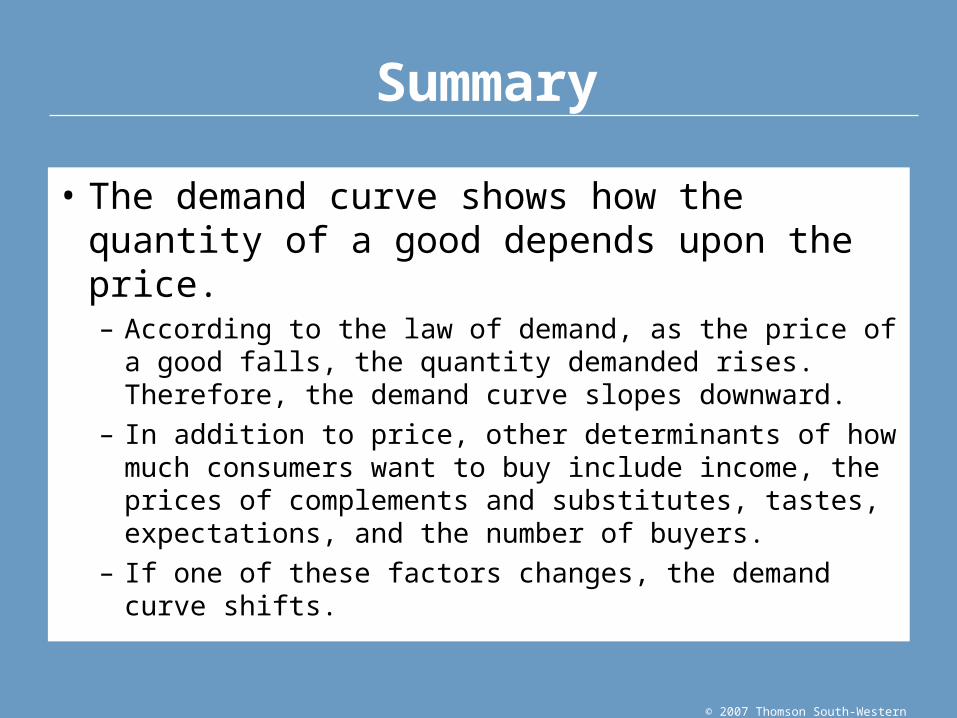
• The demand curve shows how the quantity of a good depends upon the price.– According to the law of demand, as the price of a good
falls, the quantity demanded rises. Therefore, the demand curve slopes downward.
– In addition to price, other determinants of how much consumers want to buy include income, the prices of complements and substitutes, tastes, expectations, and the number of buyers.
– If one of these factors changes, the demand curve shifts.
Summary
© 2007 Thomson South-Western
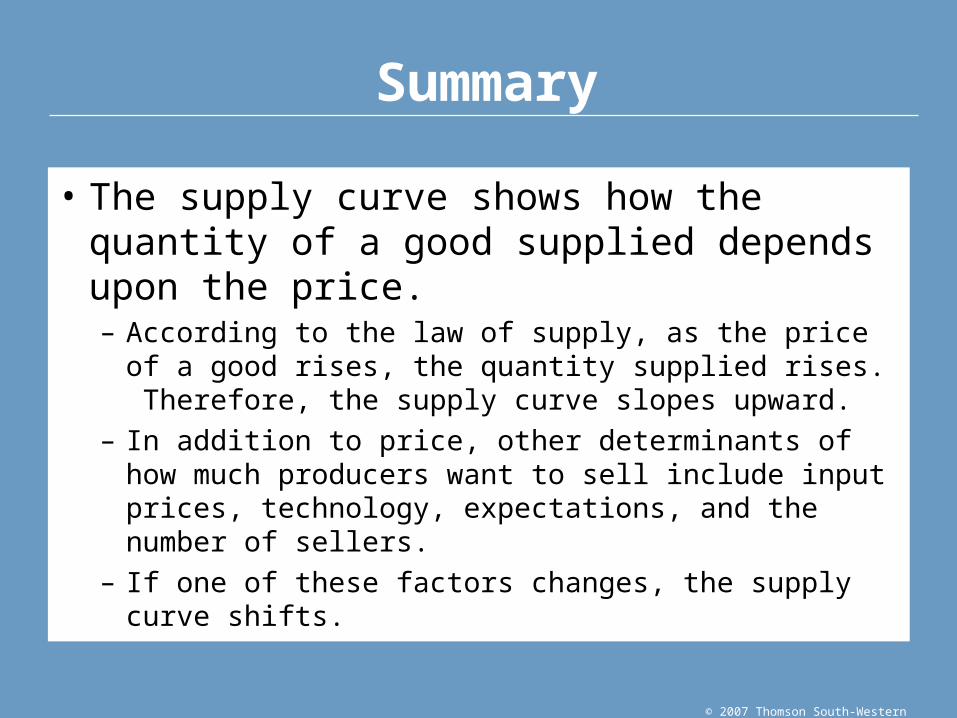
• The supply curve shows how the quantity of a good supplied depends upon the price.– According to the law of supply, as the price of a good rises,
the quantity supplied rises. Therefore, the supply curve slopes upward.
– In addition to price, other determinants of how much producers want to sell include input prices, technology, expectations, and the number of sellers.
– If one of these factors changes, the supply curve shifts.
Summary
© 2007 Thomson South-Western
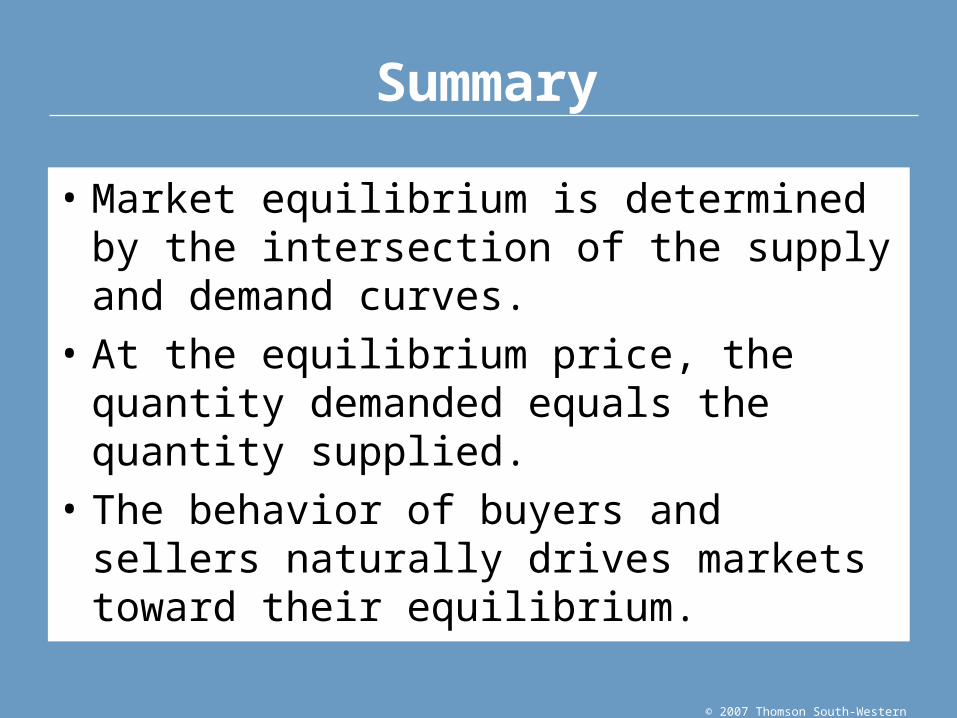
• Market equilibrium is determined by the intersection of the supply and demand curves.
• At the equilibrium price, the quantity demanded equals the quantity supplied.
• The behavior of buyers and sellers naturally drives markets toward their equilibrium.
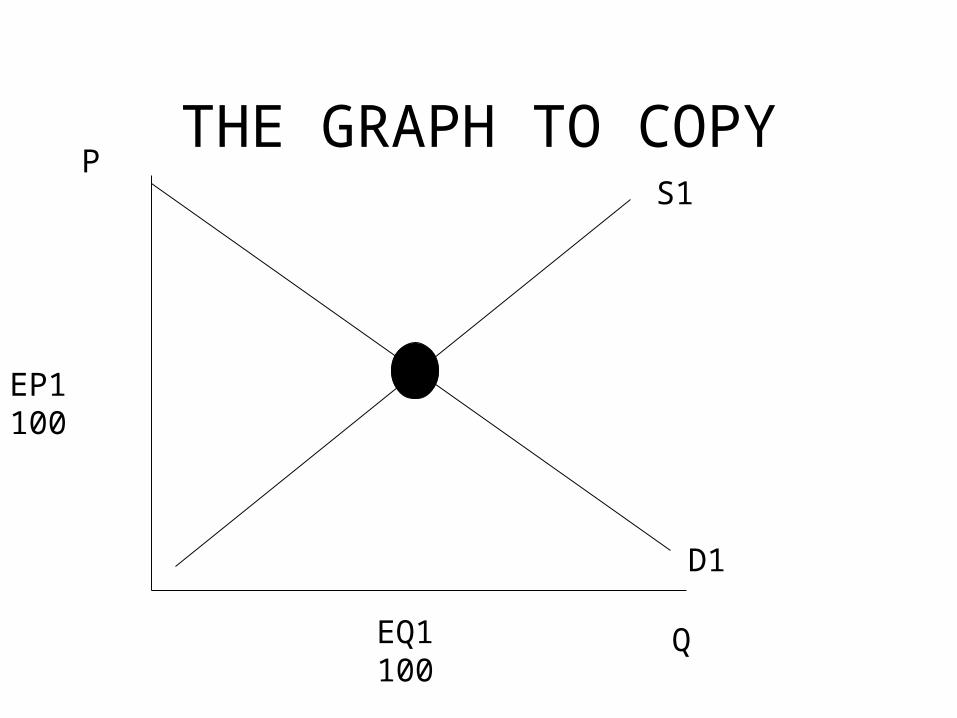
THE GRAPH TO COPYP
Q
S1
D1
EP1 100
EQ1 100
LETS SPY ON THEM
EQUILIBRIUM
EQUILIBRIUM PRICE 100
EQUILIBRIUM QUANTITY
100
S1
D1
P
Q
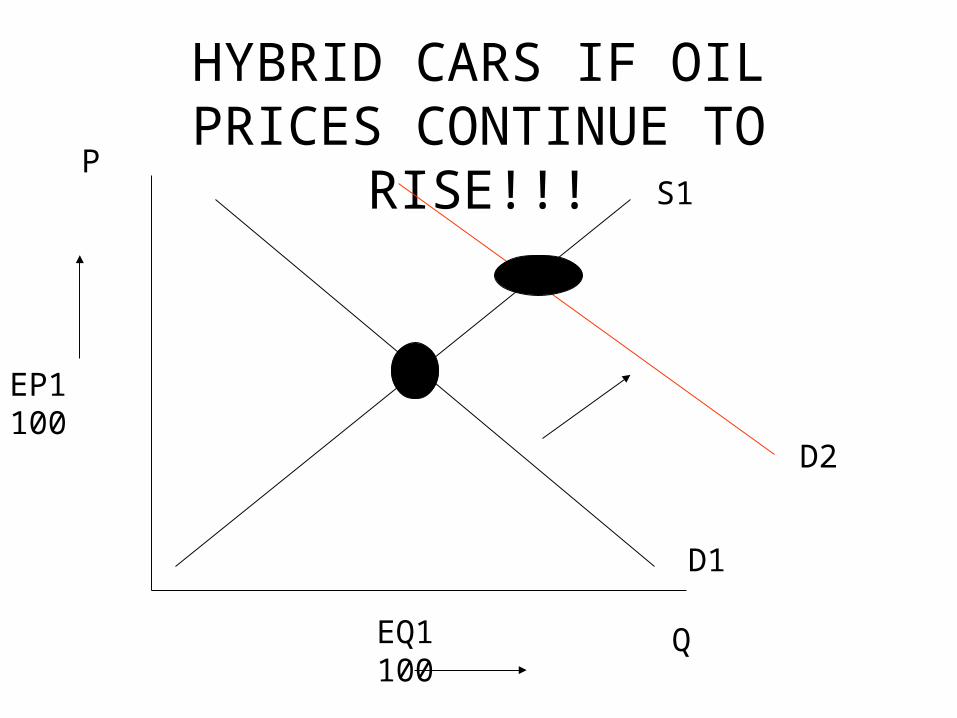
HYBRID CARS IF OIL PRICES CONTINUE TO RISE!!!P
Q
S1
D1
EP1 100
EQ1 100
D2
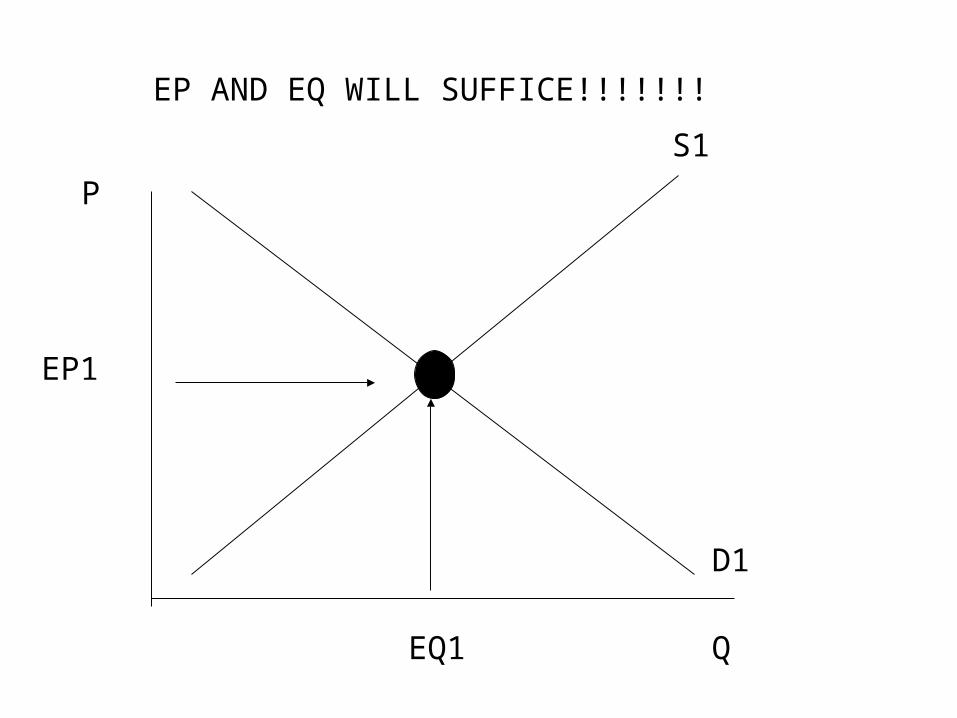
EP AND EQ WILL SUFFICE!!!!!!!
EQ1
EP1
S1
D1
P
Q
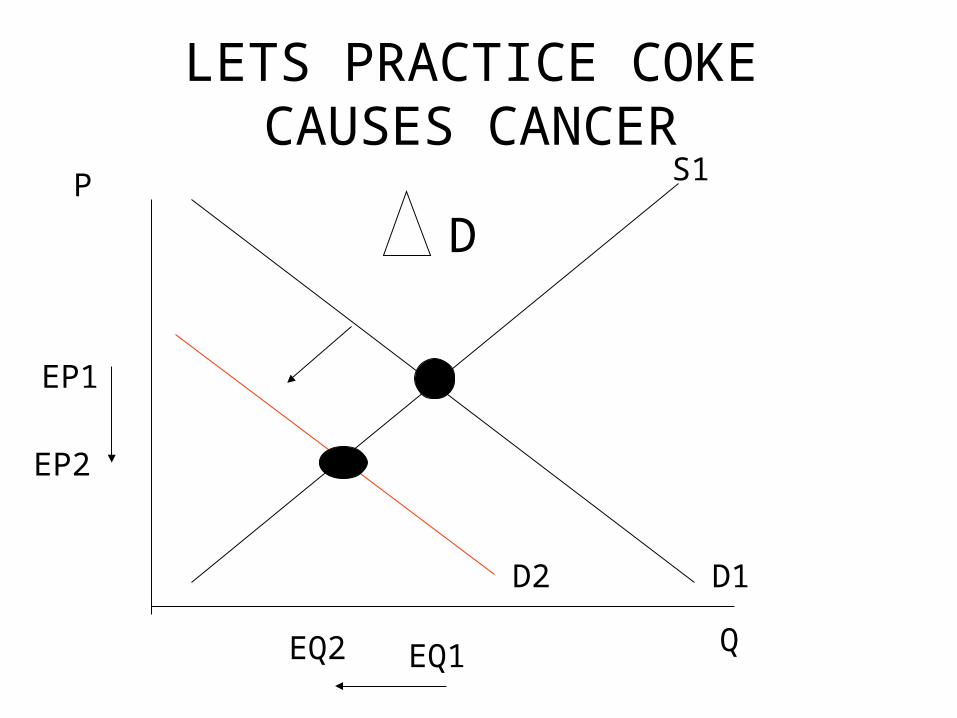
LETS PRACTICE COKE CAUSES CANCER
EP1
EQ1
EP2
EQ2
D
S1
D1D2
P
Q
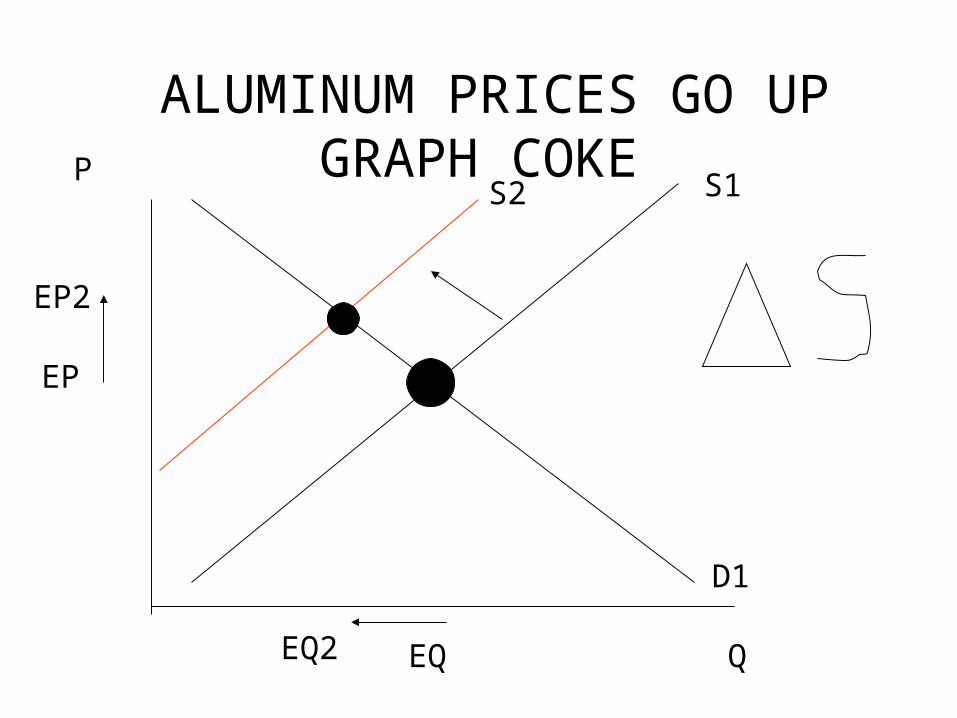
ALUMINUM PRICES GO UP GRAPH COKE
EP
EQ
EP2
EQ2
S1S2
D1
P
Q
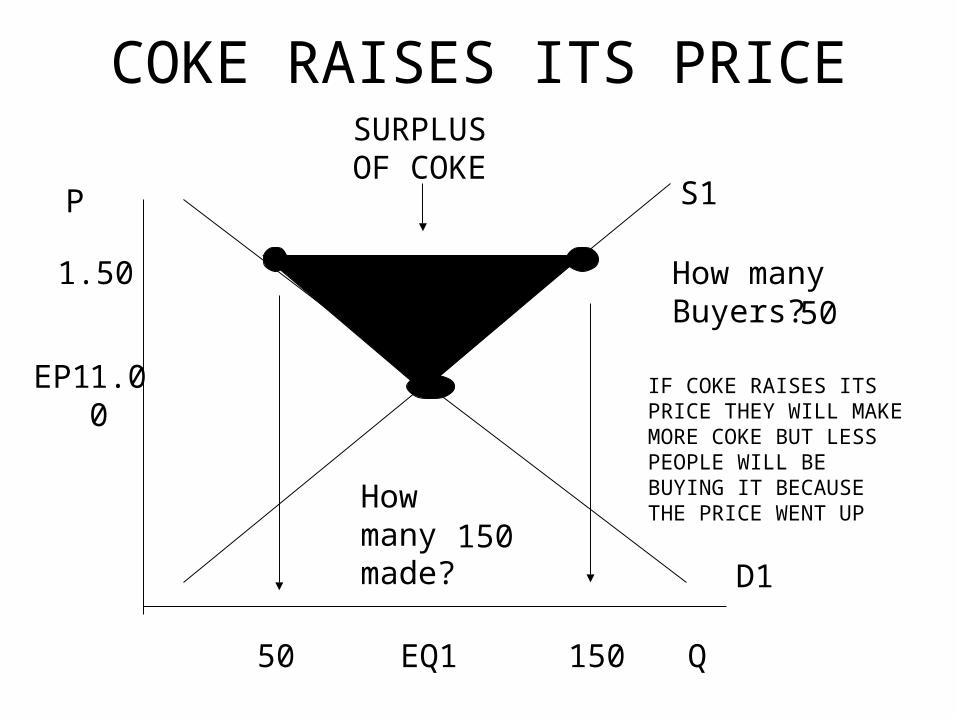
COKE RAISES ITS PRICE
EP1
EQ1
P
Q
SURPLUS OF COKE
50 150
IF COKE RAISES ITS PRICE THEY WILL MAKE MORE COKE BUT LESS PEOPLE WILL BE BUYING IT BECAUSE THE PRICE WENT UP
S1
D1
1.00
1.50 How many Buyers? 50
How many made? 150
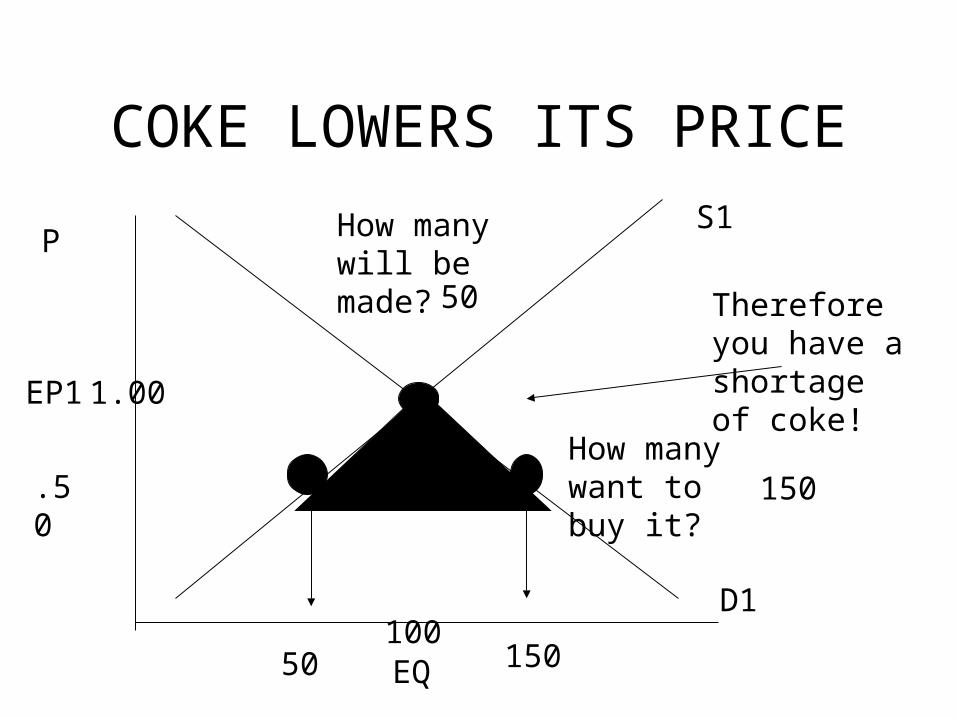
COKE LOWERS ITS PRICE
EP1
EQ
PS1
D1
1.00
10050 150
Therefore you have a shortage of coke!
.50 150
How many will be made? 50
How many want to buy it?
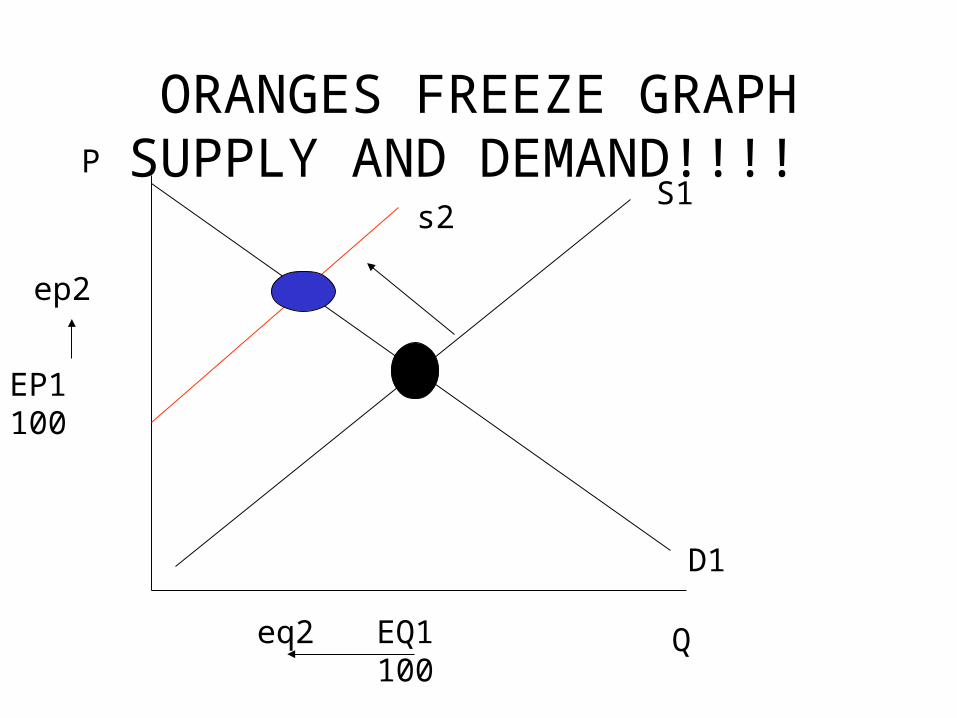
ORANGES FREEZE GRAPH SUPPLY AND DEMAND!!!! P
Q
S1
D1
EP1 100
EQ1 100
s2
ep2
eq2
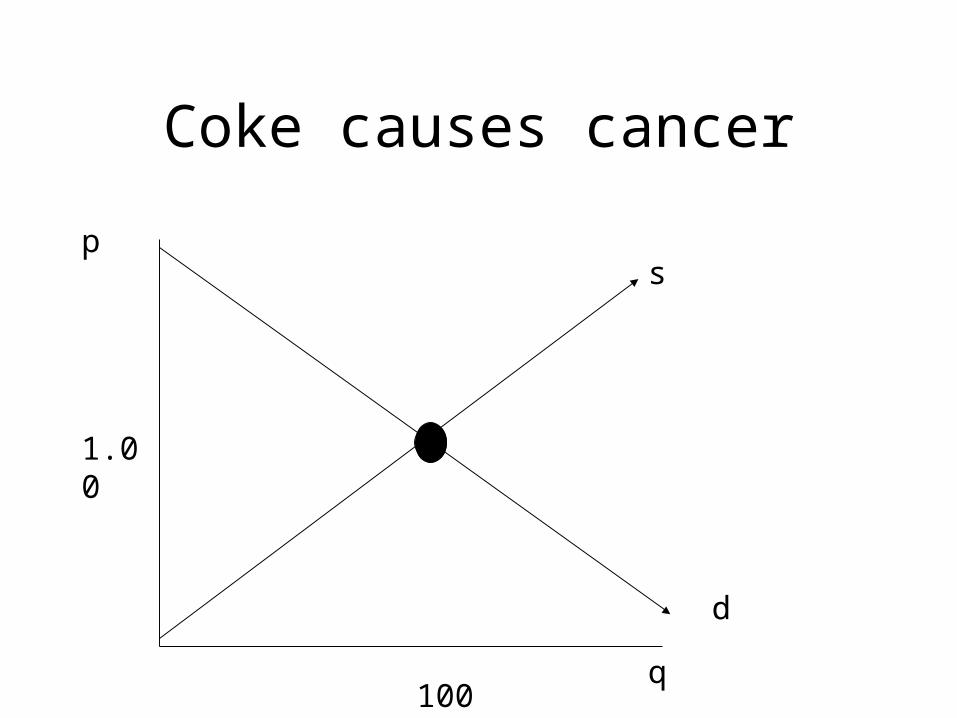
Coke causes cancer
p
q
s
d
1.00
100
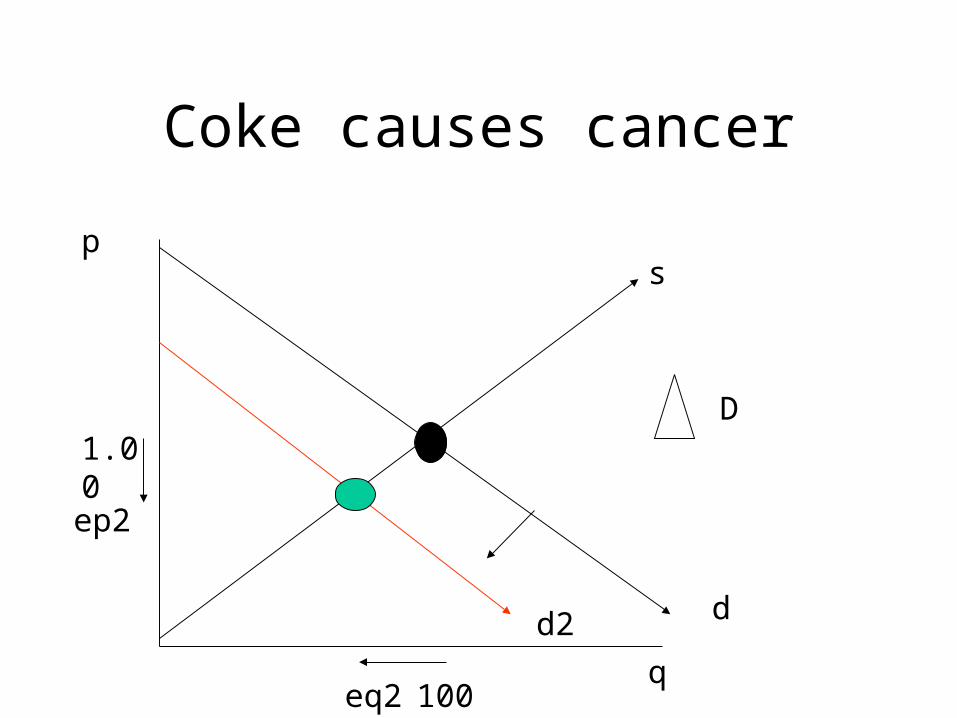
Coke causes cancer
p
q
s
d
1.00
100
d2
eq2
ep2
D
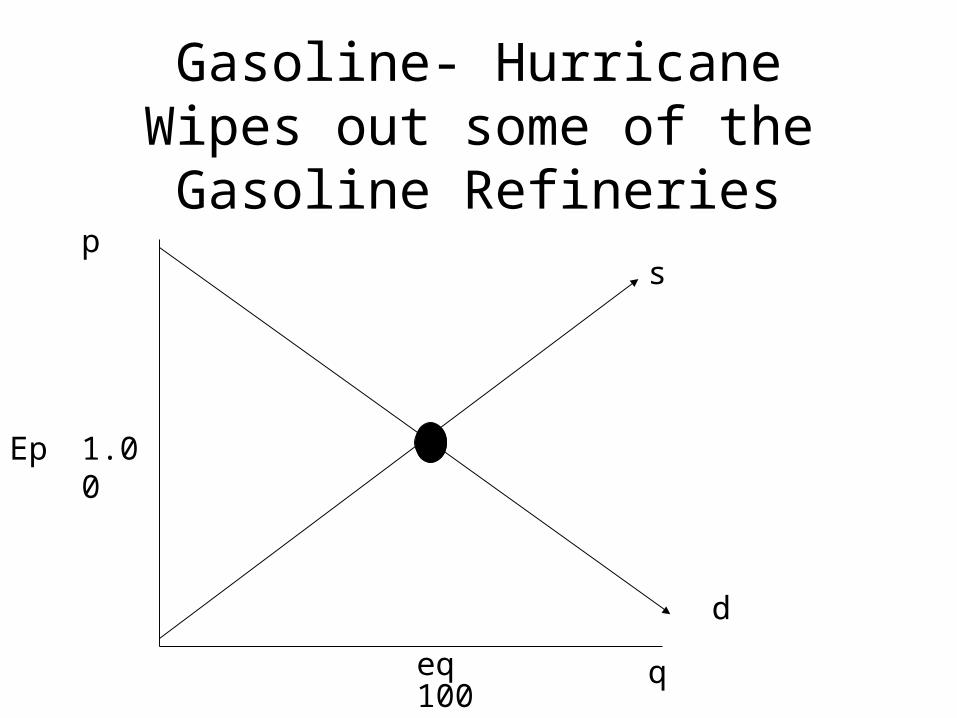
Gasoline- Hurricane Wipes out some of the Gasoline Refineries
eq
p
q
s
d
1.00
100
Ep
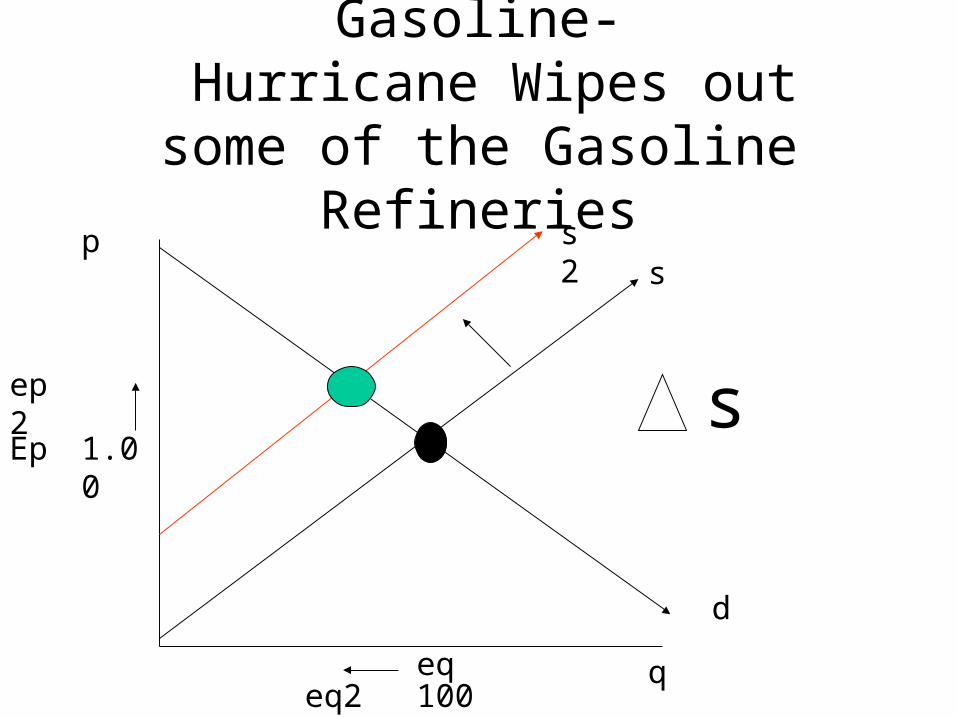
Gasoline- Hurricane Wipes out some of the
Gasoline Refineries
eq
p
q
s
d
1.00
100
Ep
ep2
eq2
s2
s
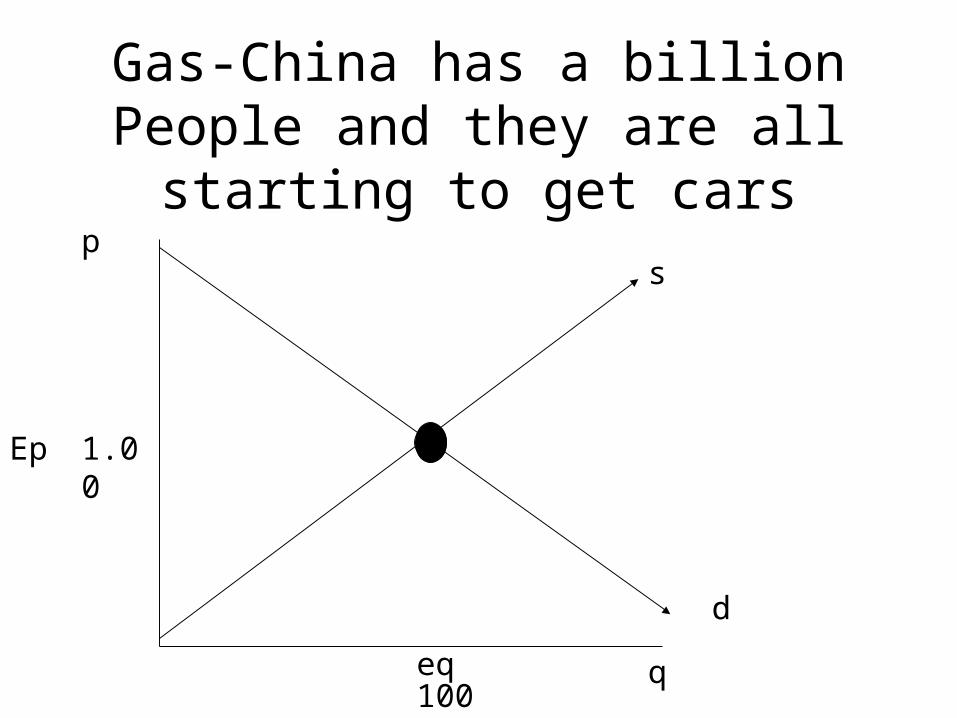
Gas-China has a billion People and they are all starting to get cars
p
q
s
d
1.00
100
Ep
eq
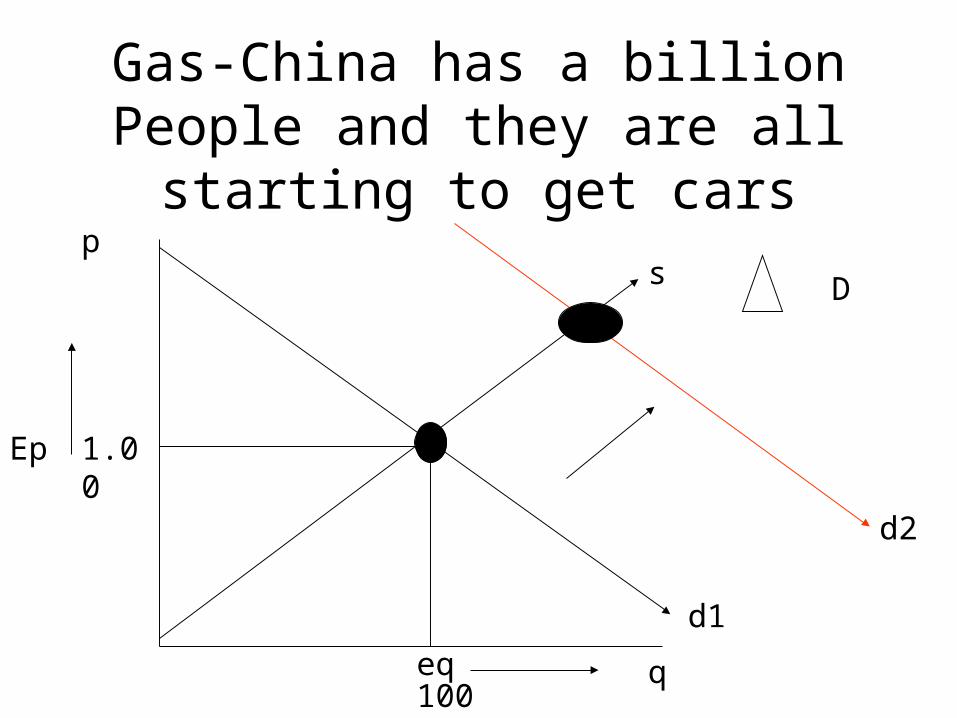
Gas-China has a billion People and they are all starting to get cars
p
q
s
d1
1.00
100
Ep
eq
D
d2
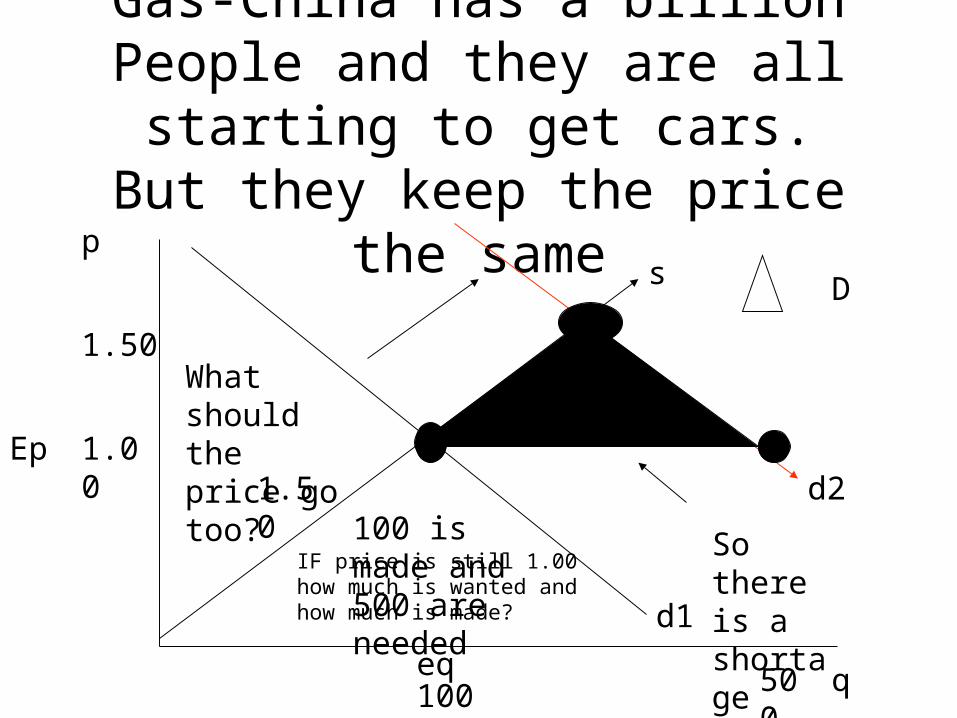
Gas-China has a billion People and they are all starting to get cars. But
they keep the price the samep
q
s
d1
1.00
100
Ep
eq
D
500
d2
1.50What should the price go too? 1.50
IF price is still 1.00 how much is wanted and how much is made?
100 is made and 500 are needed
So there is a shortage
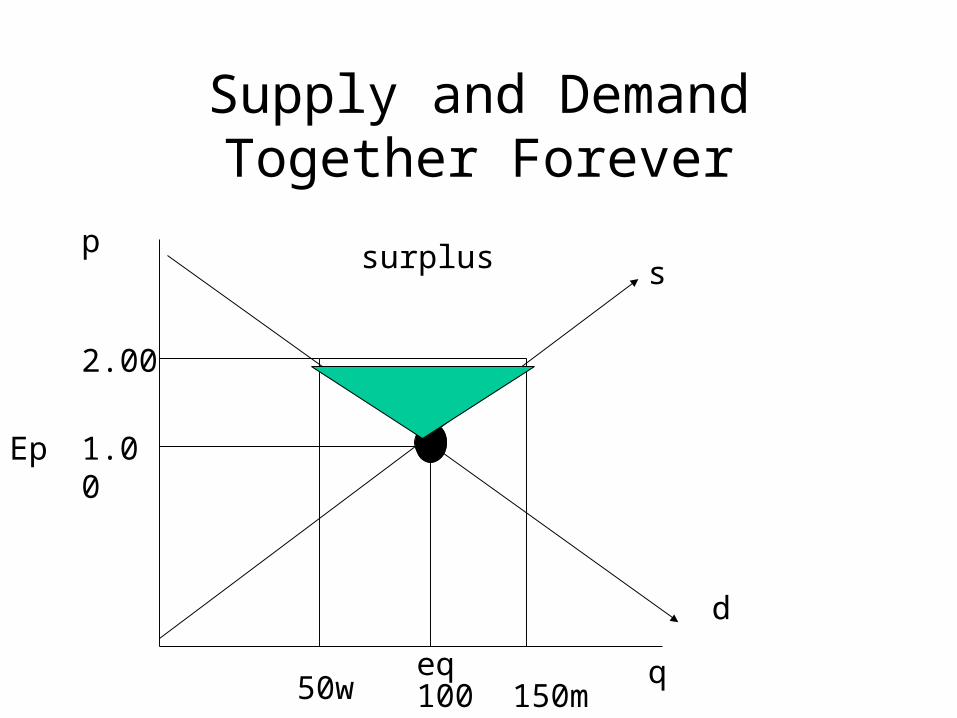
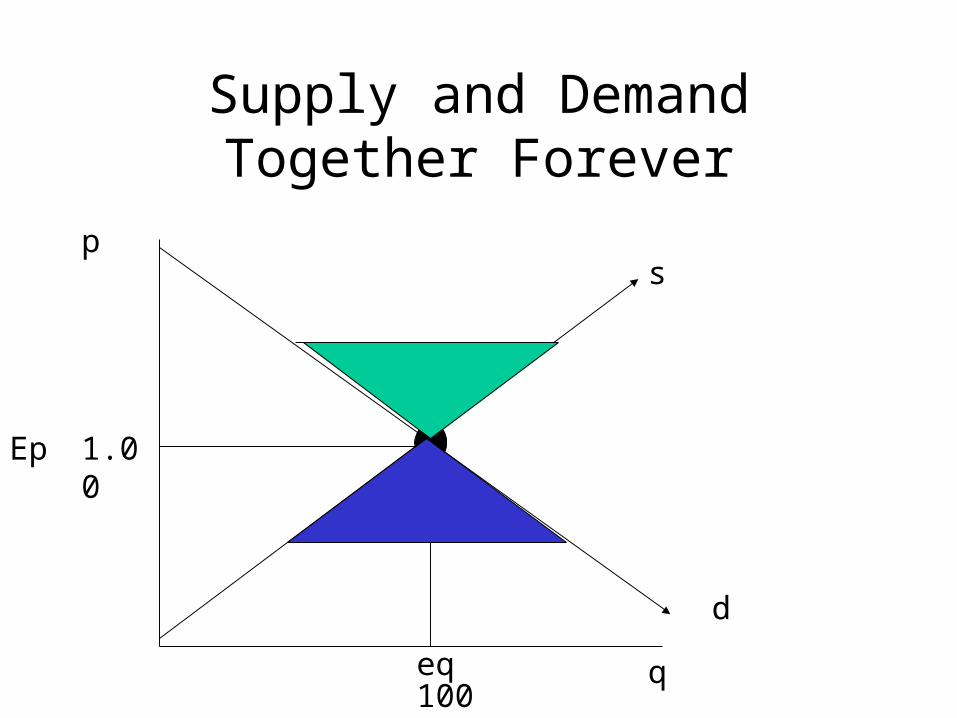
Supply and Demand Together Forever
p
q
s
d
1.00
100
Ep
eq
2.00
50w 150m
surplus
Astros T shirts if they are in the world series
p
q
s
d1
20
100
Ep
eq
d2
D
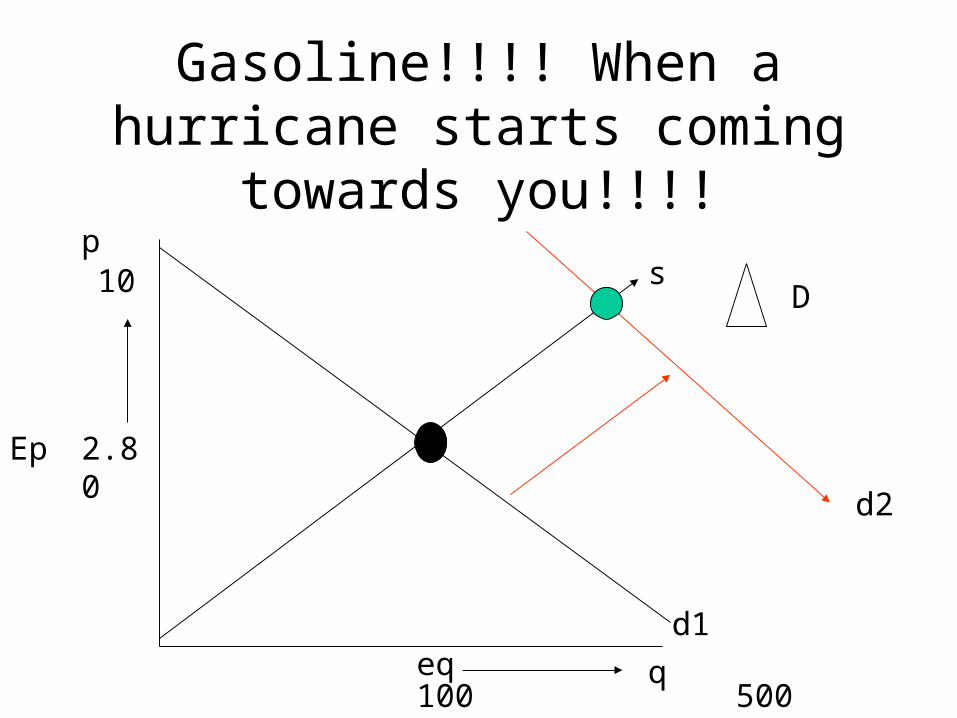
Gasoline!!!! When a hurricane starts coming towards you!!!!
p
q
s
d1
2.80
100
Ep
eq
10
500
d2
D
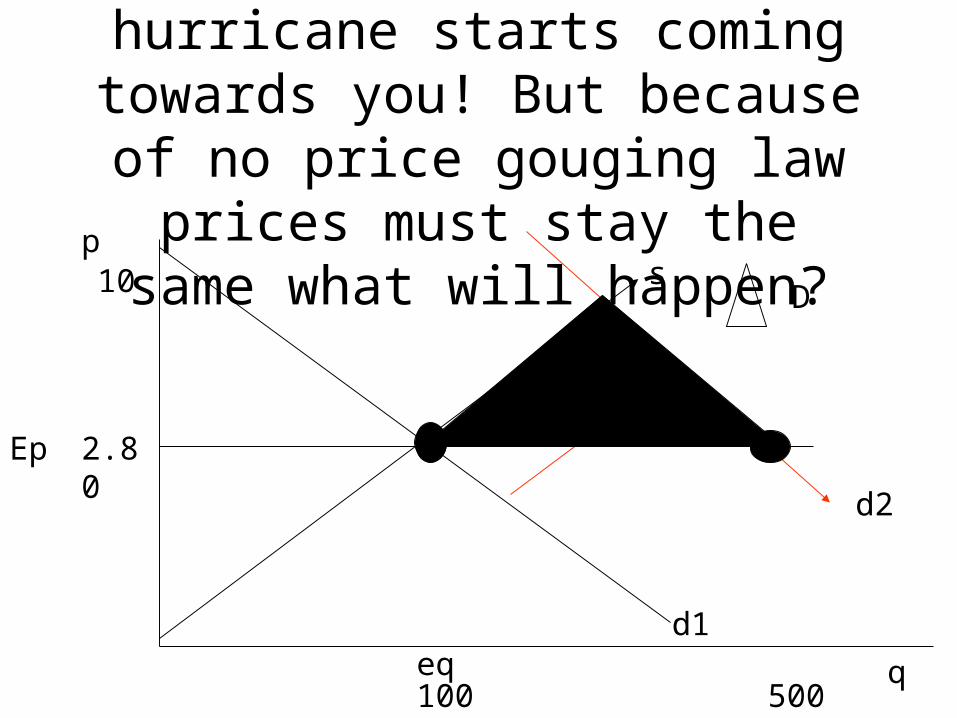
Gasoline!!!! When a hurricane starts coming towards you! But because of
no price gouging law prices must stay the same what will happen?p
q
s
d1
2.80
100
Ep
eq
10
500
d2
D
Supply and Demand Together Forever
p
q
s
d
1.00
100
Ep
eq
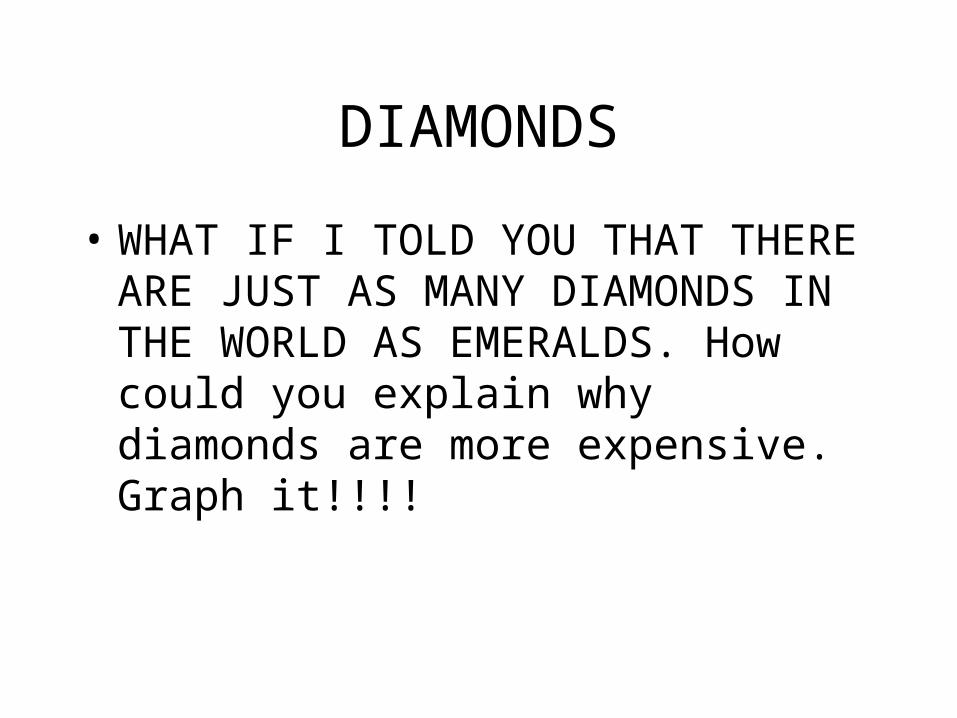
DIAMONDS
• WHAT IF I TOLD YOU THAT THERE ARE JUST AS MANY DIAMONDS IN THE WORLD AS EMERALDS. How could you explain why diamonds are more expensive. Graph it!!!!

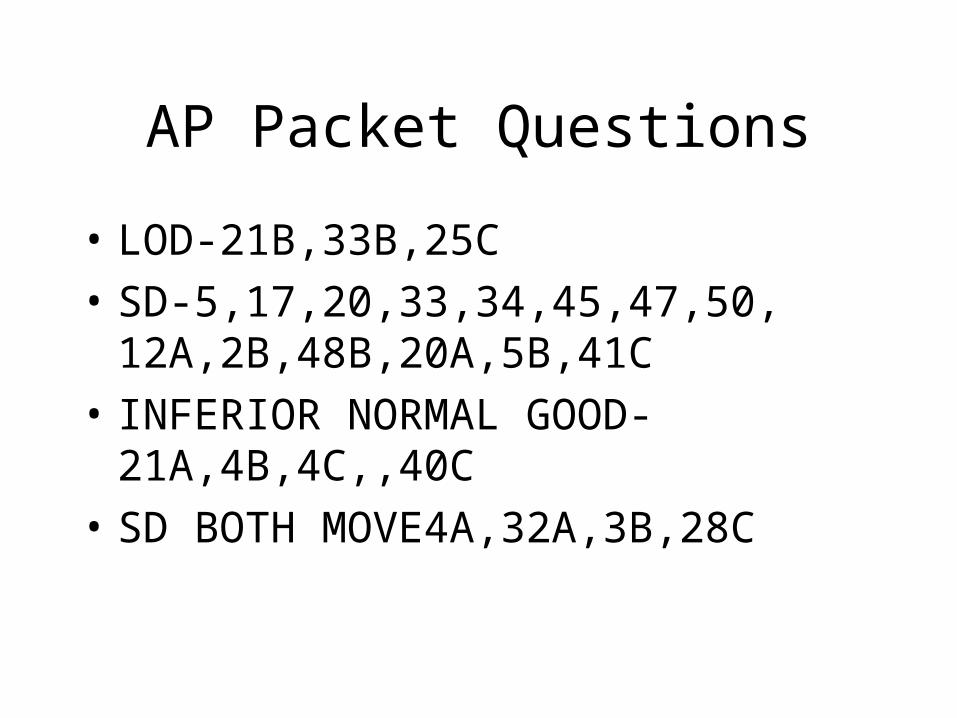
AP Packet Questions
• LOD-21B,33B,25C
• SD-5,17,20,33,34,45,47,50, 12A,2B,48B,20A,5B,41C
• INFERIOR NORMAL GOOD-21A,4B,4C,,40C
• SD BOTH MOVE4A,32A,3B,28C
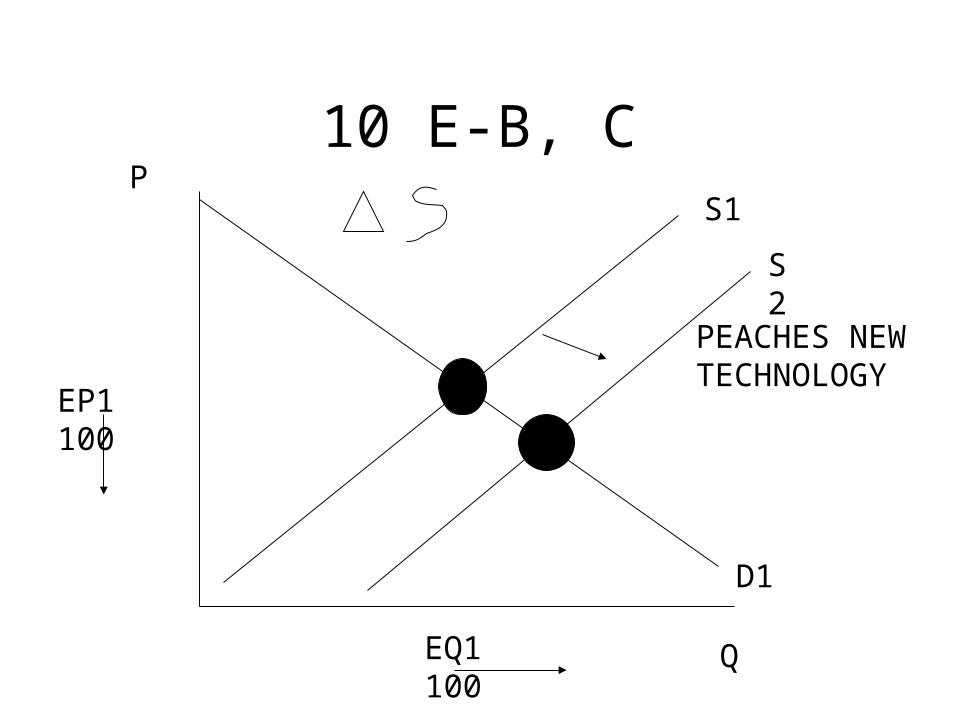
10 E-B, CP
Q
S1
D1
EP1 100
EQ1 100
PEACHES NEW TECHNOLOGY
S2
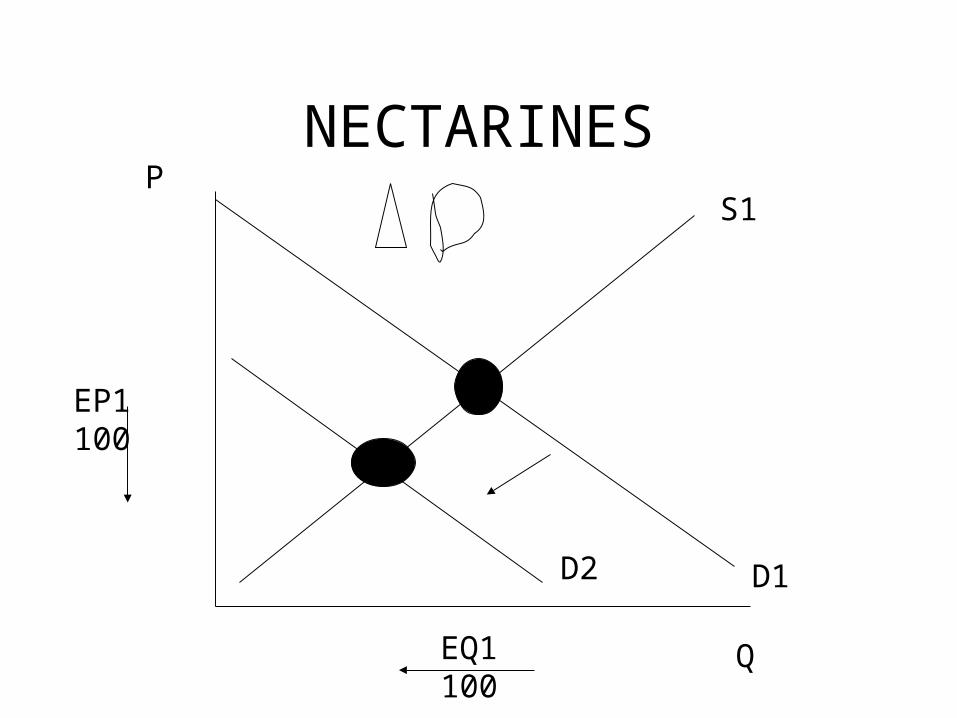
NECTARINESP
Q
S1
D1
EP1 100
EQ1 100
D2
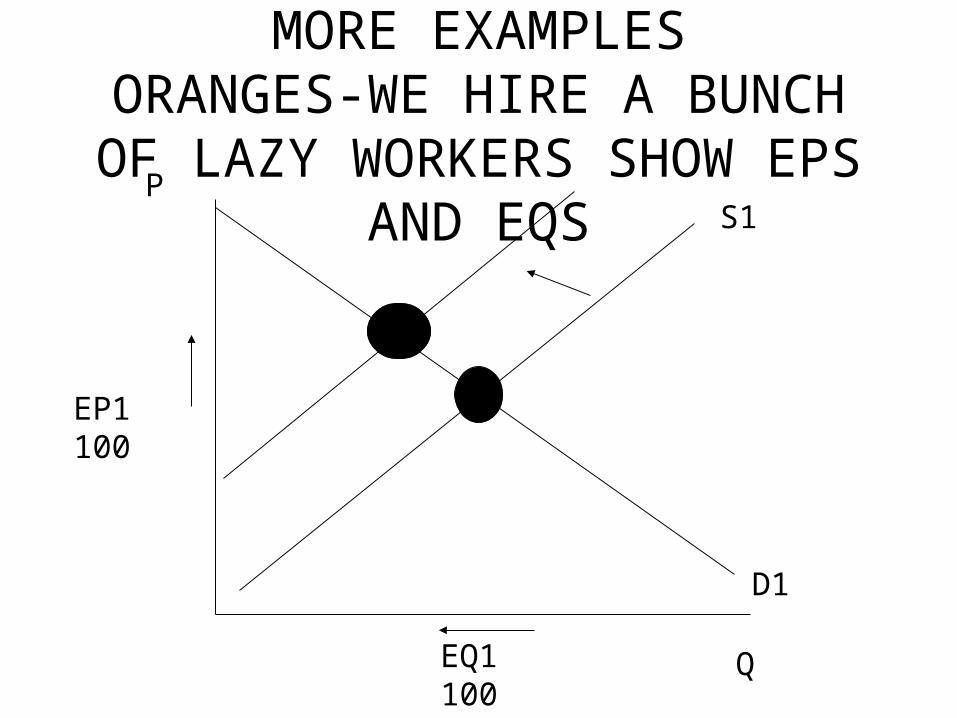
MORE EXAMPLESORANGES-WE HIRE A BUNCH
OF LAZY WORKERS SHOW EPS AND EQS
P
Q
S1
D1
EP1 100
EQ1 100
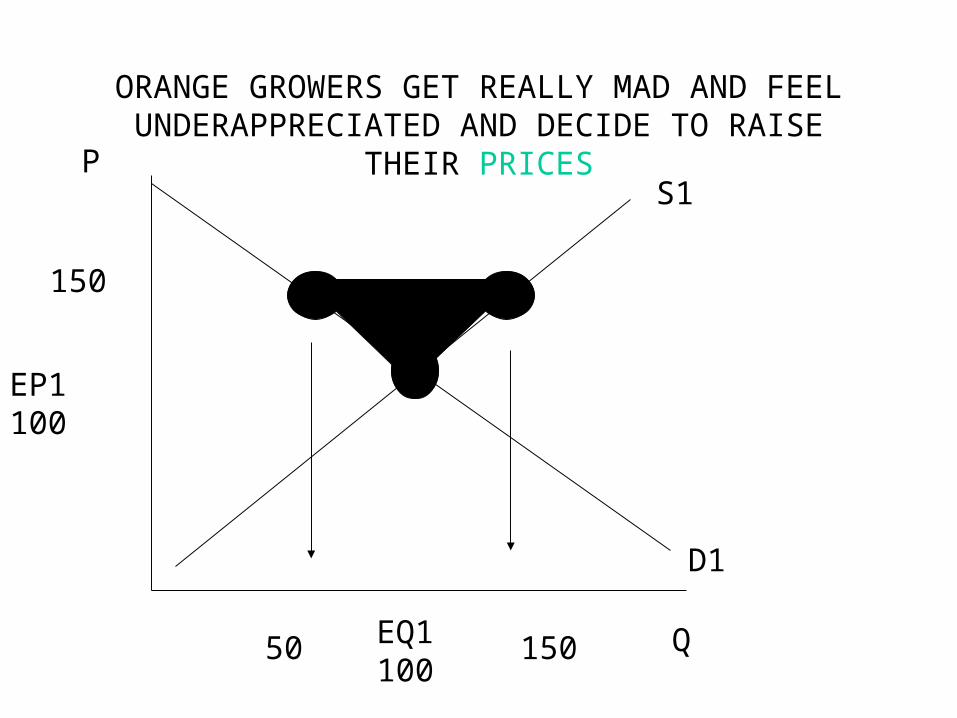
ORANGE GROWERS GET REALLY MAD AND FEEL UNDERAPPRECIATED AND DECIDE TO RAISE THEIR
PRICESP
Q
S1
D1
EP1 100
EQ1 100
150
50 150
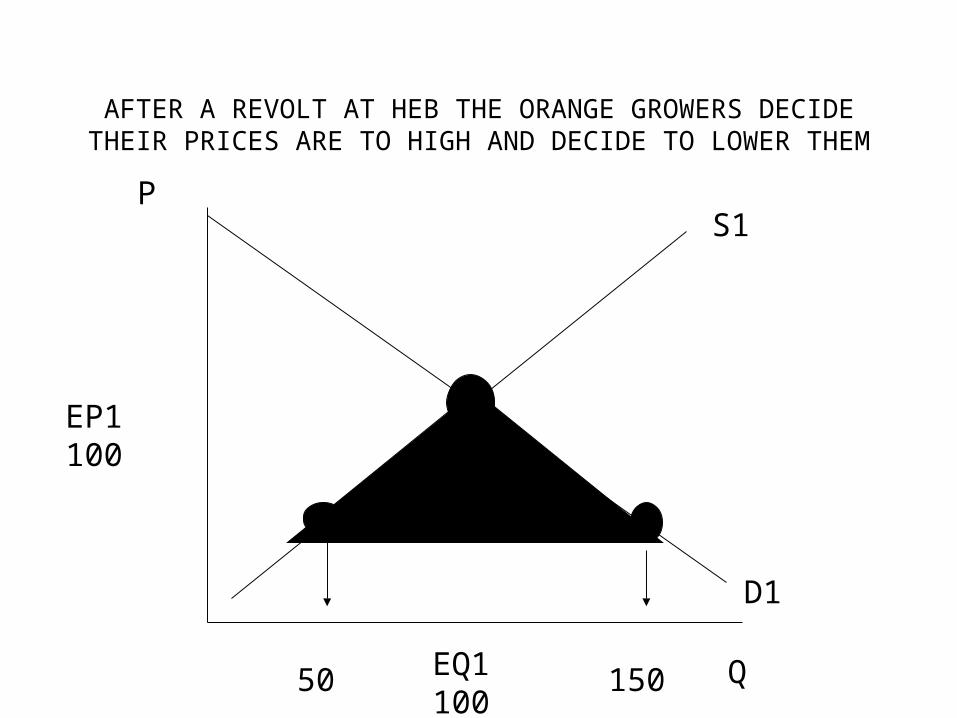
AFTER A REVOLT AT HEB THE ORANGE GROWERS DECIDE THEIR PRICES ARE TO HIGH AND DECIDE TO LOWER THEM
P
Q
S1
D1
EP1 100
EQ1 10050 150
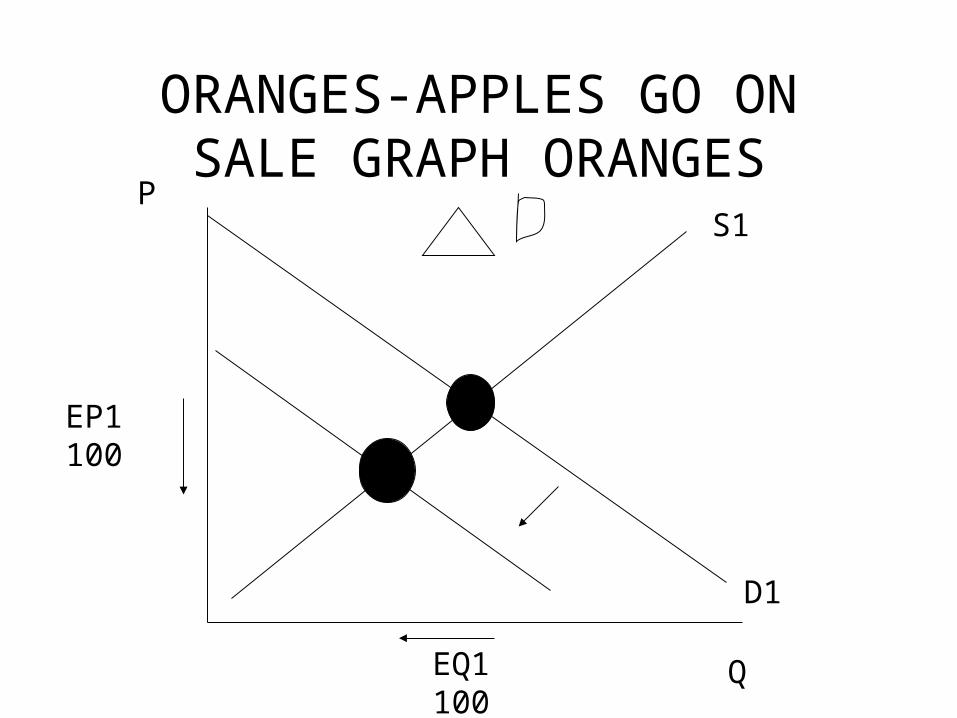
ORANGES-APPLES GO ON SALE GRAPH ORANGES
P
Q
S1
D1
EP1 100
EQ1 100
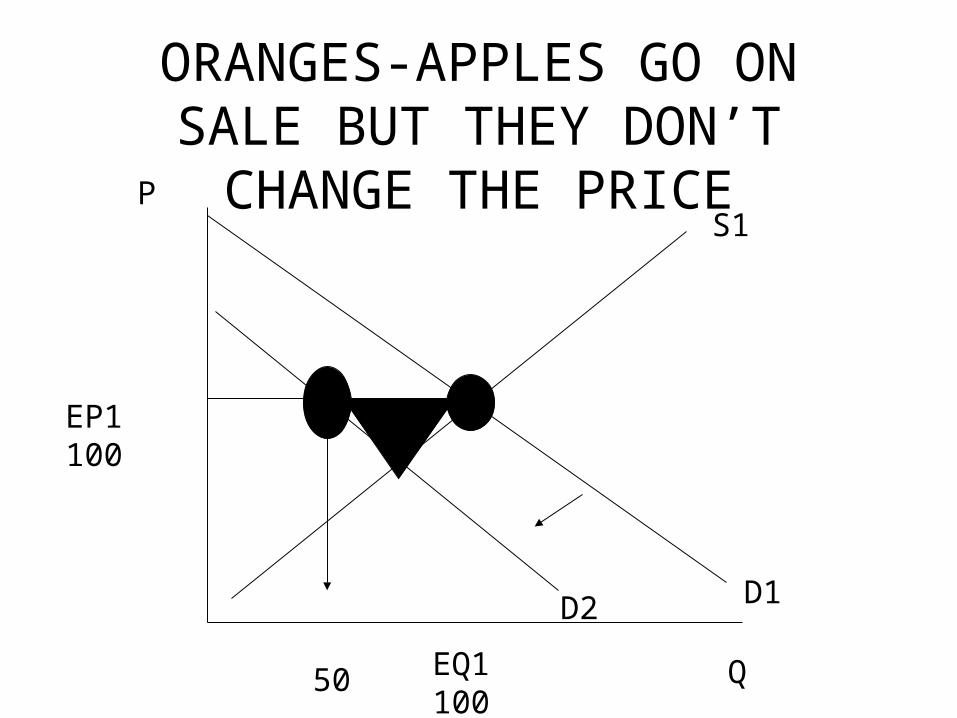
ORANGES-APPLES GO ON SALE BUT THEY DON’T CHANGE THE
PRICEP
Q
S1
D1
EP1 100
EQ1 100
D2
50
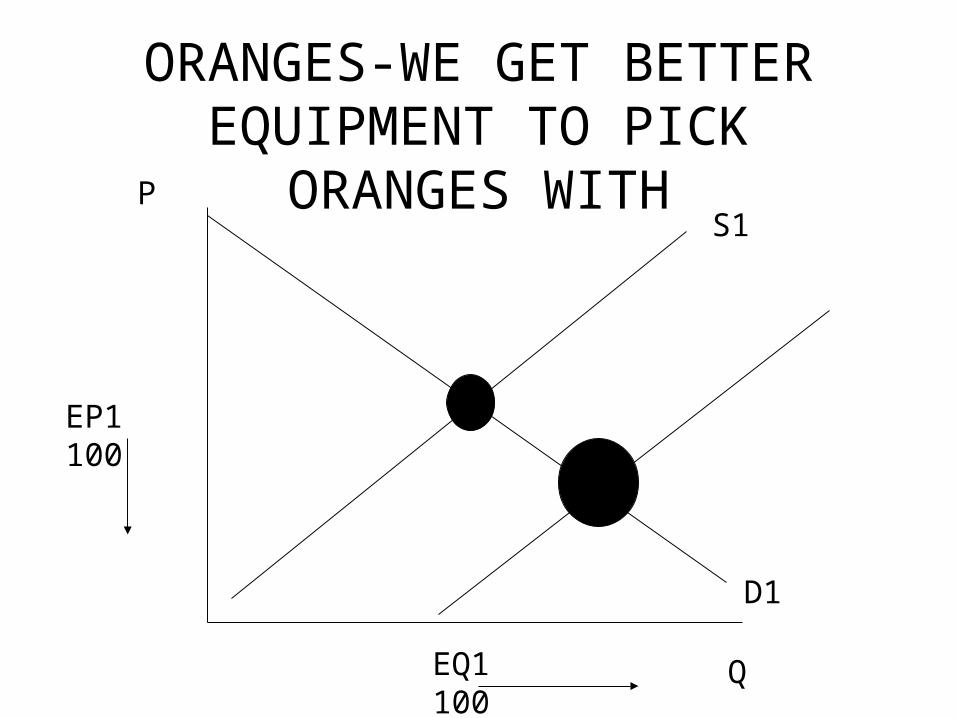
ORANGES-WE GET BETTER EQUIPMENT TO PICK ORANGES
WITHP
Q
S1
D1
EP1 100
EQ1 100
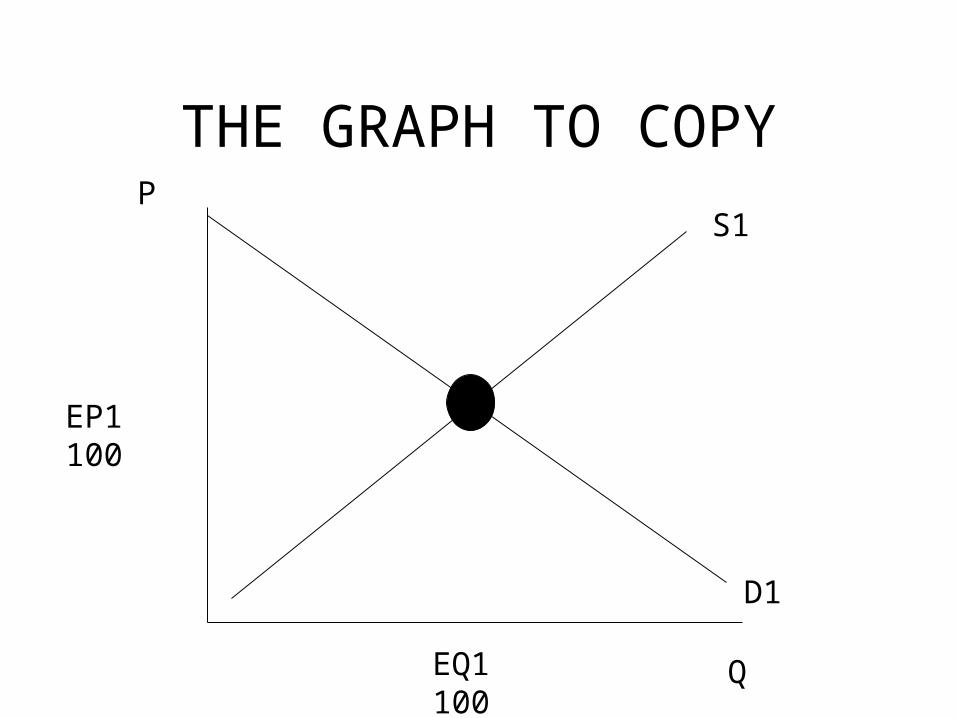
THE GRAPH TO COPYP
Q
S1
D1
EP1 100
EQ1 100
AP Packet Questions
• LOD-21B,33B,25C
• SD-5,17,20,33,34,45,47,50, 12A,2B,48B,20A,5B,41C
• INFERIOR NORMAL GOOD-21A,4B,4C,,40C
• SD BOTH MOVE4A,32A,3B,28C