Embed Size (px)
Citation preview
1
Demand Driven MRP Case Studies from the
All material and content © copyright 2014 Demand Driven Ins;tute. All rights reserved. Cer;fied Demand Driven Planner (CDDP) is a trademark of the ISCEA
2 All material and content © copyright 2012 Demand Driven Ins;tute. All rights reserved. Cer;fied Demand Driven Planner (CDDP) is a trademark of the ISCEA
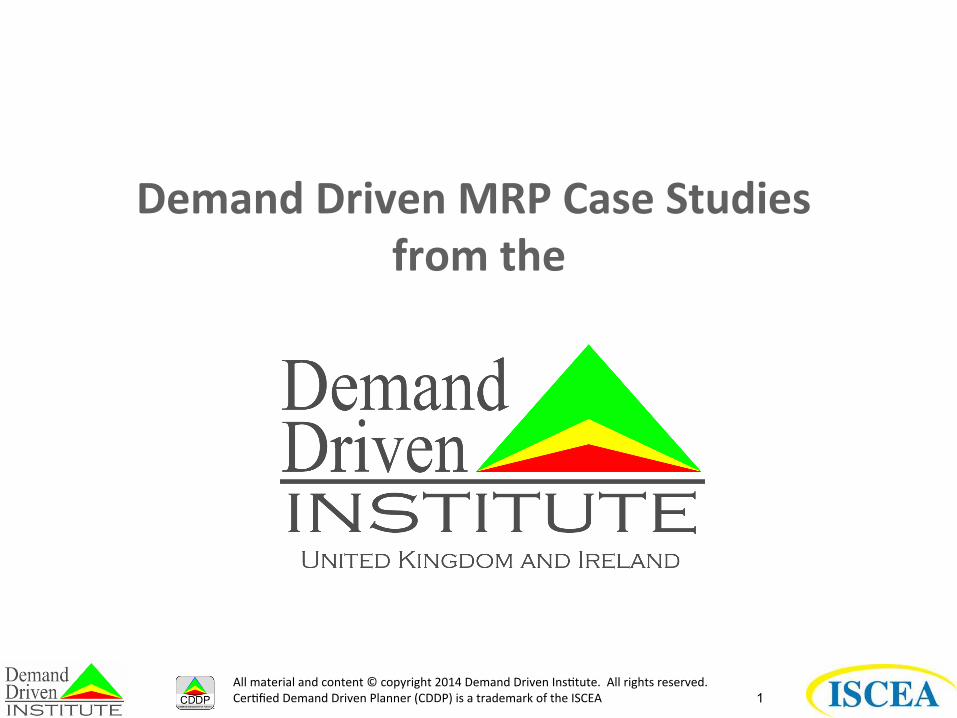
Oregon Freeze Dry Case Study
Mountain House Division: • Sales increased 20% • Customer Fill Rate improved from 79% to 99.6%
• 60% reduc?on in inventory
Industrial Ingredient Division: • 60% reduc;on in make to order lead ;me
• 100% On-‐Time-‐Delivery • 20% reduc;on in inventory
Raw Material No out of stock
Reduced inventory $2.5M+

3 All material and content © copyright 2012 Demand Driven Ins;tute. All rights reserved. Cer;fied Demand Driven Planner (CDDP) is a trademark of the ISCEA
LeTourneau Case Study
MRP
DDMRP
4
C
Steel Products
Component Supply (H/
L)
Offshore Products
Mining Products
C
C
Suppliers
Drilling Systems
Forestry Products
C
C
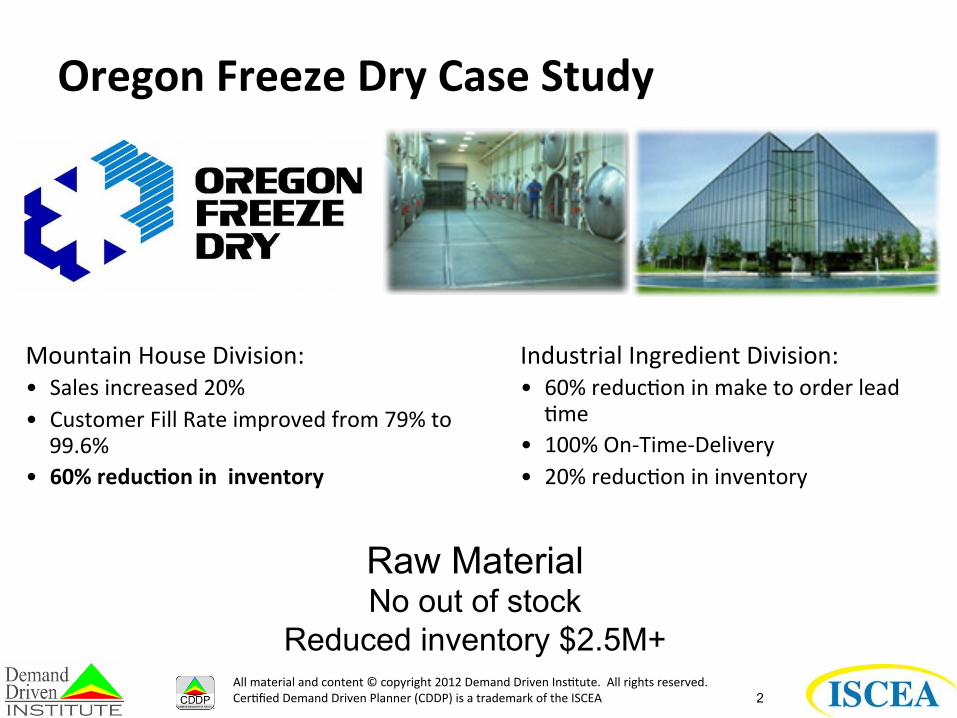
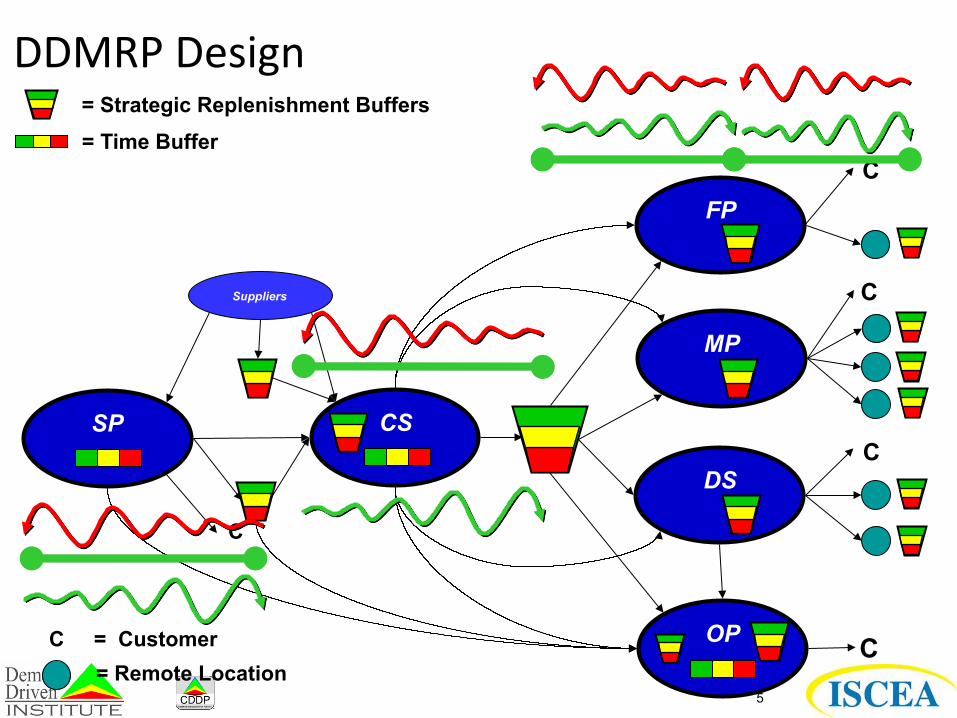
Synchroniza;on and Flow Challenge
C = Customer = Remote Location
Supply Variability
Distortions & amplification in
demand requirements reverberate backward
Demand / Information Variability
End Item Assembly inherits the amplifying upstream variability.
Lead Time before DDMRP
5
SP CS
OP
MP
C
C
Suppliers
C = Customer
DS
FP
C
C
= Remote Location
= Time Buffer = Strategic Replenishment Buffers
C
DDMRP Design
6
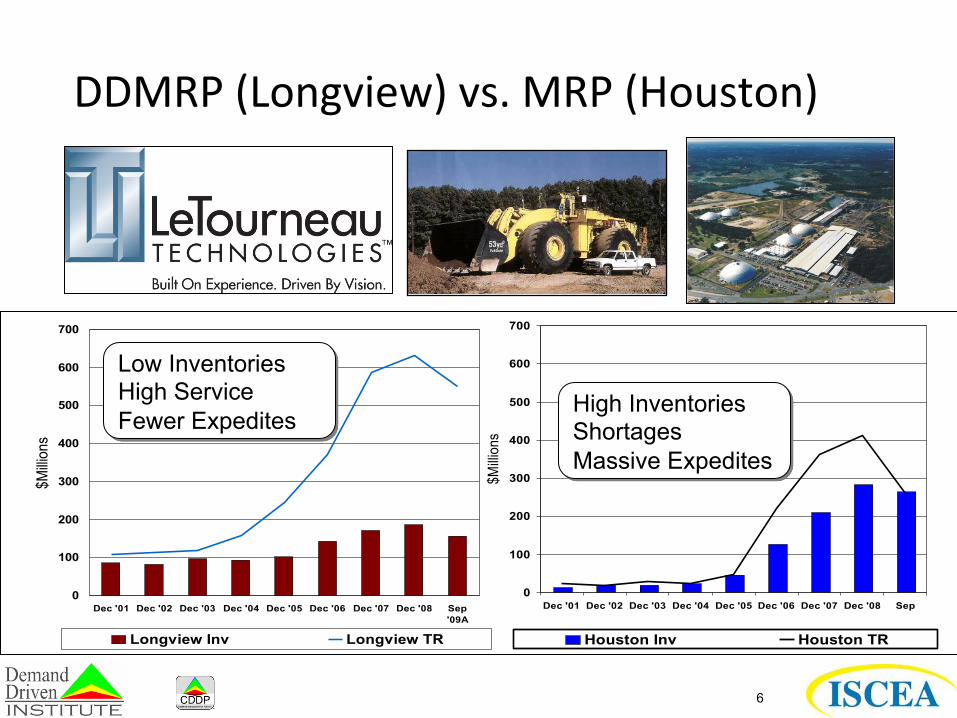
Stock-‐outs reduced by over 66%!
0
100
200
300
400
500
600
700
Dec '01 Dec '02 Dec '03 Dec '04 Dec '05 Dec '06 Dec '07 Dec '08 Sep'09A
$Millions
Longview Inv Longview TR
0
100
200
300
400
500
600
700
Dec '01 Dec '02 Dec '03 Dec '04 Dec '05 Dec '06 Dec '07 Dec '08 Sep
$Millions
Houston Inv Houston TR
High Inventories Shortages Massive Expedites
Low Inventories High Service Fewer Expedites
DDMRP (Longview) vs. MRP (Houston)
7
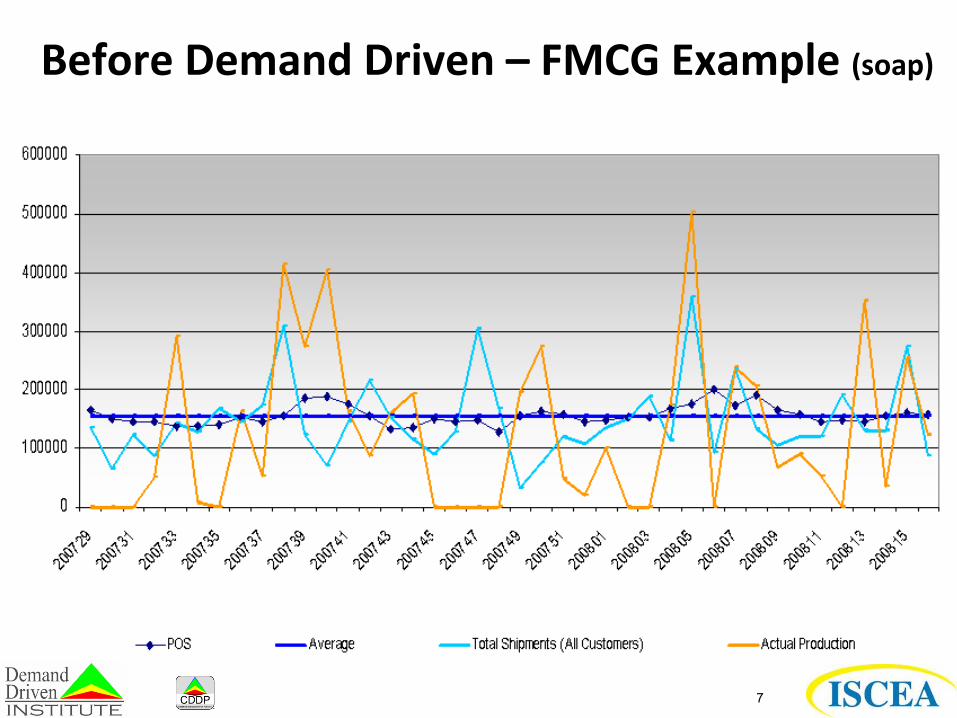
Before Demand Driven – FMCG Example (soap)

8
Raw
Pack
Mix Room
Pack 1
Pack 2
Pack 3
DC
DC
DC
DC 50+ Days
Planned Orders (MRP) Purchase Orders
Manufacturing Orders
Expedites/ Schedule Break-ins
Before Demand Driven – FMCG Example (soap)
9
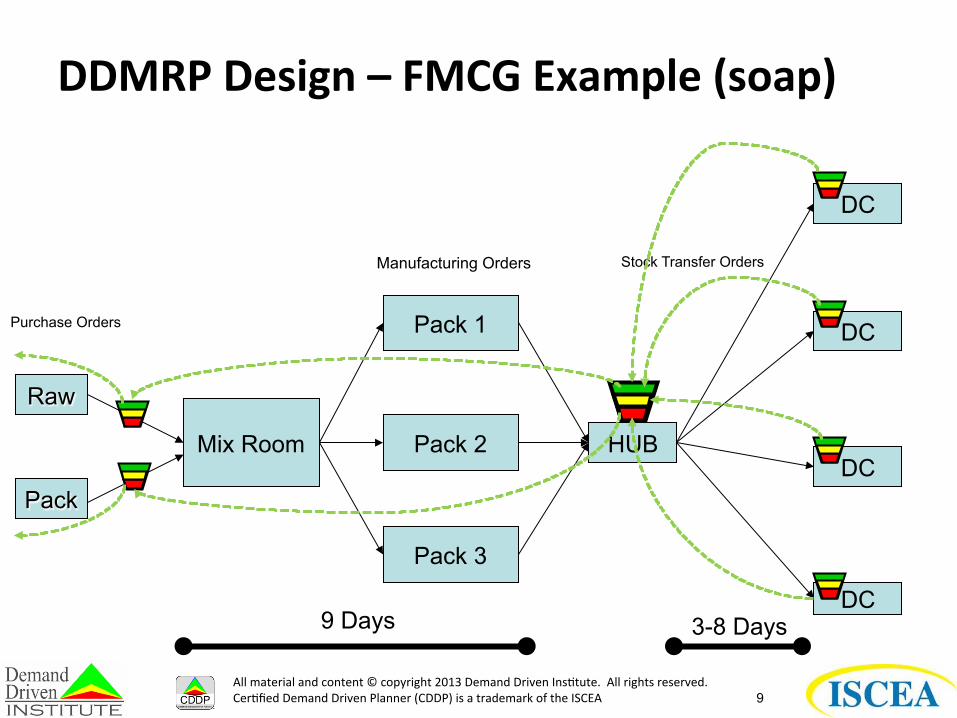
DDMRP Design – FMCG Example (soap)
All material and content © copyright 2013 Demand Driven Ins;tute. All rights reserved. Cer;fied Demand Driven Planner (CDDP) is a trademark of the ISCEA
Raw
Pack
Mix Room
Pack 1
Pack 2
Pack 3
DC
DC
DC
DC 9 Days
HUB
3-8 Days
Manufacturing Orders Stock Transfer Orders
Purchase Orders
10
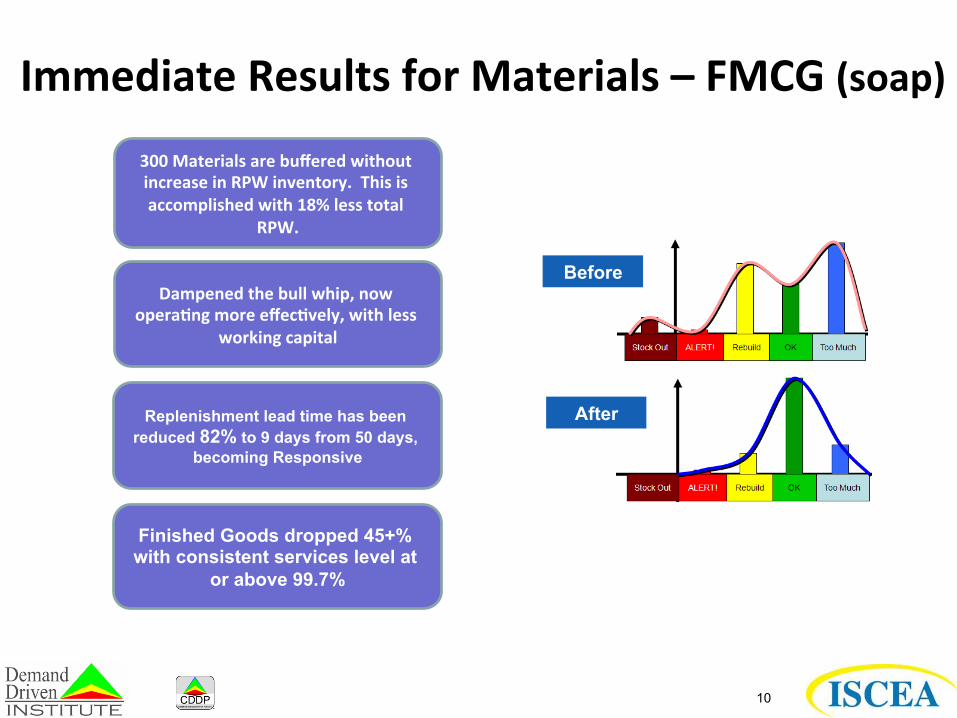
Immediate Results for Materials – FMCG (soap)
300 Materials are buffered without increase in RPW inventory. This is accomplished with 18% less total
RPW.
Dampened the bull whip, now opera?ng more effec?vely, with less
working capital
Before
After Replenishment lead time has been reduced 82% to 9 days from 50 days,
becoming Responsive
Finished Goods dropped 45+% with consistent services level at
or above 99.7%
A few cases from Orchestr8
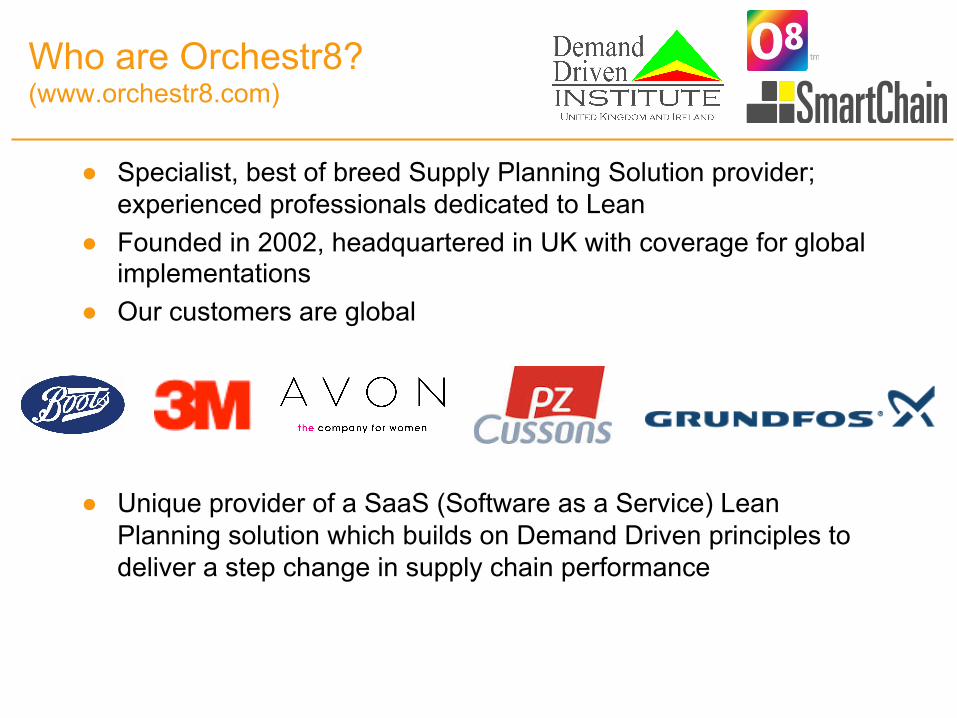
Who are Orchestr8? (www.orchestr8.com)
● Specialist, best of breed Supply Planning Solution provider; experienced professionals dedicated to Lean
● Founded in 2002, headquartered in UK with coverage for global implementations
● Our customers are global
● Unique provider of a SaaS (Software as a Service) Lean Planning solution which builds on Demand Driven principles to deliver a step change in supply chain performance
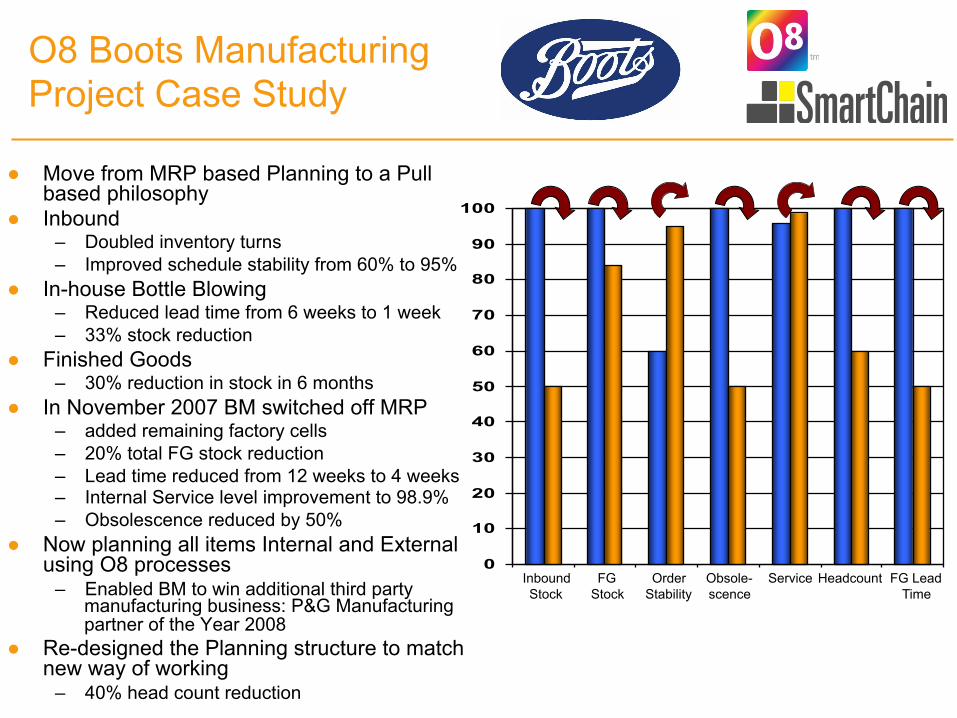
O8 Boots Manufacturing Project Case Study
● Move from MRP based Planning to a Pull based philosophy
● Inbound – Doubled inventory turns – Improved schedule stability from 60% to 95%
● In-house Bottle Blowing – Reduced lead time from 6 weeks to 1 week – 33% stock reduction
● Finished Goods – 30% reduction in stock in 6 months
● In November 2007 BM switched off MRP – added remaining factory cells – 20% total FG stock reduction – Lead time reduced from 12 weeks to 4 weeks – Internal Service level improvement to 98.9% – Obsolescence reduced by 50%
● Now planning all items Internal and External using O8 processes
– Enabled BM to win additional third party manufacturing business: P&G Manufacturing partner of the Year 2008
● Re-designed the Planning structure to match new way of working
– 40% head count reduction
0
10
20
30
40
50
60
70
80
90
100
Inbound Stock
FG Stock
Order Stability
Obsole- scence
Service Headcount FG Lead Time
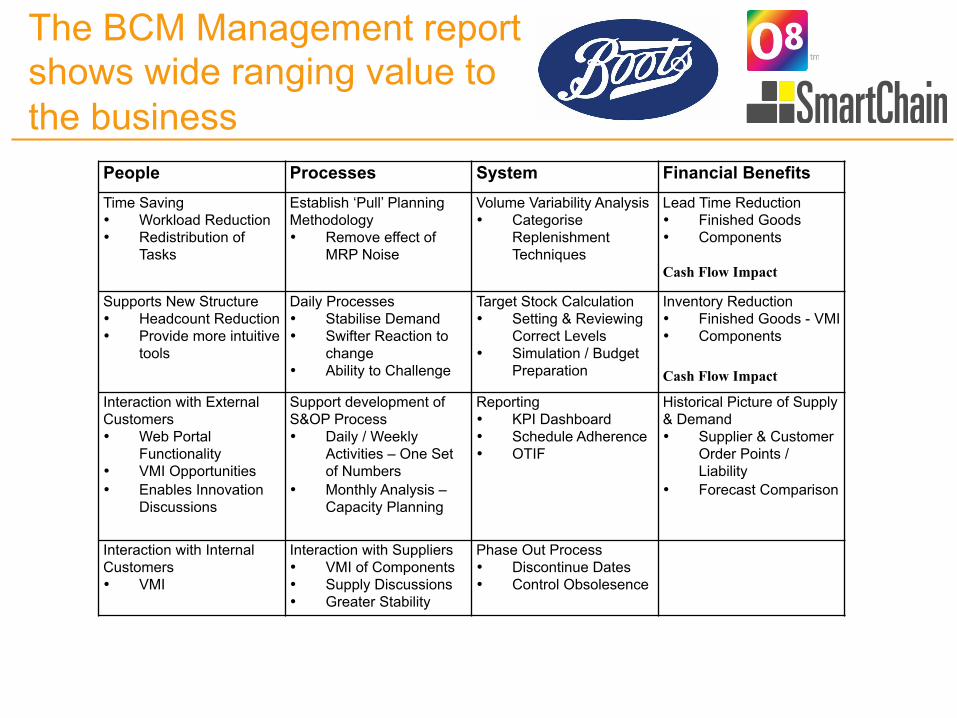
The BCM Management report shows wide ranging value to the business
People Processes System Financial Benefits
Time Saving • Workload Reduction • Redistribution of
Tasks
Establish ‘Pull’ Planning Methodology • Remove effect of
MRP Noise
Volume Variability Analysis • Categorise
Replenishment Techniques
Lead Time Reduction • Finished Goods • Components
Cash Flow Impact
Supports New Structure • Headcount Reduction • Provide more intuitive
tools
Daily Processes • Stabilise Demand • Swifter Reaction to
change • Ability to Challenge
Target Stock Calculation • Setting & Reviewing
Correct Levels • Simulation / Budget
Preparation
Inventory Reduction • Finished Goods - VMI • Components
Cash Flow Impact
Interaction with External Customers • Web Portal
Functionality • VMI Opportunities • Enables Innovation
Discussions
Support development of S&OP Process • Daily / Weekly
Activities – One Set of Numbers
• Monthly Analysis – Capacity Planning
Reporting • KPI Dashboard • Schedule Adherence • OTIF
Historical Picture of Supply & Demand • Supplier & Customer
Order Points / Liability
• Forecast Comparison
Interaction with Internal Customers • VMI
Interaction with Suppliers • VMI of Components • Supply Discussions • Greater Stability
Phase Out Process • Discontinue Dates • Control Obsolesence
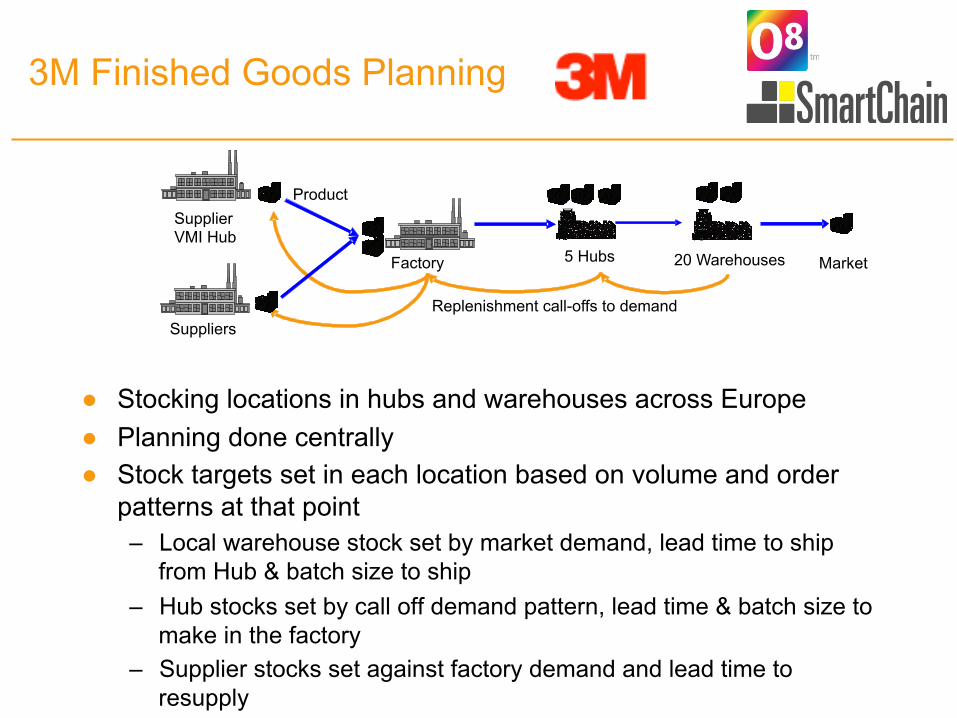
3M Finished Goods Planning
● Stocking locations in hubs and warehouses across Europe ● Planning done centrally ● Stock targets set in each location based on volume and order
patterns at that point – Local warehouse stock set by market demand, lead time to ship
from Hub & batch size to ship – Hub stocks set by call off demand pattern, lead time & batch size to
make in the factory – Supplier stocks set against factory demand and lead time to
resupply
Factory
Suppliers
5 Hubs 20 Warehouses
Product
Replenishment call-offs to demand Market
Supplier VMI Hub
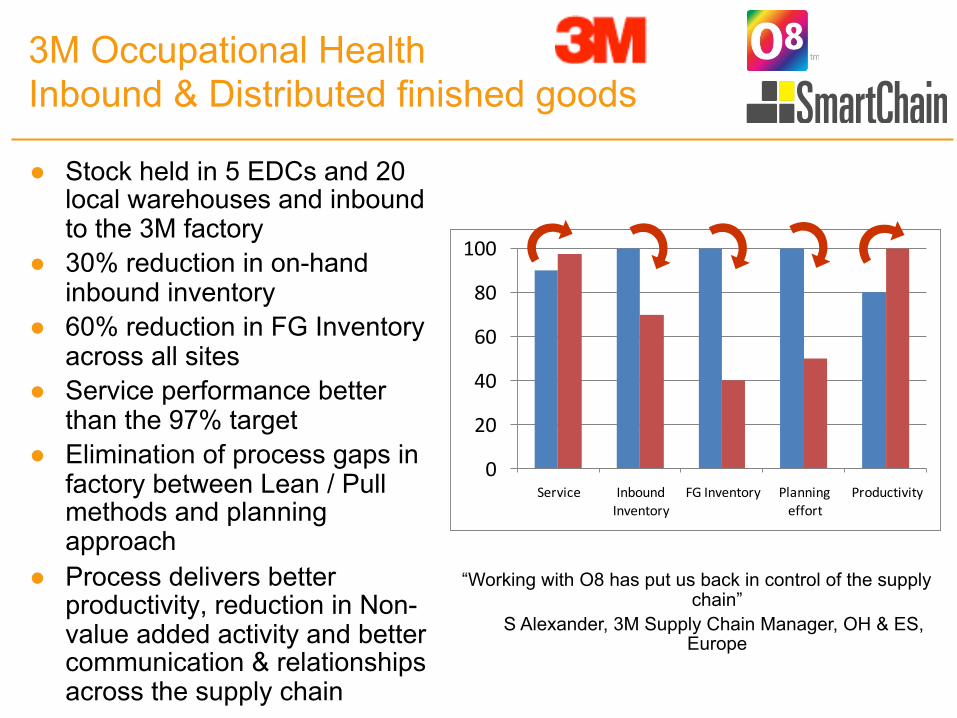
3M Occupational Health Inbound & Distributed finished goods
● Stock held in 5 EDCs and 20 local warehouses and inbound to the 3M factory
● 30% reduction in on-hand inbound inventory
● 60% reduction in FG Inventory across all sites
● Service performance better than the 97% target
● Elimination of process gaps in factory between Lean / Pull methods and planning approach
● Process delivers better productivity, reduction in Non-value added activity and better communication & relationships across the supply chain
0
20
40
60
80
100
Service Inbound Inventory
FG Inventory Planning effort
Productivity
“Working with O8 has put us back in control of the supply chain”
S Alexander, 3M Supply Chain Manager, OH & ES, Europe
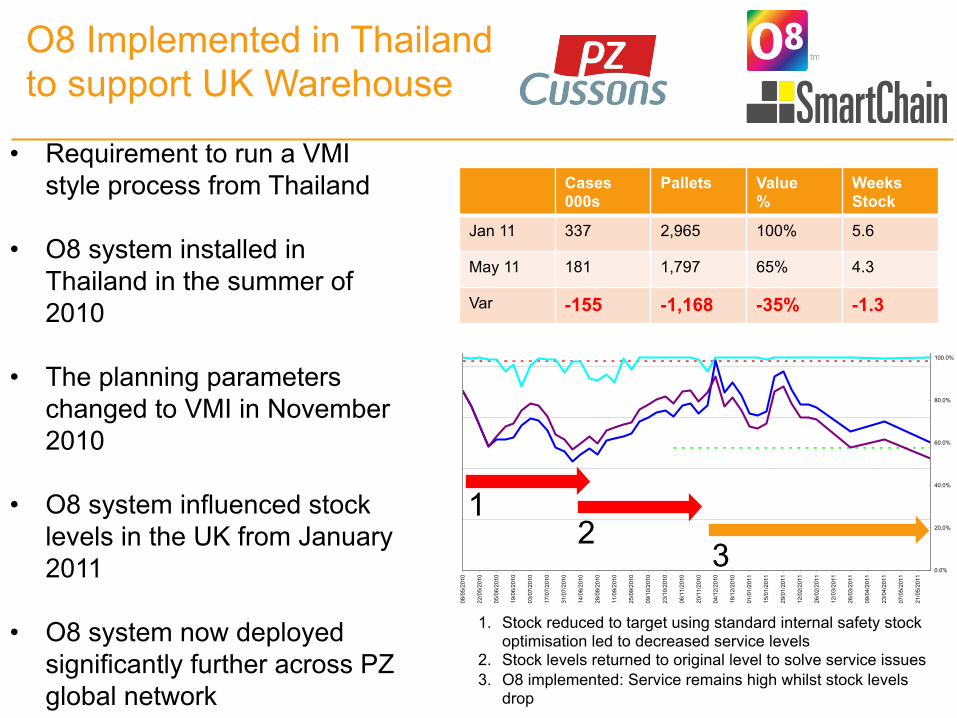
• Requirement to run a VMI style process from Thailand
• O8 system installed in Thailand in the summer of 2010
• The planning parameters changed to VMI in November 2010
• O8 system influenced stock levels in the UK from January 2011
• O8 system now deployed significantly further across PZ global network
Inventory Value and Customer Service Levels
0
500,000
1,000,000
1,500,000
2,000,000
2,500,000
08/0
5/20
10
22/0
5/20
10
05/0
6/20
10
19/0
6/20
10
03/0
7/20
10
17/0
7/20
10
31/0
7/20
10
14/0
8/20
10
28/0
8/20
10
11/0
9/20
10
25/0
9/20
10
09/1
0/20
10
23/1
0/20
10
06/1
1/20
10
20/1
1/20
10
04/1
2/20
10
18/1
2/20
10
01/0
1/20
11
15/0
1/20
11
29/0
1/20
11
12/0
2/20
11
26/0
2/20
11
12/0
3/20
11
26/0
3/20
11
09/0
4/20
11
23/0
4/20
11
07/0
5/20
11
21/0
5/20
11
0.0%
20.0%
40.0%
60.0%
80.0%
100.0%
120.0%
CSL Tgt CSL ActAct Val Tgt ValValue as at May costs
O8 Implemented in Thailand to support UK Warehouse
1. Stock reduced to target using standard internal safety stock optimisation led to decreased service levels
2. Stock levels returned to original level to solve service issues 3. O8 implemented: Service remains high whilst stock levels
drop
Cases 000s
Pallets Value %
Weeks Stock
Jan 11 337 2,965 100% 5.6
May 11 181 1,797 65% 4.3
Var -155 -1,168 -35% -1.3
1 2
3
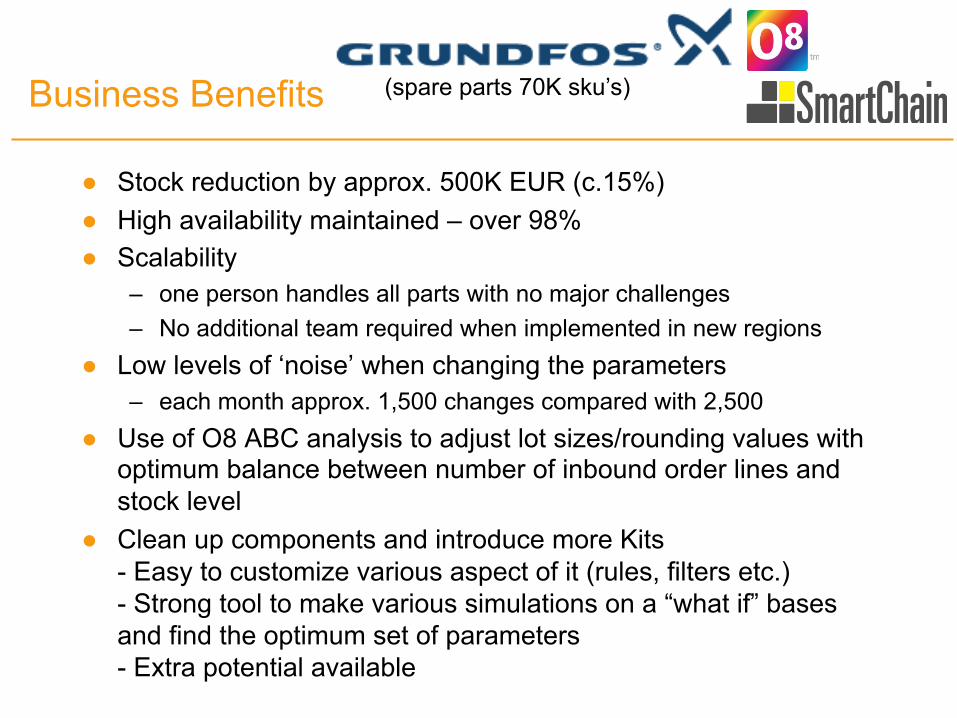
GDS planning model with O8 Business Benefits
● Stock reduction by approx. 500K EUR (c.15%) ● High availability maintained – over 98% ● Scalability
– one person handles all parts with no major challenges – No additional team required when implemented in new regions
● Low levels of ‘noise’ when changing the parameters – each month approx. 1,500 changes compared with 2,500
● Use of O8 ABC analysis to adjust lot sizes/rounding values with optimum balance between number of inbound order lines and stock level
● Clean up components and introduce more Kits - Easy to customize various aspect of it (rules, filters etc.) - Strong tool to make various simulations on a “what if” bases and find the optimum set of parameters - Extra potential available
(spare parts 70K sku’s)
GDS planning model with O8
Process benefits achieved with O8
● Monthly target process down to 2 days using standard rules ● System provides full simulation capability to trial alternate rule
settings and support new implementations ● Control provided through the Phase In / Out controls ● Removal of mistakes through elimination of spread sheets ● ‘Cloud’ system allows installation across multiple SAP instances
– Now live in Singapore – Current roll out in Australia and India
● Easy to customize various aspect of it (rules, filters etc.)