Embed Size (px)
Citation preview

2002-01-3359
Demands on Formula One Engines and Subsequent Development Strategies
Hans Alten and Mario Illien ILMOR Engineering Ltd.
Copyright © 2002 Society of Automotive Engineers, Inc.
ABSTRACT This paper will present the most important tools and features required for the development of the FO110 3.0L V10 Mercedes engine.
The demands on the natural aspirated 3.0L gasoline engine are discussed by the use of recorded data from trackside. Based on these findings the most important measures to achieve maximum power output and drivability will be discussed. The presentation will mainly focus on the thermodynamic and gasdynamic aspects of the V10 engine to ensure optimum volumetric efficiency. This includes the tuning of the inlet and exhaust system as well as optimisation of valve timings and combustion analysis work. The used simulation and measurement tools are discussed and the most important parameters will be investigated in detail. The advantages and the limitations in terms of accuracy and sensitivity of simulation programs and used measurement technology, applied in high revving race engines, will be shown.
Finally, there will be a prediction of future development strategies, seen from the thermodynamic point of view.
But, we should like to point out, that - due to the intense competition - no design or other technically related details can be published in this paper.
INTRODUCTION ILMOR Engineering Ltd. was founded in 1984 by Mario Illien (CH), Paul Morgan (GB) and Roger Penske (USA) to build the Methanol fuelled V8 engines for the PPG-CART Series, today’s Champ Car Series. Five years later the first drawings were created to start the in-house production and development of the V10-NA-Gasoline engine for the Formula 1 Series. Entering into Formula
One in 1991, ILMOR supplied teams such as Leyton-House, Tyrell, March-F1 and Sauber before their partnership with Mercedes-Benz to supply McLaren (1994). They have now won 31 Formula One Grand-Prix with the West McLaren Mercedes team, powering the team to win the 1998 Driver’s and Constructor’s World Championships, Mika Häkkinen to take his second consecutive Driver’s World Championship title in 1999 and finishing second in the Constructor’s World Championship in 1999, 2000 and 2001.
The worldwide interest and huge success of F1 is very challenging for chassis and engine designers. The result of the engineering work is reflected in the permanent increase in engine power, faster cars and therefore in shorter lap times. Such top-class competitions require the use of the best and latest technology resources for the development of current and future engines, which can only be afforded by bigger car manufacturers. At present (2002), only BMW, Ferrari, Ford, Asiatech, Honda, Mercedes and Toyota are supplying engines to the F1- teams.
The ability to win a Formula 1 race, or even the world championship, is based on several different key points, like the skill of the driver, the design and set-up of the car, engine performance and reliability, the tyres, the work and effort of the mechanics and the chosen strategy. This means that overall, the team has to be well organized and everyone has to perform their best. The competition in the F1 World and the investment of each team and sponsor is too high to allow for even minor mistakes to be made in the preparation, during the development phase and at the race weekend itself.
While in the past, a small group of designers and engineers could focus on the manufacture and development of an F1-engine, today’s engines require the most up-to-date technology. Everything from advanced design and simulation programs to profiled experts in terms of metallurgy and electronics, the highest quality machinery and sophisticated steady state
1

and transient test beds are involved in developing and testing these high-performance race engines. Despite all this, the aim of motor racing has not changed in the last 100 years:
Build the most powerful engine possible within the specified regulations, minimize the weight and fuel consumption, lower the centre of gravity of the aggregate and make it last for at least one race distance.
Extract from the FIA Regulations for F1 engines [1]:
5.1.1 Only 4-stroke engines with reciprocating pistons are permitted.
5.1.2 Engine capacity must not exceed 3000 cc.
5.1.3 Supercharging is forbidden.
5.1.4 All engines must have 10 cylinders and the normal section of each cylinder must be circular.
5.1.5 Engines may have no more than 5 valves per cylinder.
Furthermore, variable geometric length exhaust systems are forbidden. Internal spraying of water or any substances other than fuel for the purpose of combustion is prohibited. Pistons, cylinder heads and cylinder blocks may not be composite structures, which use carbon or aramid fibre reinforcing materials. The basic structure of the crankshaft and camshafts must be made from steel or cast iron. Finally, under §15.1.2: No parts of the car may be made from metallic materials, which have a specific modulus of elasticity greater than 40 GPa / (g/cm3). The regulation for the (unleaded) fuel specification is very restrictive.
The present swept volume of 3.0L was introduced in 1995 and currently (2002) all competitors are running with V10 engines. Before that, the series had to use 3.5L naturally aspirating engines for seven years. V8, V10 and V12 engine were quite common.
MERCEDES BENZ FO110J ENGINE The development of the FO110J engine started in 1999 and was based on the successful H-engine. It was introduced at the first race of the season, in Australia in March 2000, and by the end of the season the McLaren team scored 152 points in total. The two drivers, Mika Häkkinen and David Coulthard, won 7 races and finished second and third in the Driver’s World Championship.
In compliance with the technical regulations the following design features were used: Block, head, cam cover and crankcase are cast of an aluminium alloy. The block
carries separate NIKASIL coated aluminium alloy liners. The cylinder heads contain copper-beryllium valve seats and valve guides. The camshafts and crankshaft are machined from solid steel. The connecting rods and valves are made from titanium, while the connecting rod is “I” rather than “H” section. Crankshaft journals are running in plain, shell type, main bearings. There is a main bearing journal each side of each big end journal, where connecting rods from opposing cylinders are paired. Each camshaft has a number of bearings equal to the number of main bearings. Usually, camshafts operate inverted bucket type valve tappets with shim adjustment. Pneumatic systems are used for valve motion control. Pistons are made of a special aluminium alloy, short skirt and carry two small, light rings. An oil spray on the underside of the piston crown is used for cooling the pistons. The cylinders have a hemi-spherical shaped roof, including one central spark plug and 2 inlet and 2 exhaust valves. The piston crown surface is designed according to the cylinder head surface, including the valve clearance pockets. The engine has a V-angle of 72 deg and weighs approximately 95kg (without oil and water).
The engine had achieved a power level of approximately 800hp at the beginning of the year – with maximum engine speed around 17400rpm. Both, the maximum power and the engine rev increased to the end of the season by about 2%.
Today’s maximum engine speeds are well over 18000rpm.
ENGINE DEMAND On Saturday afternoon each driver has to qualify for Sunday’s race - all drivers have to be inside the 107% time limit. Due to the fact that overtaking during the race gets more and more difficult it is very important to start the race in a front row position. Therefore, the fastest laps were always done in qualifying sessions. The whole set-up of the car is optimised for this session; it’s the most demanding lap for the driver, the chassis and the engine.
Apart from 4 races on street courses (Melbourne, Monaco, Montreal and Spa-Francorchamps) all other F1 races are held on specially built race circuits. The average lap distance is approx. 4.9 km (3.1 miles) and the average velocity is about 208 km/h (130 mph).
To work out a statistically based overview of the engine demands, the fastest lap of the qualifying is analysed.
In Figure 1 the average engine speed is shown for all 17 circuits, as taken from the fastest driver from the McLaren Team.
2

Fig 1: Mean Engine Speed, Qualifying (Season 2000)
Of further interest is the time of running under fully open throttle (ALFA>95%). In Figure 2, the most demanding power circuits are Monza (Italy) and A1-Ring (Austria). Due to the wet weather during the race weekend in Hockenheim (Germany) and Spa (Belgium), the data does not show the maximum demands of these circuits possible in dry conditions.
Fig 3: WOT-Time analysis, Qualifying (Season 2000)
Conclusion:
F1-Engines must be developed for maximum power output. Highest possible torque is essential, but is mainly important for driveability reasons. High torque output at 100% throttle position allows a more accurate tuning and controlling of the torque level at different opening angles – the engine can be set up less sensitive on various pedal positions. This helps for improved drivability of the engine.
Fig 2: WOT-Time Analysis, Qualifying (Season 2000)
When analysing the WOT operating points for the fastest and slowest circuit (Monza and Monaco), it can be seen that the engine is used mainly in the top speed range. The very tight and slow corners of the street-circuit in Monaco cause a slow engine rpm, down to less than 4000 rpm. If the WOT torque output is optimised for a wide rpm range, the delivered force will cause traction problems below 9000 rpm – the drive will lift the throttle and control the acceleration in part load conditions.
POWER DEVELOPMENT
The maximum specific torque output of an internal combustion engine is driven by the following key values:
• Maximum volumetric efficiency
• Optimised combustion process
• Minimized friction losses
The maximum specific power performance is specified by the factor TORQUE x RPM. To deliver a competitive race engine, the highest power output is necessary, but low overall weight, a low centre of gravity, durability and low fuel consumption have to be considered as well.
BASIC THERMODYNAMICS:
The effective engine power output is defined by the following terms:
PE [kW] = BMEP x VOL x n / 1200, (1)
where the brake mean effective pressure is
BMEP = IMEP – FMEP. (2)
3
The indicated mean effective pressure IMEP can be divided into two sub events during the entire cycle period of 720 deg CRA:
dVpV
IMEPIMEPIMEP PH 1∫ ⋅⋅
=+= (3)
IMEPH ……………………High-pressure-MEP, -180 - 180° CRA
IMEPEX = IMEPEX + IMEPIN……Pumping-MEP, 180° - 540° CRA
p……..…………………….…………………..In-cylinder pressure
PE……..…………………….…………………….Power (effective)
V……..…………………….…………………..…..Cylinder volume
CRA……..…………………….……………….…..…..Crank Angle
The friction mean effective pressure FMEP in equation (2) contains all losses due to internal friction and all auxiliary drives. This data is related to the mean piston speed and is significantly lower in comparison to common road engines. On the other hand, even with extremely short stroke lengths, today’s F1 engines exceed mean piston velocities of 27m/s. This limit defines the size of the bore - the engine has to have a bore diameter of at least 90 to 92 mm. To predict an IMEP and/or a number for the volumetric efficiency at rated speed, an absolute friction value has to be predicted. In a simple assumption a FMEP from common road engines can be taken into account, running with approx. 18m/s mean piston speed at 6000 to 6500 rpm. This leads to a simplified equation to calculate the friction losses as function of the mean piston speed vP: FMEP = 0.3 + 0.04*(vP)1.3 (4) These basic equations and assumptions are a good starting point to work out some key dimensions of an F1-race engine, which has to run with a volumetric efficiency of at least 116% at 17000rpm to achieve a power output of nearly 800hp.
1D ENGINE SIMULATION:
To predict the performance data of an internal combustion engine, several highly developed computer codes are commercially available and are a standard tool in the entire engine performance process. The basis of this simulation tool is an engine model, containing all pipes and manifolds, which are connected via various boundary elements. The most common elements – such as cylinder, plenum, throttle, junction, injector or carburettor model, system boundaries and air filter models - allow arbitrary combinations to build up nearly all types of engines. Fast solvers had been developed to solve the non-linear partial differential equations of the
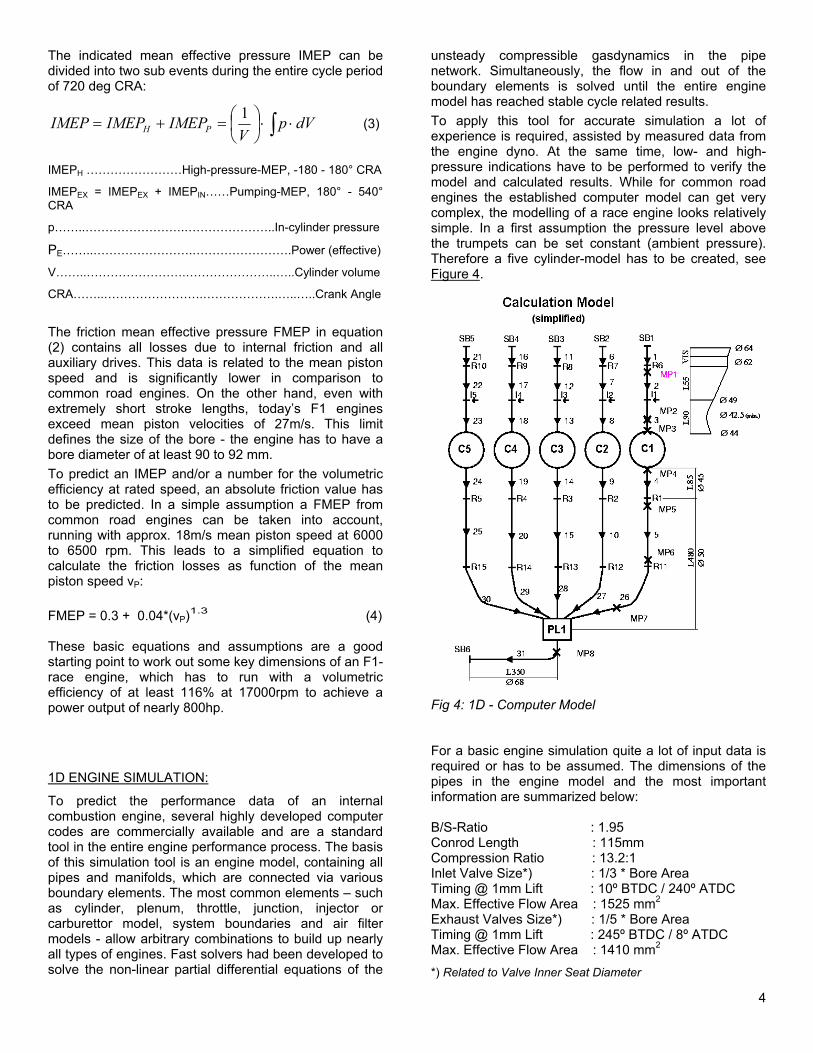
unsteady compressible gasdynamics in the pipe network. Simultaneously, the flow in and out of the boundary elements is solved until the entire engine model has reached stable cycle related results. To apply this tool for accurate simulation a lot of experience is required, assisted by measured data from the engine dyno. At the same time, low- and high- pressure indications have to be performed to verify the model and calculated results. While for common road engines the established computer model can get very complex, the modelling of a race engine looks relatively simple. In a first assumption the pressure level above the trumpets can be set constant (ambient pressure). Therefore a five cylinder-model has to be created, see Figure 4.
Fig 4: 1D - Computer Model For a basic engine simulation quite a lot of input data is required or has to be assumed. The dimensions of the pipes in the engine model and the most important information are summarized below: B/S-Ratio : 1.95 Conrod Length : 115mm Compression Ratio : 13.2:1 Inlet Valve Size*) : 1/3 * Bore Area Timing @ 1mm Lift : 10º BTDC / 240º ATDC Max. Effective Flow Area : 1525 mm2 Exhaust Valves Size*) : 1/5 * Bore Area Timing @ 1mm Lift : 245º BTDC / 8º ATDC Max. Effective Flow Area : 1410 mm2
*) Related to Valve Inner Seat Diameter
4
To predict realistic values for the in-cylinder pressure traces, a simplified heat release model for the combustion process has to be assumed. Therefore, the well-known VIEBE function is used with fixed combustion duration of 85deg CRA. N.B.: More details about 1D engine simulation technology can be found in [2, 3 and 4]. Performance data for race engines and power predictions have already been discussed and published in [5, 6 and 7]. Results: Under consideration of the specified geometries and engine related input data, the computer model was set up to predict all main engine performance data from 7000 to 19000 rpm. The results in terms of volumetric efficiency and power are shown in Figure 5.
Fig 5: Calculated Engine Performance data INLET OPTIMIZATION:
The entire inlet system (the incoming air snorkel above the driver’s helmet, the airbox and the design and dimensions of the trumpet-manifold-port track) is most critical for the engine output characteristic and is subject of ongoing research and development.
The shape of the torque output and the engine speed of maximum power are mainly determined by the inlet length, the inlet area profile and the timing of the inlet valves (IVC). Due to the wide speed range, a high and smooth torque characteristic is requested. Therefore, variable inlet systems (VIS, dynamically controlled by hydraulic devices) are state of the art in today’s F1 engines. As shown in Fig.5, an increased runner length of 20 mm changes the characteristic by more than 1000 rpm to the lower speed. The cross sectional area – from the trumpets to the valves – is responsible for the flow velocity (kin. energy) and the pressure amplitude. The latter in particular is responsible for the high charging rate just at the time when the inlet valves are closing.
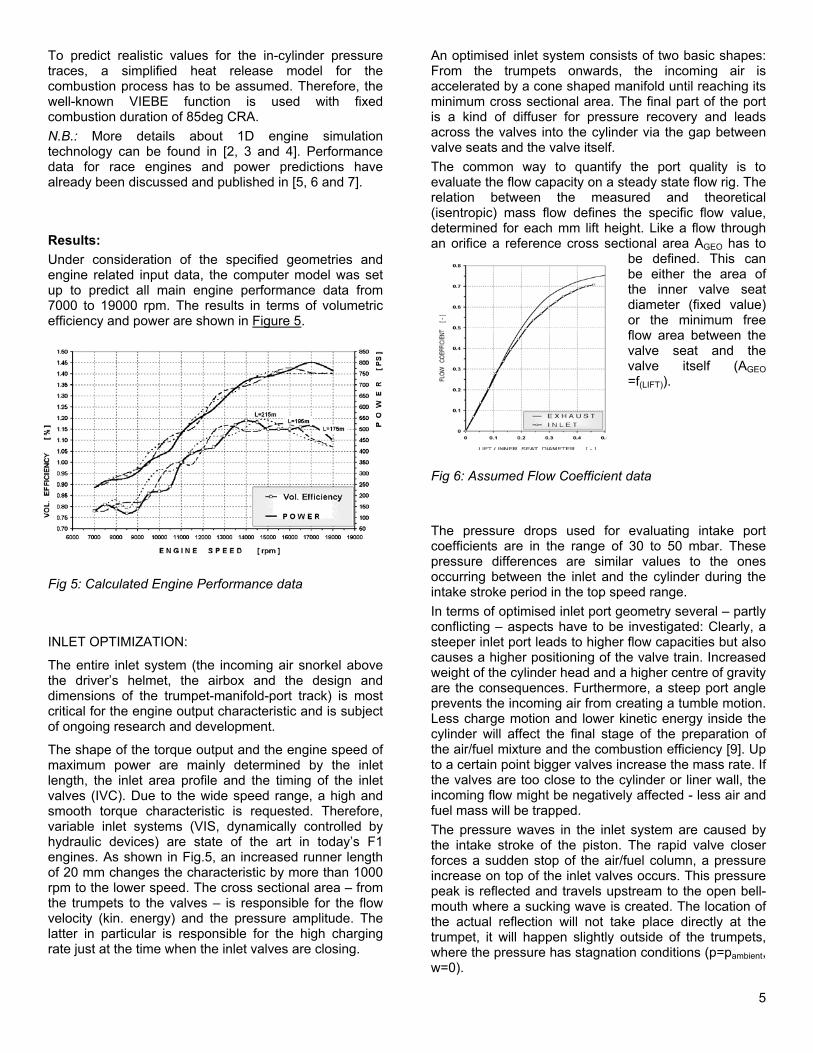
An optimised inlet system consists of two basic shapes: From the trumpets onwards, the incoming air is accelerated by a cone shaped manifold until reaching its minimum cross sectional area. The final part of the port is a kind of diffuser for pressure recovery and leads across the valves into the cylinder via the gap between valve seats and the valve itself. The common way to quantify the port quality is to evaluate the flow capacity on a steady state flow rig. The relation between the measured and theoretical (isentropic) mass flow defines the specific flow value, determined for each mm lift height. Like a flow through an orifice a reference cross sectional area AGEO has to
be defined. This can be either the area of
the inner valve seat diameter (fixed value) or the minimum free flow area between the valve seat and the valve itself (AGEO =f(LIFT)).
Fig 6: Assumed Flow Coefficient data The pressure drops used for evaluating intake port coefficients are in the range of 30 to 50 mbar. These pressure differences are similar values to the ones occurring between the inlet and the cylinder during the intake stroke period in the top speed range. In terms of optimised inlet port geometry several – partly conflicting – aspects have to be investigated: Clearly, a steeper inlet port leads to higher flow capacities but also causes a higher positioning of the valve train. Increased weight of the cylinder head and a higher centre of gravity are the consequences. Furthermore, a steep port angle prevents the incoming air from creating a tumble motion. Less charge motion and lower kinetic energy inside the cylinder will affect the final stage of the preparation of the air/fuel mixture and the combustion efficiency [9]. Up to a certain point bigger valves increase the mass rate. If the valves are too close to the cylinder or liner wall, the incoming flow might be negatively affected - less air and fuel mass will be trapped. The pressure waves in the inlet system are caused by the intake stroke of the piston. The rapid valve closer forces a sudden stop of the air/fuel column, a pressure increase on top of the inlet valves occurs. This pressure peak is reflected and travels upstream to the open bell-mouth where a sucking wave is created. The location of the actual reflection will not take place directly at the trumpet, it will happen slightly outside of the trumpets, where the pressure has stagnation conditions (p=pambient, w=0).
5

To illustrate this phenomenon Figure 7 shows recorded pressure traces 15 mm upstream of the inlet valves. In addition, the calculated values – performed with the geometric and corrected length – are shown. Such a small phase shift causes a shift of the calculated engine performance data to a 200rpm higher speed range.
The starting points are along the X-Axis at phi=0 deg, at different crank angle positions and on top of the trumpets (X=0). One special point was chosen at the end of the inlet period, just before the inlet valves are closing. A small amount of already trapped mass flows out of the cylinder and will stay above the valves until the next inlet stroke. Then this mass will be the first to get sucked into the
Fig 7: Inlet Pressure Data, n=14500rpm A similar effect was experienced when investigating an overhead vs. a side injector positions. The different gas properties of pure air and the air/fuel mixture affect the speed of sound – the modelling length of the inlet system has to be adjusted once more. In general, the dimensions of the trumpets and manifolds, the design of the transition from the port into the cylinder, the length of the bifurcation, the geometry of the valve seats, the shape of the valves and the port surface quality are the most critical areas in terms of maximum volumetric efficiency – but also a major part of the combustion development process. To visualise the pressure and velocity activities in the whole inlet track the calculated flow speed in each grid node was taken into account to calculate several particle paths, see Figure 8.
Fig 8: Calculated Particle Paths, n=16500rpm
cylinder. A further tool in the optimisation process of the inlet system is the use of 3D CFD simulation programs. This tool can be applied to simulate steady flow conditions through ports to predict flow coefficient values at different valve positions. It takes more effort to perform transient CFD simulation with moving piston and valves. In particular the meshing of the small volumes between the valves and the piston during the overlap period is most demanding and requires a lot of experience.
Fig 9: Steady State Flow Pattern, Calculated and Measured Figure 9 shows a 3D flow simulation of a steady flow test through an intake port. This work was performed to evaluate a method of predicting the tumble values from the upstream and downstream flow. To verify the computed flow pattern, the velocity profile underneath the cylinder head was measured by using the LDA measurement technique. In parallel, the tumble motion was also evaluated on a special tumble rig [8, 9 and 10]. The great advantage of unsteady CFD simulation work is to get a better understanding of the flow characteristic along the port surface and inside the cylinder. Like in 1D- computer simulation the trapped mass at inlet valve closer can be predicted. Furthermore, with a fuel injector model the vaporisation process. Wall wetting problems and the mixture distribution inside the cylinder can be investigated. Finally, when the calculated combustion process (ROHR) correlates with measured data this tool can be applied for pre-optimisation of several main parameters and can save time, manufacturing and test costs.
6

EXHAUST OPTIMIZATION The aim of a successful emptying process is to minimize the required work for pushing out the residual gases and to scavenge the cylinder from burned gases. This target can be achieved by minimising the pressure losses of the exhaust ports and pipes (flow coefficients of the ports, low mean exhaust backpressure) and – for scavenging purposes – to create a sucking wave during valve overlap period. As shown in the engine model (½V10 model in Fig. 4), the exhaust system of an F1 engine is made up of 5 primary pipes, a simplified 5-in-1 collector and a tail pipe. During the pre-optimising of the exhaust manifold dimensions the correct modelling of the collector is essential. While for standard 2-in-1 T-junctions the flow coefficients are well known, the corresponding coefficients for the in- and outflow of the small plenum have to be evaluated from measured pressure data. Figure 10 shows a pressure trace of the exhaust measured approx. 150 mm away from the flange (MP5 in the computer model). This distance was chosen to allow the mounting of a water-cooled pressure sensor on the primary pipe. Pressure measurements directly in the exhaust port have not been very successful. This might have been caused by the heterogeneous flow structure and the strong pressure gradients along the cross sectional area.
Fig 10: Exhaust Pressure Data, n=16500rpm As seen from the measured and calculated pressure traces the absolute p-level is lowest at around scavenging TDC. These (backward running) sucking waves are initiated by reflecting the main exhaust pulse in the collector and at the end of the tail pipe. The time of travelling downstream and backwards depends on the pipe lengths, the speed of sound (a function of temperature) and the actual flow velocity. Mainly the unsteady flow velocity during the blow down event makes it practically impossible to predict precisely the optimum pipe lengths by using standard equations.
When fitting the engine with single exhaust pipes the main exhaust backpressure is significantly lower. On the other hand, the different pressure waves lead to slightly more torque in the lower speed range, but cause less power output in the mid and high speed range. When the exhaust valves open (approx. 95 deg ATDC) the in-cylinder pressure is above 10bar, sonic speed occurs inside the seat gap for about 50 deg CRA at rated speed. Therefore, the development work for exhaust ports is performed under sub-sonic and super-sonic conditions. The results have to be considered in the 1D engine simulation work.
COMBUSTION ANALYSIS
The analysis and evaluation of the combustion process is a fixed part of the engine development work of F1 engines. The access to the heat release data is a thermodynamically based post-process of the cylinder pressure signals and can be carried out by simple equations in real time or - more advanced - under consideration of detailed boundary conditions.
Before any combustion data is discussed, a brief overview of indication technology and the specific problems in racing applications are summarized: For exact IMEP and combustion data analysis the pressure signals have to be recorded for at least every degree crank angle. Therefore, an optical pick-up and a trigger disk have to be fitted. The ILMOR designed MERCEDES V10-engine is front-sealing. Therefore, additional space between the rear end and gearbox has to be found for mounting the encoder disc. This causes a relatively big disk diameter and makes the system even more sensitive to stagger movements. Oil vapour, clutch dust and high temperatures are additional handicaps. The tight design of the combustion chamber does not allow the use of water-cooled thermal shock resistive high-pressure sensors. Therefore, only un-cooled piezo electric pressure transducers can be mounted with a front size of 5 to 8mm. Furthermore, the quality of the pressure signals and the lifetime suffer under the high vibration and extreme acceleration motion. Nevertheless, the latest technology of these small sensors is showing good acceleration compensation and good thermal behaviour.
When all mechanical problems are sorted out, the hardware of the data acquisition system and the software has to be adapted for the demands of high-speed race engines. Due to the limited endurance the measurements on the dyno can only be done during a limited time period of approx. 15 to 20 seconds. This time window is long enough to stabilise all engine parameters and to execute the measurements.
7

This process lasts for at least 3 seconds (dyno data) and/or 100 consecutive cycles for buffering all pressure signals. At the end of the measurements the engine will rest for a while at low load and low rpm – the remaining time must be long enough to save the results.
Fig 11: Cylinder Pressure and Combustion Data Figure 11 shows the in-cylinder pressure of 50 consecutive cycles of cylinder no. 5 (rear end) recorded at rated speed. It is quite obvious that race engines do not have stable filling conditions and the mixture preparation quality is different from one cycle to the other (expressed in the coefficient of cycle to cycle variation). Therefore, the data have to be averaged before the examination of heat release analysis can be performed. The bottom graph in Fig.11 shows the mass fraction burned (MFB) and the rate of heat release (ROHR) re-calculated with an in-house developed computer program. This post processing program was written for specific research demands, in particular for parameter variations, to study the effect of various different fuels and the corresponding gas properties, the effect of simplified and advanced heat transfer equations and to perform fast VIEBE approximation for the gas exchange simulation work.
The thermodynamic basis of the evaluation of the heat release data is to calculate a motored cycle and the required heat input to achieve the same pressure as measured. The fundamental equation is briefly shown in Figure 12 – more details in the specific literature and published papers [11, 12 and 13].
Fig 12: Thermodynamic System and Equations In all modern indication systems fast heat release algorithms are embedded to allow online diagnosis for the centre of combustion (50% of total heat input) to adjust the ignition timings for MBT and to investigate nock sensitivity. Due to the high speeds and fast incoming data rate the online optimisation is inaccurate - hence not used. All these efforts in terms of indicated data – low and high-pressure side - are performed to get detailed information of the gas exchange process and the high-pressure cycle. For power development work the measured torque under steady state conditions is most essential. Therefore, the calibration of the load cells is part of the daily work. Although a lot of effort is put into precise and accurate measurement of the air and fuel consumption and of a consistent conditioning system, unstable conditions in the air supply system (pressure, temperature and humidity) must be prevented.
8

ENGINE PERFORMANCE SIMULATION:
The aim of the 1D engine simulation is to provide a tool for the development engineer, which enables to calculate the main engine performance data like power and torque output, as well as specific details about peak cylinder pressure and the air and fuel consumption. Furthermore, the program has to predict correctly the influence when modified boundary conditions are assumed. Therefore, before any parameter variations are investigated the accuracy of the baseline results has to be examined in detail.
What quality in terms of “Main Engine Performance Data” can be expected for a Formula One engine simulation? In Figure 13 a comparison of the measure power, peak firing pressure and IMEP values for the high and low-pressure period are compared to measured data. Generally speaking, the achieved accuracy is in the range of ±1.5%, which is satisfying enough - but is higher as the engine output varies from one built to the other.
modified airbox designs are tested the assumption of constant pressure at the trumpet orifice is not valid. Even changes to a full V10-engine model with various different airbox modelling cannot predict correct the effect on the gasdynamics in the individual inlet manifolds. The limit for the 1D simulation is reached as well, when geometric dimensions of the port design or different fuel injection systems are considered, which might lead to changed in-cylinder flow conditions and are affecting the combustion process. Therefore, the engine model has to be constantly verified and up-dated to latest engine specification. ACCELERATION SIMULATION:
From the engine development point of view the effect of changed power characteristic in correlation with optimised gear ratios, different fuel consumption and the consequences of modified centre of gravity are of great interest. In certain stages during the engine development phase different torque shapes can be set-up. To quantify these parameters a computer code was developed to calculate the vehicle acceleration, specifically tailored for the demands of racecars. This means that several essential coefficients inside the main motion equation (5) are taken into account by tables or by mathematically defined sub-functions. In particular, the following main features are implemented for a correct acceleration simulation:
• Drag, front and rear wing coefficient as function of velocity
• Maximum transmission torque as function of tyre loads and slip ratio
• Rolling resistance as function of speed and load
Fig 13: Measured & Calculated Performance Data
It has to be pointed out that such accuracy can only be achieved when there is no pressure interference between the ten inlet runners and the airbox above the trumpets. As intensive measurements show this is not always the case. Particularly, when new air trays and
• Individual RPM-shift limits (up- and down-shift) and gear shift durations can be defined
• Adjustment of throttle position for optimum transmission torque
Furthermore, different sections with various slope angles can be defined. The influence of wind speed, the pressure recovery efficiency inside the airbox and changed ambient conditions (pressure and temperature) are some of several other user-defined input data. However, this FORTRAN based code is not a lap time simulator and cannot predict the optimum brake point and does not simulate any cornering. For this purpose the McLaren-Team has developed a highly sophisticated Lap-Time-Simulator-Program, used to assist the design and development of new car models, to pre-optimise all essential circuit specific car settings and to reduce time spent on testing the car. Figure 14 shows the external forces, which affect the car motion. This non-linear second-order differential equation is finally solved by using the Runge-Kutta scheme [14].
9

Applied Simulation: Before any parameters or boundary conditions can be investigated the baseline results have to match with recorded data from the trackside. As an example, the approximately 600 m long straight at the start- finish line of the A1-Circuit in Austria is chosen. From the exit of the last corner the road leads nearly horizontal up to the start/finish line and changes into an uphill slope (approx. 5% gradient) before the driver has to brake hard for the following tight right hand corner.
..
red
..
x IxmF ϕ+=∑ (5)
Or
( ) redFRwdyn
..mFFFR
TQx
µ∗+−−= (6)
With
( ) ( )( ) fwwF FsinmgFaccosmg
abF +α+−α=
( ) ( )( ) rwwR FsinmgFaccosmg
abaF +α++α−=
Where TQ Wheel Torque 7321 ...,,Engine i*TQ=
2
2.
Dw xAcF
ρ
= ; c Drag )x(f.
D=
2
2.
Lffw xAcF
ρ
= ; c Front Wing Down Force )x(f.
Lf =
2
2.
Lrrw xAcF
ρ
= ; c Rear Wing Down Force )x(f.
Lr=
Reduced Mass Ri dynsumcrankcarred /Imm 22+= Slop Angle, Air Density, and Friction coefficient µρα ,, a, b, c Wheel Base, Distances for Centre of Gravity
Fig 14: Basic Equations for Acceleration Simulation
Under consideration of all engine and car related data, and with an exit speed of 159 km/h (100% throttle position) the calculation was performed until the total distance of 600m was reached. The calculated and recorded engine speed and car velocity is shown in Figure 15.
Fig 15: Measured and Calculated Acceleration Data When a good correlation has been achieved it is possible to investigate the influence of engine or gearbox related data or parameters. To demonstrate the effect of power and torque performance the engine brake output is first increased by 3% and then decreased by 3% in the entire speed range. In the third assumption, the car with the more powerful engine has to carry 15 kg more fuel on board. As the simulation results show, 3% more torque and power will lead to a distance advantage of 7.2 metres see Figure 16. With 15 kg more weight the benefit of the power improvement drops to a gap of 4.2 metres in comparison to the initial baseline set-up.
Fig 16: Influence of Engine Performance and Weight
10

When running the same example with the lap time simulator the predicted time advantage for the high-power engine over the whole lap is 0.38 sec. Adding 15kg and running the circuit simulation again, the advantage of increased power is cancelled out. Due to changed braking points and different tyre loads the heavier and more powerful car will be approximately 0.04 seconds slower compared to the baseline configuration.
PART LOAD & DRIVEABILITY:
Good part load behaviour of a racing engine is essential to support the driver during acceleration out of a corner. It is mainly the correlation between the pedal position and the torque output (torque demand), which has to suit a wide speed range. The well-known high-speed circuit of Monza/Italy is very demanding on maximum power, but the two tight chicanes cause rpm drops. The minimum velocity at the apex in the first chicane was around 70 km/h @ ~ 6500 rpm in 1st gear (season 2000), see Figure 17.
When a new engine specification has been pre-optimised under steady conditions the mapping data has to be evaluated under transient conditions (ignition, fuelling, pedal-throttle rate, pneumatic and hydraulic data…). Therefore, the engine is transferred to a specially adapted F1-transient dyno and is tested and optimised under racing conditions. Highly developed and extremely fast controllers - governed by real-time circuit and car behaviour simulation in the background - assure realistic demands on the engine.
Fig 17: Recorded Circuit Data Before traction control systems were introduced in spring 2001 the relation between pedal and throttle motion could not be altered with engine speed or any other variable parameter. Subsequently, a lot of mapping work had to be done to establish a smooth torque output map for individual throttle/pedal positions. The aim was to avoid steep gradients at constant throttle
position and a clearly defined separation between the lines of constant throttle/pedal positions. In particular, the latter leads to a high torque demand in the lower speed range for improved driveability - see Figure 18.
F AscrethcAoeFeavscintrmcbotrAfarethcwmeIMmAisdce
ig. 18: Torque vs. RPM Map
fter pre-optimisation of all mapping parameters on the teady state and transient dyno, the engine output haracteristic is finally tuned to the individual driver quest. This can end up in different set-ups, mainly in e low load area where different engine braking
haracteristic and torque output response are favoured. lso, the style of driving – for example the throttle pening speed – is different and might require different ngine management strategies. rom the engine development point of view the aim is to nsure a smooth and predictable torque output to avoid ny dependency from the opening rate of the throttle. To erify this characteristic, the engine can be tested imilarly to a real part load acceleration event (rpm ~ onst.). On today’s F1-transient test beds the engine is stalled together with the gearbox, the side shafts ansmit the torque output to two electronically controlled otors, to brake the engine similarly to road load
onditions. The rate of throttle change characteristic can e programmed in the test bed controller to a fixed rate f change or alternatively to the optimum possible torque ansmission (traction control). s the experiences show, the recorded torque output at st throttle opening speed does not always reflect the al torque output on the clutch. The installation itself, e gear shafts, rear axle differential and the side shafts
an cause dynamic oscillations due to the internal eakness of the entire drive shaft system and might give isleading of the recorded brake values. Therefore, the ngine can either be pressure indicated to obtain the EP values or an accurate calibrated torque shaft eter between clutch and gearbox is used. further possibility for evaluating transient torque values to reconstruct the power output from the telemetry ata. When looking back at equation (6), the definition to alculate the acceleration rate by the use of known ngine torque data, the term TQ can easily be extracted
11

as a function of the acceleration. This generally allows, when measured longitudinal G-forces are recorded, reconstructing the engine torque output during straight-ahead acceleration. Again, it is necessary, that all chassis and tyre related data is precisely known, so the key factor in this application is a good quality of the recorded acceleration data. To serve its purpose these values have to be post-processed due to the noise signal by special filtering and smoothing algorithm (e.g. polynomial approximation by the use of a sliding window). In Fig. 16 the dashed frame highlights the long acceleration period of Mika Häkkinen in his qualifying lap (Monza 2000) driven in 1st gear. As an example for this section the torque release was re-calculated, starting at about 6000rpm to the final gearshift speed above 17000rpm. The results are given in the two graphs of Figure 19.
in similar problems as observed during transient test bed tests. Due to distorting of the entire drive train system unsteady lateral acceleration is recorded. OUTLOOK The history of the MERCEDES F1-Engine, designed and developed by ILMOR Engineering Ltd., shows a constant increase of peak power performance over the last 10 years. From the beginning until today, the specific power has improved continuously by about 100hp/L.
A key step forward to obtaining higher engine speeds was achieved when a reliable pneumatic valve control system was introduced in 1994. From then onwards the most challenging issue for more performance was the design and manufacture of light- weighing and reliable pistons, aiming to achieve engine speeds close to 20000rpm in the near future. This leads to huge efforts and research work in terms of metallurgy and stress analysis to define new suitable alloys or alternative materials, which agree with regulations. The new regulations for 2004 only allow one engine per car for the whole weekend. This means the designing will have to focus on ways to increase the reliability of the engines, which in turn could lead to a slight loss in power output. A lot of theory based investigations and practical tests on the single cylinder research engine were performed to optimise the volumetric efficiency at the respective speed limit. No significant step forward can be expected
Fig 19: Reconstructed Torque Output Finally it can be said, that this procedure allows the collection of useful information of the engine response during transient part load and WOT acceleration. With smooth and moderate throttle opening speed the acceleration of the car is proportional to the expected power and torque release. Any measures for adjusting the transient torque release (e.g. retarded/advanced ignition) are reflected in the re-calculated torque output. Extremely fast throttle change rates (>250 deg/sec) end
in terms of improved gas exchange processes. The already decreasing characteristic of the volumetric efficiency – in the speed range from maximum torque to maximum power - is extended to the higher speed range by putting up with small losses of maximum engine torque. The length and area profiles of the inlet system have to be optimised for the higher engine speeds - the exhaust pipes are altered accordingly. The combustion process will mainly be developed and controlled by the inlet port design. With a compression-ratio of approximately 14:1 there is barely any freedom for revised combustion chamber design to improve the combustion efficiency. The control of the valve train at even higher speed requires permanent adjustments and more complex cam profile designs and new manufacturing technology. Less moving mass and highly sophisticated coating processes will cope with an increased engine speed. A critical review of the auxiliary drives and a permanent investigation of the piston ring package, the gear train and the bearings is essential to lower the friction losses even further. As pressure and Lambda measurements of all 10 cylinders show, there is also potential for improvements by individual ignition, air supply and fuel preparation
12

optimisation. This might lead to highly sophisticated onboard diagnostic devices and even faster engine management systems. More advanced ignition and fuel injection systems might be introduced - the chassis and engine manufacturer will put more efforts into highly efficient air snorkel and air inlet systems. Due to the FIA regulation of 0.3L per cylinder a display of alternative solutions is restricted. As in the past years of F1, the future development of the engine speed and power increase will mainly be dominated by the success of the piston durability. CONCLUSION As the analysis from qualifying and race laps show, the demand on Formula One engines is very much focused on peak power performance. Even on relatively low speed circuits the engine is used mainly in the top speed range at wide open throttle conditions.
Nevertheless, for optimum power exploitation and fastest lap times the engine developer has to ensure maximum torque release and a smooth shape in the mid and lower speed range, thus allowing best acceleration out of very slow corners and helping to improve the drivability of the race engine. Today’s F1 engines have achieved a specific power output of 280 hp/L and the maximum engine-rpm is getting close to 19000rpm. This high level was achieved by minimising the weight of all engine components and optimising the design for most efficient stress load. Right from the beginning, the design of the engine has to be focused on lowest losses due to internal friction and the power required to run the auxiliary drives. Furthermore, the design of the entire cylinder head has to consider all aspects for optimising the gas exchange process. In parallel, the engine layout has to ensure an extremely low centre of gravity, which often does not match packaging demands and maximum power release. This paper showed in detail the tools used to analyse the gas exchange and combustion process. Good correlations between calculated and indicated pressure traces and measured test bed data could be achieved. To quantify the potential of different WOT performance curves a simple car acceleration model was discussed and compared to recorded trackside data. To get a feedback of the unsteady power release when running the engine on a racetrack a similar attempt was made to reconstruct the torque output. In the final outlook for the future development of the MERCEDES-ILMOR V10 engine the strategies for further possible power improvements have been discussed. Apart from the reliability constraints introduced in 2004, which might lead to a short-term stagnation, the success of continuing the improved
performance is mainly dependent on dealing with the question of piston quality. REFERENCES
[1] Federation Internationale de L’Automobile (FIA).: “2002 Formula One Technical Regulation”; Article 5; www.fia.com/homepage/selection-a.html
[2] Winterbone D.E and Pearson R.J.: “Theory of Engine
Manifold Design - Wave Action Methods for IC Engines”, Professional Engineering Publishing Ltd., UK
[3] Blair G.P.: “Design and Simulation of Four-Stroke
Engines”; SAE Order no. R-161 [4] User manual of the AVL-BOSST program [5] Boretti A., Borghi M., Cantore G., Mattarelli E.:
“Numerical Optimization of a Racing Engine with Variable Intake and Exhaust Geometry and Valve Actuation”; SAE-Paper 962542
[6] Piola G.: “Formula 1, 2000, Technical Analysis”;
COPRESS, Munich [7] Azzoni P., Moro D., Rizzoni G.: “Reconstruction of
Formula 1 Engine Instantaneous Speed by Acoustic Emission Analysis”; SAE-Paper 983047
[8] Blair G.P., Drouin F.M..: “The Relationship between
Discharge Coefficients and the Accuracy of Engine Simulation”; SAE-Paper 962527
[9] Alten H., Fraidl G., Wieser K.: “Tumbleströmung am 4-
Ventil Motor – Simulation, Messung und Motorein-fluß“; 15th Intern. Vienna Motor Symposium, 1994
[10] Pfeffer P., Bühler P. Meier D., Hamdani Z.: “Influence
of Intake Tumble Ratio on General Combustion Performance, Flame Speed and Propagation at a Formula One Type High-Speed Research Engine”; SAE-Paper 2002-01-0244
[11] Pischinger R., “Thermodynamik der Verbrennungs-
kraftmaschine”, Springer-Verlag, Band 5, 1989 [12] Taylor C.F., “The Internal-Combustion Engine in
Theory and Practice”, The M.I.T. Press, 1994 [13] Rubbert S., Klietz M., Laurenz W.: “Problems
occurring with in cylinder pressure measurement of high speed Otto-Cycle engines”; Proceeding of the Intern. Symposium on Internal Combustion Diagnostic 2002; AVL-Germany
[14] Stroud K. A.: “Further Engineering Mathematics”;
Second Edition, McMillan 13


![B737 NG - · PDF fileBoeing B737 NG - Systems Summary [Engines] Page 5. If the compact engine format is displayed, the subsequent exceedance of a secondary engine parameter will cause](https://img.pdfslide.net/doc/110x75/5a718b7b7f8b9aa7538cf4cc/b737-ng-aerocadetwwwaerocadetcomcbtspdfbng-enginespdfpdf.jpg)