Embed Size (px)
Citation preview
Dementia Economic Impact Report 2016March 2017

Dementia Economic Impact Report 2016
1
Foreword
The dementia challenge: We cannot afford to do nothing
Dementia dramatically changes the lives of people who live with it, together with their families, friends and communities.
This report shows dementia is a major and growing health challenge. It estimates there has been a 29% increase in numbers of people with dementia in five years – from 48,182 people in 2011 to 62,287 in 2016. It is predicted 170,212 people will have dementia by 2050.
The costs associated with dementia are estimated to have increased by 75% – from $955 million in 2011 to $1,676 million in 2016. In today’s dollars, this could be more than $2.7 billion by 2030.
We need high quality data to support high quality services that are affordable and sustainable.
The rapidly increasing size of the dementia problem needs an urgent response and it is important to reduce the risk factors for dementia. What is good for the heart is good for the brain, and lifestyle changes may reduce the incidence of dementia, but only by a small margin.
However, the number of people with dementia will increase and we all must do more and better to prepare for this. New Zealand must create dementia-friendly communities that provide practical support for people with dementia.
New Zealand must also implement the government’s own New Zealand Framework for Dementia Care. Alzheimers New Zealand supports this framework and commends the government’s commitment to it. But it must be implemented now to benefit the dementia community now and in future.
The costs and challenges of dementia continue to grow. But we can put in place interventions that will constrain some of these costs and – more importantly – enhance wellbeing for people living with dementia.
This is the third report on the Economic Impacts of Dementia commissioned by Alzheimers New Zealand and with the involvement of Deloitte Access Economics. These reports are the primary information source on the size and scale of dementia in New Zealand. But they depend on assumptions drawn from international and Australian data and it is disappointing that, after ten years, there is still no New Zealand-specific data available.
We cannot afford to do nothing, and there is much we can do. Alzheimers New Zealand and local Alzheimers organisations look forward to continuing to work alongside government and non-government organisations to support those living with the reality behind the facts and figures outlined in this report – people with dementia, their families and carers.
Dr Ngaire Dixon
Chair
Alzheimers New Zealand

Dementia Economic Impact Report 2016
Page 4
A dementia friendly New Zealand | Aotearoa, he aro nui ki te hunga mate wareware
Contents
Executive summary 8
Prevalence of dementia 8
Economic costs associated with dementia 10
Burden of disease 12
Cost benefit analysis of delaying institutional care 13
A significant public health burden 14
1 Introduction 15
1.1 Alzheimers New Zealand 15
1.2 New Zealand health system 15
1.3 Structure of the report 15
1.4 Limitations 16
2 Background 17
2.1 What is dementia? 17
2.2 Diagnosis 17
2.3 Progression 18
2.4 Forms of dementia 18
2.5 Risk factors 19
2.6 Treatment 19
3 Prevalence estimates and projections 21
3.1 Data sources 21
3.2 Prevalence by stage of dementia 24
3.3 Prevalence projections and ethnicity 27
3.4 Mortality 30
4 Health system costs 32
4.1 Hospital expenditure 32
4.2 General practitioner visits 34
4.3 Pharmaceutical costs 35
4.4 Research costs 36
4.5 Aged care costs 37
4.6 Out-of-hospital medical and other health professional expenditure 40
4.7 Community care 41
4.8 Summary of health system costs 43
5 Other economic costs 45
5.1 Productivity losses 45
5.2 Informal care costs 49
5.3 Transfers 51
Dementia Economic Impact Report 2016
Page 5
A dementia friendly New Zealand | Aotearoa, he aro nui ki te hunga mate wareware
5.4 Summary of other economic costs 56
6 Burden of disease 57
6.1 Valuing life and health 57
6.2 Estimating the burden of disease from dementia 58
7 Cost benefit analysis of delaying institutional care 61
7.1 Scenarios 61
7.2 Benefits 61
7.3 Cost benefit analysis 62
7.4 Costs 63
7.5 Findings 65
7.6 Sensitivity testing 66
8 Economic impact of dementia 67
Appendix A: Summary of economic costs 70
References 71
Limitation of our work 76
Charts
Chart a : Prevalence number by age and gender, 2016 8
Chart b : Prevalence projections by gender, New Zealand, 2016 to 2050. 9
Chart c : Prevalence projections by ethnicity, 2016 to 2038 9
Chart d : Economic costs associated with dementia in New Zealand, 2016 10
Chart e : Projected economic costs of dementia 11
Chart f : Value of burden of disease from dementia by gender, 2016. 13
Chart g : Summary of costs and benefits of delaying institutional care for people with dementia in New Zealand 14
Chart 3.1 : Number of cases of dementia, by age and gender, 2016. 27
Chart 3.2 : Prevalence projections by gender, New Zealand, 2016 to 2050 29
Chart 3.3 : Prevalence projections by ethnicity, New Zealand, 2016 to 2038. 29
Chart 3.4 : Deaths with an underlying cause of dementia by age and gender, 2016. 31
Chart 4.1 : HRC funding pertaining to dementia research, 2005-2016 37
Chart 4.2 : Health system expenditure by sector, 2016 43
Chart 4.3 : Health system expenditure by who pays, 2016 44
Chart 5.1 : Productivity costs for people with dementia and who bears the cost, 2016 49
Chart 5.2 : Informal care costs by who bears the cost, 2016 51
Chart 5.3 : Deadweight loss of taxation 55
Chart 6.1 : Burden of disease from dementia, New Zealand, 2016. 59
Chart 6.2 : Value of burden of disease from dementia, 2016 59
Chart 8.1 : Economic costs associated with dementia in New Zealand, 2016 68
Dementia Economic Impact Report 2016
Page 6
A dementia friendly New Zealand | Aotearoa, he aro nui ki te hunga mate wareware
Tables
: Pharmacologic treatments for dementia 19
: Dementia prevalence rates from previous studies (%) 23
: New Zealand prevalence rate estimates, 2016 (%). 24
: Prevalence, by age and gender, 2016-2050 (people) 26
: Dementia prevalence by ethnicity group 28
: Deaths attributed to dementia by age and gender, 2013 30
: Number of deaths attributed to dementia, 2016 31
: ICD-10 codes for dementia 33
: Dementia pharmaceuticals dispensing and schedule price, 2016. 36
: Number of people by residential aged care type, 2016. 38
: People with dementia in residential aged care, 2016 39
: People with dementia as a main condition in residential aged care, 2016 40
: Other health system expenditure, 2016 41
: Health system costs by sector, total and per person, 2016 43
: Summary of productivity costs for people with dementia, 2016 48
: Components of deadweight loss, 2016 56
: Other economic costs summary 56
: Additional community costs of institutional delay ($ million) 64
: Summary of costs and benefits 65
: Summary of costs and benefits, sensitivity testing 66
: Total costs of dementia, 2016 67
: Total costs associated with dementia by age and gender 69
Table A.1: Summary of economic costs of dementia, New Zealand, 2016 70
Acknowledgements
We acknowledge the analysis provided by Deloitte Access Economics in preparing this report.
We also acknowledge the data and information provided by the Ministry of Health, the Ministry for Social Development and the Health Research Council.
Dementia Economic Impact Report 2016
Page 7
A dementia friendly New Zealand | Aotearoa, he aro nui ki te hunga mate wareware
Glossary
Acronym Full name
ADI Alzheimer’s Disease International
ADL activities of daily living
AIHW Australian Institute of Health and Welfare
ALOS average length of stay
AWE average weekly earnings
BCR benefit cost ratio
BPSD behavioural and psychological symptoms of dementia
CPI Consumer Price Index
DALY disability adjusted life year
DHB District Health Board
DSM-5 Diagnostic and Statistical Manual for Mental Disorders (Fifth Edition)
DWCD Dementia Worldwide Cost Database
GP general practitioner
HRC Health Research Council
ICD-10 International Classification of Disease (Tenth Revision)
NZACA New Zealand Aged Care Association
PBS Pharmaceutical Benefits Scheme
PHO Primary Health Organisation
SLP Supported Living Payment
TAS Technical Advisory Services
YLD years of healthy life lost due to disability
YLL years of life lost due to premature death
VSL value of a statistical life
VSL(Y) value of a statistical life (year)
Dementia Economic Impact Report 2016
Page 8
A dementia friendly New Zealand | Aotearoa, he aro nui ki te hunga mate wareware
Executive summary
This report provides estimates of the prevalence and costs of dementia in New Zealand in 2016, updating earlier estimates published in 2008 and again in 2012. It also provides observations about changes that occur over time – changes since previous reports, the situation today and looking to the future.
Prevalence of dementia
This report estimates that, in 2016, the prevalence of dementia in New Zealand was 62,287 people – 1.3% of the population. This estimate has increased by 29% over five years from 48,182 in 2011 (refer section 3 for detailed discussion).
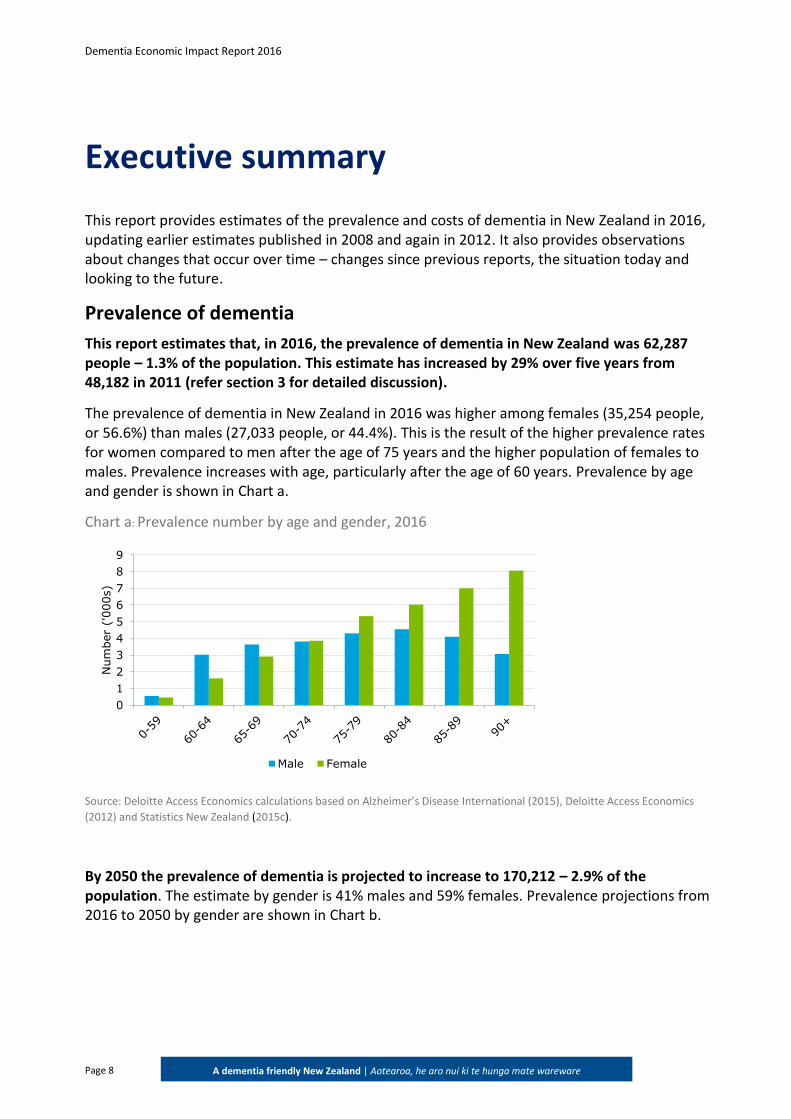
The prevalence of dementia in New Zealand in 2016 was higher among females (35,254 people, or 56.6%) than males (27,033 people, or 44.4%). This is the result of the higher prevalence rates for women compared to men after the age of 75 years and the higher population of females to males. Prevalence increases with age, particularly after the age of 60 years. Prevalence by age and gender is shown in Chart a.
Chart a: Prevalence number by age and gender, 2016
Source: Deloitte Access Economics calculations based on Alzheimer’s Disease International (2015), Deloitte Access Economics
(2012) and Statistics New Zealand (2015c).
By 2050 the prevalence of dementia is projected to increase to 170,212 – 2.9% of the population. The estimate by gender is 41% males and 59% females. Prevalence projections from 2016 to 2050 by gender are shown in Chart b.
0
1
2
3
4
5
6
7
8
9
Num
ber
('000s)
Male Female
Dementia Economic Impact Report 2016
Page 9
A dementia friendly New Zealand | Aotearoa, he aro nui ki te hunga mate wareware
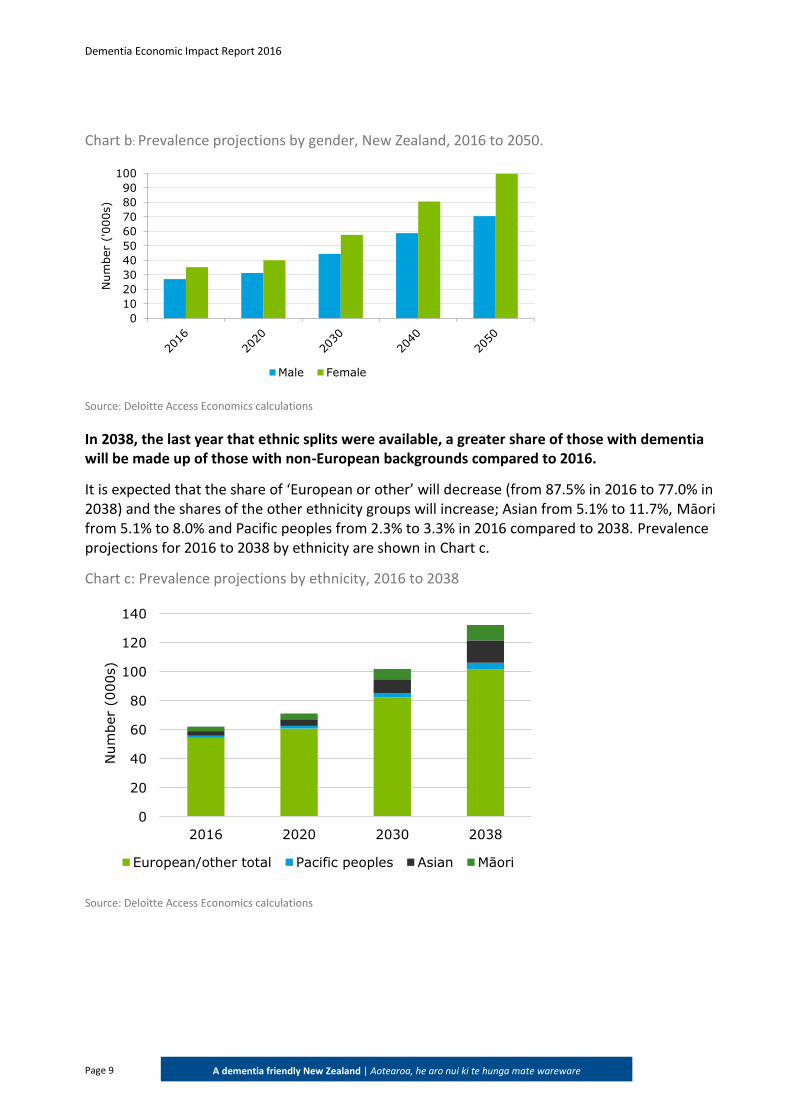
Chart b: Prevalence projections by gender, New Zealand, 2016 to 2050.
Source: Deloitte Access Economics calculations
In 2038, the last year that ethnic splits were available, a greater share of those with dementia will be made up of those with non-European backgrounds compared to 2016.
It is expected that the share of ‘European or other’ will decrease (from 87.5% in 2016 to 77.0% in 2038) and the shares of the other ethnicity groups will increase; Asian from 5.1% to 11.7%, Māori from 5.1% to 8.0% and Pacific peoples from 2.3% to 3.3% in 2016 compared to 2038. Prevalence projections for 2016 to 2038 by ethnicity are shown in Chart c.
Chart c: Prevalence projections by ethnicity, 2016 to 2038
Source: Deloitte Access Economics calculations
0
10
20
30
40
50
60
70
80
90
100
Num
ber
('000s)
Male Female
0
20
40
60
80
100
120
140
2016 2020 2030 2038
Num
ber
(000s)
European/other total Pacific peoples Asian Māori
Dementia Economic Impact Report 2016
Page 10
A dementia friendly New Zealand | Aotearoa, he aro nui ki te hunga mate wareware
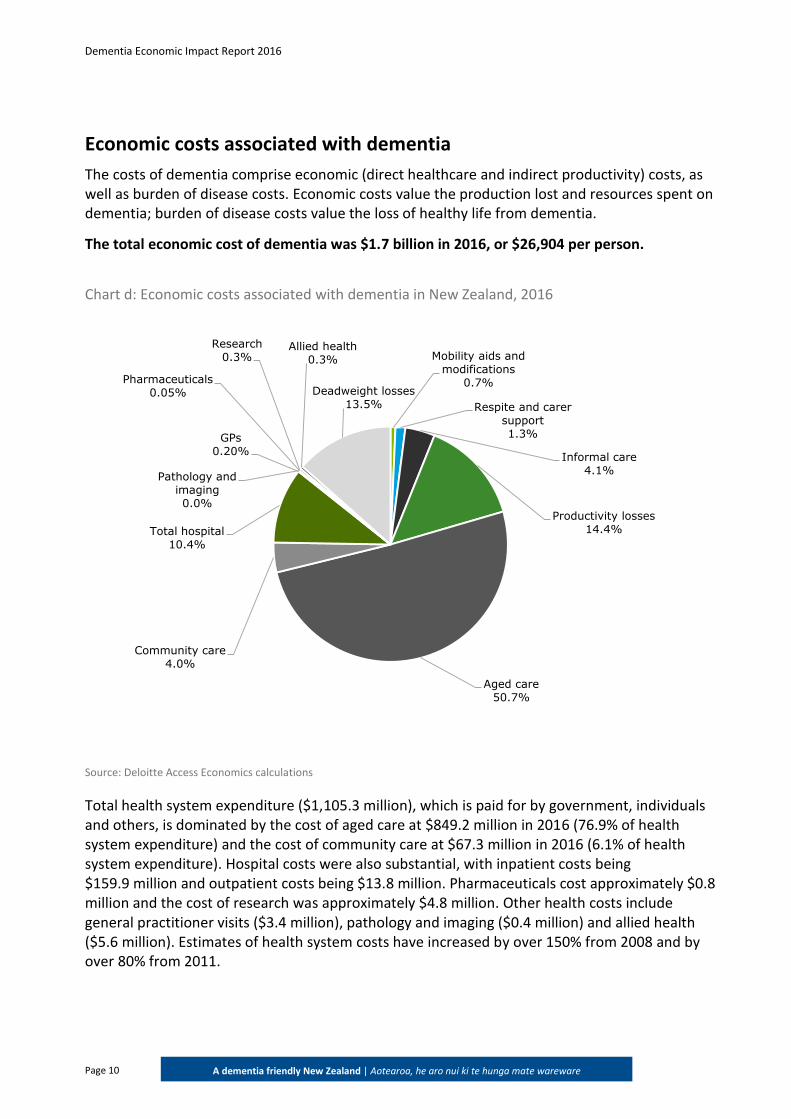
Economic costs associated with dementia
The costs of dementia comprise economic (direct healthcare and indirect productivity) costs, as well as burden of disease costs. Economic costs value the production lost and resources spent on dementia; burden of disease costs value the loss of healthy life from dementia.
The total economic cost of dementia was $1.7 billion in 2016, or $26,904 per person.
Chart d: Economic costs associated with dementia in New Zealand, 2016
Source: Deloitte Access Economics calculations
Total health system expenditure ($1,105.3 million), which is paid for by government, individuals and others, is dominated by the cost of aged care at $849.2 million in 2016 (76.9% of health system expenditure) and the cost of community care at $67.3 million in 2016 (6.1% of health system expenditure). Hospital costs were also substantial, with inpatient costs being $159.9 million and outpatient costs being $13.8 million. Pharmaceuticals cost approximately $0.8 million and the cost of research was approximately $4.8 million. Other health costs include general practitioner visits ($3.4 million), pathology and imaging ($0.4 million) and allied health ($5.6 million). Estimates of health system costs have increased by over 150% from 2008 and by over 80% from 2011.
Mobility aids and modifications
0.7%
Respite and carer support1.3%
Informal care4.1%
Productivity losses14.4%
Aged care50.7%
Community care4.0%
Total hospital 10.4%
GPs0.20%
Pharmaceuticals0.05%
Pathology and imaging0.0%
Research 0.3%
Allied health0.3%
Deadweight losses 13.5%
Dementia Economic Impact Report 2016
Page 11
A dementia friendly New Zealand | Aotearoa, he aro nui ki te hunga mate wareware
Productivity losses due to dementia comprise the lower employment participation of people with dementia ($207.4 million), higher rates of absenteeism ($17.4 million) and the loss of human capital as a result of premature mortality ($16.2 million). Estimates of productivity losses attributed to people with dementia have increased by over 80% since 2008 and by over 40% since 2012.
In addition to the productivity losses attributed to people with dementia, informal carers of people with dementia work less and this incurs a productivity loss. The total cost of informal carers in 2016 was $68.6 million. Informal care costs have increased by over 130% since 2008 and by over 80% since 2011. This arises from both the increased prevalence of dementia and revised information about the number of hours of informal care provided to people with dementia.
Other costs attributed to dementia include respite ($21.9 million), travel costs ($6.56 million), aids and modifications ($5.5 million) and the deadweight efficiency losses ($226.9 million).
Increase in economic costs since 2011
The economic cost per person has increased 36% between 2011 and 2016, and prevalence has increased 29% between 2011 and 2016. In combination, this has resulted in a 75% increase in economic costs from $955 million to $1.7 billion1.
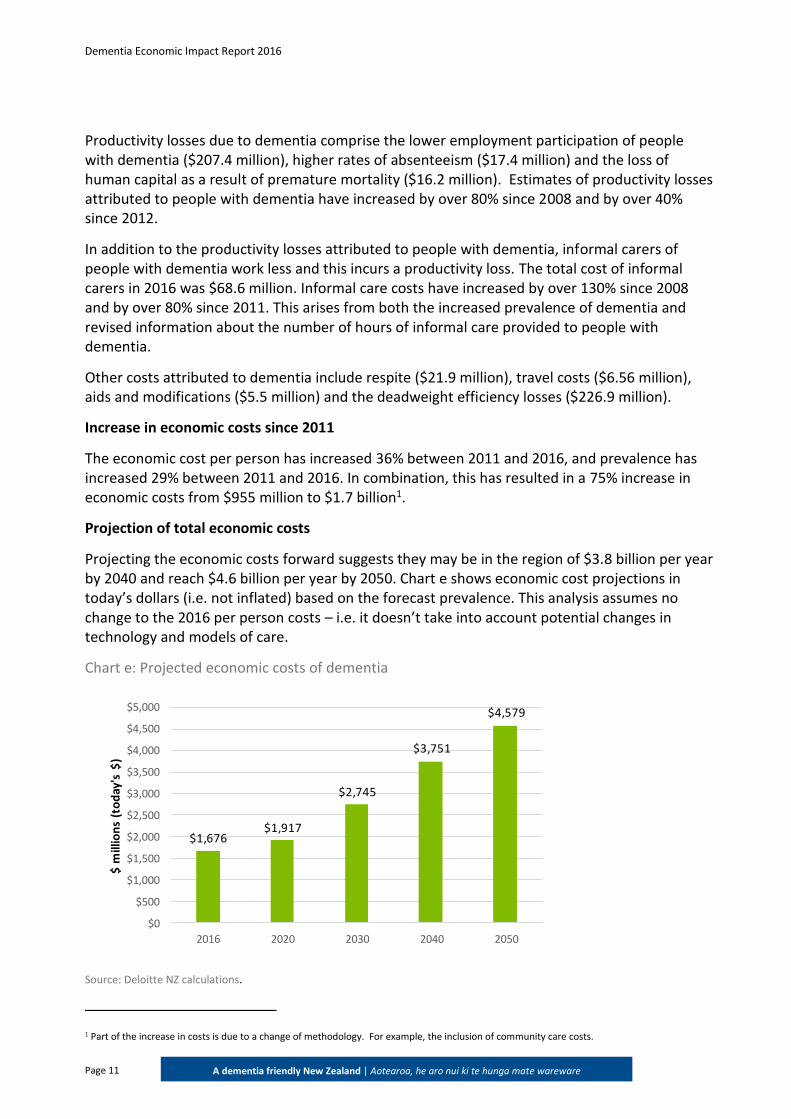
Projection of total economic costs
Projecting the economic costs forward suggests they may be in the region of $3.8 billion per year by 2040 and reach $4.6 billion per year by 2050. Chart e shows economic cost projections in today’s dollars (i.e. not inflated) based on the forecast prevalence. This analysis assumes no change to the 2016 per person costs – i.e. it doesn’t take into account potential changes in technology and models of care.
Chart e: Projected economic costs of dementia
$1,676$1,917
$2,745
$3,751
$4,579
$0
$500
$1,000
$1,500
$2,000
$2,500
$3,000
$3,500
$4,000
$4,500
$5,000
2016 2020 2030 2040 2050
$ m
illio
ns
(to
day
's $
)
Source: Deloitte NZ calculations.
1 Part of the increase in costs is due to a change of methodology. For example, the inclusion of community care costs.
Dementia Economic Impact Report 2016
Page 12
A dementia friendly New Zealand | Aotearoa, he aro nui ki te hunga mate wareware
While these projected costs are quite a simplistic forecast, the potential magnitude of costs highlights the need for policy-makers to consider significant change to ensure these are affordable.
Burden of disease
In addition to economic costs, there are also burden of disease costs associated with dementia. The burden of disease costs in this report are substantially lower than what was estimated in the 2008 and 2012 reports. This arises due to methodological changes to the data inputs used to calculate these costs, specifically:
lower disability weights; and
lower value of a statistical life year (VSLY).
These data have been revised by both the Ministry of Transport (2016) and the Global Burden of Disease (Vos et al, 2015). Due to these changes, burden of disease cost comparisons between the 2008 and 2012 reports cannot be made directly.
Burden of disease is calculated using disability adjusted life years (DALYs), which measures the mortality and morbidity impact of a disease. Burden of disease attributed to dementia in 2016 was estimated to be 31,652 DALYs.
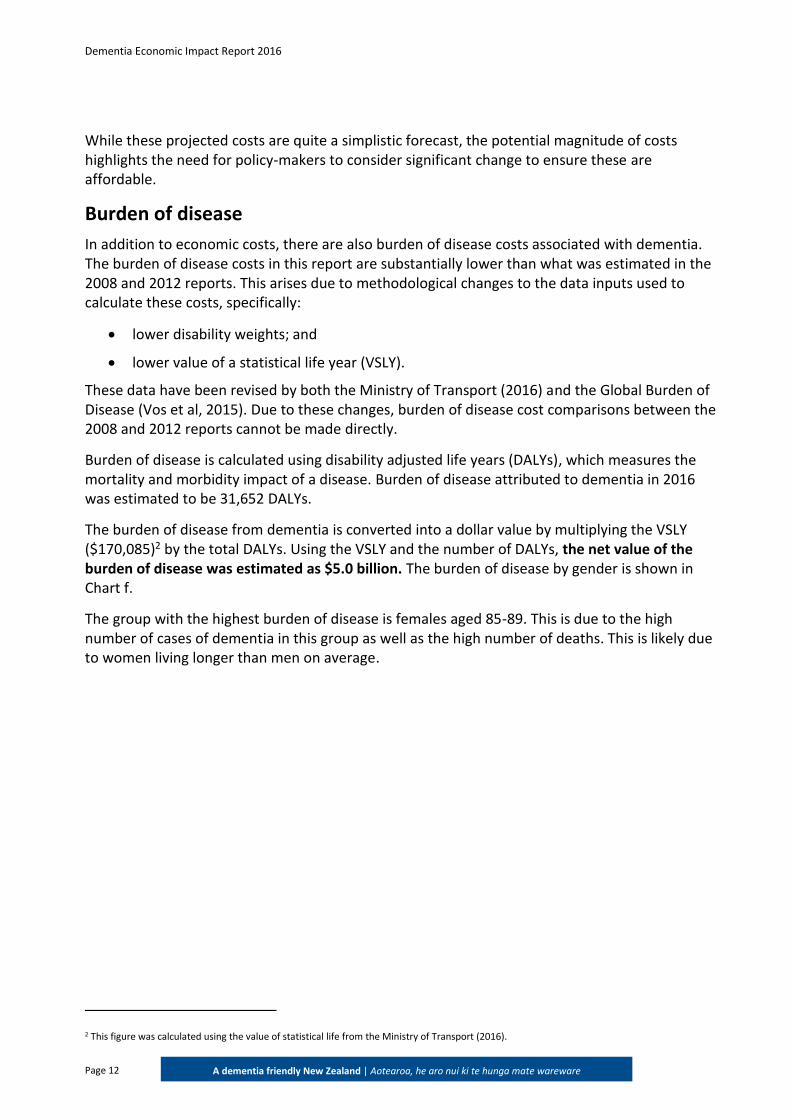
The burden of disease from dementia is converted into a dollar value by multiplying the VSLY ($170,085)2 by the total DALYs. Using the VSLY and the number of DALYs, the net value of the burden of disease was estimated as $5.0 billion. The burden of disease by gender is shown in Chart f.
The group with the highest burden of disease is females aged 85-89. This is due to the high number of cases of dementia in this group as well as the high number of deaths. This is likely due to women living longer than men on average.
2 This figure was calculated using the value of statistical life from the Ministry of Transport (2016).
Dementia Economic Impact Report 2016
Page 13
A dementia friendly New Zealand | Aotearoa, he aro nui ki te hunga mate wareware
Chart f: Value of burden of disease from dementia by gender, 2016.
Source: Deloitte Access Economics calculations
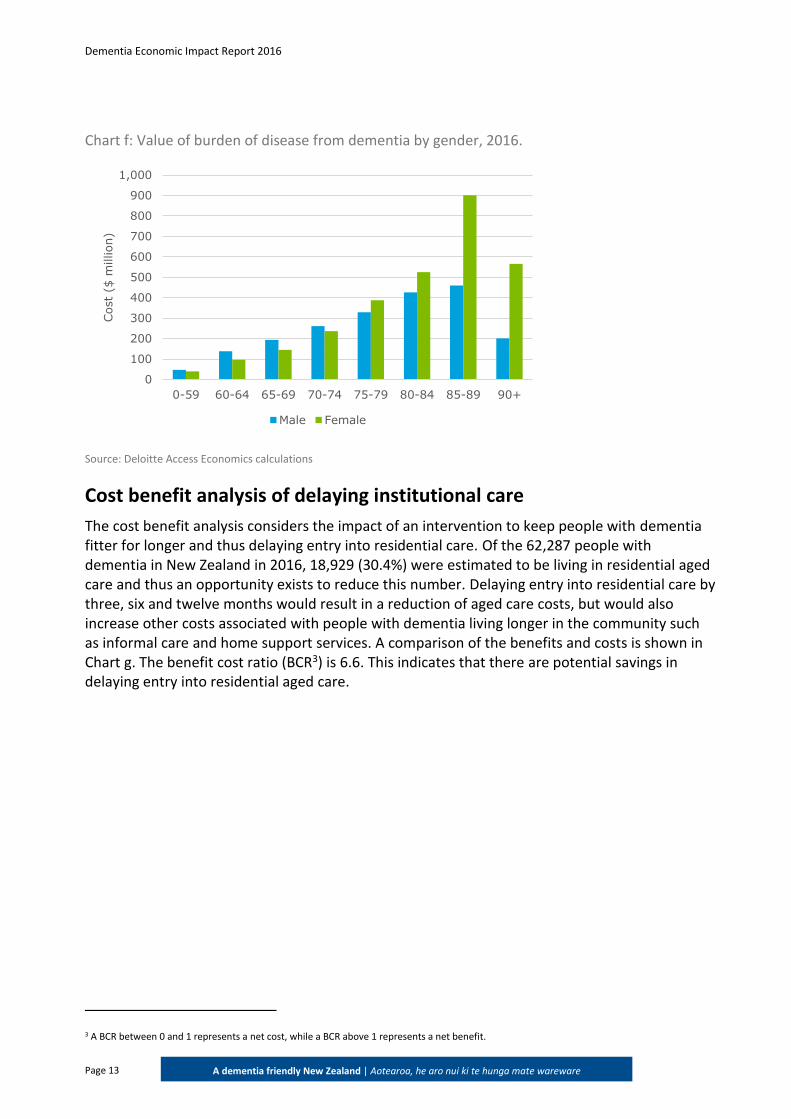
Cost benefit analysis of delaying institutional care
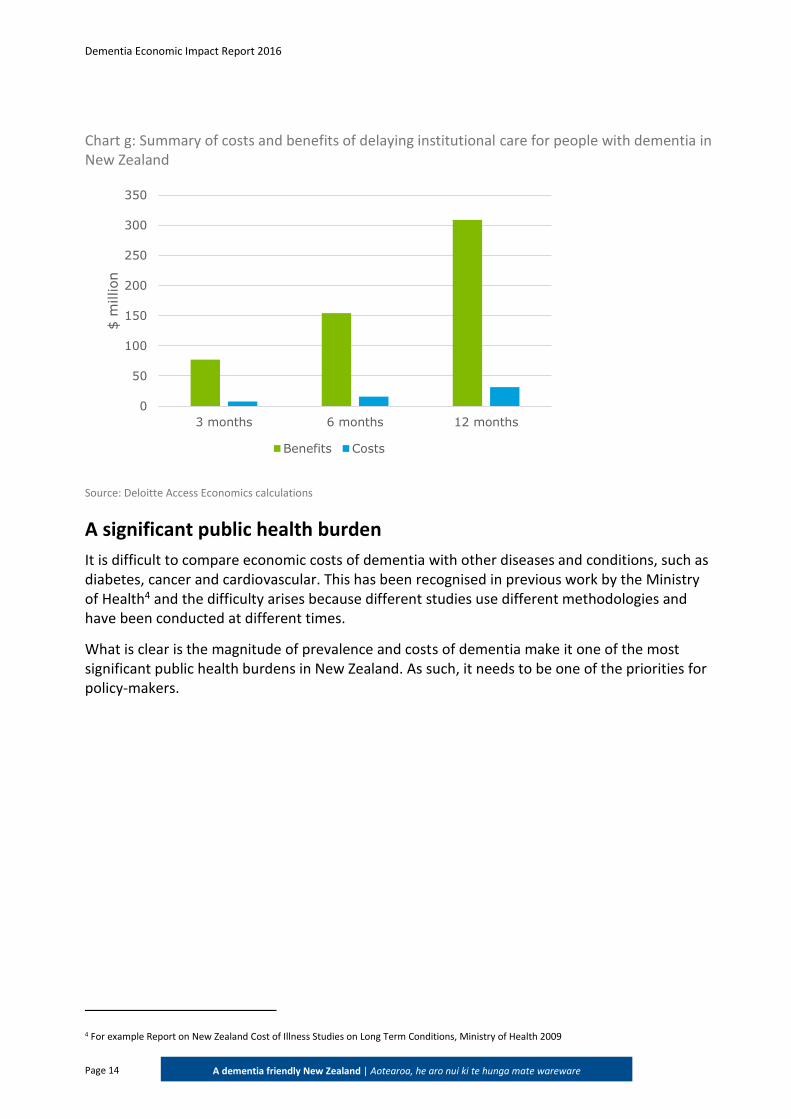
The cost benefit analysis considers the impact of an intervention to keep people with dementia fitter for longer and thus delaying entry into residential care. Of the 62,287 people with dementia in New Zealand in 2016, 18,929 (30.4%) were estimated to be living in residential aged care and thus an opportunity exists to reduce this number. Delaying entry into residential care by three, six and twelve months would result in a reduction of aged care costs, but would also increase other costs associated with people with dementia living longer in the community such as informal care and home support services. A comparison of the benefits and costs is shown in Chart g. The benefit cost ratio (BCR3) is 6.6. This indicates that there are potential savings in delaying entry into residential aged care.
3 A BCR between 0 and 1 represents a net cost, while a BCR above 1 represents a net benefit.
0
100
200
300
400
500
600
700
800
900
1,000
0-59 60-64 65-69 70-74 75-79 80-84 85-89 90+
Cost
($ m
illion)
Male Female
Dementia Economic Impact Report 2016
Page 14
A dementia friendly New Zealand | Aotearoa, he aro nui ki te hunga mate wareware
Chart g: Summary of costs and benefits of delaying institutional care for people with dementia in New Zealand
Source: Deloitte Access Economics calculations
A significant public health burden
It is difficult to compare economic costs of dementia with other diseases and conditions, such as diabetes, cancer and cardiovascular. This has been recognised in previous work by the Ministry of Health4 and the difficulty arises because different studies use different methodologies and have been conducted at different times.
What is clear is the magnitude of prevalence and costs of dementia make it one of the most significant public health burdens in New Zealand. As such, it needs to be one of the priorities for policy-makers.
4 For example Report on New Zealand Cost of Illness Studies on Long Term Conditions, Ministry of Health 2009
0
50
100
150
200
250
300
350
3 months 6 months 12 months
$ m
illion
Benefits Costs
Dementia Economic Impact Report 2016
Page 15
A dementia friendly New Zealand | Aotearoa, he aro nui ki te hunga mate wareware
1 Introduction
Deloitte was commissioned by Alzheimers New Zealand to provide an update of its 2008 report Economic Impact of Dementia in New Zealand.
1.1 Alzheimers New Zealand
Alzheimers New Zealand represents people affected by dementia at a national level by raising awareness of dementia, providing information and resources for people affected by dementia, advocating for high quality services for those people, and promoting research about prevention, treatment, cure and care of people with dementia.
1.2 New Zealand health system
Like most developed countries, the New Zealand health system is a mixed public-private system but consists of a significant public infrastructure that is mainly supported by general taxation.
The Minister of Health, in conjunction with the Ministry of Health and its business units, is responsible for deciding public health policy. New Zealand’s 20 District Health Boards (DHBs) are responsible for the majority of the planning, purchasing and provision of health services in New Zealand. DHBs play a significant role in the New Zealand health system as the primary source of funding for primary care, hospital services, public health services, aged care services, and services provided by other non-government providers.
1.3 Structure of the report
The remainder of the report is structured as follows:
chapter 2 provides some background on dementia, including a brief review of the risk factors for dementia, morbidity and social impacts, and pharmacologic and non-pharmacologic treatments available;
chapter 3 presents prevalence estimates and mortality considerations for dementia including a review of the available literature;
chapter 4 outlines the costs of dementia to the New Zealand health system by type of cost;
chapter 5 looks at the productivity costs and other financial costs associated with dementia, including a review of relevant studies;
chapter 6 summarises costs of dementia associated with welfare payments, and the deadweight loss that arises from raising tax to fund government expenditure;
chapter 7 estimates the total burden of disease and burden of disease due to dementia;
chapter 8 provides a cost benefit analysis of delaying institutional care for people with dementia; and
chapter 9 provides a discussion of the direct and indirect costs associated with dementia, and summarises the issues raised in this report.
Dementia Economic Impact Report 2016
Page 16
A dementia friendly New Zealand | Aotearoa, he aro nui ki te hunga mate wareware
1.4 Limitations
There is currently a lack of information on dementia epidemiology and costs in New Zealand. In cases where no New Zealand data were found, international sources were used. For example, we could not identify any population-based studies in New Zealand that specifically estimate the prevalence of dementia for the New Zealand population and thus estimates for the prevalence rates in Australasia were used. This report also relies on Australian estimates for information on the use of general practitioners (GPs) for managing dementia and for the amount of informal care provided to people with dementia, as this information is not available for New Zealand. The data sources and methodology for prevalence and cost estimates are explained in more detail in the following chapters.
Dementia Economic Impact Report 2016
Page 17
A dementia friendly New Zealand | Aotearoa, he aro nui ki te hunga mate wareware
2 Background
2.1 What is dementia?
Dementia is an umbrella term used to describe a group of diseases that affect how well our brains work because of progressive damage to brain cells.
Dementia can affect anyone, and as people get older the chances of developing dementia increase.
The symptoms each person experiences depends on the parts of the brain that are affected. However, the most common dementia symptoms include changes in memory, thinking, behaviour, personality and emotions. These changes affect a person’s ability to perform everyday tasks and interfere with their everyday lives.
Dementia is progressive, which means that for most people the changes gradually spread through the brain and lead to the symptoms getting worse. Dementia is different for everyone – what people experience, and how quickly they are affected is unique to them. What they can do, remember and understand may change from day to day.
2.2 Diagnosis
The Diagnostic and Statistical Manual for Mental Disorders fifth edition (DSM-5) published in 2013, renames dementia as Major Neurocognitive Disorder. Criteria for diagnosis include:
Evidence of substantial cognitive decline from a previous level of performance in one or more of the following domains:
– learning and memory;
– language;
– executive function;
– complex attention;
– perceptual-motor; and
– social cognition.
Evidence comprises (1) concern of the individual, a knowledgeable informant, or the clinician that there has been a significant decline in cognitive function, and (2) a substantial impairment in cognitive performance, preferably documented by standardised neuropsychological testing or, in its absence, another quantified clinical assessment.
The cognitive deficits interfere with independence in everyday activities. At a minimum, assistance would be required with complex instrumental activities of daily living, such as paying bills or managing medications.
The cognitive deficits do not occur exclusively in the context of a delirium.
The cognitive deficits are not better explained by another mental disorder (e.g. major depressive disorder, schizophrenia).
Dementia Economic Impact Report 2016
Page 18
A dementia friendly New Zealand | Aotearoa, he aro nui ki te hunga mate wareware
2.3 Progression
Dementia illnesses are progressive conditions –they spread through the brain leading to increased and more disabling symptoms. The progression of dementia over many years is often categorised as mild (early stage), moderate (middle stage) and severe or advanced (late stage), before the person dies:
Mild or early stage – difficulties in a number of areas but still able to function with minimal assistance
Moderate or middle stage – difficulties more obvious and severe and needing help with most tasks
Severe or late stage – fully dependent on others
2.4 Forms of dementia
2.4.1 Alzheimer’s disease
This is the most common form of dementia. Although we are still learning about the causes, there are typical changes seen in the brain – shrinkage and a build-up of abnormal proteins (plaques and tangles).
Alzheimer’s disease is progressive, starting as forgetfulness, word-finding problems and mild confusion, progressing to more severe memory loss, disorientation and changes in personality and behaviour. The specific symptoms can vary depending on the part of the brain that is affected.
2.4.2 Vascular dementia
This is the second most common form of dementia. This group of conditions is caused by poor blood supply to the brain as a result of a stroke or several mini-strokes, or by the slow accumulation of blood vessel disease in the brain. Vascular dementia symptoms can begin suddenly after a stroke or gradually as disease in the blood vessels worsen. Some people will have both vascular dementia and Alzheimer’s disease.
2.4.3 Lewy Body disease
This condition is characterised by the presence of ‘Lewy Bodies’, which are abnormal clumps of a particular protein in the brain. These cause changes in movement, thinking, behaviour and alertness. People with Lewy Body disease can fluctuate between almost normal functioning and severe confusion within short periods, and may also have hallucinations, seeing things that aren't really there. People with this diagnosis also nearly always develop the movement symptoms of Parkinson’s Disease.
2.4.4 Fronto-temporal dementia
Fronto-temporal dementia is a group of conditions which affect the frontal and/or temporal lobes of the brain. If a person has affected frontal lobes they will have increasing difficulty with motivation, planning and organising, controlling emotions and maintaining socially appropriate behaviour. If temporal lobes are affected the person will have difficulty with speaking and/or understanding language. Symptoms often begin in a person's 50s or 60s.
Dementia Economic Impact Report 2016
Page 19
A dementia friendly New Zealand | Aotearoa, he aro nui ki te hunga mate wareware
2.5 Risk factors
Age is the greatest risk factor for dementia. Other risk factors include a lack of physical activity, smoking, excessive alcohol consumption, head injuries, and eating a poor diet high in saturated fat. Pre-existing medical conditions that increase the risk of dementia include Parkinson’s disease, stroke, type-2 diabetes and high blood pressure.
2.6 Treatment
Dementia cannot be cured but there is increasing research into how it may be prevented and hopefully one day slowed.
2.6.1 Modifiable risk factors
Evidence is emerging5 that suggests that the risk of dementia can be reduced by changes in lifestyle. Many of these life changes are similar to those that reduce risks for a range of cardiovascular conditions but also include having a rich social life, and a high level of education6. Estimates suggest that addressing modifiable risk factors may be able to reduce the prevalence of dementia by 10-20%7.
2.6.2 Pharmacologic treatment
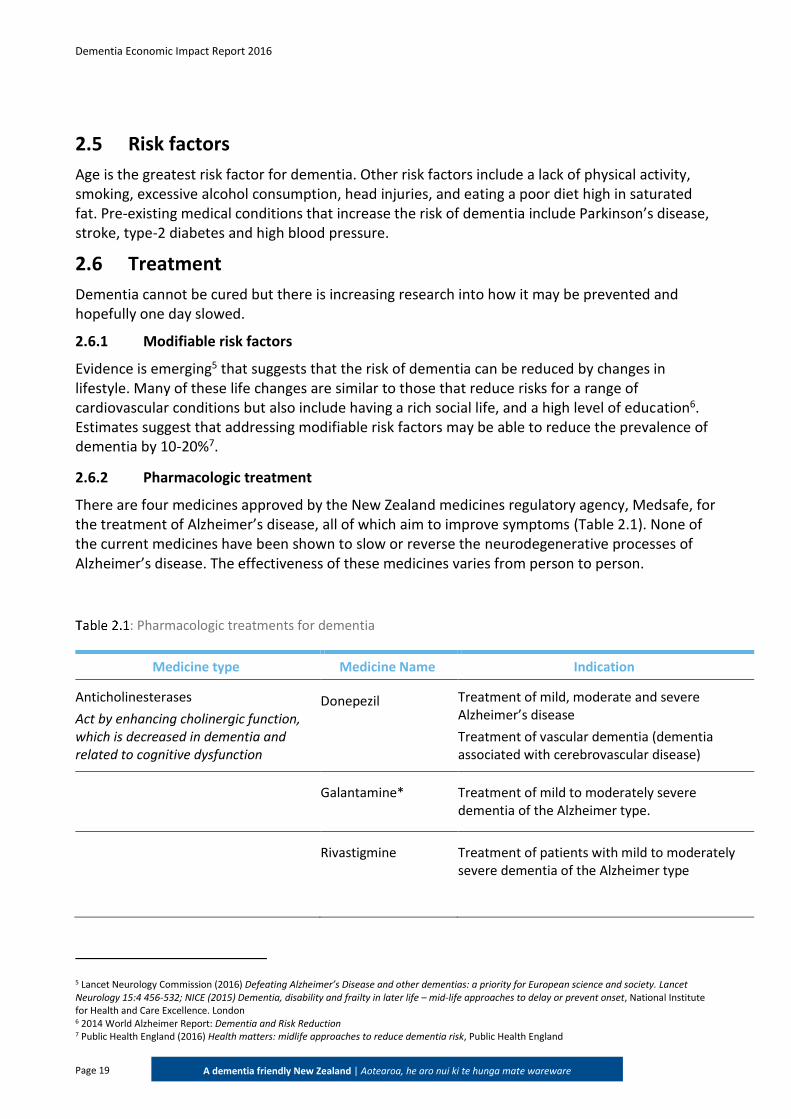
There are four medicines approved by the New Zealand medicines regulatory agency, Medsafe, for the treatment of Alzheimer’s disease, all of which aim to improve symptoms (Table 2.1). None of the current medicines have been shown to slow or reverse the neurodegenerative processes of Alzheimer’s disease. The effectiveness of these medicines varies from person to person.
: Pharmacologic treatments for dementia
Medicine type Medicine Name Indication
Anticholinesterases
Act by enhancing cholinergic function, which is decreased in dementia and related to cognitive dysfunction
Donepezil Treatment of mild, moderate and severe Alzheimer’s disease
Treatment of vascular dementia (dementia associated with cerebrovascular disease)
Galantamine* Treatment of mild to moderately severe dementia of the Alzheimer type.
Rivastigmine Treatment of patients with mild to moderately severe dementia of the Alzheimer type
5 Lancet Neurology Commission (2016) Defeating Alzheimer’s Disease and other dementias: a priority for European science and society. Lancet Neurology 15:4 456-532; NICE (2015) Dementia, disability and frailty in later life – mid-life approaches to delay or prevent onset, National Institute for Health and Care Excellence. London 6 2014 World Alzheimer Report: Dementia and Risk Reduction 7 Public Health England (2016) Health matters: midlife approaches to reduce dementia risk, Public Health England
Dementia Economic Impact Report 2016
Page 20
A dementia friendly New Zealand | Aotearoa, he aro nui ki te hunga mate wareware
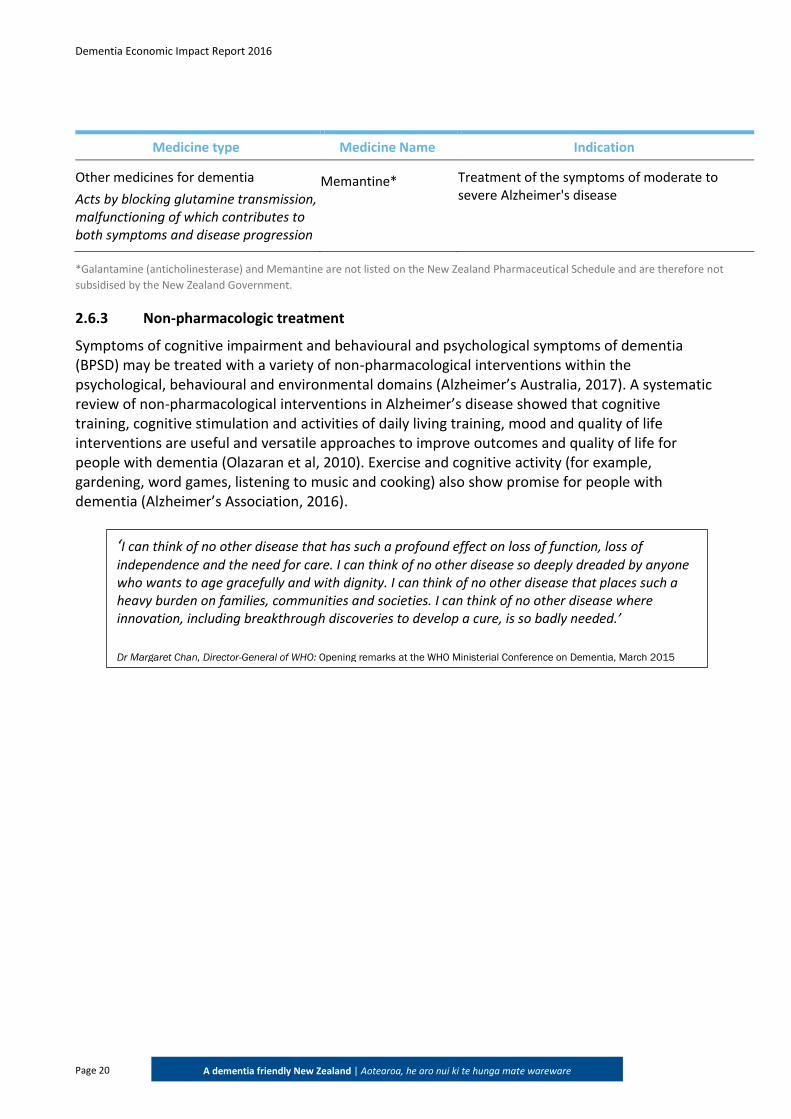
Medicine type Medicine Name Indication
Other medicines for dementia
Acts by blocking glutamine transmission, malfunctioning of which contributes to both symptoms and disease progression
Memantine* Treatment of the symptoms of moderate to severe Alzheimer's disease
*Galantamine (anticholinesterase) and Memantine are not listed on the New Zealand Pharmaceutical Schedule and are therefore not
subsidised by the New Zealand Government.
2.6.3 Non-pharmacologic treatment
Symptoms of cognitive impairment and behavioural and psychological symptoms of dementia (BPSD) may be treated with a variety of non-pharmacological interventions within the psychological, behavioural and environmental domains (Alzheimer’s Australia, 2017). A systematic review of non-pharmacological interventions in Alzheimer’s disease showed that cognitive training, cognitive stimulation and activities of daily living training, mood and quality of life interventions are useful and versatile approaches to improve outcomes and quality of life for people with dementia (Olazaran et al, 2010). Exercise and cognitive activity (for example, gardening, word games, listening to music and cooking) also show promise for people with dementia (Alzheimer’s Association, 2016).
‘I can think of no other disease that has such a profound effect on loss of function, loss of independence and the need for care. I can think of no other disease so deeply dreaded by anyone who wants to age gracefully and with dignity. I can think of no other disease that places such a heavy burden on families, communities and societies. I can think of no other disease where innovation, including breakthrough discoveries to develop a cure, is so badly needed.’ Dr Margaret Chan, Director-General of WHO: Opening remarks at the WHO Ministerial Conference on Dementia, March 2015

Dementia Economic Impact Report 2016
Page 21
A dementia friendly New Zealand | Aotearoa, he aro nui ki te hunga mate wareware
3 Prevalence estimates and projections
This chapter provides prevalence estimates and projections, and mortality estimates for dementia in New Zealand. As dementia is a relatively common condition, a number of sources exist to estimate and triangulate prevalence and mortality in high income countries; however, no epidemiological studies of dementia prevalence in the New Zealand population were identified in researching this report.
3.1 Data sources
3.1.1 New Zealand data
The targeted literature review conducted for this study did not identify any population-based studies in New Zealand that specifically estimate the prevalence of dementia for the New Zealand population or for ethnic groups within the New Zealand population. As a result, other sources were used to estimate the prevalence of dementia in New Zealand.
To estimate the prevalence of dementia in New Zealand in 2016, published dementia prevalence rates for Australasia (Alzheimer’s Disease International (ADI), 2015) were applied to the estimated population of New Zealand in 2016 (Statistics New Zealand, 2015c). The methods and data used for calculating the prevalence of dementia in New Zealand in 2016 are described in detail in the following sections. This is similar to methods employed in the Access Economics (2008) and the Deloitte Access Economics (2012) reports (referred to as the 2008 report and 2012 report) as detailed below, which used Australian prevalence rates applied to New Zealand population data.
Dementia is a common condition that affects many people throughout the world. Prevalence studies give slightly different results depending on the methods used in the study, although all reported estimates show that prevalence increases with age. While dementia can occur at any age, it is rare below the age of 60 years. Because of demographic ageing, in the future there will be relatively more people in the age groups at most risk for dementia. In the absence of effective prevention or treatment, the increase in the numbers of people with dementia will come about as a consequence of an increase in the size of the population most at risk i.e. those in the older age groups.
Key findings: There were an estimated 62,287 people in New Zealand who had dementia in 2016 – 1.3%
of the New Zealand population.
This is an increase of approximately 29% over the previous estimate of 48,182 people in 2011 (Deloitte Access Economics, 2012).
In 2050, it is projected that there will be 170,212 people in New Zealand with dementia – 2.9% of the New Zealand population.
This is an increase of approximately 16% over the previous estimate of 147,359 people in 2050 (Deloitte Access Economics, 2012).
Dementia Economic Impact Report 2016
Page 22
A dementia friendly New Zealand | Aotearoa, he aro nui ki te hunga mate wareware
We reiterate our previous statements in the 2008 and 2012 reports that it would be worthwhile collecting such information, including Māori and Pacific peoples, since it is possible that dementia prevalence rates differ by ethnicity. While there is evidence that the incidence of dementia may be higher for Māori and Pacific peoples in New Zealand, due to a higher prevalence of cardiovascular risk factors, no data were available to enable modelling of the extent of this difference.
3.1.2 Alternative sources
Previous estimates of the prevalence of dementia in New Zealand have also been based on international data. For example, the 2012 report used Australian prevalence estimates due to lack of a superior alternative (Table 3.1). These estimates were based on a meta-analysis conducted by Access Economics in 2005.
A more recent publication by Deloitte Access Economics (2014), Dementia Prevalence Estimates and Projections, estimated the prevalence of dementia in Australia using data from the Australian Institute of Health and Welfare (AIHW, 2012). These estimates are shown in Table 3.1 and report higher prevalence rates than the Deloitte Access Economics (2012) report.
ADI reports on a range of topics such as healthcare services for people with dementia, the global prevalence of dementia and factsheets about the condition. ADI’s prevalence estimates are based on a systematic review and meta-analysis of 224 eligible articles. The ADI (2015) report is considered to be one of the most up-to-date and comprehensive estimates of global dementia prevalence. The ADI (2015) report provides regional rather than country specific dementia prevalence estimates. New Zealand sits within the Australasian region, which also includes Australia. To estimate New Zealand-specific prevalence, ADI applied the Australasian prevalence rates to New Zealand population projections from the United Nations. The prevalence rates for Australasia are also shown in Table 3.1.
Note the Economic Cost of Dementia in Australia 2016-2056 report was released while this New Zealand report was being finalised. There was no opportunity to include the findings and analyses of that report due to timing.
Dementia Economic Impact Report 2016
Page 23
A dementia friendly New Zealand | Aotearoa, he aro nui ki te hunga mate wareware
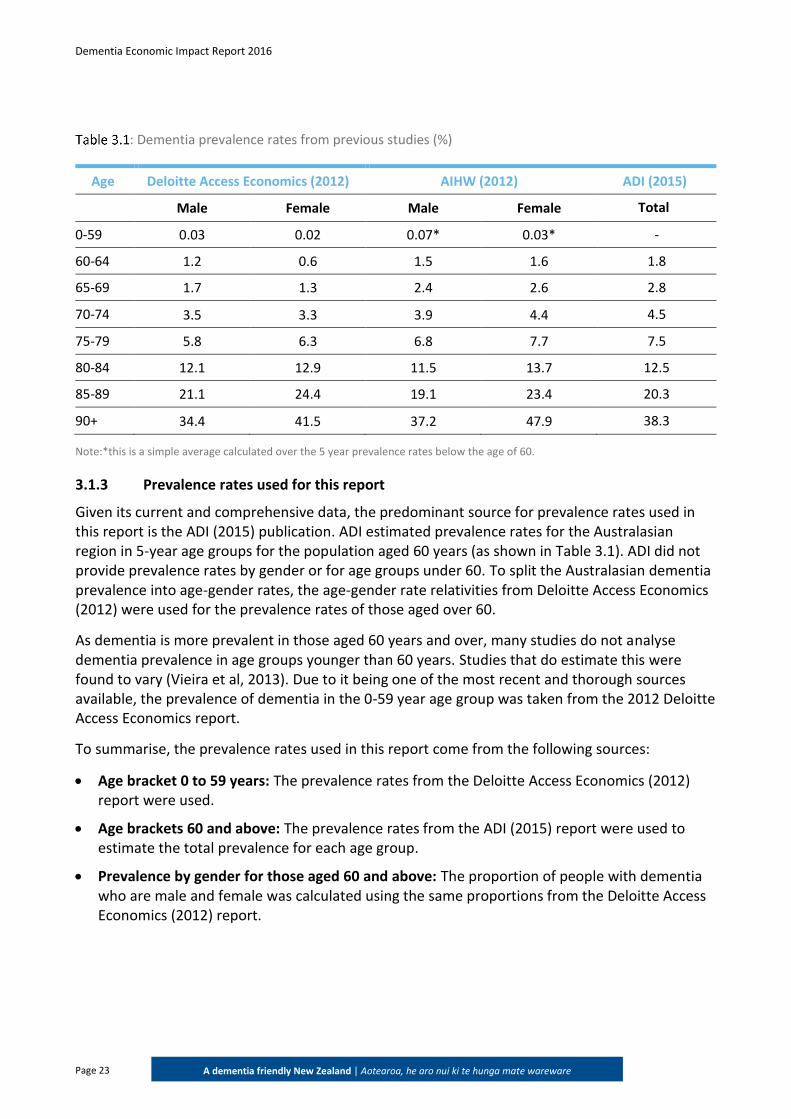
: Dementia prevalence rates from previous studies (%)
Age Deloitte Access Economics (2012) AIHW (2012) ADI (2015)
Male Female Male Female Total
0-59 0.03 0.02 0.07* 0.03* -
60-64 1.2 0.6 1.5 1.6 1.8
65-69 1.7 1.3 2.4 2.6 2.8
70-74 3.5 3.3 3.9 4.4 4.5
75-79 5.8 6.3 6.8 7.7 7.5
80-84 12.1 12.9 11.5 13.7 12.5
85-89 21.1 24.4 19.1 23.4 20.3
90+ 34.4 41.5 37.2 47.9 38.3
Note:*this is a simple average calculated over the 5 year prevalence rates below the age of 60.
3.1.3 Prevalence rates used for this report
Given its current and comprehensive data, the predominant source for prevalence rates used in this report is the ADI (2015) publication. ADI estimated prevalence rates for the Australasian region in 5-year age groups for the population aged 60 years (as shown in Table 3.1). ADI did not provide prevalence rates by gender or for age groups under 60. To split the Australasian dementia prevalence into age-gender rates, the age-gender rate relativities from Deloitte Access Economics (2012) were used for the prevalence rates of those aged over 60.
As dementia is more prevalent in those aged 60 years and over, many studies do not analyse dementia prevalence in age groups younger than 60 years. Studies that do estimate this were found to vary (Vieira et al, 2013). Due to it being one of the most recent and thorough sources available, the prevalence of dementia in the 0-59 year age group was taken from the 2012 Deloitte Access Economics report.
To summarise, the prevalence rates used in this report come from the following sources:
Age bracket 0 to 59 years: The prevalence rates from the Deloitte Access Economics (2012) report were used.
Age brackets 60 and above: The prevalence rates from the ADI (2015) report were used to estimate the total prevalence for each age group.
Prevalence by gender for those aged 60 and above: The proportion of people with dementia who are male and female was calculated using the same proportions from the Deloitte Access Economics (2012) report.
Dementia Economic Impact Report 2016
Page 24
A dementia friendly New Zealand | Aotearoa, he aro nui ki te hunga mate wareware
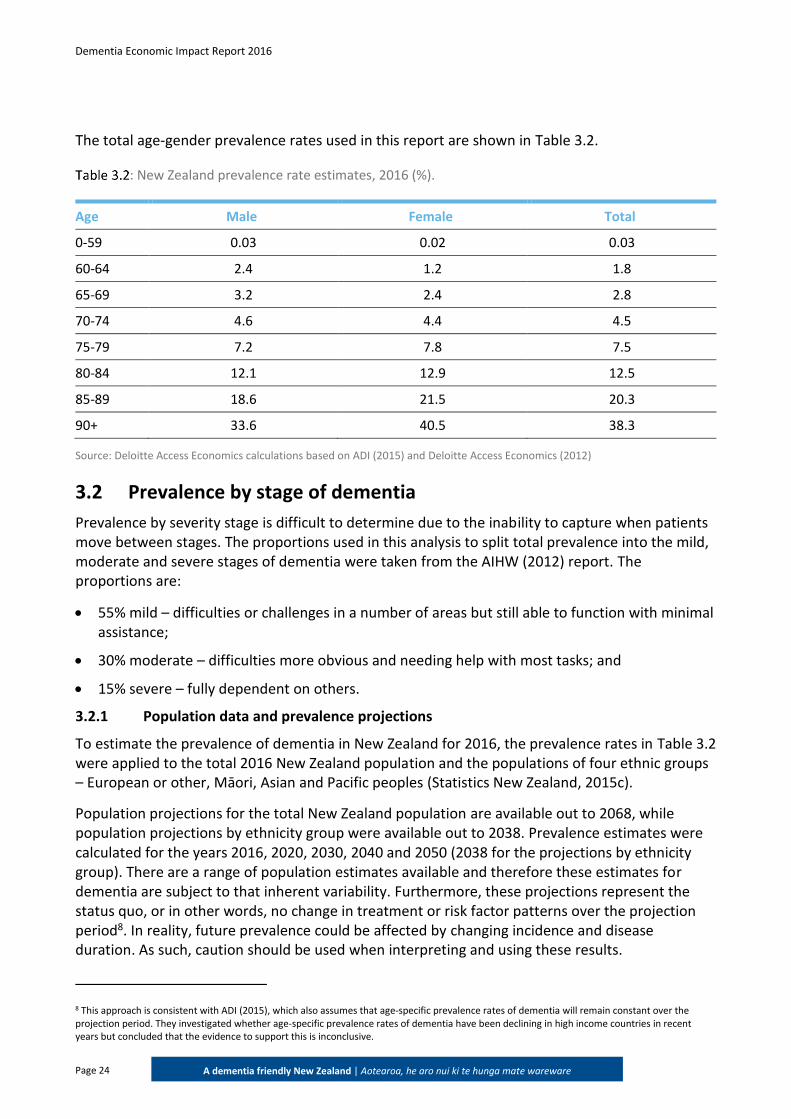
The total age-gender prevalence rates used in this report are shown in Table 3.2.
: New Zealand prevalence rate estimates, 2016 (%).
Age Male Female Total
0-59 0.03 0.02 0.03
60-64 2.4 1.2 1.8
65-69 3.2 2.4 2.8
70-74 4.6 4.4 4.5
75-79 7.2 7.8 7.5
80-84 12.1 12.9 12.5
85-89 18.6 21.5 20.3
90+ 33.6 40.5 38.3
Source: Deloitte Access Economics calculations based on ADI (2015) and Deloitte Access Economics (2012)
3.2 Prevalence by stage of dementia
Prevalence by severity stage is difficult to determine due to the inability to capture when patients move between stages. The proportions used in this analysis to split total prevalence into the mild, moderate and severe stages of dementia were taken from the AIHW (2012) report. The proportions are:
55% mild – difficulties or challenges in a number of areas but still able to function with minimal assistance;
30% moderate – difficulties more obvious and needing help with most tasks; and
15% severe – fully dependent on others.
3.2.1 Population data and prevalence projections
To estimate the prevalence of dementia in New Zealand for 2016, the prevalence rates in Table 3.2 were applied to the total 2016 New Zealand population and the populations of four ethnic groups – European or other, Māori, Asian and Pacific peoples (Statistics New Zealand, 2015c).
Population projections for the total New Zealand population are available out to 2068, while population projections by ethnicity group were available out to 2038. Prevalence estimates were calculated for the years 2016, 2020, 2030, 2040 and 2050 (2038 for the projections by ethnicity group). There are a range of population estimates available and therefore these estimates for dementia are subject to that inherent variability. Furthermore, these projections represent the status quo, or in other words, no change in treatment or risk factor patterns over the projection period8. In reality, future prevalence could be affected by changing incidence and disease duration. As such, caution should be used when interpreting and using these results.
8 This approach is consistent with ADI (2015), which also assumes that age-specific prevalence rates of dementia will remain constant over the projection period. They investigated whether age-specific prevalence rates of dementia have been declining in high income countries in recent years but concluded that the evidence to support this is inconclusive.
Dementia Economic Impact Report 2016
Page 25
A dementia friendly New Zealand | Aotearoa, he aro nui ki te hunga mate wareware
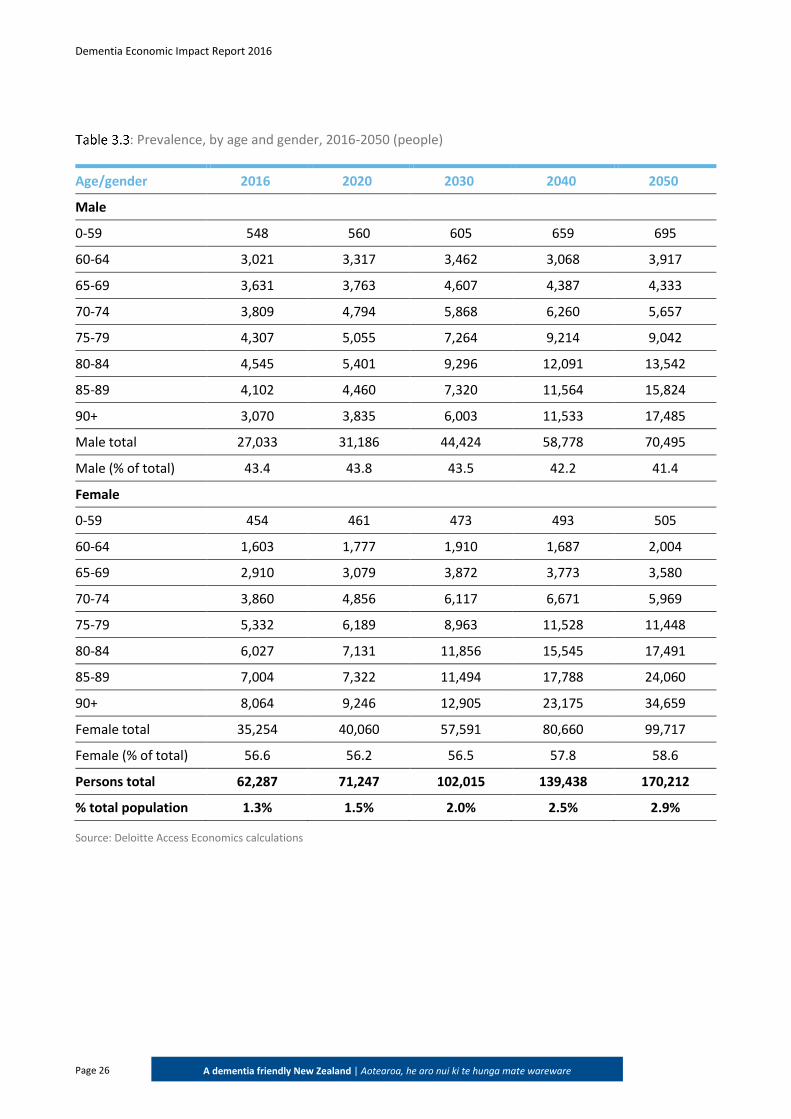
Table 3.3 shows the prevalence projections by age and gender. There were an estimated 62,287 people in New Zealand who had dementia in 2016 – 1.3% of the New Zealand population. Of these 62,287 people, 43% were male and 57% were female. By 2050 it is estimated that there will be 170,212 people with dementia in New Zealand - 2.9% of the population. Of this, 70,495 will be males and 99,717 will be females.
The Access Economics (2008) report estimated that there would be 146,699 people with dementia in 2050 – 2.7% of the population. While the Deloitte Access Economics (2012) report estimated that by 2050 the total prevalence of dementia would be 147,359 people – 2.6% of the population. Both these estimates for future dementia prevalence are lower than what has been estimated in this report (170,212 people – 2.9% in 2050). A key driver of the projected increase in the number of people with dementia in 2050 is the higher prevalence rates for the 60 to 79 age brackets from the ADI report (as shown in Table 1.1).
When compared to previous estimates, these findings suggest that the prevalence of dementia is increasing. With an ageing population, New Zealand is expected to see an increase in dementia cases into the future. However, it should be noted that there is inherent variability and many underlying assumptions in prevalence and projection estimates that will likely influence any results. Population estimates to which the prevalence rates are applied in this report are provided by Statistics New Zealand and are updated every two to three years. Therefore, with revised information, data and methods, estimates may change over time and may not be solely a reflection of a change in the prevalence of the condition. In addition, each of the reports used to estimate prevalence use different sources of data, which may drive the different estimates.
The population projections presented in Table 3.3 also differ from the projections undertaken by ADI for New Zealand. ADI (2015) estimated there would be 154,000 people with dementia in 2050. The key difference in methodology, which explains the difference between the projections in this report and the ADI projection, is that ADI uses UN population projections to undertake their analysis, which differ from the Statistics New Zealand projections.
Dementia Economic Impact Report 2016
Page 26
A dementia friendly New Zealand | Aotearoa, he aro nui ki te hunga mate wareware
: Prevalence, by age and gender, 2016-2050 (people)
Age/gender 2016 2020 2030 2040 2050
Male
0-59 548 560 605 659 695
60-64 3,021 3,317 3,462 3,068 3,917
65-69 3,631 3,763 4,607 4,387 4,333
70-74 3,809 4,794 5,868 6,260 5,657
75-79 4,307 5,055 7,264 9,214 9,042
80-84 4,545 5,401 9,296 12,091 13,542
85-89 4,102 4,460 7,320 11,564 15,824
90+ 3,070 3,835 6,003 11,533 17,485
Male total 27,033 31,186 44,424 58,778 70,495
Male (% of total) 43.4 43.8 43.5 42.2 41.4
Female
0-59 454 461 473 493 505
60-64 1,603 1,777 1,910 1,687 2,004
65-69 2,910 3,079 3,872 3,773 3,580
70-74 3,860 4,856 6,117 6,671 5,969
75-79 5,332 6,189 8,963 11,528 11,448
80-84 6,027 7,131 11,856 15,545 17,491
85-89 7,004 7,322 11,494 17,788 24,060
90+ 8,064 9,246 12,905 23,175 34,659
Female total 35,254 40,060 57,591 80,660 99,717
Female (% of total) 56.6 56.2 56.5 57.8 58.6
Persons total 62,287 71,247 102,015 139,438 170,212
% total population 1.3% 1.5% 2.0% 2.5% 2.9%
Source: Deloitte Access Economics calculations
Dementia Economic Impact Report 2016
Page 27
A dementia friendly New Zealand | Aotearoa, he aro nui ki te hunga mate wareware
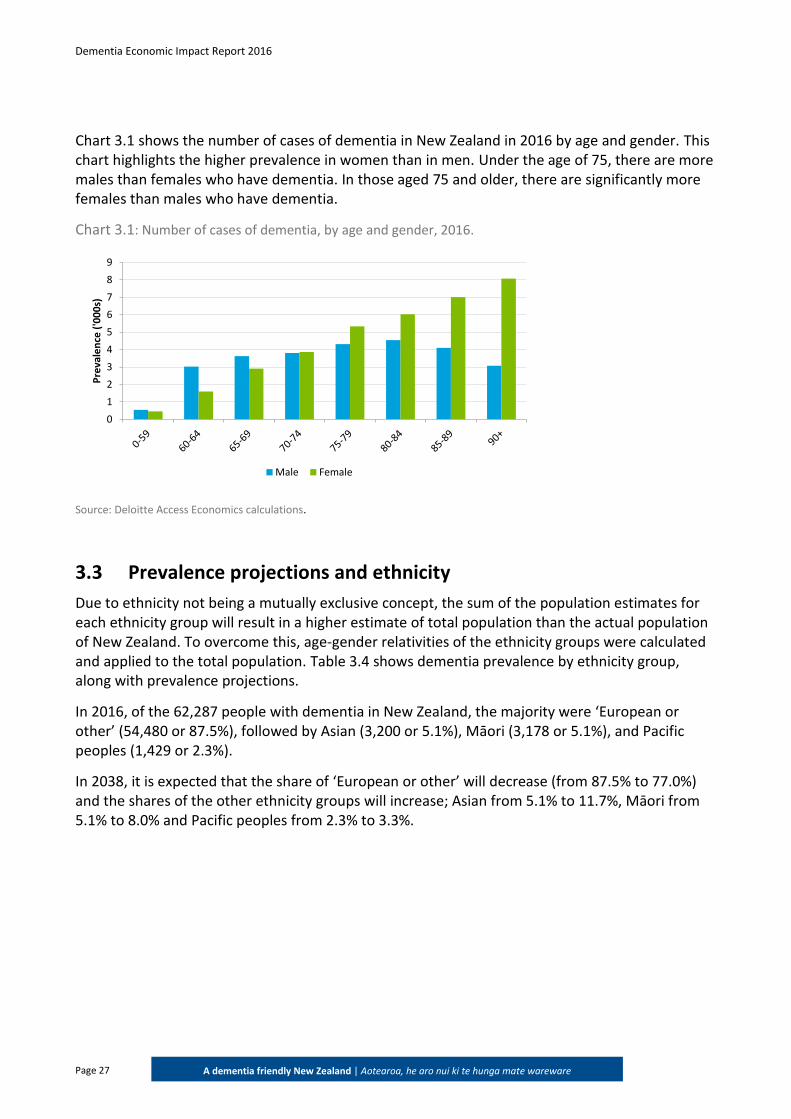
Chart 3.1 shows the number of cases of dementia in New Zealand in 2016 by age and gender. This chart highlights the higher prevalence in women than in men. Under the age of 75, there are more males than females who have dementia. In those aged 75 and older, there are significantly more females than males who have dementia.
Chart 3.1: Number of cases of dementia, by age and gender, 2016.
Source: Deloitte Access Economics calculations.
3.3 Prevalence projections and ethnicity
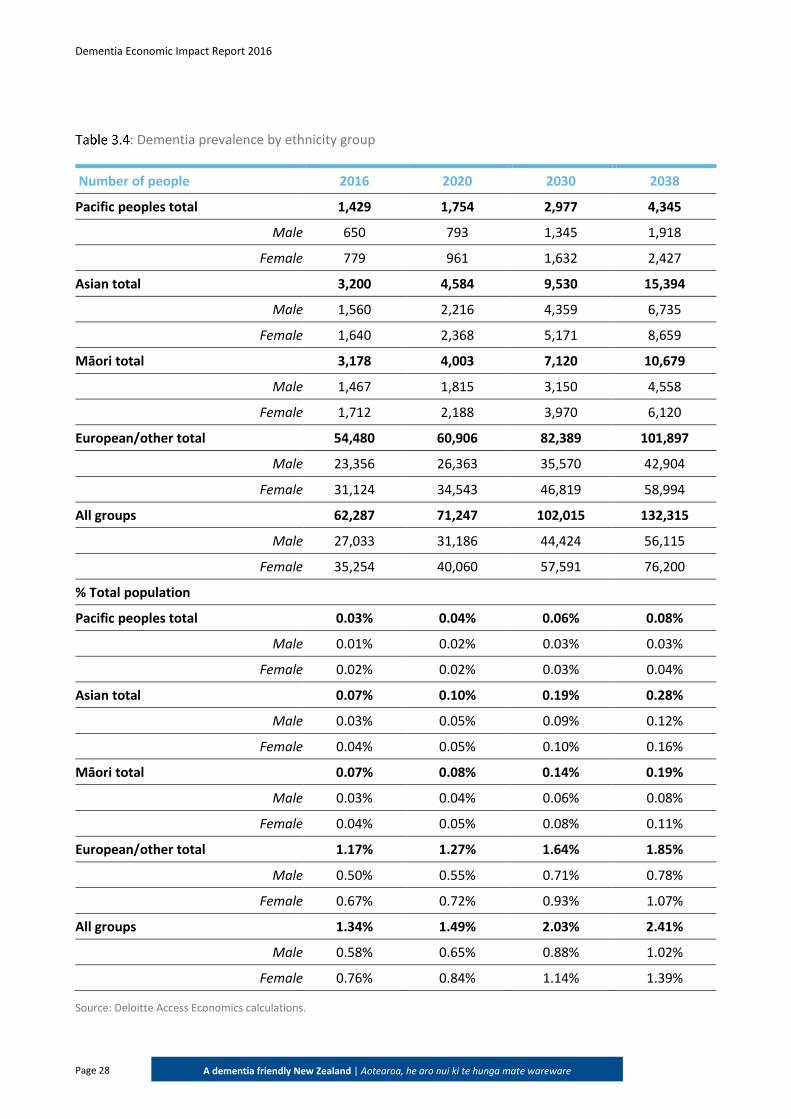
Due to ethnicity not being a mutually exclusive concept, the sum of the population estimates for each ethnicity group will result in a higher estimate of total population than the actual population of New Zealand. To overcome this, age-gender relativities of the ethnicity groups were calculated and applied to the total population. Table 3.4 shows dementia prevalence by ethnicity group, along with prevalence projections.
In 2016, of the 62,287 people with dementia in New Zealand, the majority were ‘European or other’ (54,480 or 87.5%), followed by Asian (3,200 or 5.1%), Māori (3,178 or 5.1%), and Pacific peoples (1,429 or 2.3%).
In 2038, it is expected that the share of ‘European or other’ will decrease (from 87.5% to 77.0%) and the shares of the other ethnicity groups will increase; Asian from 5.1% to 11.7%, Māori from 5.1% to 8.0% and Pacific peoples from 2.3% to 3.3%.
0
1
2
3
4
5
6
7
8
9
Pre
vale
nce
('0
00
s)
Male Female
Dementia Economic Impact Report 2016
Page 28
A dementia friendly New Zealand | Aotearoa, he aro nui ki te hunga mate wareware
: Dementia prevalence by ethnicity group
Number of people 2016 2020 2030 2038
Pacific peoples total 1,429 1,754 2,977 4,345
Male 650 793 1,345 1,918
Female 779 961 1,632 2,427
Asian total 3,200 4,584 9,530 15,394
Male 1,560 2,216 4,359 6,735
Female 1,640 2,368 5,171 8,659
Māori total 3,178 4,003 7,120 10,679
Male 1,467 1,815 3,150 4,558
Female 1,712 2,188 3,970 6,120
European/other total 54,480 60,906 82,389 101,897
Male 23,356 26,363 35,570 42,904
Female 31,124 34,543 46,819 58,994
All groups 62,287 71,247 102,015 132,315
Male 27,033 31,186 44,424 56,115
Female 35,254 40,060 57,591 76,200
% Total population
Pacific peoples total 0.03% 0.04% 0.06% 0.08%
Male 0.01% 0.02% 0.03% 0.03%
Female 0.02% 0.02% 0.03% 0.04%
Asian total 0.07% 0.10% 0.19% 0.28%
Male 0.03% 0.05% 0.09% 0.12%
Female 0.04% 0.05% 0.10% 0.16%
Māori total 0.07% 0.08% 0.14% 0.19%
Male 0.03% 0.04% 0.06% 0.08%
Female 0.04% 0.05% 0.08% 0.11%
European/other total 1.17% 1.27% 1.64% 1.85%
Male 0.50% 0.55% 0.71% 0.78%
Female 0.67% 0.72% 0.93% 1.07%
All groups 1.34% 1.49% 2.03% 2.41%
Male 0.58% 0.65% 0.88% 1.02%
Female 0.76% 0.84% 1.14% 1.39%
Source: Deloitte Access Economics calculations.
Dementia Economic Impact Report 2016
Page 29
A dementia friendly New Zealand | Aotearoa, he aro nui ki te hunga mate wareware
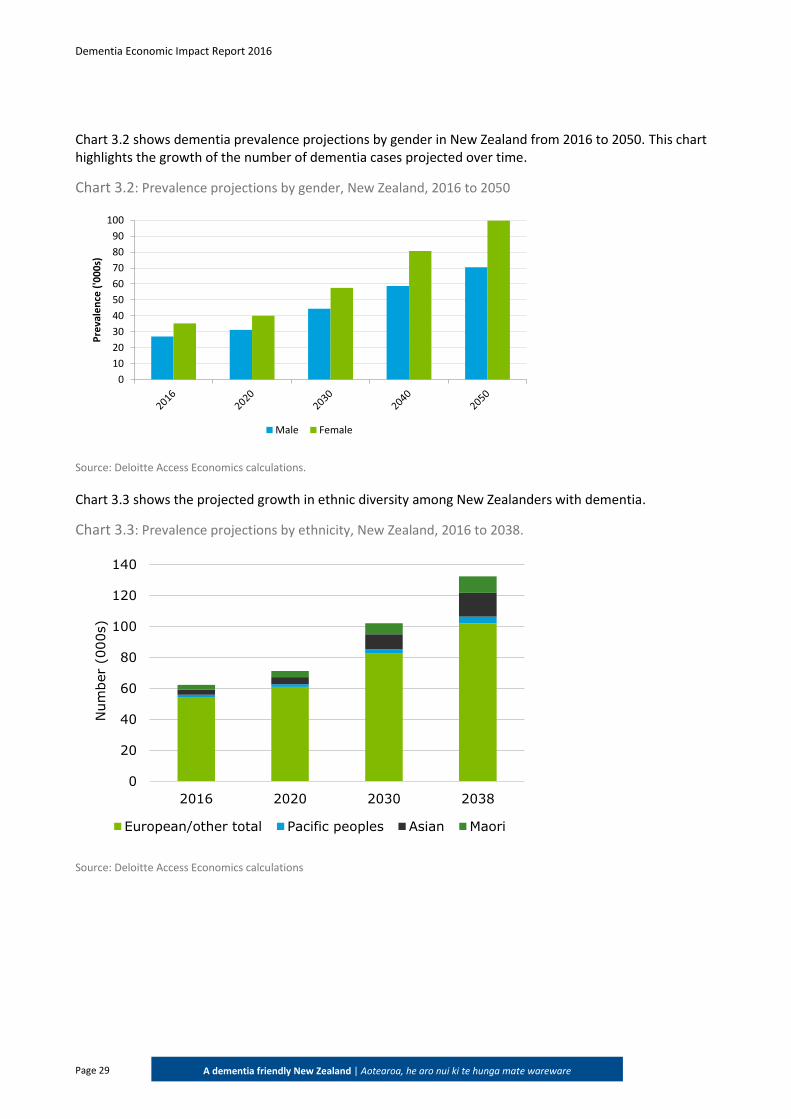
Chart 3.2 shows dementia prevalence projections by gender in New Zealand from 2016 to 2050. This chart highlights the growth of the number of dementia cases projected over time.
Chart 3.2: Prevalence projections by gender, New Zealand, 2016 to 2050
Source: Deloitte Access Economics calculations.
Chart 3.3 shows the projected growth in ethnic diversity among New Zealanders with dementia.
Chart 3.3: Prevalence projections by ethnicity, New Zealand, 2016 to 2038.
Source: Deloitte Access Economics calculations
0
10
20
30
40
50
60
70
80
90
100
Pre
vale
nce
('0
00
s)
Male Female
0
20
40
60
80
100
120
140
2016 2020 2030 2038
Num
ber
(000s)
European/other total Pacific peoples Asian Maori
Dementia Economic Impact Report 2016
Page 30
A dementia friendly New Zealand | Aotearoa, he aro nui ki te hunga mate wareware
3.4 Mortality
This section outlines the methodology and data that were used to estimate the number of deaths due to dementia in 2016.
3.4.1 Methods
The primary source for estimating the number of deaths due to dementia in 2016 is the Ministry of Health’s Mortality 2013: Online tables (Ministry of Health, 2016a). The underlying cause of death in the Ministry of Health (2016a) publication was defined as:
(a) the disease or injury which initiated the train of morbid events leading directly to death, or (b) the circumstances of the accident or violence which produced the fatal injury.
It should be noted that death certificates under-report dementia as the cause of death, often citing instead respiratory infection (Deloitte Access Economics, 2012). Therefore, the following calculations are likely to underestimate the number of deaths due to dementia in New Zealand.
3.4.2 Results
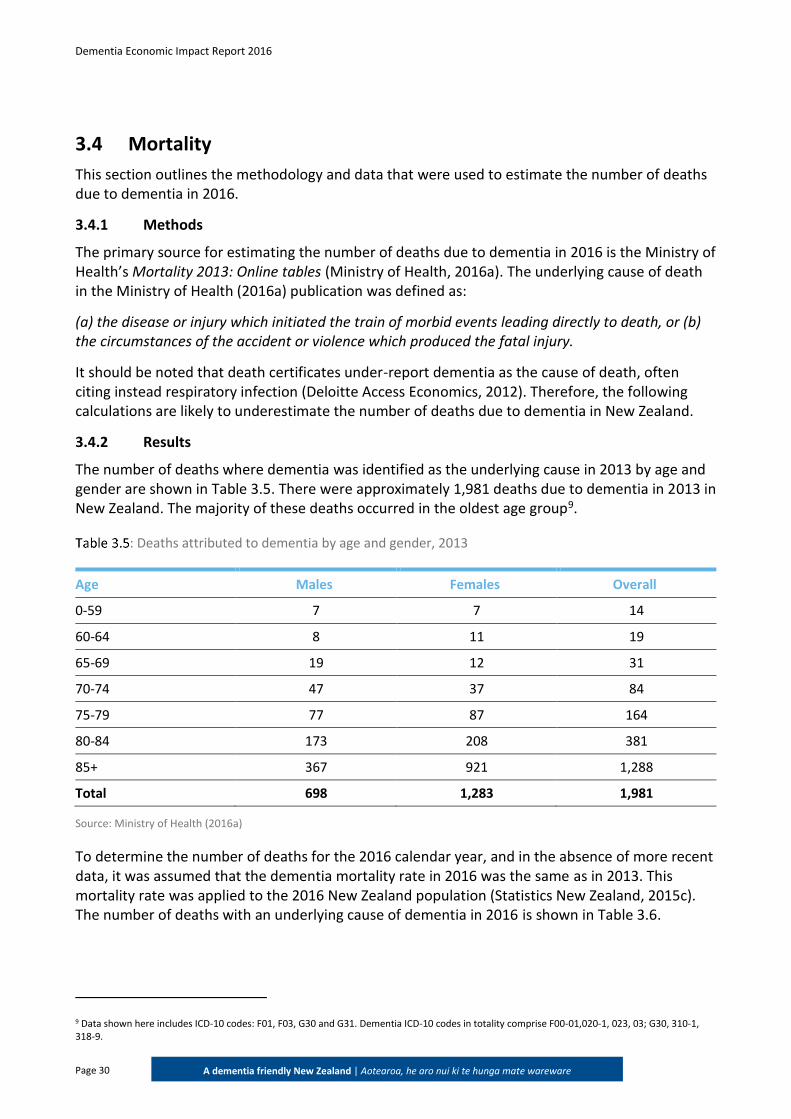
The number of deaths where dementia was identified as the underlying cause in 2013 by age and gender are shown in Table 3.5. There were approximately 1,981 deaths due to dementia in 2013 in New Zealand. The majority of these deaths occurred in the oldest age group9.
: Deaths attributed to dementia by age and gender, 2013
Age Males Females Overall
0-59 7 7 14
60-64 8 11 19
65-69 19 12 31
70-74 47 37 84
75-79 77 87 164
80-84 173 208 381
85+ 367 921 1,288
Total 698 1,283 1,981
Source: Ministry of Health (2016a)
To determine the number of deaths for the 2016 calendar year, and in the absence of more recent data, it was assumed that the dementia mortality rate in 2016 was the same as in 2013. This mortality rate was applied to the 2016 New Zealand population (Statistics New Zealand, 2015c). The number of deaths with an underlying cause of dementia in 2016 is shown in Table 3.6.
9 Data shown here includes ICD-10 codes: F01, F03, G30 and G31. Dementia ICD-10 codes in totality comprise F00-01,020-1, 023, 03; G30, 310-1, 318-9.
Dementia Economic Impact Report 2016
Page 31
A dementia friendly New Zealand | Aotearoa, he aro nui ki te hunga mate wareware
: Number of deaths attributed to dementia, 2016
Age Males Females Overall
0-59 7 7 14
60-64 8 12 20
65-69 22 14 36
70-74 52 41 93
75-79 91 102 193
80-84 181 212 393
85-89 301 629 930
90+* 125 384 509
Total 787 1,401 2,188
Source: Deloitte Access Economics calculations using Ministry of Health (2016a) data.
Note: *For the 90+ age group the mortality rate for the 85+ age group as shown in Table 3.5 was applied.
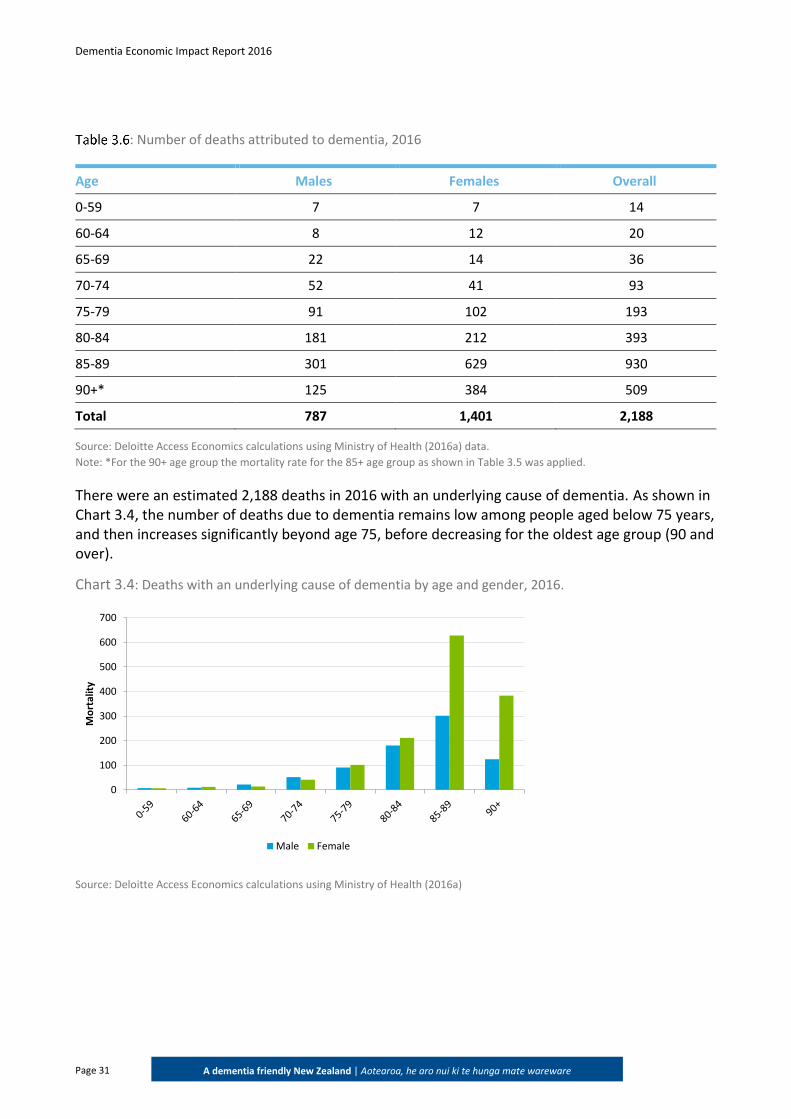
There were an estimated 2,188 deaths in 2016 with an underlying cause of dementia. As shown in Chart 3.4, the number of deaths due to dementia remains low among people aged below 75 years, and then increases significantly beyond age 75, before decreasing for the oldest age group (90 and over).
Chart 3.4: Deaths with an underlying cause of dementia by age and gender, 2016.
Source: Deloitte Access Economics calculations using Ministry of Health (2016a)
0
100
200
300
400
500
600
700
Mo
rtal
ity
Male Female
Dementia Economic Impact Report 2016
Page 32
A dementia friendly New Zealand | Aotearoa, he aro nui ki te hunga mate wareware
4 Health system costs
This chapter estimates individual components of health system costs, to provide an estimate of the overall health system expenditure on dementia in New Zealand. Health system costs comprise the costs of running hospitals, general practitioner (GP), specialist and other health professional services, pharmaceuticals, research, aged care and other direct costs such as health administration and infrastructure. Health system costs were estimated using a combination of a bottom-up approach and a top-down approach.
4.1 Hospital expenditure
4.1.1 Public and private hospital inpatient costs
Similarly to the Access Economics (2008) and the Deloitte Access Economics (2012) reports (referred to as the 2008 report and 2012 report), data sets analysed in this report use the International Classification of Disease Tenth Revision (ICD-10) as the basis for coding of diseases. A diagnosis of dementia or Alzheimer’s disease was defined as including any of the codes from Table 4.110.
10 Some publications vary in which codes they use when analysing dementia data; for example, the Australian Institute of Health and Welfare (AIHW, 2012) includes ICD -10 codes F01, F03 and G30 in their analysis of dementia related deaths, but includes ICD-10 codes of F00, F01, F02, F03, F05.1, G30 and a principal diagnosis code of G31 when estimating the number of hospitalisations due to dementia.
Key findings: In 2016, the total health system costs due to dementia were estimated to be
$1,105 million, or $17,745 per person with dementia.
The health system costs for 2008 and 2011 were $435.7 million and $596.3 million, respectively, noting those estimates excluded community care costs (estimated at $67.3 million in 2016).
Compared to 2016, estimates of health system costs have increased by over 150% from 2008 and by over 80% from 2011.
Dementia Economic Impact Report 2016
Page 33
A dementia friendly New Zealand | Aotearoa, he aro nui ki te hunga mate wareware
: ICD-10 codes for dementia
Code Description
F00 Dementia in Alzheimer's disease
F01 Vascular dementia
F02.0 Dementia in Pick's disease
F02.1 Dementia in Creutzfeldt-Jakob disease
F02.3 Dementia in Parkinson's disease
F03 Unspecified dementia
G30 Alzheimer’s disease
G31.0 Circumscribed brain atrophy
G31.1 Senile degeneration of brain, not elsewhere classified
G31.8 Other specified degenerative disease of nervous system
G31.9 Degenerative disease of nervous system, unspecified
Source: Access Economics (2008)
The 2008 report was able to estimate hospital expenditure using data provided by the Ministry of Health. The 2012 report inflated this figure using health CPI and prevalence growth for the time period between reports.
A data request was sent to the Ministry of Health to obtain data for this report. The data provided by the Ministry of Health for the 2015 calendar year provided a much lower case-weighted discharge cost than included in our previous reports. For our previous work in the 2008 report, the Ministry of Health provided Access Economics with data that showed that the average cost weight across all discharges where dementia was the primary diagnosis was approximately 11.5, while the average across all dementia related discharges was 5.4. When the average was taken across the cost weights provided by the Ministry of Health for the 2015 calendar year, the average cost weight was 1.45. We also looked at the average length of stay for a dementia patient. In 2004, the average length of stay was approximately 63.3 days in a public hospital, which was approximately 10 times longer than the average for all discharges in 2004. As a result, we would also expect the cost weight to be higher than the average cost weight in 2015 of 1.45. We were unable to determine the cause of the difference in the cost weights, and given the more detailed information available for the 2008 data request, we have used the 2008 cost weights.
Hospital expenditure data in New Zealand includes general public and private hospital admissions, as well as outpatient clinics. These data are reported by the Ministry of Health (2016b; 2016c). The cost of case-weighted discharges for 2016 was taken from the New Zealand Casemix Framework, which indicated the average cost weight was $4,752 per procedure (Ministry of Health, 2016d).
Dementia Economic Impact Report 2016
Page 34
A dementia friendly New Zealand | Aotearoa, he aro nui ki te hunga mate wareware
Due to the inability to calculate the average case-weighted discharge cost for dementia specifically from available data, results from the 2008 report were utilised. The average cost per dementia discharge was also calculated from the 2008 report. This was then divided by the average cost per discharge from 2008. Overall, the 2008 case-weighted discharge value for dementia procedures was 11.46 – meaning that 11.46 times the average cost weight per procedure ($4,752), or $54,455 is applied to all dementia procedures to determine the overall expenditure.
In previous reports the private hospital inpatient costs were not calculated due to the paucity of private inpatient beds in New Zealand to treat people with dementia. However, recent data have become available which provide information about the number of private hospital discharges which can be used in this calculation.
The total number of discharges for each of the ICD-10 codes in Table 4.1 was collated for both publicly funded and privately funded discharges from the Ministry of Health’s publications (2016b, 2016c)11. These data present the number of discharges by age and gender. The total number of reported discharges related to dementia in 2013-14 was 2,737. To obtain an estimate of the number of discharges related to dementia in 2016, this number was adjusted for prevalence growth between 2014 and 2016. It was thus estimated that there were 2,937 discharges related to dementia in 2016. Multiplying the number of dementia related discharges by the cost weight for dementia ($54,455) results in total admitted patient hospital expenditure for dementia to be $159.9 million in 2016.
4.1.2 Public outpatient
In addition to inpatient hospital expenditure, outpatient hospital expenditure on dementia patients is also substantial on a per-capita basis. No publicly available data were available on the service utilisation for outpatient services associated with dementia, as the information on outpatients held by the Ministry of Health does not capture the diagnosis code. Consequently, the methodology from the Access Economics (2008) report was used to calculate the outpatient costs. The Access Economics (2008) report assumed that outpatient expenditure on dementia was approximately 9.5% of total public hospital expenditure on dementia.
By applying this percentage to public hospital expenditure on dementia, it was estimated that $13.9 million was spent on non-admitted care for people with dementia in 2016.
4.2 General practitioner visits
The 2008 and 2012 reports relied on data provided by the Public Health Intelligence unit of the Ministry of Health, specifically the number of GP consultations for people with and without dementia. We were unable to source data for this report from the Ministry of Health because the number of GP consultations by diagnosis code is not collected. Therefore, this report used a different approach to calculating the number of GP consultations per person with dementia.
11 Data was collected for ICD-10 codes: F01, F03, G30 and G31. Dementia ICD-10 codes in totality comprise F00-01,020-1, 023, 03; G30, 310-1, 318-9.
Dementia Economic Impact Report 2016
Page 35
A dementia friendly New Zealand | Aotearoa, he aro nui ki te hunga mate wareware
According to the Ministry of Health there were approximately 12.4 million GP consultations in New Zealand in 2013 (Ministry of Health, 2015a). The number of GP consultations was multiplied by the 2013-2016 growth rate in the population to provide a 2016 figure for the number of GP consultations in 2016. This resulted in approximately 13.1 million consultations in 2016.
No publicly available New Zealand data were found that could provide an indication of how many of these consults were specifically for managing dementia. Instead, data from the Australian study by Britt et al (2016) was used. This study found that the rate at which dementia was managed was 0.5 per 100 GP encounters. Multiplying this rate by the total number of GP consultations results in approximately 65,281 consultations where dementia was managed.
Primary Health Organisations (PHOs) receive funding to provide subsidised GP consultations for their enrolled members. The subsidy is paid at a rate of $13.33 for those aged 18 years or over and who hold a Community Services Card or a High Use Health Card (Ministry of Health, 2015b). The remainder of the cost of the consultation is charged as an out-of-pocket fee to the patient.
According to CPI data (Statistics New Zealand, 2016a), the weighted average retail price for a ‘General Practitioner – consultation, adults without community services card” was $39.21 for 2016. This cost excludes Government subsidies for the GP consultation. No data were identified to estimate the average out-of-pocket price of a consultation where a subsidy was accessed, nor the share of visits attributable to dementia where subsidies were used, hence the total average cost of a GP visit in 2016 was estimated as $52.54 (the sum of the subsidy and the non-subsidised out-of-pocket costs). Note this is lower than the total average cost of a GP visit as it excludes other government subsidies such as capitation-based funding for PHOs. As these are costs paid for all people, regardless of condition, they are not part of the marginal increase in cost for GP visits due to dementia.
The number of GP consults where dementia was managed was multiplied by the 2016 average cost per consult. The total cost of GP visits due to dementia in 2016 is estimated to be $3.4 million ($52.54 per GP visit*65,281 visits).
4.3 Pharmaceutical costs
The 2008 report calculated pharmaceutical expenditure attributed to dementia from a special data request from the Ministry of Health, while the 2012 Deloitte Access Economics report inflated this cost to provide an estimate of pharmaceutical costs in 2011. To estimate pharmaceutical costs for 2016 a special data request was sent to the Ministry of Health requesting data on the two PHARMAC subsidised pharmaceuticals, Donepezil and Rivastigmine. As discussed in Section 2.6.1, Donepezil and Rivastigmine are currently subsidised in New Zealand for the treatment of dementia. Two other medicines, Galantamine and Memantine, are available for individual (private) purchase for the treatment of dementia however these do not attract a government subsidy. The size of this private pharmaceutical market in New Zealand is unknown and these costs are therefore not included in the estimates below. However, it was assumed that given the availability of highly subsidised alternatives, use of these private medicines in New Zealand is likely to be limited.
Dementia Economic Impact Report 2016
Page 36
A dementia friendly New Zealand | Aotearoa, he aro nui ki te hunga mate wareware
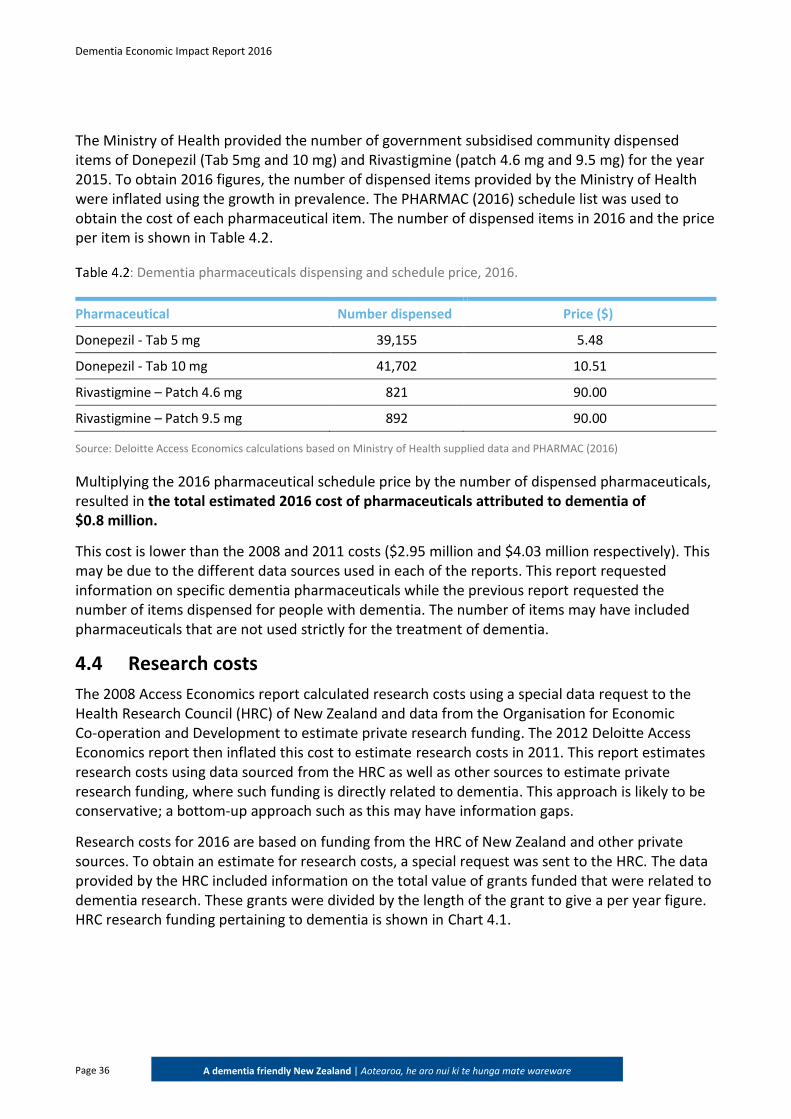
The Ministry of Health provided the number of government subsidised community dispensed items of Donepezil (Tab 5mg and 10 mg) and Rivastigmine (patch 4.6 mg and 9.5 mg) for the year 2015. To obtain 2016 figures, the number of dispensed items provided by the Ministry of Health were inflated using the growth in prevalence. The PHARMAC (2016) schedule list was used to obtain the cost of each pharmaceutical item. The number of dispensed items in 2016 and the price per item is shown in Table 4.2.
: Dementia pharmaceuticals dispensing and schedule price, 2016.
Pharmaceutical Number dispensed Price ($)
Donepezil - Tab 5 mg 39,155 5.48
Donepezil - Tab 10 mg 41,702 10.51
Rivastigmine – Patch 4.6 mg 821 90.00
Rivastigmine – Patch 9.5 mg 892 90.00
Source: Deloitte Access Economics calculations based on Ministry of Health supplied data and PHARMAC (2016)
Multiplying the 2016 pharmaceutical schedule price by the number of dispensed pharmaceuticals, resulted in the total estimated 2016 cost of pharmaceuticals attributed to dementia of $0.8 million.
This cost is lower than the 2008 and 2011 costs ($2.95 million and $4.03 million respectively). This may be due to the different data sources used in each of the reports. This report requested information on specific dementia pharmaceuticals while the previous report requested the number of items dispensed for people with dementia. The number of items may have included pharmaceuticals that are not used strictly for the treatment of dementia.
4.4 Research costs
The 2008 Access Economics report calculated research costs using a special data request to the Health Research Council (HRC) of New Zealand and data from the Organisation for Economic Co-operation and Development to estimate private research funding. The 2012 Deloitte Access Economics report then inflated this cost to estimate research costs in 2011. This report estimates research costs using data sourced from the HRC as well as other sources to estimate private research funding, where such funding is directly related to dementia. This approach is likely to be conservative; a bottom-up approach such as this may have information gaps.
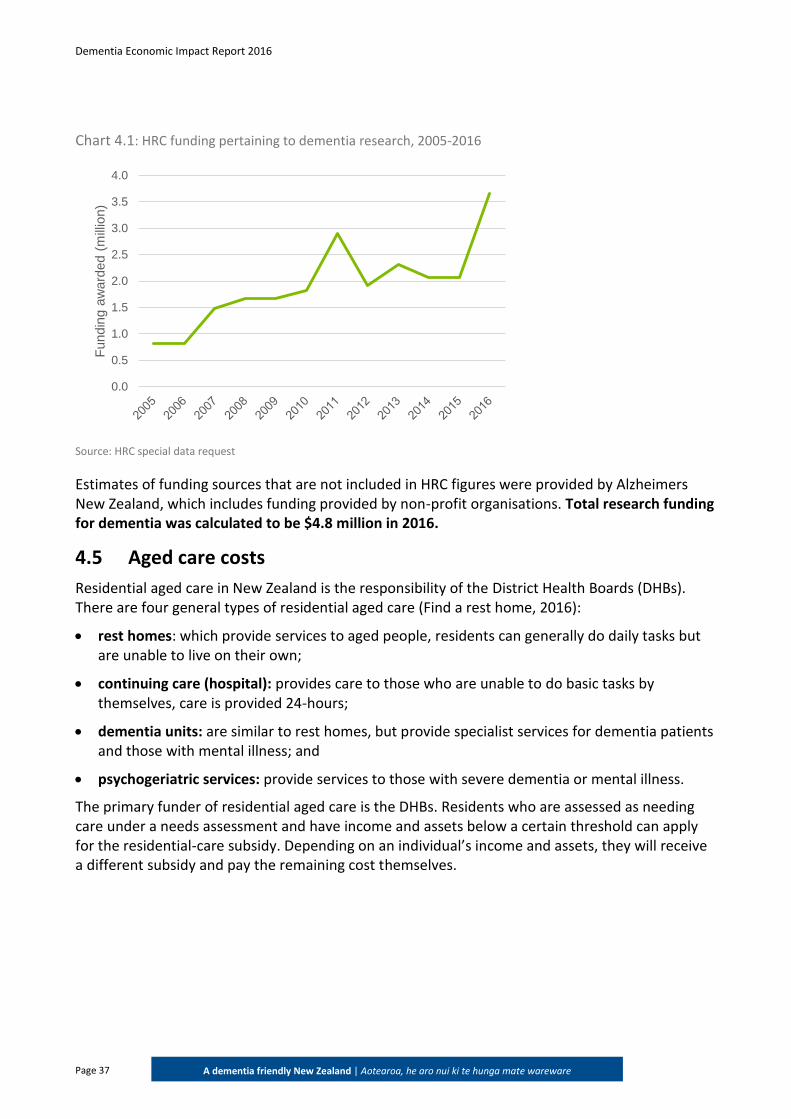
Research costs for 2016 are based on funding from the HRC of New Zealand and other private sources. To obtain an estimate for research costs, a special request was sent to the HRC. The data provided by the HRC included information on the total value of grants funded that were related to dementia research. These grants were divided by the length of the grant to give a per year figure. HRC research funding pertaining to dementia is shown in Chart 4.1.
Dementia Economic Impact Report 2016
Page 37
A dementia friendly New Zealand | Aotearoa, he aro nui ki te hunga mate wareware
Chart 4.1: HRC funding pertaining to dementia research, 2005-2016
Source: HRC special data request
Estimates of funding sources that are not included in HRC figures were provided by Alzheimers New Zealand, which includes funding provided by non-profit organisations. Total research funding for dementia was calculated to be $4.8 million in 2016.
4.5 Aged care costs
Residential aged care in New Zealand is the responsibility of the District Health Boards (DHBs). There are four general types of residential aged care (Find a rest home, 2016):
rest homes: which provide services to aged people, residents can generally do daily tasks but are unable to live on their own;
continuing care (hospital): provides care to those who are unable to do basic tasks by themselves, care is provided 24-hours;
dementia units: are similar to rest homes, but provide specialist services for dementia patients and those with mental illness; and
psychogeriatric services: provide services to those with severe dementia or mental illness.
The primary funder of residential aged care is the DHBs. Residents who are assessed as needing care under a needs assessment and have income and assets below a certain threshold can apply for the residential-care subsidy. Depending on an individual’s income and assets, they will receive a different subsidy and pay the remaining cost themselves.
0.0
0.5
1.0
1.5
2.0
2.5
3.0
3.5
4.0
Fu
nd
ing a
wa
rde
d (
mill
ion)
Dementia Economic Impact Report 2016
Page 38
A dementia friendly New Zealand | Aotearoa, he aro nui ki te hunga mate wareware
4.5.1 Data
The 2008 report used data from a data request sent to the Ministry of Health to estimate aged care costs. Aged care data was requested from the Ministry of Health, however none had been received at the time of writing this report. As a result, the 2008 methodology for estimating aged care expenditure was not used. The estimate of aged care costs has increased substantially since the 2008 report for a number of reasons aside from rising costs of care alone. This report uses revised information about the costs of aged care as well as the rate of institutionalisation. The 2008 reports notes that the estimate of residential care costs in New Zealand should be treated as a minimum.
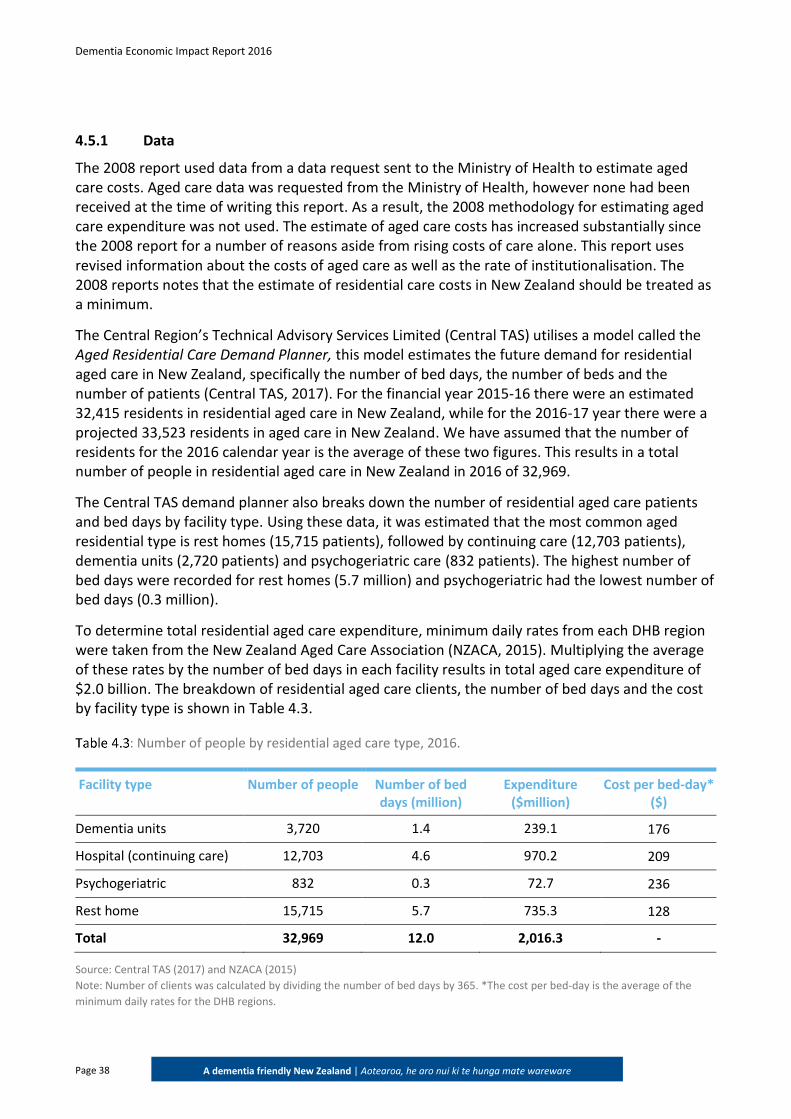
The Central Region’s Technical Advisory Services Limited (Central TAS) utilises a model called the Aged Residential Care Demand Planner, this model estimates the future demand for residential aged care in New Zealand, specifically the number of bed days, the number of beds and the number of patients (Central TAS, 2017). For the financial year 2015-16 there were an estimated 32,415 residents in residential aged care in New Zealand, while for the 2016-17 year there were a projected 33,523 residents in aged care in New Zealand. We have assumed that the number of residents for the 2016 calendar year is the average of these two figures. This results in a total number of people in residential aged care in New Zealand in 2016 of 32,969.
The Central TAS demand planner also breaks down the number of residential aged care patients and bed days by facility type. Using these data, it was estimated that the most common aged residential type is rest homes (15,715 patients), followed by continuing care (12,703 patients), dementia units (2,720 patients) and psychogeriatric care (832 patients). The highest number of bed days were recorded for rest homes (5.7 million) and psychogeriatric had the lowest number of bed days (0.3 million).
To determine total residential aged care expenditure, minimum daily rates from each DHB region were taken from the New Zealand Aged Care Association (NZACA, 2015). Multiplying the average of these rates by the number of bed days in each facility results in total aged care expenditure of $2.0 billion. The breakdown of residential aged care clients, the number of bed days and the cost by facility type is shown in Table 4.3.
: Number of people by residential aged care type, 2016.
Facility type Number of people Number of bed days (million)
Expenditure ($million)
Cost per bed-day* ($)
Dementia units 3,720 1.4 239.1 176
Hospital (continuing care) 12,703 4.6 970.2 209
Psychogeriatric 832 0.3 72.7 236
Rest home 15,715 5.7 735.3 128
Total 32,969 12.0 2,016.3 -
Source: Central TAS (2017) and NZACA (2015)
Note: Number of clients was calculated by dividing the number of bed days by 365. *The cost per bed-day is the average of the
minimum daily rates for the DHB regions.
Dementia Economic Impact Report 2016
Page 39
A dementia friendly New Zealand | Aotearoa, he aro nui ki te hunga mate wareware
Another publication by Dale (2015) estimated the costs of residential aged care in New Zealand in 2013 and provided estimates for costs in 2016-17, 2021-22 and 2031-32. Using different population growth rates, Dale (2015) provides estimates for residential aged care expenditure under low, medium and high population growth. The 2016-17 estimates are:
low population growth: $1.9 billion;
medium population growth: $2.0 billion; and
high population growth: $2.1 billion.
The residential aged care expenditure estimate derived using the NZACA (2015) and Central TAS (2017) data lies within the high and low ranges and is roughly the same as the medium estimate. This indicates that although the minimum daily rates for residential aged care were used in the calculation, the estimate is within the boundaries of estimates and is not overly overestimating or underestimating expenditure.
4.5.2 Aged care expenditure attributed to dementia
People with dementia are able to go to any of the four residential aged care facilities. One way to calculate the residential aged care expenditure attributed to dementia is to determine the proportion of people in residential aged care who have dementia and multiply total costs by this proportion.
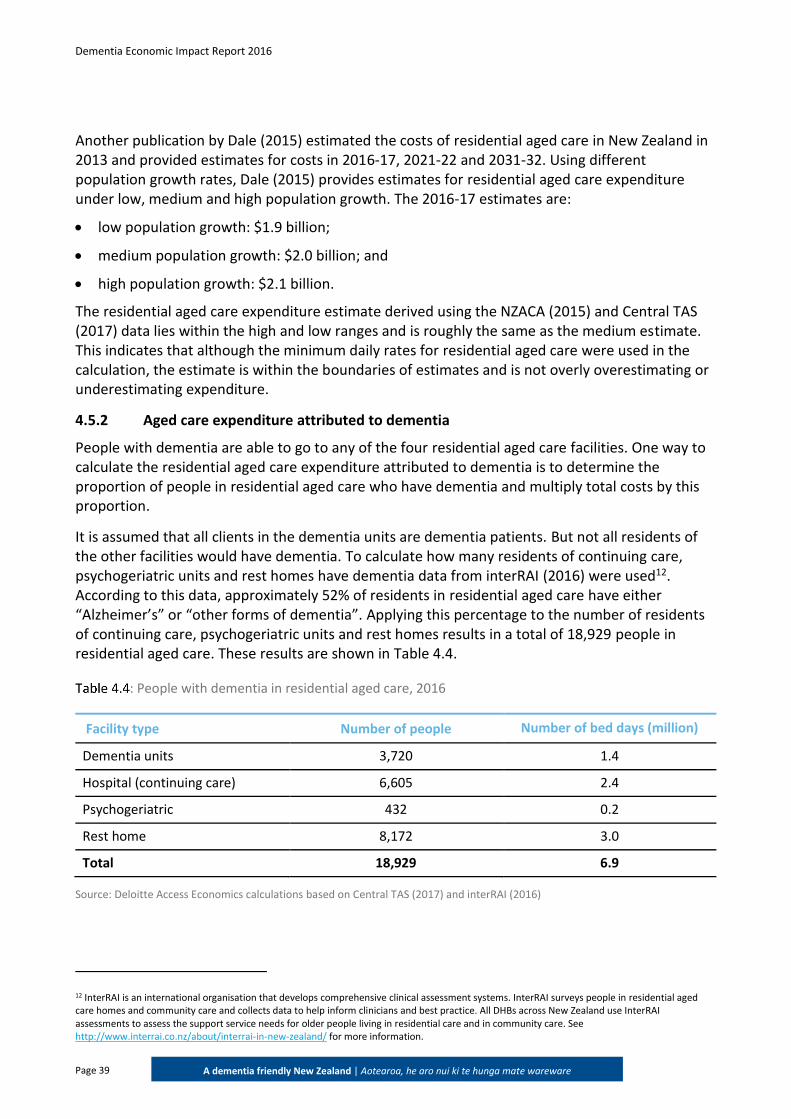
It is assumed that all clients in the dementia units are dementia patients. But not all residents of the other facilities would have dementia. To calculate how many residents of continuing care, psychogeriatric units and rest homes have dementia data from interRAI (2016) were used12. According to this data, approximately 52% of residents in residential aged care have either “Alzheimer’s” or “other forms of dementia”. Applying this percentage to the number of residents of continuing care, psychogeriatric units and rest homes results in a total of 18,929 people in residential aged care. These results are shown in Table 4.4.
: People with dementia in residential aged care, 2016
Facility type Number of people Number of bed days (million)
Dementia units 3,720 1.4
Hospital (continuing care) 6,605 2.4
Psychogeriatric 432 0.2
Rest home 8,172 3.0
Total 18,929 6.9
Source: Deloitte Access Economics calculations based on Central TAS (2017) and interRAI (2016)
12 InterRAI is an international organisation that develops comprehensive clinical assessment systems. InterRAI surveys people in residential aged care homes and community care and collects data to help inform clinicians and best practice. All DHBs across New Zealand use InterRAI assessments to assess the support service needs for older people living in residential care and in community care. See http://www.interrai.co.nz/about/interrai-in-new-zealand/ for more information.
Dementia Economic Impact Report 2016
Page 40
A dementia friendly New Zealand | Aotearoa, he aro nui ki te hunga mate wareware
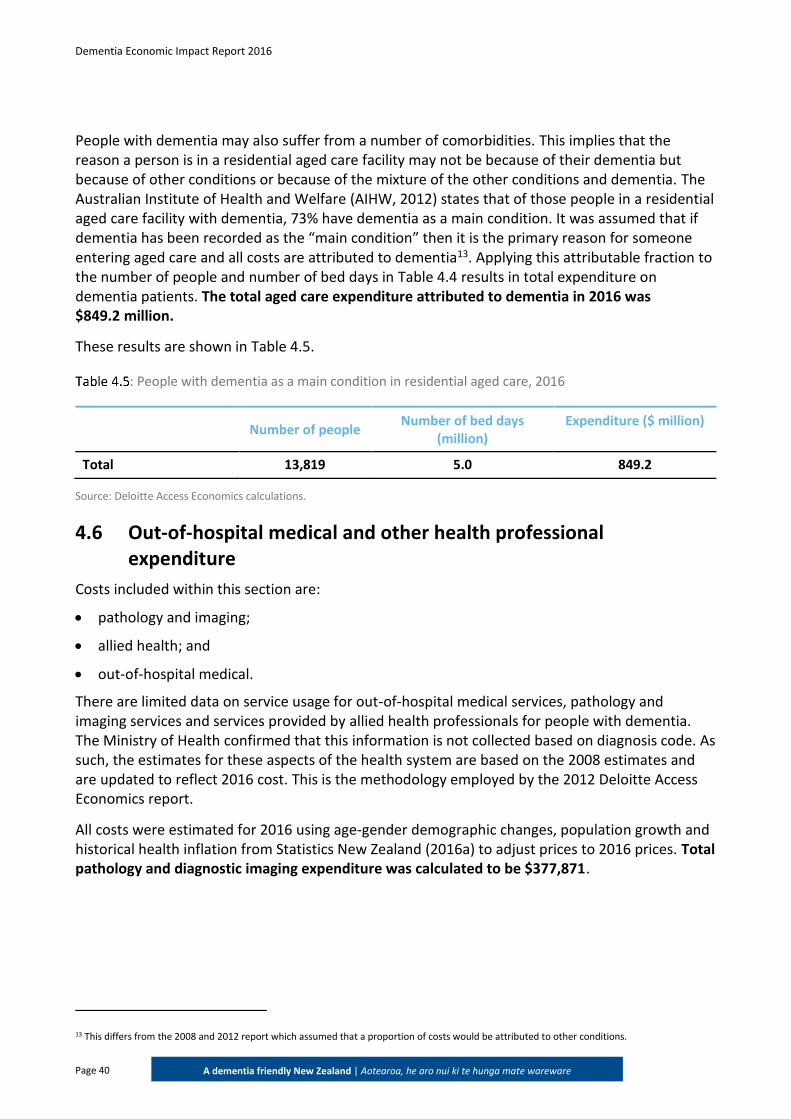
People with dementia may also suffer from a number of comorbidities. This implies that the reason a person is in a residential aged care facility may not be because of their dementia but because of other conditions or because of the mixture of the other conditions and dementia. The Australian Institute of Health and Welfare (AIHW, 2012) states that of those people in a residential aged care facility with dementia, 73% have dementia as a main condition. It was assumed that if dementia has been recorded as the “main condition” then it is the primary reason for someone entering aged care and all costs are attributed to dementia13. Applying this attributable fraction to the number of people and number of bed days in Table 4.4 results in total expenditure on dementia patients. The total aged care expenditure attributed to dementia in 2016 was $849.2 million.
These results are shown in Table 4.5.
: People with dementia as a main condition in residential aged care, 2016
Number of people Number of bed days
(million) Expenditure ($ million)
Total 13,819 5.0 849.2
Source: Deloitte Access Economics calculations.
4.6 Out-of-hospital medical and other health professional expenditure
Costs included within this section are:
pathology and imaging;
allied health; and
out-of-hospital medical.
There are limited data on service usage for out-of-hospital medical services, pathology and imaging services and services provided by allied health professionals for people with dementia. The Ministry of Health confirmed that this information is not collected based on diagnosis code. As such, the estimates for these aspects of the health system are based on the 2008 estimates and are updated to reflect 2016 cost. This is the methodology employed by the 2012 Deloitte Access Economics report.
All costs were estimated for 2016 using age-gender demographic changes, population growth and historical health inflation from Statistics New Zealand (2016a) to adjust prices to 2016 prices. Total pathology and diagnostic imaging expenditure was calculated to be $377,871.
13 This differs from the 2008 and 2012 report which assumed that a proportion of costs would be attributed to other conditions.
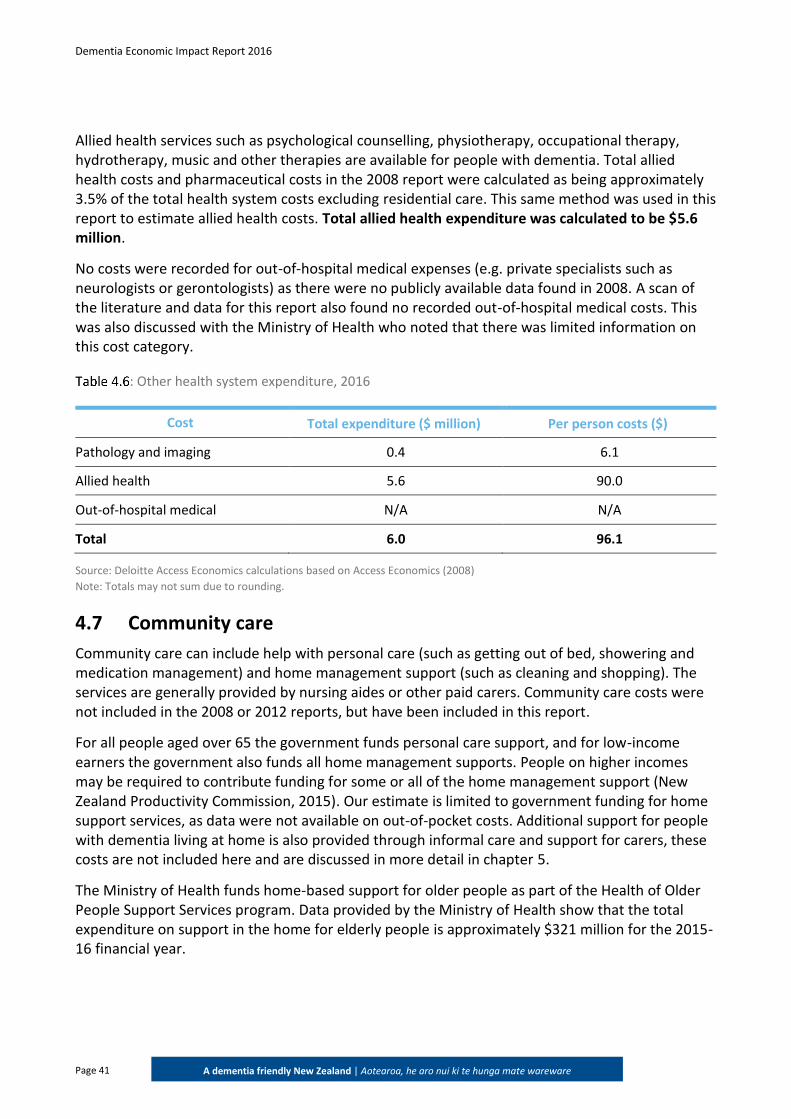
Dementia Economic Impact Report 2016
Page 41
A dementia friendly New Zealand | Aotearoa, he aro nui ki te hunga mate wareware
Allied health services such as psychological counselling, physiotherapy, occupational therapy, hydrotherapy, music and other therapies are available for people with dementia. Total allied health costs and pharmaceutical costs in the 2008 report were calculated as being approximately 3.5% of the total health system costs excluding residential care. This same method was used in this report to estimate allied health costs. Total allied health expenditure was calculated to be $5.6 million.
No costs were recorded for out-of-hospital medical expenses (e.g. private specialists such as neurologists or gerontologists) as there were no publicly available data found in 2008. A scan of the literature and data for this report also found no recorded out-of-hospital medical costs. This was also discussed with the Ministry of Health who noted that there was limited information on this cost category.
: Other health system expenditure, 2016
Cost Total expenditure ($ million) Per person costs ($)
Pathology and imaging 0.4 6.1
Allied health 5.6 90.0
Out-of-hospital medical N/A N/A
Total 6.0 96.1
Source: Deloitte Access Economics calculations based on Access Economics (2008)
Note: Totals may not sum due to rounding.
4.7 Community care
Community care can include help with personal care (such as getting out of bed, showering and medication management) and home management support (such as cleaning and shopping). The services are generally provided by nursing aides or other paid carers. Community care costs were not included in the 2008 or 2012 reports, but have been included in this report.
For all people aged over 65 the government funds personal care support, and for low-income earners the government also funds all home management supports. People on higher incomes may be required to contribute funding for some or all of the home management support (New Zealand Productivity Commission, 2015). Our estimate is limited to government funding for home support services, as data were not available on out-of-pocket costs. Additional support for people with dementia living at home is also provided through informal care and support for carers, these costs are not included here and are discussed in more detail in chapter 5.
The Ministry of Health funds home-based support for older people as part of the Health of Older People Support Services program. Data provided by the Ministry of Health show that the total expenditure on support in the home for elderly people is approximately $321 million for the 2015-16 financial year.
Dementia Economic Impact Report 2016
Page 42
A dementia friendly New Zealand | Aotearoa, he aro nui ki te hunga mate wareware
To determine the proportion of this community care expenditure attributed to dementia, we have used a similar approach as used for residential aged care expenditure. The approach was to calculate the proportion of people accessing community care services who have dementia and then multiply total government costs by this proportion.
Data from interRAI (2016) were used to determine the proportion of people who were assessed as eligible for home care services who have dementia. According to this data, approximately 26% of residents assessed for home care services have either “Alzheimer’s” or “other forms of dementia”.
As discussed in section 4.5, the reason a person is receiving home-based support may not be entirely because of their dementia but also because of other conditions or a mixture of the other conditions and dementia. The AIHW (2012) states that, of those people assessed for aged care support (including home care) who had dementia, 73% have dementia as a main condition. Following the same approach as the aged care estimate, it was assumed that if dementia has been recorded as the “main condition” then it is the primary reason for someone accessing home support services and all costs are attributed to dementia. Applying this attributable fraction to the proportion of people with dementia and then to the total government costs for home support services results in total expenditure on dementia patients of $60.9 million.
In addition to this government component, non-profit organisations provide services to those with dementia. According to Alzheimers New Zealand, their total costs in 2016 were approximately $6.3 million. This figure includes funding provided by Alzheimers New Zealand regional members.
The total community care expenditure attributed to dementia in 2016 was $67.3 million.
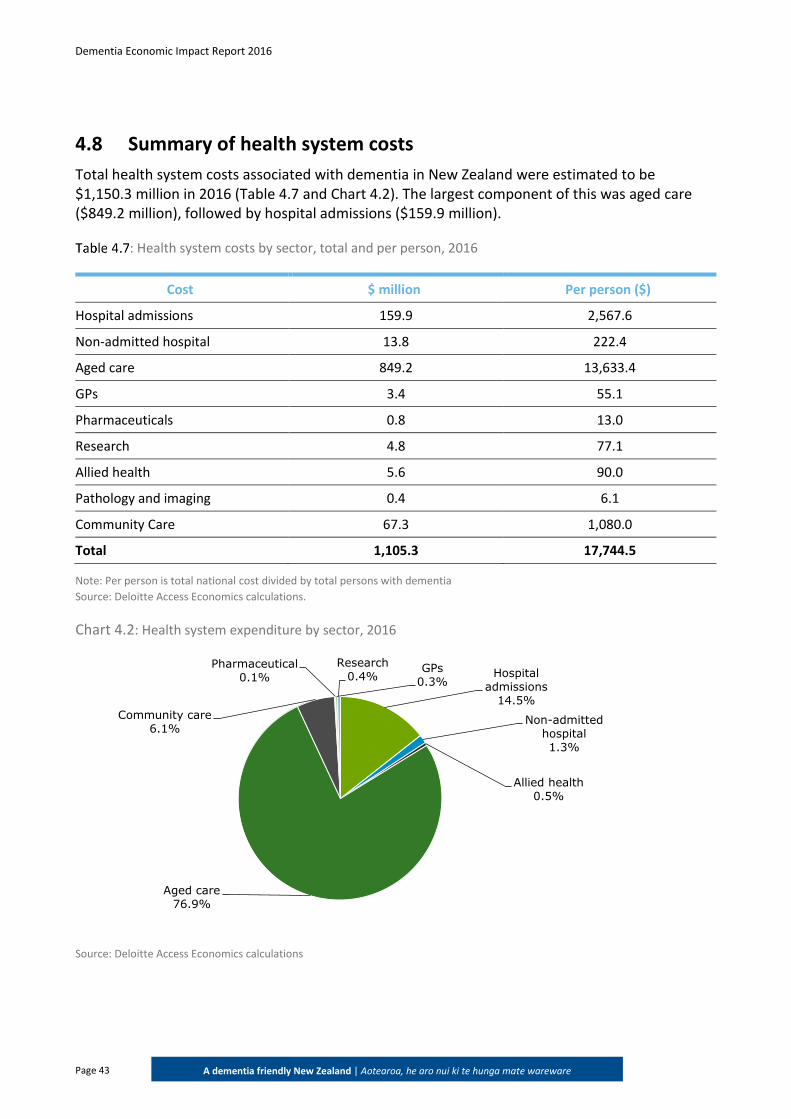
Dementia Economic Impact Report 2016
Page 43
A dementia friendly New Zealand | Aotearoa, he aro nui ki te hunga mate wareware
4.8 Summary of health system costs
Total health system costs associated with dementia in New Zealand were estimated to be $1,150.3 million in 2016 (Table 4.7 and Chart 4.2). The largest component of this was aged care ($849.2 million), followed by hospital admissions ($159.9 million).
: Health system costs by sector, total and per person, 2016
Cost $ million Per person ($)
Hospital admissions 159.9 2,567.6
Non-admitted hospital 13.8 222.4
Aged care 849.2 13,633.4
GPs 3.4 55.1
Pharmaceuticals 0.8 13.0
Research 4.8 77.1
Allied health 5.6 90.0
Pathology and imaging 0.4 6.1
Community Care 67.3 1,080.0
Total 1,105.3 17,744.5
Note: Per person is total national cost divided by total persons with dementia
Source: Deloitte Access Economics calculations.
Chart 4.2: Health system expenditure by sector, 2016
Source: Deloitte Access Economics calculations
Hospital admissions
14.5%
Non-admitted hospital1.3%
Allied health0.5%
Aged care76.9%
Community care6.1%
Pharmaceutical0.1%
GPs0.3%
Research0.4%
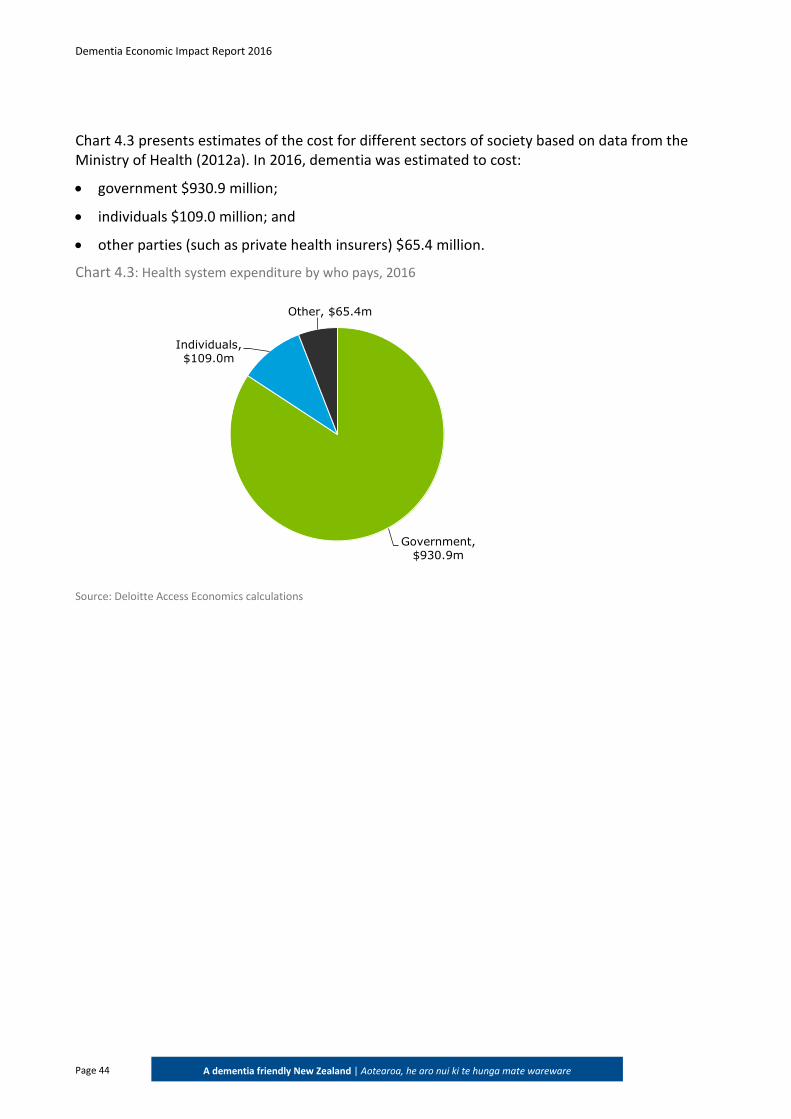
Dementia Economic Impact Report 2016
Page 44
A dementia friendly New Zealand | Aotearoa, he aro nui ki te hunga mate wareware
Chart 4.3 presents estimates of the cost for different sectors of society based on data from the Ministry of Health (2012a). In 2016, dementia was estimated to cost:
government $930.9 million;
individuals $109.0 million; and
other parties (such as private health insurers) $65.4 million.
Chart 4.3: Health system expenditure by who pays, 2016
Source: Deloitte Access Economics calculations
Government, $930.9m
Individuals, $109.0m
Other, $65.4m
Dementia Economic Impact Report 2016
Page 45
A dementia friendly New Zealand | Aotearoa, he aro nui ki te hunga mate wareware
5 Other economic costs
This chapter estimates the other economic costs of dementia in New Zealand, that is those costs that are not direct health system costs (Chapter 4) nor intangible costs – the loss of health and wellbeing (Chapter 6). Other economic costs include lost productivity for people with dementia and for people who care for people with dementia, and transfer payments.
5.1 Productivity losses
Although dementia tends to affect older people, for younger people with dementia or those who choose to stay in the workforce at older ages, dementia can affect their capacity to work. They may work less than they otherwise would, retire early or die prematurely. If employment rates are lower for people with dementia, this loss in productivity represents a real cost to the economy.
This section analyses the lower employment, absenteeism and premature mortality costs for people with dementia. There is also productivity cost associated with carers of people with dementia, however this is estimated as part of the informal care costs set out in Section 5.2.
This section provides an analysis of the productivity costs associated with dementia. We adopt a human capital approach to the estimation of productivity losses.14 This involves the calculation of the difference in employment between people with dementia and that of the general population, multiplied by average weekly earnings (AWE). Similarly, costs incurred through absenteeism are derived by multiplying the average number of weeks, as converted from the number of days and hours respectively lost, by AWE. Any productivity losses from premature retirement are estimated in terms of the net present value of the future income streams lost. The analysis of productivity costs uses the same methodology as the Access Economics (2008) and the Deloitte Access Economics (2012) reports (subsequently referred to as the 2008 report and 2012 report). Thus, the increase cost of productivity losses is driven by the increased prevalence of dementia and inflation.
14 The alternative is a friction approach, which would not be appropriate in a country such as New Zealand that has relatively low rates of unemployment and underemployment, in line with non-accelerating inflation rates of unemployment.
Key findings: The productivity loss for individuals with dementia was $241.0 million in 2016, or $3,870
per person with dementia. In 2008, the productivity costs attributed to people with dementia were $132.5 million,
while in 2011 they were $167.6 million. Compared to 2016, estimates of productivity losses attributed to people with dementia have increased by over 80% increase since 2008 and by over 40% since 2011.
Productivity losses due to informal care were $68.6 million in 2016
In 2008, the informal care costs were $29.3 million, while in 2011 they were $37.2 million. Compared to 2016 estimates, informal care costs have increased by over 130% since 2008 and by over 80% since 2012
Dementia Economic Impact Report 2016
Page 46
A dementia friendly New Zealand | Aotearoa, he aro nui ki te hunga mate wareware
5.1.1 Lower employment
Given the age distribution of dementia, it is probable that most people have left the workforce prior to disease onset. However, for a significant number of younger onset cases, as well as those choosing to work till later in life, there is a productivity loss15. Lower employment is measured by estimating the age standardised difference in employment rates between people with dementia and those without.
While it would be preferable to calculate these costs based on New Zealand data, these were not available. As such, the difference in employment rates for people with dementia compared to those without was based on the employment impact estimated in Australia (Access Economics, 2003). In the absence of available data, and given the similarity of the two countries’ employment patterns and culture, and the fact that the functional impact of dementia is likely to be similar in any country, this was considered appropriate.
Access Economics (2003) found that, for people aged 65 years and over, those with dementia were employed at 27.1% of the employment rate of the general population16. In the absence of comparable data for younger cohorts, the same relativity was applied to those under 65 years of age.
For modelling purposes, the employment rates for those with dementia were standardised by five-year age cohorts and by gender, based on employment data for the general population. The data were not able to be controlled for other factors that might also contribute to lower overall age and gender standardised employment rates (for example, socioeconomic status).
Compared to the employment rates of the general population (Statistics New Zealand, 2015d), it was estimated that 4,260 people with dementia were not employed in 2016 because of their condition. This figure was calculated by multiplying the number of people with dementia in each age and gender group by the employment rates in the general population for each of those groups.
The number of people that were not employed due to dementia was multiplied by the average weekly wage (Statistics New Zealand, 2015b) to estimate the productivity cost associated with lower employment for those with dementia. Estimates of AWE were based on New Zealand wages data for those employed in the general population (Statistics New Zealand, 2015d). AWE data were only available up to 2015 and estimates for 2016 were thus based on historical growth trends.
The total economic cost associated with reduced employment was estimated to be $207.4 million – or $3,330 per person with dementia in 2016.
15 Younger people with dementia (of working age) need to retire early from work. 16 Access Economics (2003) showed that only 2.3% of those aged over 65 who have dementia are employed, compared to 8.5% of the population as a whole.
Dementia Economic Impact Report 2016
Page 47
A dementia friendly New Zealand | Aotearoa, he aro nui ki te hunga mate wareware
5.1.2 Absenteeism
Some people will remain in the workforce in the early stages of dementia, either because they are not yet diagnosed or because they need or want to continue to work. Remaining in employment for a time is more likely if the illness is in the early stages, if the work environment is supportive, if tasks are familiar or repetitive, and if supervision and occupational health and safety arrangements are adequate. These people may, however, be absent from work more often than those without dementia as a result of the condition – because they need to take time off for medical appointments, to organise their affairs, or because of their symptoms. This absenteeism represents a further productivity loss.
As with employment participation, there is a lack of New Zealand data on the number of days absent from work due to dementia. Thus, these New Zealand calculations were based on Access Economics (2003) estimates from Australian data that dementia results in 5% of work time (or 12 work days) lost per annum, over and above the absenteeism of people without dementia17.
Applying the number of sick days to those with dementia who were employed, it was estimated that there were approximately 19,002 additional sick days in 2016 due to dementia. Applying this to the New Zealand general population employment rates and average weekly earnings by age and gender (Statistics New Zealand, 2015b; Statistics New Zealand, 2015d), the total cost associated with absenteeism was estimated to be $17.4 million – or $279 per person with dementia in 2016.
5.1.3 Premature mortality
There are also production losses arising from premature mortality associated with dementia. The income forgone for those who die prematurely was estimated based on the assumption that if those who died had lived and not had dementia, they would have been employed at the same rate as the general population. This represents a further productivity loss, measured as the net present value of future lost income streams for those people who die from dementia prior to when they would otherwise have retired.
To derive lifetime earnings, the annual income (based on AWE from Statistics New Zealand, 2015b) was multiplied by the average employment rate at each age group while alive (Statistics New Zealand, 2015d). Income earned at each age was then summed to calculate the expected total income over a person’s lifetime, and this is discounted back to present values.
Premature deaths due to dementia impose a substantial cost in New Zealand. Lost lifetime earnings were estimated to be $16.2 million in 2016.
Premature retirement and premature mortality results in increased employee turnover costs, such as search, hiring and training costs. These costs are estimated to be equal to 26 weeks salary of the incumbent worker (Access Economics, 2004). However, this cost is merely ‘brought forward’ a number of years because there would be some normal turnover of people with dementia in the absence of their condition – approximately 15% per annum (which implies that people change
17 The estimate of 5% of work time lost was conservatively based on 8% lost for people with psychotic illnesses with similar cognitive and functional impairments.
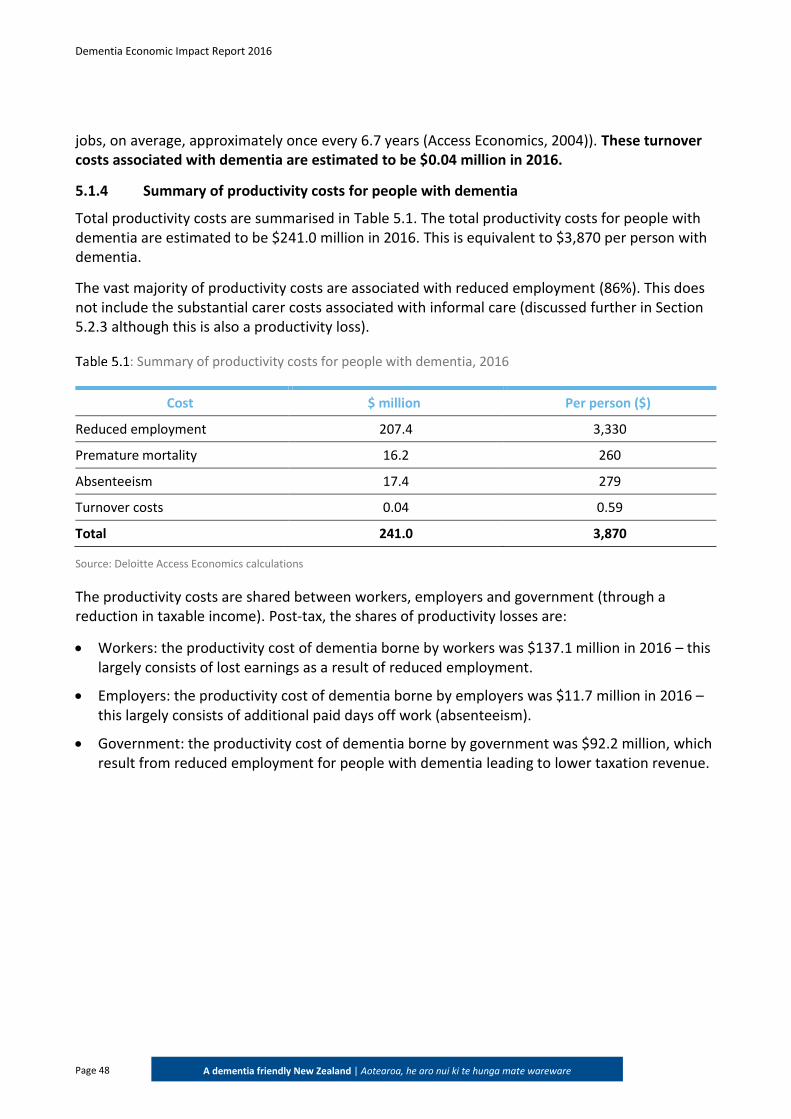
Dementia Economic Impact Report 2016
Page 48
A dementia friendly New Zealand | Aotearoa, he aro nui ki te hunga mate wareware
jobs, on average, approximately once every 6.7 years (Access Economics, 2004)). These turnover costs associated with dementia are estimated to be $0.04 million in 2016.
5.1.4 Summary of productivity costs for people with dementia
Total productivity costs are summarised in Table 5.1. The total productivity costs for people with dementia are estimated to be $241.0 million in 2016. This is equivalent to $3,870 per person with dementia.
The vast majority of productivity costs are associated with reduced employment (86%). This does not include the substantial carer costs associated with informal care (discussed further in Section 5.2.3 although this is also a productivity loss).
: Summary of productivity costs for people with dementia, 2016
Cost $ million Per person ($)
Reduced employment 207.4 3,330
Premature mortality 16.2 260
Absenteeism 17.4 279
Turnover costs 0.04 0.59
Total 241.0 3,870
Source: Deloitte Access Economics calculations
The productivity costs are shared between workers, employers and government (through a reduction in taxable income). Post-tax, the shares of productivity losses are:
Workers: the productivity cost of dementia borne by workers was $137.1 million in 2016 – this largely consists of lost earnings as a result of reduced employment.
Employers: the productivity cost of dementia borne by employers was $11.7 million in 2016 – this largely consists of additional paid days off work (absenteeism).
Government: the productivity cost of dementia borne by government was $92.2 million, which result from reduced employment for people with dementia leading to lower taxation revenue.
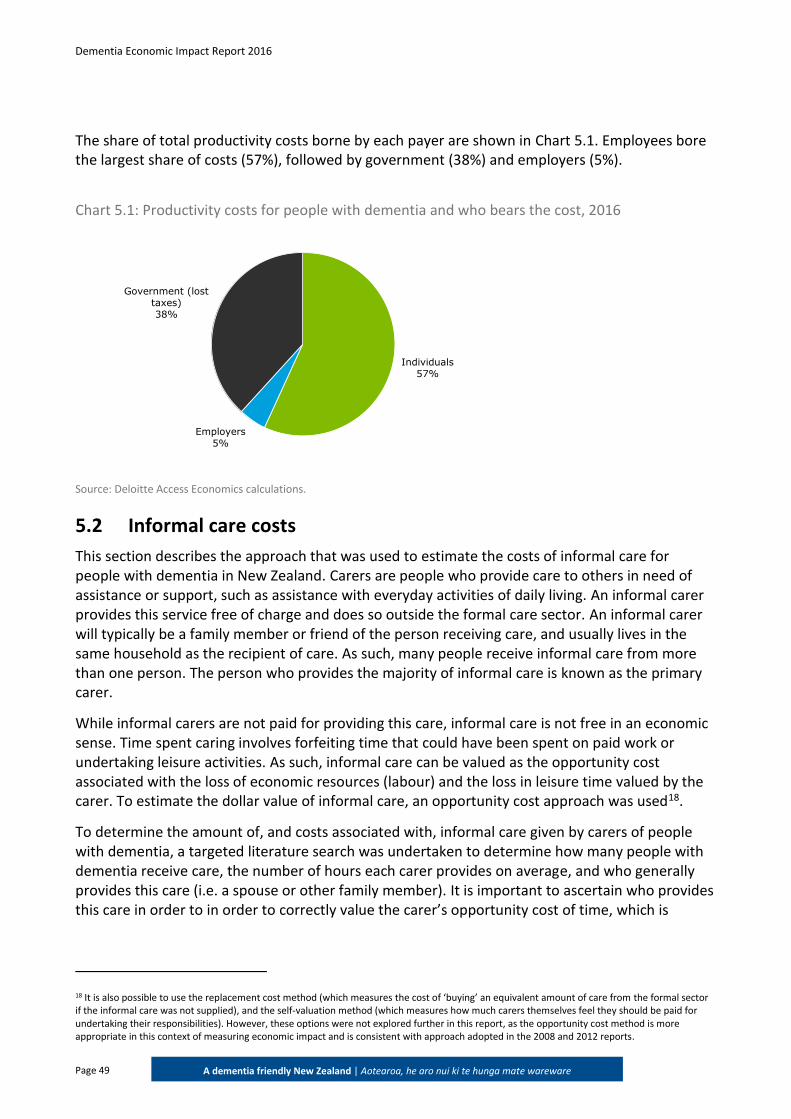
Dementia Economic Impact Report 2016
Page 49
A dementia friendly New Zealand | Aotearoa, he aro nui ki te hunga mate wareware
The share of total productivity costs borne by each payer are shown in Chart 5.1. Employees bore the largest share of costs (57%), followed by government (38%) and employers (5%).
Chart 5.1: Productivity costs for people with dementia and who bears the cost, 2016
Source: Deloitte Access Economics calculations.
5.2 Informal care costs
This section describes the approach that was used to estimate the costs of informal care for people with dementia in New Zealand. Carers are people who provide care to others in need of assistance or support, such as assistance with everyday activities of daily living. An informal carer provides this service free of charge and does so outside the formal care sector. An informal carer will typically be a family member or friend of the person receiving care, and usually lives in the same household as the recipient of care. As such, many people receive informal care from more than one person. The person who provides the majority of informal care is known as the primary carer.
While informal carers are not paid for providing this care, informal care is not free in an economic sense. Time spent caring involves forfeiting time that could have been spent on paid work or undertaking leisure activities. As such, informal care can be valued as the opportunity cost associated with the loss of economic resources (labour) and the loss in leisure time valued by the carer. To estimate the dollar value of informal care, an opportunity cost approach was used18.
To determine the amount of, and costs associated with, informal care given by carers of people with dementia, a targeted literature search was undertaken to determine how many people with dementia receive care, the number of hours each carer provides on average, and who generally provides this care (i.e. a spouse or other family member). It is important to ascertain who provides this care in order to in order to correctly value the carer’s opportunity cost of time, which is
18 It is also possible to use the replacement cost method (which measures the cost of ‘buying’ an equivalent amount of care from the formal sector if the informal care was not supplied), and the self-valuation method (which measures how much carers themselves feel they should be paid for undertaking their responsibilities). However, these options were not explored further in this report, as the opportunity cost method is more appropriate in this context of measuring economic impact and is consistent with approach adopted in the 2008 and 2012 reports.
Individuals57%
Employers5%
Government (lost taxes)38%
Dementia Economic Impact Report 2016
Page 50
A dementia friendly New Zealand | Aotearoa, he aro nui ki te hunga mate wareware
calculated based on AWE for each age and gender group of carers (Statistics New Zealand, 2015b), and the chance of being employed (Access Economics, 2003).
5.2.1 Recipients of care
As calculated in Section 4.5.2 above, the estimated number of people with dementia in residential aged care in New Zealand in 2016 was 18,929.
People with dementia can either be cared for at home (in the community) or in residential care. Therefore, the remaining proportion of the prevalence is expected to be the number of people with dementia living in the community. Accordingly, of the 62,287 people with dementia in New Zealand, 43,358 people with dementia are living in the community.
In its 2012 report on Dementia in Australia, the Australian Institute of Health and Welfare (AIHW, 2012) found that, of the people with dementia living in the community, 92% were identified as receiving informal care from one or more carers.
If 92% of people with dementia living in the New Zealand community similarly receive care, this equates to 39,889 people with dementia living in the New Zealand community receiving informal care. Assuming, conservatively, that each person with dementia living in the community requires one carer, there are 39,889 carers for people with dementia.
5.2.2 Hours of informal care provided
The Dementia Worldwide Cost Database (DWCD) provides worldwide estimates of the costs for informal care. The basic cost model in the DWCD uses two options for calculating the number of hours of informal care provided to people with dementia: 1.6 hours per day (basic activities of daily living (ADLs)), and 3.7 hours per day (basic ADLs and instrumental ADLs) (Wimo et al, 2010). Informal care can also include supervision, and taken together with basic and instrumental ADLs assistance, which is calculated as 7.4 hours of care per day (Alzheimer Europe, 2009).
A number of international studies have attempted to quantify the number of hours of informal care provided to people with dementia. In a Danish study of 469 informal caregivers, Jakobsen et al (2011) found that time spent on informal care, including supervision, was estimated to be on average 5.85 hours on a typical day for the primary caregiver. In a French study of 513 people with dementia, it was found that, on average, people with dementia received 44 hours of informal care each week (Paraponaris et al, 2015). A worldwide study by Costa et al (2015) found that average informal care time was 55.73 hours per week (7.96 hours per day). The AIHW (2012) found that 81% of dementia carers provide more than 40 hours of care each week.
Taken together, these findings suggest that the number of hours of informal care provided to people with dementia is significant. Using the base case of informal care described by the DWCD, it was estimated that for mild dementia, basic ADL (1.6 hours per day) care is provided, for moderate dementia, basic and instrumental ADL is provided (3.7 hours per day) and for severe dementia, basic and instrumental ADL as well as supervision (7.4 hours per day). An average of these figures, weighted by share of 2016 New Zealand prevalence, provided an average estimate of 21.7 informal care hours per week provided to people with dementia.
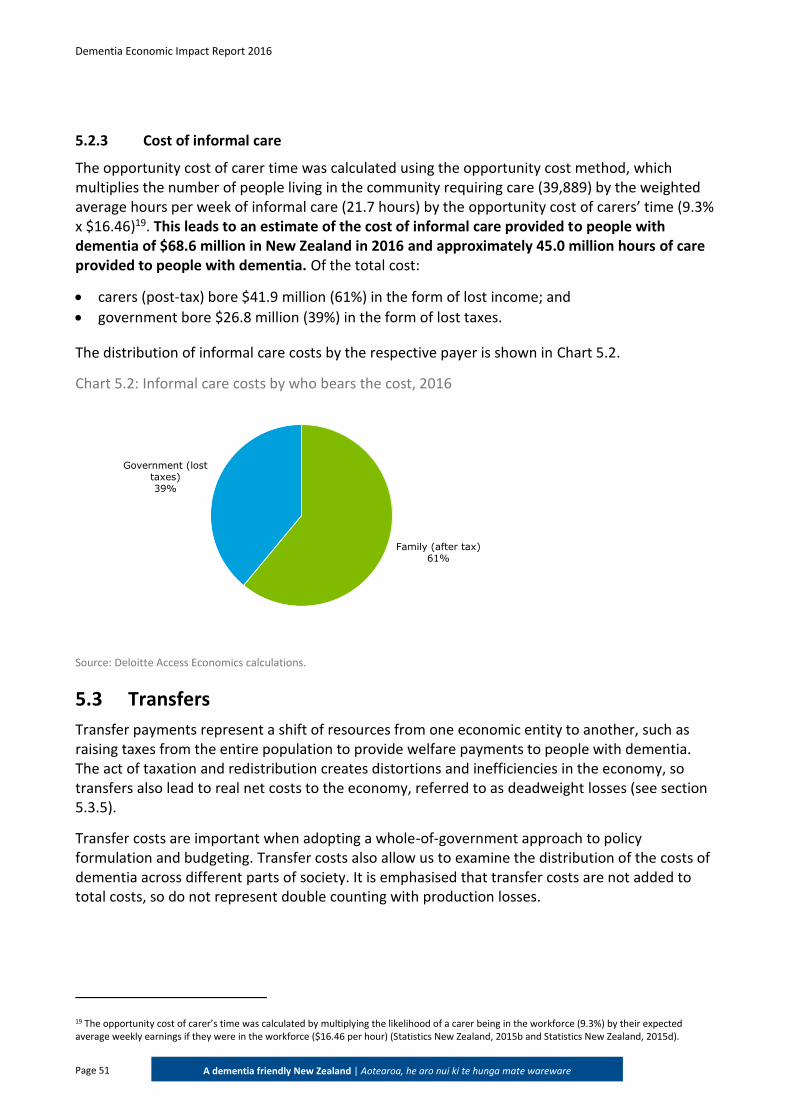
Dementia Economic Impact Report 2016
Page 51
A dementia friendly New Zealand | Aotearoa, he aro nui ki te hunga mate wareware
5.2.3 Cost of informal care
The opportunity cost of carer time was calculated using the opportunity cost method, which multiplies the number of people living in the community requiring care (39,889) by the weighted average hours per week of informal care (21.7 hours) by the opportunity cost of carers’ time (9.3% x $16.46)19. This leads to an estimate of the cost of informal care provided to people with dementia of $68.6 million in New Zealand in 2016 and approximately 45.0 million hours of care provided to people with dementia. Of the total cost:
carers (post-tax) bore $41.9 million (61%) in the form of lost income; and
government bore $26.8 million (39%) in the form of lost taxes.
The distribution of informal care costs by the respective payer is shown in Chart 5.2.
Chart 5.2: Informal care costs by who bears the cost, 2016
Source: Deloitte Access Economics calculations.
5.3 Transfers
Transfer payments represent a shift of resources from one economic entity to another, such as raising taxes from the entire population to provide welfare payments to people with dementia. The act of taxation and redistribution creates distortions and inefficiencies in the economy, so transfers also lead to real net costs to the economy, referred to as deadweight losses (see section 5.3.5).
Transfer costs are important when adopting a whole-of-government approach to policy formulation and budgeting. Transfer costs also allow us to examine the distribution of the costs of dementia across different parts of society. It is emphasised that transfer costs are not added to total costs, so do not represent double counting with production losses.
19 The opportunity cost of carer’s time was calculated by multiplying the likelihood of a carer being in the workforce (9.3%) by their expected average weekly earnings if they were in the workforce ($16.46 per hour) (Statistics New Zealand, 2015b and Statistics New Zealand, 2015d).
Family (after tax)61%
Government (lost taxes)39%
Dementia Economic Impact Report 2016
Page 52
A dementia friendly New Zealand | Aotearoa, he aro nui ki te hunga mate wareware
5.3.1 Income support for people with dementia
The main source of income support for people with dementia in New Zealand aged less than 65 years comes from the Supported Living Payment (SLP). The SLP is an income support payment for people who are unable to work due to their condition or another reason. SLP is also a payment for people who have, or are caring for someone with a health condition, injury or disability (Ministry of Social Development, 2017a).
It was estimated that in 2016 there were approximately 3,120 people under 65 years of age who are not working due to dementia, this was calculated in section 5.1.1. This number represents the maximum number of people who would be eligible to receive an SLP payment due to having dementia.
To determine the total SLP payments made to people with dementia, the number of people receiving the SLP payment was multiplied by the average yearly payment per person. Average per person yearly payments were calculated as total expenditure for SLP, divided by the total number of people receiving the payment. The data were collected from the Ministry of Social Development (2017a; 2016).
Taking the average number of people receiving payments in any one quarter, there were approximately 93,727 people receiving SLP during 2015-16. Total expenditure was $1.5 billion for SLP during this period. Multiplying the average annual payment by the number of people with dementia receiving the SLP payment, it was estimated that approximately $50.7 million was paid in SLP payment to people with dementia in 2016.
The 2008 report and the 2012 report also included an estimate of the superannuation payment (New Zealand Super) paid to people over the age of 65 who would otherwise have continued working, if they did not have dementia. This was based on the understanding that New Zealand Super payments were means tested. It has subsequently been clarified that New Zealand Super payments are not means tested and are available to all eligible New Zealand residents, regardless of their work status. Thus, as everyone over 65 receives superannuation, whether or not they have dementia, and this is not means tested, we have not included New Zealand Super payments in this report as an additional cost due to dementia.
5.3.2 Respite and carer support
Respite aims to provide a full-time carer, defined as someone who provides more than 4 hours a day of unpaid care, with a break from their caring role (Ministry of Social Development, 2016). Options that may be available are:
facility-based respite: a 24-hour overnight break in a facility for the person receiving support.
the Carer Support Subsidy: reimburses some of the costs of supporting the person receiving care (Ministry of Social Development, 2016).
A carer break can be for a short period (half a day or longer, including overnight) or for several weeks, depending on the circumstances of the carer and/or the person being cared for.
For consistency with previous reports and due to the lack of readily available data, we have not included the carer support subsidy in this analysis. Further, this payment is not available for carers of spouses in New Zealand, and therefore the cost is likely to be minimal.
Dementia Economic Impact Report 2016
Page 53
A dementia friendly New Zealand | Aotearoa, he aro nui ki te hunga mate wareware
In New Zealand, carers have available to them four weeks of respite care per annum. In previous reports it was assumed that all carers take the four weeks of respite care. Recent data has indicated that not all informal carers will use the respite support that is available to them and the methodology has been updated to reflect this.
According to the AIHW (2012), only 39% of carers of people with dementia access respite care. Assuming this access rate in New Zealand, then the community respite and carer support cost related to dementia is calculated as: 39,899 carers of people with dementia who live at home* 39% accessing respite care * 21.7 hours per week * 4 weeks a year *16.2420 (Infometrics, 2014). This equates to $21.9 million to provide respite care in 2016, which is borne by the government. This is lower than the previous 2008 and 2011 figures, due to the change in assumption that not all carers will access respite care.
5.3.3 Travel costs, aids and home modifications
Travel costs
The Total Mobility Scheme provides subsidised licensed taxi services to people who have an impairment that prevents them from undertaking an unaccompanied journey on a bus, train or ferry in a safe and dignified manner. The scheme provides eligible clients up to 50% discount on taxi fares for transport (Ministry of Transport, 2017).
The scheme is funded jointly by Land Transport New Zealand and local or regional councils. The costs were estimated based on information from the 2008 report. Using details of the scheme based on operations in Northland, the average subsidised fare is $6.80, inflated from the 2008 report using CPI (Statistics New Zealand, 2016a), and the average number of trips was around two per month. To estimate travel costs the average fare was multiplied by the number of trips and the number of people with dementia in the community. This equates to a cost of $6.5 million in 2016 across the population of people living at home with dementia.
Aids and modifications
People with dementia may require aids and/or housing modifications in order to continue living at home. Data on aids and modifications were not readily available. The Ministry of Health noted that they did not have information for aids and modifications that could be attributed by diagnosis code and therefore could not provide an estimate of expenditure on aids and modifications attributed to dementia.
The 2008 report noted two programs that were delivered by the Ministry of Health which provided aids and modifications assistance to those with disabilities. The Housing Modification Program delivered by the Ministry of Health provides financial assistance to those with a disability for purchases of aids or modifications for their house to make their house more accessible. The second program mentioned by the 2008 report was the Equipment and Modification program; however, this program did not exist in 2016. Instead, the Ministry of Health offers loaned equipment to those with a disability (Ministry of Health, 2016e).
20 In this case the replacement cost has been used to estimate the value of respite and carer support. The replacement cost method is a more accurate reflection of the cost of providing that service, rather than the opportunity cost method for the informal care, which takes into account other considerations such as the change of employment which is not relevant to this calculation.
Dementia Economic Impact Report 2016
Page 54
A dementia friendly New Zealand | Aotearoa, he aro nui ki te hunga mate wareware
Due to a lack of data availability, it was assumed that the Ministry of Health provides a similar level of assistance to those with dementia in 2016 as it did in 2008, but the cost would be higher due to price increases and additional demand. The 2008 per person cost was inflated using CPI and prevalence growth (Statistics New Zealand, 2016a). The aids and modifications expenditure in 2016 was thus estimated to be $5.5 million.
5.3.4 Taxation revenue forgone
People with dementia and their carers in paid employment, who have left the workforce temporarily due to caring responsibilities, or permanently due to premature retirement, will contribute less tax revenue to the government. As presented in the relevant sections throughout this report:
people with dementia missed out on $224.7 million in pre-tax wage income due to reduced productivity, unpaid absenteeism and reduced employment;
carers lost $68.6 million in pre-tax wage income due to caring for a person with dementia; and
employers lost $16.3 million in pre-tax production but no reduction in costs on account of paid absenteeism resulting from dementia.
Consistent with Deloitte Access Economics’ standard methodology, in terms of allocating these losses to either personal income or company income, only the employer losses were included as lost company revenue, with the remainder allocated as lost personal income in one form or another. In 2016, the average personal income tax rate was 24% (New Zealand Treasury, 2016), the company tax rate was 28% (Inland Revenue, 2014) and the average indirect tax rate was modelled as 15% using the current Goods and Services Tax (Inland Revenue, 2016).
By applying the total lost wage income marginal income tax and indirect tax rate and the total lost business output to the company tax rate, the total loss of tax revenue was estimated to be $119.0 million in 2016. This represents taxation revenue that must be collected from other parts of the economy (e.g. those that remain in the workforce) given a “no change in expenditure” assumption.
5.3.5 Deadweight loss of taxation payments and administration
Transfer payments (government payments and taxes) are not a net cost to society, as they represent a shift of consumption power from one group of individuals to another in society. If the act of taxation did not create distortions and inefficiencies in the economy, then transfers could be made without a net cost to society. However, these distortions do impose a deadweight loss on the economy.
A deadweight loss is the loss of consumer and producer surplus, as a result of the imposition of a distortion to the equilibrium (society preferred) level of output and prices (Chart 5.3). Taxes alter the price and quantity of goods sold compared to what they would be if the market were not distorted, and thus lead to some diminution in the value of trade between buyers and sellers that would otherwise be enjoyed.
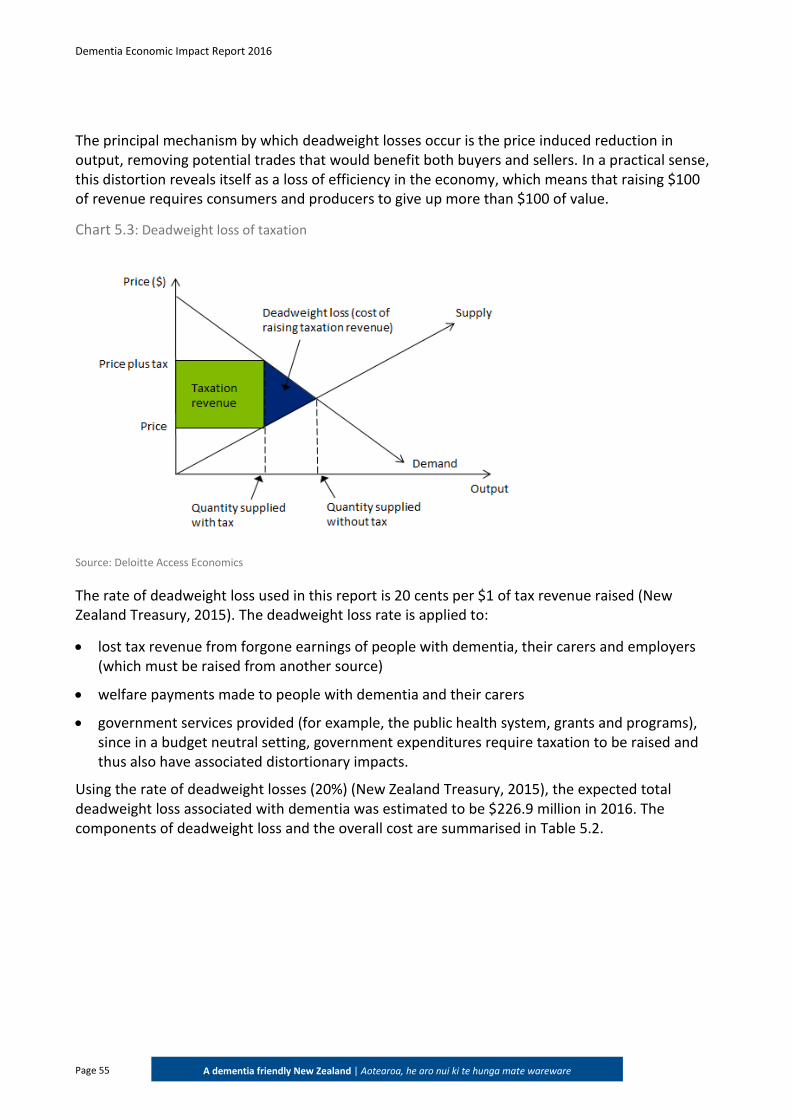
Dementia Economic Impact Report 2016
Page 55
A dementia friendly New Zealand | Aotearoa, he aro nui ki te hunga mate wareware
The principal mechanism by which deadweight losses occur is the price induced reduction in output, removing potential trades that would benefit both buyers and sellers. In a practical sense, this distortion reveals itself as a loss of efficiency in the economy, which means that raising $100 of revenue requires consumers and producers to give up more than $100 of value.
Chart 5.3: Deadweight loss of taxation
Source: Deloitte Access Economics
The rate of deadweight loss used in this report is 20 cents per $1 of tax revenue raised (New Zealand Treasury, 2015). The deadweight loss rate is applied to:
lost tax revenue from forgone earnings of people with dementia, their carers and employers (which must be raised from another source)
welfare payments made to people with dementia and their carers
government services provided (for example, the public health system, grants and programs), since in a budget neutral setting, government expenditures require taxation to be raised and thus also have associated distortionary impacts.
Using the rate of deadweight losses (20%) (New Zealand Treasury, 2015), the expected total deadweight loss associated with dementia was estimated to be $226.9 million in 2016. The components of deadweight loss and the overall cost are summarised in Table 5.2.
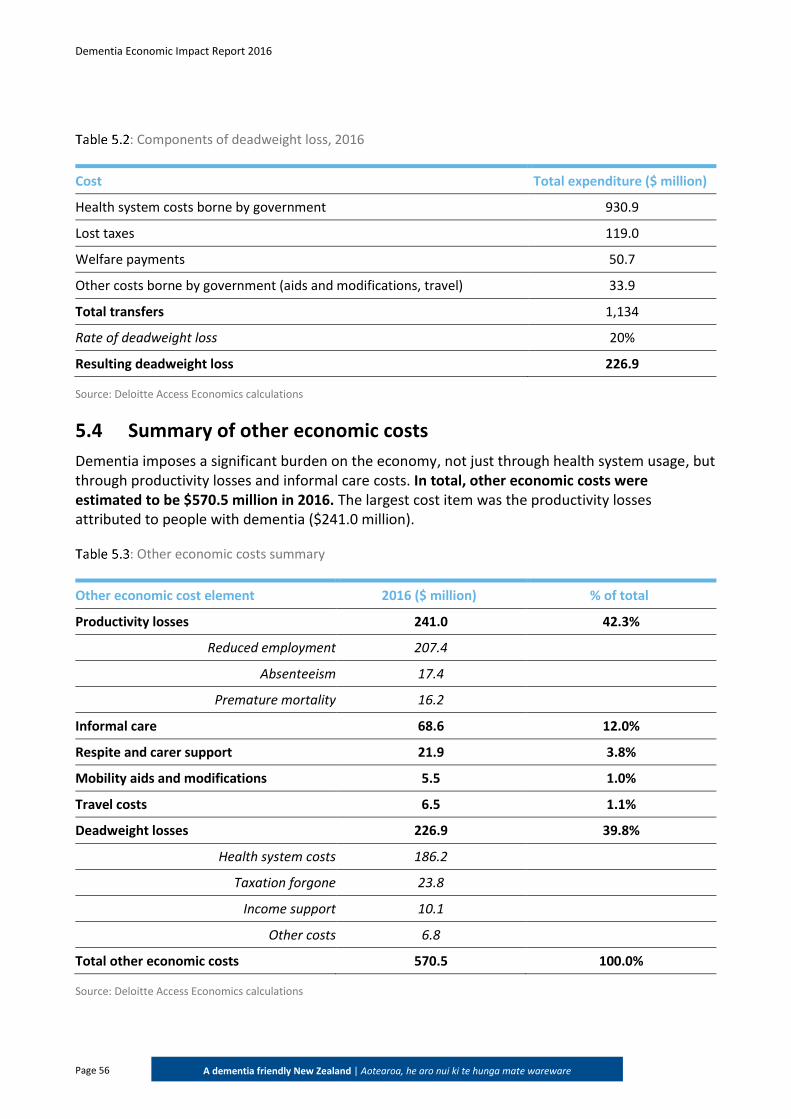
Dementia Economic Impact Report 2016
Page 56
A dementia friendly New Zealand | Aotearoa, he aro nui ki te hunga mate wareware
: Components of deadweight loss, 2016
Cost Total expenditure ($ million)
Health system costs borne by government 930.9
Lost taxes 119.0
Welfare payments 50.7
Other costs borne by government (aids and modifications, travel) 33.9
Total transfers 1,134
Rate of deadweight loss 20%
Resulting deadweight loss 226.9
Source: Deloitte Access Economics calculations
5.4 Summary of other economic costs
Dementia imposes a significant burden on the economy, not just through health system usage, but through productivity losses and informal care costs. In total, other economic costs were estimated to be $570.5 million in 2016. The largest cost item was the productivity losses attributed to people with dementia ($241.0 million).
: Other economic costs summary
Other economic cost element 2016 ($ million) % of total
Productivity losses 241.0 42.3%
Reduced employment 207.4
Absenteeism 17.4
Premature mortality 16.2
Informal care 68.6 12.0%
Respite and carer support 21.9 3.8%
Mobility aids and modifications 5.5 1.0%
Travel costs 6.5 1.1%
Deadweight losses 226.9 39.8%
Health system costs 186.2
Taxation forgone 23.8
Income support 10.1
Other costs 6.8
Total other economic costs 570.5 100.0%
Source: Deloitte Access Economics calculations
Dementia Economic Impact Report 2016
Page 57
A dementia friendly New Zealand | Aotearoa, he aro nui ki te hunga mate wareware
6 Burden of disease
This chapter adopts the ‘burden of disease’ methodology in order to quantify the impact of dementia on wellbeing. This methodology is used to calculate non-financial costs from reduced health and premature mortality.
6.1 Valuing life and health
Life and health can be measured in terms of disability adjusted life years (DALYs), which are based on disability weights where a weight of 0 represents a year of perfect health and a weight of 1 represents death. The DALY approach has been adopted and applied in New Zealand by the Ministry of Health (2016). DALYs are comprised of two components: the premature mortality (years of life lost due to premature death - YLLs) and morbidity (years of healthy life lost due to disability - YLDs).
YLDs are calculated by multiplying the number of people with a condition by a disability weight that applies to them. In any year, the disability weight of a health condition reflects a relative health state. For example, if the disability weight for a broken wrist is 0.18, this would represent losing 18% of a year of healthy life because of the injury, for the duration of the condition. YLLs are calculated based on the life expectancy according to the age and gender of people who died from a condition.
The burden of disease as measured in DALYs can be converted into a dollar figure using the concept of the value of a statistical life (VSL). The VSL is an estimate of the value society places on an anonymous life. As DALYs are enumerated in years of life rather than in whole lives it is necessary to calculate the value of a statistical life year (VSLY) based on the VSL. This is done using the formula:21
21 The formula is derived from the definition: VSL = ΣVSLYi/(1+r)i where i=0,1,2….n where VSLY is assumed to be constant (i.e. no variation with age).
Key finding: The burden of disease attributed to dementia was estimated to be $5.0 billion in 2016.
While this figure is substantially lower than what was estimated for 2008 and 2011, the difference is largely due to updated data from the Global Burden of Disease study (Vos et al, 2015).
In particular, the disability weights for each severity of dementia. Therefore, comparisons may not be made between the 2016 figure and the 2008 and 2011 figures.
DALY = YLLs + YLDs
Dementia Economic Impact Report 2016
Page 58
A dementia friendly New Zealand | Aotearoa, he aro nui ki te hunga mate wareware
The New Zealand Ministry of Transport (2016) estimated that the VSL was $4.06 million in 2015, which was inflated to $4.19 million in 2016 when accounting for the average growth in average weekly earnings (AWE). The average person living in New Zealand has 45 years of expected life remaining (Statistics New Zealand, 2015a), so the VSLY was estimated to be $170,085 in 2016 dollars.
6.2 Estimating the burden of disease from dementia
To estimate the burden of disease attributed to dementia, it is necessary to determine an appropriate disability weight given to the severity of dementia. In New Zealand, the most recent study analysing the health of the New Zealand population is the Ministry of Health’s Health Loss in New Zealand 1990-2013 (Ministry of Health, 2016f). This study uses data from the Global Burden of Disease 2013 database. To be consistent with the Ministry of Health (2016f) methodology, disability weights were taken from the Global Burden of Disease 2013 database (Vos et al, 2015).
YLDs are estimated using the disability weights for mild, moderate and severe dementia multiplied by the number of people with each level of dementia. The disability weights for each severity of dementia are as follows:
mild dementia is 0.069;
moderate dementia is 0.377; and
severe dementia is 0.449 (Vos et al, 2015).
The YLLs are based on the number of deaths due to dementia (as shown in section 0), and the years of expected remaining life at the age of death which are taken from standard life tables published by Statistics New Zealand (Statistics New Zealand, 2015a). A discount rate of 3% was applied when converting DALYs to a dollar estimate. No age weighting or discount was applied to the estimates of YLLs or YLDs – consistent with the methodology employed by the global burden of disease study22.
Chart 6.1 shows the total DALYs due to dementia by age, broken down by YLDs and YLLS components. The majority of the burden was due to morbidity (lost wellbeing and quality of life).
Overall, people with dementia experienced:
13,604 YLDs, or around 0.2 YLDs per person with dementia;
18,048 YLLs, or around 0.3 YLLs per person with dementia; and
31,652 DALYs, or around 0.5 DALYs per person with dementia.
22 When estimating DALYs the Global Burden of Disease study does not apply age-weighting or discounting. This has been their preferred approach since the 2010 Global Burden of Disease study (Murray et al, 2012) to quantify the value of lost life, rather than the social value of loss of health. The Global Burden of Disease does not estimate the value of lost life in dollar terms, and so makes no recommendations about whether to apply discounting to the dollar terms. We maintained discounting of the dollar value of burden of disease (i.e. VSLY in future years). This still reflects a
social preference for healthy life today rather than in the future.
VSLY = VSL / Σi=0,…,n-1(1+r)n
Where: n = years of remaining life, and r = discount rate
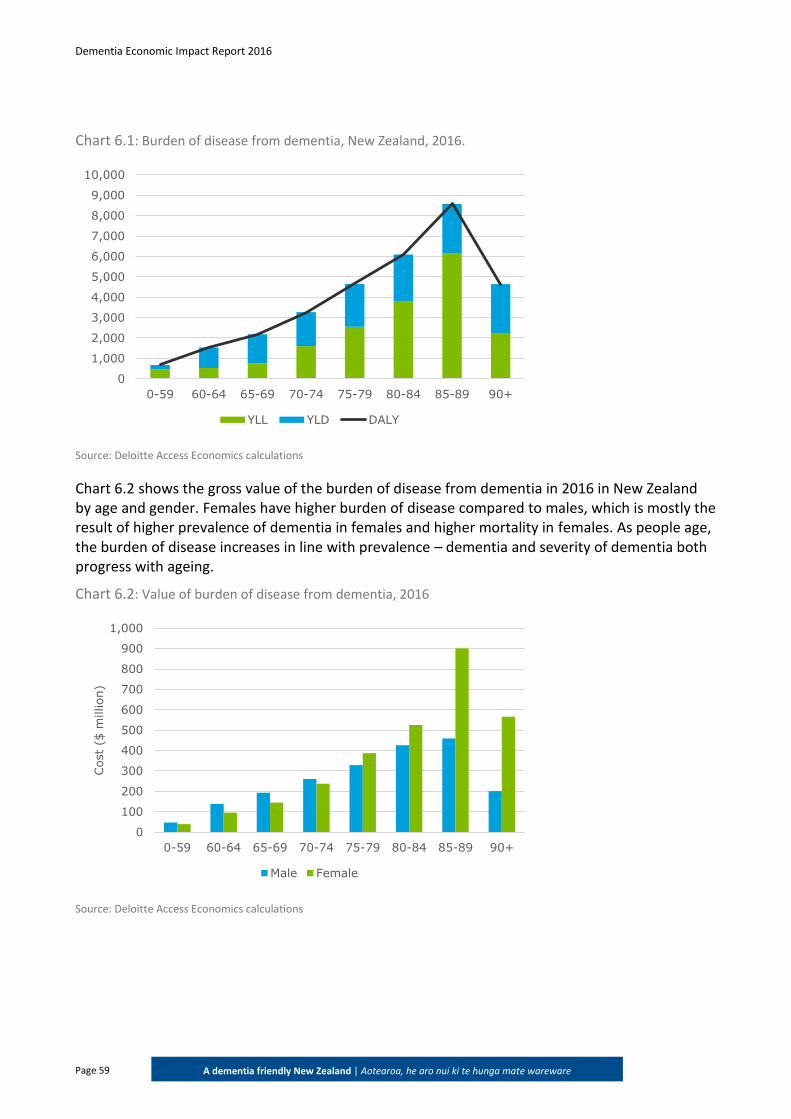
Dementia Economic Impact Report 2016
Page 59
A dementia friendly New Zealand | Aotearoa, he aro nui ki te hunga mate wareware
Chart 6.1: Burden of disease from dementia, New Zealand, 2016.
Source: Deloitte Access Economics calculations
Chart 6.2 shows the gross value of the burden of disease from dementia in 2016 in New Zealand by age and gender. Females have higher burden of disease compared to males, which is mostly the result of higher prevalence of dementia in females and higher mortality in females. As people age, the burden of disease increases in line with prevalence – dementia and severity of dementia both progress with ageing.
Chart 6.2: Value of burden of disease from dementia, 2016
Source: Deloitte Access Economics calculations
0
1,000
2,000
3,000
4,000
5,000
6,000
7,000
8,000
9,000
10,000
0-59 60-64 65-69 70-74 75-79 80-84 85-89 90+
YLL YLD DALY
0
100
200
300
400
500
600
700
800
900
1,000
0-59 60-64 65-69 70-74 75-79 80-84 85-89 90+
Cost
($ m
illion)
Male Female
Dementia Economic Impact Report 2016
Page 60
A dementia friendly New Zealand | Aotearoa, he aro nui ki te hunga mate wareware
Burden of disease increases with age for both males and females, due to increasing prevalence and severity as people age. Those aged 85-89 had the largest burden of disease, mainly due to this age group having the largest number of deaths compared to other age groups, resulting in high YLLs, and also having a larger number of prevalent cases, leading to high YLDs. After the peak in DALYs in the 85-89 age group, there is a significant drop in the 90+ age group, due to the lower number of cases in this age group and the lower number of deaths. Overall, the total burden of disease cost attributed to dementia was $5.0 billion.
The burden of disease is much lower than in previous reports ($5 billion in this report compared to $12 billion in 201), because the disability weights are lower and the VSL used is lower. The 2008 and 2011 estimates were based on disability weights from the 1996 study by Murray and Lopez. This study used the latest Global Burden of Disease disability weights from 2013 (Vos et al, 2015); for example, the previous disability weight for severe dementia was 0.940 but the new 2015 weight is 0.449.
Dementia Economic Impact Report 2016
Page 61
A dementia friendly New Zealand | Aotearoa, he aro nui ki te hunga mate wareware
7 Cost benefit analysis of delaying
institutional care
This chapter considers the costs and benefits of delaying entry into residential care by three, six or twelve months.
7.1 Scenarios
The scenarios being considered in this chapter are a policy intervention that results in a delay in the entry of people with dementia into residential aged care by three months, six months and twelve months. It is assumed that every day of delayed entry into residential care is one day less of residential care that needs to be provided to a person with dementia. Each day of delay into residential care is assumed to be replaced with one additional day of formal and informal care provided in the community. That is, it is assumed that different models of care will not have an impact on the life expectancy of people with dementia.
As described in Section 4.5.2, of the 62,287 people with dementia in New Zealand in 2016, 18,929 (30.4%) were estimated to be living in residential aged care. Of the 18,929 people with dementia living in residential aged care, it was estimated that approximately 73% have dementia as a main condition (13,819 or 22.2% of the prevalence). It was assumed that if dementia has been recorded as the “main condition” then it is the primary reason for someone entering aged care. Therefore, the proposed intervention is likely to target those people whose primary reason for entering aged care would have been dementia.
7.2 Benefits
There are two main benefits from a policy perspective of an intervention to keep people with dementia fitter for longer and thus delaying entry into residential care. Firstly, there are the financial benefits for both individuals and government from savings in residential care costs. Secondly, there are the emotional, or quality of life benefits of allowing people to choose the model of care that is best suited to the person with dementia and their family and carers.
Key finding: The net benefit from delaying entry into residential aged care by three, six and twelve
months in 2016 was estimated to be $65.5 million, $131.0 million and $262.0 million.
Comparison of the total costs and benefits of delaying entry in to residential aged care produces a benefit cost ratio of 6.6.
This indicates that there is potential savings in delaying entry into residential aged care.
Dementia Economic Impact Report 2016
Page 62
A dementia friendly New Zealand | Aotearoa, he aro nui ki te hunga mate wareware
7.3 Cost benefit analysis
People with dementia can either be cared for at home (in the community) or in residential care. Access Economics (2008) estimated that, based on the ratio of the prevalence of dementia to the incidence of dementia, the average life expectancy of a person with dementia is 3.3 years following diagnosis. A 2013 review of the literature to determine the rates of survival in dementia and Alzheimer's disease found that median survival time from age of onset of dementia ranges from 3.3 to 11.7 years, and median survival time from age of disease diagnosis ranges from 3.2 to 6.6 years for dementia or Alzheimer's disease cohorts as a whole (Todd et al, 2013). Therefore, for the purposes of this analysis, the average duration of dementia of 3.3 years remains appropriate.
Based on this average duration, the reduction in costs was calculated as follows:
0.25/3.3=7.6% reduction in costs for a three month delay;
0.5/3.3=15.2% reduction in costs for a six month delay; and
1/3.3=30.3% reduction in costs for a twelve month delay.
7.3.1 Reduction in residential aged care costs
The cost savings from delaying entry into residential care for people with dementia arise from the reduction in residential care services that need to be provided.
The costs of residential care in New Zealand were discussed in Section 4.5.2 of this report. In 2016, it was estimated that a total of $849.2 million was spent on providing residential aged care to people with dementia that can be attributed to their dementia.
The total cost saving from delaying entry into residential aged care by three, six and twelve months in 2016, was calculated based on a reduction of 7.6%, 15.2% and 30.3% of the costs for each level of care, respectively, and the corresponding reduction in the deadweight loss of taxation. The costs savings were estimated to be $64.3 million, $128.7 million, and $257.3 million.
7.3.2 Choice in model of care
In addition to the financial benefits from reduced residential care costs, an important driver for policies that provide support for at-home care is the choice offered to people with dementia and their families and loved ones.
The transition to residential care can be a difficult and distressing experience for people with dementia and their families and loved ones. For some, the ability to extend the period of home-based care may be preferred to residential care due to cultural norms or the emotional needs of family.
There are limited quantitative data on the size of the benefit of providing the choice of home-based care for people with dementia, however a number of international studies have shown there to be benefits. For example, Olsen et al (2016) found that living at home as long as possible is not only desirable for economic reasons but also is associated with higher quality of life for persons with moderate dementia compared to living in nursing homes. Similarly Black et al (2012) found that addressing health problems, while reducing caregiver burden and depression, may maximise quality of life in those with dementia living in the community and their carers.
Dementia Economic Impact Report 2016
Page 63
A dementia friendly New Zealand | Aotearoa, he aro nui ki te hunga mate wareware
Due to the lack of quantitative data on the non-financial benefits associated with home-based care, this benefit has not been estimated in this analysis. This should not be taken as a reflection of the importance, or lack thereof, of the non-financial benefits of home-based care. Providing choice in care models and delaying entry into residential care both have real non-financial benefits and these represent an important consideration for policy makers.
7.4 Costs
If people are not cared for in residential facilities, they consume more resources in the community sector, including informal care services and community services. We have assumed that there is no increase in non-residential health care services, since people are expected to access the same pharmaceutical, medical and hospital services in either care setting on average, for the same level of need. Similarly, there is no extra productivity or other costs incurred due to care in the community rather than in a residential facility.
7.4.1 Additional informal care services
As shown in Table 4.5, there were approximately 5.0 million bed days in residential aged care for people with dementia in 2016. Multiplied by 7.6%, 15.2% and 30.3%, this equates to 0.38 million, 0.76 million and 1.53 million bed days saved in residential facilities by delaying institutionalisation by three, six and twelve months, respectively. This equates to 54,586 weeks, 109,172 weeks and 218,345 weeks of care required in the community.
As set out in Section 5.2.2, there were an estimated 21.7 hours per week of informal care required on average for people with dementia in the community, in order to calculate the opportunity cost of this care. However, people with dementia who would otherwise be institutionalised are likely to require more care than the average since they are likely to be more progressed and/or have more complex needs. Consequently, the estimate of care required for people with severe stage dementia is used in this cost benefit analysis – an estimated 51.8 hours per week of informal care required on average.
Three month delay to institutionalisation
Multiplying the estimated average hours of informal care per week of 51.8 by 54,586 gives a total of 2.8 million hours of informal care required. The opportunity cost of each hour of care on average can be calculated by multiplying the number of informal hours of care required by the replacement hourly rate of $1.53 per hour. The hourly rate is calculated by multiplying the weighted average weekly earnings (AWE) of $16.46 for informal carers by the weighted chance of being employed (9.3%) (Statistics New Zealand, 2015a; 2015d). Therefore, the estimate of the opportunity cost of informal care associated with delaying institutionalisation by three months is estimated to be $4.3 million.
Compared to the total annual cost of informal care for people with dementia in New Zealand in 2016, this represents 4.3/68.6= 6.3% additional cost. This is lower than the 7.6% of residential care costs saved.
Six month delay to institutionalisation
Multiplying 51.8 by 109,172 weeks of care in the community for a six month delay gives a total of 5.7 million hours of informal care required. Multiplying this by the informal care wage of $1.53,
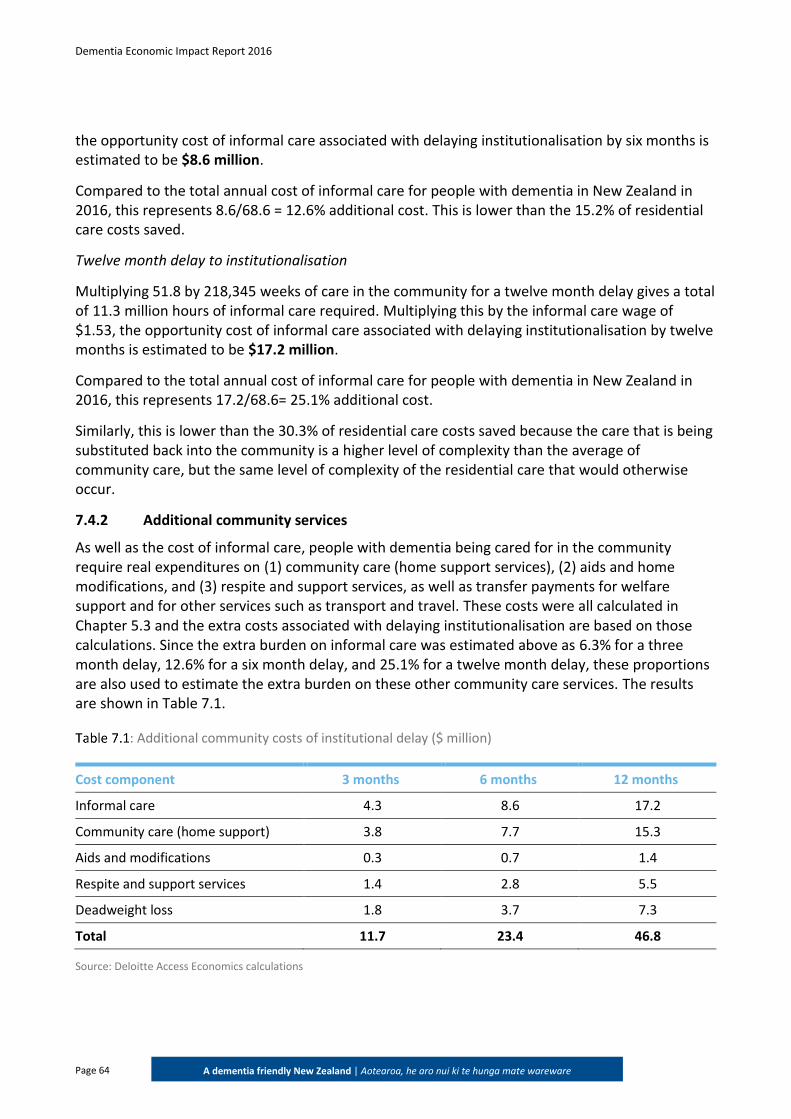
Dementia Economic Impact Report 2016
Page 64
A dementia friendly New Zealand | Aotearoa, he aro nui ki te hunga mate wareware
the opportunity cost of informal care associated with delaying institutionalisation by six months is estimated to be $8.6 million.
Compared to the total annual cost of informal care for people with dementia in New Zealand in 2016, this represents 8.6/68.6 = 12.6% additional cost. This is lower than the 15.2% of residential care costs saved.
Twelve month delay to institutionalisation
Multiplying 51.8 by 218,345 weeks of care in the community for a twelve month delay gives a total of 11.3 million hours of informal care required. Multiplying this by the informal care wage of $1.53, the opportunity cost of informal care associated with delaying institutionalisation by twelve months is estimated to be $17.2 million.
Compared to the total annual cost of informal care for people with dementia in New Zealand in 2016, this represents 17.2/68.6= 25.1% additional cost.
Similarly, this is lower than the 30.3% of residential care costs saved because the care that is being substituted back into the community is a higher level of complexity than the average of community care, but the same level of complexity of the residential care that would otherwise occur.
7.4.2 Additional community services
As well as the cost of informal care, people with dementia being cared for in the community require real expenditures on (1) community care (home support services), (2) aids and home modifications, and (3) respite and support services, as well as transfer payments for welfare support and for other services such as transport and travel. These costs were all calculated in Chapter 5.3 and the extra costs associated with delaying institutionalisation are based on those calculations. Since the extra burden on informal care was estimated above as 6.3% for a three month delay, 12.6% for a six month delay, and 25.1% for a twelve month delay, these proportions are also used to estimate the extra burden on these other community care services. The results are shown in Table 7.1.
: Additional community costs of institutional delay ($ million)
Cost component 3 months 6 months 12 months
Informal care 4.3 8.6 17.2
Community care (home support) 3.8 7.7 15.3
Aids and modifications 0.3 0.7 1.4
Respite and support services 1.4 2.8 5.5
Deadweight loss 1.8 3.7 7.3
Total 11.7 23.4 46.8
Source: Deloitte Access Economics calculations
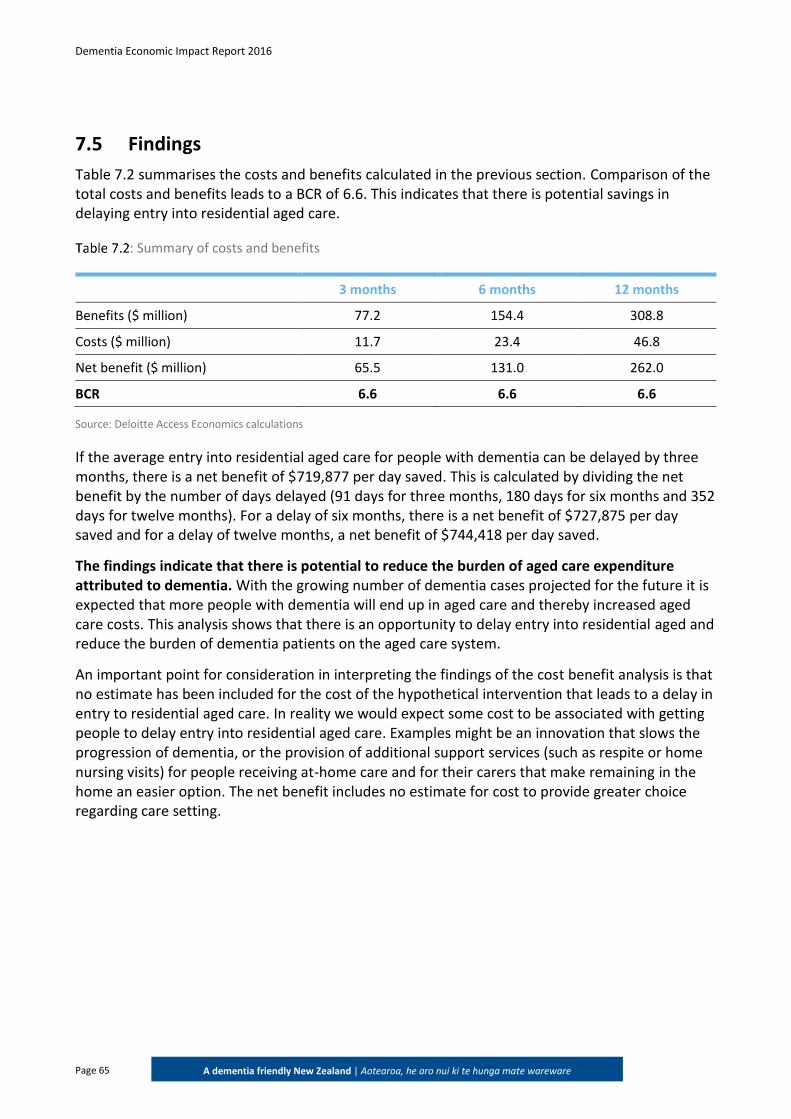
Dementia Economic Impact Report 2016
Page 65
A dementia friendly New Zealand | Aotearoa, he aro nui ki te hunga mate wareware
7.5 Findings
Table 7.2 summarises the costs and benefits calculated in the previous section. Comparison of the total costs and benefits leads to a BCR of 6.6. This indicates that there is potential savings in delaying entry into residential aged care.
: Summary of costs and benefits
3 months 6 months 12 months
Benefits ($ million) 77.2 154.4 308.8
Costs ($ million) 11.7 23.4 46.8
Net benefit ($ million) 65.5 131.0 262.0
BCR 6.6 6.6 6.6
Source: Deloitte Access Economics calculations
If the average entry into residential aged care for people with dementia can be delayed by three months, there is a net benefit of $719,877 per day saved. This is calculated by dividing the net benefit by the number of days delayed (91 days for three months, 180 days for six months and 352 days for twelve months). For a delay of six months, there is a net benefit of $727,875 per day saved and for a delay of twelve months, a net benefit of $744,418 per day saved.
The findings indicate that there is potential to reduce the burden of aged care expenditure attributed to dementia. With the growing number of dementia cases projected for the future it is expected that more people with dementia will end up in aged care and thereby increased aged care costs. This analysis shows that there is an opportunity to delay entry into residential aged and reduce the burden of dementia patients on the aged care system.
An important point for consideration in interpreting the findings of the cost benefit analysis is that no estimate has been included for the cost of the hypothetical intervention that leads to a delay in entry to residential aged care. In reality we would expect some cost to be associated with getting people to delay entry into residential aged care. Examples might be an innovation that slows the progression of dementia, or the provision of additional support services (such as respite or home nursing visits) for people receiving at-home care and for their carers that make remaining in the home an easier option. The net benefit includes no estimate for cost to provide greater choice regarding care setting.
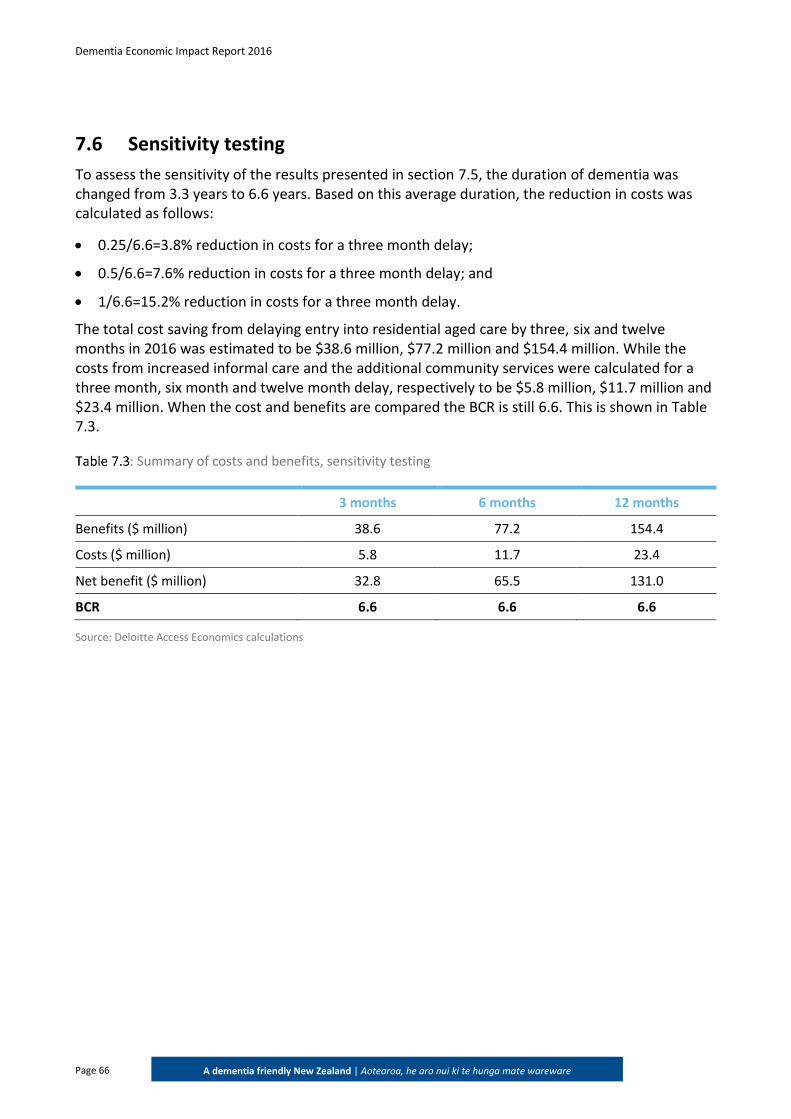
Dementia Economic Impact Report 2016
Page 66
A dementia friendly New Zealand | Aotearoa, he aro nui ki te hunga mate wareware
7.6 Sensitivity testing
To assess the sensitivity of the results presented in section 7.5, the duration of dementia was changed from 3.3 years to 6.6 years. Based on this average duration, the reduction in costs was calculated as follows:
0.25/6.6=3.8% reduction in costs for a three month delay;
0.5/6.6=7.6% reduction in costs for a three month delay; and
1/6.6=15.2% reduction in costs for a three month delay.
The total cost saving from delaying entry into residential aged care by three, six and twelve months in 2016 was estimated to be $38.6 million, $77.2 million and $154.4 million. While the costs from increased informal care and the additional community services were calculated for a three month, six month and twelve month delay, respectively to be $5.8 million, $11.7 million and $23.4 million. When the cost and benefits are compared the BCR is still 6.6. This is shown in Table 7.3.
: Summary of costs and benefits, sensitivity testing
3 months 6 months 12 months
Benefits ($ million) 38.6 77.2 154.4
Costs ($ million) 5.8 11.7 23.4
Net benefit ($ million) 32.8 65.5 131.0
BCR 6.6 6.6 6.6
Source: Deloitte Access Economics calculations
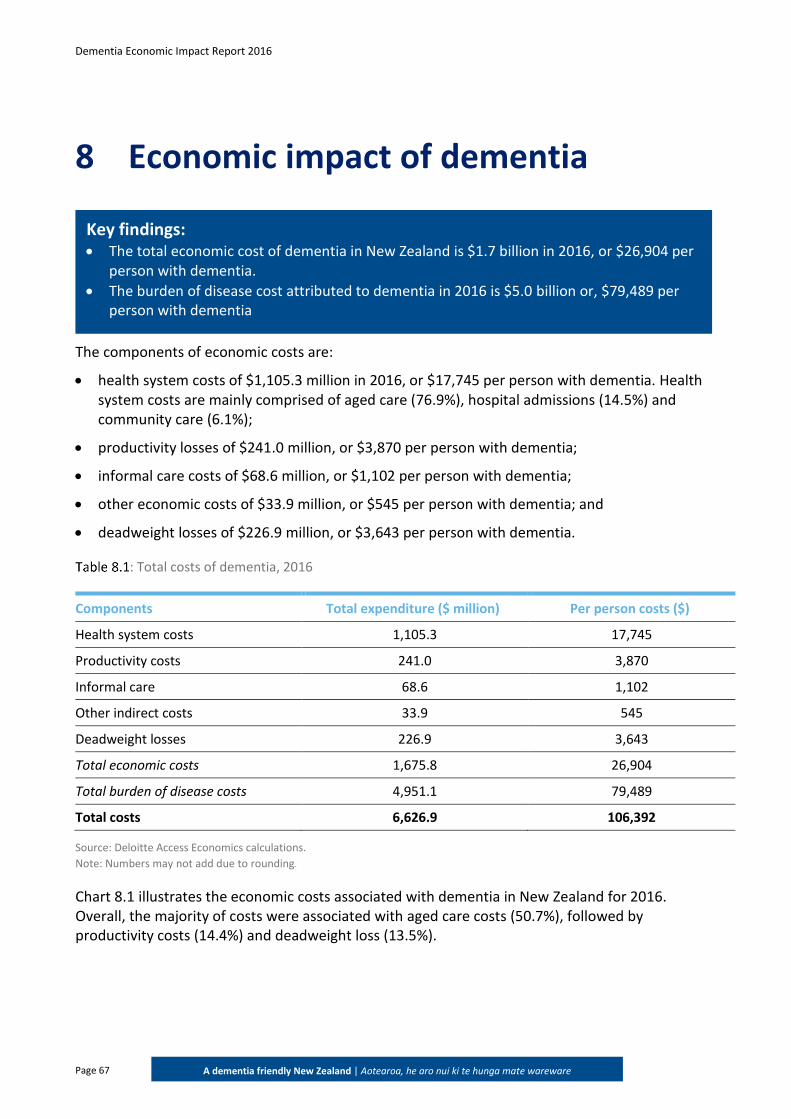
Dementia Economic Impact Report 2016
Page 67
A dementia friendly New Zealand | Aotearoa, he aro nui ki te hunga mate wareware
8 Economic impact of dementia
The components of economic costs are:
health system costs of $1,105.3 million in 2016, or $17,745 per person with dementia. Health system costs are mainly comprised of aged care (76.9%), hospital admissions (14.5%) and community care (6.1%);
productivity losses of $241.0 million, or $3,870 per person with dementia;
informal care costs of $68.6 million, or $1,102 per person with dementia;
other economic costs of $33.9 million, or $545 per person with dementia; and
deadweight losses of $226.9 million, or $3,643 per person with dementia.
: Total costs of dementia, 2016
Components Total expenditure ($ million) Per person costs ($)
Health system costs 1,105.3 17,745
Productivity costs 241.0 3,870
Informal care 68.6 1,102
Other indirect costs 33.9 545
Deadweight losses 226.9 3,643
Total economic costs 1,675.8 26,904
Total burden of disease costs 4,951.1 79,489
Total costs 6,626.9 106,392
Source: Deloitte Access Economics calculations.
Note: Numbers may not add due to rounding.
Chart 8.1 illustrates the economic costs associated with dementia in New Zealand for 2016. Overall, the majority of costs were associated with aged care costs (50.7%), followed by productivity costs (14.4%) and deadweight loss (13.5%).
Key findings: The total economic cost of dementia in New Zealand is $1.7 billion in 2016, or $26,904 per
person with dementia.
The burden of disease cost attributed to dementia in 2016 is $5.0 billion or, $79,489 per person with dementia
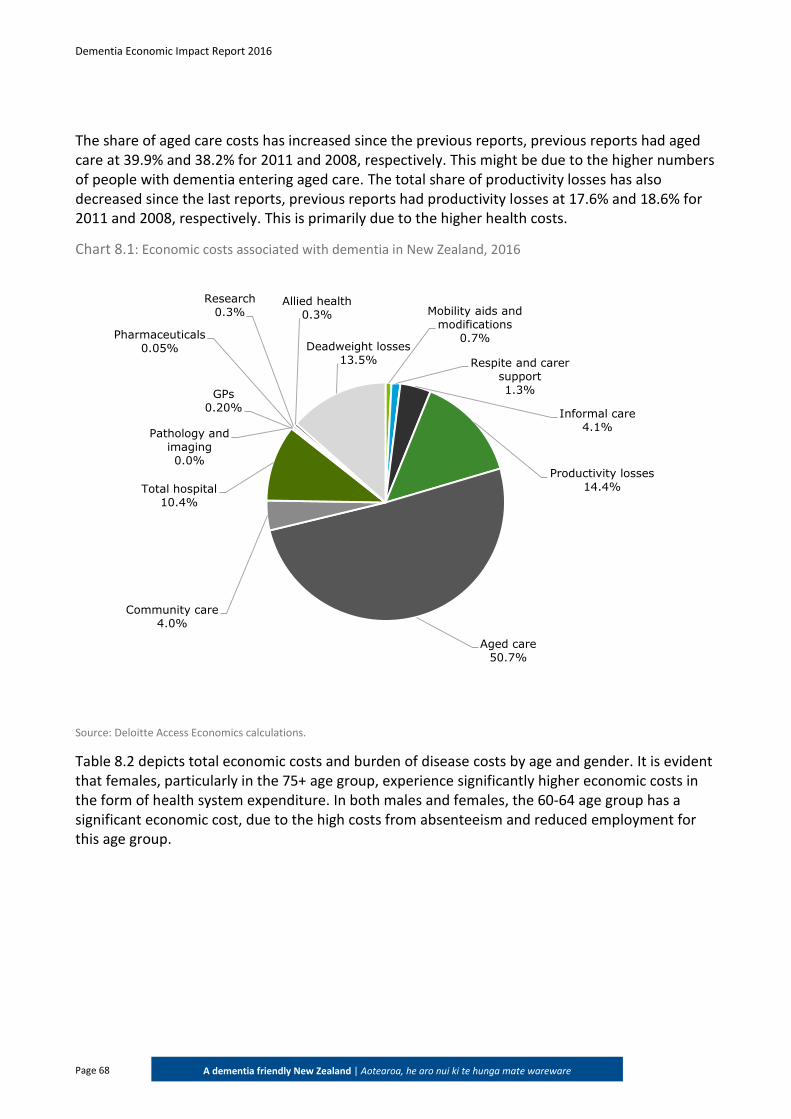
Dementia Economic Impact Report 2016
Page 68
A dementia friendly New Zealand | Aotearoa, he aro nui ki te hunga mate wareware
The share of aged care costs has increased since the previous reports, previous reports had aged care at 39.9% and 38.2% for 2011 and 2008, respectively. This might be due to the higher numbers of people with dementia entering aged care. The total share of productivity losses has also decreased since the last reports, previous reports had productivity losses at 17.6% and 18.6% for 2011 and 2008, respectively. This is primarily due to the higher health costs.
Chart 8.1: Economic costs associated with dementia in New Zealand, 2016
Source: Deloitte Access Economics calculations.
Table 8.2 depicts total economic costs and burden of disease costs by age and gender. It is evident that females, particularly in the 75+ age group, experience significantly higher economic costs in the form of health system expenditure. In both males and females, the 60-64 age group has a significant economic cost, due to the high costs from absenteeism and reduced employment for this age group.
Mobility aids and modifications
0.7%
Respite and carer support1.3%
Informal care4.1%
Productivity losses14.4%
Aged care50.7%
Community care4.0%
Total hospital 10.4%
GPs0.20%
Pharmaceuticals0.05%
Pathology and imaging0.0%
Research 0.3%
Allied health0.3%
Deadweight losses 13.5%
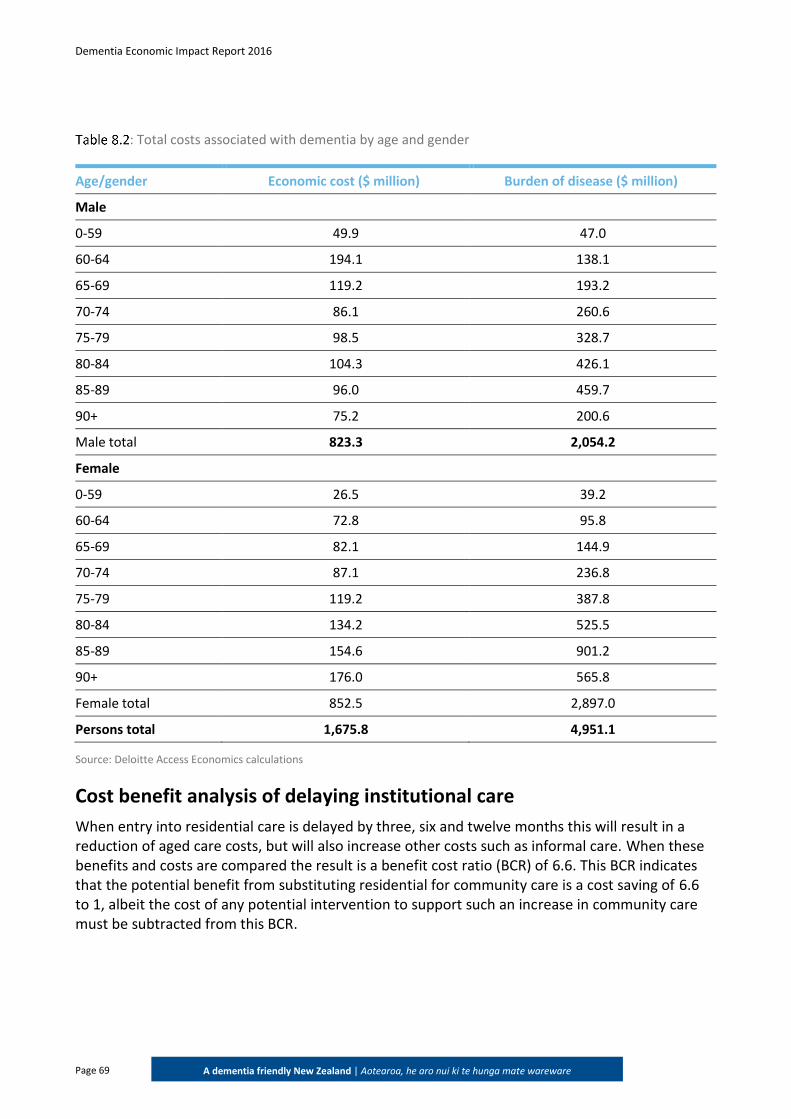
Dementia Economic Impact Report 2016
Page 69
A dementia friendly New Zealand | Aotearoa, he aro nui ki te hunga mate wareware
: Total costs associated with dementia by age and gender
Age/gender Economic cost ($ million) Burden of disease ($ million)
Male
0-59 49.9 47.0
60-64 194.1 138.1
65-69 119.2 193.2
70-74 86.1 260.6
75-79 98.5 328.7
80-84 104.3 426.1
85-89 96.0 459.7
90+ 75.2 200.6
Male total 823.3 2,054.2
Female
0-59 26.5 39.2
60-64 72.8 95.8
65-69 82.1 144.9
70-74 87.1 236.8
75-79 119.2 387.8
80-84 134.2 525.5
85-89 154.6 901.2
90+ 176.0 565.8
Female total 852.5 2,897.0
Persons total 1,675.8 4,951.1
Source: Deloitte Access Economics calculations
Cost benefit analysis of delaying institutional care
When entry into residential care is delayed by three, six and twelve months this will result in a reduction of aged care costs, but will also increase other costs such as informal care. When these benefits and costs are compared the result is a benefit cost ratio (BCR) of 6.6. This BCR indicates that the potential benefit from substituting residential for community care is a cost saving of 6.6 to 1, albeit the cost of any potential intervention to support such an increase in community care must be subtracted from this BCR.
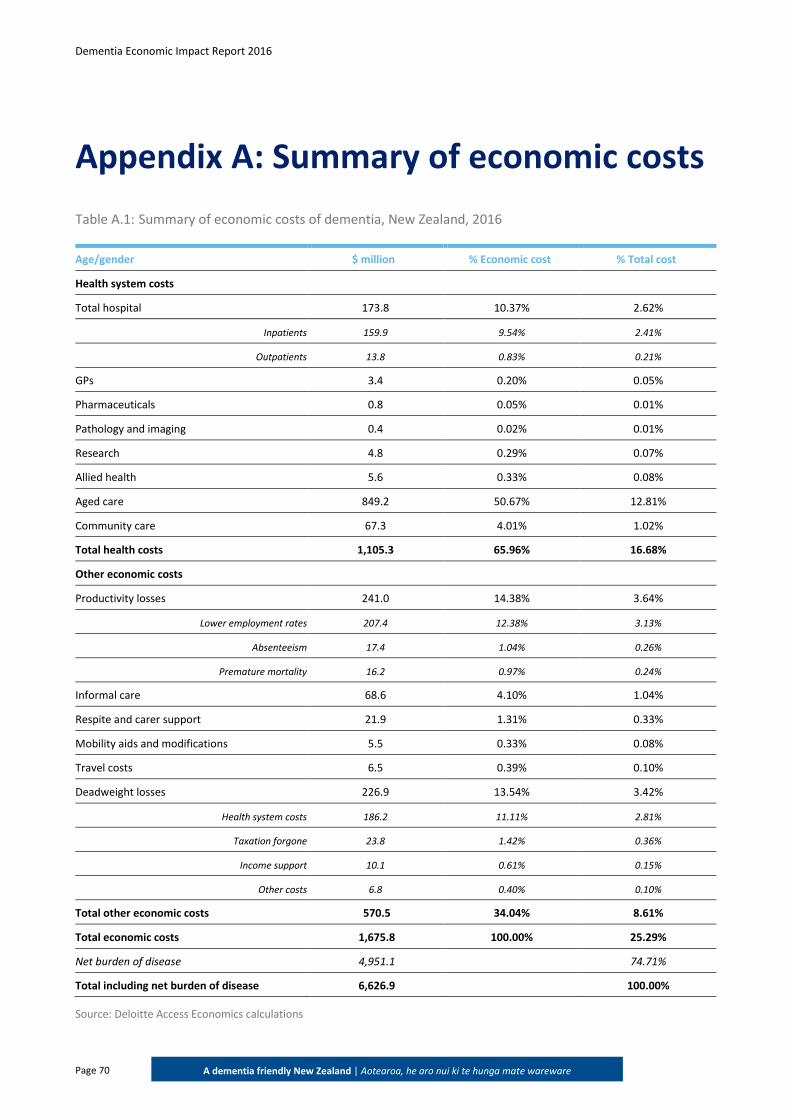
Dementia Economic Impact Report 2016
Page 70
A dementia friendly New Zealand | Aotearoa, he aro nui ki te hunga mate wareware
Appendix A: Summary of economic costs
Table A.1: Summary of economic costs of dementia, New Zealand, 2016
Age/gender $ million % Economic cost % Total cost
Health system costs
Total hospital 173.8 10.37% 2.62%
Inpatients 159.9 9.54% 2.41%
Outpatients 13.8 0.83% 0.21%
GPs 3.4 0.20% 0.05%
Pharmaceuticals 0.8 0.05% 0.01%
Pathology and imaging 0.4 0.02% 0.01%
Research 4.8 0.29% 0.07%
Allied health 5.6 0.33% 0.08%
Aged care 849.2 50.67% 12.81%
Community care 67.3 4.01% 1.02%
Total health costs 1,105.3 65.96% 16.68%
Other economic costs
Productivity losses 241.0 14.38% 3.64%
Lower employment rates 207.4 12.38% 3.13%
Absenteeism 17.4 1.04% 0.26%
Premature mortality 16.2 0.97% 0.24%
Informal care 68.6 4.10% 1.04%
Respite and carer support 21.9 1.31% 0.33%
Mobility aids and modifications 5.5 0.33% 0.08%
Travel costs 6.5 0.39% 0.10%
Deadweight losses 226.9 13.54% 3.42%
Health system costs 186.2 11.11% 2.81%
Taxation forgone 23.8 1.42% 0.36%
Income support 10.1 0.61% 0.15%
Other costs 6.8 0.40% 0.10%
Total other economic costs 570.5 34.04% 8.61%
Total economic costs 1,675.8 100.00% 25.29%
Net burden of disease 4,951.1 74.71%
Total including net burden of disease 6,626.9 100.00%
Source: Deloitte Access Economics calculations
Dementia Economic Impact Report 2016
Page 71
A dementia friendly New Zealand | Aotearoa, he aro nui ki te hunga mate wareware
References
Access Economics 2008, ‘Dementia economic impact report 2008’, prepared for Alzheimers New Zealand Incorporated, Access Economics, Canberra, Australia.
-2004, ‘Delaying the Onset of Alzheimer's Disease: Projections and Issues Report for Alzheimer’s Australia’, Canberra, September.
-2003, ‘The dementia epidemic: economic impact and positive solutions for Australia’, Access Economics, Canberra, Australia.
Alzheimer’s Association 2016, ‘2016 Alzheimer’s disease facts and figures’, Alzheimer’s and Dementia, 12:459-509.
Alzheimer's Australia 2017, Non-pharmacological treatment options, available at: https://www.fightdementia.org.au/about-dementia/health-professionals/clinical-resources/non-pharmacological-treatments, accessed 20 January 2017.
Alzheimer’s Disease International 2015, The Global Impact of Dementia: An analysis of prevalence, incidence, cost and trends, https://www.alz.co.uk/research/worldalzheimerreport2015summary.pdf, Accessed December 2016.
-2009, World Alzheimer Report, https://www.alz.co.uk/research/files/WorldAlzheimerReport.pdf accessed December 2016.
Alzheimer Europe 2009, ‘Other European cost of illness estimates: the Dementia Worldwide Cost Database’, available at: http://alzheimer-europe.org, accessed 20 December 2016.
American Psychiatric Association 2016, ‘DSM-5’, available at: http://www.psychiatry.org/dsm5, accessed 16 December 2016.
Australian Institute of Health and Welfare (AIHW) 2012, Dementia in Australia, Cat. no. AGE 70, Australian Government, Canberra.
Baumgart M, Snyder H, Carillo M, Fazio S, Kim H & Johns H 2015, ‘Summary of evidence on modifiable risk factors for cognitive decline and dementia: a population-based perspective’, Alzheimer’s & Dementia, 11:718-26.
Black B, Johnston D, Morrison A, Rabins P, Lyketsos C & Samus Q 2016, ‘Quality of life and community-residing persons with dementia based on self-rated and caregiver-rated measures’, Quality of Life Research, 21;8:1379-89.
Britt H, Miller GC, Henderson J, Bayram C, Harrison C, Valenti L, Wong C, Gordon J, Pollack A, Pan Y and Charles J 2014, ‘ General practice activity in Australia 2015-16’, The University of Sydney, General Practice Series Number 40.
Dementia Economic Impact Report 2016
Page 72
A dementia friendly New Zealand | Aotearoa, he aro nui ki te hunga mate wareware
Central TAS 2017, Aged Residential Care Demand Planner, New Zealand Government, Wellington.
Costa N, Felicoq L, Derumeaux-Burel H, Rapp T, Garnault V, Gillette-Guyonnet S et al 2013, ‘Comparison of informal care time and costs in different age-related dementias: a review’, BioMed Research International, volume 2013:article ID 852368.
Dale C 2015, ‘Turning silver to gold: Policies for an ageing population’, The University of Auckland, Working Paper 2014-2.
Deloitte Access Economics 2012, Updated Dementia Economics Impact Report 2011, New Zealand -2014, Dementia Prevalence Estimates And Projections Find a rest home 2016, Q&A Types of Care,
http://findaresthome.co.nz/questions/RestHomeDementiaandHospitalCare.htm, accessed February 2017.
Infometrics 2014, The economic value and impacts of informal care in New Zealand: For Carers NZ and the NZ Carers Alliance.
Inland Revenue 2016, ‘GST (Goods and services tax)’, http://www.ird.govt.nz/gst/gst-registering/gst-about/, accessed December 2016.
-2014, ‘Business income tax’, http://www.ird.govt.nz/business-income-tax/paying-tax/tax-rates/bit-taxrates-companytax.html, accessed February 2017.
interRAI 2016, National interRAI Data Analysis Annual Report 2014/15, http://centraltas.co.nz/assets/Health-of-Older-People/National-interRAI-Data-Analysis-Annual-Report-2014-15.pdf, accessed February 2017.
Jakobsen M, Poulsen P, Reiche T, Nissen N & Gundgaard J 2011, ‘Costs of informal care for people with dementia: evidence from a Danish survey’, Dementia and Geriatric Disorders Extra, 1:418-28.
Lenox-Smith A, Reed C, Lebrec J, Belger M & Jones R 2016, ‘Resource utilisation, costs and clinical outcomes in non-institutionalised patients with Alzheimer’s disease: 18-month UK results from the GERAS observational study’, BMC Geriatrics, 16:195-205.
Ministry of Health (New Zealand) 2016a, Mortality 2013: Online tables, Wellington.
-2016b, Publicly funded hospital discharges (pivot tables) - 1 July 2013 to 30 June 2014, Wellington.
-2016c, Privately funded hospital discharges (pivot tables) - 1 July 2013 to 30 June 2014, Wellington.
-2016d, New Zealand Casemix Framework for Publicly Funded Hospitals, Ministry of Health, Wellington.
Dementia Economic Impact Report 2016
Page 73
A dementia friendly New Zealand | Aotearoa, he aro nui ki te hunga mate wareware
-2016e, Equipment and modifications for disabled people, http://www.health.govt.nz/your-health/services-and-support/disability-services/types-disability-support/equipment-and-modifications-disabled-people, accessed February 2017.
-2016f, Health Loss in New Zealand 1990-2013, Ministry of Health, Wellington.
-2015a, Primary care data and stats, http://www.health.govt.nz/nz-health-statistics/health-statistics-and-data-sets/primary-care-data-and-stats, accessed February 2017.
-2015b, General Medical Services, http://www.health.govt.nz/our-work/primary-health-care/primary-health-care-subsidies-and-services/general-medical-services, accessed February 2017.
Ministry of Social Development (New Zealand) 2016, Annual Report 2014/2015.
2017a, Benefit fact sheets, https://www.msd.govt.nz/about-msd-and-our-work/publications-resources/statistics/benefit/ index.html#Datatables6, accessed February 2017.
2017b, New Zealand Superannuation (NZ Super) overview https://www.workandincome.govt.nz/eligibility/seniors/superannuation/superannuation-overview.html#null, accessed February 2017.
Ministry of Transport (New Zealand) 2017, The Total Mobility Scheme, http://www.transport.govt.nz/land/the-total-mobility-scheme/, accessed February 2017.
- 2016, Social cost of road crashes and injuries 2015 update, Wellington.
Murray C, Ezzati M, Flaxman A, Lim S, Lozano R, Michaud C et al. 2012. ‘GBD 2010: design, definitions and metrics’, The Lancet, 380:2063–6
Murray C, Lopez A 1996, ‘The Global Burden of Disease: a comprehensive assessment of mortality & disability from disease, injuries & risk factors in 1990 & projected to 2020’, Harvard School of Public Health, Boston.
National Institute for Health and Care Excellence 2015, Dementia, disability and frailty in later life – mid-life approaches to delay or prevent onset, National Institute for Health and Care Excellence, London.
New Zealand Aged Care Association (NZACA) 2015, Minimum Rates by TLA per day as at 1 July 2015, http://www.nzaca.org.nz/publications/documents, accessed February 2017.
New Zealand Productivity Commission 2015, Appendix E: Home-based support for older people.
New Zealand Treasury 2016, ‘Current Discount Rates’, available at: http://www.treasury.govt.nz/publications/guidance/planning/costbenefitanalysis/currentdiscountrates, accessed December 2016.
-2015, ‘Guide to social cost benefit analysis’, Wellington.
Dementia Economic Impact Report 2016
Page 74
A dementia friendly New Zealand | Aotearoa, he aro nui ki te hunga mate wareware
Norton S, Matthews F, Barnes D, Yaffe K & Brayne C 2014, ‘Potential for primary prevention of Alzheimer’s disease: an analysis of population-based data’, The Lancet Neurology, 13;8:788-94.
Olazaran J, Reisberg B, Clare L, Cruz I, Pena-Casanova J, del Ser T, et al 2010, ‘Nonpharmacological therapies in Alzheimer’s disease: a systematic review of efficacy’, Dementia and Geriatric Cognitive Disorders, 30:161-78.
Olsen C, Pedersen I, Bergland A, Enders-Slegers M, Jøranson N, Calogiuri G & Ihlebaek C 2016, ‘Differences in quality of life in home-dwelling persons and nursing home residents with dementia – a cross-sectional study’, BMC Geriatrics, 16:137.
Paraponaris A & Davin B 2015, ‘Economics of the iceberg: informal care provided to French elderly with dementia’, Value in Health, 18:268-75.
PBS 2017a, Donepezil, http://www.pbs.gov.au/medicine/item/2479L-8496E, accessed February 2017.
-2017b, Galantamine, http://www.pbs.gov.au/medicine/item/2537M-8771P, accessed February 2017.
-2017c, Rivastigmine, http://www.pbs.gov.au/medicine/item/2475G-8497F , accessed February 2017.
-2017d, Memantine, http://www.pbs.gov.au/medicine/item/1956Y-2492E, accessed February 2017.
Public Health England (2016) Health matters: midlife approaches to reduce dementia risk, Public Health England.
PHARMAC 2016, New Zealand Pharmaceutical Schedule: December 2016, http://www.pharmac.govt.nz/2016/11/28/Sched.pdf, accessed March 2017.
Statistics New Zealand 2017, Frequently asked questions, http://www.stats.govt.nz/browse_for_stats/population/estimates_and_projections/frequently-asked-questions-population-statistics/faq-population-statistics-part-2.aspx#credible, accessed March 2017.
-2016a, Consumer Price Index, http://www.stats.govt.nz/infoshare/, accessed January 2017.
-2015a, New Zealand Period Life Tables: 2012-14.
-2015b, Income for all people by labour force status, sex, and age groups , http://nzdotstat.stats.govt.nz/wbos/index.aspx, accessed January 2017.
-2015c, Estimated resident population by age and sex (1991+) (Annual-Jun), http://www.stats.govt.nz/infoshare/, accessed January 2017.
Dementia Economic Impact Report 2016
Page 75
A dementia friendly New Zealand | Aotearoa, he aro nui ki te hunga mate wareware
-2015d, Key labour force measures by qualification, age and sex, http://nzdotstat.stats.govt.nz/wbos/index.aspx, accessed January 2017.
Todd S, Barr S, Roberts M & Passmore A 2013, ‘Survival in dementia and predictors of mortality: a review’, International Journal of Geriatric Psychiatry, 11:1109-24.
Vieira RT, Caixeta L, Machado S, Silva AC, Nardi AE, Arias-Carrion O and Carta MG 2010, ‘Epidemiology of early-onset dementia: a review of the literature’, Clinical Practice and Epidemiology in Mental Health, 9:88-95.
Vos T et al 2015, ‘Global, regional, and national incidence, prevalence, and years lived with disability for 301 acute and chronic disease and injuries in 188 countries, 1990-2013: a systematic analysis for the Global Burden of Disease Study 2013’, The Lancet, 386 (9995):743-800.
Wimo A, Winblad B & Johnsson L 2010, ‘The worldwide societal cost of dementia: estimates for 2009’, Alzheimer’s and Dementia, 6:98-103.
Winblad, B et al. 2016, ‘Defeating Alzheimer’s Disease and other dementias: a priority for European science and society’, The Lancet Neurology, 15:4 456-532.
Dementia Economic Impact Report 2016
Page 76
A dementia friendly New Zealand | Aotearoa, he aro nui ki te hunga mate wareware
Limitation of our work
This report is prepared solely for Alzheimers New Zealand. We accept no duty of care to any other person or entity. The report has been prepared for the purpose of estimating the economic impact of dementia in New Zealand. You should not refer to or use our name or the advice for any other purpose.
Dementia Economic Impact Report 2016
Page 77
A dementia friendly New Zealand | Aotearoa, he aro nui ki te hunga mate wareware
Deloitte refers to one or more of Deloitte Touche Tohmatsu Limited, a UK private company limited by guarantee (“DTTL”), its network of member firms, and
their related entities. DTTL and each of its member firms are legally separate and independent entities. DTTL (also referred to as “Deloitte Global”) does not
provide services to clients. Please see www.deloitte.com/about for a more detailed description of DTTL and its member firms.
Deloitte provides audit, consulting, financial advisory, risk management, tax and related services to public and private clients spanning multiple industries.
Deloitte serves four out of five Fortune Global 500® companies through a globally connected network of member firms in more than 150 countries bringing
world-class capabilities, insights, and high-quality service to address clients’ most complex business challenges. To learn more about how Deloitte’s
approximately 225,000 professionals make an impact that matters, please connect with us on Facebook, LinkedIn, or Twitter.
Deloitte New Zealand brings together more than 1000 specialist professionals providing audit, tax, technology and systems, strategy and performance
improvement, risk management, corporate finance, business recovery, forensic and accounting services. Our people are based in Auckland, Hamilton,
Rotorua, Wellington, Christchurch and Dunedin, serving clients that range from New Zealand’s largest companies and public sector organisations to smaller
businesses with ambition to grow. For more information about Deloitte in New Zealand, look to our website www.deloitte.co.nz.
This communication contains general information only, and none of Deloitte Touche Tohmatsu Limited, its member firms, or their related entities
(collectively, the “Deloitte Network”) is, by means of this communication, rendering professional advice or services. Before making any decision or taking any
action that may affect your finances or your business, you should consult a qualified professional adviser. No entity in the Deloitte Network shall be
responsible for any loss whatsoever sustained by any person who relies on this communication.
© 2017. For information, contact Deloitte Touche Tohmatsu Limited.