Embed Size (px)
Citation preview

Note to Evaluation Committee members
Focal points:
Technical questions: Dispatch of documentation:
Fabrizio FelloniOfficer-in-ChargeIndependent Office of Evaluation of IFADTel.: +39 06 5459 2361e-mail: [email protected]
Deirdre McGrenraHead, Governing Bodies OfficeTel.: +39 06 5459 2374e-mail: [email protected]
Evaluation Committee — Eighty-first SessionRome, 27 November 2013
For: Review
Document: EC 2013/81/W.P.4
EAgenda: 5Date: 15 November 2013Distribution: PublicOriginal: English
Dry Zone Livelihood Support and PartnershipProgramme
Impact evaluation
Democratic Socialist Republic of Sri Lanka

EC 2013/81/W.P.4
i
Contents
Executive summary 1
AppendixDemocratic Socialist Republic of Sri Lanka:Dry Zone Livelihood Support and Partnership ProjectImpact Evaluation – Main Report 5

EC 2013/81/W.P.4
1
Executive summary
1. As a part of IFAD-wide commitments for the Ninth Replenishment period(2013-2015), the Independent Office of Evaluation of IFAD (IOE) in 2013conducted its first impact evaluation of an IFAD-supported project. This reportpresents the impact evaluation of the Dry Zone Livelihood Support and PartnershipProgramme (DZLISPP) in Sri Lanka.
2. The entire range of project-level evaluation criteria outlined in IFAD’s EvaluationManual was applied in the evaluation. For the first time at IFAD extensive primarydata collection and analysis were undertaken, including a qualitative survey (30 keyinformant interviews with project staff and relevant government officers, and 41focus group discussions with beneficiaries), and a quantitative survey of over 2,560households - both project and comparison households.
3. The DZLISPP was approved by the Executive Board of IFAD in September 2004 andcompleted in March 2013. Actual costs amounted to US$27.2 million and werefinanced by an IFAD loan of US$21.97 million and a grant of US$0.34 million forpolicy work on land tenure, while the remainder was funded by the Government ofSri Lanka and the beneficiaries. The project was under the responsibility of theMinistry of Agriculture. It included five components: (i) rainfed upland agriculturaldevelopment, through farmer field schools; (ii) marketing and enterprisedevelopment; (iii) irrigation rehabilitation; (iv) microfinance and income-generating activities; and (v) priority community infrastructure development.
4. The project design was relevant, with priority accorded to disadvantagedcommunities. Originally designed as a project in support of subsistence agriculture,DZLISPP gradually aligned itself to changes in the country context, such as thetransition from low- to middle- income status and from a conflict-affected to apost-conflict phase (after 2009). In particular, the project increasingly sharpenedthe focus on: (i) higher-value crops and livestock products; (ii) linkages toprocessing and marketing channels within existing value chains (e.g. milk, fruitsand vegetables); and (iii) technology for seed multiplication (potato, onion). Thistransition was possible thanks to a new project management team and inputprovided by the midterm review.
5. The project was broadly effective. Outreach figures are high (at least 120,000households as compared to the appraisal target of 80,000 households) althoughthe quality of implementation did not always keep pace with the scale of outreach.The support to livestock development, initially not a major area of emphasis,succeeded in integrating livestock production systems into dryland farming. Theproject rehabilitated traditional village irrigation tanks, affecting a command areaof 7,900 hectares (compared to the target 6,600 hectares), 3,362 of which wereincremental. Overall the quality of work was good, but the water users’associations were still relatively weak after completion. The DZLISPP helpedexpand marketing opportunities that established linkages between farmers andprivate firms. The latter cofinanced equipment and construction of processing andcollection centres for agricultural and dairy produce.
6. The project was moderately efficient. Similar to other IFAD projects, the DZLISPPsuffered from serious delays during the first three years of implementation butmanaged to attain most of its targets by completion. The actual projectmanagement cost ratio was roughly 22 per cent. This is a relatively high proportionpartly justified by the need to serve a scattered target population and tocompensate for the capacity constraints of local extension agencies. At completion,the estimated internal rate of returns was high (19.6 per cent) but as this figure isheavily dependent on monitoring and evaluation (M&E) data, it may not be reliable.

EC 2013/81/W.P.4
2
7. Methodological issues. One of the fundamental constraints in the context of thisevaluation was the absence of a baseline dataset. For this reason, the quantitativecomponent of the survey employed two strategies: (i) an attempt to reconstructbaseline information through recall methods; and (ii) a quasi-experimentalapproach using statistical techniques that do not strictly require baseline data. Inparticular, the evaluation adopted “propensity score matching” as well as the“treatment effect model” (an application of the Heckman sample selection model)to test for consistency and robustness of results. Both can help address samplingbias when project participants have not been randomly selected.
8. In addition to the absence of a baseline dataset, the impact evaluation faced othermajor constraints and issues: (i) sample selection bias due to targeting;(ii) confounding effects of the general economic growth and poverty reductionexperienced by Sri Lanka over the past eight years; (iii) the possible spreading ofbenefits from target to non-target groups; and (iv) issues related to the project“incubation time” in that although the project began in late 2005, most projectinterventions took place during the three-year period between late 2009 and early2013.
9. Targeting of disadvantaged communities. As confirmed by the evaluation’ssurvey, the project – in line with design – focused on more isolated communities,with a lower endowment of basic infrastructure such as primary and secondaryschools, police posts and community markets. Within those communities,households assisted by the project cultivated more crops and had slightly highereducation status but a poorer asset base, reflecting a tendency by project fieldstaff to focus on households on the basis of their needs and interest in projectactivities.
10. Impact. The project M&E data tend to show significant and generalizedimprovements in the welfare of beneficiaries, including agricultural productivity,incomes and assets. This evaluation acknowledges the efforts made by the projectM&E system to collect a wide array of data and information. At the same time, thefollowing limitations have been found: (i) inaccuracies in reporting at the districtlevel (e.g. double counting, incorrect entries); (ii) non-representative sampling;and (iii) lack of comparison with households not benefitting from the project(raising an attribution issue).
11. The evaluation benefited from primary data that are better representative and fromcomparisons with households that were not assisted by the project. Moreover, ittriangulated between different methods and sources and tested the robustness ofthe analysis. The findings on impact are positive but more nuanced when comparedto the project M&E findings. Evidence suggests that the project has exposed smallfarmers to new crops and improved agricultural techniques. It has promoted anumber of initiatives that can play a role in helping modernize agriculture in thedry zone of Sri Lanka. At the household level, socio-economic changes in assetsand expenditures are mixed and the results are sensitive to alternative estimationmethods. The effects of project-supported training and extension services are, to alarge extent, still emerging.
12. Through the farmer field school approach, the project exposed smallholder farmersto new techniques in onion cultivation practices and crop varieties such as turmericand ginger, groundnuts and fruit trees (e.g. mango, papaya). In a few instances,more advanced technology was introduced through the Department of Agriculturesuch as seed production for B-onions and hydroponics for potato tuber production(Badulla district).
13. The project contributed to the development of grassroot networks at the villagelevel, particularly through support given to water tank societies, crop societies anddairy societies, and their federations. In many of these, women held the positionsof president, secretary or treasurer.

EC 2013/81/W.P.4
3
14. Results in terms of household income and assets are mixed. The findings suggestthat given the project’s emphasis on dairy farming, project-supported householdshave invested in cattle and purchased fewer household assets due to externalfinancial constraints. In most cases, participating households had to self-financedairy farming investments, not only to buy cattle but also to build equipment andpurchase special feed for lactating cows. The fact that the beneficiaries had tofinance the new investments encouraged by the project may explain why they hadto forego the purchase of other household assets. In assessing the project impacts,this evaluation has taken into account that most of the project initiatives took placebetween 2009 and early 2013.
15. The project contained sustainability elements: (i) the formation of farmer andproducer societies (e.g. village irrigation tank, crop and dairy societies) and theirfederations; (ii) linkages with relevant government departments; (iii) grants forfuture maintenance of minor tanks and revolving microfinance and microcreditfunds; and (iv) linking farmers with private sector agribusiness companies (freshfruits and vegetables, milk). Most of the project initiatives need furthertechnical/organizational support as they were implemented over the last36 months of the project. Fledgling farmers’ organizations are not yet fullyconfident with accounting and marketing strategies.
16. Pro-poor innovation and scaling up has been satisfactory. The project hasmade direct efforts to bring farmers closer to available technology such asmultiplication techniques for seed potato, chilling technology for dairy farming, andquality seeds for cowpeas, maize and groundnuts. The project worked with bothprivate sector companies and provincial and district departments on the diffusion ofthe above innovations. Some partnerships are already under way. Current nationalpolicies favour larger infrastructure and plantation agriculture and tend to disregardthe fact that successful commercial agriculture is not at odds with smallholderfarming.
17. The project’s performance in gender equality and women’s empowerment isassessed as highly satisfactory. Both men and women participate in householdmanagement and income generation. Women are strongly represented in cropsocieties and account for 43 per cent of society presidents, 64 per cent ofsecretaries and 54 per cent of treasurers. The majority of loan beneficiaries arealso women (60-100 per cent).
Recommendations18. Need for a follow-up phase and advocacy from IFAD. Pioneering interventions
such as this project require years to consolidate results; a single project phase isnot sufficient. Focusing on the dry zone is consistent with the current priorityaccorded by the Government for the modernization of agriculture. IFAD needs toconvey this perspective more forcefully to the Government.
19. A more selective project format is required, revisiting several componentsand concepts. In particular, it is important to: (i) promote further linkages withexisting value chains through public-private sector partnerships; (ii) supportgrassroot societies (e.g. crop, village tank, dairy) and their federations as an entrypoint for public extension programmes and for agreements with private sectoroperators; and (iii) avoid subsidized interest rates in credit schemes (as lump-summatching grants may be a better option).
20. Continued advocacy on policy issues. This involves not only macro policy issuesthat are politically entrenched, such as land tenure, but also meso-level andpractical issues such as the formal registration of village-level societies.
21. Project commitments need to be honoured. In the short term, the project’scommitment to provide a financial contribution to revolving funds for maintenanceof village tanks and other schemes needs to be honoured.

EC 2013/81/W.P.4
4
22. Better accuracy and quality control in M&E data is required. Conductingthematic studies is good practice and deserves to be retained. A simple baselinesurvey with both project and comparison observations is recommended and itsdatabase needs to be carefully preserved.
Selected methodological considerations for future similar work at IFAD23. Absence of baseline data and a comparison group is a typical constraint
encountered in impact evaluations at IFAD. This is further complicated by thetargeting approach of many projects, which is likely to generate a serious samplingbias. Use of statistical techniques that do not strictly require a baseline (propensityscore matching, difference in differences, using recall questions and the treatmenteffect model) is a viable option although it may not fully replace baseline data. It isalso to be noted that the selection, development and testing of the econometricapproach can be extremely time-consuming.
24. Timing of the survey. Some reviewers may believe that it is preferable to waituntil a project has gone through a sufficiently long “gestation period” beforeconducting an impact evaluation. However, undertaking an evaluation ex post(i.e. when the project has been closed for a few years and the management teamis no longer in place) can be extremely challenging; significant information on theproject area context may be missing and could result in survey design andsampling errors. When impact evaluations are conducted during implementation orjust after project closure, surveys may have to focus more on shorter-termindicators such as technology adoption.
25. Other challenges include: (i) practical sampling arrangements in which projectstarget specific agroecological areas thus making it problematic to find validcomparison areas and communities; and (ii) the multi-component nature of manyIFAD-funded projects means that interventions are non-homogenous bundles ofactivities, making the cause-to-effect relation difficult to detect and explain, anddata collection and analysis highly time-consuming.
26. Finally, econometric analysis results are rarely self-explanatory and need to beinterpreted. Mixed methods, combining both quantitative (mini-surveys) andqualitative techniques can help disentangle the causal nexus. A way forward forIFAD projects could be to conduct more thematic studies combining a simplesurvey format with more qualitative techniques. This would provide more context-specific findings adapted to each component that can be used to inform projectimplementation as well as final assessment at completion.

Appendix EC 2013/81/W.P.4
1
The Democratic Socialist Republic of Sri LankaDry Zone Livelihood Support and Partnership ProgrammeImpact Evaluation
Main Report
Contents
Currency equivalent, weights and measures 2Abbreviations and acronyms 2Map of the project area 3I. Background, objectives, methodology and process 4II. The project 5
A. The country context 5B. Project implementation status 9C. Project performance 10D. Rural poverty impact 16E. Other performance criteria 28F. Performance of partners 32
III. Assessment of the PCR quality 33IV. Conclusions, recommendations and selected methodological
considerations 34A. Conclusions 34B. Recommendations 35C. Selected methodological considerations for future similar work at
IFAD 36
Annexes
1. Rating comparison 382. Basic project data 393. Note on the surveys 404. Definition of the evaluation criteria used by IOE 495. List of key persons met 506. Bibliography 527. Tables from the quantitative household survey 58

Appendix EC 2013/81/W.P.4
2
Currency equivalent, weights and measures
Currency equivalentCurrency unit = Sri Lankan RupeesUS$1 = 0.0075 Sri Lankan Rupees(31 August 2013)
Abbreviations and acronyms
DSD District Secretary’s DivisionDZLISPP Dry Zone Livelihood Support and Partnership ProgrammeFAO Food and Agriculture Organization of the United NationsFFS farmer field schoolGND Grama Niladhari DivisionHARTI Hector Kobbekaduwa Agrarian Research and Training InstituteIOE Independent Office of Evaluation of IFADM&E monitoring and evaluationPCR project completion reportPSM propensity score matching

Appendix EC 2013/81/W.P.4
3
Appendix I
EC 2013/81/W
.P.4
Map of the project area

Appendix EC 2013/81/W.P.4
4
Appendix I
EC 2013/81/W
.P.4
The Democratic Socialist Republic of Sri LankaDry Zone Livelihood Support and Partnership ProgrammeImpact Evaluation
I. Background, methodology and process1. Between 2013 and 2015, as a part of its commitment in the ninth replenishment
period (2013-2015), IFAD will conduct 30 impact evaluations, applyinginternationally recognised quantitative data analysis techniques, in conjunctionwith other analytical approaches. In line with recent guidance received from theEvaluation Committee and the Executive Board, the Independent Office ofEvaluation (IOE) of IFAD will provide support to the Fund through:(i) participation at in-house discussions on impact evaluations; (ii) closeinvolvement in major international platforms on impact evaluation (e.g. NONIE,ECG, UNEG); and (iii) undertaking a Corporate Level Evaluation on IFAD’sApproaches and Results in conducting Impact Evaluations at the end of the ninthreplenishment period.
2. In addition, and as approved by the Executive Board1 in December 2012, in 2013IOE has conducted its first impact evaluation of an IFAD-supported project in SriLanka, the Dry Zone Livelihood Support and Partnership Programme (DZLISPP).Further impact evaluations will be conducted by IOE from 2014 onwards, basedon the 2013 experience and subject to the availability of resources.
3. Similar to other project-level evaluations conducted by IOE, this impact evaluation isintended to assess the performance and impact of an IFAD project and providerecommendations for future operations. It applies mixed methods and triangulatesfrom different sources. Compared to previous IOE evaluations, it benefits from alarger set of primary data collected through a qualitative and quantitative survey.For the first time the quantitative survey tests, within an IFAD project context,econometric approaches used by other international organizations. This is expectedto highlight opportunities and constraints in adopting such approaches in an IFAD“project environment”, better contribute to internal and external discussions onimpact evaluation and, eventually, help prepare for the above Corporate-levelEvaluation.
4. Among the factors taken into account in selecting this project in Sri Lanka were:(i) the availability of qualitative thematic studies on the project; (ii) theavailability of relatively detailed M&E information on project sites (although thelatter proved to be less accurate than expected); (iii) national technical expertisein quantitative and qualitative data collection; (iv) preference for a countrywhere IOE had not recently conducted an evaluation; (v) availability of projectstaff in the capital and in the field during the foreseen survey implementationperiod. The latter point was crucial. While the project had reached completionand some field coordinators had terminated their contract, key project staff atthe national and district level were in office until the end of May 2013. Interactionswith these staff members were fundamental for verifying information and data,understanding key project implementation features, revising the sampling strategyand organizing the survey logistics.
5. Methodology. This evaluation applies the entire range of project-levelevaluation criteria outlined in IFAD’s Evaluation Manual.2 Impact is thus one ofthe criteria considered here: exploring other criteria is essential to provide abalanced assessment. Compared to previous evaluations, an additional featurewas the organization of extensive field work for primary data collection, both
1 https://webapps.ifad.org/members/eb/107/docs/EB-2012-107-R-2-Rev-1.pdf2 http://www.ifad.org/evaluation/process_methodology/doc/manual.pdf

Appendix EC 2013/81/W.P.4
5
Appendix I
EC 2013/81/W
.P.4
qualitative and quantitative. The qualitative component entailed 30 keyinformant interviews with project staff, relevant government officers3 and41 focus group discussions with beneficiaries in the four project district (men andwomen). Selection of the sites was done randomly in each district, taking intoaccount the need to represent different project components.
6. The quantitative component entailed the fielding of a survey of 2567 householdsin 160 Grama Niladhari Divisions (GNDs)4 split between 1302 households locatedin GNDs that had been covered by the project (general treatment households)and 1265 households located in GNDs without project (comparison households).Selection of sites and household was done through multi-stage cluster randomsampling.
7. IOE reviewed the documents, reports and secondary data produced by theproject, including the M&E data, the Project Completion Report (PCR), and thethematic studies carried out by the Hector Kobbekaduwa Agrarian Research andTraining Institute (HARTI), a very distinctive feature of this project. IOEconducted a first reconnaissance mission in December 2012, a preparatorymission in March 2013 (including field visits in Kurunegala district) to fine-tunethe methodology and evaluation questions and start data collection, as well as asynthesis mission from 21 to 31 May 2013. During the latter, in Colombo, thecapital, meetings were held with the Ministry of Agriculture, the Ministry ofFinance, the Central Bank, the World Bank country office, commercial banks,NGOs and staff of the programme management unit. Field visits were made totwo of the four project districts, i.e. Monaragala and Badulla in Uva Province. Atthe end of the mission, the preliminary evaluation’s findings were presented on31 May 2013 at a wrap-up meeting organized by the Government.
8. The report was subsequently drafted and peer-reviewed by IOE. The draft reportwas also reviewed by the Independent Evaluation Department of the AsianDevelopment Bank and the Operations Evaluation Department of the AfricanDevelopment Bank.5 The draft report was shared with IFAD’s Asia and the PacificDivision (Programme Management Department) the Statistics and Studies forDevelopment Division (Strategy and Knowledge Management Department) andthe Government of Sri Lanka, and their comments were taken into account whenfinalizing the report. A learning workshop was organised in Colombo on 3December 2013 and attended by representatives of the Ministry of Agriculture,the Ministry of Finance and Planning, the Central Bank, and other concernedcentral Government authorities, district-level authorities from Anuradhapura,Badulla, Kurunegala and Monaragala, international organizations, private sectorcompanies and NGOs active in Sri Lanka.
9. Since this is the first exercise of this type undertaken by IFAD, limitations,constraints and considerations for future undertakings of this type are presentedthroughout the report and summarised at the end.
II. The projectA. The country context10. Growing economy and transition to middle-income country status. With a
population of 21.2 million (mid 2012), Sri Lanka has experienced a majordemographic transition during the past decades, entailing a reduction inmortality (6 deaths per 1000 people in 2012 against 12.2 in 1962) and fertility:
3 e.g., Department of Agriculture, Department of Agrarian Development, Department of Animal Health and Production andthe Women’s Bureau.4 In Sri Lanka, local governments below the district level include: (i) District Secretary’s Divisions (DSD) and (ii) GramaNilhadari Divisions (local government units below divisional secretariats).5 The approach paper of this evaluation benefited from comments from the Evaluation Department of the NorwegianAgency for Development Cooperation.

Appendix EC 2013/81/W.P.4
6
Appendix I
EC 2013/81/W
.P.4
total fertility rate in 2012 was just above the replacement rate at 2.2 births perwoman, compared to 5.3 in 1962.
11. According to the definitions of the Department of Census and Statistics, thepopulation of Sri Lanka is classified as predominantly rural (85 per cent in 2011),although agriculture represents only 32 per cent of total employment and 12 percent of the GDP (against 26 per cent in 1992).6 Agriculture in Sri Lanka has animportant export crop sub-sector, historically dominated by cash crop plantations(tea, rubber, coconut) but more recently including spices, fruits and vegetablesgrown by both large and smallholder farmers. With raising per capita income, thedomestic demand is increasing for higher-value products such as fruits andvegetables, meat, as well as dairy products.
12. Impressive poverty reduction, according to official statistics. In Sri Lanka,GDP grew at an annual average of 5.5 per cent between 1992 and 2002 and6.1 per cent between 2002 and 2012. With a GNI per capita of US$1,385 (2011),Sri Lanka has been recently classified as a middle-income country. Economicgrowth has contributed to the reduction of poverty prevalence: from 26.1 percent at the national level in 1991 (29.5 per cent in rural areas) to 8.9 per cent in2010 (9.4 per cent in rural areas). Most of this reduction has taken place since2002. In the four districts where DZLISPP has intervened, poverty prevalence isestimated (2010) at: 14.5 per cent (Monaragala), 13.3 per cent (Badulla),11.7 per cent (Kurunegala), and 5.7 per cent (Anhuradhapura), an impressivereduction since the time of project design.7
13. Increasing inequalities and child malnutrition is still a problem. Duringthe above period, inequalities have initially increased (the Gini coefficient at thenational level was 0.325 in 1991 and had reached 0.403 in 2007) and thenslightly reduced (Gini coefficient was 0.364 in 2010). Child malnutritionprevalence (low height-for-age) has reduced although at a less impressive rate.At the national level, it declined from 31 per cent in 1987 to 19.2 per cent (stillhigh) in 2009, with the highest prevalence in the districts of Nuwara Eliya andBadulla, 40.9 per cent and 23.9 per cent respectively.
14. Post-conflict rebound. The country’s development was marred by a 26-yearcivil war, fought between the Government and the Liberation Tigers of TamilEelam from 1983 to 2009. A ceasefire agreement was signed in 2002 (two yearsbefore the approval of DZLISPP). However, the country slipped back into conflictin 2005 (just before project start-up): the Government resumed militaryoperations which eventually led to the defeat of the Liberation Tigers of TamilEelam in 2009. In May 2010, the President of Sri Lanka Mahinda Rajapaksaestablished a Lessons Learnt and Reconciliation Commission.
15. The economy grew faster after the end of the conflict, also thanks to economicreforms. The business environment for the private sector has recently improved.The World Bank’s ranking of Sri Lanka for the ease of doing business shifted from96th place in 2012 to 85th in 2013 and Sri Lanka is considered as the bestperformer in the South Asia region in this domain.
16. At the time of project design, agricultural strategies emphasised foodsecurity and small-scale agriculture. When DZLISPP was designed (2003-2004), the main reference for development was the Poverty Reduction Strategyof 2002. Elaborated at the time of the cease-fire, this strategy contained a
6 The data quoted in this section are drawn from the 2012 World Population Datasheet of the Population ReferenceBureau, the World Bank Development Indicators database (retrieved in June 2013) and the 2013 UNDP HumanDevelopment Report).7 When the project was designed (2003-2004), the latest official statistics available were those of 2002 and reported thefollowing poverty prevalence: Monaragala (37.2 per cent), Badulla (37.3 per cent), Kurunegala (25.4 per cent), andAnuradhapura (20.4 per cent).

Appendix EC 2013/81/W.P.4
7
Appendix I
EC 2013/81/W
.P.4
reconstruction agenda to foster development and social harmony by negotiatinga political settlement to the conflict and expediting development in the war-tornareas. In terms of agriculture, the main priority was to improve farmproductivity, raise farm incomes, and ensure supplies of food at affordableprices. Support to small-scale agriculture was considered important for reducingpoverty in rural areas.
17. Current agricultural strategies emphasize the modernization of thesector, with a diminished interest for small-scale agriculture. TheGovernment has elaborated the Mahinda Chintana Vision for the period 2010-20168 establishing the following priorities for the agriculture and rural sector:(i) intensification of agricultural production (large-scale irrigation, higher qualityseeds and planting material); (ii) diversification from paddy to higher valuecrops; (iii) support to the plantation economy; (iv) expansion of ruralinfrastructure (roads, electricity and telecommunications). Special emphasis isgiven to livestock production and dairy sector (the objective is to become fullyself-sufficient in milk production by 2020).
18. The above national strategies reflect the transition of Sri Lanka to a middle-income status, with increasing demand for higher quality agricultural and dairyproducts as well as meat, and where the priorities gradually shift from foodsecurity to food quality and safety. Mahinda Chintana displays less interest forsmall-holder agriculture. Yet, as discussed in this report, support to smallholderagriculture is not necessarily at odds with agricultural sector modernization.
19. Land tenure. In Sri Lanka, in 1972 a land reform imposed ceilings of 50 acres ofplantation land and 25 acres of paddy land for each family member above18 years old. Within four years 563,400 acres of land were alienated andredistributed primarily to small-holders using the “Land Development Ordinance”instrument. Land was allotted on perpetual leases, based on a stipulated purpose(type of cultivation): it could not be mortgaged nor sold without governmentapproval. In 1975 all estate lands owned by public stock companies werenationalised. The Government enacted land re-privatization programmes at theend of the 1990s.
20. Instruments such as the Land Development Ordinance have served the purposeof land redistribution but posed constraints to land re-alienation and lease thathave been difficult to enforce (giving way to informal leasing and sale markets).At the same time, they have burdened agricultural land development. Other well-known land tenure issues in Sri Lanka include poor land recording (allcompounded by a heavily centralised administration with the LandCommissioner’s Department), with uncertain boundaries, and unclear nature ofthe tenure rights that landholders have over a particular parcel of land. All thisgenerates issues of land dispute.9 Among the consequence of the internal armedconflicts were about 300 000 internally displaced people. A resettlement processstarted in 2010, involving massive humanitarian operations to build shelters forreturnees, facing problems of land demarcation (destroyed landmarks such asfences, trees, buildings), and mine contamination restricting access to land.
Key project information21. IFAD’s first loan for Sri Lanka, approved in April 1978, was also the first loan
ever approved by IFAD. Since then, Sri Lanka received 16 loans for a total
8 Overall goals of the Mahinda Chintana are: (i) doubling per capita incomes between 2009 and 2016; (ii) shifting theeconomy to be more knowledge-based, globally integrated and competitive, environmentally friendly, internally integratedand increasingly urban; (iii) ensuring improved living standards and social inclusion.9 Under the Mahinda Chintana, a new programme for digital land titling registration is planned to be completed by 2025.See also A.B.Quizon 2013. Land Governance in Asia: Understanding the debates on land tenure rights and land reformsin the Asian context. Framing the Debate Series, no.3 International Land Coalition, Rome. See also Land Watch Asia(2011). Land Ownership and the Journey to Self Determination. Sri Lanka County Paper

Appendix EC 2013/81/W.P.4
8
Appendix I
EC 2013/81/W
.P.4
cumulated value of US$217.6 million and total project costs of US$402.0 million.DZLISPP was IFAD’s eleventh loan to Sri Lanka. It was approved by theExecutive Board in September 2004. It became effective in December 2005 andwas completed in March 2013. The design foresaw a total cost ofUS$30.40 million, to be financed by IFAD (a loan of US$21.97 million, and agrant of US$0.34 for policy work on land tenure)10, the Government of Sri Lanka(US$1.7 million) and beneficiaries (US$1.7 million).
22. Total cofinancing of US$5.5 million was also expected, of which US$1.5 millionfrom the United Nations Development Programme (UNDP) and the remainderfrom the World Food Programme, the Japan Bank for International Cooperation,and the Canadian International Development Agency. While collaboration withUNDP materialized, the other organizations either financed an entirely separateprogramme or withdrew from cofinancing due to a shift of emphasis fromfinancing discrete agricultural development programmes to supporting sectoralstrategies and policymaking. The actual total programme cost was thereforeUS$27.24 million, with the reduction in cofinancing mainly affecting thecommunity infrastructure component.
23. The project was implemented by the Ministry of Agriculture. At the time of itscompletion, DZLISPP was the only project implemented by this Ministry to befinanced by international cooperation. Given the evolving institutionalconfiguration in Sri Lanka, the line agencies of several other Ministries wereinvolved in the implementation of the project as well, such as: the Ministry ofEconomic Development (Department of Agrarian Development), Ministry ofMinor Export Crops Promotion (Department of Export Agriculture), Ministry ofLivestock and Rural Community Development (Department of Animal Productionand Health) and the Ministry of Land.
24. The project was managed by a National project management unit and fourDistrict programme management units, responsible for the day-to-dayimplementation in their districts, according to the approved annual workprogramme and budgets. This relatively large structure was justified by thenovelty of the approaches promoted by the project as well as by the limitedresources and capacity of local government extension agencies and explains therelatively high implementation costs (see below).
25. The programme targeted 80,000 households in four districts (Monaragala,Badulla, Kurunegala, Anhuradhapura) and included the following components:(i) support to rain-fed upland agricultural and livestock development throughfarmer field schools (10 per cent of programme costs);(ii) small-scale irrigationrehabilitation (15 per cent); (iii) marketing and enterprise development (13 percent); (iv) microfinance and income-generating activities (12 per cent);community infrastructure development (27 per cent); and programmemanagement (22 per cent). The World Bank supervised the programme but didnot provide cofinancing.
26. In Sri Lanka, the definition of “dry zone” is below 1800mm of rain per year, ofwhich about 70 per cent during the Maha season from September to Februaryand about 30 per cent in the Yala season from March to June. This would beconsidered a favourable rainfall pattern in other parts of the world.
27. Targeting criteria. The project was to intervene in half of the GNDs in the fourdistricts (i.e. 1077 Grama Nilhadari). In the choice of the Grama Nilhadari, theproject would take into account a number of indicators: (i) housing conditions;(ii) level of income per person; (iii) percentage of the population receiving
10 The Government used the grant to commission policy work on land tenure to the Food and Agriculture Organization ofthe United Nations (a diagnostic survey, training and workshops for stakeholders, pilot studies on land alienation issues).

Appendix EC 2013/81/W.P.4
9
Appendix I
EC 2013/81/W
.P.4
Samurdhi support (a national programme for low-income households); (iv) areaof arable land per person; (v) percentage of arable land area under irrigation;(vi) distance to District Secretary Division capital; (vii) female literacy rate;(viii) primary school enrolment rate.
B. Project implementation status28. The main information sources for this section are the physical and financial project
Progress Report as of March 2013 and the Project Completion Report (PCR, August2013). The progress report contains exclusively tables of physical achievements andexpenditures on 44 pages, with a wealth of information that is however not alwayseasily understandable for outside readers (e.g. lack of units of measure and precisereferences). During the preparation of the impact survey, flaws in the accuracy werefound in the M&E databases maintained by the four district project managementunits (cases of double counting, inexact representation of activities in the projectsites, sometimes non-existing activities or outputs). Thus, the figures presented inthis section are to be interpreted with some caution.
29. By May 2013, the IFAD loan was disbursed to the extent of 98.8 per cent, theGovernment contribution at 86 per cent and the beneficiaries’ part at 100 per cent.The IFAD grant, which was used for the land tenure studies and related activities,stood at 67 per cent by March 2013. Back in June 2009, IFAD loan disbursement wasonly 23 per cent, and the Mid-term review of that date rated implementationprogress as only moderately satisfactory.11 This means that, since then, in termsfinancial performance, the project underwent a visible turnaround to reach the abovedisbursement status.
30. In March 2013, according to the progress report, the cumulative target populationattended by the project was close to 122 000 households, above the 80,000anticipated at design, again with some questions on M&E data accuracy and veracity.This figure does not include the beneficiaries of the community infrastructuredevelopment component with an additional 53,000 reported beneficiaries. However,multiple household counting across components is likely. Based on beneficiaryhouseholds attended, it is fair to say that physical progress, as reported by the citedMarch 2013 project progress report, is commensurate with cumulative expenditures.A more detailed analysis of achievements follows in the section covering theassessment of effectiveness.
31. Land tenure policy related activities started only in 2010 and finished in the secondhalf of 2012. It was decided that the IFAD grant of US$0.3 million would be awardedby the Ministry of Agriculture to FAO but, as explained in the aide-mémoire of the2009 mid-term review mission, the contracting procedure required a long time. FAOsub-contracted most of the work to international consultants and a nationalcompany. Initiatives included a survey, training sessions, pilot activities, and a studytour. FAO published a report on the status of land tenure in the project districts anda policy brief (both in 2012). It organized several training sessions in the four projectdistricts, in collaboration with the Land Ministry.12 Pilot activities included:(i) surveying and demarcation of reservations in 20 small irrigation tanks inKurunegala district; (ii) establishment of a Land Information Center in Monaragaladistrict area and a land alienation scheme under four small tanks rehabilitated underthe project in the same district; (iii) homestead survey and providing land titlesdeeds to 200 low income earning families in Badulla District. FAO also helpedorganize overseas study tours to study methods and techniques developed with thesupport of the Government of Australia and the World Bank. A policy workshop washeld in 2012 to expose the lesson learned.
11 DZLISPP. Aide Memoire, Mid Term Implementation Support Review Mission, Colombo, September 2009.12 Customised training modules were prepared for Divisional Secretaries, District Land Commissioners, Assistant LandCommissioners, and Assistant Divisional Secretariats, Colonization Officers, Program Assistants, Management AssistantsGrama Niladhari, community leaders of farmer’s societies and the opposition leaders of the respective local authorities.

Appendix EC 2013/81/W.P.4
10
Appendix I
EC 2013/81/W
.P.4
32. The above cited physical and financial project progress report as of March 2013provides details on the component-wise IFAD and Government allocations andexpenditures up to November 2012. The components with the comparatively lowestexpenditures are the land tenure related activities and the marketing and micro-enterprise promotion. As Table 1 implies, the expenditures for the former remainedbelow allocations, arguably because of its complicated set-up. In the case of themarketing and microenterprise promotion component, the originally foreseenforward sales contracts negotiations carried out by selected service providers did notsubstantiate into tangible marketing arrangements. The remaining componentsdisplay satisfactory allocation-expenditure patterns.Table 1Component-wise fund allocations and expenditures
Cumulative allocations and expenditures.up to November 2012 (Rupees million)
No Component Allocation Expenditure %
1 Upland agriculture 380 359 94%
2 Irrigation 488 453 93%
3 Community infrastructure 740 716 97%
4 Microfinance 275 274 97%
5 Marketing andmicroenterprise. 320 231 72%
6 Project management 686 604 88%
7 Land tenure 42 28 66%
Total 2,891 2,665 92%Source: DZLSPP, Physical and financial project progress, March 2013
C. Project performanceRelevance of the objectives
33. The first question to examine is whether the design of DZLSPP was pro-poor. Thechoice of the 1,077 Grama Nilhadari Divisions (GNDs) where the project was tointervene (according to the M&E data, the project actually intervened in 1,648 GNDs)was made using poverty-relevant criteria. Observations from the qualitative andquantitative survey confirm that the project gave priority to disadvantagedcommunities (see under “impact”). On the other hand, findings from the qualitativesurvey suggest that parts of the project area belong to an “intermediate zone” ratherthan to the dry zone proper and benefit from higher rainfall.13
34. Coherence with the 2002 country strategy and gradual adaptation to achanging country context. Project design was coherent with country policies andIFAD strategies. Sri Lanka’s 2002 Poverty Reduction Strategy included infrastructurebuilding and improving market linkages for poor rural populations. In IFAD’s 2003COSOP, the dry zone of the country was the first priority. The evaluation noted theproject’s adaptation capacity. Originally meant as a project for subsistenceagriculture and food security, DZLSPP continued to support paddy production butgradually aligned itself to changes in the country context, i.e. the transition: (i) from
13 e.g. large portions of the Badulla District, the District Secretary Divisions to the south of Kurunagala District and theDistrict Secretary Divisions of Madulla in Monaragala District.

Appendix EC 2013/81/W.P.4
11
Appendix I
EC 2013/81/W
.P.4
low to middle income; (ii) from cease-fire to conflict (after 2005) and finally (after2009) to post-conflict. Indeed, the project added initiatives related to:14
Higher-value crops and livestock products;
Linkages to processing and marketing channels within existing value chains(e.g. milk, fruits and vegetables) by reducing transaction costs; and
Facilitating farmer organizations’ access to the state-led multiplication system ofcertified seeds, which allowed value addition by poor households.
35. The qualitative field survey study findings confirm this assessment. Initially, theproject’s design was strongly skewed in favour of boosting production (input-orientated, training and infrastructure development). At a later stage (2010-2012)the project made an effort to emphasise marketing and boosted support to dairyfarming which was not initially contemplated as a major focus area. At present,government departments are increasingly focusing on post-harvest assistance, valuechain development and value addition, expanding markets and developing marketlinkages.
36. Generally sound design with some weaker points. In general terms, thecomponent mix as designed was adequate. It made sense to include both irrigatedand upland agriculture and to include livestock, especially dairy, into the latter. Theadopted extension approaches, the Farmer Field Schools (FFS) favour direct testingand innovation.15 The project adapted them with equipment funding, the set-up ofrevolving funds, the creation of FFS societies and federations. Given the prevailingpoverty levels at appraisal, the inclusion of a community infrastructure developmentcomponent was pertinent.
37. Some components were less well designed, for instance:
a. In the marketing and enterprise development component, the project expected toset up a system of forward sale contracts as a tool to reduce risks related to thevolatility of prices. This was a difficult task and the service providers selected forthis task were companies devoid of previous experience and of the “right”connections to private processors/buyers and their performance was dismal.Through a turn-around decision, the project opted to facilitate the set-up ofvegetables and fruits collection centres operated by private companies (e.g.Cargills). This proved to be a simpler and safer path to agricultural producemarketing.
b. The microfinance and income-generating component was based on subsidisedinterest rates. This is not enticing for participating banks and often not necessary(e.g. there are good returns from dairy farming to make commercial ratesviable16) and created problems of credit rationing. This was also not in line withthe IFAD Rural Finance Policy of 2000.
38. As in many IFAD logframes formulated in the first years of the last decennium, theresults chain, especially at purpose and goal level, lacked clarity and sustenance by
14 This shift occurred without an explicit reorientation provided by the MTR but was rather an expression of a fresh look atopportunities by a new project management team after the MTR.15 Farmer Field School, first tested in Indonesia for integrated pest management in the 1980s emphasises "horizontalinformation and learning exchanges” between farmers, facilitated by extension workers in a colloquial and collegialsetting. The farmers play an active role in initiating discussion and action, thereby ensuring that their priority issues will beaddressed. After discussing indigenous agricultural practices and identifying what works and what does not, they engagein practical demonstrations. Constraints and opportunities are identified by the FFS members themselves, becoming aplatform for practical hands-on learning. While widespread, the FFS model also received critiques, probably becauseresults are context-specific. See K. Davis et al (2010), Impact of Farmers Field School on Agricultural Productivity andPoverty in East Africa. IFPRI. Feder, G, Murgai, R and Quizon, J.B. 2004. Review of Agricultural Economics, 26(1), 45-62.16 For the Baghya loan category, unsubsidised monthly interest rates have been estimated in a range of LKR 375 to 1 500LKR for selected activities ranging from handicraft to dairy farming, against reported monthly net revenues of 2,000 to4,000 LKR excluding the payment of interests.

Appendix EC 2013/81/W.P.4
12
Appendix I
EC 2013/81/W
.P.4
pertinent indicators. Poverty, income and asset indicators appear on both levels, andout of the 51 indicators, only three had some form of magnitude, but none was time-bound. As such, the logframe was an un-prioritized list of indicators to be measuredby the project rather than a helpful guidance for project monitoring and evaluation.Despite these flaws, project design was flexible enough to operate the observed shiftto serve existing and emerging value chains.
39. Weighing the overwhelmingly positive factors against some odds in the design of theproject, relevance is rated as satisfactory.
Effectiveness40. Impressive outreach of farmers’ field schools, although quality was not
always at par with quantity. Can the general objective (purpose) be consideredachieved, i.e. “to put in place a mechanism to mobilize resources and servicessustainably to increase production and add value to produce in the dry zones”?Despite the observed accuracy issues of M&E data, the answer can be in theaffirmative. DZLSPP recorded a substantial outreach, of 120,000 households orabove compared to the 80,000 households target at appraisal (although the alreadynoted caveat on data accuracy applies). Out of a target of 2,800 Farmer FieldSchools, 2,535 are reported to have been set up.
41. In promoting the farmer field school approach, the project was to operate throughthe Agricultural Instructors of the Agrarian Service Department (later theDepartment of Agriculture) who would receive training in FFS and implement theapproach. The limited resources and capacity of the line agencies were a seriousconstraint to project implementation in the first three years. The turn-arounddecision by the project management was to recruit agriculture diploma holders, astechnical assistants for field-level project extension activities, paid for through theproject’s budget.
42. In quantitative terms, results were impressive but qualifications can be made on thequality of work and present status of operation of these FFS. A HARTI study, basedon a random sample, warns that only about 50 per cent of the crop FFS have anoperational status of moderately satisfactory and above and three quarters have lowperspective of continuation after project closure. It can also be questioned whethersocieties of 20 members or less can be viable with limited external support. On theother hand, the formation of divisional and district FFS federations, which the projecthas undertaken, may add some stability to these organisations.
43. The FFS model chosen by DZLSPP presents four main modifications to the prototypemodel, namely: (i) the FFS society, (ii) the program facilitator, (iii) the revolvingfund; (iv) technology transfer. Some concepts of the prototype FFS model have beenomitted: common field and curriculum. Findings from the available documentationand the field observations of this evaluation’s mission suggest that the project wasinnovative in implementing the FFS activities but further coaching and follow-upsupport would be required to maintain focus and momentum, given the still fragileoperational status of half of the FFS. The HARTI study praises the emphasis of FFS inbuilding upon farmers’ experience and skills (less weight on lecture and more onfarmers’ initiatives) but critiques the omission of the curriculum component arguingthat some element of standard training is necessary even in a participatoryenvironment.
44. More concretely, did DZLSPP set up mechanisms to increase production and addvalue to produce in the dry zones? To answer this question, the five immediateobjectives will be reviewed.17 The first immediate objective reads: Rain-fed uplandfarm productivity increased and integrated with livestock production systems. As the
17 IFAD. Report and Recommendation of the President to the Executive Board on Proposed Financial Assistance to theDemocratic Socialist Republic of Sri Lanka for the Dry Zone Livelihood Support and Partnership Programme, Rome,September 2004.

Appendix EC 2013/81/W.P.4
13
Appendix I
EC 2013/81/W
.P.4
preceding paragraph infers, most of the quantitative and qualitative achievementsunder this immediate objective have been generated through FFS. The projectdocumentation, based reportedly on a sample of 12 000 farmers, claims the resultspresented in Table 2.18
Table 2Most common crops and average yield increases
Anuradhapura District Maize OnionPulses w/o
cowpeas Seed paddy CowpeasNumber of farmers 3,591 2,229 1,635 625 527
Average yield increase % 26% 35% 15% 26% 10%
Kurunegala District Maize OnionPulses w/o
cowpeas Seed paddy Cowpeas
Number of farmers 773 149 250 304 250
Average yield increase % 36% 80% 44% 20% 44%
Badulla District Maize OnionPulses w/o
cowpeas Seed paddy Cowpeas
Number of farmers 1,366
Average yield increase % 30%
Monaragala District Maize OnionPulses w/o
cowpeas Seed paddy Cowpeas
Number of farmers 6,094 757 1041 883
Average yield increase % 22% 22% 10% 13%
All districts Maize OnionPulses w/o
cowpeas Seed paddy Cowpeas
Number of farmers 11,824 3,135 2,926 1,812 777Per farmer weighted averageyield increase % 25% 34% 16% 19% 21%
Source: DZLSPP, Physical and financial project progress, March 2013
45. Again, these figures are impressive. However, there are important caveats to theabove data: (i) it is not known precisely in which lapse of time this has beenachieved; (ii) it is not clear whether data have been obtained from a representativesample; (iii) there is no comparison with households or sites without project(attribution to the project is an open question). While some examples of yieldincrease of this type have been documented and observed during the evaluation fieldvisits, it is not obvious whether they can be generalised to the number of farmersquoted in Table 2. In fact, the impact survey invites treating the above data withcaution.
46. Regarding livestock development, initially not a major area of emphasis, DZLSPPsucceeded in integrating livestock production systems into dry land farming. Thecited project status report indicates that, cumulatively, 10,300 dairy farminghouseholds have been supported via 634 Dairy Farmers Field Schools. As observedin the HARTI study on dairy production, there was a decrease in the total number ofcattle owned by farmers but an increase in the productive cattle units (cows andheifers for milk production), confirmed by this evaluation’s survey. So the projectcontributed to the beginning of a rationalisation of cattle management, where cattleis valued less as status symbol and more for its productivity, although much remainsto be done.19 The single most important measure in this context was to build milkcollection centres in the project area and to encourage public and private milkcollecting firms to install milk coolers and to establish a daily milk collection routine.Milk price is in the range of 50 LKR/litre in Sri Lanka (high demand for dairy products
18 In Badulla District where there are four other main crops reported (ginger, potato seed, banana and chilies), theincreases are all between 23 and 45 per cent, thus in comparable ranges for a total of 7 000 additional farmers.19 HARTI reports household milk production increase of 32 per cent: HARTI. DZLSPP, Impact of Dairy DevelopmentProgramme, Paper 05, Colombo, 2012.

Appendix EC 2013/81/W.P.4
14
Appendix I
EC 2013/81/W
.P.4
in a middle income-country). Such levels are in the range of farm gate milk prices inthe European Union.
47. The second immediate objective of DLZSPP states that irrigation infrastructure isrehabilitated and operated. A total of 708 schemes were rehabilitated (373 tanks and334 small water conveyance systems; so-called anicuts). Close to 7,900 ha ofirrigated land were rehabilitated (against a target 6,600 ha) of which 3,362 ha areincremental area. This corresponds with the additionally irrigated areas in the mainand secondary seasons (Maha and Yala, respectively) plus a third irrigation seasonon 332 ha, which applies only to Badulla District. In total, the irrigation developmentcomponent benefitted 17,250 households.
48. A dedicated HARTI study20 in relation with the small-scale irrigation componentconfirms that the irrigation rehabilitation works undertaken in all the selectedschemes are overall good in quality from an engineering point of view. However,water user associations in the majority of the areas are relatively weak and asper the indicators developed by the study. Thus, the longevity of the rehabilitationsmay be at stake.
49. The third immediate objective of DZLSPP focused on expanded marketingopportunities and micro-enterprises developed. At design, it was planned toimplement two instruments to add value to produce: forward sales contracts andinventory credit schemes. As explained, the planned forward sales contracts to benegotiated by selected service providers was not a successful attempt because theproviders did not have the required insight into the existing agricultural producemarketing channels. The inventory credit schemes did not substantiate either.
50. Instead, the project opted for establishing interfaces between buyers andproducers in concert with private firms, e.g. Cargills, Nestle and Milco, which gotaccess to produce in 791 collecting or processing centres (with cofinancing from theproject and from private companies). The case of two major vegetable collectioncentres in Monaragala and Badulla Districts is well documented.21 Both centres serveseveral hundred vegetable producers each. On average, the producer prices paid byCargills are substantially higher than reference prices in nearby markets, in therange of 25 per cent. In most cases, the producers are paid the same day or within afew days. What the surveyed farmers also appreciate is the reduction of transportdistances and the availability to receive advice for production techniques and post-harvest handling of the produce.
51. The Micro-finance and micro-enterprise development component targets thefollowing: micro-finance services expanded and income generating activitiesundertaken with profit. It has raised great expectations with subsidised interest ratesunder two different schemes. The Bhagya scheme was implemented with theinvolvement of state and regional banks in the area and with supervision andprovision of refinance facilities by the Central Bank of Sri Lanka. The Bhagya schemeprovided 4,651 loans at 10 per cent per annum interest rate and displayed anaverage recovery record of around 90 per cent.22
52. The second scheme, Apeksha, was pre-existing and operated by the Women’sBureau (WB). DZLSPP simply opted in under the micro-finance and micro-enterprisecomponent. Under Apeksha, 2,714 loans have been issued in total at 6 per centannual interest rate. More than 8,000 women are on the waiting list in MonaragalaDistrict alone where 887 women have been served too date. Both schemes have
20 HARTI, M.M.M. Aheeyar and M.A.C.S. Bandara. Impact of Small Scale Irrigation Rehabilitation and Water Managementunder Dry Zone Livelihood Support and Partnership Programme (DZLSPP), Colombo, August 201321 HARTI, R.P. Vidanapathirana and W.H.D. Priyadarshana. Vegetable Collection Centres in Badulla and MoneragalaDistricts: Impacts & Lessons, Colombo, September 2012.22 HARTI, J.K.M.D. Chandrasiri and R.L.N. Jayatissa. Impacts and Lessons of Microfinance Component of the Dry ZoneLivelihood Support and Partnership Programme, Colombo, October 2012

Appendix EC 2013/81/W.P.4
15
Appendix I
EC 2013/81/W
.P.4
been less effective than the land-based components, foremost because of their lowrespective coverage.
53. The fifth component of DLSPP pursued the immediate objective of realising prioritycommunity infrastructure and assuring use to effect. The inclusion of such acomponent was relevant, because the GNDs selected by the project were inrelatively secluded areas. An additional argument is the difficult topography in someproject area, especially in Badulla District. Even short, but safe, roadcommunications are important for a village community (e.g. access to school,markets).23 In total, the project facilitated the construction of about 740 km of suchaccess roads, 120 community buildings and 113 drinking water supply schemes.Besides providing access for the marketing of produce, roads and drinking watersupplies are likely to have an incidence on health and education.
54. Taking into account the achievements and the qualification made on the accuracy offigures and quality of selected interventions, DZLSPP has shown a satisfactory levelof effectiveness in achieving its main objectives. This evaluation has identifiedsustainability issues24 but treats them in a dedicated section in the remainder of thereport.
Efficiency55. Project management efficiency. As in many IFAD supported projects,
implementation was sluggish during the first three years, with a 23 per cent IFADdisbursement rate after 43 months.25 As noted, this delay was largely made up untilMarch 2013, the original project completion date. This is an indication of the capacityof project management to operate a successful turnaround as well as of thecontribution of the mid-term review to improving implementation performance. Thepart of project management cost was 22 per cent at appraisal, and remained at thatlevel over project life. This proportion is high but observed also in other IFAD fundedprojects attending a relatively scattered target population.26 This cost proportionresponded to the need to reinforce local support teams, anticipating that the existingline agencies may not have had sufficient resources and experience.
56. Efficiency of activities and results. The PCR calculates economic internal rates ofreturn for the main project components (upland agriculture 23.9 per cent, irrigationinfrastructure 16.5 per cent, community infrastructure development 17.0 per centand micro finance and enterprise development 23.3 per cent) and computes anaggregated internal rate of return of 19.6 per cent, compared to 17.4 per cent atappraisal. This is a high value although the calculation relies on project M&E data onnumber of beneficiaries and yields which are to be taken with caution.
57. A HARTI study on irrigation also attempts the calculation of economic internal ratesof return based on a sample of 35 rehabilitated schemes. It finds that 25 schemeshave positive rates of return (with district averages ranging from 18 to 79 per cent),while ten have negative or undetermined returns. However, a rapid inspection ofcash flow assumptions used to calculate rates of return suggests that maintenancecosts have been seriously under-estimated or ignored.
58. Other project documents present estimates of very high returns on specific crops(e.g. estimates of incremental profits of 150 per cent or more for seed potato or bigonions against the pre-project baseline). This evaluation notes that many crops and
23 According to the president of the road maintenance committee in a village visited by this evaluation’s mission, thechildren were unable to go to school on heavy monsoon days because the footpath was too dangerous before the project.DZLSPP invested LKR 700 000 for 45 families, with a village contribution of KLR 100 000.24 The original definition of the overall project objectives contained the adverb “sustainably” (see at the beginning of theeffectiveness section). However, IFAD evaluation methodology considers sustainability as a separate criterion.25 DZLISPP. Aide Memoire, Mid Term Implementation Support Review Mission, Colombo, September 200926 IFAD. Eastern Republic of Uruguay, Uruguay Rural Project Performance Assessment, Rome, 2013. See also IFAD.Republic of Nicaragua, Programme for the Economic Development of the Dry Region in Nicaragua, Project CompletionReport Validation (PCRV), Rome, 2012.

Appendix EC 2013/81/W.P.4
16
Appendix I
EC 2013/81/W
.P.4
activities have potential for high return. However, impact survey findings suggestthat potential has translated into reality only to a limited extent and that adoptionrates have been progressing at a slower pace compared to M&E data. With theproject’s completion in March 2013, it is unlikely that the pace will increase.
59. This evaluation also notes that subsidised credit (Bhaghya loans and Apekshascheme) is not an efficient use of resources. It leads to credit rationing for activitiesthat are profitable (e.g. dairy farming).
60. Finally, a consideration for the future: from a strategic perspective, projects likeDZLISPP are seminal interventions and require systematic follow up to ensure thatnew techniques and practices are adopted by a relatively large number ofbeneficiaries. It would be very inefficient not to finance a second project phase. Itwould amount to wasting experience, human capital (e.g. dynamic project teams),know-how, and risking a reduction in the future stream of benefits (see also thesection of sustainability).
61. In sum, given quality issues with M&E data, and some disconnects with theobservations made by the impact survey, it is appropriate to assess efficiency in the“positive zone” but as moderately satisfactory.
D. Rural poverty impactMethodological issues
62. The present section seeks to triangulate evidence from different sources,including secondary ones (project M&E data, PCR, HARTI studies), as well as primarydata from the qualitative and quantitative survey conducted in April-June 2013, andfield observations made during the May 2013 mission. One of the fundamentalconstraints to this evaluation is the absence of a baseline dataset (as in many otherIFAD projects). The project conducted a baseline survey in 2006, including bothproject and comparison households. Quite surprisingly, the electronic dataset hasbeen lost and this may have happened at the time of the change in the projectmanagement team (2008-2009).
63. Project secondary sources as well as existing administrative statistics provideinteresting information on the project area context but not of the type, quality anddisaggregation that would be suitable for an impact assessment. For this reason, thequantitative component of the survey adopted two strategies. On one hand itattempted to reconstruct selected baseline information through recall methods.27
While there are threats to recall methods, a mitigation path was to limit recall toitems that could be more easily remembered (e.g. the presence of certain physicalassets in the house or farm).28 Moreover, the time of the project start-up (2005)coincided with the time of the resumption of conflicts in the country, so that it waspossible to anchor the recall to known events.
64. Quasi-experimental design approach. On the other hand, and more importantly,the quantitative survey adopted “propensity score matching”, an analyticaltechnique that does not strictly require baseline data.29 Propensity score matching
27 Recall methods consist of asking questions about the past, for example whether a household owned certain agriculturalimplements five years before the interview. Typical problems with recall methods include telescoping” (i.e. projecting anevent backwards or forwards in time from when it actually occurred).28 Challenges of recall methods include: (i) incorrect recollection and (ii) telescoping, i.e. projecting an event backward orforward. For example, the purchase of a durable good which took place seven years ago (before the project started)might be projected to a point in time just four years ago, during project implementation. It is often useful to anchor therecall method to major events that took place in a community.29 Propensity score matching is a statistical procedure that mimics random assignment. Given a treatment and acomparison group, the procedure works in two steps. First, it calculates for all units (both in treatment and comparisongroups) the probability to receive the treatment (based on a set of observable characteristics that are unlikely to beaffected by the treatment). Second, it compares outcome indicators between treatment and comparison units that have avery close propensity score. This ensures that differences in outcome indicators are assessed on a sub-group of unitsthat are comparable according to a set of observable characteristics. According to the available literature, one of therecognized advantages of this procedure is its adoptability when baseline data are not available. An obvious limitation is

Appendix EC 2013/81/W.P.4
17
Appendix I
EC 2013/81/W
.P.4
can be used to pair a subset of households with and without project interventionaccording to a set of observable characteristics that are not likely to have beenaffected by the project.30 This is particularly important at IFAD where projects focuson disadvantaged regions and communities and sometimes disadvantages groups orcategories within those communities. Controlling for targeting bias is a majorchallenge. While propensity score matching is widely used, this technique also haslimitations. The most obvious one is that the pairing of households with and withoutproject can only be done based on “observable” characteristics. If households withand without project differ on other essential characteristics that are not captured bythe survey or the statistical model, then the results may still be biased.
65. To test the consistency and robustness of results, the evaluation also applied analternative technique: the “treatment effect model”, a derivative of the Heckmansample selection technique. The treatment effect model is useful in producingimproved estimates when data were generated by a non-randomized experiment,and thus selection bias is non-ignorable. 31
66. As presented in Table 3, the quantitative survey covered 2,567 households, of which1,302 in Grama Nilhadaris Divisions (GNDs) covered by the project (generaltreatment households) and 1,265 in comparison GNDs. This involved 160 GNDs,through a multi-stage cluster random sampling. Within treatment GNDs, the surveyfurther distinguished between direct beneficiaries households and other householdsthat did not receive project interventions (they might be considered as indirectbeneficiaries). In addition, based on the number of intervention packages received,the survey established a sub-sample of high-intensity of interventions (six or more).Further information on the sampling strategy is in the annexes.Table 3Numbers of Treatment and Comparison Households Surveyed
District
Total Number ofHouseholds
SurveyedNum.
comparison hhNumber General
Treatment hhNum. Direct
Beneficiaries hh (%)Num. hh with Intense
Treatment (%)
Anuradhapura 1029 509 520278
(53.5%)32
(6.2%)
Kurunegala 514 259 255177
(69.4%)32
(12.6%)
Badulla 767 368 399273
(68.4%t)160
(40.1%)
Monaragala 257 129 128106
(82.81%)113
(88.3%)
Sum 2567 1265 1302834
(64.1%)337
(25.9%)Source: IOE Impact Survey 2013
67. The quantitative analysis has been conducted according to four analytical paths bycomparing: (i) households in treatment (i.e. with project) communities againsthousehold in non-treatment (i.e. without project) communities; (ii) direct
that matching can only be done on “observable” characteristics but not on other characteristics. For an introductorydiscussion to this method, see Gertler et al. (2011), Impact Evaluation in Practice, The World Bank, Washington DC. Fora more advanced treatment see the classical article by Rosenbaum P., Rubin D. (1983), “The Central Role of thePropensity Score in Observational Studies for Causal Effects”, Biometrika, 70, pp. 41-50.30 For examples of applications by IFIs, see Asian Development Bank Impact Evaluation of the Community GroundwaterIrrigation Sector Project in Nepal; Impact of Rural Water Supply and Sanitation in Punjab, Pakistan; Impact of the AsianDevelopment Bank’s Assistance for Low-Income Housing Finance in Sri Lanka; Impact of Microfinance on RuralHouseholds in The Philippines.31 The Heckman sample selection also works in two steps. The first step, similar to propensity score matching, consists inestimating the conditional probability of participation. In the second step, the conditional probability of participation isinserted in a regression equation, together with other variables (it requires a specific functional form), see Guo and Fraser2009. The “correct” functional form is rarely known but sensitivity analysis can help compare different functional forms.

Appendix EC 2013/81/W.P.4
18
Appendix I
EC 2013/81/W
.P.4
beneficiaries against households in non-treatment communities; (iii) households inhigh intensity treatment communities against households in non-treatmentcommunities; and (iv) direct beneficiaries households against non-beneficiaryhouseholds within the same treatment community (Table 4).Table 4Different types of treatment in the quantitative surveyTreatmentType Treatment Population
Number inTreatment
ComparisonPopulation
Number inComparison
A. GeneralTreatment
Households incommunities where
there was anintervention. 1,302
Households in communitieswith no intervention
(comparison). 1,265
B. DirectTreatment
Households that directlyparticipated (Direct
Beneficiaries). 856
Households in communitieswith no intervention
(comparison). 1,245
C. IntenseTreatment
Households incommunities that receive
between seven andtwelve interventions. 337
Households in communitieswith no intervention
(comparison). 1265
D. Directversus IndirectBeneficiaries
Households that directlyparticipated (Direct
Beneficiaries). 856
Non-beneficiary households indirect treatment communities
(indirect beneficiaries). 446Source: IOE Survey 2013
68. In addition, as a further means of validation and in order to cover less standardizableaspects (e.g., human and social capital, gender equality, policy issues), IOEconducted a qualitative survey including 30 key informant interviews with projectstaff, relevant government officers32 and 41 focus group discussions withbeneficiaries in the four project district (Table 5). Selection of the sites was donerandomly in each district, taking into account the need to represent different projectcomponents. Finally, IOE conducted a validation mission that included field visits inlate May 2013.Table 5Number of key informant interviews and focus group discussions undertaken in the context of thequalitative survey
District Key Informant InterviewsCommunity focus group discussions (one
per Grama Nilhadari Division)
Anuradhapura 4 17
Kurunagala 9 9
Badulla 7 11
Monaragala 10 4
Sum 30 41Source: IOE Impact Survey 2013
69. There were several challenges to the conduct of the survey. First, as already noted,the multi-component nature of the project complicates the result chain. In fact, thereal problem was not just the number of component but the high diversity andscattering of interventions within certain components (notably for FFS) and it wasvery difficult to establish a group of core intervention packages that would yield asufficient number of observations for the quantitative survey. While creatingdedicated modules in the survey for sub-component was contemplated, this provedimpractical during the questionnaire pre-testing. Triangulating with other sources
32 e.g., Department of Agriculture, Department of Agrarian Development, Department of Animal Health and Productionand the Women’s Bureau.

Appendix EC 2013/81/W.P.4
19
Appendix I
EC 2013/81/W
.P.4
(qualitative survey, thematic studies, direct field observations) proved to be moreinformative. Second, there were several imprecisions in the project household listswhich required accurate work at the field data collection level.
70. There is thus a relatively wide corpus of evidence on DZLISPP. It should be noted,however, that there are inconsistencies between findings from difference sources.Several secondary sources (notably, project M&E data, reflected in the PCR) are notbased on random sampling techniques nor do they compare with households orcommunities without project. This poses the threats of: (i) representativeness ofdata; and (ii) attribution of results to the project. The second point is crucial in SriLanka, a country that has experienced high economic growth and poverty prevalencereduction in the past decade. Observed changes may well depend on the projectactivities but may also be related to the burgeoning economy of Sri Lanka.
Targeting71. The project targeted communities that had lower access to basic
infrastructure. As explained in the introductory section, the project was supposedto target GNDs according to a list of criteria. During the evaluation interviews,project district staff explained that they selected communities that were moregeographically secluded and disadvantaged in terms of social services. Data from thequantitative survey support these claims and suggest that treatment communitieshad lower access to basic infrastructure. It is important to note that the surveyfocused on infrastructure not built by the project and that was in place before theproject start-up.33
72. As a first step in propensity score matching, the analysis considered communityfactors affecting the probability of being served by the project. It was found thatcommunities that are further away from their DSD capital were more likely to beserved by the project.34 Finally, communities with less access to basic infrastructurebefore the project start-up (calculated through a principal-component based index)35
were more likely to receive project assistance (Table 6).
73. Within the selected communities, the project tended to target householdsthat owned fewer assets but had more diversified cropping patterns, andslightly higher educational status. Project field staff explained that, within theselected communities, households were selected (and sometimes self-selected)based on both their needs and their interest in specific training / extension schemesand their belonging to informal village groups. Interviews with district project staffyielded similar responses.
74. According to our modelling (Table 6), households covered by the project grew morecrops than comparison households but had a weaker asset base (an index has beenestablished through principal component analysis)36 and these differences arestatistically significant.37 Other significant characteristics pertain to householdeducation (positively correlated to project participation) and household head age(significantly and weakly negatively correlated to project participation). In the caseof the comparison between treatment and non-treatment households with the same
33 As an example, 58.8 per cent of the GNDs with project (treatment) had a primary school building, 37.1 per cent asecondary school building, 7.4 per cent a policy post and 7.4 per cent a community market, compared to 72.2 per cent,53.2 per cent, 19.2 per cent and 17.9 per cent in GNDs without project (comparison) respectively.34 It was also found that communities that are closer to the District capital were more likely to be served by the project,although this is less intuitive to explain.35 Principal component analysis is a technique to convert a set of correlated variables into a smaller set of non-correlatedones.36 Household surveys often include estimates of expenditures as more reliable than estimates of income, under theassumption that respondents find it less sensitive to answer questions on expenditures rather than sources and amountsof revenues and that responses would be more precise and reliable.37 More disaggregated analysis has shown similar results. Interestingly, direct beneficiaries within treatment communitiesand intense treatment households appear to have wider disadvantages in household asset index (for example, television,electric fan, refrigerator, gas cooker).

Appendix EC 2013/81/W.P.4
20
Appendix I
EC 2013/81/W
.P.4
GND (last column of Table 6), the above observations on assets and education stillhold. In addition, the number of children under age five appears to (negatively)affect the likelihood of participating in the project, probably reflecting timeconstraints of household members (and possibly a negative correlation betweeneducational status and number of children).Table 6Probit Estimates for Participation in the Program
Characteristics General TreatmentDirect
BeneficiariesIntense
Treatment
Direct vs.Indirect
Treatment
Distance to DSD Capital 0.279*** 0.406*** 0.624***
(0.074) (0.079) (0.101)
Distance to the District capital -0.171*** -0.183*** -0.388***
(0.039) (0.044) (0.061)
2006 Community Infrastructure Index -0.080*** -0.052*** -0.029
(0.016) (0.018) (0.024)
Household Head Age -0.007*** -0.006*** -0.007*** 0.007**
(0.002) (0.002) (0.003) (0.003)
Household Head Sex 0.033 -0.032 -0.157 -0.181
(0.090) (0.104) (0.142) (0.130)
Household Highest Education 0.075*** 0.064** 0.025
(0.029) (0.032) (0.041)
2006 Asset Index -0.040*** -0.044*** -0.069*** -0.042**
(0.014) (0.016) (0.022) (0.021)
2006 Total Crops 0.301*** 0.326*** 0.303*** 0.053
(0.027) (0.031) (0.040) (0.035)
2006 Livestock Index 0.031 0.036 -0.038 0.032
(0.023) (0.025) (0.043) (0.031)
Number of Children under Age 5 -0.151**
(0.074)
Household Head Education 0.135***
(0.038)
Constant 0.039 -0.309 -0.398 -0.183
(0.193) (0.216) (0.284) (0.257)
Observations 2,550 2,108 1,592 1,291
Pseudo R-square 0.0616 0.0674 0.0820 0.0156Note: Standard errors in parentheses*** p<0.01, ** p<0.05, * p<0.1
ImpactImpact on human and social capital and empowerment
75. As agricultural-related project activities were the mainstay of the project, one of thekey project interventions was the support to the diffusion of new crops (notablyhigher-value crops), improved techniques and skills. As already noted, extension andtraining was provided through the FFS approach. Table 7 presents a first indicationof participation rates in training programmes and some form of feedback on

Appendix EC 2013/81/W.P.4
21
Appendix I
EC 2013/81/W
.P.4
respondent’s perception of their own skills in crop and soil management. Data in thetable are those from statistical analysis after propensity score matching.
76. As expected, households in the treatment groups were both more likely thancomparison households to participate in agricultural training and in a larger averagenumber of training programmes. This is confirmed for the four analytical blocks. It isto be noted that comparison households also appear to participate in some sorts oftraining programmes, probably conducted by the provincial or district departmentswith their own funding or by NGOs (reportedly, no other internationally fundedprogramme of the type of DZLISPP was active in the evaluated period in theconcerned districts). The proportion of households reporting a member’sparticipation in a training activity hovers around half in the intensive and directtreatment group which may seem a relatively modest percentage. This might eitherindicate that either some DZLISPP interventions did not involve training or someactivities were not perceived as training (the FFS approach focuses on participatoryactivity and minimises the “lecture” framing).
77. The survey included questions on the degree of satisfaction with knowledge andskills in soil and crop management, a rather crude indicator. Scores are clustered atthe “middle point” (neutral) for both treatment and comparison groups, with asignificant and positive difference only for intensive treatment. Interestingly, one ofthe secondary sources, a thematic study conducted by HARTI showed that 46 percent of households considered knowledge received through training as adequate. Onthe other hand, satisfaction is subjective and context-specific. From secondary dataand qualitative survey, more information is available on specific areas.Table 7Agricultural Training Participation by Treatment Level – Propensity score matching
General Treatment Direct Beneficiaries
MatchingTreatment
MeanComparison
MeanT-stat of
difference MatchingTreatment
MeanComparison
MeanT-stat of
differenceHave any household members participated in any agriculture trainings since 2006? ? 0=No; 1= Yes
Unmatched 0.471 0.305 8.71*** Unmatched 0.517 0.305 9.99***
Matched0.471(1279)
0.363(1238) 5.28*** Matched
0.517(845)
0.371(1238) 6.32***
How many training programs?
Unmatched 1.530 0.848 7.93*** Unmatched 1.681 0.848 8.70***
Matched1.530(1265)
1.032(1241) 5.47*** Matched
1.681(842)
1.060(1241) 5.81***
What is your level of satisfaction with your knowledge and skills in relation to soil and crop management?(1 = unsatisfied, 2 = neutral, 3 = satisfied)
Unmatched 2.096 2.078 0.58 Unmatched 1.854 1.892 -0.94
Matched2.096(999)
2.083(682) 0.39 Matched
1.854(677)
1.856(678) -0.05

Appendix EC 2013/81/W.P.4
22
Appendix I
EC 2013/81/W
.P.4
Table 7 - continuedAgricultural Training Participation by Treatment Level – Propensity score matching
Intense Treatment Direct versus Indirect Treatment
MatchingTreatment
MeanComparison
MeanT-stat of
difference MatchingTreatment
MeanComparison
MeanT-stat of
differenceHave any household members participated in any agriculture trainings since 2006?
Unmatched 0.488 0.305 6.34*** Unmatched 0.517 0.383 4.57***
Matched0.488(334)
0.354(1238) 4.23*** Matched
0.517(845)
0.407(433) 3.70***
How many training programs?
Unmatched 1.707 0.848 6.76*** Unmatched 1.681 1.235 3.09***
Matched1.707(334)
0.999(1241) 4.33*** Matched
1.681(842)
1.328(422) 2.51**
What is your level of satisfaction with your knowledge and skills in relation to soil and crop management?(1 = unsatisfied, 2 = neutral, 3 = satisfied)
Unmatched 2.154 2.078 1.66* Unmatched 2.111 2.064 1.10
Matched2.154(259)
2.083(682) 1.51 Matched
2.111(685)
2.075(314) 0.83
Number of observations in parenthesesNote: Level of significance: *** p<0.01, ** p<0.05, * p<0.1Average Treatment Effect on the Treated - Kernel matching38
Source: IOE Impact Survey 2013
78. Exposure to new techniques, crops, enhanced confidence vis-à-vis publicagencies, private operators and banks. Project documentation and the ProgressCompletion Report find that DZLISPP beneficiaries acquired or strengthenedtechnical knowledge and skills and improved their self-esteem and this was observedfor both men and women. These findings are confirmed through the focus groupinterviews conducted within the qualitative survey.39 According to the latter, in thearea of crop cultivation, extension (mainly through FFS) focused on the use offertilizers and pesticides, introduction to new crop varieties such as turmeric andginger, post-harvest processing for cinnamon, and fruit trees (e.g. mango, papaya)and many others. In a few instances, more advanced technology was introducedthrough the Department of Agriculture, such as seed production for B-onions andhydroponics for potato tuber production (Badulla district).
79. In paddy cultivation, the extent of knowledge improvement was minor as farmerswere already well experienced. Instead the (re-)introduction of the role of“caretakers” (Jalapalaka) in the water users’ associations for small minor irrigationstanks, and the training of these individuals in tank maintenance and watermanagement aimed at diffusing good water management practices.
80. Regarding dairy production, according to the qualitative survey, the main project’scontribution was to promote basic knowledge on cattle sheds to keep cattle cool andclean, varieties and selection of dairy cows, cattle nutrition (including types of feeds,feeding regimes, and micro-nutrients), good practices in milking cows (to improvefat content of milk, fetching better prices), prevention of diseases (such as mastitis)and vaccinations; reproduction and fertility, including artificial insemination.
81. Within the Bhagya loan programme, beneficiaries received basic notions on financialmanagement and banking. More importantly, field observations point to increasedconfidence levels of beneficiaries in engaging with banks (previously seen withsuspicion). In the case of Apeksha loans, the DZLISPP intervention was an add-on toan existing government programme and it consisted of providing financing forrevolving funds without specific incremental training elements.
38 For easiness of presentation, this report only shows results of propensity score matching (average treatment effect onthe treated). Among the several matching algorithms, the kernel matching has been used but sensitivity of results hasbeen tested through other methods such as nearest neighbour, caliper, stratification matching, obtaining consistentresults.39 The results of focus group discussions have been coded according to: impact domain, project component, district andvillage. This has generated over 95 pages of interview summaries which is briefly summarised in this report.

Appendix EC 2013/81/W.P.4
23
Appendix I
EC 2013/81/W
.P.4
82. High diversification and scattering of activities. Two qualifications need to bemade to the significant results reported. First, the qualitative survey showed that theextension activities were highly diversified and scattered: this was not evident fromthe project documentation. Second, the sampling exercise of the quantitative surveyshowed that sometimes the project activities in a community involved a very smallnumber of participants. According to district project teams the rule of thumb was 20participants in an FFS but in practice this was often done with fewer farmers. This isa typical feature and sometimes a limitation of the FFS approach (risk of insufficientcritical mass, unclear pathway for spill-over effects), which the project activelysought to correct by reinvigorating farmers societies, as described in the nextsection.
Social capital83. According to project documentation and the qualitative survey, the project
contributed to the development of grassroots networks at the village level,particularly through the support to tanks societies, crop societies, dairy societies andthe federations of these societies. In many of these, women held positions ofpresident, secretary and treasurer.
84. Regarding crop cultivation, while the crop societies (and federations) formed underthe project are ‘new’, the members belong to previously existing groups ororganizations in the village (e.g., farmers’ organization, women developmentorganization). These societies have benefited from new focus on higher-value cropsand revolving crop cultivation funds’ and in the future may serve as an entry pointfor line departments of the Ministry of agriculture to conduct training programmes.For line departments, it is simpler and less costly to deal with societies that have aminimum of organizational structure than to scout for individual farmers. Somefederations have now an office with paid staff.
85. In the small irrigation sub-component, the main project’s contribution was thepromotion of village tank societies and the re-introduction of “caretakers”, in chargeof coordination of tank rehabilitation, annual maintenance of the canals and watermanagement. The introduction of a tank maintenance fund has provided impetus tothe mobilization of paddy farmers for tank maintenance. However, beneficiaries andproject staff expressed concerns regarding the project’s failure to match themaintenance funds raised by tank societies and the consequences this may have onthe medium and long term sustainability.
86. Dairy societies also increased the confidence of their members and their ability toengage with the private sector, increasing their bargaining position in relation tobuying price and conditions (i.e., milk protein and fat-content based pricing) andhelped establish relationships between dairy farmers and the extension services ofthe Department of Animal Production and Health. The establishment of revolvingfunds by beneficiaries was a crucial factor in sustaining dairy societies.
87. Within the Bhagya loan sub-component, the vast majority of groups formed werenew associations, often of close friends in a village with high levels of trust andcooperation. This also strengthened bonds between women (the majority of clients)solidarity guarantors of group loans and facilitated women’s contacts with localbanks. Within the Apeksha loan sub-component, women’s savings groups, societiesand federations were already established by the Women’s Bureau and mechanismswere in place to solicit, verify, approve, disburse, monitor and repay micro financeloans. The project’s inputs were restricted to providing an additional source of credit,which was appreciated by the beneficiaries, but did not result in major changes insocial capital at the village or divisional level.
88. The support to farmers’ societies and to the creation of federations was to a largeextent an additional element brought in by the project management to respond totwo interconnected issues: (i) risk of isolation and scattering of FFS; (ii) need forsupport among farmers and of a minimum scale of activities to attract the support of

Appendix EC 2013/81/W.P.4
24
Appendix I
EC 2013/81/W
.P.4
public agencies. This was well meant to ensure inter-alia better perspectives ofsustainability of benefits. A limitation is that the building of grassroots organizationneeds itself time. As already noted under effectiveness, only about half of FFSsocieties were found as well functioning according of several indicators and only39 per cent had a functioning revolving fund. Overall and with the abovequalifications, impact on human and social capital can be considered as satisfactory.
Food security and agricultural productivity89. Pathway towards crop diversification. According to all the project documents,
including the PCR, DZLISPP made a positive contribution in this domain, with themain argument based on M&E data on data on crop productivity increases. TheHARTI thematic study on FFS interventions, based on a random sample of 52 FFSand 125 farmers in the four districts, found that slightly more than a third of theinterviewed farmers had adopted new crops or varieties during the project period(Table 8).Table 8Distribution of Farmers who have adapted to New Crops/Varieties by Districts
Description Kurunegala Badulla Anuradapura Monaragala Overall
% of Farmers AdoptedNew Crops/ Varieties 81 43 0 4 34
Source: HARTI Survey Data, 2012.
90. Through the qualitative survey and this evaluation’s own mission observations andinterviews, a common observation was that farmers assisted by the project wereexposed to new crops including higher value crops (e.g. groundnuts, vegetables,sometimes fruit trees and spices). Anecdotal evidence also pointed to increasinginterest (and acreage) for fodder production, given the growing attractiveness ofdairy farming (cost of commercial feed is high and increasing auto-production offodder makes economic sense). Naturally, exposure does not automatically translateinto (successful adoption) of new varieties and techniques.
91. The quantitative survey provides initial evidence in support of the above. Forexample, according to the results of propensity score matching, participation in theproject is positively correlated with indicators of crop diversification and productivity.Households supported by the project were significantly more likely to report anincrease in the number of crops grown between 20012 and 2006 (based on recall), ahigher percentage of crops for which an increase in production had been observedand a lower proportion of crops for which a decrease in production had beenobserved (Annex 7, Table B.1a and B.1b), although differences were small. Resultswere sensitive to the technique used: statistical significance of differences was lowerunder the treatment effect method (Annex 7, Table A.1).
92. While the survey attempted to collect more information on individual crops, only forpaddy and maize could the survey collect a large number of observations. In thecase of paddy, under both propensity score matching and treatment effect method,positive correlation was found between project participation and higher yields for theMaha season harvest (the major paddy harvest season) only in a few cases(Annex 7, Table A.1 and Table B.1a and B.1b).40 No significant difference was foundfor yields of maize.
93. As a proxy indicator of food security, the survey collected data on the prevalence ofeating of eating a limited number of meals. Data analysis through the treatmenteffect method suggests that project-supported households were less likely to reporteating only on or two meals per day when compared to households without project
40 It is to be noted that the number of observations was low for the Yala season (secondary growing season), reflectingthe fact that in the dry zone farmers typically have one paddy growing season.

Appendix EC 2013/81/W.P.4
25
Appendix I
EC 2013/81/W
.P.4
in the same village (Annex 7 Table A.2), while data analysis through propensityscore matching shows no significant differences.
94. In sum, secondary sources point to the introduction of improved techniques,diversification of crops, improved yields, the qualitative survey and this evaluation’smission helped observe concrete examples. Quantitative data preserve some echo ofthese observations although differences tend to be small. Taking all the above intoaccount, and considering that most of the project interventions have been carriedout fairly recently (between 2009 and early 2013), a rating of moderatelysatisfactory is assigned to this domain.
Natural resources and the environment (including climate change issues)95. Natural resources and environmental management was not a major project focus
area. According to the qualitative survey, the beneficiaries recollected beingintroduced to basic measures to reduce soil erosion and improve water management(for small-scale irrigation schemes). In Kurunagala and Badulla districts,beneficiaries and government officers spoke of the potential benefit to dairy farmersfrom the introduction of a drought resistant variety of grass known as Clone 13.
96. Given the high diversity of sub-components and activities, it proved very difficult toaddress specific issues through a standardised questionnaire and therefore questionsin the quantitative survey were kept at a general level for water management andsoil fertility: changes in access to irrigation, satisfaction with access to water andperception of soil fertility. Only in a few cases, did the survey find positive andsignificant difference households assisted by the project (Annex 7, Table A.3 andTable B.3a and B.3b). However, water and soil fertility involves many nuances whichare better captured through thematic studies and field visits.
97. Field visit showed that, in those GNDs were a village water tank had beenrehabilitated, the project had provided training packages for the maintenance of thedam, soil and water management and set up a water user association. Focus groupdiscussions with farmers showed that they often adopted good practices in terms ofwater rotation, keeping paddy fields moist but reducing field flooding. A HARTI studyon small scale irrigation made similar observations. It also found that therehabilitation of irrigation tanks helped increase not only the capacity of the tank andstorage of water but also had positive externalities on the ground water level(including agro wells and domestic wells) of the adjacent settlement area. At thesame time, it noted that several water user associations were dormant and could notbe expected to manage the schemes effectively in the future. While environment andclimate change were not at the core of project interventions, several relevantpackages have been recorded by project studies, by this evaluation’s mission andthe qualitative survey. Effects on the general project beneficiary population areprobably taking up and not yet fully perceived. The rating for this impact domain ismoderately satisfactory.
Household income and assets98. In this section we review the results of the analysis on estimates and expenditures
as well as asset indexes. Regarding expenditures, the quantitative survey includedquestions on relatively expensive food consumption items (fish, meat/eggs,milk/dairy, prepared foods, and tobacco alcohol) as well as on a set of non-foodconsumption items. Estimated expenditures are widely used in the literature as aproxy of income status and are known to be more reliable than income indicatorswhen collected through interviews.
99. Project M&E documents argue that household income and expenditures increased inthe project area due to the enhanced profitability of several types of farmingenterprises as well as for non-farm enterprises. Similar findings are presented in theHARTI studies although in a more cautious fashion and with qualifications. Thisevaluation’s qualitative survey and the evaluation mission gathered mixed evidence.There was evidence of the project’s contribution to introducing crops and activities,

Appendix EC 2013/81/W.P.4
26
Appendix I
EC 2013/81/W
.P.4
including dairy farming (see also the impact sections above for the types of cropsand activities) that are potentially profitable. At the same time, the uptake was notalways uniform and linear. Constraints pertained to the local village context (e.g.access to a market), limited availability of follow-up training and extension, orfinancial services and the size of the initial investment required.
100. Findings from the quantitative surveys are mixed and sensitive to the econometricmethod adopted. Regarding expenditures, the treatment effect model shows apositive correlation between project participation and several categories ofexpenditures when comparing household with project and households withoutproject in the same village (Annex 7, Table A.4). Instead, there are cases ofnegative correlation when project households in a community with high number ofproject interventions are compared with households without project. In most of theother cases, differences are not significant. When using the propensity scorematching technique, correlations tend to be negative in many cases (Annex 7, TableB.4a and B.4b).
101. Regarding household asset indexes, both the treatment effect model and propensityscore matching suggest that project participation is negatively correlated withseveral household indexes but positively correlated with ownership of cattle in 2013(Annex 7, Table A.5 and Table B.5a and B.5b). The number of cattle has beensingled out in the quantitative analysis because, as observed through focus groupdiscussions and field visits, dairy farming emerged as one of the most appreciatedactivities, according to project participants.
102. While the above results are not immediately intuitive, triangulation with evidencegathered through the qualitative survey and field visit helps build an explanatoryscenario. Given the increasing emphasis of the project on dairy farming, the data islikely to reflect the fact that project-supported households have invested in cattleand purchased less of other household assets under external financial constraints. Inmost cases, participating household had to self-finance these investments, not onlyto purchase cattle but also to build cow sheds and to purchase special feed forlactating cows. More in general, project’s beneficiaries had to self-finance the newinvestments encouraged by the project which may explain that they had to foregothe purchase of other household assets. Combining the findings from differentmethods and considering that most of the project activities are fairly recent, thisimpact domain is assessed as moderately satisfactory.
Institutions and policies103. FFS societies as a platform for district level extension programmes. The
project collaborated with the staff of the Department of Agriculture in the fourdistricts and with the Department’s Agricultural Inspectors at the field level. Theproject’s derivative version of FFS was appreciated by the Department of Agriculture.Senior officers of the Department of Agriculture in several districts expressed theircommitment to continuing support and using the ‘crop societies’ established by theproject as a cost-effective entry point to contact farmers (rather than having toscout for individual farmers in the field). They also noted that in many Districts, theDepartment has several vacant positions for field extension officers and formerproject staff at the district level could be competent candidates to recruit and thusbring back project experience to the Department. Directors of the DistrictDepartment of Export Agriculture (cash crops), Department of Animal Productionand Health made similar observations. The project allowed them to extendoutreach beyond their normal budget and staff resource capacity. Their aim is tobuild on the grassroots organizations set by DZLISPP although their own budgetaryresources will probably allow for a more modest coverage.
104. The current regulatory system allows for the registration of only some ofthe village-level producers’ societies set up by the project. While manyproducers’ societies have been formed, the legal registration of the same emerged

Appendix EC 2013/81/W.P.4
27
Appendix I
EC 2013/81/W
.P.4
as a policy issue for the crop and dairy societies. Lack of registration means that thesociety is not officially recognised and cannot benefit from public supportprogrammes. At the moment, the Divisional Secretary Office and the Department ofAgrarian Development are the only two government agencies with legal provision toregister societies at the village level and they only deal with village tank societies(small-scale irrigation component). This leaves crop and dairy societies formed bythe project without formal links to the respective line departments. Cognizant ofthese constraints, in Badulla District the Department of Agriculture, with the supportof the project, has submitted an amendment proposal of the legal statute to theProvincial Council in order include provision of legal registration of societies underthe provincial Department of Agriculture (for crop societies). If the amendment isapproved and the project’s societies are registered with the Department ofAgriculture they will be entitled to official support.
105. In small-scale irrigation, the project revitalised traditional villageinstitutions but did not deliver matching funds to the extent pledged. Theproject’s emphasis on rehabilitating small village irrigation tanks has beenappreciated by the Department of Agrarian Development, responsible for smallerreservoirs but constrained by a limited annual capital budget. The project’sassistance has re-activated many tanks that were only partially used or close tobeing abandoned and introduced or re-introduced traditional institutions such as the“tank societies”, or the water caretaker, and village-raised and managedmaintenance funds. The Department of Agrarian Development is interested inpursuing this approach in the years to come. Staff of this Department explained thatthe project had pledged to provide additional matching funds for long-termmaintenance of the village tanks but in many instances they were not released dueto a halt to all financial commitments decided by the Ministry of Agriculture at thecentral level in March 2013 (corresponding to the project completion date). This maycreate problems for funding the maintenance of schemes. Reportedly, the situation isbeing addressed and the project has started releasing matching funds.41
106. Land tenure: work has just started. As already noted, the FAO-implementedpolicy component, financed through an IFAD grant to the Government producedstudies, policy briefs, training activities, an overseas study tour. Inter alia, theseinitiatives sought to document, discuss and deal with: (i) land fragmentation;(ii) informal selling and leasing of land under Land Development Ordinanceprovision;42 (iii) encroachment of reserve lands; (iv) limited capacity and equipmentof the district land administration; and (v) lack of formal title documents, permits,grants or leases on land. According to an assessment commissioned by the project43,participants rated training and study tours as pertinent and well organized. Landtenure policy making requires long-term efforts and it would not be realistic toexpect concrete policy changes within the time span of the project. These activitiesstarted late (in 2010) and project closure may cause discontinuity. Most of theinitiatives were sub-contracted by FAO to external consultants. If these activities arenot capitalised and built upon by present or future IFAD or FAO interventions, theyrisk having little traction.
107. Apart from the land tenure initiative, which deserves to be seen as the beginning ofa long-term commitment, the project did not entail major policy dialogue work.Some of the approaches devised (e.g. farmers field school) may inspire future workof public institutions (particularly for extension approaches). All this seems subject tocontinued support by IFAD and its partners (see also the section on sustainability).The overall rating for institutional impact is moderately satisfactory.
41 Source: Mr A.Herath IFAD Country Presence Officer, personal communication, end October 2013.42 In theory, the lease and alienation of land under ordinance would require government approval, which is impracticalleaving to a high number of informal arrangements.43 J. Weerahewa (2013). An Evaluation of The Interventions on Land Tenure By DZLISPP.

Appendix EC 2013/81/W.P.4
28
Appendix I
EC 2013/81/W
.P.4
Overall impact assessment108. The overall assessment for impact on rural poverty is positive but more nuanced and
mixed, compared to the project’s self-assessment. While the project’s own M&E dataconvey a sense of generalised high impacts, this evaluation takes a more prudentstance and assesses overall impact as moderately satisfactory. As already explained,in spite of the project’s efforts, M&E data present a problem of representativenessand attribution (no comparison with households without project, particularly in aperiod of generalised economic growth).
109. This impact evaluation, based on mixed methods and drawing from an impact surveywith a more representative sample and comparison observations, confirms thatDZLISPP has promoted a number of initiatives that can contribute to improveproductivity and modernise agriculture in the dry zone of Sri Lanka. The question isto what extent these initiatives have already spread out enough for results to beobservable on a sufficiently large scale. In the case of impact on human and socialcapital and agricultural productivity, there is common support between the differentmethods to the claim that the project has exposed farmers to new knowledge,techniques, crops, and practices with some initial observable effects on cropdiversification. Two other areas of impact (natural resources on one hand andinstitutions and policies) have received comparatively less resources and generatedless tangible results at least up to present.
110. Evidence is mixed for the impact on household income and assets. The findingssuggest that, given the project’s emphasis on dairy farming, project-supportedhouseholds have invested on cattle while purchasing less of other household assetsunder external financial constraints. In most cases, participating household had toself-finance dairy farming investments, not only to buy cattle but also buildequipment and purchase special feed for lactating cows. More in general, project’sbeneficiaries had to self-finance the new investments and thus forego the purchaseof other household assets.
111. This impact evaluation had to face a number of difficulties and constraints: (i) theabsence of a baseline dataset (a problem encountered by many other projectevaluations at IFAD); (ii) the presence of targeting mechanisms which generate aserious sampling bias problem; (iii) confounding effects of the general economicgrowth and poverty reduction experienced by the country; (iv) potential“contamination” effects , spreading of benefits from project to non-project groups (toquote an example, vegetable collection centres did not exclusively procure theproduce of farmers assisted by the project); (v) limited “incubation time”, whereasthe project started in early 2006, most project interventions have concentrated inthe period between late 2009 and early 2013. On the latter point, the sections onsustainability and up-scaling of this report argue that, in the absence of a follow-upsupport phase, the full project impact potential may not be brought to bear.
112. Interestingly, there are no clear-cut patterns emerging from the four analyticalblocks (treatment communities vs. comparisons; direct beneficiaries vs.comparisons; intensive vs. comparisons; and direct vs. indirect beneficiaries). Inparticular households in intensive intervention villages (i.e. villages with six or moreproject interventions) do not perform better than other analytical blocks. It ispossible that the proxy adopted for the intensive intervention case (six or moreproject interventions in the same village) does not reflect adequately the scale andquality of work (e.g., double counting or simply repeating the same intervention if itwas not successful in previous attempts).
E. Other performance criteriaSustainability
113. Institutional development requires longer-term plans. As already noted, theproject contained some sustainability elements: (i) the formation of farmer andproducer societies (e.g., village irrigation tank, crop, dairy societies) and their
Appendix EC 2013/81/W.P.4
29
Appendix I
EC 2013/81/W
.P.4
federations; (ii) linkages with relevant government departments (see above);(iii) grants for future maintenance of minor tanks and revolving micro finance andmicro credit funds (e.g., for crop societies, Apeksha and Bhaghya loans). As a“society” of 15-20 farmers may not be viable, the project tried to aggregate societiesinto larger federations.
114. The HARTI Paper 15, entirely devoted to sustainability aspects, concludes that dueto various kinds of constraints such as the delay in DZLISPP implementationfor the first two-three years, project implementers had to give more weight toquantitative outreach (working in as many GNDs as possible) while thegrassroots organizations supported by the project were still in their formativestage and less likely to sustain without external assistance for some moreyears. This evaluation stresses the following points regarding general sustainabilityprospects: most project activities have completed in the past 36 months; they needfurther technical/organizational support. Indeed, fledgling farmers’ organizations arenot yet fully confident with accounting and marketing strategies and only a minorityof them have been officially registered.
115. Linkages to agricultural value chains are a gage to sustainability. Withspecific regards to rainfed agricultural and livestock-based systems, the focus onseed production groups (potatoes, cereals, pulses) is a positive sustainability factor.In an agricultural sector transitioning towards enhanced market linkages and valueaddition, quality seed is in high demand. The remarkable achievements in the multi-stage seed potato production system are a good example of this trend. Theforeseeably growing demand is a driver of sustainability, but the dependence onfurther scientific and technical support remains critical. Another telling example isdairy farming (linkages with large dairy processors). The high farm-gate price formilk is an incentive. Milk farm gate prices per litre are at European Union level,i.e. around EUR 0.30.44
116. Sustainability of rehabilitated irrigation systems. While increased financialrevenues from crop sales may allow for routine maintenance, not all water userscollect maintenance fees. Another concern regarding sustainability is related to thetank maintenance fund set up by the project and the project’s possible failure tomeet its commitment to paddy farming communities in the form of a matching grantof LKR 50,000 for scheme maintenance. These commitments need to be honouredand the project has sought to address this matter in the past months.
117. Sustainability of marketing and enterprise development. The main questionsconcern the sustainability of the recent marketing arrangements. Positive examplesexist such as the two vegetable collecting centers cofinanced and now managed bythe private company Cargills. The project has established a committee under theDivisional secretary concerned and represented by the stakeholder agencies tooversee their operations and provide necessary guidance. In addition, arrangementshave been made to establish a welfare fund for farmers through contributions of thecompany. These arrangements still need to materialise. They are important for thelongevity of this approach, which is attracting buyers close to the production sitesand, vice-versa, providing better farm gate prices, predictability and a social safetynet to the producers.
118. Promising examples from community infrastructure development. Twospecific measures are meant to enhance the sustainability of communityinfrastructure built with the help of the project. First, community buildings anddrinking water supply schemes are handed over to the community-basedorganizations concerned for maintenance. Second, for access road maintenance, theLocal Government Bodies (Pradesheeya Sabha) have been involved. Usually, the
44 A caveat to be mentioned here is that farmers are not always adopting good practices (e.g., overstocking ofunproductive cattle), which tends to depress sustainability.
Appendix EC 2013/81/W.P.4
30
Appendix I
EC 2013/81/W
.P.4
village roads are damaged due to monsoon rains. Therefore, immediately after rainyseason, minor repairs are attended to, before they turn into major repairs. If thisscheme works over the villages attended by the projects, sustainability prospects forthis component are encouraging.
119. Sustainability prospects are low for the credit components, notably Apekshaloans. In this scheme, interest rates per annum are below market rates and simplynot viable (6 per cent). This scheme will be swiftly eroded by inflation. Similar issuesexist for Bhaghya loans, albeit at higher annual interest rates of 10 per cent. In theview of this evaluation, the architecture of this scheme corresponds to a lostopportunity. Rather than promoting subsidised interest rates, a more viable schemecould have been to introduce one-time lump-sum subsidises in the form of matchinggrants, while maintaining interest rates at the market level. This may have marked apath to graduation of borrowers towards formal credit with regional banks, on top ofbeing more consistent with IFAD rural finance policies.
120. Based on the above considerations, sustainability prospects are rated as moderatelysatisfactory.
Pro-poor innovation and scaling up121. The project has made direct efforts to bring farmers closer to the available
technology frontiers. The economic potential of some of many of these isnoteworthy:
Multiplication techniques for seed potato, involving the first two multiplicationsteps with advanced but still small farmers. The first step, the production of pre-basis seed in hydroponics, is remarkable, and was possible thanks to the supportby an agricultural research centre, the Seethaeliya Research Station and the seedcertification services of the Department of Agriculture. Eight farmers haveinvested in greenhouses with hydroponics so far. The second multiplication step isalso more than adequate as it uses controlled, self-made substrates from teawaste and carbonised rice husk, which are freely available in the area.45
Introduction of improved varieties (e.g. onions), quality seeds (cowpeas, maize,paddy and groundnuts). The involvement of small farmers in seed production is aproxy of progress towards commercial agriculture and away from meresubsistence. As a rule, seed of any crop get roughly a double farm gate pricecompared to commercial produce.
Chilling technology for dairy farming, which is provided by large milk purchasingfirms, some of them private and some state-owned.
Organizational innovation: variations on the Farmer Field School approachreinforced by setting up federations have shown promising results, albeit with ahalf of such organisations still in a fragile state.
122. In terms of up-scaling, the project worked with both private sector companies(technologies) and provincial and district departments (FFS) on the support todiffusion the above innovation with some partnerships already under way.
123. For the future, this is a challenge to IFAD and the Government. Scaling-up has juststarted, thus it needs support. On one hand, there is private sector potentiallyinterested in doing business with smallholders but there is need of publicintervention for reducing transaction costs. On the other hand, current nationalpolicies are not really putting emphasis on this type of projects. As they arefavouring mostly larger infrastructure and plantation agriculture, they tend todisregard the fact that successful commercial agriculture does not exclude the activeinvolvement of smallholder farmers. DZLSPP has advocated for this case.
45 According to a HARTI paper, farmers have produced evidence that the technology can produce table potato at a cost ofRs.18.00 – Rs.23.00/per kg at 2012 prices, which is 50 per cent less compared to the pre-project situation.

Appendix EC 2013/81/W.P.4
31
Appendix I
EC 2013/81/W
.P.4
124. In spite of the above limitations, mainly related to national policies, the managementteam of DZLISPP deserves to be recognised for the attempt to promote newtechnologies and approaches and also the work done recently in building externalpartnerships (public and private) for up-scaling. This criterion is rated assatisfactory.
Gender equality and women’s empowerment125. Project data systematically display gender disaggregated figures, which helps
forming an opinion on this evaluation criterion. Table 14 indicates per district figureson women’s involvement in the project.Table 14Number of male and female farmers attended in major dry land crops per districtDistricts Totals Male Female
Anurapura 8,607 3,676 4,931
(57%)
Kurunegala 3,408 n.a. n.a.
Badulla 17,290 10,046 7,244
(42%)
Monaragala 11,540 6,613 4,927
(43%)
Grand totals 40,845 20,335 17,102Source: DZLSPP. Physical and Financial Progress Report, Colombo, March 2013:No gender disaggregated data available for Kurunegala district
126. According to the impact qualitative survey and this evaluation’s field visits, men andwomen repeatedly stressed that they work together equally in support of thehousehold’s management and income. Men and women commonly share tasksincluding cooking, child care, marketing and washing clothes at home and variousaspects of cultivation, marketing (milk), and mutually support household microenterprises. Household are dependent on multiple crops none of which are sufficientto provide a sole source of income.
127. In addition, women are strongly represented in crop societies; often the majority ofmembers are women, and held executive positions, i.e., president, secretary ortreasurer in almost all crop societies observed, as among beneficiaries across allcomponents of the project (Table 15).Table 15Sex Distribution among FFS society Office Bearers
Male Female
# % # %
President 41 57 31 43
Secretary 26 36 46 64
Treasurer 33 46 39 54
Total 90 44 116 56Source: HARTI Survey Data, 2012.
128. The majority of Bhaghya beneficiaries are women (60 – 100 per cent). However,men (husbands or sons) are often involved in some aspect of the enterprise financedby the Bhaghya Loan. Bhaghya Loans have fostered cooperation and strengthenedcooperation between men and women at the household level. The greatest differenceis perceived by women beneficiaries in terms of self-confidence as ‘entrepreneurs’

Appendix EC 2013/81/W.P.4
32
Appendix I
EC 2013/81/W
.P.4
and their ability and willingness to engage with the formal banking sector. In view ofthe above, this evaluation criterion is rated as highly satisfactory.
F. Performance of partnersIFAD performance
129. IFAD supported an overall sound project design. After the initial period of slowdisbursement, closing the project at the time of Mid-term review was considered asan option and IFAD, in consultation with the World Bank, decided to support itscontinuation. This was a correct choice. Upon reflection, the mid-term review missioncould have taken a stronger decision to reduce project physical targets which wouldhave helped DZLISPP focus more on quality and continuity rather than on outreach.
130. As the World Bank was responsible for supervision and loan administration, IFAD didnot lead supervision missions but had consultants join those missions. At a laterstage, IFAD’s support and advocacy roles have been less visible. In part this may bedue to a shift of attention from DZLISPP to the supervision of more recent projects.Another factor, as conveyed during several partners interviews, may be that theabsence of a country office in Colombo (IFAD has a national country presence officerwho resides in Kandy in the Central Province), constraining regular engagement withnational counterparts. This limits advocacy for a follow up phase particularly at amoment when the Government is not strongly supportive of interventions in the dryzone. In addition to the concern for consolidation (sustainability), another importantitem is building partnerships for up-scaling (donors, public and private sector). Whilemany of the project achievements have been attained in the last 36 months, thepioneering character of DZLSPP, the technological and market challenges ahead andthe still vulnerable farmers’ organisations warrant extended support. Globally, IFAD’sperformance is assessed as moderately satisfactory.
Government performance131. The most striking trait related to Government performance is that DZLSPP was
capable of vigorously re-bouncing after a deceiving first half of project life.This may be indicative of the quality of staff assigned at the helm of the project afterMTR and after the reshuffling of the management team, and the commitment of thestaff of the four District project management units, an observation corroborated bythe evaluation mission. The key findings of the qualitative survey reveal a gooddegree of transparency and accountability in the project’s transactions with projectbeneficiaries.
132. The project’s commissioning of 15 thematic studies to HARTI can be considered asa very good practice. They provide precious insights in technical and methodologicalmatters. Furthermore, thematic studies can be context-specific and provideappropriate technical feedback to project managers. Given their high number, qualityand interest varies considerably between these studies. Ideally, it would have beenpreferable to concentrate on fewer (say 4-5 rather than 15) and at an earlier projectstage (to allow project management to take corrective measures) but this iscertainly an excellent example for many other IFAD projects.
133. On the other hand, the mission has to voice the often-heard concern that the finalfinancial commitments of the project towards farmers’ organizations may not befulfilled. Tank maintenance and farmer organisations critically depend on thepromised matching grants. In addition, while the project conducted a baselinesurvey in 2006, it is very unfortunate that the database has not been preserved.
134. While the current project team, notably the national coordination unit, has madeserious efforts to communicate and share the project experience, so far there hasbeen lukewarm support from the Ministry of Agriculture and from centralGovernment authorities for accompanying the DZLISPP in its last months ofoperation and for requesting the financing of a follow-phase of the project. Given theachievements and challenges of this seminal project, consolidation efforts are

Appendix EC 2013/81/W.P.4
33
Appendix I
EC 2013/81/W
.P.4
necessary. In sum, while the work of the current project management unit (at bothnational and district level) after the Mid Term Review is considered as strong andwarrants a high score, the above critical issues must be taken into account and theoverall government performance is rated as moderately satisfactory.
135. The World Bank, responsible for supervision, was very supportive of the projectthroughout its implementation phase. Its role was determinant, at the time of themid-term review when the continuation of the project was at stake. The World Bankcontributed to the visibility of the project vis-à-vis the national authorities. Itinspired the preparation of thematic studies which were eventually commissioned toHARTI and represent a good practice case. Its supervision aide memoires andpresentations try to strike a balance between achievements and shortcomings of theproject. As noted, at the time of mid-term review, it would have been more prudentfor both the World Bank and IFAD to revise the project quantitative targetsdownwards, and avoid incentives to over-stretching outreach.
Overall assessment of project achievements136. The overall assessment of the project’s achievements needs to balance across the
different criteria and take into account that, for many aspects, DZLISPP can beconsidered as a pioneering project. Key interventions (agricultural extension, smallirrigation rehabilitation and community infrastructure) responded to existing needswith broadly valid approaches. On the other hand rural finance and microenterpriseinterventions did not conform to recognised good practice (e.g. subsidised loanrates).
137. Following a typical pattern of IFAD’s projects, implementation was seriously delayedin the first three years. The effort and capacity to bring execution levels back ontrack were impressive but caused over-stretching and focus on quantity to thedetriment of quality and depth. Concerning impact, this evaluation’s assessment isoverall positive but more mixed and nuanced compared to the project’s self-assessments.
138. Introducing innovative techniques and approaches was an achievement of theproject, fully confirmed by direct observations of the evaluation mission. Thequestion relates to the number of farmers successfully adopting such innovations.For future scaling up, there is interest from private sector and from extensionagencies of local governments but, without external funding, uptake may besluggish. By the same token, maintaining benefits after the project closure ispossible but with the risk of sacrificing many fledgling grassroots organizations andachievements. Regarding gender equality and women’s empowerment, progress hasbeen very strong. Overall, a rating of satisfactory is justified.
III. Assessment of the PCR quality139. Scope. The Project Completion Report is a relatively short, yet easy to read
document. It follows the standard IFAD criteria for project-level evaluation, althoughit does not include an explicit assessment of the performance of IFAD.Rating: satisfactory.
140. Quality (methods, data, participatory process). The PCR makes full use of theM&E data and selectively quotes from the HARTI studies. While M&E data areabundant, they need to be taken with caution. The PCR indicates that there has beenno stakeholder workshop prior to carrying out the analysis. Such a workshop couldhave been a good opportunity to obtain stakeholder views in addition to advocatingfor future follow-up support. Rating: moderately satisfactory.
141. Lessons. The section on lessons learned contains five points, three of operationalnature (dairy sub-component, the role of the local facilitators hired by the project,and the forward sale contracts sub-component) and two at a broader level (theconsequence of over-ambitious targets for the marketing and rural enterprisecomponent, and the role of farmers’ organizations and federations). The issues

Appendix EC 2013/81/W.P.4
34
Appendix I
EC 2013/81/W
.P.4
reviewed by the PCR are valid. The document could have further reflected on theavailable documentation (including HARTI studies) and come up with more elaborate“strategic” issues and recommendations in view of future similar interventions.Rating: moderately satisfactory.
142. Candour. The PCR makes efforts to keep a reasonable balance between recognisingand praising the achievements and identifying the shortcomings of the project. Itmight have insisted further on the trade-off between quantitative outreach andquality and the need for achieving a “critical mass” of interventions. Overall, candourcan be rated as satisfactory.
IV. Conclusions, recommendations and selected methodologicalconsiderations
A. Conclusions143. Gradual refocus to a middle-income country context. Initially conceived as a
food security project within a national reconstruction effort, DZLISPP was graduallyrefocused to match the needs of a middle-income economy. While quantity andquality of nutrition is still an issue in rural Sri Lanka, economic growth also meansincreasing demand of higher-value agricultural produce and dairy products. Theproject took this challenge and, while maintaining the commitment to staple crops(e.g. rehabilitation of traditional village water tanks for paddy cultivation), it fostereddiversification towards higher value crops and dairy farming.
144. Supporting the introduction of improved technology. The project collaboratedwith national and local research institutions to bring existing technology to thefarmer’s field and homestead. Technology for seed potato multiplication, improvedvarieties and quality seeds for onions, cowpeas and groundnuts are among the bestexamples. Cooling machines for milk are another example, in this case through apublic-private sector agreement.
145. The project lived up to the commitment to foster partnerships. Partnershipwas one of the objectives of the project and the number of agreements signed(albeit an imperfect indicator of partnerships) is impressive. The World Bank 2012final supervision mission counted about 60 partnerships, of which twelve with privatesector organizations and the others with central and local (provincial, district) publicagencies. In Sri Lanka, private sector operators are entering rural areas to cater forthe urban demand of dairy products and fresh fruits and vegetables. DZLISPP’scooperation with the private sector was focused and opportunistic: rather thanventuring to develop value chains ex novo, the project opted for linkages with well-established processors and retailers and co-financed with them the construction ofcollection centres (for vegetables, fruits, milk) where farmers bring produce atregular dates, so that collectors do not have to visit farmers one by one, thusreducing transaction costs.
146. Impact evaluation findings are generally positive but more mixed andnuanced than in M&E. While the project M&E data convey a sense of strong andgeneralised impact on household incomes and assets, this evaluation finds initialsupporting evidence in some areas (human, social capital, agricultural productivity),while evidence is more mixed in other areas (household income and assets).Exposure of farmers to new crops and techniques has yet to translate into adoptionon a large scale. Compared to the project M&E data, this evaluation benefited from amore representative household sample, a comparison with households withoutproject, econometric analysis and triangulation between qualitative and quantitativesources.
147. Pioneering interventions imply risks and require years to consolidateresults. Seeking to introduce improved techniques and technologies trough a newapproach for Sri Lanka (FFS) implied risks. A single phase of a project such asDZLISPP is not sufficient to consolidate results. This is particularly the case when a

Appendix EC 2013/81/W.P.4
35
Appendix I
EC 2013/81/W
.P.4
project suffers from important implementation delays. The project has builtmomentum, human capital, experience and knowledge, but much remains to beaccomplished. While some elements of sustainability are in place and there isinterest from both private operators and local government agencies to build upon theproject’s seminal contribution, there is a risk that benefits will accrue at a slow paceafter closure. While the learning curve is steep in a first phase, not building uponknowledge and experience leads to inefficiency.
148. Strengths and weaknesses in the project’s self-assessment. The number ofdata, figures, reports, excel tables produced by the project M&E is impressive butthere are inaccuracies (double-counting and unclear representativeness of thesamples adopted). An even more conspicuous gap was the disappearance of thedatabase of the 2006 baseline survey, which made ex post assessment far morecomplicated. On the positive side, the production of thematic studies (HARTI) wasa very important feature of this project, providing contextualization and detailednarrative and analysis.
B. Recommendations149. Need of a follow-up phase and advocacy from IFAD’s side. This point has been
hinted to several times in the body of this report: for sustainability, efficiency andup-scaling reasons. Focus on the dry zone is consistent with the current priorityaccorded by the Government to modernization of agriculture. Potential exists forfostering production of high value crops and introducing improved technology. Thisperspective needs to be conveyed more forcefully by IFAD to a somehow reluctantGovernment partner.
150. A more selective project format is required, revisiting several componentsand concepts. While further investment on this type of project seems wellgrounded, it would not be appropriate to simply repeat the same project design. Aproject with fewer components and lower ambitions in terms of geographic coveragewould be a better choice. For the future:
- there is need to promote further linkages with existing value chains throughpublic-private sector partnerships, taking the opportunity of the presence ofmedium-large agro-business operators in the rural areas;
- it will be essential to support grassroots societies of farmers (e.g. crop, villagetank, dairy societies) and their federations. They can reduce transaction costs forfuture support programmes sponsored by provincial and district agencies, as wellfor linkages with private sector operators;
- IFAD and the Government should avoid subsidised interest rates credit schemes.They are not necessary (returns from many investments types can supportcommercial rates), nor efficient (credit rationing), nor consistent with IFAD’spolicy for rural finance. Smarter approaches may include the signing ofmemoranda of understanding with state-owned regional banks or private banksand providing subsidies in the form of lump-sum matching grant to be provided asequity contribution to the borrower (for a first loan for example), while applyingcommercial interest rates.
151. Advocacy on policy issues needs to continue. This involves not only macropolicy issues which are politically entrenched, such as land tenure, but also meso-level and practical issues such as the formal registration of village level societies (seethe section on impact on institutions). However, this requires work not only at anindividual project level but also across the entire country programme and deservesconsideration in the next COSOP.
152. In the short term, project commitments to provide a financial contribution torevolving funds for maintenance of village tanks and other schemes need to behonoured. While formal termination of financial commitment was set as of endMarch 2013, several grassroots societies had mobilised their own funds but did not

Appendix EC 2013/81/W.P.4
36
Appendix I
EC 2013/81/W
.P.4
receive the project counterpart as established. Solutions have been sought by theproject and they need to be vigorously pursued.
153. M&E and self-assessment. In spite of the efforts of project staff, better accuracyand quality control in M&E data is required. The good practice of conducting thematicstudies deserves to be retained, better if focusing on a limited number of qualityreports. It would also be useful to produce them earlier on, so that time is availablefor corrective actions. Finally, a simple baseline survey with both project andcomparison observation is recommended, with particular care and attention forpreserving the integrity of its electronic database. A follow-up survey could beundertaken towards the end of the project life span.
C. Selected methodological considerations for future similar workat IFAD
154. In spite of the limitations already pointed out, the use of mixed methods allowed theevaluation to gain a richer view of the project’s performance and results. As a firstattempt at impact evaluation, this exercise helped unveil a number of challengeswhich are likely to appear in future similar endeavours, including in the 30 impactevaluations that IFAD will conduct by 2015. They are briefly reviewed in thefollowing paragraphs.
155. First, the absence of a baseline has traditionally been a common constraint toevaluating IFAD projects. More recent projects have conducted baseline surveysunder the Result and Impact Management System of IFAD (focusing onanthropometrics and household asset indicators) yet they generally lack acomparison group. In addition, sample selection bias is a serious issue for IFADprojects due to their targeting approach: disadvantaged areas, communities orgroups are expected to take precedence in receiving project’s support. Use ofstatistical techniques that do not strictly require a baseline (propensity scorematching, difference in difference using recall methods, derivative approaches of theHeckman sample selection method), combined with a selection of a fresh comparisongroup, is in order but it is also recommended to adopt mixed methods (includingqualitative techniques), as argued further below. It is to be noted that the selection,development and testing of the econometric approach and model specificationcan be extremely time consuming and that, in any case, advanced econometrictechniques are an imperfect substitute for baseline data.
156. Timing of the survey. Some reviewers may believe that it is desirable to wait untila project has gone through a sufficiently long “gestation period” before conductingan impact evaluation. However, an ex post exercise (i.e. undertaking an impactsurvey a few years after project closure) can pose tremendous survey managementchallenges in terms of practical organisations, learning and feedback tomanagement. Fielding a survey is very difficult without interactions with the projectteam on the ground (a typical situation in an ex post evaluations). This may give riseto petty errors (e.g. confusing between a project and a comparison site) but alsodeprive the evaluators’ team of understanding of key project implementation aspects(e.g. how targeting was done). Similarly, an impact evaluation that takes place latehas limited chances to inform project management or the design of a follow-upproject phase. In the end, it seems preferable to conduct an impact survey beforeproject closure. And earlier on, during project implementation, it would be useful toundertake thematic studies (see further below).
157. Linked to the timing of the survey is the matter of choice of indicators. At IFAD,impact evaluation indicators relate to medium-longer term indicators. However, ifimpact evaluations are conducted during the project implementation or just beforeproject closure, surveys may have to focus more on intermediate shorter-termindicators (e.g. technology adoption) rather than on final impact (e.g., income andexpenditures).
Appendix EC 2013/81/W.P.4
37
Appendix I
EC 2013/81/W
.P.4
158. Decisions on practical sampling arrangements can be more complicated thanexpected. When projects target areas with specific agro-ecological characteristic, it isdifficult to find adequate comparison sites if the project covers a very largeproportion or the totality of that area. Many other issues arise when the survey hitsthe ground, such as deciding whether the unit of analysis should be only the directproject beneficiaries or other households in the same community (e.g. to test forspill-over effects). This requires not only strong statistical sampling skills but alsoknowledge of the terrain and discussion with project field staff can be essential: anadditional argument to undertake impact surveys when the project has not beenclosed.
159. Another challenge is the multi-component nature of IFAD projects. The logicalchain of cause effects becomes fuzzier to model and assess when severalconcomitant components are operating. One of the tacit assumptions of quantitativeimpact techniques is that the interventions studied are homogenous, producing thesame type of results more or less in the same fashion (e.g. as a vaccine, a medicineor, under certain conditions, a training programme). This may not be the case in amulti-component project setting. Designing an “omnibus survey” can be a dauntingtask when components include a large number of sub-components and sub-activities(as in DZLISPP).
160. And finally, econometric analysis results are not always self-explanatory, they needto be interpreted and can yield inconsistent results. Mixed methods, combiningboth quantitative (mini-surveys) and qualitative techniques can have an importanthermeneutical contribution. Combined with the need to be more component or sub-component-specific, this evaluation suggests that a way forward for IFAD projects isto conduct more thematic studies concentrating on a single component or a clusterof components (along the line of those prepared by HARTI for DZLISPP) combining asimple survey format with more qualitative techniques. Such studies could beconducted during the project implementation and follow-up thematic studies couldalso be fielded at completion or for the purpose of evaluating the project.

Appendix – Annex 1 EC 2013/81/W.P.4
38
Rating comparison
Criterion IFAD-PMD ratingA Evaluation ratingARating disconnect
Project performanceRelevance 5 5 0
Effectiveness 4 5 +1
Efficiency 4 4 0
Project performance B4.3 4.6 +0.3
Rural poverty impactHousehold income and net assets 5 4 -1
Human, social capital and empowerment 5 5 0
Food security and agricultural productivity 5 4 -1
Natural resources and environment 5 4 -1
Institutions and policies 4 4 0
Rural poverty impact C5 4 -1
Other performance criteriaSustainability 4 4 0
Innovation and scaling up 5 5 0
Gender equality and women’s empowerment 5 6 +1
Overall project achievement D 5 5 0
Performance of partnersIFAD np 4Government 5 4 -1
Average net disconnect -0.18A Rating scale: 1 = highly unsatisfactory; 2 = unsatisfactory; 3 = moderately unsatisfactory; 4 = moderately satisfactory; 5 =satisfactory; 6 = highly satisfactory; n.p. = not provided; n.a. = not applicable.B Arithmetic average of ratings for relevance, effectiveness and efficiency.C This is not an average of ratings of individual impact domains.D This is not an average of ratings of individual evaluation criteria but an overarching assessment of the project, drawing uponthe rating for relevance, effectiveness, efficiency, rural poverty impact, sustainability, innovation and scaling up, and gender.E The rating for partners’ performance is not a component of the overall assessment ratings.
Ratings of the PCR Document
Ratings of the PCR Document Quality IFAD-PMD ratings PCRV Rating Rating Disconnect
Scope 6 5 -1
Quality 5 4 -1
Lessons 5 4 -1
Candour 5 5 0
Overall rating PCR Document na 5

Appendix – Annex 2 EC 2013/81/W.P.4
39
Basic project data
A. Basic Project Data Approval(US$m)
Region APR Total project costs 27.24 30.40
Country Sri Lanka IFAD Loan and % of total 21.7 loan
0.34 grant
81%
1%
21.7loan
0.34grant
72%
1%
Loan Number 636 Borrower Sri Lanka 1.7 6% 1.7 6%
Type of project(sub-sector)
AGRIC Co-financier 1 UNDP
Domestic Fin. Inst.s
1.5 6% 1.5 5%
Financing Type F Co-financier 2 WFP 0 1.06 4%
Lending Terms1 Highly concessional Co-financier 3 JBIC 0 1.14 4%
Date of Approval 09 Sep 2004 Co-financier 4 CIDA 0 0.963 3%
Date of LoanSignature
15 Dec 2004 From Beneficiaries 1.7 6% 1.7 6%
Date ofEffectiveness
22 Dec 2005 From Other Sources:
Loan Amendments - Number of beneficiaries
(if appropriate, specify ifdirect or indirect)
80 000 80 000
Loan ClosureExtensions
- Cooperating Institution The World Bank The WorldBank
CountryProgrammeManagers
S.Jatta
Y.Tian
Loan Closing Date 30 Sept 2013 30 Sept 2013
RegionalDirector(s)
T.Elhaut
H.Kim
Mid-Term Review August 2009
PCR Reviewer - IFAD Loan Disbursement at
project completion (%)
98.8%
PCR QualityControl Panel
-
Sources: President’s report, PCR, Mid-term review, supervision reports, PPMS, LGS
1 There are four types of lending terms: (i) special loans on highly concessional terms, free of interest but bearing a servicecharge of three fourths of one per cent (0.75 per cent) per annum and having a maturity period of 40 years, including a graceperiod of 10 years; (ii) loans on hardened terms bearing a service charge of three fourths of one per cent (0.75 per cent) perannum and having a maturity period of 20 years, including a grace period of 10 years; (iii) loans on intermediate terms with arate of interest per annum equivalent to 50 per cent of the variable reference interest rate, and a maturity period of 20 years,including a grace period of 5 years; (iv) loans on ordinary terms with a rate of interest per annum equivalent to one hundred percent (100 per cent) of the variable reference interest rate, and a maturity period of 15 to eighteen 18 years, including a graceperiod of 3 years.

Appendix – Annex 3 EC 2013/81/W.P.4
40
Note on the surveys
Qualitative1. This part of the survey used Focus Group Discussions (FGD) and Key Informant
Interviews to gather qualitative data from project staff, relevant governmentofficers (e.g., Department of Agriculture, Department of Agrarian Department,Department of Animal Health and Production, Department of Export CropDevelopment, the Women’s Bureau, and project beneficiaries in each of the fourdistricts under the DZLiSPP: Anuradhapura, Kurunagala, Badulla and Monaragala.The guidelines for the focus group discussions and key informant interviews weredeveloped in response to the Terms of Reference prepared by the IOE using thelocal experience and knowledge of the national organization’s qualitative fieldsurvey team. The guidelines sought to ensure equal participation of men andwomen in the qualitative field survey. In addition, a series of discussionsspecifically targeting female beneficiaries, i.e., women who had participated in theApeksha micro credit programme and the Bhaghya micro finance programme, wereincluded in the strategy for the collection of qualitative data during the field survey.
2. The number of villages (GND1) in each district in which focus group discussionswere conducted with project beneficiaries, was dependent on the proportion of thetotal number of project GND present in each district. A larger number of focusgroup discussions were conducted with project beneficiaries in the districts (i.e.,Anuradhapura and Badulla) where the DZLiSPP had implemented projectinterventions in a larger number of villages (Table 1).
3. At the district level, Divisional Secretary Divisions (DSD) were randomly sampledusing the list of DSD covered by the project provided by the District ProjectManagement Unit and a DSD map of each district. In each district, DSD in whichthe project had implemented interventions were divided into ‘groups’ according totheir relative geographic location in the district (i.e., northern, southern, eastern orwestern areas of the district) and the number of field days available for thequantitative field survey. A random number was generated to select a DSD fromeach “geographic group” in each district.Table 1A summary of the proportion of total number of GND under the DZLiSPP together with the targetnumber and achieved totals of field days, key informant interviews and focus group discussionscompleted under the qualitative field survey in four districts
District % GND Target AchievedDays KII FGD Total Days KII FGD Total
Anuradhapura 37% 7 11 7 20 7 4 17 21
Kurunagala 20% 5 07 5 12 5 9 9 18
Badulla 33% 5 11 5 20 6 7 11 18
Monaragala 10% 4 07 4 12 4 10 4 14
21 36 21 64 22 30 41 71
4. At the DSD level, individual target villages were selected using the convergencelists provided by the district project units. In Anuradhapura and Kurunagaladistricts the Convergence Lists were used to identify two villages in each DSD inwhich the project had implemented suitable combinations of the main types ofproject intervention, i.e., crop, dairy, paddy, community infrastructure, Apekshaand Bhaghya.
1 Grama Niladhari Division is roughly equivalent to ‘a village’ at the local level.

Appendix – Annex 3 EC 2013/81/W.P.4
41
Table 2Sub sampling groups and DSD selected for the qualitative field survey in four districts in eachdistrict
District DSD Group DSD - Randomly Selected DSD underlined
ANP
DSD N Padaviya Kebithigolwewa, Medawachhiya Horowpathana
DSD S Palagala, Thirappane, Nachchaduwa, Thalawa, Nuwaragam PalathaEast
DSD E Kahatagasdigiliya, Gelenbidunuwewa, PalugaswewaDSD W Nuwaragam Palatha Central, Rajanganaya, Maha Wilachhiya
KURDSD N Giribawa, Galgamuwa
DSD SE Polpithigama, Ehethuwewa and MahawaDSD SW Ambanpola, Kotawehera and Rasnayakepura
BAD
DSD E Mahiyanganaya DSD and Rideemaliyadda
DSD C Kandaketiya, Meegahakivula, Lunugala, Soranathota, Badulla, Passara,Uva Paranagama, Hali Ela, Ella
DSD W Haldumulla, Bandarawela, Welimada Haputale
MON DSD NE Madulla, SiyambalanduwaDSD SW Buttala, Wellawaya, Thanamalwilla, Sewanagala
5. A total number of 312 project stakeholders were interviewed, includingrepresentatives of the project, government agencies, Development Banks, togetherwith project beneficiaries who had received project assistance for crop cultivation(12 villages), paddy farming (9 villages), dairy production (10 villages), Apeksha(7 villages) and Bhaghya micro finance programmes (8 villages) and therehabilitation and or development of community infrastructure (17 villages). A totalof 88 project interventions were discussed with the national organization, duringthe course of the qualitative field survey. A little over half of the stakeholders andbeneficiaries who participated in the 71 key informant interviews and focus groupdiscussions were women (52 per cent).Table 3A summary of the number of participants disaggregated by district and gender who participated inthe focus group discussions and key informant interviews conducted with beneficiariesrepresenting each of the six main interventions under the DZLiSPP
FGD & KII Participants DZLiSPP Interventions
District Total Men Women % Crop Paddy Dairy MF/A MF/B CI All Total
Anuradhapura 101 41 60 59% 5 4 4 3 3 3 2 24
Kurunagala 71 37 34 48% 4 4 3 3 3 1 1 19
Badulla 103 46 57 55% 5 3 4 3 2 10 1 28
Monaragala 37 27 10 27% 3 3 3 2 3 3 0 17
Total 312 151 161 52% 17 14 14 11 11 17 04 882
Quantitative6. The survey team collected data from a total of 2,567 households in 160
communities across the four districts where the project had been implemented:Anurahdhapura, Kurunegala, Monaragala, and Badulla.3 In addition to a household
2 The total of 88 exceeds the total of 71 KIIs/FGDs indicated in table 1 due to the fact that Community Infrastructurediscussions took place together with FGDs.3 At the time of design the requirement for sample size was tentatively estimated at 2500 households equally splitbetween project and comparison. This estimate is made under the assumption of a 5 per cent type 1 error, 20 per centtype 2 error and a value between 8 and 9 of the ratio between the standard deviation of the outcome and the minimumdetectable effect. In this case, a type 1 error means falsely concluding that there is a significant difference between thetreatment and comparison group when in fact there is no difference. A type 2 error means failing to detect a differencebetween treatment and comparison group when there is in fact a difference between the two. As a general formula, the

Appendix – Annex 3 EC 2013/81/W.P.4
42
survey, the team also collected data at the community level using a separatequestionnaire. The study included households and communities that receivedassistance from the DZLiSPP (treatment) and households and communities that didnot receive DZLiSPP program interventions (comparison).
Instrument Development7. An initial draft of the household survey questionnaire was iteratively piloted first in
Kurunegala and then, with a revised version, in Badulla.4 The pilot focused oncomprehension, applicability, and time. During the piloting process, the instrumentwas significantly reduced to ensure it could be implemented in less than 45minutes. Following instrument finalization, the survey was translated to Sinhala5
and formatted.
8. Since the baseline dataset was not available,6 the survey team included recallquestions for selected control variables that were expected to be recalled quiteaccurately. For example, while it was expected that assets could be accuratelyrecalled, no question was asked of recalled expenditures or crop production eventhough these represent important predictors of final outcomes, as it was expectedthat they could not be accurately recalled.
9. To aid in recall, “anchoring” to known events was promoted by asking participantsto think about the time of the “Mavil Aru”, an event connected to the resumption ofconflict in the country which happened around the beginning of the project. Forparticipants that were unfamiliar with this event, enumerators probed other, morehousehold-specific events which could serve as anchors (e.g., a wedding whichoccurred near the beginning of the project). Qualitative feedback from respondentsindicates that this anchoring aided in recall.
10. The household survey instrument was developed around the following modules:
- Metadata: This module includes informed consent; information about theenumerator and supervisor; date, time and result of visit; and identifyinginformation (which was removed from responses after the interview).
- Demographics: This module included a brief household roster along with childmeasurement data (height and weight at birth and at least measurement)through available health books. Each child under 5 years old in Sri Lanka issupposed to keep a child health book in which their height and weight, asmeasured by a community health worker, are regularly recorded. Data wereused from these books rather than directly measuring children due to cost,time, and logistical constraints.
- Assets: This section includes questions on housing conditions (e.g. housingmaterials, electricity, and water access), household assets measured currentlyand recalled for 2006, and a livestock list both currently and recalled for 2006.
following could be considered: nT = nC = 2(t α/2+tβ) 2 (σ/δ)2 where nT is the sample size for the treatment group; nC isthe sample size for the comparison group; t α/2 is the t statistics for a significance level of α; tβ is the t statistics for aprobability β of committing a type II error; σ is the standard deviation of the outcome variable; δ is the minimumdetectable difference in the means of the outcome variable between treatment and comparison. Issues related to intra-cluster correlation and multi-indicator measurement of impacts will have to be considered as well. If cluster sampling isadopted, then the above equation will have to be augmented by the additional factor of (1 + (m -1) ρ), with ρ as thecoefficient of intra-cluster correlation and m as the average number of observations within each cluster (see List, Sadoffand Wagner, 2009; and Carletto, 1999).4 The questionnaire was developed iteratively through exchanges between IOE, a national company (GreenTechConsultants Pvt.), an international company (Social Impact). It is to be noted that the international company had twoadvisors from Sri Lanka with previous professional experience in rural development including work in one of the projectdistricts. The questionnaire was shared in its draft and revised form with the project coordination team of DZLSPP.5 Translation was conducted by Green Tech and verified through two, independent translators by Social Impact. A fewminor issues in translation were identified and fixed during enumerator trainings. The enumerator team also includedTamil speakers to translate questions.6 A survey was conducted by the project in 2006 but the electronic database was not available to the project team at thetime of the conduct of this survey. The electronic database was probably lost at the time of the shift in projectmanagement that took place in 2008-2009.

Appendix – Annex 3 EC 2013/81/W.P.4
43
- Expenditures: This section includes a short list of higher-value consumptionitems (Fish, Meat/Eggs, Milk/Dairy, Prepared Foods, and Tobacco/Alcohol) plusother possible household expenses which may indicate wealth (Transport,Electricity, Water, Health, Clothing, Ceremonies, Settlement of debt, andEducation). Information on expenditures was asked over a typical two weeks ormonth or over the last year (depending on the item). Although research7
indicates that expenditure recall is more accurate over a defined time periodrather than a ‘typical’ time period, we did not ask about the last two weeks (ormonth), as that time period included a major national holiday for part of thedata collection period, which could have greatly increased variance in response.
- Agricultural Production: This module includes a table for up to 15 commoncrops which recorded whether anyone in the household had cultivated the cropin 2012, and if so, the amount of land cultivated, the production, and estimatedvalue per unit of production. It was also asked if the crop was cultivated in2006, and if so, whether production had increased, decreased, or stayedroughly the same between 2006 and 2012.
- Other: A set of questions around perceived changes to soil fertility and accessto irrigation since 2006, as well as satisfaction with access to irrigation andknowledge of crop management practices. Finally, questions were includedabout participation in trainings on topics related to agriculture.
11. The community questionnaire included information on distance to main towns,number of agriculture programs implemented in the community, and a communityasset list including things like primary and secondary schools, health clinics, policepost, market facilities (they were not provided by the project). Respondents wereasked about availability of these in the community currently as well as in 2006.
Sampling12. Due to resource constraints, data collection concentrated on 160 GNDs in 20 DSDs
across the four project Districts, even though the program was implemented inmore than 1,600 GNDs in 45 DSDs. The 160 GNDs included both GNDs thatreceived programming from the DZLiSPP and those that did not. The evaluationteam used a three-stage cluster sampling approach:
- Stage 1: DSD Level The number of DSDs to be sampled in each District wasdetermined in order to match the total percentage of project DSDs that camefrom that District. To select DSDs within a District, the team sampled based onprobabilities proportional to the number of GNDs in the DSD (based on theconvergence list prepared by the project). This means that DSDs with moreGNDs were more likely to be selected.
- Stage 2: GND Level In the second stage, the team sought to sample fourtreatment and four comparison GNDs per DSD. To do this, the team sampledseparately (stratified) by comparison and treatment GNDs.
o For comparison: randomly selected up to 4 comparison GNDs from eachDSD. In cases where a GND did not have sufficient comparison GNDsavailable, we randomly selected an additional comparison froma randomly selected DSD.
o For treatment: In each DSD, the team randomly selected the requirednumber of treatment GNDs to yield a total of 8 sampled GND per DSD8.That is, if a DSD had only 2 comparison GNDs, the team randomly
7 Beegle, et al. 2009 “Methods of Household Consumption Measurement Through Surveys” World Bank PolicyResearch Working Paper 5501 (Dec 2010): 1-478 Due to implementation logistics, the field team required 8 GNDs per DSD, although in practice we ended up with a fewDSDs with more or less than 8 GNDs due to replacements.

Appendix – Annex 3 EC 2013/81/W.P.4
44
sampled 6 treatment GNDs, and if the DSD had 5 comparison GNDs, theteam sampled 3 treatment GNDs.
13. During data collection, it was found that some sampled GNDs were incorrectlyclassified in the convergence list (i.e. a GND classified as comparison actuallyreceived program interventions and vice versa). In such cases, a replacement wasrandomly sampled from the DSD, if a replacement was available in the DSD, orfrom a randomly selected DSD in the District if not.
- Stage 3: HH Level In the third stage, the team sampled HHs according tothe GND-type:
o Sample from Beneficiary List: For villages where the implementationoffice had beneficiary lists (i.e. those villages with individual levelinterventions such as farmer field schools, microfinance, etc.), the teamrandomly sampled 16 primary respondents, plus 6 replacements, fromthe aggregated list of all beneficiaries in the GND. This group isconsidered the direct beneficiaries. If less than 22 beneficiaries werelisted, all listed beneficiaries were sampled, and enumerators wereinstructed to identify additional respondents in the GND. This group isconsidered the indirect beneficiaries.
o Sample from Community List: For intervention types without clearbeneficiary lists (i.e. comparison and GNDs with onlycommunity infrastructure projects), the team randomly sampled 16primary respondent households, plus 6 replacements, from the mostrecent election office lists, which are supposed to include a complete listof households in a given GND. Households selected this way in GNDswhere community level treatments were implemented are consideredgroup beneficiaries, and households in the comparison communities areconsidered comparisons.
Data Collection14. Prior to data collection, all field staff went through a two day training exercise
jointly led by Green Tech and Social Impact, which included an introduction to theproject, a question-by-question review of the survey instrument, field logistics, andat least two full rounds of practice with the instrument. Data collection occurred inMay-June 2013 and was staggered across the four Districts, first in Anuradhapura,then Kurunegala, followed by Badulla, and lastly Monaragala. Following completionof data collection, all questionnaires were double entered and reconciled in aspecifically designed database in SPSS which included logic checks. Additionalreview and cleaning was conducted in STATA.
Identification Approach – propensity score matching15. The survey team used a “comparison group” of communities and households that
have not participated in the program to account for any alternative causes ofchange and estimate the counterfactual, or the level of change in programparticipants the team would have expected in the absence of the program.
16. In order for the comparison group to validly estimate the counterfactual, thetreatment and comparison groups should be similar along all baselinecharacteristics that may influence outcomes of interest. This similarity is bestachieved using random assignment to treatment and comparison status. However,in the case of DZLiSPP, it was not possible to randomly assign which communitiesand individuals would participate in the program interventions, as the program wasspecifically targeted to communities of highest need, as identified by theimplementation team’s project offices. Because random assignment was notpossible in this case, propensity score matching was applied to identify a plausiblecounterfactual and distinguish the impact of the DZLiSPP from other interventions.

Appendix – Annex 3 EC 2013/81/W.P.4
45
17. This technique approximates randomization and reduces (but may fail to entirelyeliminate) selection bias by making treatment and non-treatment groups morecomparable. Confounding is reduced by using observable household andcommunity characteristics to predict the receipt of the treatment and by matchingthe participating and non-participating households on a range of observablecharacteristics. Baseline data would allow for a more robust evaluation of changesdue to the intervention; however, baseline data were not available to theevaluation team. Therefore, households are matched only on variables collectedthrough the final household and community surveys, including a mix of currentvariables that are unlikely to have been unaffected by program participation(e.g. sex of household head) and recall variables (e.g. recall of household assets atthe beginning of the program). While the lack of baseline data and the subjectiveassignment to treatment prohibit the use of the most robust evaluation designs,the propensity score matching approach (PSM)9 is considered the best optionsavailable under these circumstances.
18. It is important to note that PSM, as any quasi-experimental approach, is only ableto account for observable characteristics. The omission of any potentially predictiveunobserved characteristics that may influence both a household’s participation andoutcomes could thus still contribute to potential bias.
19. PSM utilizes the household and community characteristics as predictors in a probitregression to calculate the probability that a particular household participated inDZLiSPP, based on a set of predictor variables. Using this methodology, theexpected probability of treatment, called the propensity score, can be calculated foreach household, and households can be matched on this propensity score whichmitigates selection bias. Each sampled household is assigned a propensity score,which represents the likelihood of project participation based on the household’scharacteristics. After estimation of the propensity scores, tests were carried out forbalance and overlap, called common support, of propensity scores for thetreatment and comparison households, and observations outside the region ofcommon support were dropped.
20. After verification of balance and common support, the analysis used propensityscores to match each treatment household with its comparison. While the choicewas for kernel matching as a matching algorithm (it includes data from allcomparison observations within the region of common support, weighted by thesimilarity of the propensity scores; i.e. those comparison units with very similarpropensity scores are more heavily weighted), sensitivity tests for other commonmatching algorithms were conducted as well.
21. One important condition for the propensity score matching to correctly estimatethe impact of a program is ( , ) ⊥ | (Rosenbaum and Rubin, 1983). This saysthat after controlling for the observed covariates, the treatment assignment isindependent of the potential outcomes. It requires that all variables relevant totreatment assignment and outcome are included in the set of independentvariables, X (Rosenbaum and Rubin, 1983). To satisfy this condition, variables thatinfluence simultaneously the treatment status and outcome variable should beincluded (Sianesi, 2004; Smith and Todd, 2005). Omitting important pre-treatmentvariables can increase bias in resulting estimates (Heckman et. al., 1998; Dehejiaand Wahba, 1999).10
22. In the initial propensity score estimation only 5 variables had been included in theprobit model with only one community variable (which characterizes the distancefrom GND to District Capital). Since the program was specifically targeted to
9 PSM was first published by Rosenbaum and Rubin in: Rosenbaum, PR, and DB Rubin. “The central role of thepropensity score in observational studies for causal effects.” Biometrika 70, no. 1 (1983): 41-55.10 Revision to the analysis was performed by the School of Economic Science, Washington State University.

Appendix – Annex 3 EC 2013/81/W.P.4
46
communities of highest need, other community level characteristics that are likelyto influence the participation should also be considered in the model.
23. A revised flexible specification that includes a more complete set of pre-treatmentvariables of household and community under different treatment levels in the first-stage of the PSM can help overcome the above problems. Only variables that areunaffected by treatment should be included in the model. To ensure this, variablesshould either be fixed over time or measured before participation (Caliendo andKopeinig, 2008). Because some important variables that were measured beforeparticipation are unavailable and because of the known lack of reliability of lengthyrecall, greater emphasis was given to variables that were fixed over time.
24. These issues were addressed by examining the balance property in a revised PSM.Based on the covariates that have been included, the balance property wassatisfied by including for General Treatment, Direct Treatment, and IntenseTreatment, characteristics such as:
o on community level: distance to the DSD capital; distance to the District capital;index of community infrastructure in 2006;
o on household level: household head age; household head sex; highest educationlevel in the household; index of household assets in 2006; total number of cropsin 2006; index of livestock in 2006.
25. Other characteristics were examined, including the number of people in thehousehold, number of children under age 5, and total acres of cultivated land. Eachof these was statistically insignificant under alternative specifications for the threetreatment levels. They were dropped from the specification so as not to increasethe variance of the estimates and worsen the common support problem.
26. For Direct versus Indirect Treatment, since the treatment assignment was based onhousehold level, only household characteristics relevant to selection and outcomewere included: number of children under age 5 in 2006; household head education;household head sex; household head age; index of household assets in 2006; totalnumber of crops in 2006; index of livestock in 2006. The model examined thehighest education level in household and number of people in the household, butthey were both insignificant in explaining the participation under variousspecifications. They were dropped from the model so as not to exacerbate thecommon support problem.
27. The Heckman correction model, also known as the treatment effect model, is adirect application of Heckman’s sample selection model to estimation of treatmenteffects. It is useful in producing improved estimates of average treatment effects,particularly when data were generated by a nonrandomized experiment, and thusselection bias is non-ignorable (Guo and Fraser, 2009) and when selectionprocesses are known and are correctly specified in the selection equation. The“correct” functional form is rarely known but sensitivity analysis can help comparedifferent functional forms. In this report, the analysis uses a two-step procedure inimplementing an estimation of the Heckman correction model: (a) first specify aselection equation to model the selection process; (b) use the conditionalprobability of receiving treatment to control for selection bias in the outcomeregression equation.
28. The first step estimates the selection process, which is the same as the first stageof the revised PSM, included variables the same as those characteristics controlledin the probit model of the revised PSM based on the previous testing results. ForGeneral Treatment, Direct Treatment, and Intense Treatment, covariates includedin the selection equation are: distance to the DSD capital; distance to the Districtcapital; index of community infrastructure in 2006; household head age; householdhead sex; highest education level in the household; index of household assets in2006; total number of crops in 2006; index of livestock in 2006. For Direct versus

Appendix – Annex 3 EC 2013/81/W.P.4
47
Indirect Treatment, covariates included are: number of children under age 5 in2006; household head education; household head sex; household head age; indexof household assets in 2006; total number of crops in 2006; index of livestock in2006.
29. In the outcome regression equation, variables that can influence household’sdecisions on expenditures and assets are all included:
o Community-level variables that are correlated with community affluence andremoteness, which can influence households’ decisions on expenditures andassets: distance to the DSD capital; distance to the District capital; index ofcommunity infrastructure in 2006;
o Household-level variables that are correlated with decisions on expenditures andassets: household head age; household head sex; highest education level in thehousehold; index of household assets in 2006; total number of crops in 2006;index of livestock in 2006; number of people in the household; number ofchildren under age 5.
30. Difference in differences model is an alternative method of analysis, comparingwith and without project samples before and after the treatment. However, thedecision was taken to abandon it because of limited number of reliable householddata before the treatment began.
The survey and IFAD’s impact domains31. IFAD’s Evaluation Manual adopts five domains for impact assessment (see Table 4,
first column on the left). DZLISPP design document included a logframe but not aformal “model of change” in a graphic form, nor an explanation of the causal chainthrough which certain interventions would contribute to certain results. This is quitea common case at IFAD and elsewhere. From the general project description andthe available documentation (supervision, progress reports, HARTI studies), inprinciple all impact domains could be relevant to the programme. In fact, inaddition to improving households’ economic conditions (e.g. incomes and assets)and nutrition status, the programme had an important agricultural extensioncomponent aimed at improving knowledge on crop management (a dimension ofhuman capital).
32. Similarly, the support to grass-roots organizations can be expected to haveaffected community groups and networks (social capital). Agricultural developmentinitiatives are likely to have interacted with the environmental resources (soil andwater, for example). Finally, the process of engaging with poor rural clients mayalso have brought about changes in institutions and private-sector organizationsoperating in rural areas (e.g. public agencies, NGOs, private companies), and theFAO work on land tenure may have led to policy dialogue activities.
33. Tables 4 and 5 illustrate, respectively, the expected focus area of the quantitativeand qualitative analysis, which were envisaged taking into account informationavailable and the type of data that could be realistically be collected under timeand data constraints.
34. Given that a formal description of the impact pathway was not provided in theoriginal project design, rather than “rationalizing ex post” the project, which wouldhave been quite artificial, it was decided to create a much more simple map of thelikely relationship between the project’s main components, their immediate effectsand the main impact domains of IFAD (Table 5) and use this map as a referencepoint for the exercise.

Appendix – Annex 3 EC 2013/81/W.P.4
48
Table 4Impact domains and analytical focus areas of the survey
Analytical focus areas
Impact domains Quantitative Qualitative
Household income and assets Household income sources, householdexpenditures and their main compositionHousehold productive assets (includingagricultural implements, livestock) anddurable goods (including house quality
improvements)
-
Human and social capital andempowerment
Access to health services and basicinfrastructure
Access to training, extension andadoption of improved practices
Access to farmers’ organizations and theirnetworks
Better knowledge of crop and livestockmanagement. Collective action of grass-
roots organizations
Gender equality in (i) information andtraining and income-generating activities; (ii)
rural institutions; (iii) economic and socialbenefits
Food security and agriculturalproductivity
Data on household food self-sufficiency(e.g. number of months of food self-
sufficiency).
Data on child malnutrition
Data on crop yields
-
Natural resources,environment, climate change
- Soil and water management, vegetativecover
Institutions and policies - Changes in policies and pro-poor orientationof public agencies and private-sector
organizationsSource: IOE (2013)
Table 5Examples of chain of effects from programme components to impact domainsProgramme components Immediate effects Impact domains concerned
Dryland agriculture andlivestock: technicalpackages through farmerfield schools
Availability of improved seeds, inputs Exposure to improved crop and fruit
tree management and enhancedcattle- rearing techniques
Diversification to higher- value cropsand products
Strengthened grass-rootsorganizations
Intended / unintended effects on soils
Human capital (technical know-how oncrops and water management)
Household income and assets (throughhigher agricultural profits)
Farm productivity and food security(higher yields and better crop
management) Environment and natural resources, either
positive (watershed protection, fertilityenhancement) or detrimental (e.g. erosion)
Rehabilitation of villagemicro tanks
Complementary irrigation and largercommand area
Village ponds allow for fish production
Farm productivity and food security (higheryields and better crop management)
Microenterprisedevelopment, marketing
Microfinance
Processing of agricultural products,demand increase for agricultural
products, value chain linkages Non-agricultural income-generating
activities Availability of improved inputs
Human capital ( entrepreneurial skills) Household income and assets
(diversification of income sources,stabilization of income)
Institutions and policies (Public and privateorganization work more with poor clients)
Basic communityinfrastructure (roads, healthposts)
Mobility of people enhanced Reduced transportation costs for
agricultural produce Storage and collection points for
agricultural produce
Social capital (contacts with people,groups and organizations)
Household income and assets (throughbetter access to roads and markets)
Human capital (better access to healthcare, education facilities)
Source: IOE (2013)

Appendix – Annex 4 EC 2013/81/W.P.4
49
Definition of the evaluation criteria used by IOE
Criteria Definitiona
Project performanceRelevance The extent to which the objectives of a development intervention are consistent
with beneficiaries’ requirements, country needs, institutional priorities andpartner and donor policies. It also entails an assessment of project design inachieving its objectives.
Effectiveness The extent to which the development intervention’s objectives were achieved, orare expected to be achieved, taking into account their relative importance.
Efficiency A measure of how economically resources/inputs (funds, expertise, time, etc.)are converted into results.
Rural poverty impactb Impact is defined as the changes that have occurred or are expected to occur inthe lives of the rural poor (whether positive or negative, direct or indirect,intended or unintended) as a result of development interventions.
Household income andassets
Household income provides a means of assessing the flow of economic benefitsaccruing to an individual or group, whereas assets relate to a stock ofaccumulated items of economic value.
Human and social capitaland empowerment
Human and social capital and empowerment include an assessment of thechanges that have occurred in the empowerment of individuals, the quality ofgrassroots organizations and institutions, and the poor’s individual and collectivecapacity.
Food security andagricultural productivity
Changes in food security relate to availability, access to food and stability ofaccess, whereas changes in agricultural productivity are measured in terms ofyields.
Natural resources, theenvironment and climatechange
The focus on natural resources and the environment involves assessing theextent to which a project contributes to changes in the protection, rehabilitationor depletion of natural resources and the environment as well as in mitigatingthe negative impact of climate change or promoting adaptation measures.
Institutions and policies The criterion relating to institutions and policies is designed to assess changesin the quality and performance of institutions, policies and the regulatoryframework that influence the lives of the poor.
Other performance criteria
Sustainability The likely continuation of net benefits from a development intervention beyondthe phase of external funding support. It also includes an assessment of thelikelihood that actual and anticipated results will be resilient to risks beyond theproject’s life.
Innovation and scaling up The extent to which IFAD development interventions have: (i) introducedinnovative approaches to rural poverty reduction; and (ii) the extent to whichthese interventions have been (or are likely to be) replicated and scaled up bygovernment authorities, donor organizations, the private sector and othersagencies.
Gender equality andwomen’s empowerment
The criterion assesses the efforts made to promote gender equality andwomen’s empowerment in the design, implementation, supervision andimplementation support, and evaluation of IFAD-assisted projects.
Overall project achievement This provides an overarching assessment of the project, drawing upon theanalysis made under the various evaluation criteria cited above.
Performance of partners IFAD Government
This criterion assesses the contribution of partners to project design, execution,monitoring and reporting, supervision and implementation support, andevaluation. It also assesses the performance of individual partners against theirexpected role and responsibilities in the project life cycle.
a These definitions have been taken from the OECD/DAC Glossary of Key Terms in Evaluation and Results-BasedManagement and from the IFAD Evaluation Manual (2009).
b The IFAD Evaluation Manual also deals with the “lack of intervention”, that is, no specific intervention may have been foreseenor intended with respect to one or more of the five impact domains. In spite of this, if positive or negative changes are detected andcan be attributed in whole or in part to the project, a rating should be assigned to the particular impact domain. On the other hand, ifno changes are detected and no intervention was foreseen or intended, then no rating (or the mention “not applicable”) is assigned.

Appendix – Annex 5 EC 2013/81/W.P.4
50
List of key persons met
Government and Project
Hon Mahinda Yapa Abeywardena, Minister of Agriculture of Sri Lanka
Mr V.M. Ameen, Additional Director General, Department of Project Management andMonitoring, Ministry of Finance and Planning
Dr R.M. Ariyadasa, Provincial Director, Department of Animal Production and Health,District of Badulla
Mr T.M. Ariyarathne, District Programme Manager, Monaragala
Mr A.M.R.K. Attanayake, Additional Director, Regional Development Department, CentralBank of Sri Lanka
Mr M.A.B.C Aloka Bandara, District Programme Manager, Kurunegala
Ms Dharshana Senanayake, Director General, Department of Project Management andMonitoring, Ministry of Finance and Planning
Mr I.H. Dharmasekara, Monitoring and Evaluation Specialist, District of Badulla
Mr Wijitha Bandara Ekanayake, Chief Secretary, North Western Province
Mr Wijerathne Sakalasooriya, Secretary, Ministry of Agriculture
Mr L.K. Hathurusinghe, Director-Projects, Ministry of Agriculture
Mr P N.N. Javanethi, Deputy Director-Projects, Ministry of Agriculture
Ms T.G. Chandra Malanei, Assistant Director, Department of Project Management andMonitoring, Ministry of Finance and Planning
Mr R.M. Nandashiri, Provincial Director of Agriculture, Uva Province
Mr Karunapala Rajapaksha, Monitoring and Evaluation Specialist, Dry Zone LivelihoodSupport and Partnership Programme
Mr Navaratna Walisundara, Coordinator, Dry Zone Livelihood Support and PartnershipProgramme
Mr D.B.T. Wijerayatne, Additional Secretary, Ministry of Agriculture
International cooperation
Mr Abimbola Adubi, Senior Agricultural Specialist, The World Bank – Sri Lanka
Mr Graham Dixie, Agribusiness Unit Team Leader Agriculture and Rural Development,The World Bank, Washington DC
Mr Nihal Atapattu, Senior Development Officer, High Commission of Canada in Sri Lanka
Ms Vichitrani Gunawardene, Technical Advisor - Agriculture, The World Bank – Sri Lanka
Mr Anura Herath, Country Programme and Knowledge Officer, IFAD – Sri Lanka
Mr Jean Michel Jordan, Director of Cooperation, Swiss Agency for Development andCooperation
Mr Hiroyuki Kawamoto, Representative, Japan International Cooperation Agency in SriLanka
Mr Thomas Litscher, Ambassador of Switzerland
Ms Namal Ralapanawe, Project Specialist, Japan International Cooperation Agency in SriLanka
Ms Dagny Mjøs, Counsellor, Royal Norwegian Embassy in Sri Lanka

Appendix – Annex 5 EC 2013/81/W.P.4
51
Ms Vidya Perera, Senior Advisor, Development, Royal Norwegian Embassy in Sri Lanka
Specialists
Mr Sarath Mananwatte, Private Consultant
Mr Steeve Creech, Consultant, GreenTech Consultants [Pvt.] Ltd.
Ms Dushanthi Fernando, GreenTech Consultants [Pvt.] Ltd.
Mr Diyath Gunawardana, Director GreenTech Consultants [Pvt.] Ltd.

Appendix – Annex 6 EC 2013/81/W.P.4
52
Bibliography
Bamberger, M., Rugh, J., & Mabry, L. (2007). Real World Evaluation: Working UnderBudget, Time, Data, and Political Constraints. USA: Sage Publications.
Becker, SO, and A. Ichino. 2002. “Estimation of Average Treatment Effects Based onPropensity Scores.” The Stata Journal 2 (Number 4): 358–377.
Beegle, et al. 2009 “Methods of Household Consumption Measurement Through Surveys”World Bank Policy Research Working Paper 5501 (Dec 2010): 1-47
Caliendo, Marco, and Sabine Kopeinig. 2008. “Some Practical Guidance for theImplementation of Propensity Score Matching.” Journal of Economic Surveys 22 (1)(February): 31–72.
Carletto, C. (1999). Constructing Samples for Characterizing Household Food Securityand for Monitoring and Evaluating Food Security Interventions: Theoretical Concernsand Practical Guidelines. IFPRI technical Guide 8. Washington DC.
Dehejia, RH, and Sadek Wahba. 1999. “Causal Effects in Nonexperimental Studies:Reevaluating the Evaluation of Training Programs.” Journal of the American Statistical …94 (448): 1053–1062.
Gertler, P.J., Martinez, S., Premand, P., Rawlings, L.B., Vermeersch, C.M. (2011).Impact Evaluation in Practice. Washington DC: The World Bank.
Guo, Shengyang, and Mark W. Fraser. 2009. Propensity Score Analysis. SAGEPublications,Inc.
Harder, VS, EA Stuart, and JC Anthony. 2010. “Propensity Score Techniques and theAssessment of Measured Covariate Balance to Test Causal Associations in PsychologicalResearch.” Psychological Methods 15 (3): 234–249.
Heckman, James J., Hidehiko Ichimura, and Petra Todd. 1998. “Matching As AnEconometric Evaluation Estimator.” Review of Economic Studies 65 (2) (April): 261–294.
IEG World Bank (2011). Impact Evaluation in Agriculture. An Assessment of theEvidence. Washington DC.
IEG World Bank (2012). World Bank Group Impact Evaluations. Relevance and
Effectiveness. Washington DC.
IFAD-Office of Evaluation (2009). Evaluation Manual. Methodology and Processes.Rome: International Fund for Agricultural Development.
Khandker, S.R., Koolwal, G.B., Samad, H.A. (2010). Handbook on Impact Evaluation.Quantitative Methods and Practices. Washington DC: The World Bank.
Mathison, S. (1988). Why Triangulate? Educational Researcher, 17 (2), 13-18.
IED-ADB (2007). Impact of Microfinance on Rural Households in The Philippines. A CaseStudy from the Special Evaluation Study on the Effects of Microfinance Operations onPoor Rural Households and the Status of Women. Manila: Operations EvaluationDepartment, The Asian Development Bank.
Idem (2009). Impact of Rural Water Supply and Sanitation in Punjab, Pakistan. Manila:Operations Evaluation Department, The Asian Development Bank.
Idem (2011). Impact Evaluation Study on Asian Development Bank’s Assistance forLow- Income Housing Finance in Sri Lanka. Manila: Operations Evaluation Department,he Asian Development Bank.
Idem (2012). Groundwater Mining for Irrigation: A Match or Mismatch for HumanWelfare?—Evidence from Nepal's Shallow Tubewells. Manila: Operations EvaluationDepartment, The Asian Development Bank.

Appendix – Annex 6 EC 2013/81/W.P.4
53
Jalan, J. and Ravallion, M. (2003). Estimating the Benefit Incidence of AntipovertyProgram by Propensity-Score Matching. Journal of Business and Economic Statistics 21(1):19-30.
Rosenbaum, P. and Rubin, D. (1983). The Central Role of the Propensity Score inObservational Studies for Causal Effects. Biometrika, 70, pp. 41-50.
——. 1985. “Constructing a Control Group Using Multivariate Matched Sampling MethodsThat Incorporate the Propensity Score.” The American Statistician 39 (1): 33–38.
List, J.A., Sadoff, S. and Wagner, M. (2009). So You Want to Run an Experiment,Now What? Some Simple Rules of Thumb for Optimal Experimental Design. CarloAlberto Notebooks No. 125. Turin, Italy.
Sianesi, Barbara. 2004. “An Evaluation of the Swedish System of Active Labor MarketPrograms in the 1990s.” Review of Economics and Statistics 86 (February): 133–155.
Smith, Jeffrey A., and Petra E. Todd. 2005. “Does Matching Overcome LaLonde’sCritique of Nonexperimental Estimators?” Journal of Econometrics 125 (1-2) (March):305–353
Tashakkori A., and Teddlie, C. (1998). Mixed Methodology: Combining Qualitative andQuantitative Approaches. Sage Publications, California, USA.

Appendix
–Annex 7
EC 2013/81/W
.P.4
54
Tables from the quantitative household survey
A. Results of Treatment Effect MethodTable A.1Trends in crops grown and yields of paddy and maize - Treatment Effect Method
Agriculture General Treatment Direct Beneficiaries Intense TreatmentDirect versus Indirect
Treatment
Coefficient N Coefficient N Coefficient N Coefficient N
Proportion of crops grown where there is an increase incrop harvest
1.036(1.22) 1621
-1.611(-0.81) 1328
-0.109(-0.28) 919
0.157(0.44) 953
Negative of proportion of crops grown where there is adecrease in crop harvest
1.383(1.17) 1710
1.061(0.69) 1392
0.987*(1.78) 964
-0.291(-0.70) 1007
Total number of crops grown in 2012/total number ofcrops grown in 2006
-0.079(-0.11) 1641
-0.041(-0.04) 1343
0.303(0.80) 931
-0.056(-0.16) 963
Log of productivity of paddy crops during the Yalaseason (kg/acre)
-5.322(-0.54) 563
2.222(0.80) 476
-2.133(-1.63) 355
-4.086(-0.57) 242
Log of productivity of paddy crops during the Mahaseason (kg/acre)
-0.567(-0.21) 1329
4.323(0.67) 1083 1.638* (1.65) 730
-0.068(-0.10) 743
Log of productivity of Maize (kg/acre)-0.341(-0.14) 534
0.651(0.26) 425
1.222(0.85) 293
-2.003(-1.31) 360
Note: t statistics in parentheses*** p<0.01, ** p<0.05, * p<0.1
Table A.2Eating a limited number of meals - Treatment Effect Method
Meals General Treatment Direct Beneficiaries Intense TreatmentDirect versus Indirect
Treatment
Coefficient N Coefficient N Coefficient N Coefficient NOver the last month, how often did youconsume only one or two meals perday? (1-Often, 2-Sometimes,3-Never)
0.683(1.52) 2536
-0.271(-0.66) 2096
-0.278(-1.35) 1584
0.509**(2.10) 1284
Note: t statistics in parentheses*** p<0.01, ** p<0.05, * p<0.1

Appendix
–Annex 7
EC 2013/81/W
.P.4
55
Table A.3Water and soil fertility - Treatment Effect Method
AgricultureGeneral Treatment Direct Beneficiaries Intense Treatment
Direct versus IndirectTreatment
Coefficient N Coefficient N Coefficient N Coefficient N
How has your access to irrigation changed since 2006?(1 = decreased, 2 = same, 3 = improved)
1.120***(18.44) 1647
-0.016(-0.03) 1337
-0.643(-1.24) 921
0.222(0.35) 971
What is your level of satisfaction with access to water,including irrigation, for agriculture?(1 = unsatisfied, 2 = neutral 3 = satisfied)
0.547(0.92) 1688
0.348(0.40) 1361
1.016(1.34) 940
0.318(0.51) 993
How has the fertility of your soil changed since 2006?(1 = decreased, 2 = same, 3 = improved)
0.345(0.40) 1673
-0.858(-1.58) 1369
-0.338(-0.77) 945
-0.611(-1.08) 999
Table A.4Expenditures – Treatment Effect Method
Log of Expenditures General Treatment Direct Beneficiaries Intense TreatmentDirect versus Indirect
Treatment
Coefficient N Coefficient N Coefficient N Coefficient N
Log of total expenditures in a typical two weeks0.621(0.78) 2549
0.389(0.49) 2108
-0.839**(-2.04) 1592
1.305**(2.39) 1290
Log of total food expenditures in a typical two weeks0.715(0.76) 2523
0.195(0.21) 2086
-0.684(-1.45) 1575
0.520(0.94) 1277
Log of total non-food expenditures in a typical two weeks0.191(0.20) 2549
-0.172(-0.18) 2108
-1.164**(-2.36) 1592
1.810***(2.60) 1290
Log of expenditures on fish in a typical two weeks0.679(0.73) 2363
0.056(0.06) 1952
-0.452(-0.94) 1473
0.036(0.07) 1201
Log of expenditures on meat and eggs in a typical two weeks1.167(0.94) 2073
-0.398(-0.32) 1703
-0.511(-0.84) 1294
-0.262(-0.43) 1055
Log of expenditures on milk and dairy foods in a typical twoweeks
2.231(1.62) 1807 1.760* (1.69) 1500
0.128(0.27) 1163 1.043* (1.73) 872

Appendix
–Annex 7
EC 2013/81/W
.P.4
56
Table A.4Expenditures – Treatment Effect Method
Log of Expenditures General Treatment Direct Beneficiaries Intense TreatmentDirect versus Indirect
Treatment
Coefficient N Coefficient N Coefficient N Coefficient N
Log of expenditures on prepared food (including bread) in atypical two weeks
1.214(1.12) 1797
0.963(0.89) 1492
-0.713(-1.40) 1117
0.752(1.21) 915
Log of expenditures on fruits in a typical two weeks0.725(0.77) 1303
0.844(0.93) 1076
-1.186*(-1.73) 831
1.146**(2.08) 606
Log of expenditures on tobacco and alcohol in a typical twoweeks
2.737(1.06) 427
5.438(0.95) 338
0.791(0.36) 238
1.711(0.77) 235
Log of expenditures on transportation in a typical two weeks1.448(1.03) 2280
0.032(0.02) 1886
-1.261*(-1.89) 1407
0.630(0.92) 1169
Log of expenditures on electricity in a typical month-2.220*(-1.85) 2162
-0.617(-0.60) 1771
-0.396(-0.65) 1337
1.567**(2.49) 1078
Log of expenditures on water a typical month0.415(0.47) 862
1.524(1.64) 706 0.641 (1.05) 552
-0.304(-0.36) 401
Log of expenditures on health in the last year-2.144(-1.34) 2406
-2.743*(-1.68) 1996
-2.738***(-3.49) 1505
1.338(1.55) 1214
Log of expenditures on clothing in the last year0.083(0.09) 2345
0.153(0.16) 1935
-0.583(-1.26) 1450
0.413(0.81) 1203
Log of expenditures on ceremonies in the last year0.430(0.36) 2377
0.788(0.61) 1969 0.064 (0.10) 1466 1.232* (1.85) 1222
Log of expenditures on settlement of debt in the last year0.267(0.16) 923
2.560(1.00) 758 0.647 (0.49) 524
4.978(1.19) 514
Log of expenditures on education in the last year1.211(0.75) 1478
-0.880(-0.48) 1209
-1.983**(-2.06) 898
1.209(1.03) 789
Note: t statistics in parentheses*** p<0.01, ** p<0.05, * p<0.1
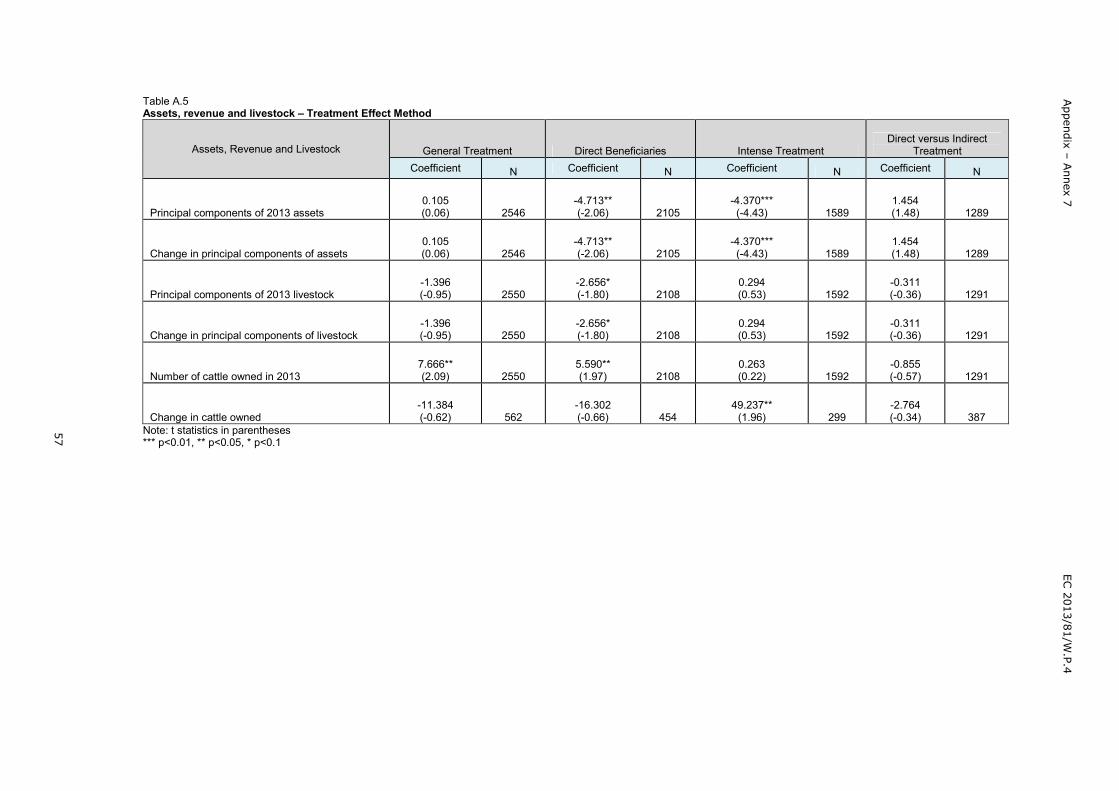
Appendix
–Annex 7
EC 2013/81/W
.P.4
57
Table A.5Assets, revenue and livestock – Treatment Effect Method
Assets, Revenue and Livestock General Treatment Direct Beneficiaries Intense TreatmentDirect versus Indirect
TreatmentCoefficient N Coefficient N Coefficient N Coefficient N
Principal components of 2013 assets0.105(0.06) 2546
-4.713**(-2.06) 2105
-4.370***(-4.43) 1589
1.454(1.48) 1289
Change in principal components of assets0.105(0.06) 2546
-4.713**(-2.06) 2105
-4.370***(-4.43) 1589
1.454(1.48) 1289
Principal components of 2013 livestock-1.396(-0.95) 2550
-2.656*(-1.80) 2108
0.294(0.53) 1592
-0.311(-0.36) 1291
Change in principal components of livestock-1.396(-0.95) 2550
-2.656*(-1.80) 2108
0.294(0.53) 1592
-0.311(-0.36) 1291
Number of cattle owned in 20137.666**(2.09) 2550
5.590**(1.97) 2108
0.263(0.22) 1592
-0.855(-0.57) 1291
Change in cattle owned-11.384(-0.62) 562
-16.302(-0.66) 454
49.237**(1.96) 299
-2.764(-0.34) 387
Note: t statistics in parentheses*** p<0.01, ** p<0.05, * p<0.1

Appendix
–Annex 7
EC 2013/81/W
.P.4
58
B. Results of Propensity Score Matching
Table B.1aTrends in crops grown and yields of paddy and maize – Propensity Score Matching
General Treatment Direct Beneficiaries
MatchingTreatment
Mean Treated NControlMean
ControlN Difference T-stat Matching
TreatmentMean
TreatedN
ControlMean
ControlN Difference T-stat
Proportion of crops grown where there is an increase in crop harvest
Unmatched 0.183 0.136 0.047 2.77*** Unmatched 0.196 0.136 0.060 3.22***
Matched 0.183 953 0.156 668 0.027 1.55 Matched 0.196 660 0.155 668 0.041 2.12**
Proportion of crops grown where there is a decrease in crop harvest
Unmatched 0.400 0.443 -0.043 -1.90* Unmatched 0.401 0.443 -0.042 -1.70*
Matched 0.400 1,007 0.426 703 -0.025 -1.07 Matched 0.401 689 0.429 703 -0.028 -1.09
Total number of crops grown in 2012/total number of crops grown in 2006
Unmatched 1.105 1.073 0.032 1.78* Unmatched 1.096 1.073 0.023 1.25
Matched 1.105 963 1.069 678 0.035 1.93* Matched 1.096 665 1.068 678 0.028 1.42
Productivity of paddy crops during the Yala season (kg/acre)
Unmatched 1426.338 1402.454 23.884 0.35 Unmatched 1428.383 1402.454 25.929 0.32
Matched 1426.338 242 1433.064 321 -6.726 -0.10 Matched 1428.383 155 1429.671 321 -1.288 -0.02
Productivity of paddy crops during the Maha season (kg/acre)
Unmatched 1571.525 2021.733 -450.208 -1.04 Unmatched 1694.116 2021.733 -327.618 -0.62
Matched 1571.525 743 2161.727 586 -590.202 -1.18 Matched 1694.116 497 2062.421 586 -368.305 -0.69
Productivity of Maize (kg/acre)
Unmatched 1238.410 1176.250 62.160 0.56 Unmatched 1239.168 1176.250 62.918 0.52
Matched 1238.410 360 1209.027 174 29.383 0.23 Matched 1239.168 251 1197.653 174 41.514 0.31Note: Level of significance: *** p<0.01, ** p<0.05, * p<0.1
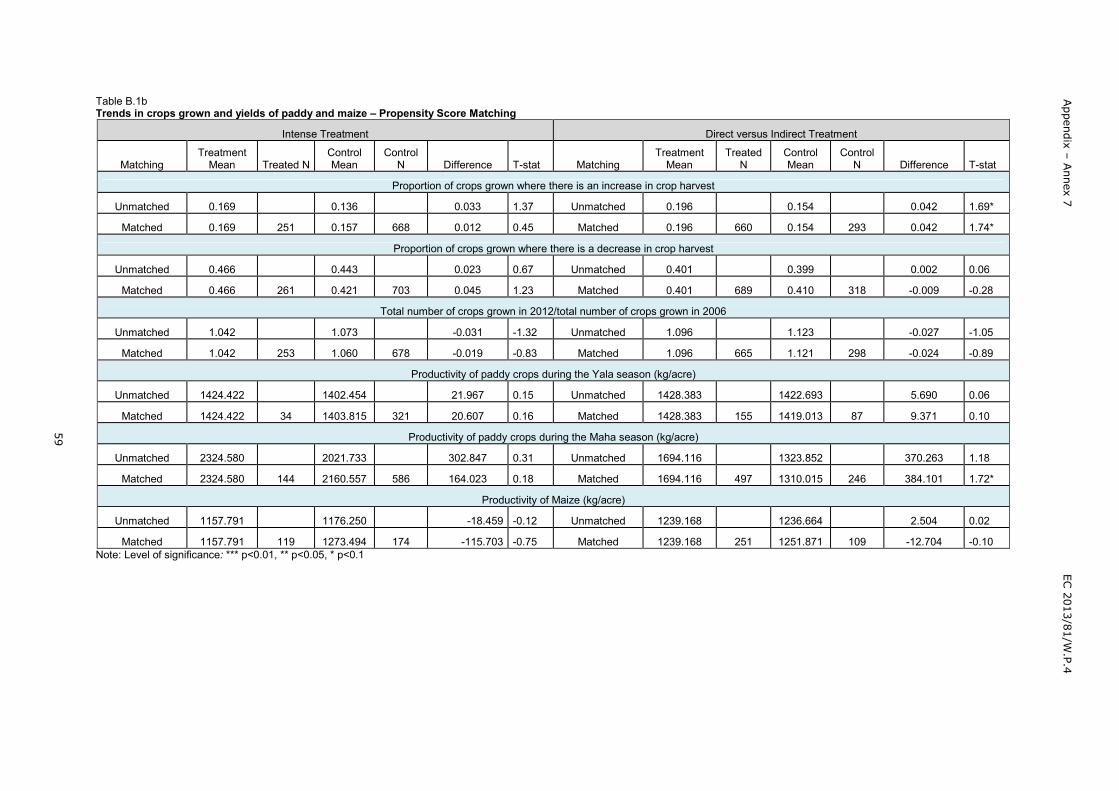
Appendix
–Annex 7
EC 2013/81/W
.P.4
59
Table B.1bTrends in crops grown and yields of paddy and maize – Propensity Score Matching
Intense Treatment Direct versus Indirect Treatment
MatchingTreatment
Mean Treated NControlMean
ControlN Difference T-stat Matching
TreatmentMean
TreatedN
ControlMean
ControlN Difference T-stat
Proportion of crops grown where there is an increase in crop harvest
Unmatched 0.169 0.136 0.033 1.37 Unmatched 0.196 0.154 0.042 1.69*
Matched 0.169 251 0.157 668 0.012 0.45 Matched 0.196 660 0.154 293 0.042 1.74*
Proportion of crops grown where there is a decrease in crop harvest
Unmatched 0.466 0.443 0.023 0.67 Unmatched 0.401 0.399 0.002 0.06
Matched 0.466 261 0.421 703 0.045 1.23 Matched 0.401 689 0.410 318 -0.009 -0.28
Total number of crops grown in 2012/total number of crops grown in 2006
Unmatched 1.042 1.073 -0.031 -1.32 Unmatched 1.096 1.123 -0.027 -1.05
Matched 1.042 253 1.060 678 -0.019 -0.83 Matched 1.096 665 1.121 298 -0.024 -0.89
Productivity of paddy crops during the Yala season (kg/acre)
Unmatched 1424.422 1402.454 21.967 0.15 Unmatched 1428.383 1422.693 5.690 0.06
Matched 1424.422 34 1403.815 321 20.607 0.16 Matched 1428.383 155 1419.013 87 9.371 0.10
Productivity of paddy crops during the Maha season (kg/acre)
Unmatched 2324.580 2021.733 302.847 0.31 Unmatched 1694.116 1323.852 370.263 1.18
Matched 2324.580 144 2160.557 586 164.023 0.18 Matched 1694.116 497 1310.015 246 384.101 1.72*
Productivity of Maize (kg/acre)
Unmatched 1157.791 1176.250 -18.459 -0.12 Unmatched 1239.168 1236.664 2.504 0.02
Matched 1157.791 119 1273.494 174 -115.703 -0.75 Matched 1239.168 251 1251.871 109 -12.704 -0.10Note: Level of significance: *** p<0.01, ** p<0.05, * p<0.1

Appendix
–Annex 7
EC 2013/81/W
.P.4
60
Table B.2aEating a limited number of meals - Propensity Score Matching
General Treatment Direct Beneficiaries
MatchingTreatment
Mean Treated NControlMean Control N Difference T-stat Matching
TreatmentMean Treated N
ControlMean Control N Difference T-stat
Over the last month, how often did you consume only one or two meals per day? (3-Never, 2-Sometimes,1-Often)
Unmatched 2.920 2.920 0.000 -0.02 Unmatched 2.930 2.920 0.010 0.74
Matched 2.920 1,285 2.932 1,251 -0.012 -0.87 Matched 2.930 845 2.931 1,251 -0.001 -0.06Note: Level of significance: *** p<0.01, ** p<0.05, * p<0.1
Table B.2bEating a limited number of meals - Propensity Score Matching
Intense Treatment Direct versus Indirect Treatment
MatchingTreatment
Mean Treated NControlMean
ControlN Difference T-stat Matching
TreatmentMean Treated N
ControlMean
ControlN Difference T-stat
Over the last month, how often did you consume only one or two meals per day? (3-Never, 2-Sometimes,1-Often)
Unmatched 2.934 2.920 0.014 0.74 Unmatched 2.930 2.900 0.030 1.61
Matched 2.934 333 2.926 1,251 0.008 0.44 Matched 2.930 845 2.902 439 0.028 1.32Note: Level of significance: *** p<0.01, ** p<0.05, * p<0.1

Appendix
–Annex 7
EC 2013/81/W
.P.4
61
Table B.3aWater and soil fertility - Propensity Score Matching
General Treatment Direct Beneficiaries
MatchingTreatment
Mean Treated NControlMean
ControlN Difference T-stat Matching
TreatmentMean
TreatedN
ControlMean
ControlN Difference T-stat
How has your access to irrigation changed since 2006?
Unmatched 2.113 2.102 0.010 0.32 Unmatched 2.100 2.102 -0.002 -0.05Matched 2.113 966 2.115 674 -0.002 -0.05 Matched 2.100 657 2.111 674 -0.010 -0.28
What is your level of satisfaction with access to water, including irrigation, for agriculture?
Unmatched 1.859 1.892 -0.033 -0.88 Unmatched 1.854 1.892 -0.039 -0.94
Matched 1.859 988 1.865 678 -0.005 -0.14 Matched 1.854 677 1.856 678 -0.002 -0.05How has the fertility of your soil changed since 2006?
Unmatched 1.598 1.547 0.051 1.69* Unmatched 1.609 1.547 0.062 1.91*Matched 1.598 994 1.554 680 0.043 1.40 Matched 1.609 683 1.549 680 0.060 1.77*
Table B.3bWater and soil fertility - Propensity Score Matching
Intense Treatment Direct versus Indirect Treatment
MatchingTreatment
Mean Treated NControlMean
ControlN Difference T-stat Matching
TreatmentMean
TreatedN
ControlMean
ControlN Difference T-stat
How has your access to irrigation changed since 2006?
Unmatched 2.045 2.102 -0.057 -1.19 Unmatched 2.100 2.139 -0.039 -0.85
Matched 2.045 243 2.113 674 -0.068 -1.34 Matched 2.100 657 2.158 309 -0.057 -1.24What is your level of satisfaction with access to water, including irrigation, for agriculture?
Unmatched 1.872 1.892 -0.020 -0.36 Unmatched 1.854 1.871 -0.018 -0.34
Matched 1.872 258 1.848 678 0.024 0.42 Matched 1.854 677 1.888 311 -0.034 -0.65How has the fertility of your soil changed since 2006?
Unmatched 1.606 1.547 0.059 1.37 Unmatched 1.609 1.572 0.037 0.88
Matched 1.606 259 1.550 680 0.056 1.21 Matched 1.609 683 1.564 311 0.045 1.08Note: Level of significance: *** p<0.01, ** p<0.05, * p<0.1

Appendix
–Annex 7
EC 2013/81/W
.P.4
62
Table B.4aExpenditures – Propensity Score Matching
General Treatment Direct Beneficiaries
Matching Treatment Mean Comparison Mean Difference S.E. T-stat Matching Treatment Mean Comparison Mean Difference S.E. T-stat
Total expenditures in a typical two weeks
Unmatched 6448.772 6733.984 -285.211 221.278 -1.29 Unmatched 6254.010 6733.984 -479.974 211.849 -2.27**
Matched 6448.772 6747.320 -298.548 236.415 -1.26 Matched 6254.010 6784.907 -530.897 224.579 -2.36**
Total food expenditures in a typical two weeks
Unmatched 2171.864 2349.893 -178.029 80.252 -2.22** Unmatched 2027.809 2349.893 -322.083 82.420 -3.91***
Matched 2171.864 2372.392 -200.528 86.848 -2.31** Matched 2027.809 2388.579 -360.769 87.060 -4.14***
Total non-food expenditures in a typical two weeks
Unmatched 4276.909 4384.091 -107.182 175.167 -0.61 Unmatched 4226.201 4384.091 -157.890 171.532 -0.92
Matched 4276.909 4374.928 -98.019 187.052 -0.52 Matched 4226.201 4396.328 -170.127 183.302 -0.93
Expenditures on fish in a typical two weeks
Unmatched 729.401 766.635 -37.233 29.346 -1.27 Unmatched 698.251 766.635 -68.384 32.321 -2.12**
Matched 729.401 788.665 -59.264 32.166 -1.84* Matched 698.251 796.541 -98.290 34.205 -2.87***
Expenditures on meat and eggs in a typical two weeks
Unmatched 637.532 677.444 -39.912 43.118 -0.93 Unmatched 573.778 677.444 -103.666 37.175 -2.79***
Matched 637.532 697.366 -59.833 45.001 -1.33 Matched 573.778 702.675 -128.897 39.557 -3.26***
Expenditures on milk and dairy foods in a typical two weeks
Unmatched 519.398 585.548 -66.150 30.271 -2.19** Unmatched 506.338 585.548 -79.210 30.823 -2.57**
Matched 519.398 582.229 -62.831 32.180 -1.95* Matched 506.338 580.580 -74.242 33.606 -2.21**
Expenditures on prepared food (including bread) in a typical two weeks
Unmatched 341.030 353.351 -12.320 21.865 -0.56 Unmatched 331.966 353.351 -21.385 23.633 -0.90
Matched 341.030 363.773 -22.743 23.092 -0.98 Matched 331.966 366.149 -34.183 26.182 -1.31
Expenditures on fruits in a typical two weeks
Unmatched 191.903 271.966 -80.062 15.961 -5.02*** Unmatched 175.923 271.966 -96.043 17.930 -5.36***
Matched 191.903 258.293 -66.389 18.205 -3.65*** Matched 175.923 259.646 -83.723 18.236 -4.59***

Appendix
–Annex 7
EC 2013/81/W
.P.4
63
Table B.4aExpenditures – Propensity Score Matching
General Treatment Direct Beneficiaries
Matching Treatment Mean Comparison Mean Difference S.E. T-stat Matching Treatment Mean Comparison Mean Difference S.E. T-stat
Expenditures on tobacco and alcohol in a typical two weeks
Unmatched 192.017 270.521 -78.504 37.891 -2.07** Unmatched 189.660 270.521 -80.861 44.531 -1.82*
Matched 192.017 267.711 -75.694 44.468 -1.70* Matched 189.660 270.602 -80.942 47.143 -1.72*
Expenditures on transportation in a typical two weeks
Unmatched 1291.570 1304.730 -13.159 62.375 -0.21 Unmatched 1256.983 1304.730 -47.747 67.659 -0.71
Matched 1291.570 1315.989 -24.419 67.173 -0.36 Matched 1256.983 1319.537 -62.554 72.797 -0.86
Expenditures on electricity in a typical month
Unmatched 527.807 547.534 -19.726 67.301 -0.29 Unmatched 478.354 547.534 -69.179 34.369 -2.01**
Matched 527.807 466.021 61.786 68.126 0.91 Matched 478.354 467.861 10.493 36.995 0.28
Expenditures on water a typical month
Unmatched 77.160 151.444 -74.283 11.312 -6.57*** Unmatched 64.171 151.444 -87.273 13.336 -6.54***
Matched 77.160 104.999 -27.838 12.873 -2.16** Matched 64.171 110.116 -45.945 13.303 -3.45***
Expenditures on health in the last year
Unmatched 12774.470 14737.116 -1962.646 972.920 -2.02** Unmatched 12023.585 14737.116 -2713.530 1009.545 -2.69***
Matched 12774.470 14332.655 -1558.185 1066.901 -1.46 Matched 12023.585 14522.131 -2498.546 1039.381 -2.40**
Expenditures on clothing in the last year
Unmatched 10245.666 10239.384 6.283 345.828 0.02 Unmatched 10184.783 10239.384 -54.601 370.609 -0.15
Matched 10245.666 10567.746 -322.080 366.833 -0.88 Matched 10184.783 10553.614 -368.832 406.190 -0.91
Expenditures on ceremonies in the last year
Unmatched 6226.300 6122.180 104.121 526.198 0.20 Unmatched 5845.678 6122.180 -276.502 488.922 -0.57
Matched 6226.300 5920.296 306.005 565.820 0.54 Matched 5845.678 6050.435 -204.758 507.124 -0.40
Expenditures on settlement of debt in the last year
Unmatched 25603.471 32284.723 -6681.252 2550.649 -2.62*** Unmatched 27525.383 32284.723 -4759.340 2947.680 -1.61
Matched 25603.471 32347.519 -6744.047 2939.046 -2.29** Matched 27525.383 32561.580 -5036.197 3159.309 -1.59

Appendix
–Annex 7
EC 2013/81/W
.P.4
64
Table B.4aExpenditures – Propensity Score Matching
General Treatment Direct Beneficiaries
Matching Treatment Mean Comparison Mean Difference S.E. T-stat Matching Treatment Mean Comparison Mean Difference S.E. T-stat
Expenditures on education in the last year
Unmatched 27161.864 27356.636 -194.772 2222.440 -0.09 Unmatched 29420.846 27356.636 2064.209 2643.889 0.78
Matched 27161.864 29207.868 -2046.004 2373.386 -0.86 Matched 29420.846 29553.815 -132.969 2923.134 -0.05Note: Level of significance: *** p<0.01, ** p<0.05, * p<0.1
Table B.4bExpenditures– Propensity Score Matching
Intense Treatment Direct versus Indirect Treatment
MatchingTreatment
MeanComparison
Mean Difference S.E. T-stat MatchingTreatment
MeanComparison
Mean Difference S.E. T-stat
Total expenditures in a typical two weeks
Unmatched 5662.035 6733.984 -1071.949 298.982 -3.59*** Unmatched 6254.010 6835.906 -581.896 355.232 -1.64
ATT 5662.035 6730.692 -1068.657 280.654 -3.81*** ATT 6254.010 7007.052 -753.042 442.820 -1.70*
Total food expenditures in a typical two weeks
Unmatched 1794.820 2349.893 -555.072 114.388 -4.85*** Unmatched 2027.809 2453.311 -425.501 120.405 -3.53***
ATT 1794.820 2411.315 -616.494 96.756 -6.37*** ATT 2027.809 2461.210 -433.401 143.502 -3.02***
Total non-food expenditures in a typical two weeks
Unmatched 3867.214 4384.091 -516.877 240.001 -2.15** Unmatched 4226.201 4382.595 -156.394 282.167 -0.55
Matched 3867.214 4319.377 -452.163 237.671 -1.90* Matched 4226.201 4545.841 -319.641 342.991 -0.93
Expenditures on fish in a typical two weeks
Unmatched 667.310 766.635 -99.325 45.674 -2.17** Unmatched 698.251 788.419 -90.168 41.153 -2.19**
Matched 667.310 794.288 -126.978 41.462 -3.06*** Matched 698.251 786.146 -87.895 45.074 -1.95*
Expenditures on meat and eggs in a typical two weeks
Unmatched 489.111 677.444 -188.333 49.065 -3.84*** Unmatched 573.778 755.978 -182.200 73.040 -2.49**
Matched 489.111 704.768 -215.658 37.375 -5.77*** Matched 573.778 785.566 -211.787 93.054 -2.28**

Appendix
–Annex 7
EC 2013/81/W
.P.4
65
Table B.4bExpenditures– Propensity Score Matching
Intense Treatment Direct versus Indirect Treatment
MatchingTreatment
MeanComparison
Mean Difference S.E. T-stat MatchingTreatment
MeanComparison
Mean Difference S.E. T-stat
Expenditures on milk and dairy foods in a typical two weeks
Unmatched 464.049 585.548 -121.500 39.665 -3.06*** Unmatched 506.338 543.418 -37.080 49.989 -0.74
Matched 464.049 596.611 -132.562 34.679 -3.82*** Matched 506.338 525.756 -19.418 57.019 -0.34
Expenditures on prepared food (including bread) in a typical two weeks
Unmatched 300.108 353.351 -53.243 28.531 -1.87* Unmatched 331.966 358.290 -26.324 36.299 -0.73
Matched 300.108 376.101 -75.993 29.223 -2.60*** Matched 331.966 348.914 -16.948 37.544 -0.45
Expenditures on fruits in a typical two weeks
Unmatched 166.905 271.966 -105.061 29.073 -3.61*** Unmatched 175.923 218.811 -42.888 18.714 -2.29**
Matched 166.905 273.343 -106.438 20.873 -5.10*** Matched 175.923 225.671 -49.748 21.979 -2.26**
Expenditures on tobacco and alcohol in a typical two weeks
Unmatched 168.981 270.521 -101.540 72.300 -1.40 Unmatched 189.660 196.025 -6.365 42.107 -0.15
Matched 168.981 268.720 -99.739 55.290 -1.80* Matched 189.660 212.690 -23.030 44.507 -0.52
Expenditures on transportation in a typical two weeks
Unmatched 1213.290 1304.730 -91.439 94.062 -0.97 Unmatched 1256.983 1359.428 -102.445 94.177 -1.09
Matched 1213.290 1285.203 -71.913 97.155 -0.74 Matched 1256.983 1391.835 -134.853 101.580 -1.33
Expenditures on electricity in a typical month
Unmatched 413.144 547.534 -134.389 46.638 -2.88*** Unmatched 478.354 614.771 -136.417 132.120 -1.03
Matched 413.144 486.845 -73.701 38.449 -1.92* ATT 478.354 672.384 -194.029 176.858 -1.10
Expenditures on water a typical month
Unmatched 56.090 151.444 -95.354 20.535 -4.64*** Unmatched 64.171 102.279 -38.108 9.891 -3.85***
Matched 56.090 122.104 -66.013 14.854 -4.44*** ATT 64.171 99.972 -35.801 11.039 -3.24***
Expenditures on health in the last year
Unmatched 12285.760 14737.116 -2451.356 1543.298 -1.59 Unmatched 12023.585 14259.102 -2235.516 1347.041 -1.66*
Matched 12285.760 14374.044 -2088.285 1402.058 -1.49 Matched 12023.585 14607.049 -2583.463 1673.380 -1.54

Appendix
–Annex 7
EC 2013/81/W
.P.4
66
Table B.4bExpenditures– Propensity Score Matching
Intense Treatment Direct versus Indirect Treatment
MatchingTreatment
MeanComparison
Mean Difference S.E. T-stat MatchingTreatment
MeanComparison
Mean Difference S.E. T-stat
Expenditures on clothing in the last year
Unmatched 10588.424 10239.384 349.041 523.784 0.67 Unmatched 10184.783 10385.372 -200.589 560.024 -0.36
Matched 10588.424 10453.537 134.887 651.641 0.21 Matched 10184.783 10597.074 -412.291 595.850 -0.69
Expenditures on ceremonies in the last year
Unmatched 4897.452 6122.180 -1224.728 714.801 -1.71* Unmatched 5845.678 6984.569 -1138.892 810.479 -1.41
Matched 4897.452 6080.055 -1182.602 541.484 -2.18** Matched 5845.678 7093.562 -1247.884 1068.675 -1.17
Expenditures on settlement of debt in the last year
Unmatched 25272.615 32284.723 -7012.108 4538.502 -1.55 Unmatched 27525.383 22345.058 5180.326 3036.029 1.71*
Matched 25272.615 32228.431 -6955.815 4180.671 -1.66* Matched 27525.383 23277.200 4248.183 3153.808 1.35
Expenditures on education in the last year
Unmatched 28647.328 27356.636 1290.692 3217.762 0.40 Unmatched 29420.846 23040.426 6380.420 3392.762 1.88*
Matched 28647.328 28819.961 -172.633 3422.318 -0.05 Matched 29420.846 23608.475 5812.371 2927.038 1.99**Note: Level of significance: *** p<0.01, ** p<0.05, * p<0.1

Appendix
–Annex 7
EC 2013/81/W
.P.4
67
Table B.5aAssets and livestock – Propensity Score Matching
General Treatment Direct Beneficiaries
MatchingTreatment
Mean Treated N Control MeanControl
N Difference T-stat MatchingTreatment
Mean Treated N Control MeanControl
N Difference T-stat
Principal components of 2013 assets
Unmatched -0.097 0.118 -0.215-2.83*** Unmatched -0.189 0.118 -0.307 -3.61***
Matched -0.097 1,290 -0.023 1,256 -0.074 -0.89 Matched -0.189 849 -0.023 1,256 -0.166 -1.83*
Change in principal components of assets
Unmatched 0.035 -0.028 0.063 1.06 Unmatched -0.035 -0.028 -0.007 -0.11
Matched 0.035 1,290 0.166 1,256 -0.130 -1.99** Matched -0.035 849 0.172 1,256 -0.207 -2.92***
Principal components of 2013 livestock
Unmatched 0.011 -0.011 0.022 0.51 Unmatched 0.000 -0.011 0.011 0.24
Matched 0.011 1,292 0.009 1,258 0.002 0.05 Matched 0.000 850 0.008 1,258 -0.008 -0.16
Change in principal components of livestock
Unmatched -0.044 0.042 -0.086 -1.37 Unmatched -0.079 0.042 -0.121 -1.75*
Matched -0.044 1,292-0.023
1,258 -0.021 -0.31 Matched -0.079 850 -0.045 1,258 -0.034 -0.44
Number of cattle owned in 2013
Unmatched 0.830 0.366 0.464 5.84*** Unmatched 0.908 0.366 0.542 6.05***
Matched 0.830 1,292 0.490 1,258 0.341 4.03*** Matched 0.908 850 0.499 1,258 0.409 4.11***
Change in cattle owned
Unmatched -3.106 -4.446 1.340 1.42 Unmatched -3.183 -4.446 1.263 1.23
Matched -3.096 384 -4.364 175 1.268 1.24 Matched -3.188 277 -4.541 175 1.353 1.23Note: Level of significance: *** p<0.01, ** p<0.05, * p<0.1
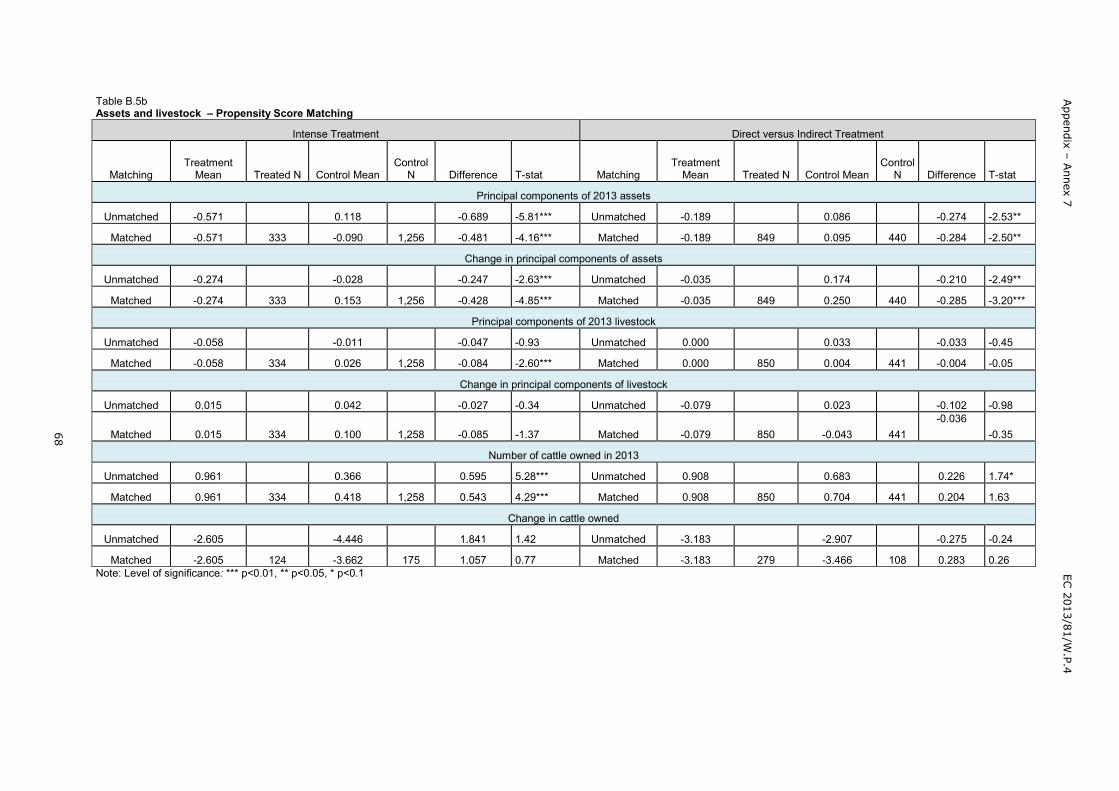
Appendix
–Annex 7
EC 2013/81/W
.P.4
68
Table B.5bAssets and livestock – Propensity Score Matching
Intense Treatment Direct versus Indirect Treatment
MatchingTreatment
Mean Treated N Control MeanControl
N Difference T-stat MatchingTreatment
Mean Treated N Control MeanControl
N Difference T-stat
Principal components of 2013 assets
Unmatched -0.571 0.118 -0.689 -5.81*** Unmatched -0.189 0.086 -0.274 -2.53**
Matched -0.571 333 -0.090 1,256 -0.481 -4.16*** Matched -0.189 849 0.095 440 -0.284 -2.50**
Change in principal components of assets
Unmatched -0.274 -0.028 -0.247 -2.63*** Unmatched -0.035 0.174 -0.210 -2.49**
Matched -0.274 333 0.153 1,256 -0.428 -4.85*** Matched -0.035 849 0.250 440 -0.285 -3.20***
Principal components of 2013 livestock
Unmatched -0.058 -0.011 -0.047 -0.93 Unmatched 0.000 0.033 -0.033 -0.45
Matched -0.058 334 0.026 1,258 -0.084 -2.60*** Matched 0.000 850 0.004 441 -0.004 -0.05
Change in principal components of livestock
Unmatched 0.015 0.042 -0.027 -0.34 Unmatched -0.079 0.023 -0.102 -0.98
Matched 0.015 334 0.100 1,258 -0.085 -1.37 Matched -0.079 850 -0.043 441-0.036
-0.35
Number of cattle owned in 2013
Unmatched 0.961 0.366 0.595 5.28*** Unmatched 0.908 0.683 0.226 1.74*
Matched 0.961 334 0.418 1,258 0.543 4.29*** Matched 0.908 850 0.704 441 0.204 1.63
Change in cattle owned
Unmatched -2.605 -4.446 1.841 1.42 Unmatched -3.183 -2.907 -0.275 -0.24
Matched -2.605 124 -3.662 175 1.057 0.77 Matched -3.183 279 -3.466 108 0.283 0.26Note: Level of significance: *** p<0.01, ** p<0.05, * p<0.1