Embed Size (px)
Citation preview
Demographic and Social Characteristics of
Persons in Poverty: 2018
March 26, 2020
Congressional Research Service
https://crsreports.congress.gov
R46294
Demographic and Social Characteristics of Persons in Poverty: 2018
Congressional Research Service
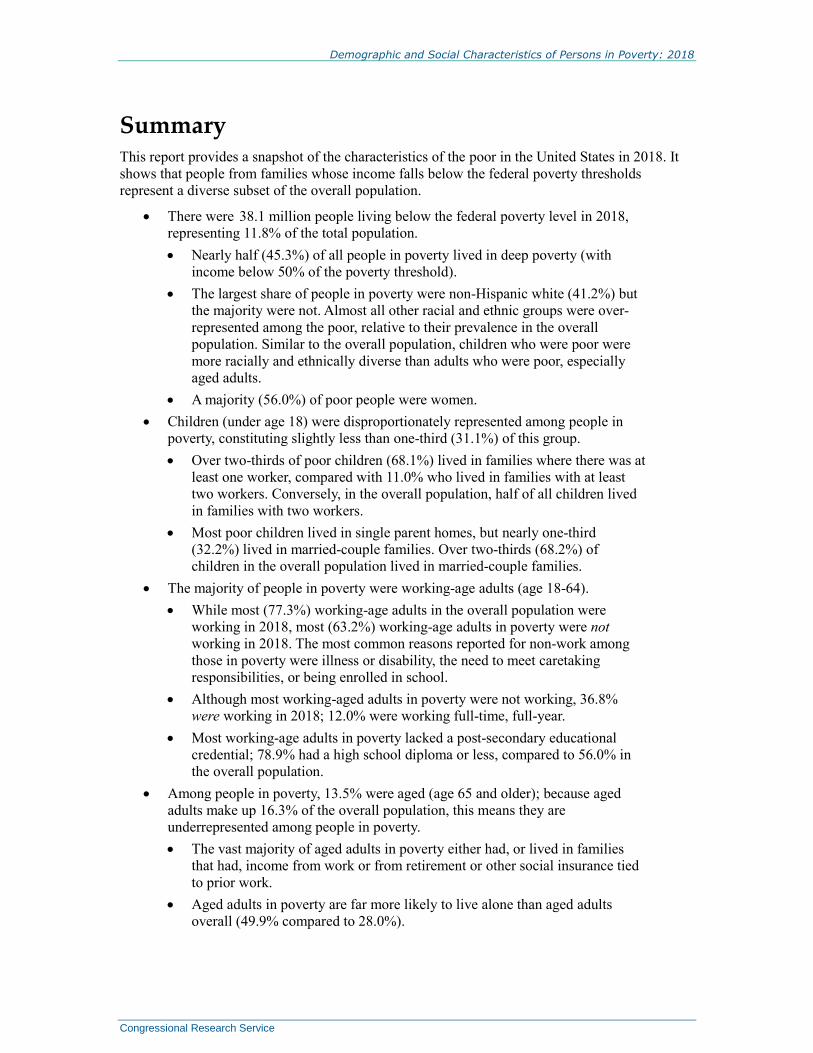
Summary This report provides a snapshot of the characteristics of the poor in the United States in 2018. It
shows that people from families whose income falls below the federal poverty thresholds
represent a diverse subset of the overall population.
There were 38.1 million people living below the federal poverty level in 2018,
representing 11.8% of the total population.
Nearly half (45.3%) of all people in poverty lived in deep poverty (with
income below 50% of the poverty threshold).
The largest share of people in poverty were non-Hispanic white (41.2%) but
the majority were not. Almost all other racial and ethnic groups were over-
represented among the poor, relative to their prevalence in the overall
population. Similar to the overall population, children who were poor were
more racially and ethnically diverse than adults who were poor, especially
aged adults.
A majority (56.0%) of poor people were women.
Children (under age 18) were disproportionately represented among people in
poverty, constituting slightly less than one-third (31.1%) of this group.
Over two-thirds of poor children (68.1%) lived in families where there was at
least one worker, compared with 11.0% who lived in families with at least
two workers. Conversely, in the overall population, half of all children lived
in families with two workers.
Most poor children lived in single parent homes, but nearly one-third
(32.2%) lived in married-couple families. Over two-thirds (68.2%) of
children in the overall population lived in married-couple families.
The majority of people in poverty were working-age adults (age 18-64).
While most (77.3%) working-age adults in the overall population were
working in 2018, most (63.2%) working-age adults in poverty were not
working in 2018. The most common reasons reported for non-work among
those in poverty were illness or disability, the need to meet caretaking
responsibilities, or being enrolled in school.
Although most working-aged adults in poverty were not working, 36.8%
were working in 2018; 12.0% were working full-time, full-year.
Most working-age adults in poverty lacked a post-secondary educational
credential; 78.9% had a high school diploma or less, compared to 56.0% in
the overall population.
Among people in poverty, 13.5% were aged (age 65 and older); because aged
adults make up 16.3% of the overall population, this means they are
underrepresented among people in poverty.
The vast majority of aged adults in poverty either had, or lived in families
that had, income from work or from retirement or other social insurance tied
to prior work.
Aged adults in poverty are far more likely to live alone than aged adults
overall (49.9% compared to 28.0%).
Demographic and Social Characteristics of Persons in Poverty: 2018
Congressional Research Service
Contents
Introduction ..................................................................................................................................... 1
Data Used in this Report ........................................................................................................... 2
How Many People Were Poor in 2018? .......................................................................................... 2
Who Was Poor in 2018? An Overview ............................................................................................ 3
Age ............................................................................................................................................ 3 Race and Ethnicity .................................................................................................................... 4 Sex ............................................................................................................................................. 6
Poverty Among Children, Working-Age Adults, and Aged Adults ................................................. 7
Children ..................................................................................................................................... 7 Working-Age Adults ............................................................................................................... 10 Aged Persons ........................................................................................................................... 13
Conclusion ..................................................................................................................................... 15
Figures
Figure 1. Number and Percentage of the Total Population by Poverty Status, 2018 ....................... 3
Figure 2. Population by Poverty Status and Age, 2018 ................................................................... 4
Figure 3. Population by Poverty Status and Race/Ethnicity, 2018 .................................................. 5
Figure 4. Population by Poverty Status, Race/Ethnicity, and Age Group, 2018 ............................. 6
Figure 5. Population by Poverty Status and Sex, 2018 ................................................................... 7
Figure 6. Population of Children by Poverty Status and Number of Adult Workers in the
Family, 2018 ................................................................................................................................. 8
Figure 7. Population of Children by Poverty Status and Family Type, 2018 .................................. 9
Figure 8. Population of Children by Poverty Status and Number of Dependent Children in
the Family, 2018 ......................................................................................................................... 10
Figure 9. Population of Working-Age Adults in Poverty by Work Status and
(If Not Working) Reason for Not Working, 2018 ........................................................................ 11
Figure 10. Population of Adults Ages 18 to 64 by Poverty Status and Highest Educational
Credential, 2018 ......................................................................................................................... 12
Figure 11. Population of Working-Age Adults by Poverty Status and Living Arrangement,
2018 ............................................................................................................................................ 13
Figure 12. Share of Aged Adults with Work-Based Income, by Poverty Status 2018 .................. 14
Figure 13. Population of Aged Adults by Poverty Status and Living Arrangement, 2018 ............ 15
Tables
Table A-1. Number and Percent of the Total Population in Poverty and In Deep Poverty,
2018 ............................................................................................................................................ 16
Table A-2. Characteristics of People Living in Poverty and in the Total Population, 2018 .......... 16
Demographic and Social Characteristics of Persons in Poverty: 2018
Congressional Research Service
Table A-3. Race/Ethnicity of People Living in Poverty and in the Total Population,
By Age Grouping, 2018 ............................................................................................................. 17
Table A-4. Characteristics of Children (Under Age 18) Living in Poverty and in the Total
Population, 2018 ......................................................................................................................... 18
Table A-5. Characteristics of Non-aged Adults (Age 18 to 64) Living in Poverty and in
the Total Population, 2018 .......................................................................................................... 19
Table A-6. Characteristics of Aged Adults (Age 65 and Older) Living in Poverty and in
the Total Population, 2018 .......................................................................................................... 20
Appendixes
Appendix. Data Tables .................................................................................................................. 16
Contacts
Author Information ........................................................................................................................ 21
Demographic and Social Characteristics of Persons in Poverty: 2018
Congressional Research Service 1
Introduction Poverty is an ongoing topic of interest for Congress, in various capacities: as a factor to be
considered when allocating funding for certain programs, as an eligibility criterion for some low-
income assistance programs, and to gauge the well-being of individuals, families, or the economy
as a whole.1 The poverty rate fell to 11.8% in 2018 from 12.3% in 2017. In both years, the
poverty rate was lower than the pre-recessionary level of 12.5% in 2007. However, since the end
of the Great Recession in 2009,2 the poverty rate remained elevated for approximately the first
four years after the recession’s end, and despite reductions in the poverty rate in recent years, it
remains higher than its record-low of 11.1% in 1973. Poverty’s persistence alongside indicators
of economic strength has led policymakers to continually examine the drivers of poverty—both
economic and social—and the effectiveness of various policy responses. As the conversations
about poverty and public policy continue, it may be useful to consider the question: Who are the
people who are poor in the United States?
This report provides a snapshot of who was poor in 2018 by selected demographic, economic,
and social characteristics. The data presented here show that people in poverty are not a
monolithic group, but rather a diverse collection of families and individuals at different stages of
life, living in different circumstances. Special attention is paid in this report to the role of work in
the lives of people who are poor. Income from work, or the lack thereof, is central to the
economic fortunes not only of those considered “working-age,” but also of children, who are
generally dependent on working-age adults, and persons who are aged (age 65 and older), who
generally have prior experience in the workforce that shapes their economic well-being after they
retire. Attention is also paid to living arrangements. Because poverty is measured at the family
level, considerations such as whether someone lives alone, or whom someone lives and
potentially shares resources with, influence economic well-being. Other factors that affect family
well-being, and that influence individuals’ attachment to and success in the labor market, are
important for considering individuals’ experiences of poverty but are beyond the scope of this
report.
This snapshot looks at the composition of people in poverty—what groups comprise what share
of the poverty population—rather than at poverty rates among different groups. This provides a
different perspective in viewing poverty. A large population group such as non-Hispanic whites
might have relatively low poverty rates, but because of the group’s size in the overall population
it represents a relatively large share of the poverty population. A small population, such as
American Indians and Alaska Natives, might have relatively high poverty rates, but because of
the group’s size it represents a relatively small share of the poverty population. Both perspectives
on poverty are valid and relevant to public policy. Readers interested in an examination of
poverty rates for different demographic groups—and trends in poverty over time—should see
CRS Report R46000, Poverty in the United States in 2018: In Brief, by Joseph Dalaker.
1 In the 116th Congress, no fewer than 20 bills included “poverty” in their title; more than 240 included “poverty”
within their full text. Information on poverty is used by some programs when determining funding allocations; for
example, Title I-A funding for schools under the Elementary and Secondary Education Act as amended under the
Every Student Succeeds Act (see CRS Report R45827, State and Local Financing of Public Schools, by Rebecca R.
Skinner for details). For a discussion of low-income assistance programs and the use of poverty metrics in determining
eligibility, see CRS Report R44574, Federal Benefits and Services for People with Low Income: Overview of Spending
Trends, FY2008-FY2015, by Karen Spar and Gene Falk.
2 For further discussion about recessions and the poverty rate, see CRS Report R45854, Trends in the U.S. Poverty Rate
after Recessions, by Joseph Dalaker.
Demographic and Social Characteristics of Persons in Poverty: 2018
Congressional Research Service 2
Data Used in this Report
Poverty, in general, is a lack of resources to meet basic needs. This report uses the official
measure of poverty used by the U.S. Census Bureau to identify individuals as “poor.”3 However,
it is important to note that the Census poverty measure is actually family-based. Whether a person
is considered poor depends on his or her money income and the income of any other family
members—those related to a family head by birth, marriage, or adoption—with whom the person
lives and presumably shares resources. If an individual is living alone or with people who are not
relatives, that individual is considered a family of one and only his or her income is counted in
determining his or her poverty status. That money income is then compared with a dollar
threshold, which is based on that individual’s family composition. For example, the poverty
threshold for a working-age single person (who does not live in a family) in 2018 was $13,064. A
single person with income below that amount is considered poor. The poverty threshold for a
family of two adults and two children was $25,465. If the combined income of all family
members was below that amount, all people in that family would be considered poor.4
The current official poverty measure has existed for about 50 years and is widely used, but it does
have limitations. For example, the official measure looks only at pre-tax money income and does
not examine the impact of government taxes and non-cash benefits on family well-being. The
official measure also generally does not take the value of assets into account, though a recent
change in measurement now considers distributions from retirement savings as income. The
official measure is also the same across the country, and does not take into consideration
differences in living costs in different geographical areas. Additionally, the measure’s current
definition of family does not take into account modern resource-sharing arrangements, such as
those of cohabiting couples. The Census Bureau now publishes a supplemental poverty measure
(SPM) for research purposes5 that does take into account taxes and transfers, make adjustments
for housing costs by geographical area, and use an expanded definition of family.6
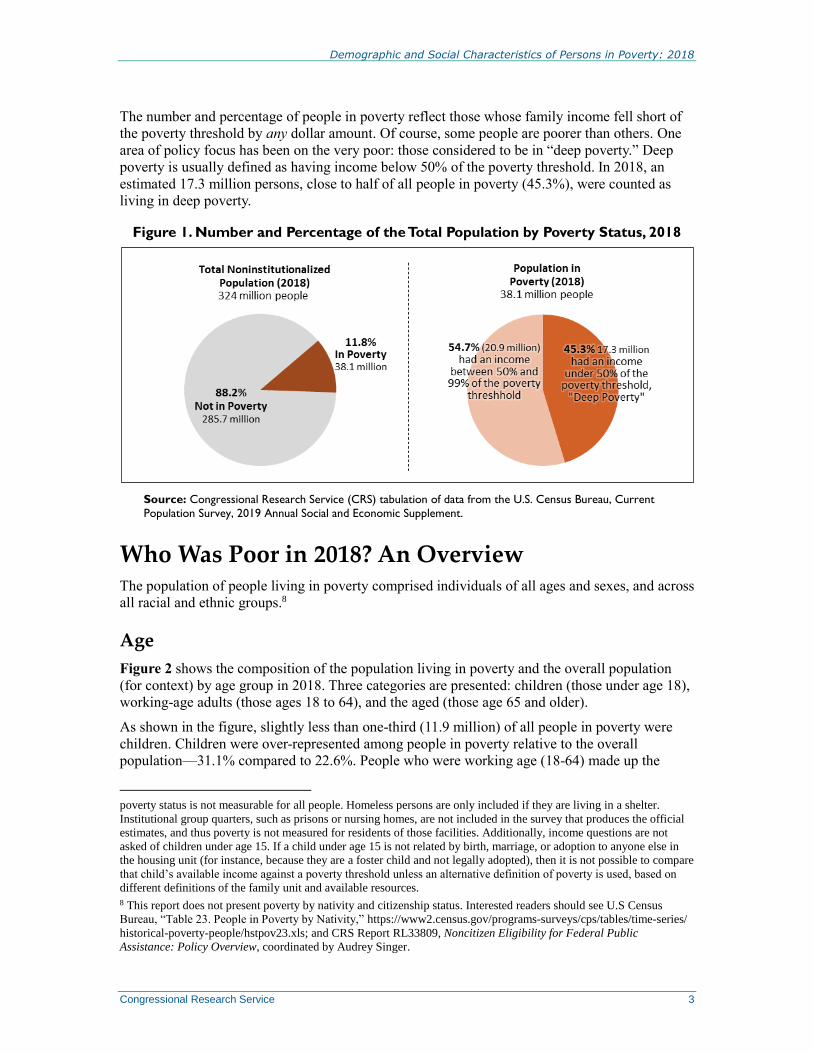
How Many People Were Poor in 2018? In 2018, an estimated 38.1 million people had pre-tax money income below the poverty
threshold. As shown in Figure 1, people who were poor accounted for 11.8% of the total
noninstitutionalized population.7
3 Specifically, this report uses data from the U.S. Census Bureau, Current Population Survey 2019 Annual Social and
Economic Supplement. All data in this report are thus estimates, and have margins of error. Comparisons discussed in
this report have been tested for statistical significance to reduce the risk of interpreting random sampling variation as
real differences. Even if the true poverty rates for two different groups were exactly the same, it is possible to get
survey estimates that appear different. Comparisons in this report are only discussed if they are large enough that fewer
than 10% of all possible survey samples would show a difference of that size, even if the true poverty rates were the
same.
4 See https://www.census.gov/data/tables/time-series/demo/income-poverty/historical-poverty-thresholds.html.
5 A detailed introduction to the SPM can be found in CRS Report R45031, The Supplemental Poverty Measure: Its
Core Concepts, Development, and Use, by Joseph Dalaker. Recent information using the SPM may be found in Liana
Fox, The Supplemental Poverty Measure: 2018, U.S. Census Bureau, Current Population Reports, P60-268 (RV),
October 2019, https://www.census.gov/library/publications/2019/demo/p60-268.html.
6 The official poverty measure considers family members to be those related by birth, marriage, or adoption, but there is
an alternative approach. The SPM considers as a family “all related individuals who live at the same address, any
coresident unrelated children who are cared for by the family (such as foster children up to age 22), and any unmarried
partners and their children.”
7 Poverty is measured using household surveys. Because of the way household surveys are implemented, official
Demographic and Social Characteristics of Persons in Poverty: 2018
Congressional Research Service 3
The number and percentage of people in poverty reflect those whose family income fell short of
the poverty threshold by any dollar amount. Of course, some people are poorer than others. One
area of policy focus has been on the very poor: those considered to be in “deep poverty.” Deep
poverty is usually defined as having income below 50% of the poverty threshold. In 2018, an
estimated 17.3 million persons, close to half of all people in poverty (45.3%), were counted as
living in deep poverty.
Figure 1. Number and Percentage of the Total Population by Poverty Status, 2018
Source: Congressional Research Service (CRS) tabulation of data from the U.S. Census Bureau, Current
Population Survey, 2019 Annual Social and Economic Supplement.
Who Was Poor in 2018? An Overview The population of people living in poverty comprised individuals of all ages and sexes, and across
all racial and ethnic groups.8
Age
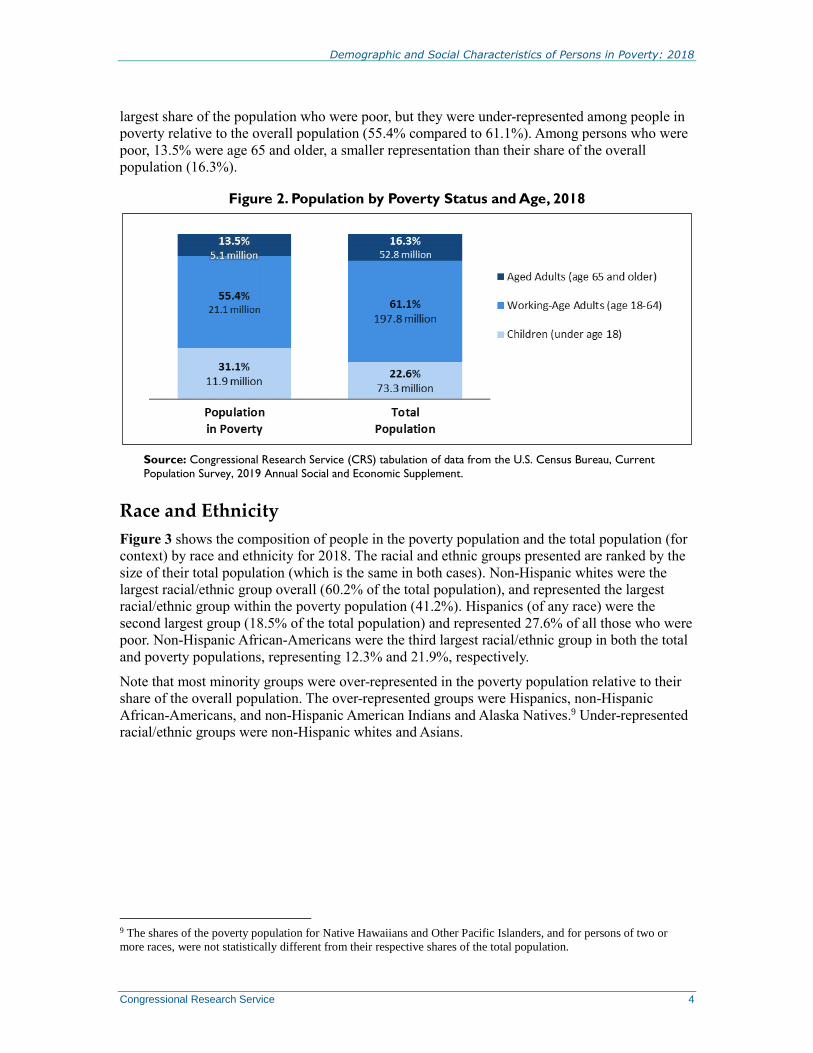
Figure 2 shows the composition of the population living in poverty and the overall population
(for context) by age group in 2018. Three categories are presented: children (those under age 18),
working-age adults (those ages 18 to 64), and the aged (those age 65 and older).
As shown in the figure, slightly less than one-third (11.9 million) of all people in poverty were
children. Children were over-represented among people in poverty relative to the overall
population—31.1% compared to 22.6%. People who were working age (18-64) made up the
poverty status is not measurable for all people. Homeless persons are only included if they are living in a shelter.
Institutional group quarters, such as prisons or nursing homes, are not included in the survey that produces the official
estimates, and thus poverty is not measured for residents of those facilities. Additionally, income questions are not
asked of children under age 15. If a child under age 15 is not related by birth, marriage, or adoption to anyone else in
the housing unit (for instance, because they are a foster child and not legally adopted), then it is not possible to compare
that child’s available income against a poverty threshold unless an alternative definition of poverty is used, based on
different definitions of the family unit and available resources.
8 This report does not present poverty by nativity and citizenship status. Interested readers should see U.S Census
Bureau, “Table 23. People in Poverty by Nativity,” https://www2.census.gov/programs-surveys/cps/tables/time-series/
historical-poverty-people/hstpov23.xls; and CRS Report RL33809, Noncitizen Eligibility for Federal Public
Assistance: Policy Overview, coordinated by Audrey Singer.
Demographic and Social Characteristics of Persons in Poverty: 2018
Congressional Research Service 4
largest share of the population who were poor, but they were under-represented among people in
poverty relative to the overall population (55.4% compared to 61.1%). Among persons who were
poor, 13.5% were age 65 and older, a smaller representation than their share of the overall
population (16.3%).
Figure 2. Population by Poverty Status and Age, 2018
Source: Congressional Research Service (CRS) tabulation of data from the U.S. Census Bureau, Current
Population Survey, 2019 Annual Social and Economic Supplement.
Race and Ethnicity
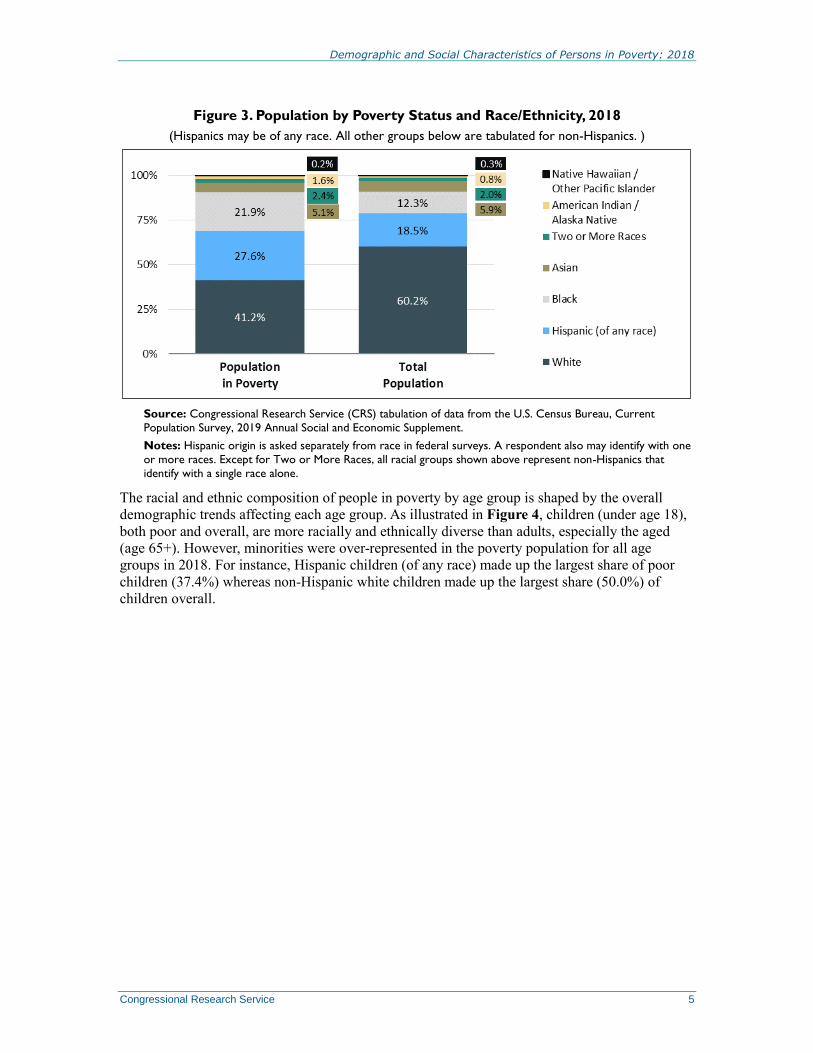
Figure 3 shows the composition of people in the poverty population and the total population (for
context) by race and ethnicity for 2018. The racial and ethnic groups presented are ranked by the
size of their total population (which is the same in both cases). Non-Hispanic whites were the
largest racial/ethnic group overall (60.2% of the total population), and represented the largest
racial/ethnic group within the poverty population (41.2%). Hispanics (of any race) were the
second largest group (18.5% of the total population) and represented 27.6% of all those who were
poor. Non-Hispanic African-Americans were the third largest racial/ethnic group in both the total
and poverty populations, representing 12.3% and 21.9%, respectively.
Note that most minority groups were over-represented in the poverty population relative to their
share of the overall population. The over-represented groups were Hispanics, non-Hispanic
African-Americans, and non-Hispanic American Indians and Alaska Natives.9 Under-represented
racial/ethnic groups were non-Hispanic whites and Asians.
9 The shares of the poverty population for Native Hawaiians and Other Pacific Islanders, and for persons of two or
more races, were not statistically different from their respective shares of the total population.
Demographic and Social Characteristics of Persons in Poverty: 2018
Congressional Research Service 5
Figure 3. Population by Poverty Status and Race/Ethnicity, 2018
(Hispanics may be of any race. All other groups below are tabulated for non-Hispanics. )
Source: Congressional Research Service (CRS) tabulation of data from the U.S. Census Bureau, Current
Population Survey, 2019 Annual Social and Economic Supplement.
Notes: Hispanic origin is asked separately from race in federal surveys. A respondent also may identify with one
or more races. Except for Two or More Races, all racial groups shown above represent non-Hispanics that
identify with a single race alone.
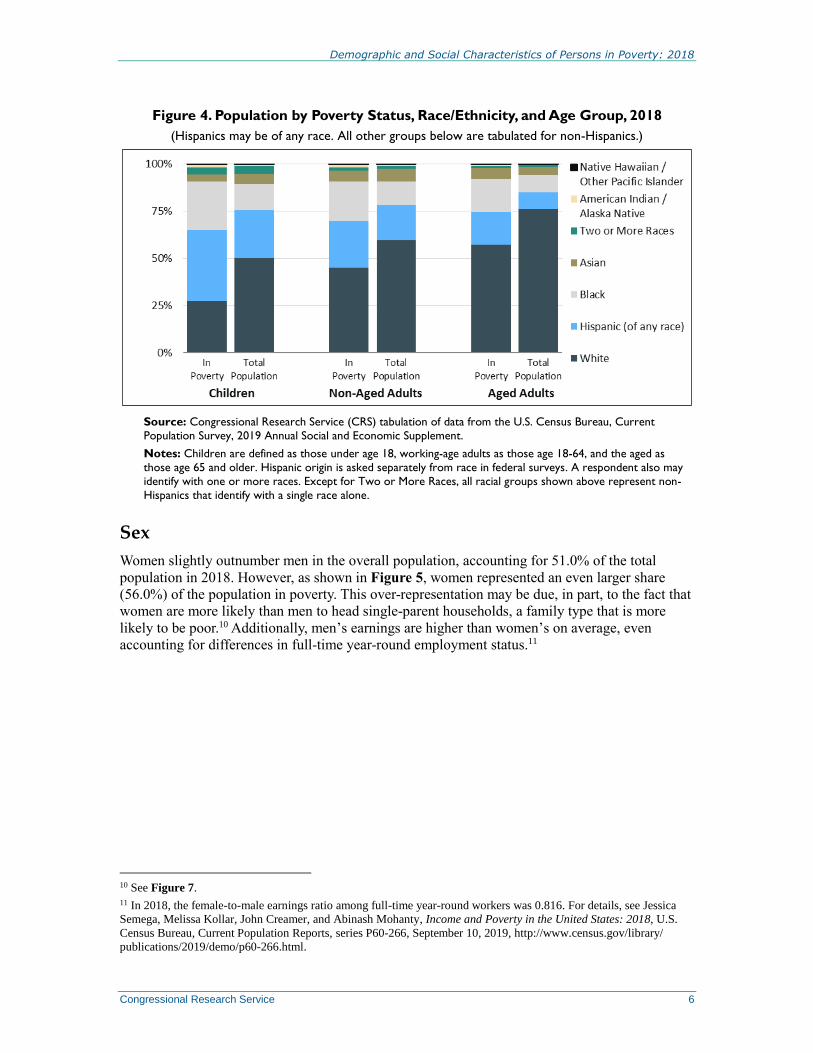
The racial and ethnic composition of people in poverty by age group is shaped by the overall
demographic trends affecting each age group. As illustrated in Figure 4, children (under age 18),
both poor and overall, are more racially and ethnically diverse than adults, especially the aged
(age 65+). However, minorities were over-represented in the poverty population for all age
groups in 2018. For instance, Hispanic children (of any race) made up the largest share of poor
children (37.4%) whereas non-Hispanic white children made up the largest share (50.0%) of
children overall.
Demographic and Social Characteristics of Persons in Poverty: 2018
Congressional Research Service 6
Figure 4. Population by Poverty Status, Race/Ethnicity, and Age Group, 2018
(Hispanics may be of any race. All other groups below are tabulated for non-Hispanics.)
Source: Congressional Research Service (CRS) tabulation of data from the U.S. Census Bureau, Current
Population Survey, 2019 Annual Social and Economic Supplement.
Notes: Children are defined as those under age 18, working-age adults as those age 18-64, and the aged as
those age 65 and older. Hispanic origin is asked separately from race in federal surveys. A respondent also may
identify with one or more races. Except for Two or More Races, all racial groups shown above represent non-
Hispanics that identify with a single race alone.
Sex
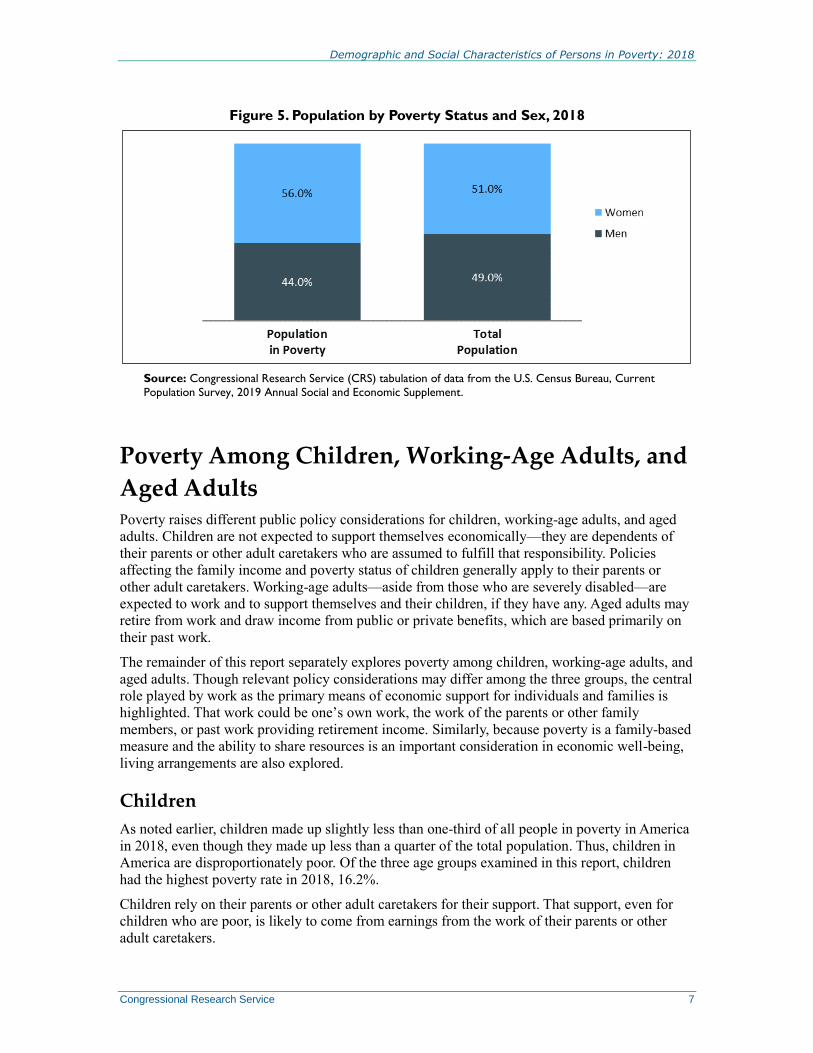
Women slightly outnumber men in the overall population, accounting for 51.0% of the total
population in 2018. However, as shown in Figure 5, women represented an even larger share
(56.0%) of the population in poverty. This over-representation may be due, in part, to the fact that
women are more likely than men to head single-parent households, a family type that is more
likely to be poor.10 Additionally, men’s earnings are higher than women’s on average, even
accounting for differences in full-time year-round employment status.11
10 See Figure 7.
11 In 2018, the female-to-male earnings ratio among full-time year-round workers was 0.816. For details, see Jessica
Semega, Melissa Kollar, John Creamer, and Abinash Mohanty, Income and Poverty in the United States: 2018, U.S.
Census Bureau, Current Population Reports, series P60-266, September 10, 2019, http://www.census.gov/library/
publications/2019/demo/p60-266.html.
Demographic and Social Characteristics of Persons in Poverty: 2018
Congressional Research Service 7
Figure 5. Population by Poverty Status and Sex, 2018
Source: Congressional Research Service (CRS) tabulation of data from the U.S. Census Bureau, Current
Population Survey, 2019 Annual Social and Economic Supplement.
Poverty Among Children, Working-Age Adults, and
Aged Adults Poverty raises different public policy considerations for children, working-age adults, and aged
adults. Children are not expected to support themselves economically—they are dependents of
their parents or other adult caretakers who are assumed to fulfill that responsibility. Policies
affecting the family income and poverty status of children generally apply to their parents or
other adult caretakers. Working-age adults—aside from those who are severely disabled—are
expected to work and to support themselves and their children, if they have any. Aged adults may
retire from work and draw income from public or private benefits, which are based primarily on
their past work.
The remainder of this report separately explores poverty among children, working-age adults, and
aged adults. Though relevant policy considerations may differ among the three groups, the central
role played by work as the primary means of economic support for individuals and families is
highlighted. That work could be one’s own work, the work of the parents or other family
members, or past work providing retirement income. Similarly, because poverty is a family-based
measure and the ability to share resources is an important consideration in economic well-being,
living arrangements are also explored.
Children
As noted earlier, children made up slightly less than one-third of all people in poverty in America
in 2018, even though they made up less than a quarter of the total population. Thus, children in
America are disproportionately poor. Of the three age groups examined in this report, children
had the highest poverty rate in 2018, 16.2%.
Children rely on their parents or other adult caretakers for their support. That support, even for
children who are poor, is likely to come from earnings from the work of their parents or other
adult caretakers.
Demographic and Social Characteristics of Persons in Poverty: 2018
Congressional Research Service 8
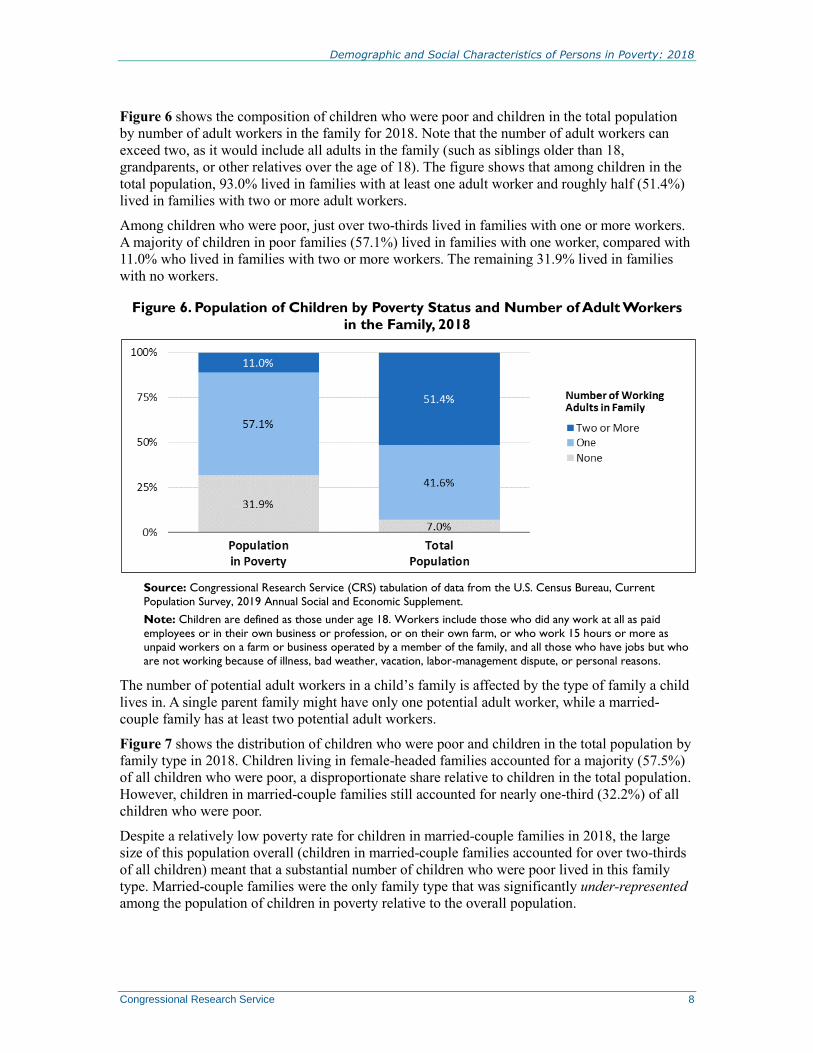
Figure 6 shows the composition of children who were poor and children in the total population
by number of adult workers in the family for 2018. Note that the number of adult workers can
exceed two, as it would include all adults in the family (such as siblings older than 18,
grandparents, or other relatives over the age of 18). The figure shows that among children in the
total population, 93.0% lived in families with at least one adult worker and roughly half (51.4%)
lived in families with two or more adult workers.
Among children who were poor, just over two-thirds lived in families with one or more workers.
A majority of children in poor families (57.1%) lived in families with one worker, compared with
11.0% who lived in families with two or more workers. The remaining 31.9% lived in families
with no workers.
Figure 6. Population of Children by Poverty Status and Number of Adult Workers
in the Family, 2018
Source: Congressional Research Service (CRS) tabulation of data from the U.S. Census Bureau, Current
Population Survey, 2019 Annual Social and Economic Supplement.
Note: Children are defined as those under age 18. Workers include those who did any work at all as paid
employees or in their own business or profession, or on their own farm, or who work 15 hours or more as unpaid workers on a farm or business operated by a member of the family, and all those who have jobs but who
are not working because of illness, bad weather, vacation, labor-management dispute, or personal reasons.
The number of potential adult workers in a child’s family is affected by the type of family a child
lives in. A single parent family might have only one potential adult worker, while a married-
couple family has at least two potential adult workers.
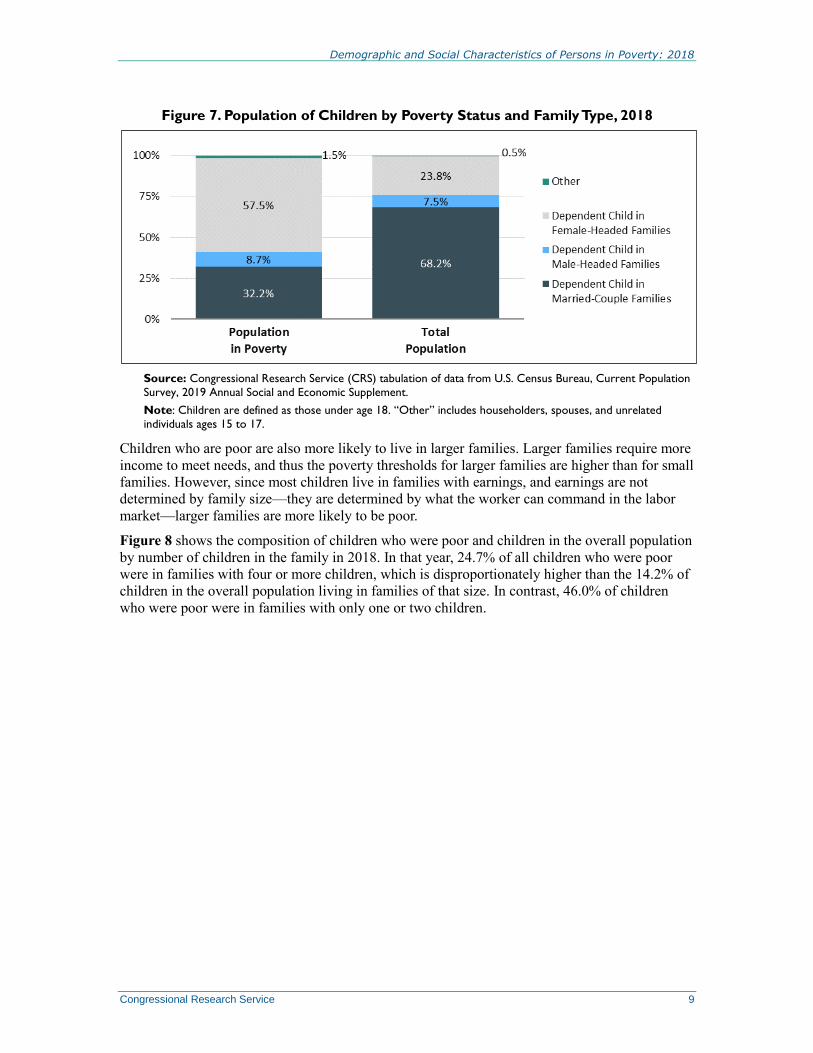
Figure 7 shows the distribution of children who were poor and children in the total population by
family type in 2018. Children living in female-headed families accounted for a majority (57.5%)
of all children who were poor, a disproportionate share relative to children in the total population.
However, children in married-couple families still accounted for nearly one-third (32.2%) of all
children who were poor.
Despite a relatively low poverty rate for children in married-couple families in 2018, the large
size of this population overall (children in married-couple families accounted for over two-thirds
of all children) meant that a substantial number of children who were poor lived in this family
type. Married-couple families were the only family type that was significantly under-represented
among the population of children in poverty relative to the overall population.
Demographic and Social Characteristics of Persons in Poverty: 2018
Congressional Research Service 9
Figure 7. Population of Children by Poverty Status and Family Type, 2018
Source: Congressional Research Service (CRS) tabulation of data from U.S. Census Bureau, Current Population
Survey, 2019 Annual Social and Economic Supplement.
Note: Children are defined as those under age 18. “Other” includes householders, spouses, and unrelated
individuals ages 15 to 17.
Children who are poor are also more likely to live in larger families. Larger families require more
income to meet needs, and thus the poverty thresholds for larger families are higher than for small
families. However, since most children live in families with earnings, and earnings are not
determined by family size—they are determined by what the worker can command in the labor
market—larger families are more likely to be poor.
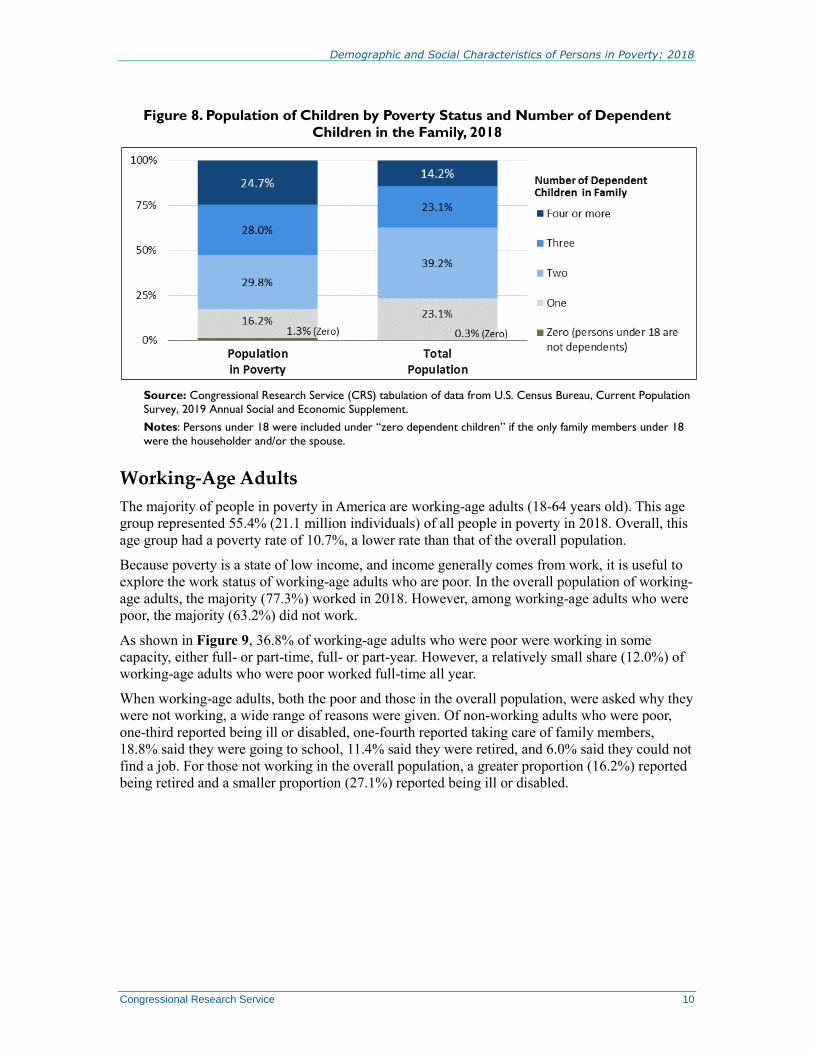
Figure 8 shows the composition of children who were poor and children in the overall population
by number of children in the family in 2018. In that year, 24.7% of all children who were poor
were in families with four or more children, which is disproportionately higher than the 14.2% of
children in the overall population living in families of that size. In contrast, 46.0% of children
who were poor were in families with only one or two children.
Demographic and Social Characteristics of Persons in Poverty: 2018
Congressional Research Service 10
Figure 8. Population of Children by Poverty Status and Number of Dependent
Children in the Family, 2018
Source: Congressional Research Service (CRS) tabulation of data from U.S. Census Bureau, Current Population
Survey, 2019 Annual Social and Economic Supplement.
Notes: Persons under 18 were included under “zero dependent children” if the only family members under 18
were the householder and/or the spouse.
Working-Age Adults
The majority of people in poverty in America are working-age adults (18-64 years old). This age
group represented 55.4% (21.1 million individuals) of all people in poverty in 2018. Overall, this
age group had a poverty rate of 10.7%, a lower rate than that of the overall population.
Because poverty is a state of low income, and income generally comes from work, it is useful to
explore the work status of working-age adults who are poor. In the overall population of working-
age adults, the majority (77.3%) worked in 2018. However, among working-age adults who were
poor, the majority (63.2%) did not work.
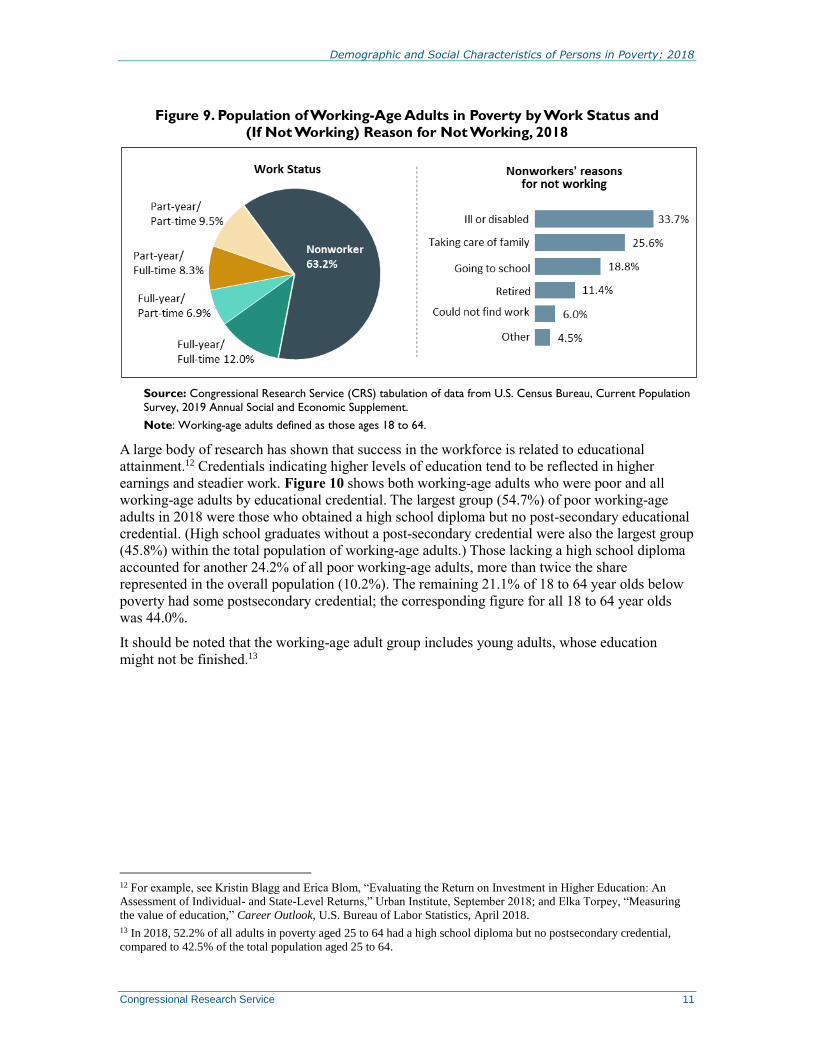
As shown in Figure 9, 36.8% of working-age adults who were poor were working in some
capacity, either full- or part-time, full- or part-year. However, a relatively small share (12.0%) of
working-age adults who were poor worked full-time all year.
When working-age adults, both the poor and those in the overall population, were asked why they
were not working, a wide range of reasons were given. Of non-working adults who were poor,
one-third reported being ill or disabled, one-fourth reported taking care of family members,
18.8% said they were going to school, 11.4% said they were retired, and 6.0% said they could not
find a job. For those not working in the overall population, a greater proportion (16.2%) reported
being retired and a smaller proportion (27.1%) reported being ill or disabled.
Demographic and Social Characteristics of Persons in Poverty: 2018
Congressional Research Service 11
Figure 9. Population of Working-Age Adults in Poverty by Work Status and
(If Not Working) Reason for Not Working, 2018
Source: Congressional Research Service (CRS) tabulation of data from U.S. Census Bureau, Current Population
Survey, 2019 Annual Social and Economic Supplement.
Note: Working-age adults defined as those ages 18 to 64.
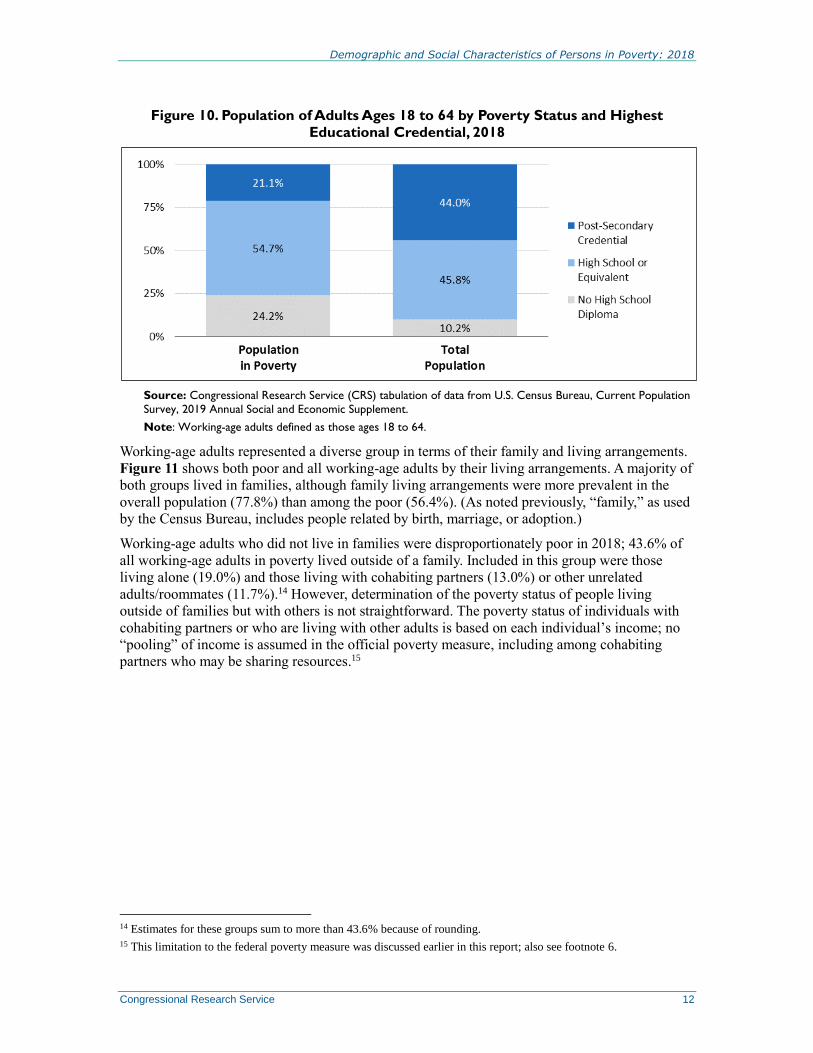
A large body of research has shown that success in the workforce is related to educational
attainment.12 Credentials indicating higher levels of education tend to be reflected in higher
earnings and steadier work. Figure 10 shows both working-age adults who were poor and all
working-age adults by educational credential. The largest group (54.7%) of poor working-age
adults in 2018 were those who obtained a high school diploma but no post-secondary educational
credential. (High school graduates without a post-secondary credential were also the largest group
(45.8%) within the total population of working-age adults.) Those lacking a high school diploma
accounted for another 24.2% of all poor working-age adults, more than twice the share
represented in the overall population (10.2%). The remaining 21.1% of 18 to 64 year olds below
poverty had some postsecondary credential; the corresponding figure for all 18 to 64 year olds
was 44.0%.
It should be noted that the working-age adult group includes young adults, whose education
might not be finished.13
12 For example, see Kristin Blagg and Erica Blom, “Evaluating the Return on Investment in Higher Education: An
Assessment of Individual- and State-Level Returns,” Urban Institute, September 2018; and Elka Torpey, “Measuring
the value of education,” Career Outlook, U.S. Bureau of Labor Statistics, April 2018.
13 In 2018, 52.2% of all adults in poverty aged 25 to 64 had a high school diploma but no postsecondary credential,
compared to 42.5% of the total population aged 25 to 64.
Demographic and Social Characteristics of Persons in Poverty: 2018
Congressional Research Service 12
Figure 10. Population of Adults Ages 18 to 64 by Poverty Status and Highest
Educational Credential, 2018
Source: Congressional Research Service (CRS) tabulation of data from U.S. Census Bureau, Current Population
Survey, 2019 Annual Social and Economic Supplement.
Note: Working-age adults defined as those ages 18 to 64.
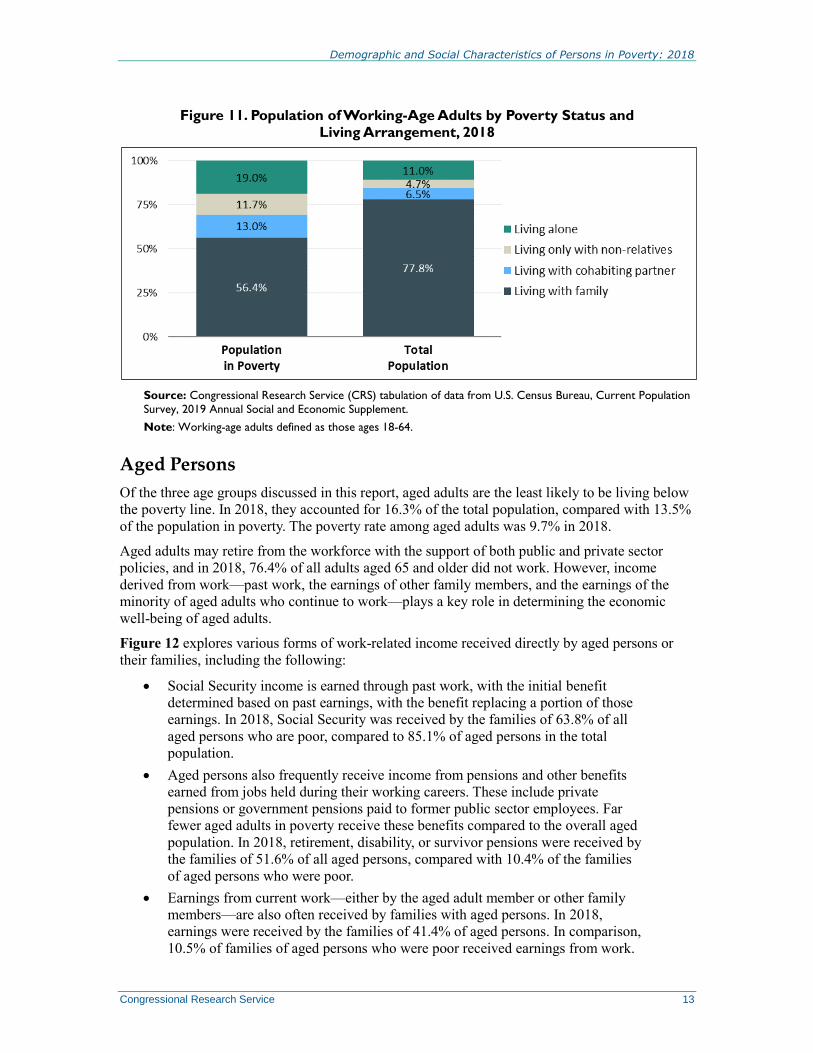
Working-age adults represented a diverse group in terms of their family and living arrangements.
Figure 11 shows both poor and all working-age adults by their living arrangements. A majority of
both groups lived in families, although family living arrangements were more prevalent in the
overall population (77.8%) than among the poor (56.4%). (As noted previously, “family,” as used
by the Census Bureau, includes people related by birth, marriage, or adoption.)
Working-age adults who did not live in families were disproportionately poor in 2018; 43.6% of
all working-age adults in poverty lived outside of a family. Included in this group were those
living alone (19.0%) and those living with cohabiting partners (13.0%) or other unrelated
adults/roommates (11.7%).14 However, determination of the poverty status of people living
outside of families but with others is not straightforward. The poverty status of individuals with
cohabiting partners or who are living with other adults is based on each individual’s income; no
“pooling” of income is assumed in the official poverty measure, including among cohabiting
partners who may be sharing resources.15
14 Estimates for these groups sum to more than 43.6% because of rounding.
15 This limitation to the federal poverty measure was discussed earlier in this report; also see footnote 6.
Demographic and Social Characteristics of Persons in Poverty: 2018
Congressional Research Service 13
Figure 11. Population of Working-Age Adults by Poverty Status and
Living Arrangement, 2018
Source: Congressional Research Service (CRS) tabulation of data from U.S. Census Bureau, Current Population
Survey, 2019 Annual Social and Economic Supplement.
Note: Working-age adults defined as those ages 18-64.
Aged Persons
Of the three age groups discussed in this report, aged adults are the least likely to be living below
the poverty line. In 2018, they accounted for 16.3% of the total population, compared with 13.5%
of the population in poverty. The poverty rate among aged adults was 9.7% in 2018.
Aged adults may retire from the workforce with the support of both public and private sector
policies, and in 2018, 76.4% of all adults aged 65 and older did not work. However, income
derived from work—past work, the earnings of other family members, and the earnings of the
minority of aged adults who continue to work—plays a key role in determining the economic
well-being of aged adults.
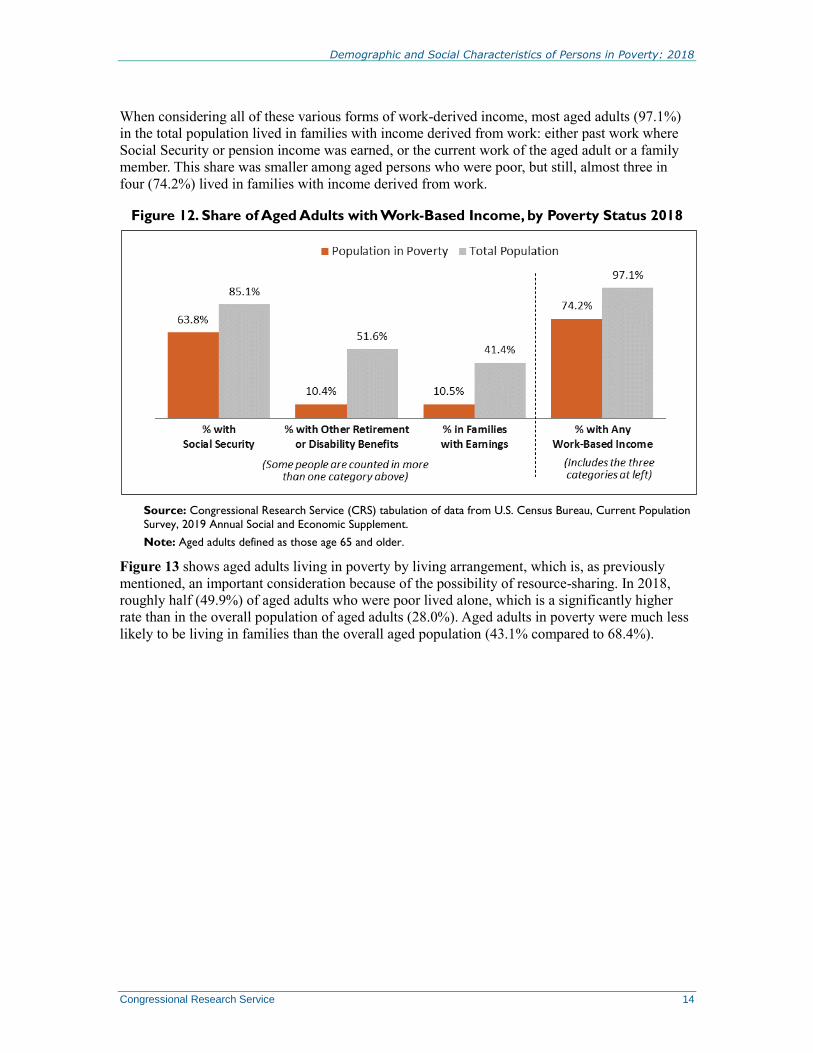
Figure 12 explores various forms of work-related income received directly by aged persons or
their families, including the following:
Social Security income is earned through past work, with the initial benefit
determined based on past earnings, with the benefit replacing a portion of those
earnings. In 2018, Social Security was received by the families of 63.8% of all
aged persons who are poor, compared to 85.1% of aged persons in the total
population.
Aged persons also frequently receive income from pensions and other benefits
earned from jobs held during their working careers. These include private
pensions or government pensions paid to former public sector employees. Far
fewer aged adults in poverty receive these benefits compared to the overall aged
population. In 2018, retirement, disability, or survivor pensions were received by
the families of 51.6% of all aged persons, compared with 10.4% of the families
of aged persons who were poor.
Earnings from current work—either by the aged adult member or other family
members—are also often received by families with aged persons. In 2018,
earnings were received by the families of 41.4% of aged persons. In comparison,
10.5% of families of aged persons who were poor received earnings from work.
Demographic and Social Characteristics of Persons in Poverty: 2018
Congressional Research Service 14
When considering all of these various forms of work-derived income, most aged adults (97.1%)
in the total population lived in families with income derived from work: either past work where
Social Security or pension income was earned, or the current work of the aged adult or a family
member. This share was smaller among aged persons who were poor, but still, almost three in
four (74.2%) lived in families with income derived from work.
Figure 12. Share of Aged Adults with Work-Based Income, by Poverty Status 2018
Source: Congressional Research Service (CRS) tabulation of data from U.S. Census Bureau, Current Population
Survey, 2019 Annual Social and Economic Supplement.
Note: Aged adults defined as those age 65 and older.
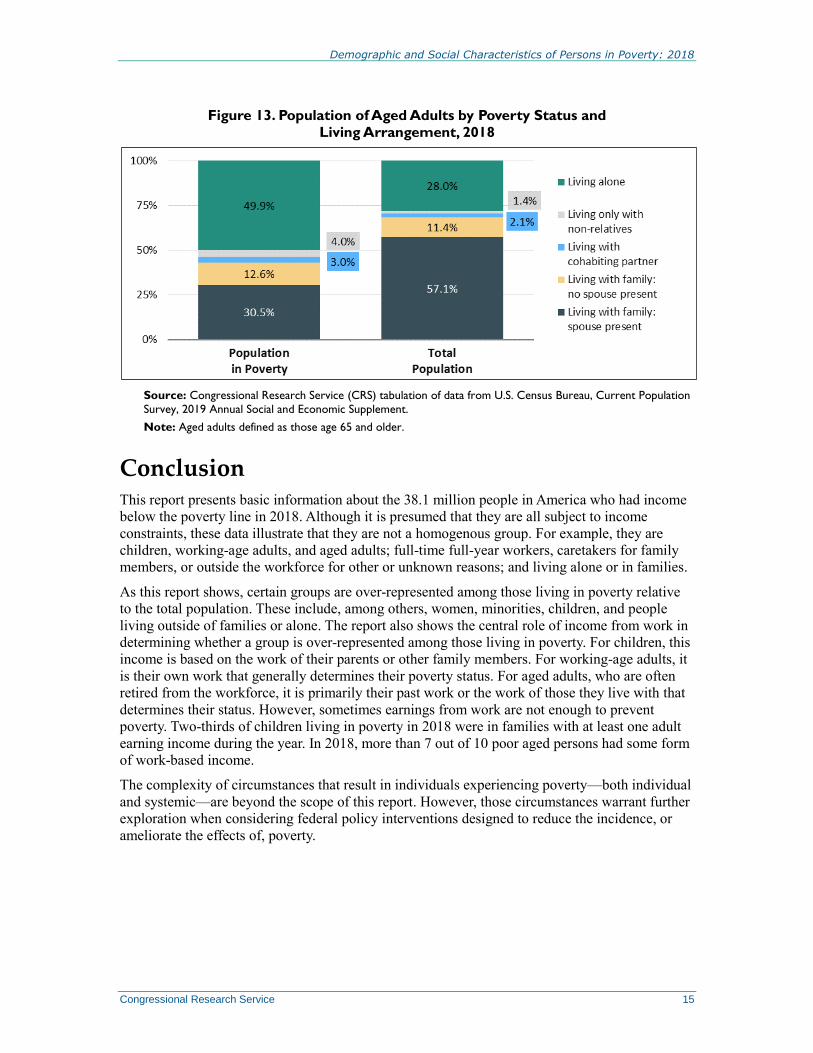
Figure 13 shows aged adults living in poverty by living arrangement, which is, as previously
mentioned, an important consideration because of the possibility of resource-sharing. In 2018,
roughly half (49.9%) of aged adults who were poor lived alone, which is a significantly higher
rate than in the overall population of aged adults (28.0%). Aged adults in poverty were much less
likely to be living in families than the overall aged population (43.1% compared to 68.4%).
Demographic and Social Characteristics of Persons in Poverty: 2018
Congressional Research Service 15
Figure 13. Population of Aged Adults by Poverty Status and
Living Arrangement, 2018
Source: Congressional Research Service (CRS) tabulation of data from U.S. Census Bureau, Current Population
Survey, 2019 Annual Social and Economic Supplement.
Note: Aged adults defined as those age 65 and older.
Conclusion This report presents basic information about the 38.1 million people in America who had income
below the poverty line in 2018. Although it is presumed that they are all subject to income
constraints, these data illustrate that they are not a homogenous group. For example, they are
children, working-age adults, and aged adults; full-time full-year workers, caretakers for family
members, or outside the workforce for other or unknown reasons; and living alone or in families.
As this report shows, certain groups are over-represented among those living in poverty relative
to the total population. These include, among others, women, minorities, children, and people
living outside of families or alone. The report also shows the central role of income from work in
determining whether a group is over-represented among those living in poverty. For children, this
income is based on the work of their parents or other family members. For working-age adults, it
is their own work that generally determines their poverty status. For aged adults, who are often
retired from the workforce, it is primarily their past work or the work of those they live with that
determines their status. However, sometimes earnings from work are not enough to prevent
poverty. Two-thirds of children living in poverty in 2018 were in families with at least one adult
earning income during the year. In 2018, more than 7 out of 10 poor aged persons had some form
of work-based income.
The complexity of circumstances that result in individuals experiencing poverty—both individual
and systemic—are beyond the scope of this report. However, those circumstances warrant further
exploration when considering federal policy interventions designed to reduce the incidence, or
ameliorate the effects of, poverty.
Demographic and Social Characteristics of Persons in Poverty: 2018
Congressional Research Service 16
Appendix. Data Tables
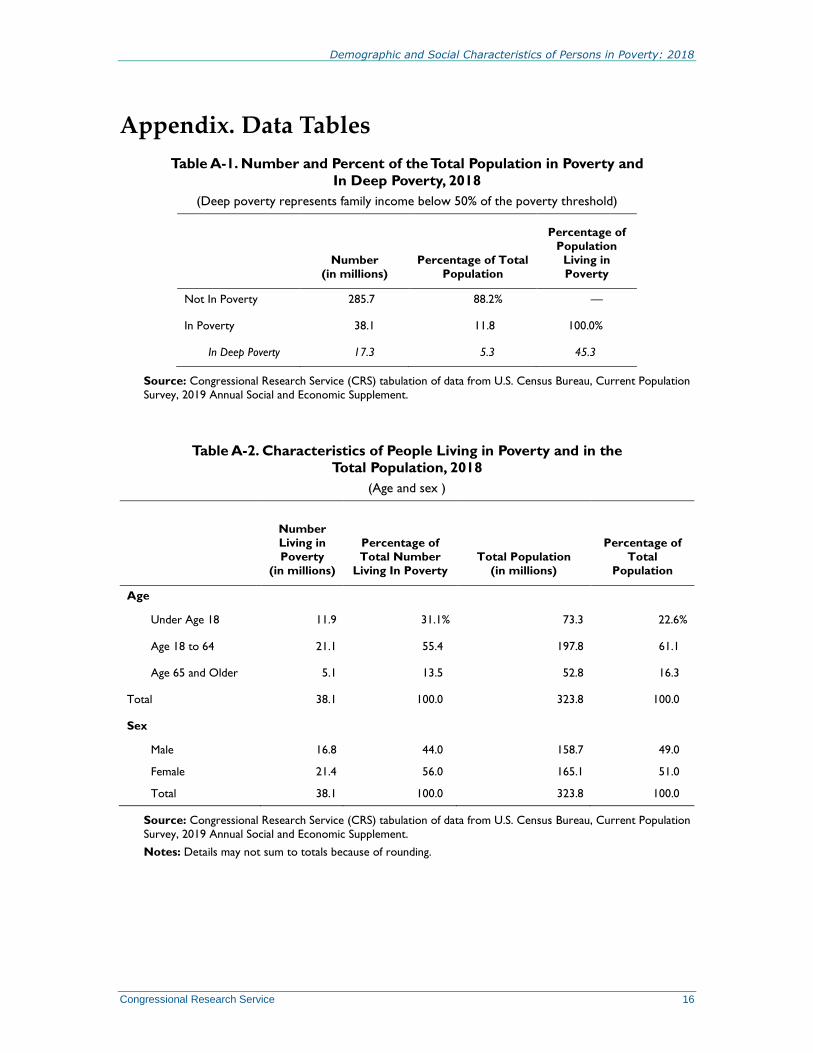
Table A-1. Number and Percent of the Total Population in Poverty and
In Deep Poverty, 2018
(Deep poverty represents family income below 50% of the poverty threshold)
Number
(in millions)
Percentage of Total
Population
Percentage of
Population
Living in
Poverty
Not In Poverty 285.7 88.2% —
In Poverty 38.1 11.8 100.0%
In Deep Poverty 17.3 5.3 45.3
Source: Congressional Research Service (CRS) tabulation of data from U.S. Census Bureau, Current Population
Survey, 2019 Annual Social and Economic Supplement.
Table A-2. Characteristics of People Living in Poverty and in the
Total Population, 2018
(Age and sex )
Number
Living in
Poverty
(in millions)
Percentage of
Total Number
Living In Poverty
Total Population
(in millions)
Percentage of
Total
Population
Age
Under Age 18 11.9 31.1% 73.3 22.6%
Age 18 to 64 21.1 55.4 197.8 61.1
Age 65 and Older 5.1 13.5 52.8 16.3
Total 38.1 100.0 323.8 100.0
Sex
Male 16.8 44.0 158.7 49.0
Female 21.4 56.0 165.1 51.0
Total 38.1 100.0 323.8 100.0
Source: Congressional Research Service (CRS) tabulation of data from U.S. Census Bureau, Current Population
Survey, 2019 Annual Social and Economic Supplement.
Notes: Details may not sum to totals because of rounding.
Demographic and Social Characteristics of Persons in Poverty: 2018
Congressional Research Service 17
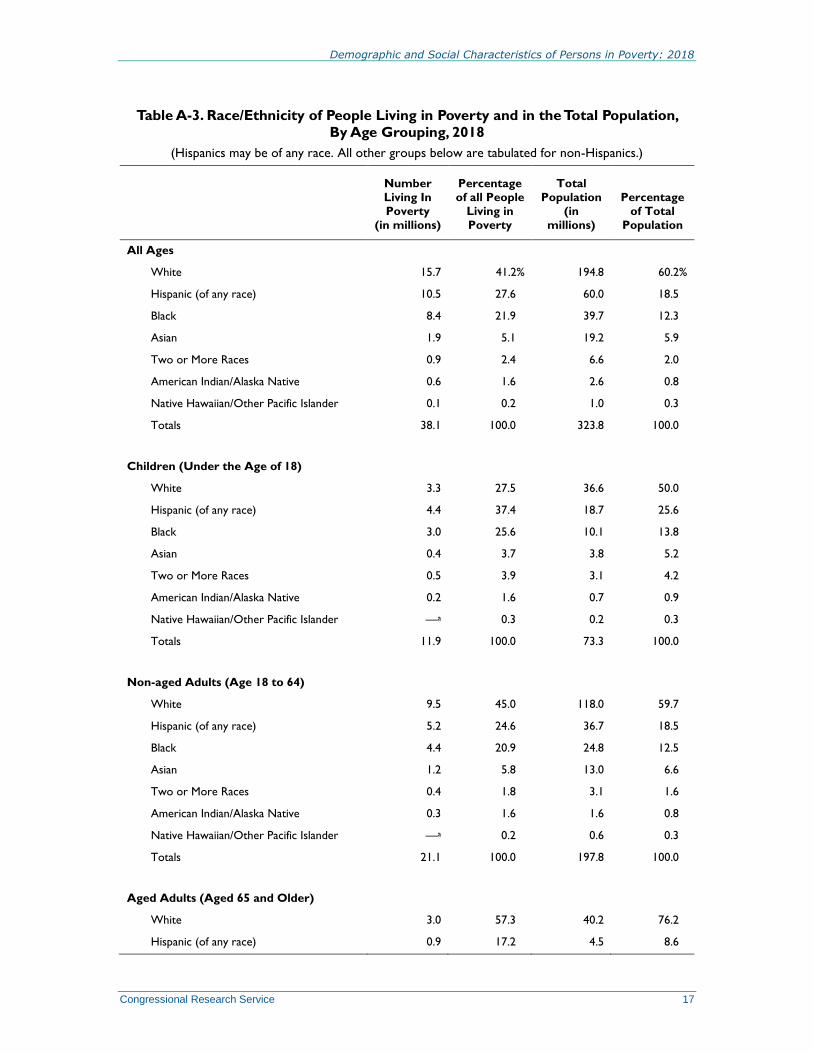
Table A-3. Race/Ethnicity of People Living in Poverty and in the Total Population,
By Age Grouping, 2018
(Hispanics may be of any race. All other groups below are tabulated for non-Hispanics.)
Number
Living In
Poverty
(in millions)
Percentage
of all People
Living in
Poverty
Total
Population
(in
millions)
Percentage
of Total
Population
All Ages
White 15.7 41.2% 194.8 60.2%
Hispanic (of any race) 10.5 27.6 60.0 18.5
Black 8.4 21.9 39.7 12.3
Asian 1.9 5.1 19.2 5.9
Two or More Races 0.9 2.4 6.6 2.0
American Indian/Alaska Native 0.6 1.6 2.6 0.8
Native Hawaiian/Other Pacific Islander 0.1 0.2 1.0 0.3
Totals 38.1 100.0 323.8 100.0
Children (Under the Age of 18)
White 3.3 27.5 36.6 50.0
Hispanic (of any race) 4.4 37.4 18.7 25.6
Black 3.0 25.6 10.1 13.8
Asian 0.4 3.7 3.8 5.2
Two or More Races 0.5 3.9 3.1 4.2
American Indian/Alaska Native 0.2 1.6 0.7 0.9
Native Hawaiian/Other Pacific Islander —a 0.3 0.2 0.3
Totals 11.9 100.0 73.3 100.0
Non-aged Adults (Age 18 to 64)
White 9.5 45.0 118.0 59.7
Hispanic (of any race) 5.2 24.6 36.7 18.5
Black 4.4 20.9 24.8 12.5
Asian 1.2 5.8 13.0 6.6
Two or More Races 0.4 1.8 3.1 1.6
American Indian/Alaska Native 0.3 1.6 1.6 0.8
Native Hawaiian/Other Pacific Islander —a 0.2 0.6 0.3
Totals 21.1 100.0 197.8 100.0
Aged Adults (Aged 65 and Older)
White 3.0 57.3 40.2 76.2
Hispanic (of any race) 0.9 17.2 4.5 8.6
Demographic and Social Characteristics of Persons in Poverty: 2018
Congressional Research Service 18
Number
Living In
Poverty
(in millions)
Percentage
of all People
Living in
Poverty
Total
Population
(in
millions)
Percentage
of Total
Population
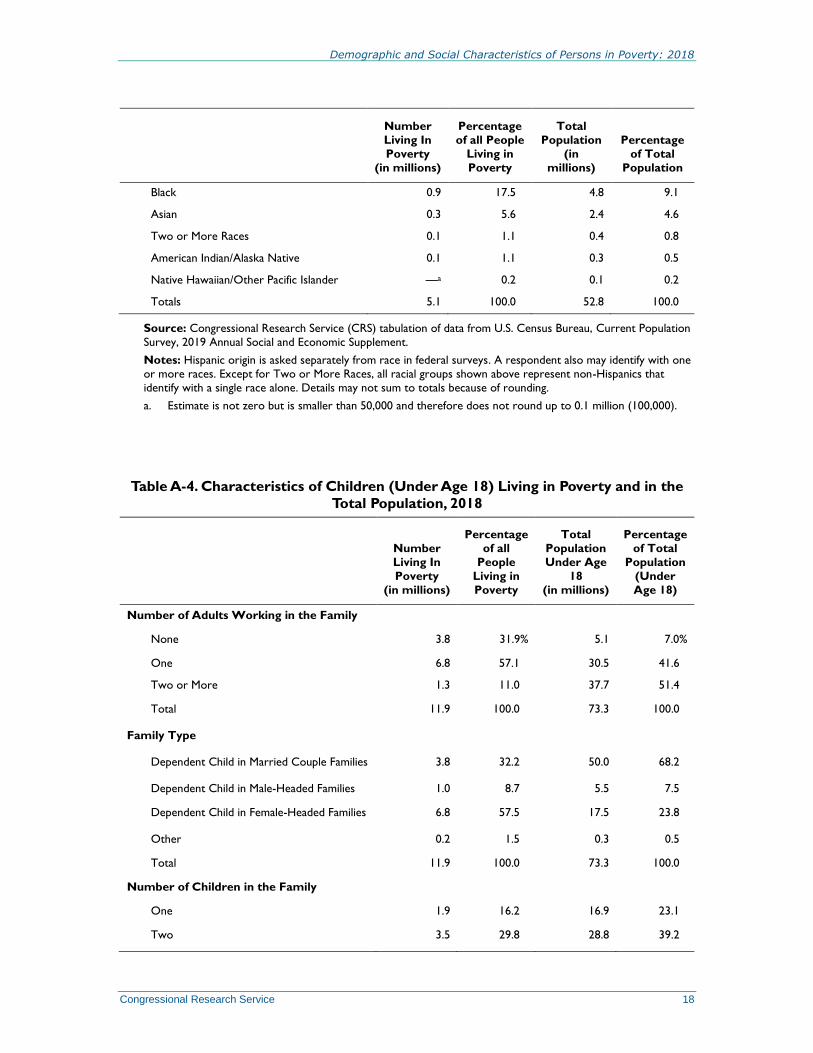
Black 0.9 17.5 4.8 9.1
Asian 0.3 5.6 2.4 4.6
Two or More Races 0.1 1.1 0.4 0.8
American Indian/Alaska Native 0.1 1.1 0.3 0.5
Native Hawaiian/Other Pacific Islander —a 0.2 0.1 0.2
Totals 5.1 100.0 52.8 100.0
Source: Congressional Research Service (CRS) tabulation of data from U.S. Census Bureau, Current Population
Survey, 2019 Annual Social and Economic Supplement.
Notes: Hispanic origin is asked separately from race in federal surveys. A respondent also may identify with one
or more races. Except for Two or More Races, all racial groups shown above represent non-Hispanics that
identify with a single race alone. Details may not sum to totals because of rounding.
a. Estimate is not zero but is smaller than 50,000 and therefore does not round up to 0.1 million (100,000).
Table A-4. Characteristics of Children (Under Age 18) Living in Poverty and in the
Total Population, 2018
Number
Living In
Poverty
(in millions)
Percentage
of all
People
Living in
Poverty
Total
Population
Under Age
18
(in millions)
Percentage
of Total
Population
(Under
Age 18)
Number of Adults Working in the Family
None 3.8 31.9% 5.1 7.0%
One 6.8 57.1 30.5 41.6
Two or More 1.3 11.0 37.7 51.4
Total 11.9 100.0 73.3 100.0
Family Type
Dependent Child in Married Couple Families 3.8 32.2 50.0 68.2
Dependent Child in Male-Headed Families 1.0 8.7 5.5 7.5
Dependent Child in Female-Headed Families 6.8 57.5 17.5 23.8
Other 0.2 1.5 0.3 0.5
Total 11.9 100.0 73.3 100.0
Number of Children in the Family
One 1.9 16.2 16.9 23.1
Two 3.5 29.8 28.8 39.2
Demographic and Social Characteristics of Persons in Poverty: 2018
Congressional Research Service 19
Number
Living In
Poverty
(in millions)
Percentage
of all
People
Living in
Poverty
Total
Population
Under Age
18
(in millions)
Percentage
of Total
Population
(Under
Age 18)
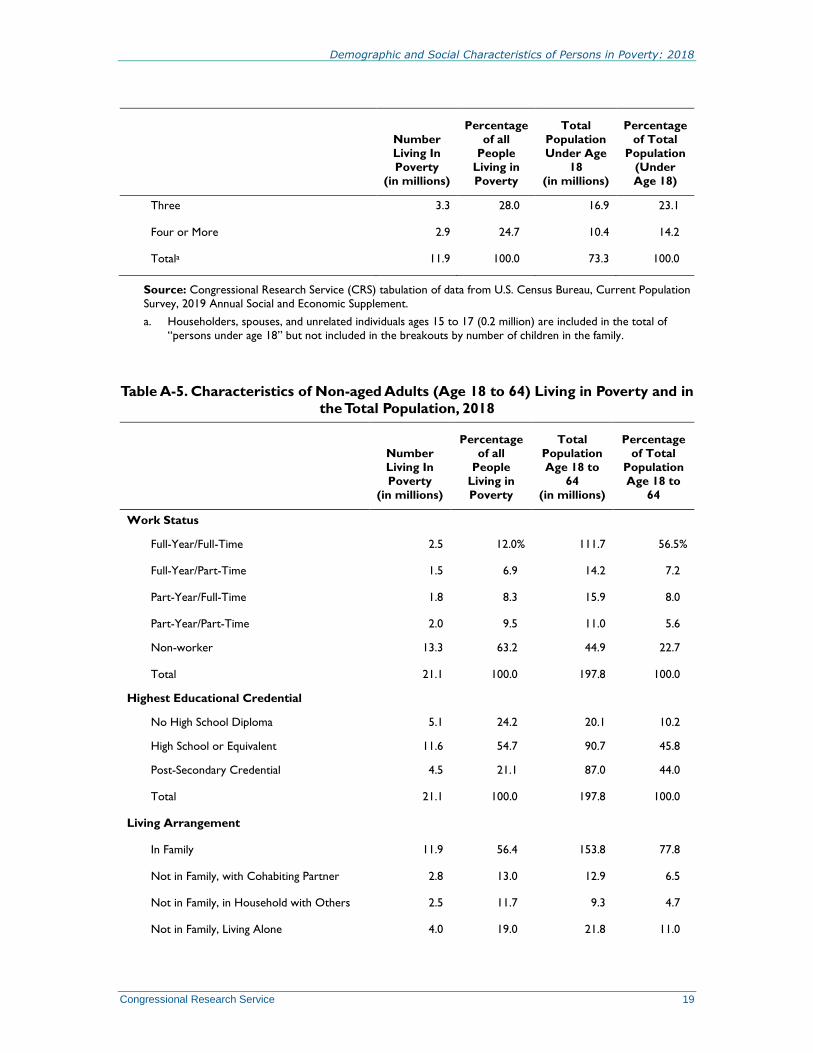
Three 3.3 28.0 16.9 23.1
Four or More 2.9 24.7 10.4 14.2
Totala 11.9 100.0 73.3 100.0
Source: Congressional Research Service (CRS) tabulation of data from U.S. Census Bureau, Current Population
Survey, 2019 Annual Social and Economic Supplement.
a. Householders, spouses, and unrelated individuals ages 15 to 17 (0.2 million) are included in the total of
“persons under age 18” but not included in the breakouts by number of children in the family.
Table A-5. Characteristics of Non-aged Adults (Age 18 to 64) Living in Poverty and in
the Total Population, 2018
Number
Living In
Poverty
(in millions)
Percentage
of all
People
Living in
Poverty
Total
Population
Age 18 to
64
(in millions)
Percentage
of Total
Population
Age 18 to
64
Work Status
Full-Year/Full-Time 2.5 12.0% 111.7 56.5%
Full-Year/Part-Time 1.5 6.9 14.2 7.2
Part-Year/Full-Time 1.8 8.3 15.9 8.0
Part-Year/Part-Time 2.0 9.5 11.0 5.6
Non-worker 13.3 63.2 44.9 22.7
Total 21.1 100.0 197.8 100.0
Highest Educational Credential
No High School Diploma 5.1 24.2 20.1 10.2
High School or Equivalent 11.6 54.7 90.7 45.8
Post-Secondary Credential 4.5 21.1 87.0 44.0
Total 21.1 100.0 197.8 100.0
Living Arrangement
In Family 11.9 56.4 153.8 77.8
Not in Family, with Cohabiting Partner 2.8 13.0 12.9 6.5
Not in Family, in Household with Others 2.5 11.7 9.3 4.7
Not in Family, Living Alone 4.0 19.0 21.8 11.0
Demographic and Social Characteristics of Persons in Poverty: 2018
Congressional Research Service 20
Number
Living In
Poverty
(in millions)
Percentage
of all
People
Living in
Poverty
Total
Population
Age 18 to
64
(in millions)
Percentage
of Total
Population
Age 18 to
64
Total 21.1 100.0 197.8 100.0
Source: Congressional Research Service (CRS) tabulation of data from U.S. Census Bureau, Current Population
Survey, 2019 Annual Social and Economic Supplement.
Note: Details may not sum to totals because of rounding.
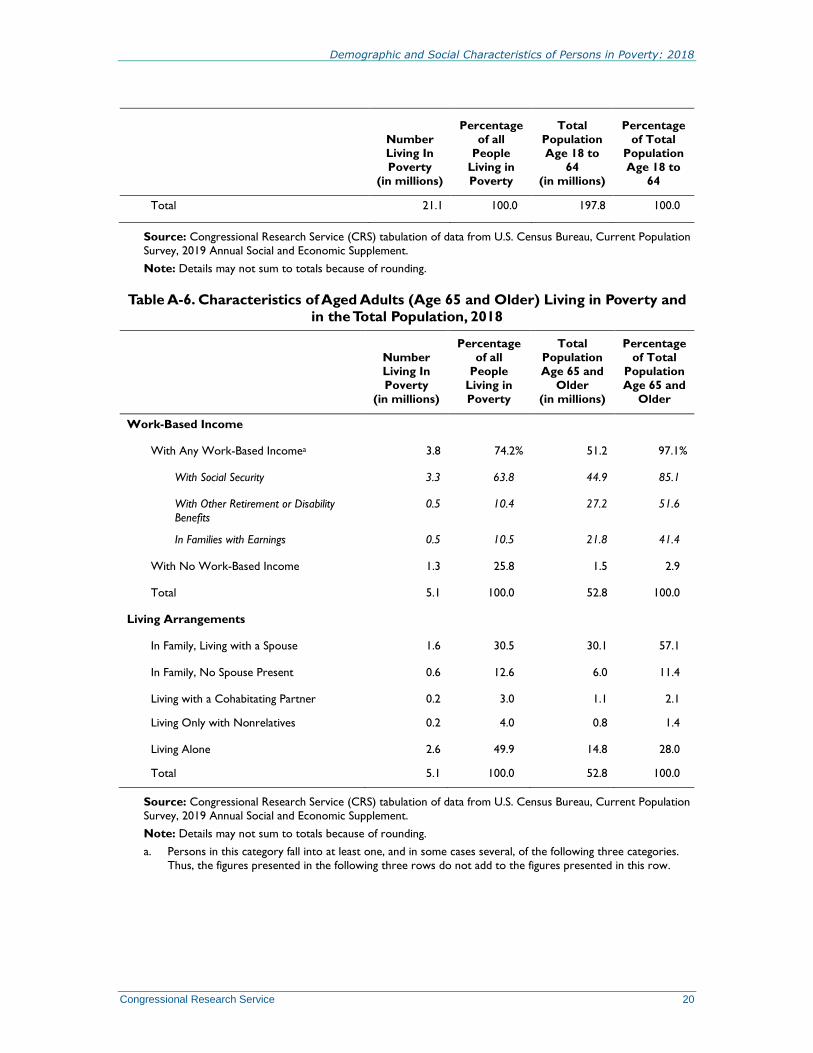
Table A-6. Characteristics of Aged Adults (Age 65 and Older) Living in Poverty and
in the Total Population, 2018
Number
Living In
Poverty
(in millions)
Percentage
of all
People
Living in
Poverty
Total
Population
Age 65 and
Older
(in millions)
Percentage
of Total
Population
Age 65 and
Older
Work-Based Income
With Any Work-Based Incomea 3.8 74.2% 51.2 97.1%
With Social Security 3.3 63.8 44.9 85.1
With Other Retirement or Disability
Benefits
0.5 10.4 27.2 51.6
In Families with Earnings 0.5 10.5 21.8 41.4
With No Work-Based Income 1.3 25.8 1.5 2.9
Total 5.1 100.0 52.8 100.0
Living Arrangements
In Family, Living with a Spouse 1.6 30.5 30.1 57.1
In Family, No Spouse Present 0.6 12.6 6.0 11.4
Living with a Cohabitating Partner 0.2 3.0 1.1 2.1
Living Only with Nonrelatives 0.2 4.0 0.8 1.4
Living Alone 2.6 49.9 14.8 28.0
Total 5.1 100.0 52.8 100.0
Source: Congressional Research Service (CRS) tabulation of data from U.S. Census Bureau, Current Population
Survey, 2019 Annual Social and Economic Supplement.
Note: Details may not sum to totals because of rounding.
a. Persons in this category fall into at least one, and in some cases several, of the following three categories.
Thus, the figures presented in the following three rows do not add to the figures presented in this row.
Demographic and Social Characteristics of Persons in Poverty: 2018
Congressional Research Service R46294 · VERSION 2 · NEW 21
Author Information
Joseph Dalaker
Analyst in Social Policy
Acknowledgments
The author is grateful for the work of CRS Specialist in Social Policy Gene Falk and CRS Specialist in
Housing Policy Maggie McCarty, who were co-authors on a previous version of this report, and for CRS
Research Assistant Emma Nyhof’s help in verifying the updated information.
Disclaimer
This document was prepared by the Congressional Research Service (CRS). CRS serves as nonpartisan
shared staff to congressional committees and Members of Congress. It operates solely at the behest of and
under the direction of Congress. Information in a CRS Report should not be relied upon for purposes other
than public understanding of information that has been provided by CRS to Members of Congress in
connection with CRS’s institutional role. CRS Reports, as a work of the United States Government, are not
subject to copyright protection in the United States. Any CRS Report may be reproduced and distributed in
its entirety without permission from CRS. However, as a CRS Report may include copyrighted images or
material from a third party, you may need to obtain the permission of the copyright holder if you wish to
copy or otherwise use copyrighted material.