Embed Size (px)
Citation preview

main : 2012/10/19(15:34)
Demographic Changes andMacroeconomic Performance:
Japanese ExperiencesOpening Remarks
by Masaaki Shirakawa,Governor of the Bank of Japan
I. Introduction
Good morning. I am very pleased to have a lot of participants from central banks,international organizations, and academia in this year’s annual BOJ-IMES Conference.On behalf of my colleagues at the Bank of Japan, I am privileged to welcome you allhere in Tokyo.
The theme of this year’s conference is “Demographic Changes and MacroeconomicPerformance.” On the theme, I am sure that Japan is the most notable case that providesa basis for discussion. Japan’s population and the working-age population—that is, thepopulation aged between 15 and 64 years—came to decline after their peak-years in2007 and in 1995 respectively. The share of the population aged 65 years or older roserapidly to 23 percent in 2010 from 12 percent in 1990 (Figure 1). In the meantime,Japan’s economic growth gradually slowed during the past two decades mainly for tworeasons. In the former half of the period, the Japanese economy was hobbled by thecrippling effect of the burst of the bubble. In the latter half, the rapid population ag-ing hampered the Japanese economy through a variety of channels. In an attempt toillustrate that, I frequently rely on the cross-country comparison of growth rates in-cluding Japan. Among G-7 countries, the Japanese GDP growth rate per working-agepopulation—an indicator least affected by demographic changes in the short run—wasthe highest. By contrast, the Japanese per capita GDP growth rate was almost the sameas the average, and the Japanese GDP growth rate, which is subject to the decreases inthe total population, was below average (Figure 2). Neoclassical growth theories nor-mally do not distinguish the overall population from the working-age population dueto analytical simplicity. However, without taking into account the distinction betweenthe two variables explicitly, the very challenges that Japan is currently faced with willbe outside the scope of analysis.
In the macroeconomic policy discussions in other economies, Japan’s experiencesare frequently cited, and a lot of lessons have been drawn over the past decade. How-ever, a general conclusion obtained in such policy discussions without consideringthe differences in the demographic factors between Japan and other economies couldsometimes be misleading.
19MONETARY AND ECONOMIC STUDIES/NOVEMBER 2012DO NOT REPRINT OR REPRODUCE WITHOUT PERMISSION

main : 2012/10/19(15:34)
Figure 1 Demographic Changes in Japan
Millions
0
Forecast
20
40
60
80
100
120
140
160Child and aged populationWorking-age populationTotal populationEmployed persons
1970 75 80 85 90 95 2000 05 10 15 20 25 30 35 40 45 50 55 60CY
Note: Child population, working-age population, and aged population refer to the number ofpersons under 15 years, those between 15 and 64 years, and those over 64 years,respectively.
Sources: National Institute of Population and Social Security Research; Ministry of InternalAffairs and Communications.
Figure 2 Effects of Rapid Population Aging
[1] Real GDP Growth Rate per
Working-Age Person
[2] Real GDP Growth
Rate per Capita
[3] Real GDP Growth Rate
Average for 2000–10, percent
Japan United
States
United
Kingdom
Euro
area
Germany France
2.0
1.6
1.2
0.8
0.4
0.0
Average for 2000–10, percent2.0
1.6
1.2
0.8
0.4
0.0Japan United
States
United
Kingdom
Euro
area
Germany France
Average for 2000–10, percent2.0
1.6
1.2
0.8
0.4
0.0Japan United
States
United
Kingdom
Euro
area
Germany France
Note: A working-age person refers to those between 15 and 64 years old.
Sources: World Bank; Haver.
Various challenges posed by demographic changes have been and will be amongthe paramount issues lying ahead for a broad group of countries including Japan. Forexample, growth rate of the Chinese working-age population has slowed since the late1980s, and is projected to turn negative by 2020 (Figure 3). Other Asian economies
20 MONETARY AND ECONOMIC STUDIES/NOVEMBER 2012

main : 2012/10/19(15:34)
Demographic Changes and Macroeconomic Performance: Japanese Experiences
Figure 3 Growth Rate of the Working-Age Population
Forecast
5
4
3
1
2
0
–1
–2
–3
Year-on-year change, percent
1955CY 352515200595857565 45 55
Japan
United States
South Korea
China
Sources: National Institute of Population and Social Security Research; United Nations.
will also find themselves in the midst of population aging in due course. It is a must-face reality which is just yet-to-come. Looking at Europe, in the euro-area peripheralcountries, immigration contributed to the expansion of the populations until 2007. Con-versely, after the global financial crisis, the immigration momentum was lost and somecountries in the region are now faced with even some emigration while suffering fromlower economic growth owing to the lower population growth or even because of thedeclining population.
Rather than trying to cover all of the relevant topics under the theme of demographicchanges and macroeconomic performance in my remark, I focus on Japan’s experienceof population aging that, I hope, will help ensuing discussions in this conference, be-cause Japan can be addressed an “advanced country” in the sense that it has been facedwith various challenges that stem from population aging ahead of other countries.I begin by explaining demographic changes in Japan briefly, and then move on toidentifying the issues related with macroeconomic performance. Finally, I will touchon the policy implications of demographic changes.
II. Demographic Changes in Japan
I begin by pointing out four relevant facts in order to consider the linkage betweenJapanese demographic changes and macroeconomic performance.
First, in former times, the Japanese population growth rate was high, and theJapanese working-age population was remarkably large. Today, this may sound waybeyond our imagination. However, in the aftermath of World War II, overpopulationwas considered a challenge to cope with. For example, Japanese emigration to Brazilby sea was restarted in 1952 and continued until 1973. It is usually understood thatJapan’s period of high-growth began in the mid-1950s and ended in the early 1970s.
21

main : 2012/10/19(15:34)
Figure 4 Japanese Age Structure in the High-Growth Era
Males Females
Males Females
0.00.20.40.60.81.01.21.4
Millions
Millions
Working-age population ratio (percent) 60.8 61.8
[1] 1955
AgeMales Females
Males Females
Working-age population ratio (percent) 67.7 67.8
[2] 1975
0
10
20
30
40
50
60
70
80
90
100Age
Millions
Millions
0
10
20
30
40
50
60
70
80
90
100
0.00.20.40.60.81.01.21.4
0.0 0.2 0.4 0.6 0.8 1.0 1.2 1.4 0.0 0.2 0.4 0.6 0.8 1.0 1.2 1.4
Source: Ministry of Internal Affairs and Communications.
The expansion of the working-age population, in tandem with the free trade regime,provided strong grounds for rapid growth. A comparison of the Japanese population byage group between the beginning and the end of the high-growth era clearly points to arapid increase in the Japanese working-age population taking place during the period,as confirmed by Figure 4 showing a blip moving upward in the population pyramid.For your reference, the average growth rate of the total population and the growth rateof the working-age population from 1955 to 1975 were 1.3 percent and 1.9 percent,respectively. A quick cross-country comparison can confirm that Japan’s populationand the growth rate of the working-age population in those days were relatively high,or sometimes even the highest, among the advanced countries.
Second, the rapid pace of decrease in the growth rate of the Japanese population andthat of the working-age population were globally unprecedented. The trend of a pop-ulation depends crucially on the birth rate and the death rate (Figure 5). The Japanesetotal fertility rate declined substantially after the 1950s, and reached 1.39 in 2010, alower level compared to that in other advanced countries. The Japanese death rate alsodeclined substantially after World War II and reached 6.0 (per thousand persons) in1979. Then it increased gradually and reached 9.5 in 2010.
Third, interestingly, the recurrent declines in the total fertility rate have long beenregarded as a one-off aberration for each point in time. Such mis-recognition led to therecurrent overestimation in the official projection of the fertility rate every five years,which has been used in the actuarial valuations for the Japanese public pension system,since the year 1976 (Figure 6). In the official projections, the long-run fertility rate haseven been assumed to rise to two in due course until 1992, when the projection wasrevised downward well below two for the first time.
22 MONETARY AND ECONOMIC STUDIES/NOVEMBER 2012

main : 2012/10/19(15:34)
Demographic Changes and Macroeconomic Performance: Japanese Experiences
Figure 5 Total and Working-Age Population
Working-age population
Total population
Japan
–0.74
0.05
United States
0.81
0.89
United Kingdom
0.59
0.60
France
0.49
0.58
Germany
–0.23
–0.06
Advanced economies’ average
0.35
0.41
Growth Rate in 2010, percent
[1] Growth Rate of the Working-Age
Population
Year-on-year change, percent2.5
2.0
1.5
1.0
0.5
0.0
–0.5
–1.0
–1.5
–2.0
–2.5
Japan
United States
United Kingdom
France
Germany
Advanced economies’ average
CY 1955 70 80 90 2000 10 20 30 40 50 60
[2] Growth Rate of the Population
Year-on-year change, percent2.0
1.5
1.0
0.5
0.0
–0.5
–1.0
–1.5
–2.0
1955 70 80 90 2000 10 20 30 40 50 60
Sources: United Nations; National Institute of Population and Social Security Research.
Figure 6 Revisions in the Japanese Total Fertility Rate Forecast
1964 7670 82 88 94CY 2000 06 12 18 24 30 36 42 48 54 601.0
1.2
1.4
1.6
1.8
2.0
2.2
2.4
Forecast
in 1986
Forecast
in 1976
Forecast
in 1992Forecast
in 1997
Forecast
in 2002Forecast
in 2012
Forecast
in 2006
Replacement ratio
Per mill
Sources: Ministry of Health, Labour and Welfare; National Institute of Population and SocialSecurity Research.
Fourth, in addition to the delay in recognition of the ongoing demographic changes,comprehension of the far-reaching implications of the changes was even more delayed.Consequently, it took further time for Japanese people to take the measures to respond
23

main : 2012/10/19(15:34)
Figure 7 Newspaper Citations on the Low Birth Rate and Population Aging
“Low birth rate” or “population aging”
“Bubble”
“Nonperforming loan”
Number of articles6,000
5,000
4,000
3,000
2,000
1,000
0
CY 1991 93 95 97 99 2001 03 05 07 09 11
Note: Number of articles found in The Nikkei, The Nikkei Business Daily, and The Nikkei MJ.
Source: Nikkei Telecom.
to the expected demographic changes. Incidentally, if you look back at 1992, the WhitePaper on the National Life Style published by the government that year was titled, “TheAdvent of Society with Low Birth Rates: Its Effect and Response.” With hindsight,Japan around that time was painfully looking for ways to recover in the aftermathof the bubble economy. At that stage, I recall that most Japanese people along witheconomists did not grasp the gravity of population aging coupled with a low birth ratefor Japan’s economy as properly as we later came to realize. In that regard, for example,a database on Japanese newspaper articles indicates that articles on population agingor a low birth rate started increasing in the 1990s. However, it was only until in themiddle of the 2000s, articles on population aging or a low birth rate outnumbered thoseon asset price bubbles or nonperforming loans (Figure 7). Up until around that time,the working-age population had declined for about 10 years.
III. Effects of Demographic Change on Japanese Economy
In the light of Japan’s experience, I will elaborate on three aspects, first, the economicgrowth rate, second, inflation and, third, the current account balance, of the impact ofdemographic changes from the viewpoint of macroeconomic performance.
A. Economic Growth RateAt the outset, I pick up the most paramount consequence of demographic changes forthe Japanese economy, among others, that is, the economic growth rate.
The economic growth model supposes that everyone works at a given intensity.With a labor-augmenting technological change, in the long-run steady state, per capitavariables grow at the rate of technological change, and aggregate variables grow atthe rate equal to the sum of population growth and technological change. In aging
24 MONETARY AND ECONOMIC STUDIES/NOVEMBER 2012

main : 2012/10/19(15:34)
Demographic Changes and Macroeconomic Performance: Japanese Experiences
Figure 8 Decomposition of Real GDP Growth in Japan
Productivity (real GDP per employed person)
Number of employed persons
Real GDP
Average year-on-year changes, percent6
5
4
3
2
1
0
Forecast
1970s 1980s 1990s 2000s 2010s 2020s 2030s
+0.8
+0.5–0.3
–0.6 –0.8
–1.2
+0.9
–2
–1
Note: Fiscal-year basis. The rates of change in the number of employed persons from the 2010sonward are calculated using the population outlook (medium variant) and the projectedlabor force participation rates (assuming the labor force participation rates in each age/sexgroup remain the same as those in 2010).
Sources: Cabinet Office; Ministry of Internal Affairs and Communications; National Institute ofPopulation and Social Security Research.
economies, including Japan, where the working-age population has started decreasing,the labor force also declines, given the participation rate being held constant. Becausethe scarce labor force imposes a natural constraint on labor supply, the marginal productof capital declines accordingly. As a result, macroeconomic growth would be impeded.With this idea in mind, the Japanese economic data in the past decade indicate thatthe workforce declined by 0.3 percentage point, labor productivity increased by 0.8percentage point, and they add up to a real GDP growth rate increase of 0.6 percent 1
(Figure 8).Having said that, while such an analysis would provide a useful first-order approx-
imation to consider the effects of population aging and the declining population, forthe sake of policy consideration, we need slightly more realistic approaches thatincorporate other factors.
The first factor is the possibility that labor participation may adjust to the demo-graphic changes in the long run. For example, the labor participation rate of Japanesefemales was notably lower than that in other advanced countries. In particular, Japanesefemales in their 30s participate in the labor market noticeably less, which was creatinga stark M-shaped curve in the participation ratio over ages in the past and in the presentas well. However, the gap between Japan and other advanced countries in the depth ofa dip on the M-shape has been dissipating in recent years (Figure 9).
The second effect comes from the gap between the per capita growth rate andthe growth rate per working-age population. The economic growth model by Solow
......................................................................................1. The contributions do not add up to the total GDP growth rate (0.6 percent) because of the rounding errors.
25

main : 2012/10/19(15:34)
Figure 9 Labor Participation of Female Workers
1990
2000
2010
[1] Labor Participation of
Female Workers in Japan
100
90
80
70
60
50
015– 20– 25– 30– 35– 40– 45–
40
30
20
10
Age 55– 60– 65–
Percent
Japan
United States
Germany
[2] Comparison of Labor Participation of
Female Workers in 2010
Sweden
100
90
80
70
60
50
0
40
30
20
10
Percent
15– 20– 25– 30– 35– 40– 45–Age 55– 60– 65–50– 50–
Sources: Ministry of Internal Affairs and Communications; OECD.
supposes that a nation’s population coincides with that nation’s labor force. In prac-tice, as population aging advances, the gap between the population and the labor forcegrows larger. In the process of an increase in the share of the old non-working popula-tion, the per capita growth rate would be lower than the growth rate per working-agepopulation. The growth rate per working-age population is important from a viewpointof the supply capacity; however, the growth rate per capita is a more important in-dicator when we think about the income level of an average consumer who supportsaggregate demand for goods and services in the macroeconomy. Even if the growth rateper working-age population is high, as long as the per capita growth rate is decreasing,downward pressure to demand could impede macroeconomic growth.
Third, we may need to consider the so-called “spending wave” hypothesis (Figure10). For one reason, the Japanese asset price bubble was caused by Japanese babyboomers who experienced their peak spending years, particularly, for mortgages. Dur-ing the bubble period, they indeed actively purchased their homes. Likewise, demogra-phic changes, among other factors, were highly responsible for the decrease in domesticcar sales after the late 1990s. On the other hand, the progress in population aging meansthat the elderly increase demand for services, such as medical and nursing care. Cur-rently, the population aged 60 years or older accounts for around 40 percent of Japaneseconsumption. Their shares in the Japanese consumption are projected to increase fur-ther. If Japanese firms change their products in responding to such increase in thepotential demand, their efforts should slow the reductions in the potential growth rate.
The fourth factor arising from demographic changes could come into play throughfiscal balance (Figure 11). Rapid population aging is the dominant factor in increasinga fiscal deficit. Obviously, the continued population aging increases a fiscal deficit
26 MONETARY AND ECONOMIC STUDIES/NOVEMBER 2012

main : 2012/10/19(15:34)
Demographic Changes and Macroeconomic Performance: Japanese Experiences
Figure 10 The “Spending Wave”
[1] Housing Starts [2] Domestic Car Sales
5
4
3
2
1
[3] Real Output in the Medical
and Health Care Industry
60
50
40
30
20
10
¥ trillions at constant 2000 prices
1980 85 90 95 2000 05 10
Millions
1980 85 90 95 2000 05 10
1.8
1.6
1.4
1.2
1.0
0.8
1980 85 90 95 2000 05 10
0.6
CY
Millions
Note: Average in the last five years. The value in 2010 for “Real Output in the Medical and HealthCare Industry” is calculated using year-on-year changes from 2006 to 2008.
Sources: Ministry of Land, Infrastructure, Transport and Tourism; Japan Automobile DealersAssociation; Japan Mini Vehicles Association; Research Institute of Economy, Tradeand Industry.
Figure 11 Fiscal Balance in Japan
[1] Social Security Expenditure by Category
55
50
45
40
35
30
1970
25
FY
¥ trillions
[2] Fiscal 2012 Budget (General Account)
20
15
10
5
0
Others
¥25.4 tril.
(28 percent)
Persons
¥51.7 tril.
(51.8 percent)
Medical care
¥30.8 tril.
(30.9 percent)
Welfare and
others
¥17.3 tril.
(17.3 percent)
Social
security
¥26.4 tril.
(29 percent)
Local
allocation tax
grants
¥16.6 tril.
(18 percent)
National debt
service
¥21.9 tril.
(24 percent)
75 80 85 90 95 2000 05 09
Note: The scope of social security expenditure is based on the International Labor Organizationstandards for international comparison.
Sources: National Institute of Population and Social Security Research; Ministry of Finance.
27
main : 2012/10/19(15:34)
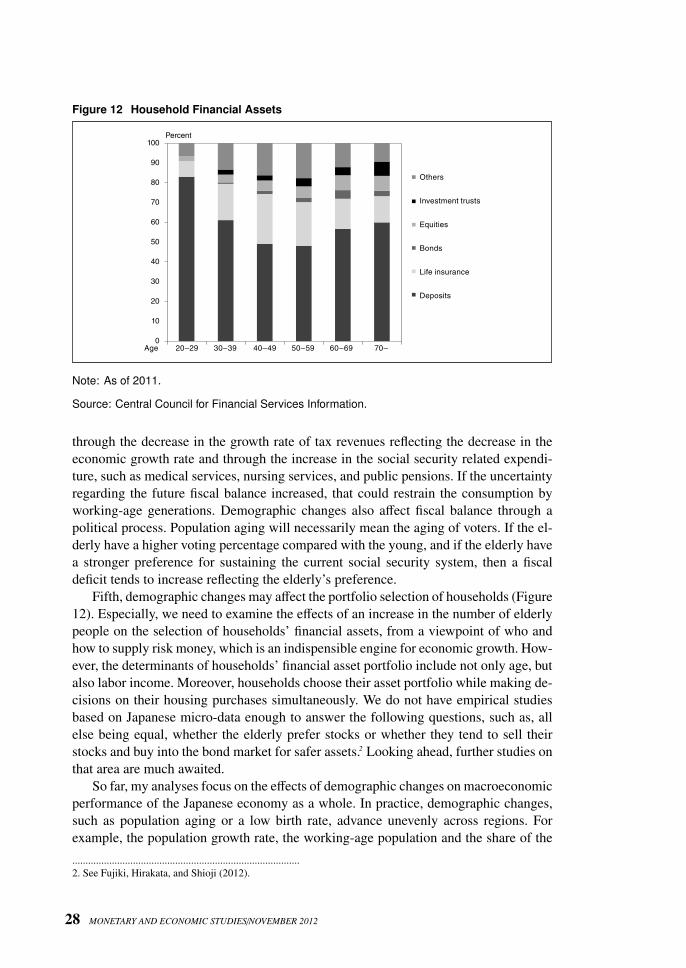
Figure 12 Household Financial Assets
100
90
80
70
60
50
40
30
20
10
0
Others
Investment trusts
Equities
Bonds
Life insurance
Deposits
20–29 30–39 40–49 50–59 60–69 70–
Percent
Age
Note: As of 2011.
Source: Central Council for Financial Services Information.
through the decrease in the growth rate of tax revenues reflecting the decrease in theeconomic growth rate and through the increase in the social security related expendi-ture, such as medical services, nursing services, and public pensions. If the uncertaintyregarding the future fiscal balance increased, that could restrain the consumption byworking-age generations. Demographic changes also affect fiscal balance through apolitical process. Population aging will necessarily mean the aging of voters. If the el-derly have a higher voting percentage compared with the young, and if the elderly havea stronger preference for sustaining the current social security system, then a fiscaldeficit tends to increase reflecting the elderly’s preference.
Fifth, demographic changes may affect the portfolio selection of households (Figure12). Especially, we need to examine the effects of an increase in the number of elderlypeople on the selection of households’ financial assets, from a viewpoint of who andhow to supply risk money, which is an indispensible engine for economic growth. How-ever, the determinants of households’ financial asset portfolio include not only age, butalso labor income. Moreover, households choose their asset portfolio while making de-cisions on their housing purchases simultaneously. We do not have empirical studiesbased on Japanese micro-data enough to answer the following questions, such as, allelse being equal, whether the elderly prefer stocks or whether they tend to sell theirstocks and buy into the bond market for safer assets.2 Looking ahead, further studies onthat area are much awaited.
So far, my analyses focus on the effects of demographic changes on macroeconomicperformance of the Japanese economy as a whole. In practice, demographic changes,such as population aging or a low birth rate, advance unevenly across regions. Forexample, the population growth rate, the working-age population and the share of the
......................................................................................2. See Fujiki, Hirakata, and Shioji (2012).
28 MONETARY AND ECONOMIC STUDIES/NOVEMBER 2012

main : 2012/10/19(15:34)
Demographic Changes and Macroeconomic Performance: Japanese Experiences
Figure 13 Ratios of Population over 65 Years by Region
20.0–22.9
23.0–25.9
26.0 and over
Ratio of aged population,
percent
Under 20.0
Note: As of 2010.
Source: Ministry of Internal Affairs and Communications.
population aged 65 years or older vary substantially from region to region (Figure 13).Behind the dispersion in prefectural growth rates, regional fiscal balances and thestrategies of financial institutions lie uneven developments in demographic changesacross prefectures.
B. Rate of Price IncreaseNext, I elaborate on the linkage between demographic changes and deflation from aviewpoint of macroeconomic performance. Seemingly, there would be no linkage be-tween demography and deflation. But it may not be the case. A cross-country compar-ison among advanced economies reveals intriguing evidence: over the decade of the2000s, the population growth rate and inflation correlate positively across 24 advancedeconomies (Figure 14).3 That finding shows a sharp contrast with the recently waningcorrelation between money growth and inflation (Figure 15).4 How could we squarethose facts with each other?
......................................................................................3. Another cross-country inspection based on a broader sample, including developing countries, does not detect
positive correlation between inflation and population growth in the 2000s and in earlier periods likewise.4. See Kimura et al. (2010).
29

main : 2012/10/19(15:34)
Figure 14 Working-Age Population Growth and Inflation: A Cross-Country Comparison
[1] 1990s
Year-on-year change, percent12
10
8
6
4
2
0
–2
GD
P d
efla
tor
320–1 1
Working-age population growth, percent
Japan
Correlation coefficient: 0.07
[2] 2000s
Year-on-year change, percent8
6
4
2
0
Japan
Correlation coefficient: 0.67
–2
–1
3
1
5
7
320–1 1
Working-age population growth, percent
GD
P d
efla
tor
Note: For the 24 countries where the data are available among those that joined the OECD bythe 1990s.
Source: OECD.
To some extent, the correlation between population growth and inflation could inpart be explained by the co-movement caused by business cycles. In some advancedeconomies in Europe and North America, it could be the case that the fluctuationsin economic activity would vary the size of an output gap, creating pressure up ordown on inflation while attracting or discouraging immigration that amplifies variationsin population. That hypothesis, however, appears to be impertinent in some countriesincluding Japan, where the impact of immigration on the total population is extremelysmall and thus can be disregarded. On that ground, business cycle fluctuations havehad a minimal impact on demographic changes. A closer look at the case of Japanconfirms the increasingly positive correlation between inflation and population growthsince the 1990s (Figure 16). That would reflect the momentum towards real incomecreation being undermined by population aging.
As I have discussed, repercussions of the bubble-burst, the rapid aging and stag-nation of productivity have been underway in Japan. Against the backdrop, the realper capita GDP growth rate has remarkably declined from somewhere around 4 per-cent back in the 1980s to almost 1 percent these days (Figure 17). With the yet-to-accelerate population aging well envisaged for the foreseeable future, the decline inthe real GDP growth rate could undermine the medium- to long-term expectations forpotential growth, giving rise to lower permanent income of households.
The decrease in potential growth, which effectively means a stagnant supply capac-ity, gives rise to lower permanent income. On the flip side, the corresponding contrac-tion in aggregate supply would offset such decline in aggregate demand. Simultaneouschanges in aggregate demand and aggregate supply keep the price level unchanged.I reemphasize the fact, however, that the public had long remained by and large
30 MONETARY AND ECONOMIC STUDIES/NOVEMBER 2012

main : 2012/10/19(15:34)
Demographic Changes and Macroeconomic Performance: Japanese Experiences
Figure 15 Money Growth and Inflation
Adjusted money growth (percentage points) Inflation rate (percent)
[2] France[1] United States
15
1970 80 90 2000 10
10
5
0
–5
(–0.18)(0.62) (0.79) (0.59)
FY
15
20
25
10
5
0
–5
1970 80 90 2000 10FY
Percent PercentPercent
[4] Japan
15
20
25
10
5
0
–5
(0.65) (0.31)
[3] United Kingdom
20
30
10
0
–10
–20
(0.49) (0.17)
1970 80 90 2000 10 1970 80 90 2000 10FYFY
Percent Percent
Notes: 1. Figures in parentheses are correlation coefficients of 1970–94 and 1995–2011.2. Money growth is selected as M2 for the United States and Japan, M3 for France, and
M4 for the United Kingdom, respectively. Adjusted money growth is defined as moneygrowth minus real GDP growth.
3. Because of the data discontinuity of Germany in the 1990s, France is selected as therepresentative of the euro area.
Sources: International Monetary Fund; statistics of individual countries.
unaware of the dangers created by demographic changes but, over time, the awarenesshas slowly been phased in. Along with such gradually phased-in public awareness, yet-to-materialize declines in GDP growth have also been factored in, precipitating today’sdecrease in aggregate demand and all the forward-looking responses have come intoplay behind Japan’s deflation.5
In the meantime, the real per capita GDP growth rate in most of Americanand European advanced economies has declined to Japan’s neighborhood range(Figure 17).
Looking ahead, aging and the declining working-age population are expected tocontinue in those American and European countries. I cannot entirely rule out thelooming menace that may unveil itself into downward pressure on inflation rates ifsuch demographic changes are to undermine the momentum toward income creation inthe economy.
......................................................................................5. See Katagiri (2012) for a mechanism that a series of unexpected revisions in the forecasts for the Japanese
population could lead to protracted deflation.
31

main : 2012/10/19(15:34)
Figure 16 Population Growth and Inflation in Japan
[1] Population and the GDP Deflator
9
6
3
0
4
1960 80 90 200095 0585
3
CY
Year-on-year change,
percent
2
1
–1
5
0
75 10
Working-age population
Labor force
GDP deflator (right scale)
7065
–3
Year-on-year change,
percent
[2] Potential Growth Rate and Expected
Inflation in the Medium to Long Term
4.5
3.0
1.5
0.0
–1.5
3.0
2.0
1.5
1.0
0.0
3.5
0.5
2.5
1991 11FY 06200196
Percent Percent
Potential growth rate per capita
Expected inflation (right scale)
Note: Lagged values are used for population growth because they precede inflation by a year.Expected inflation is the inflation outlook for CPI in the next six to 10 years by theConsensus Forecast (average of the April and October surveys in each year). Thepotential growth rate is calculated by the Bank of Japan.
Sources: Bank of Japan; Consensus Forecast; Ministry of Internal Affairs and Communications.
Figure 17 Real per Capita GDP Growth Rate in Advanced Economies
10-year average growth rate, percent
Japan
Germany
United Kingdom
United States
France
Spain
Italy
5
4
3
2
1
0
–1
CY 1971–
80
73–
82
75–
84
77–
86
79–
88
81–
90
83–
92
85–
94
87–
96
89–
98
91–
2000
93–
02
95–
04
97–
06
99–
08
01–
10
Sources: United Nations; statistics by individual countries.
C. Current AccountThe final issue that I am taking up from a viewpoint of macroeconomic performanceand the demographic changes is the current account. Some argue that, as signaledby the swing to a deficit of the Japanese trade balance in fiscal year 2011, the
32 MONETARY AND ECONOMIC STUDIES/NOVEMBER 2012

main : 2012/10/19(15:34)
Demographic Changes and Macroeconomic Performance: Japanese Experiences
Figure 18 Current Account, Trade Balance, and Income Balance
¥ trillions
Trade balance
Income balance
Current account
Service balance
Current transfers
5
0
35
30
25
20
15
10
–5
–10FY 1996 97 98 99 2000 01 02 03 04 05 06 07 08 09 10 11
Sources: Ministry of Finance; Bank of Japan.
current account balance will also turn into deficit over time (Figure 18). I disagree withsuch views.
The swing to a deficit in the trade balance reflected the declines in exports and in-creases in imports, both of which are driven by temporary factors: exports subsidedresulting from the disruption to the supply chains due to the Great East Japan Earth-quake. The sharp increase in imports of liquefied natural gas and other fossil fuels wasneeded to meet the increased demand from thermal power plants, which substitutednuclear power lost by the accident.
In general, the current account broadly reflects the savings-investment balance ofthe economy. On one hand, as for savings, a higher elderly population share in theeconomy would reduce the aggregate savings rate as a life-cycle model indicates. Onthe other hand, population aging affects investment at least through two channels. First,if a decrease in the labor force substitutes for capital, domestic investment could in-crease. Second, a decrease in domestic demand due to the declining population reducesdomestic investment. If population aging shifts consumption towards the service in-dustry, where firms find it hard to substitute labor for capital, the second effect willdominate the first effect. Anyway, the Japanese income balance recorded Y=12.4 tril-lion, or 2.5 percent of nominal GDP on average from the year 2002 to year 2011,which reflects the net international investment position of Y=253 trillion as of the end of2011, or more than 50 percent of nominal GDP. Those figures suggest that the Japanesecurrent account surplus will continue for the time being.
IV. Can Japan Respond to Demographic Changes?
Demographic changes have affected the Japanese economy slowly but steadily andprofoundly. Downward pressure on the Japanese economic growth rate resulting from
33

main : 2012/10/19(15:34)
Figure 19 Labor Participation of Female Workers and the Fertility Rate
[2] Prefectures in Japan[1] The 15 OECD Giants
2.0
1.8
1.0
65 75 85
Total fertility rate
1.2
1.4
1.6
0.8Correlation coefficient: 0.38
807060
Labor participation for female workers
aged 30 to 44, percent
Total fertility rate2.4
2.0
2.2
1.8
1.6
1.4
1.2
1.0
Japan
United States
United Kingdom
France
Germany
South
Korea
40 60 80 100
Labor participation for female
workers, percent
Canada
Sweden
Italy
Correlation coefficient: 0.46
50 70 90
Note: The left panel includes the 15 largest countries in terms of nominal GDP in 2009. Theright panel shows the values in 2010.
Sources: National Institute of Population and Social Security Research; Ministry of InternalAffairs and Communications; OECD.
various channels reflecting the continuing population aging will persist in the foresee-able future. With the pressure underway, should we live with the dwindling economyand quietly accept it as the fate that we cannot escape? My answer is definitely no. Theeffects of population aging on an economy can vary, depending on the flexibility ofthat nation’s economy and society. The current difficulties come not from the continuedpopulation aging itself, but from the delayed response to it. On that ground, I emphasizethat, if society correctly recognizes the challenges coming from demographic changes,and if society judges that changes in the systems are needed, we should find remediesin our hands. I offer a couple of options for possible changes if Japanese people aredetermined to take action.
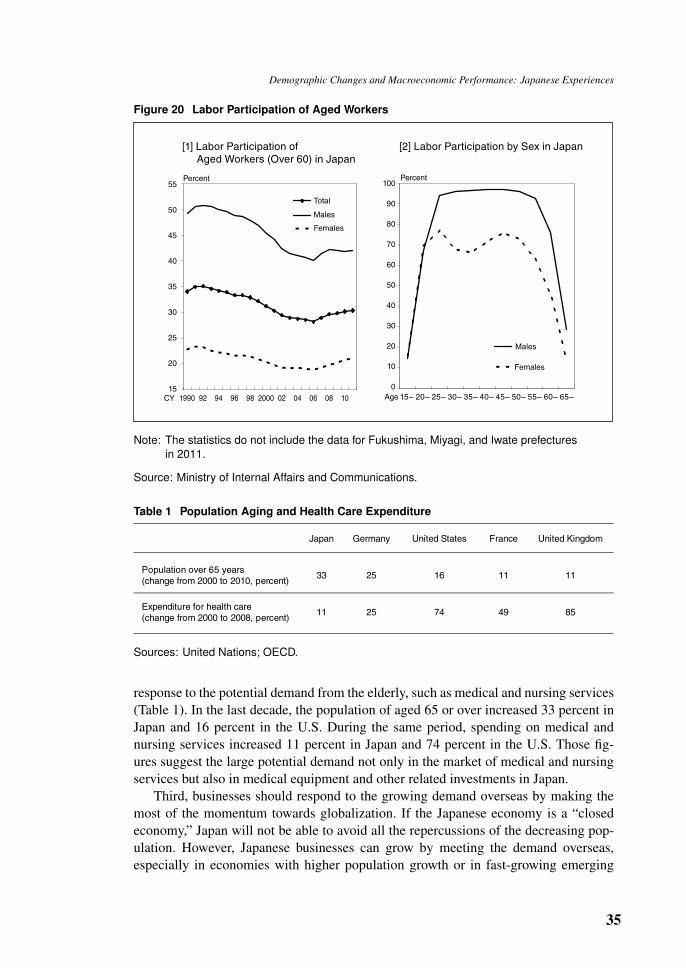
The first option is to make various efforts to increase the labor force. Setting asidethe issues that go beyond the mandate of a central bank governor, for example, whetherto accept more foreign workers, we can increase the labor force by raising the birth rateand/or the labor participation rate. Interestingly, labor participation of female workersand the birth rate have a positive relationship, according to a cross-country data analy-sis. Among 47 Japanese prefectures, labor participation of females aged from 30 to 44and the birth rate have a positive relationship (Figure 19). Recently, labor participationof Japanese female and elderly workers increased steadily. Efforts to increase the laborforce have already started and some progress has been made (Figure 20).
The second option is to adjust the supply-side structure with the ongoing changesin line with the demand pattern. Typical examples on the domestic front include the
34 MONETARY AND ECONOMIC STUDIES/NOVEMBER 2012
main : 2012/10/19(15:34)
Demographic Changes and Macroeconomic Performance: Japanese Experiences
Figure 20 Labor Participation of Aged Workers
55
50
45
40
35
[1] Labor Participation of
Aged Workers (Over 60) in Japan
Total
Males
CY 1990 92 94 96 98 2000 02 04 06 08 10
Percent
Females
30
25
20
15
[2] Labor Participation by Sex in Japan
Percent
Males
Females
Age 15– 20– 25– 30– 35– 40– 45– 50– 55– 60– 65–
100
50
90
40
80
30
70
20
60
10
0
Note: The statistics do not include the data for Fukushima, Miyagi, and Iwate prefecturesin 2011.
Source: Ministry of Internal Affairs and Communications.
Table 1 Population Aging and Health Care Expenditure
Japan Germany United States France United Kingdom
Population over 65 years
(change from 2000 to 2010, percent)33 25 16 11 11
Expenditure for health care
(change from 2000 to 2008, percent)11 25 74 49 85
Sources: United Nations; OECD.
response to the potential demand from the elderly, such as medical and nursing services(Table 1). In the last decade, the population of aged 65 or over increased 33 percent inJapan and 16 percent in the U.S. During the same period, spending on medical andnursing services increased 11 percent in Japan and 74 percent in the U.S. Those fig-ures suggest the large potential demand not only in the market of medical and nursingservices but also in medical equipment and other related investments in Japan.
Third, businesses should respond to the growing demand overseas by making themost of the momentum towards globalization. If the Japanese economy is a “closedeconomy,” Japan will not be able to avoid all the repercussions of the decreasing pop-ulation. However, Japanese businesses can grow by meeting the demand overseas,especially in economies with higher population growth or in fast-growing emerging
35

main : 2012/10/19(15:34)
Figure 21 Gross Domestic Product and Gross National Income in Japan
[2] Income Balance[1] GDP and GNI
0820001996FY 0698 11100402
0
2
4
6
8
10
12
14
16
18¥ trillions
Others
Direct investment income
Portfolio investment income
Income balance
CY 2000 = 100116
114
112
104
106
102
108
110
100
1996
98
96
94
Gross domestic product
Gross national income – trading gains
2000 02 04 1198 100806CY
Sources: Cabinet Office; Ministry of Finance; Bank of Japan.
Figure 22 Foreign Outward Direct Investment
Percentage of nominal GDP90
0
80
70
60
50
40
30
20
10
Japan
United States
United Kingdom
Germany
France
CY 10080604021990 200098969492
Source: OECD.
economies. One option to meet the foreign demand is exports, while other optionsmay include, for example, bolstering foreign direct investment by Japanese businessesin pursuit of higher profitability, which would result in a surplus in the income bal-ance. The real GDP increased by 0.6 percent annually on average in the 2000s while,the real GNI excluding the terms of trade gains/losses, an indicator comparable to thereal GDP, grew more rapidly by 0.7 percent (Figure 21). Of related matters, the ratioof Japanese foreign direct investment is notably lower than that in other advancedcountries. Room for increasing the ratio would be substantial (Figure 22). Increasesin the income balance surplus may require a renewed focus on GNI, which summarizesthe income earned by Japanese people. Finally, businesses can better reallocate their
36 MONETARY AND ECONOMIC STUDIES/NOVEMBER 2012

main : 2012/10/19(15:34)
Demographic Changes and Macroeconomic Performance: Japanese Experiences
Figure 23 Labor Productivity per Employed Person by Country
United States
Italy
Japan
United Kingdom
Canada
Germany
France
U.S. dollar thousands
20 30 40 50 60 70 80 90 100
Note: Average in the 2000s.
Source: World Bank.
capital in line with the aforementioned three options to raise productivity. I havealready referred to the growth rate of Japanese labor productivity, and now I pointout that the level of labor productivity is lower than that in other advanced countries(Figure 23). Put differently, per capita income could increase substantially if businessesreallocate their capital to be better aligned with the efficient allocations.
V. Concluding Remarks
I have explained how demographic changes affect the Japanese economy through vari-ous channels. In retrospect, up until the global credit bubble-burst, both academics andpolicymakers did not fully appreciate the significance of a bubble-burst. The Japaneseexperience of a bubble-burst tended to be underestimated as an idiosyncratic episode.Likewise, bystanders’ apprehension about the ongoing demographic changes in Japanmay, I fear, be falling short of the mark. My sense is that full apprehension of the con-sequences of rapid population aging, coupled with the low birth rate, is yet to be seenin light of the importance of the issue. Economics has dealt with the issue of popula-tion, not to mention a few examples such as, Petty’s Political Arithmetic or Malthus’sAn Essay on the Principle of Population. For the sake of economic policy formulation,basic research on demographic changes and their policy implications is indispensable.I hope that this conference would help contribute to the accumulation of such research.Thank you.
37

main : 2012/10/19(15:34)
References
Fujiki, H., N. Hirakata, and E. Shioji, “Aging and Household Stockholdings: Evidence from JapaneseHousehold Survey Data,” paper presented at the 2012 BOJ-IMES Conference on “Demo-graphic Changes and Macroeconomic Performance,” Institute for Monetary and EconomicStudies, Bank of Japan, 2012.
Katagiri, M., “Economic Consequences of Population Aging in Japan: Effects through Changesin Demand Structure,” IMES Discussion Paper No. 2012-E-3, Institute for Monetary andEconomic Studies, Bank of Japan, 2012.
Kimura, T., T. Shimatani, K. Sakura, and T. Nishida, “The Role of Money and Growth Expectationsin Price Determination Mechanism,” Bank of Japan Working Paper No. 10-E-11, Bank ofJapan, 2010.
Shirakawa, M., “Globalization and Population Aging: Challenges Facing Japan,” speech to the Boardof Councillors of Nippon Keidanren (Japan Business Federation) in Tokyo on December 22,2011.
38 MONETARY AND ECONOMIC STUDIES/NOVEMBER 2012