Embed Size (px)
Citation preview
Am. J. Hum. Genet. 56:979-992, 1995
Demographic History of India and mtDNA-Sequence DiversityJoanna L. Mountain,' Joan M. Hebert,' Silanjan Bhattacharyya,2 Peter A. Underhill,'Chris Ottolenghi,? Madhav Gadgil,2 L. Luca Cavalli-Sforza'
'Department of Genetics, Stanford University, Stanford; 2Centre for Ecological Sciences, Indian Institute of Science,Bangalore; and 3Villa Saint Michel, Paris
Summary
The demographic history of India was examined bycomparing mtDNA sequences obtained from membersof three culturally divergent Indian subpopulations (en-dogamous caste groups). While an inferred tree revealedsome clustering according to caste affiliation, there wasno clear separation into three genetically distinct groupsalong caste lines. Comparison of pairwise nucleotidedifference distributions, however, did indicate a differ-ence in growth patterns between two of the castes. TheBrahmin population appears to have undergone eithera rapid expansion or steady growth. The low-rankingMukri caste, however, may have either maintained aroughly constant population size or undergone multiplebottlenecks during that period. Comparison of the In-dian sequences to those obtained from other popula-tions, using a tree, revealed that the Indian sequences,along with all other non-African samples, form a starlikecluster. This cluster may represent a major expansion,possibly originating in southern Asia, taking place atsome point after modern humans initially left Africa.
Introduction
The current genetic diversity within a given region isthe consequence of that region's demographic history,including the effects of geographic location (with respectto other populated areas), population-size fluctuations,and social structure. India, with a central geographiclocation, an extended period of human occupation, anda hierarchical social structure, provides unique opportu-nities for exploring the relationship between genetic di-versity and demographic history. Here we describe thediversity among mtDNA sequences of Indian individualsfrom three groups living in coastal southwestern India.Tree analyses and distributions of pairwise nucleotide
Received September 21, 1994; accepted for publication December30, 1994.
Current address and address for correspondence and reprints: Dr.Joanna L. Mountain, Department of Integrative Biology, Universityof California, Berkeley, VLSB Room 4151, Berkeley, CA 94720-3140.E-mail: [email protected]© 1995 by The American Society of Human Genetics. All rights reserved.0002-9297/95/5604-0020$02.00
differences enabled us to infer demographic histories ofthese groups. In addition, by comparing these sequencesto those of other world populations we inferred the de-mographic history of these populations within thebroader context of human evolutionary history.
Indian society has traditionally been divided intocastes, tribal groups, and religious communities. Withinthe hierarchical Hindu caste system, each caste belongsto one of five varnas (in order of decreasing status: Brah-min, Kshatriya, Vaishya, Sudra, and Pancham) (Malho-tra 1984). An essentially endogamous varna consists ofseveral endogamous caste clusters, which, in turn, in-clude several endogamous castes (Malhotra 1984).Thousands of such castes exist today. Hundreds of en-dogamous tribal groups also exist. Members of tribalgroups of continental India (excluding the northeastMongoloid groups) tend to be of short stature, withcurly hair and dark pigmentation relative to other In-dians.
Previous studies of such classical genetic markers asblood groups indicated that Brahmin groups do not as-sociate with one another in inferred trees. Nor do theBrahmin groups consistently associate, in inferred trees,with other caste groups of their region (Karve and Mal-hotra 1968). Previous studies also revealed that tribalpopulations are genetically more similar to each otherthan to other nontribal Indians, but more similar tothe nontribal Indians than to morphologically similarpopulations in Africa and Australia (Roychoudhury1984). Geographic maps of single alleles for India areunique in that the high degree of microgeographic varia-tion makes the fit of allele-frequency surfaces unusuallydifficult (Piazza et al. 1981). Cavalli-Sforza et al. (1994)suggest that the widespread net of tribal groups, alongwith the caste system, creates a multitude of endoga-mous pockets, leading to this unique pattern.The three Indian groups examined in this study were
(1) the Havik, members of a Brahmin caste from villageswithin the talukas (administrative regions) of Sirsi, Sidda-pur, Yellapur, Honnavar, and Kumta, in northwest Karna-taka; (2) the Mukri, members of a scheduled caste fromseveral villages within Kumta taluka in northwest Karna-taka; and (3) the Kadar, members of a tribal group fromthe Anapandam settlement of Kadar at Chalkudi range inthe Trissur District of Kerala (fig. 1). One additional Havikindividual was from Kasargod in the state of Kerala.
979
Am. J. Hum. Genet. 56:979-992, 1995
Figure I Map of southwestern India, indicating locationswhere samples from three endogamous castes were collected. Num-bered locations are talukas (administrative units generally covering-1,000 km2 and including 20-40 villages): 1, Yellapur; 2, Sirsi; 3,Kumta; 4, Siddapur; 5, Honnavar; and 6, Anapandam (Trissur). Tradi-tionally, villages include families belonging to several different caste
groups.
Karnataka is among a small group of Indian states/territories with a large number of culturally diverse com-munities, possibly harboring caste populations with con-
siderable caste-based occupational specialization andmore rigid cultural practices than in other regions ofIndia (Joshi et al. 1993). The coastal and hill region ofthe state of Karnataka considered here was among thelast areas to be brought under settled cultivation. Whileagriculture and animal husbandry reached India pos-
sibly as early as 8,000 years before the present,these practices reached coastal Karnataka only -3,000years ago.
The Havik are among the Brahmin endogamous castegroups, which have the highest status in the caste system.They are thought to have immigrated 1,300 years ago
to the 20,000 km2 area where they are now concen-
trated. Today the group includes 100,000 individualswho are predominantly specialized cultivators of betelnuts and spices; priests; and white-collar workers. TheHavik depend very little on hunting and gathering andare the only endogamous caste group in the area withaccess to advanced horticultural techniques.The Mukri are members of a scheduled caste. Individ-
uals belonging to such castes, ranked at the lowest levelin the caste hierarchy, were previously known as "un-touchables." The Mukri consist of 8,000-10,000 indi-viduals who survive through hunting, gathering, fishing,or other unskilled labor in a 2,000 km2 area. They haveprovided unskilled labor in the agrarian society for thepast 2,500 years and have only recently begun to prac-tice agriculture. The Mukri depend on hunting and gath-
ering to a greater extent than any other endogamousgroup in the region and may have done so for a longtime; they have no oral tradition of migration and wereprobably the local hunter-gatherers when the Havik im-migrated to this area (Gadgil and Iyer 1989; Gadgil andGuha 1993).The Kadar are a group of hunter-gatherers living in
a mountainous region of the district of Kerala. They aremembers of a tribal group, separate from the Hinducaste system. Elsewhere when the Kadar were comparedto other Indian populations through tree inference fromclassical genetic markers, they appeared as the extremeoutlier (Cavalli-Sforza et al. 1994). In the present study,very few individuals (seven) were typed; while their se-quences are provided, few conclusions regarding the Ka-dar population can be drawn.Two segments of the highly variable "D"-loop region
of the mtDNA genome were sequenced. Human mtDNAis maternally inherited (Giles et al. 1980), although thereare indications of a minor paternal contribution in otherorganisms (Gyllensten et al. 1991; Hoeh et al. 1991).This 16.5-kb circular molecule is present in much highercopy number (Robin and Wong 1988) and mutates ata higher rate (Wilson et al. 1985) than nuclear DNA.The rate of nucleotide substitution per site per year fornuclear DNA is estimated to average 4.7 x 10⁻⁹ (Nei1987, p. 147). This corresponds to a rate of _10-7substitutions per site per generation, assuming a genera-tion length of 20 years for humans. The substitutionrate for mtDNA is estimated to be -10 times higherthan for nuclear DNA, on the order of 10-6 (Brown etal. 1979). The D-loop region contains sites that regulatemtDNA replication and transcription. Two portions ofthis region are particularly variable and have thereforebeen denoted the "hypervariable" regions. The mutationrate in these regions appears to be highly variable acrosssites (Aquadro and Greenberg 1983; Wakeley 1993).The average rate may be an order of magnitude higherthan for other regions of the mitochondrial genome.We have considered only individuals for which these
two hypervariable segments of the control region havebeen sequenced, thereby maximizing the number of sitesfor all comparisons. While similar analyses have beencarried out on more individuals sequenced for only onesegment, consideration of both segments should lead tomore robust results in both tree inference and pairwise-difference distribution comparisons.
Subjects, Material, and Methods
Sample CollectionThe locations of talukas (generally including 20-40
villages) where samples were collected are indicated onthe map (fig. 1). Because the Mukri reside primarily inKumta taluka, all Mukri samples were obtained fromthis region. The Havik reside in a broader geographic
980

Mountain et al.: Indian mtDNA-Sequence Diversity
region, and samples were obtained from an area includ-ing five talukas. All individuals sampled are believed tobe maternally unrelated for -2 previous generations.Field sampling was performed as follows: sterile, flattoothpicks (usually 6) were used to scrape the buccalcheek area and tongue. Rigorous controls were per-formed to ensure that the sampling materials were freeof any contamination. The scraped cells were insertedinto a sterile tube containing 0.6 ml "PCR buffer + non-ionic detergents" (Higuchi 1989) + 1% (w/v) sodiumazide.
Scalp hairs were plucked using a new pair of rubbergloves for each person sampled. They were stored dryin sterile Eppendorf tubes. In the lab the hairs wererinsed with sterile, distilled water and stored in 100%ethanol. The portion of the hair that was touched duringsampling was removed by burning.mtDNA from each of the six individuals who were
involved in the sample collection or PCR amplificationwas sequenced as a control against undetected contami-nation. Each of these sequences was determined to bedifferent from any of the Havik, Mukri, and Kadarsequences.
Amplification and PurificationTo extract DNA, buccal cells were digested with pro-
teinase K (Boehringer-Mannheim) as follows: 3 pl of a10 mg/ml (aqueous) solution of proteinase K was addedper 100 gl of sample. The sample was heated at 550Cfor 1 h, and then the proteinase K was inactivated byheat treatment for 10 min at 950C. Either 4 pl or 20 julof extract was used in a 100-jl PCR reaction. The rootportions of 1-3 hairs of a single individual were airdried and snipped into 0.5 ml "PCR Buffer + non-ionicdetergent." Proteinase K digestion was performed as de-scribed. Fifty microliters of the hair root extract wasused in a 100-pl PCR reaction.
Amplifications were carried out using a Perkin-Elmer-Cetus DNA Thermal Cycler. Each reaction contained20 mM Tris pH 8.3, 1.5 mM MgCl2, 25 mM KCl,0.05% Tween-20, 0.2 jiM each primer, 50 pM eachdNTP, 100 pug/ml nuclease-free acetylated BSA (Pro-mega or New England BioLabs), and 2.5 U Taq poly-merase (Perkin-Elmer-Cetus). Segment I (404 bp exclud-ing primers) was amplified with L15996 (5'-CTCCA-CCATTAGCACCCAAAGC-3') and H16401 (5'-TGAT-TI-CACGGAGGATGGTG-3'). Segment II (378bp excluding primers) was amplified with L29 (5'-GGT-CTATCACCCTATTAACCAC-3') and H408 (5'-CT-GTTAAAAGTGCATACCGCCA-3'). The numbers in-dicate the 3' base according to the referehce sequence(Anderson et al. 1981), and the L and H refer to "light"and "heavy" strands, respectively. A negative controlwas included with each amplification.The thermal regimen consisted of 30 cycles of dena-
turation at 94°C for 45 s, 56°C for 1 min, and 74°C for
1 min, followed by a final 7 min extension at 72°C. Thisgenerally resulted in a single product for segment II butoften resulted in multiple fragments for segment I. Con-sequently, segment I products had to be purified on alow-melting-point agarose gel as described below. Sub-sequently, amplification conditions were optimized, re-sulting in a single specific segment I product. This wasachieved by increasing the annealing temperature to66°C and using a "hot start" method (D'Aquila et al.1991) in which all reagents except for Taq polymerasewere preheated prior to the addition of polymerase.
There appeared to be an inhibitor of Taq polymerasepresent in some of the buccal mucosa samples. The useof a 4 p1 instead of a 20 gl sample often led to successfulamplification. In other cases, however, it was necessaryto extract the total DNA from these samples before anyamplification could be achieved. This was performed asfollows: the sample was extracted with an equivalentvolume of equilibrated phenol. The aqueous layer wasremoved, and the phenol was back-extracted with TEbuffer (10 mM Tris pH 8.0 and 1 mM EDTA). The twoaqueous layers were pooled and extracted once withphenol:chloroform:iso-amyl alcohol (50:48:2). Theaqueous layer from this was removed and extracted oncewith chloroform:iso-amyl alcohol (24:1). Finally, theDNA was ethanol-precipitated from the aqueous layerand was resuspended in 20 gl TE. A negative controlwas carried through this procedure each time it wasperformed.
After amplification 10 ,ul of each product was runon a minigel (2% agarose) to determine amplificationsuccess, by using a 123-bp ladder (Gibco-BRL) as amarker. When a single band of appropriate size wasdetected, the product was purified using either a Phar-macia Miniprep Spun Column (Sephacryl S-400) or aPromega Magic PCR prep kit. When the amplificationcontained secondary bands the reaction was loaded ontoa 2% low-melting-point agarose gel. The desired bandwas excised and melted, and the DNA was then purifiedusing a Promega Magic PCR prep kit.
SequencingDouble-stranded sequencing of the purified PCR
product was performed using either conventional meth-ods or fluorescent dye labeling and an Applied Biosys-tems 373A DNA sequencer. For conventional sequenc-ing, Sequenase Version 2.0 (U.S. Biochemical) was usedwith 2-deoxyadenosine 5'-(a-(35s) thio) triphosphate(Amersham). Denaturation of the PCR product wasachieved by boiling the template plus sequencing primerin annealing buffer, followed by immersion in a dry-ice/ethanol bath. Products were electrophoresed through6% polyacrylamide, 7 M urea on a Biorad SequigenApparatus for 2.5 or 5 h; then the gel was dried andexposed to Kodak XAR-5 film. For ABI 373A analyzedsequences, DyeDeoxy terminator cycle sequencing was
981
Am. J. Hum. Genet. 56:979-992, 1995
done using a Perkin-Elmer-Cetus 9600 GeneAmpPCR System, following recommended sequencing kitprotocols.
In general, segment II was sequenced with conven-tional methods, although many of these sequences wererepeated on an ABI 373A, and segment I was sequencedusing the automated sequencer. Each segment was se-quenced in both directions by using the amplificationprimers as sequencing primers. For segment I, it wassometimes necessary to do an additional sequencing re-action with a third, internal primer, L16209 (5'-CCCCATGCTTACAAGCAAGT-3'). When base posi-tion 16189 was a C rather than a T, the sequence qualitybeyond this region was ambiguous on both strands. Useof L16209, which anneals just beyond this region,made determination of a complete composite sequencepossible.
Sequence AnalysesSequences were aligned using CLUSTAL V (Higgins
and Sharp 1988) and by hand. Distances between se-quences were estimated with DNADIST of the PHYLIPsoftware package (Felsenstein 1989) using Kimura'stwo-parameter model, with transitions assumed to occurat 10 times the rate of transversions (Kimura 1980).Phylogenetic analyses were carried out using NEIGH-BOR; in some cases, in particular for trees relating hun-dreds of sequences, branch lengths were inferred to beof negative length. These were all relatively small inmagnitude, however, and were therefore represented bybranches of length zero. Trees were compared usingTempleton's Delta Q test, in the PHYLIP software pack-age. Trees were drawn using the DRAWTREE andDRAWGRAM programs; bootstrap data sets were ob-tained using SEQBOOT; and consensus trees were ob-tained using the CONSENSE program provided withthe PHYLIP software package (Felsenstein 1989).The time and extent of ancient demographic expan-
sions can be inferred from distributions of pairwise nu-cleotide differences, or mismatch distributions, if the dis-tributions are smooth and nearly Poisson (Slatkin andHudson 1991; Rogers and Harpending 1992; Rogers,in press). Slatkin and Hudson consider an exponentiallygrowing population in which the product of the currentpopulation size and the growth rate is substantiallylarger than 1. They assume that exponential growthfrom population size N1 to size No has taken place at arate, r, over a number of generations, t. In this case thedistribution of pairwise differences is expected to beapproximately Poisson. They demonstrate that one canestimate r, given the mean number of pairwise differ-ences between sequences, and assuming that No and m,the mutation rate per site per generation, are known. Ifit is assumed that m is known, one can also estimate t:t = il(2m), where i is the mean number of pairwisedifferences per site.
Rogers and Harpending (1992) use either two or threeparameters to characterize the expansion of a popula-tion, given a pairwise-difference distribution. They con-sider a model of sudden expansion: at t = 0 a populationgrows suddenly from effective female population sizeNo to female population size N1 and is observed t genera-tions later. Rogers (in press) gives a method for estimat-ing 00 = 2gNo and X = 2it, from two moments, and 0O= 2jNo, 01 = 2gN1 and X = 2jut, from three momentsof the pairwise-difference distribution (a is the mutationrate). We considered mutation rates of 10-5_10-6 persite per generation. While estimates of mutation ratesfor the mtDNA D-loop are very rough, this range maynot be unrealistic (Nei 1987, p. 147). Demographicexpansion parameters were estimated from pairwise-dif-ference distributions using either MATHEMATICA(Wolfram 1988) or a computer program provided byAlan Rogers. Estimates of the unevenness, or "ragged-ness," of mismatch distributions were obtained usingthe approach of Harpending et al. (1993).
Results
Sequence Variability among IndiansSequences for both variable segments were obtained
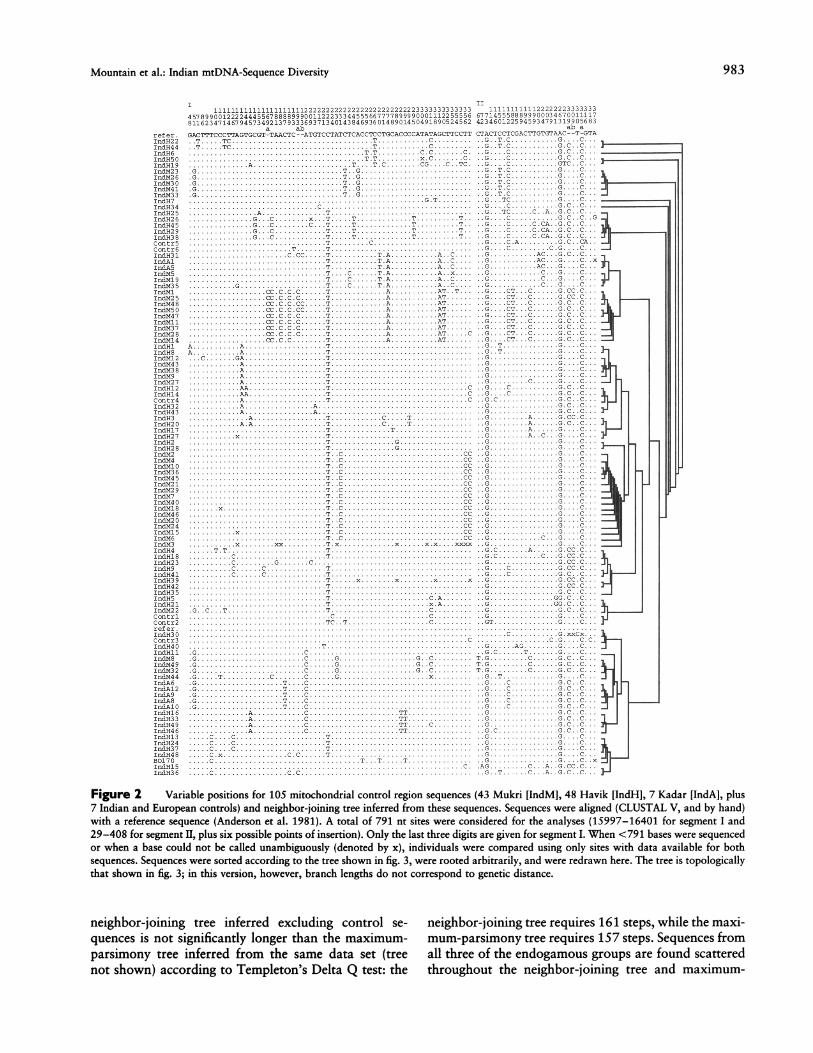
for 43 individuals of the Mukri population, 48 individu-als of the Havik population, 7 individuals of the Kadarpopulation, and 7 Indian and European controls (fig. 2).Among the 791 sites, 86 were found to be polymorphicwithin this sample of 98 individuals (excluding con-trols). Of the variable sites, 62 are in segment I and 24are in segment II. Transitions alone were observed at 73sites; the incidence of pyrimidine transitions was roughlytwice that of purine transitions (C+OT: 50 vs. AGOG: 23).Transversions alone were observed at six sites (AC*T: 3;CO-G: 1; and AR-C: 2). At one position both transitionsand transversions were observed. Insertion/deletionevents were observed at six sites.The proportion of distinct sequences differed among
the three groups of Indians. Eighteen distinct sequenceswere detected among the 43 samples from Mukri Indi-ans, 37 distinct sequences were detected among the 48Havik samples, and 2 distinct sequences were detectedamong the 7 Kadar samples. Virtual heterozygosity, orhaplotype diversity (Hartl and Clark 1989), was highestfor the Havik (.97), less high for the Mukri (.86), andlowest for the Kadar (.41). The value for three groupscombined was .96. These values were reflected in theinferred trees, discussed below.
Tree InferenceIn order to further understand the history of these
Indian lineages, we inferred trees according to the neigh-bor-joining algorithm (Saitou and Nei 1987). The treerelating sequences of 106 individuals (Havik, Kadar,Mukri, controls, plus reference) is given in figure 3. A
982
Mountain et al.: Indian mtDNA-Sequence Diversity 983
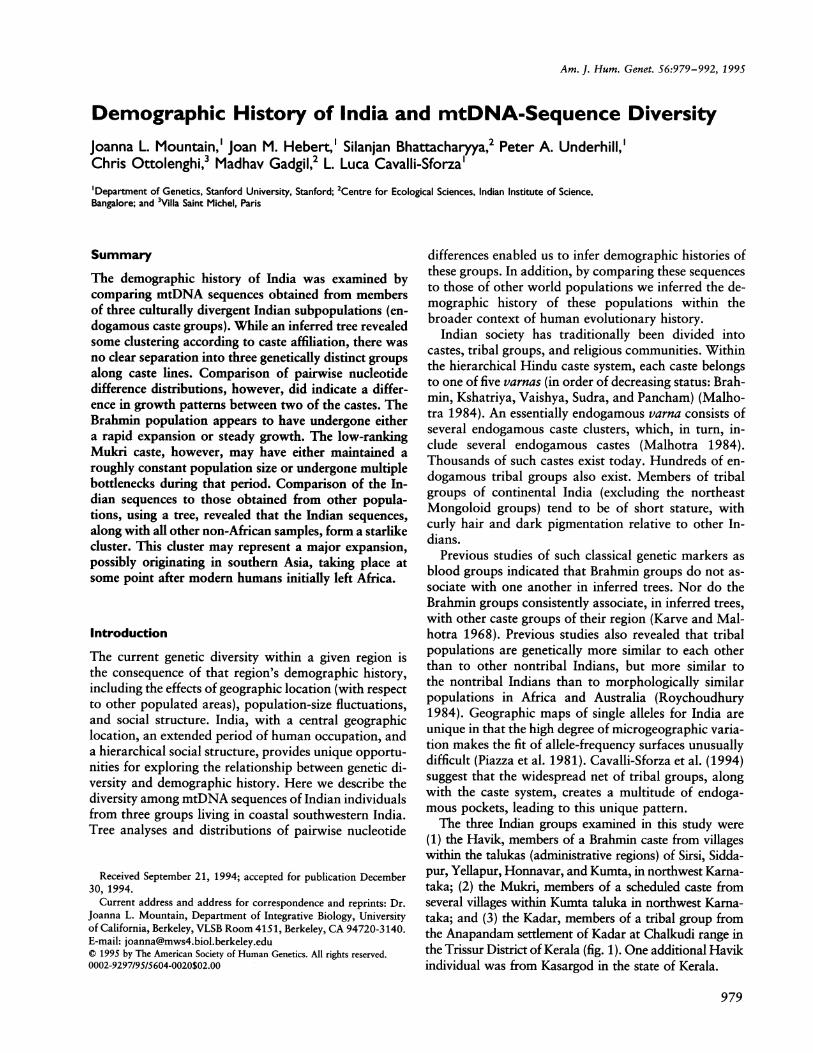
I 111111111111121111211222222222222222222222222223333333333333 XX11111111111222222233333334578990012222444556788851999001122233344555667777S99990001112255556 677145558889990003467001111781162347146794573492137933369371340143146936014B901450491890524562 4234601225945934791319905683
a abWrotor.a6WECCJWBW-YA&Ot--ATQTCTACTCACCICCYBCACCCATATAGCrfCCTT CACCVAtfAC--T-6TA110122 - .T ...TV-.T.......C..B... . ..0.B.....C..X10644 ..TT...T .0..B........C.C........11016 ....................2...T. 0....0..C ....C. ..G. . . . ......laSS ......................T.TT...... iC.. 0..C ...B. C..B.....C.C0...IndH1t ........A.............T....T.C.....CG....C. .TC. ..G.... C ... TC...( .C...zn=13 .g...............2...TG.6..... .B..........T.C .6.........0..110626 .6 ...............2...TQ....... .B.........2...C ........._110130 G.6.......2T. .6........6..... . .2.0. 6... .......a..C.i10141 06..T...... .......... . B..T.C.......a.... C....1:633 a...............6..6T ..... .B.,.2.0.B...;.. ....C...21017 ............... .........0.2.....T.2.B....0... C0..210134................C................ a....C.B.......C..C... .
25R25 .........A.........T.................. B.G..TC...C..A..B.C..C...153N26 ..6......G.C ......x...T...T.........T.....T.. ..6....C.......G.C..0..B153H45............C.....C...T.2..........T......T.. .B.. . .A...C.15329 .B.......G...C.......T. .T ........T......T.. ..B...C.0.O..CA..6.C..O...:15d338.........B...C .......2...T........T......T.. .4.G0.. ...C.OA..O.C..C...CantrS .................2..... C ........ .G.... C.A .B.....C. .C1..CcrntrG .............. ... ..........6...G..C.C.0..6.. ... C0...15331....... C.CC.2..T......T.A.......A.C....0......B. AC .6.0.0....IS ....... .T.A......A..C0..B..G......A.. ..CMI ...... .A...S:::::.T.......TA.A......A.C.. B.AC..... 6...AC.Q..C...1:065 .................T....C....T.A.......A..x.. B..G...... .- ..C.15319 .................T....C...2.TA.......A..C.. B..G...... ....C.110135. B......G..........T....C....T.A.......A..C.. B..a.......C. ..C.1161 .......... CC.C.0.C..2..........A.......AT. .T.. B.G.....CT ...C.B...CC.C..x10125 ..........OC.C.C.C......T.......A. ....AT...B..G.....CT....C.B...CC.C.153U48........C... .C.C.CC.2.........A.::....AT..B...;.....CT....C.B...(.C..Cc.-..110650.......... 0C.C.C.C0. 2.. .......A.......AT..B........ C.0.. .C.B...C. .C...11067......... 0.0.0W.0.....T........A.......AT..B..-0.....CT....C.B...C. .C...110111 .........0CO.C.C.C....T........A.......AT..B... ....CT ...C.B.. .C. .C...x1017.......... CC.C.C.C....T........A.......AT..B.... ... .CT. ..C.B....C. .C...110128...........C.C.C.C....T........A.......AT...C ..GB....CT...C.B....C..C...10124.......... C.C'.C....2..........A. AT..... ..B.... CT. ..C.B...C. .C...11011 A.......A..........T................ ..T . .6.......G...C.11018 A.......A...........T................ . B..?..T....... ..C.110612 . ..C....BOA...........T. .B............... ...G........G...C.11063. A......&..........T. .B................B. ........ ... .C...110138 .......a..........T.............BG......... ..C.11019 .......A..........T.......... .B.B. ........ ... .C...11627.......A..........T.................B..a.....C.B....G..C...1:0612 ..... L.. ..........T................C .. 0.....C..B.....C. .C...110114....... A&..........T................C .......CBC.C.Ccanr4 .......A...........T................C . .B.C....... B..0..C...11012 .......A...........................B.B........ .C. .C...110143 .......a...........................6..B........ .C..C...11013........A............T......C....T..B..G......A....C.C.W.110120 .......A.A......... .. T.......C....T. .B..::: G......A....G.C..C...110117.................T.......T ........2: ,G....B. .. ...C.110127.......x...........2................. . B..G.....AC.G.....11012 B................T....... ..... ... . B.B........a.... C....11012 .................T........B........ . B.6........G....C..:UA1 ...........12.....T. ................LC .G..........C..B .11014 . . . .. . . . . . . . .. .T . . . .. . . . . . . . .. . .c . .. . . . . . . .... C....11X30116 ...............T. .............. ...C ..B ........G....C...110136 ................ .0T .............. c.a..........C....110145 ................. 0T. .............. CT.a........C..B .110121 .................T.C.C.............. c-0..........C....110629................. T.C .CC.......... ..cc..a........ .
11067 ................2..T- ...........0:..c..6 .........G.:c:110140................2.0.0T ..............Cc..B ....B.....0....C...110618 .....X............TC..............0C..BM...........G..C..110146 ..2....0...Cc..G6......... ..C.11012....C................ ..C.10124 .................T . ................CC ..a6......... ..C .
zsma.......s...........c.CC- ...............M..GB......... ..C-1116 .................T.C.C...............cc..G6.....C...6....C---£13M6.......X.....M....a...x.at.. .30 --ac.6...B...C.1164 ..2...2T............T..:.....BQ.C.....A.B...CC.C..210615......C..B..........r........52......C.C.6G.CC.C...110623. C... 6......G... C.................... .a......0. .CC..C..X1dH9 ......C....C........T....B......... G....C.B....C......c::110141 ......C....C........T.............B:::::....C. B.C.....X11019 ................. .. tX.... ..a. a... .... .. ..6 . ..B.....CC.C...110142 B................T................ .6. ........ .CC.C...11015 B................T................ .B. ........ .C..C...11015 .................T.............C.A...BB..G ........C..C...11012 ..................r........... A .... . .......6. BB.0C..C...11012 G6..C...T ............T............C. .6.B......C..C...Csntrl..................C............C.::::'.6.G....: ......C:Ccntr2..........C........W.?.CT...........W........0...BC.? .refer .................................................110 .......................................... C......GaXCac.X. .Contr3 ....... ..C..........CO0... C.0C.0110140 .2. .. .. .. .-. .. .. .. ... .. K....... ..AG.B........C....110111 G.6............C...................... G.C....T.B....... C...5318 G.6.............- C.... .B......... ..C.....TG.....C.. B..C..£...
110149 .6 .............C.. B.B.. .0.........G ..... T.B......C.B...C..C...110132 .6 .............C..B.B.G..........G.0...... TB.C0...B....110644 Q.6. ....... C .... C..B...a............x.... B.. ?.T....... ..C.3A6 G.6...........T.. .. .......... .B.......... .G.... .0.B.....C..C...
25112 .6 ...........T.. .. .......... .B.......... .G....C. BG.C..C...SA9 a.0...........T.. ..C......... .B........... ;....C.B:::::..C..C...
TXAS8 .6...........2....C......... .6........... ..... .0......B.C. .0...I=MlO .6 ...........T..C...0 ...... .B.......... .G.... .0.B.....C..C...151116 ........A.......C.............M........ . B.B........ .C..C...251133 ........A.......C....... .........B.B .........C..C...210149 ........A.C.........C....B.B.........C..C...I10146 ........A.......C ............ .......... BG.C .B.......C..C...210113. C...c.c.C...........T.................. .B. ........0....C..153H24...C.....0...........T. .B............... .B. ........... -C-.21137 ... C.... C.0...........T. .B .B..................00..........G.C.253H48.. C.x.........C.C...T........ ........B............ .G.0..C..36170....C..................2..T.?. 2T........ . B..;........ ..C.210115..................................C.AG.....C.. A..B.M.C...21036... C........ 0..0C.......... .B.............G.T....C....A.B.C. .0...
Figure 2 Variable positions for 105 mitochondrial control region sequences (43 Mukri [IndM], 48 Havik [IndH], 7 Kadar [IndA], plus7 Indian and European controls) and neighbor-joining tree inferred from these sequences. Sequences were aligned (CLUSTAL V, and by hand)with a reference sequence (Anderson et al. 1981). A total of 791 nt sites were considered for the analyses (15997-16401 for segment I and29-408 for segment II, plus six possible points of insertion). Only the last three digits are given for segment I. When <791 bases were sequencedor when a base could not be called unambiguously (denoted by x), individuals were compared using only sites with data available for bothsequences. Sequences were sorted according to the tree shown in fig. 3, were rooted arbitrarily, and were redrawn here. The tree is topologicallythat shown in fig. 3; in this version, however, branch lengths do not correspond to genetic distance.
neighbor-joining tree inferred excluding control se- neighbor-joining tree requires 161 steps, while the maxi-quences is not significantly longer than the maximum- mum-parsimony tree requires 157 steps. Sequences fromparsimony tree inferred from the same data set (tree all three of the endogamous groups are found scatterednot shown) according to Templeton's Delta Q test: the throughout the neighbor-joining tree and maximum-
Am. J. Hum. Genet. 56:979-992, 1995
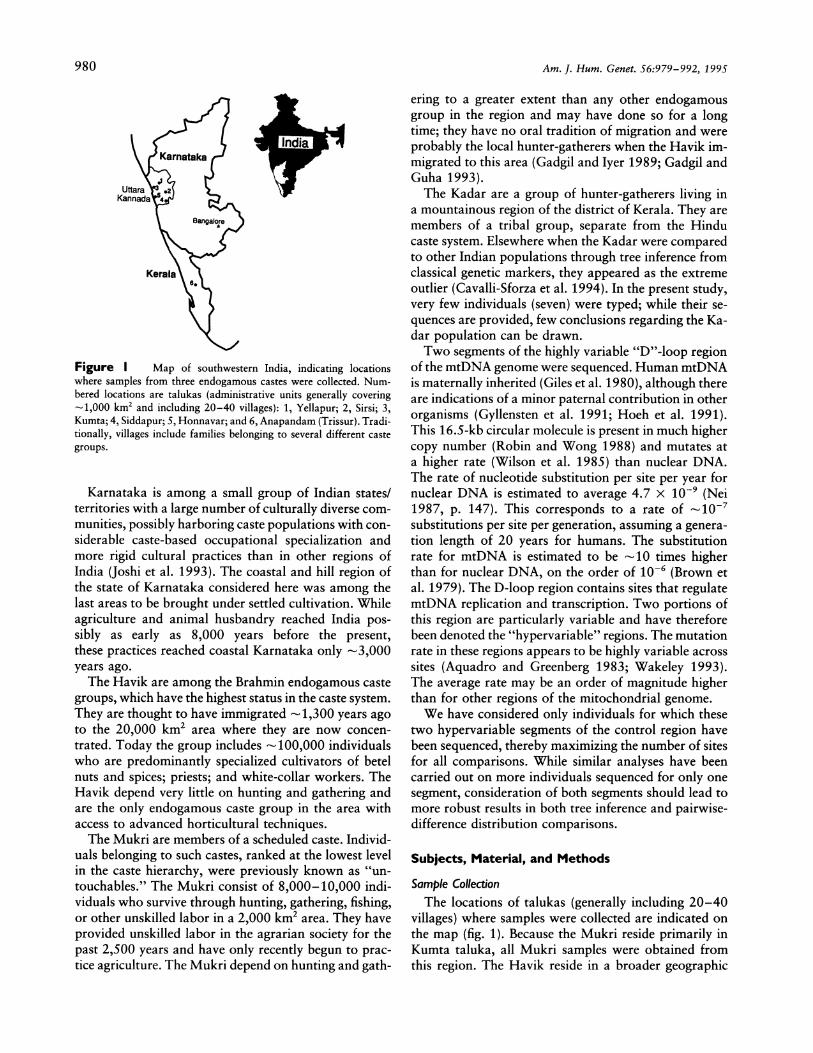
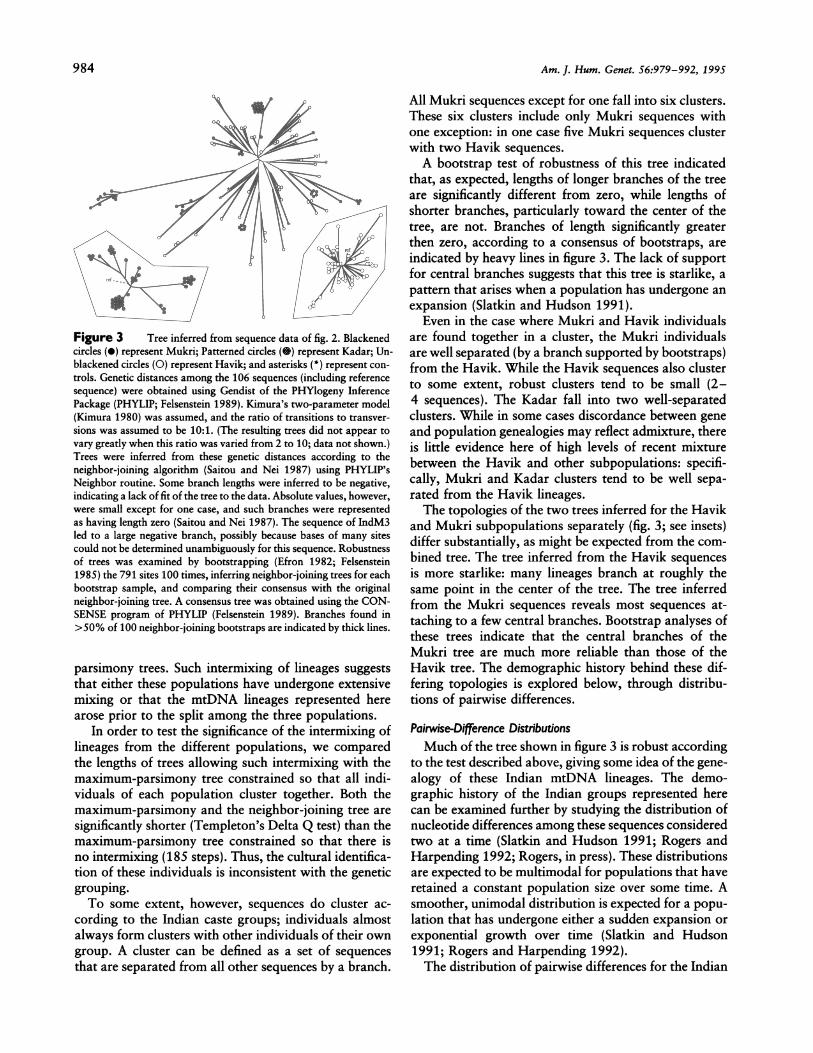
Figure 3 Tree inferred from sequence data of fig. 2. Blackenedcircles (0) represent Mukri; Patterned circles (0) represent Kadar; Un-blackened circles (0) represent Havik; and asterisks (*) represent con-
trols. Genetic distances among the 106 sequences (including referencesequence) were obtained using Gendist of the PHYlogeny InferencePackage (PHYLIP; Felsenstein 1989). Kimura's two-parameter model(Kimura 1980) was assumed, and the ratio of transitions to transver-
sions was assumed to be 10:1. (The resulting trees did not appear to
vary greatly when this ratio was varied from 2 to 10; data not shown.)Trees were inferred from these genetic distances according to theneighbor-joining algorithm (Saitou and Nei 1987) using PHYLIP'sNeighbor routine. Some branch lengths were inferred to be negative,indicating a lack of fit of the tree to the data. Absolute values, however,were small except for one case, and such branches were representedas having length zero (Saitou and Nei 1987). The sequence of IndM3led to a large negative branch, possibly because bases of many sitescould not be determined unambiguously for this sequence. Robustnessof trees was examined by bootstrapping (Efron 1982; Felsenstein1985) the 791 sites 100 times, inferring neighbor-joining trees for eachbootstrap sample, and comparing their consensus with the originalneighbor-joining tree. A consensus tree was obtained using the CON-SENSE program of PHYLIP (Felsenstein 1989). Branches found in>50% of 100 neighbor-joining bootstraps are indicated by thick lines.
parsimony trees. Such intermixing of lineages suggeststhat either these populations have undergone extensivemixing or that the mtDNA lineages represented herearose prior to the split among the three populations.
In order to test the significance of the intermixing oflineages from the different populations, we comparedthe lengths of trees allowing such intermixing with themaximum-parsimony tree constrained so that all indi-viduals of each population cluster together. Both themaximum-parsimony and the neighbor-joining tree are
significantly shorter (Templeton's Delta Q test) than themaximum-parsimony tree constrained so that there isno intermixing (185 steps). Thus, the cultural identifica-tion of these individuals is inconsistent with the geneticgrouping.To some extent, however, sequences do cluster ac-
cording to the Indian caste groups; individuals almostalways form clusters with other individuals of their owngroup. A cluster can be defined as a set of sequences
that are separated from all other sequences by a branch.
All Mukri sequences except for one fall into six clusters.These six clusters include only Mukri sequences withone exception: in one case five Mukri sequences clusterwith two Havik sequences.A bootstrap test of robustness of this tree indicated
that, as expected, lengths of longer branches of the treeare significantly different from zero, while lengths ofshorter branches, particularly toward the center of thetree, are not. Branches of length significantly greaterthen zero, according to a consensus of bootstraps, areindicated by heavy lines in figure 3. The lack of supportfor central branches suggests that this tree is starlike, apattern that arises when a population has undergone anexpansion (Slatkin and Hudson 1991).Even in the case where Mukri and Havik individuals
are found together in a cluster, the Mukri individualsare well separated (by a branch supported by bootstraps)from the Havik. While the Havik sequences also clusterto some extent, robust clusters tend to be small (2-4 sequences). The Kadar fall into two well-separatedclusters. While in some cases discordance between geneand population genealogies may reflect admixture, thereis little evidence here of high levels of recent mixturebetween the Havik and other subpopulations: specifi-cally, Mukri and Kadar clusters tend to be well sepa-rated from the Havik lineages.The topologies of the two trees inferred for the Havik
and Mukri subpopulations separately (fig. 3; see insets)differ substantially, as might be expected from the com-bined tree. The tree inferred from the Havik sequencesis more starlike: many lineages branch at roughly thesame point in the center of the tree. The tree inferredfrom the Mukri sequences reveals most sequences at-taching to a few central branches. Bootstrap analyses ofthese trees indicate that the central branches of theMukri tree are much more reliable than those of theHavik tree. The demographic history behind these dif-fering topologies is explored below, through distribu-tions of pairwise differences.
Pairwise-Difference DistributionsMuch of the tree shown in figure 3 is robust according
to the test described above, giving some idea of the gene-alogy of these Indian mtDNA lineages. The demo-graphic history of the Indian groups represented herecan be examined further by studying the distribution ofnucleotide differences among these sequences consideredtwo at a time (Slatkin and Hudson 1991; Rogers andHarpending 1992; Rogers, in press). These distributionsare expected to be multimodal for populations that haveretained a constant population size over some time. Asmoother, unimodal distribution is expected for a popu-lation that has undergone either a sudden expansion orexponential growth over time (Slatkin and Hudson1991; Rogers and Harpending 1992).The distribution of pairwise differences for the Indian
984
Mountain et al.: Indian mtDNA-Sequence Diversity
b300-
250-
200.
150
100
50
00 2 4 6 8 10 12 14 16 18 20
pairwise differences0 2 4 6 8 10 12 14 16 18 20
pairwise differences
d300
250
200
150 -
100
501
0 2 4 6 8 1 12 14 1618 20 0 2 4 6 8 10 12 14 16 18 20
pairwise differences pairwise differences
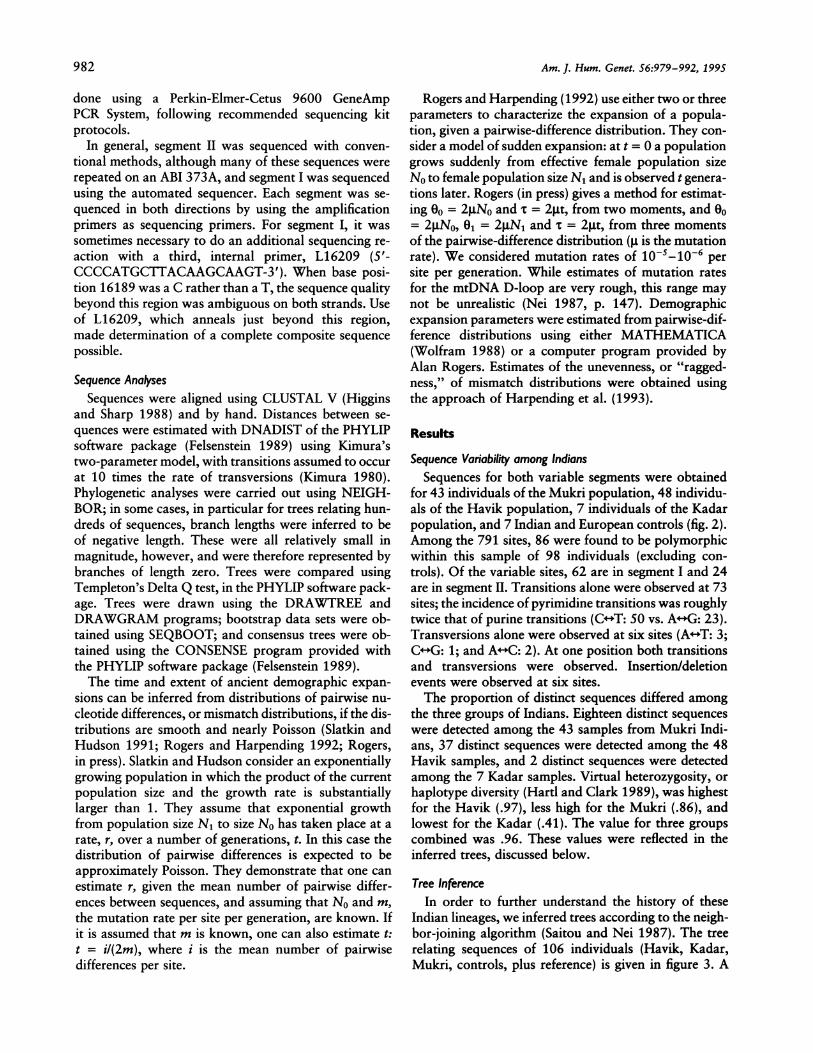
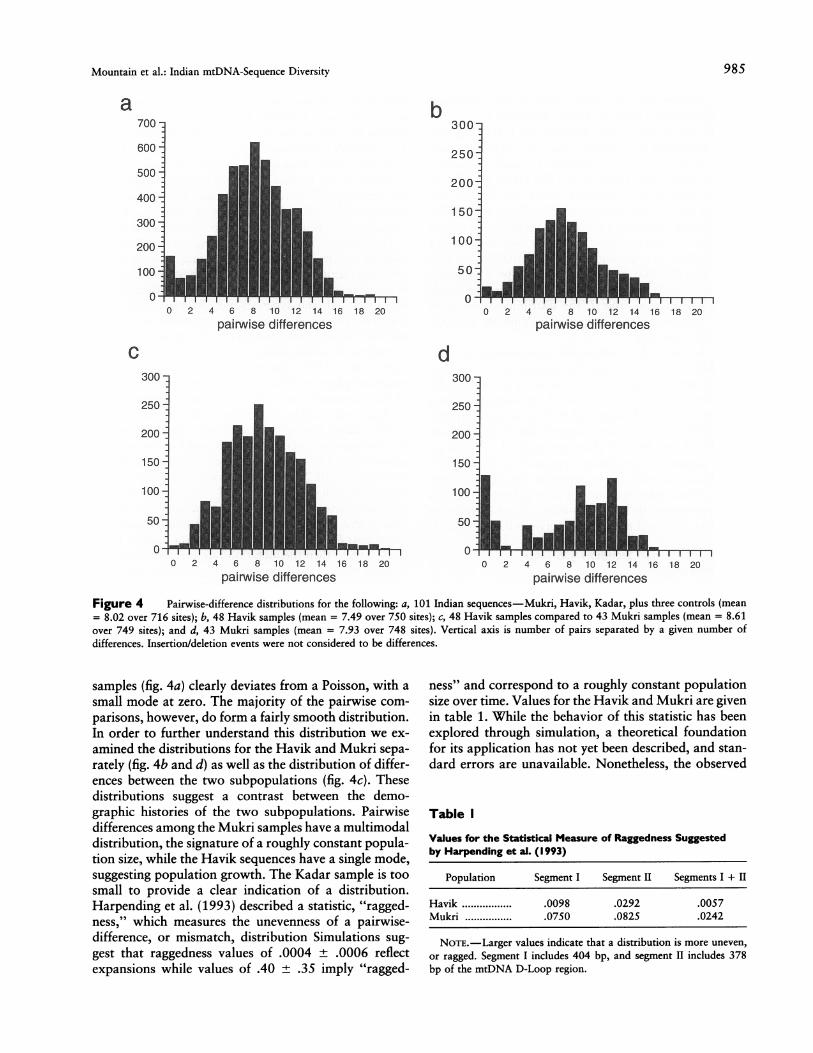
Figure 4 Pairwise-difference distributions for the following: a, 101 Indian sequences-Mukri, Havik, Kadar, plus three controls (mean= 8.02 over 716 sites); b, 48 Havik samples (mean = 7.49 over 750 sites); c, 48 Havik samples compared to 43 Mukri samples (mean = 8.61over 749 sites); and d, 43 Mukri samples (mean = 7.93 over 748 sites). Vertical axis is number of pairs separated by a given number ofdifferences. Insertion/deletion events were not considered to be differences.
samples (fig. 4a) clearly deviates from a Poisson, with a
small mode at zero. The majority of the pairwise com-
parisons, however, do form a fairly smooth distribution.In order to further understand this distribution we ex-
amined the distributions for the Havik and Mukri sepa-rately (fig. 4b and d) as well as the distribution of differ-ences between the two subpopulations (fig. 4c). Thesedistributions suggest a contrast between the demo-graphic histories of the two subpopulations. Pairwisedifferences among the Mukri samples have a multimodaldistribution, the signature of a roughly constant popula-tion size, while the Havik sequences have a single mode,suggesting population growth. The Kadar sample is toosmall to provide a clear indication of a distribution.Harpending et al. (1993) described a statistic, "ragged-ness," which measures the unevenness of a pairwise-difference, or mismatch, distribution Simulations sug-
gest that raggedness values of .0004 + .0006 reflectexpansions while values of .40 .35 imply "ragged-
ness" and correspond to a roughly constant populationsize over time. Values for the Havik and Mukri are givenin table 1. While the behavior of this statistic has beenexplored through simulation, a theoretical foundationfor its application has not yet been described, and stan-dard errors are unavailable. Nonetheless, the observed
Table I
Values for the Statistical Measure of Raggedness Suggestedby Harpending et al. (1993)
Population Segment I Segment II Segments I + II
Havik .. .0098 .0292 .0057Mukri .. .0750 .0825 .0242
NoTE.-Larger values indicate that a distribution is more uneven,or ragged. Segment I includes 404 bp, and segment II includes 378bp of the mtDNA D-Loop region.
a700
600-
500
400
300
200
100
985
_-
Am. J. Hum. Genet. 56:979-992, 1995
values indicate that the Mukri distribution is relativelyragged compared with the Havik distribution.Only one of these Indian samples, the Havik (fig. 4b),
has a unimodal distribution and low raggedness andtherefore appears to have undergone a major expansionwithout subsequent bottlenecks. The Havik data fit thePoisson distribution expected under the Slatkin andHudson model very approximately. Using the Slatkinand Hudson approach and assuming a mutation rate of10-5 per site per generation (across 760 sites) and acurrent effective population size No of 50,000, one esti-mates that the Havik population has grown exponen-tially at a rate r of - 1% or less per generation (table2). As indicated in table 2, the distribution may havearisen because of an expansion beginning 10,000-100,000 years ago.For the Havik distribution, the mean number of pair-
wise differences is 7.48, and the variance is 11.23. Givena third cumulant of 10.96, we estimate 00 to be 1.19,01 to be 60.13, and X to be 6.79, by using the three-parameter approach suggested by Rogers and Harpend-ing (1992). These estimates suggest that 50-fold growthoccurred 9,000-90,000 years ago (table 2). Rogers (inpress) suggests a simulation approach to obtain 95%confidence intervals for a particular set of parametervalues. The confidence interval thus obtained indicatesthat growth may be 30-1,000-fold, that X falls between4.78 and 7.79, and that 00 falls between 0.12 and 2.51.
Comparison of Indian Sequences with Thosefrom Other RegionsThe relationship between Indian mtDNA control re-
gion sequences and those sequences of individuals from
Table 2
Parameter Estimates for Hypothesized Havik Expansion
sea
METHOD PARAMETERb 105 10-6
Slatkin and Hudson f T 9,982 99,823(1991)'..................... r1.16 .00055
Rogers (in press) two f T 7,404 74,043moment ............... No 129 1289
Rogers (in press) three T 9,059 90,586moment ............... No 79 793
L N1 4,008 40,088
NoTE.-An average of 7.49 differences over 750 sites was observed(see fig. 4). The distribution of pairwise differences for the Havik wascharacterized according to methods suggested by Slatkin and Hudson(1991) and by Rogers (in press).
a g = mutation rate per site per generation; 1 generation = 20 years.b T = time, in years; r = growth rate per generation (%); No = initial
effective female population size; and N1 = final population size.c N1 assumed to be 5 X 10⁴.
other world populations was examined by inferring treesand comparing distributions of pairwise differences.Specifically, the Indian sequences were compared to the135 mtDNA types described by Vigilant et al. (1991);from this study, data were available for both variablesegments of the control region. While this sample doesnot represent all world populations, Africa, Asia, andEurope are included. In the following analyses, all indi-viduals were considered regardless of sharing of types.The neighbor-joining tree relating 294 mtDNA se-
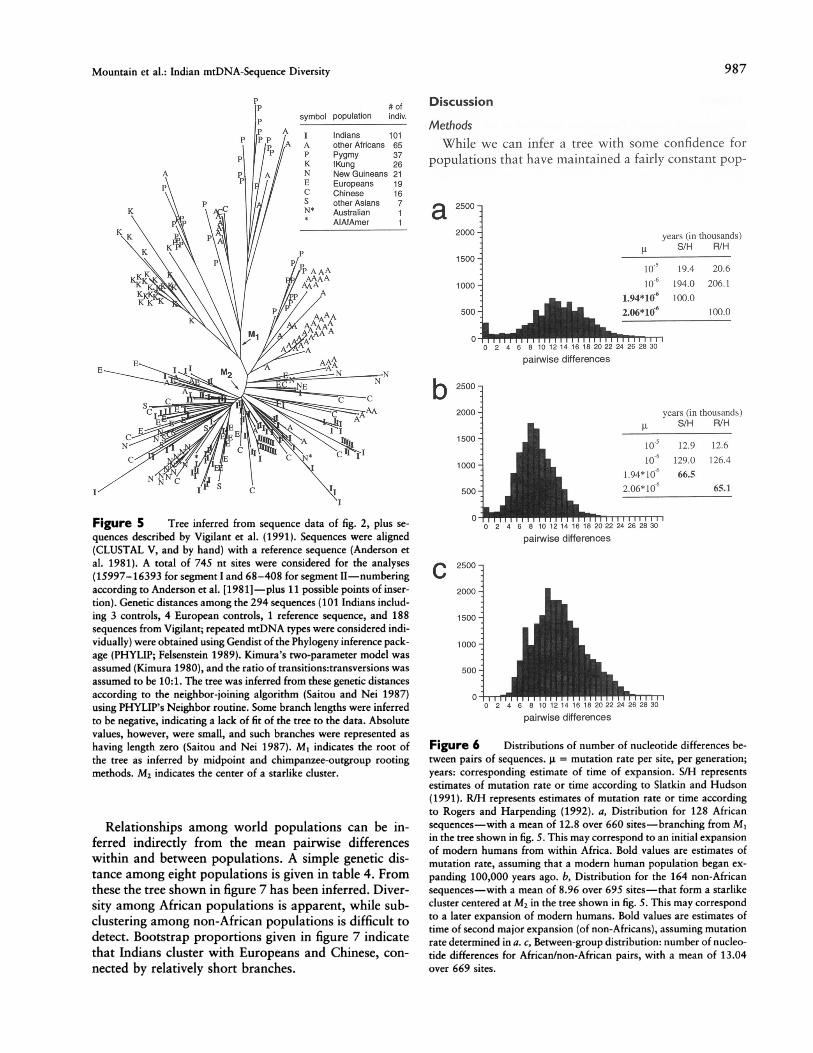
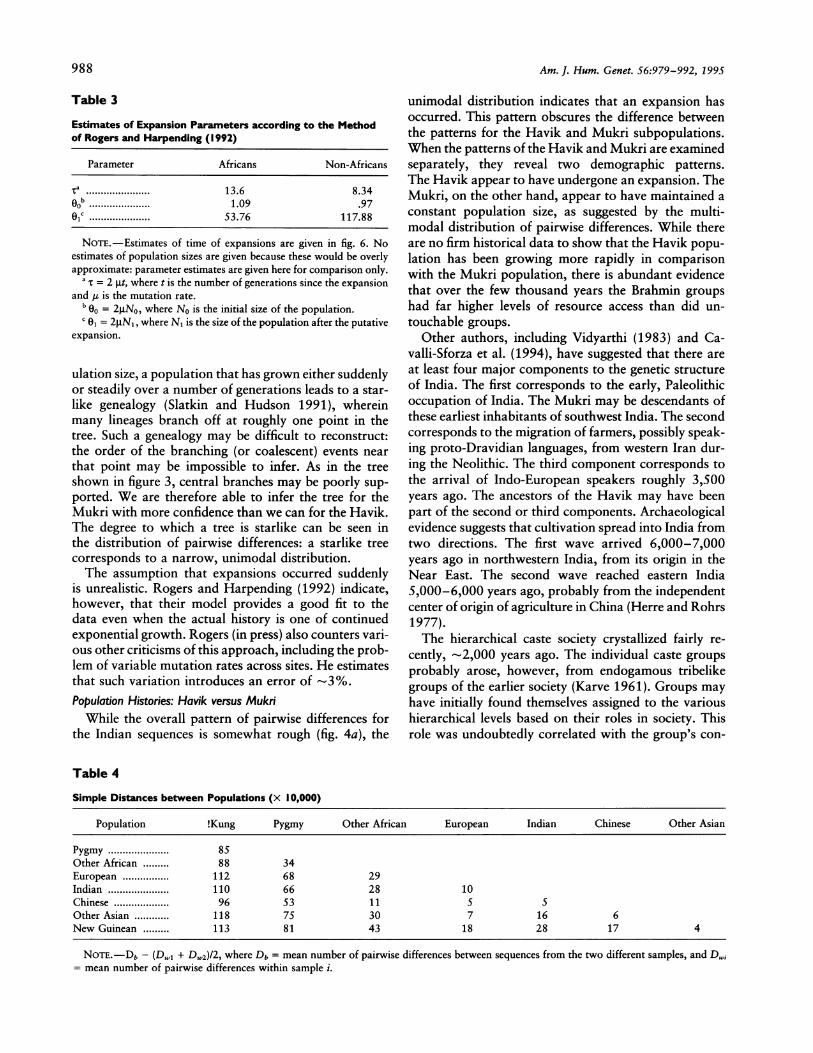
quences is given in figure 5. Two rooting methods (chim-panzee-outgroup and midpoint) suggest that the rootof the tree is at M1, within a cluster including almostexclusively African types: !Kung, Pygmies, and otherAfricans. This result is consistent with those of previousmtDNA studies, in suggesting that the greatest mtDNAdivergence is found among Africans (Cann et al. 1987;Vigilant et al. 1991). Assuming that a population expan-sion took place in Africa, we estimated the parametersof this expansion from the 128 African sequences ac-cording to the method suggested by Slatkin and Hudson(1991). While the pairwise-difference distribution (fig.6a) deviates from a Poisson, the majority of the pairwisecomparisons form a single mode. Assuming mutationrates of g = 10-5-10-6 and 20 years/generation leadsto estimates of 20,000-200,000 years ago, given thatthe mean number of pairwise differences is 12.8 for 660sites. If this expansion took place -100,000 years ago,as suggested by some archaeological data (Brauer 1989;Clark 1989), then the mutation rate for these sites mayaverage -2.0 X 10⁻⁶ per site, per generation (fig. 6a).As shown in the tree, all non-African mtDNA se-
quences (except for two Chinese sequences) along withabout one-third of all African sequences form a single,large starlike cluster, centered at M2. This starlike clustermay indicate that a major population expansion tookplace as or after humans left Africa and began occupyingparts of Eurasia. The distribution of pairwise nucleotidedifferences for the 164 non-African sequences (Indians,Europeans, Asians, New Guineans, and one Australian),comprising most of this starlike cluster, is given in figure6b. Using the approach discussed by Slatkin and Hudson(1991), the time of the putative non-African expansionis estimated to have been between 13,000-130,000years ago, given the mean number of pairwise differ-ences of 8.96 for -695 sites, and assuming g = 10-5-10-6 per site, per generation; 20 years per generation.If we assume a mutation rate of 2.0 x 10⁻⁶, estimatedabove, we estimate that the putative M2, or non-African,expansion took place -65,000 years ago.
Table 3 gives estimates of the 00 and 01 values thatcorrespond to the initial and final population sizes in theRogers and Harpending model. 'While the 00 values arevery similar, the value of 01, corresponding to the popula-tion size after the expansion, for the non-African distribu-tion, is essentially twice that of the African distribution.
986
Mountain et al.: Indian mtDNA-Sequence Diversity
Discussion
MethodsWhile we can infer a tree with some confidence for
populations that have maintained a fairly constant pop-
a 2500-
2000
1500-
1000-
500-
pairwise differences
b
Figure 5 Tree inferred from sequence data of fig. 2, plus se-quences described by Vigilant et al. (1991). Sequences were aligned(CLUSTAL V, and by hand) with a reference sequence (Anderson etal. 1981). A total of 745 nt sites were considered for the analyses(15997-16393 for segment I and 68-408 for segment II-numberingaccording to Anderson et al. [1981] -plus 11 possible points of inser-tion). Genetic distances among the 294 sequences (101 Indians includ-ing 3 controls, 4 European controls, 1 reference sequence, and 188sequences from Vigilant; repeated mtDNA types were considered indi-vidually) were obtained using Gendist of the Phylogeny inference pack-age (PHYLIP; Felsenstein 1989). Kimura's two-parameter model wasassumed (Kimura 1980), and the ratio of transitions:transversions wasassumed to be 10:1. The tree was inferred from these genetic distancesaccording to the neighbor-joining algorithm (Saitou and Nei 1987)using PHYLIP's Neighbor routine. Some branch lengths were inferredto be negative, indicating a lack of fit of the tree to the data. Absolutevalues, however, were small, and such branches were represented ashaving length zero (Saitou and Nei 1987). M, indicates the root ofthe tree as inferred by midpoint and chimpanzee-outgroup rootingmethods. M2 indicates the center of a starlike cluster.
Relationships among world populations can be in-ferred indirectly from the mean pairwise differenceswithin and between populations. A simple genetic dis-tance among eight populations is given in table 4. Fromthese the tree shown in figure 7 has been inferred. Diver-sity among African populations is apparent, while sub-clustering among non-African populations is difficult todetect. Bootstrap proportions given in figure 7 indicatethat Indians cluster with Europeans and Chinese, con-nected by relatively short branches.
2500
2000
1500
1000
500-
paisrwise differences
C 2500
2000
1500
1000
500
0
years (in thousands)S/H P/H
10i5 19.4 20.610 194.0 206.1
L.94*1G' 100.02.06*10 100.0
426 28 30
years (in thousands)
1075 12.9 12.610' 129.0 126.4
1.94*l1e 66.52.06*1(e 65.1
a4 282830
.
wle differlncw
pwaiswle differenoes
rm30
Figure 6 Distributions of number of nucleotide differences be-tween pairs of sequences. j = mutation rate per site, per generation;years: corresponding estimate of time of expansion. S/H representsestimates of mutation rate or time according to Slatkin and Hudson(1991). R/H represents estimates of mutation rate or time accordingto Rogers and Harpending (1992). a, Distribution for 128 Africansequences-with a mean of 12.8 over 660 sites-branching from M1in the tree shown in fig. 5. This may correspond to an initial expansionof modern humans from within Africa. Bold values are estimates ofmutation rate, assuming that a modern human population began ex-panding 100,000 years ago. b, Distribution for the 164 non-Africansequences-with a mean of 8.96 over 695 sites-that form a starlikecluster centered at M2 in the tree shown in fig. 5. This may correspondto a later expansion of modern humans. Bold values are estimates oftime of second major expansion (of non-Africans), assuming mutationrate determined in a. c, Between-group distribution: number of nucleo-tide differences for African/non-African pairs, with a mean of 13.04over 669 sites.
987
0 2
Am. J. Hum. Genet. 56:979-992, 1995
Table 3
Estimates of Expansion Parameters according to the Methodof Rogers and Harpending (1992)
Parameter Africans Non-Africans
,a ...................... 13.6 8.3400 *-----.-.............. 1.09 .9701C ............. 53.76 117.88
NoTE.-Estimates of time of expansions are given in fig. 6. Noestimates of population sizes are given because these would be overlyapproximate: parameter estimates are given here for comparison only.
a X = 2 gt, where t is the number of generations since the expansionand y is the mutation rate.
b 00 = 2No, where No is the initial size of the population.C 01 - 2g1N,, where N, is the size of the population after the putative
expansion.
ulation size, a population that has grown either suddenlyor steadily over a number of generations leads to a star-like genealogy (Slatkin and Hudson 1991), whereinmany lineages branch off at roughly one point in thetree. Such a genealogy may be difficult to reconstruct:the order of the branching (or coalescent) events nearthat point may be impossible to infer. As in the treeshown in figure 3, central branches may be poorly sup-ported. We are therefore able to infer the tree for theMukri with more confidence than we can for the Havik.The degree to which a tree is starlike can be seen inthe distribution of pairwise differences: a starlike treecorresponds to a narrow, unimodal distribution.The assumption that expansions occurred suddenly
is unrealistic. Rogers and Harpending (1992) indicate,however, that their model provides a good fit to thedata even when the actual history is one of continuedexponential growth. Rogers (in press) also counters vari-ous other criticisms of this approach, including the prob-lem of variable mutation rates across sites. He estimatesthat such variation introduces an error of -3%.Population Histories: Havik versus MukriWhile the overall pattern of pairwise differences for
the Indian sequences is somewhat rough (fig. 4a), the
unimodal distribution indicates that an expansion hasoccurred. This pattern obscures the difference betweenthe patterns for the Havik and Mukri subpopulations.When the patterns of the Havik and Mukri are examinedseparately, they reveal two demographic patterns.The Havik appear to have undergone an expansion. TheMukri, on the other hand, appear to have maintained a
constant population size, as suggested by the multi-modal distribution of pairwise differences. While thereare no firm historical data to show that the Havik popu-
lation has been growing more rapidly in comparisonwith the Mukri population, there is abundant evidencethat over the few thousand years the Brahmin groups
had far higher levels of resource access than did un-
touchable groups.
Other authors, including Vidyarthi (1983) and Ca-valli-Sforza et al. (1994), have suggested that there are
at least four major components to the genetic structureof India. The first corresponds to the early, Paleolithicoccupation of India. The Mukri may be descendants ofthese earliest inhabitants of southwest India. The secondcorresponds to the migration of farmers, possibly speak-ing proto-Dravidian languages, from western Iran dur-ing the Neolithic. The third component corresponds tothe arrival of Indo-European speakers roughly 3,500years ago. The ancestors of the Havik may have beenpart of the second or third components. Archaeologicalevidence suggests that cultivation spread into India fromtwo directions. The first wave arrived 6,000-7,000years ago in northwestern India, from its origin in theNear East. The second wave reached eastern India5,000-6,000 years ago, probably from the independentcenter of origin of agriculture in China (Herre and Rohrs1977).The hierarchical caste society crystallized fairly re-
cently, -2,000 years ago. The individual caste groupsprobably arose, however, from endogamous tribelikegroups of the earlier society (Karve 1961). Groups mayhave initially found themselves assigned to the varioushierarchical levels based on their roles in society. Thisrole was undoubtedly correlated with the group's con-
Table 4
Simple Distances between Populations (x 10,000)
Population MKung Pygmy Other African European Indian Chinese Other Asian
Pygmy ............ 85Other African ......... 88 34European ............ 112 68 29Indian ............ 110 66 28 10Chinese ............ 96 53 11 5 5Other Asian ............ 118 75 30 7 16 6New Guinean ......... 113 81 43 18 28 17 4
NOTE.-Db - (Dy, + D,2)/2, where Db = mean number of pairwise differences between sequences from the two different samples, and D",- mean number of pairwise differences within sample i.
988

Mountain et al.: Indian mtDNA-Sequence Diversity
Kung
Pygmy88 Other African
47
694 European4 Chinese
Indian1 Other Asian
NewGuinean
Figure 7 Tree inferred according to average linkage algorithm(unweighted pair-group method using arithmetic averages; see Sokaland Michener [1958]) from simple genetic distances given in table 2.Values at nodes indicate number of 100 bootstrap trees presentingcluster to the right of node. Tree inferred according to neighbor-joining method (Saitou and Nei 1987) (not shown) indicated similarrelationships among populations.
trol over technologies, i.e., the degree to which they wereable to generate surplus resources and to acquire surplusresources from other groups. At the time of formationof the caste society the Havik would then have been in anadvantageous position through access to more advancedtechnology, including agriculture. Much of populationgrowth in India over the millennia must have related togradual agricultural colonization of new areas followedby intensification of agriculture through irrigation inareas already under cultivation (Jha 1974). Groups as-
signed low status, such as the Mukri, may have subsistedas hunter-gatherers prior to formation of the caste so-
ciety.In the hierarchical caste society the Brahmin (includ-
ing the Havik) were granted land by rulers in order toestablish irrigated tracts and temples. With control over
irrigation, spice gardening, and priestly functions, theyhave been capable of generating a surplus for at leastthe past 2,000 years. During that period they were con-
tinually spreading to new territories and presumablygrowing in numbers. The lowest-ranking castes (includ-ing the Mukri) were landless and less likely to generatea surplus through such occupations characteristic oferstwhile untouchables as hunting, fishing, gathering,weaving of reed mats or bamboo baskets, tanning ofleather, or farm labor. It is plausible that there was a
gradient of population growth rates corresponding tosocial hierarchy: Brahmin groups continued to expandbecause of greater economic surplus, while scheduledcastes maintained their population sizes or underwentmultiple bottlenecks. Figure 8 indicates likely, simplifiedscenarios compatible with the pairwise-difference distri-butions described here.
Other cultural practices within the caste system alsoensure that a Brahmin caste group grows at a higherrate than lower status caste groups. In the rare instancesthat marriage is outside the endogamous group, off-spring belong to the father's group. Such marriages tra-ditionally involved a man from a higher status group
marrying a lower status woman (Powell 1896). Childrenwould therefore be absorbed into the higher statusgroup. This ensures that the higher status social groupsgrow in size at a somewhat faster rate, all other factorsbeing equal.The tree inferred from sequences for all the Indian
samples reveals no clear separation among the subpopu-lations. A similar pattern, with no identifiable caste-spe-cific clades, was recently reported by Bamshad et al.(1994) for a study of 40 individuals from four castegroups in Andrah Pradesh, India. Although the Havikand Mukri examined here are among the highest andlowest status castes, respectively, sequences from bothsamples are found scattered throughout the tree. Sucha pattern might be evidence for some level of gene flowbetween these two subpopulations. A recent study indi-cates that prior to the 1980s -3% of marriages wereexogamous (Bhattacharyya 1993). This small amount ofgene flow, if maintained over a number of generations,would certainly have an impact. In this region, however,no marriages between Mukri and Havik take place(Bhattacharyya 1993). In the hierarchical caste systemthe Havik and Mukri are separated by several othercaste levels; marriage outside of a caste group only takesplace between members of groups of roughly the samesocial status. The rate of gene flow between Havik andMukri must therefore be orders of magnitude lower than3%. While Havik and Mukri sequences are found to-gether in each part of the tree shown in figure 3, Havikand Mukri sequences are generally separated bybranches supported by bootstraps. This pattern indi-cates that very recent gene flow is unlikely. The lack ofclustering according to caste affiliation is more likely anindication that the separation between mitochondrialDNA lineages predates the separation of populations(Avise et al. 1984).
Indian Sequences in a Broader ContextPrevious genetic studies have demonstrated that In-
dian populations cluster most closely with west Asianpopulations, including Turks, Iranians, Caucasians, andLebanese (Cavalli-Sforza et al. 1994). The Indians andwest Asians form a Caucasoid cluster when comparedwith Asians from further north and east.As do sequences of other populations, the Indian se-
quences, both Mukri and Havik, tend to scatter through-out the starlike M2 cluster that includes Europeans,Asians, New Guineans, and some Africans (fig. 5). Thispattern is somewhat surprising, considering that theseindividuals were sampled from a very small geographicarea, and indicates that the common ancestor of theseIndian lineages predates the divergence among Eurasianpopulations. That is, diverse mitochondrial lineages ap-pear to have existed prior to the separation of theseIndian populations and even prior to the separation ofnon-Africans into various ethnic groups. Furthermore,
989

Am. J. Hum. Genet. 56:979-992, 1995
Mukrihunting, gathering
constant resource base
Havikcultivation of spices, irrigation technology, priestly functions
increasing resource base
k-pattern(constant population size)
(ac0
CL.a
time
Kz
clustered treeof mtDNA
multimodal distributionof nucleotide differencesbetween individuals
r-pattern(population expansion)
time
&z
star-like treeof mtDNA
unimodal distributionof nucleotide differencesbetween individuals
Figure 8 Illustration of possible scenarios leading to the difference between the trees and pairwise-difference distributions of the Mukriand Havik samples.
most clusters of Indian sequences join sequences of otherpopulations near the center of this cluster, suggestingthat little mixture between these Indian groups and theother populations sampled has taken place. The Indianpopulations considered here may have arisen as partof a broader Eurasian expansion. Since then the Havikappear to have been expanding, while the Mukri haveeither maintained a roughly constant population size or
undergone multiple bottlenecks.While the !Kung were also drawn from a very re-
stricted geographic region, the two samples (!Kung andIndian) form very different patterns in the tree shownin figure 5. The !Kung form a single cluster that includesno individuals from other populations. This observationhas implications for sampling of human populations;while sampling criteria may be consistently geographicor linguistic, widely different genetic patterns may
emerge.
Major Human ExpansionsArchaeological evidence suggests that the first migra-
tion of anatomically modern humans from Africa toother world regions took place roughly 100,000 years
ago (Brauer 1989; Clark 1989). If population growthaccompanied such migration, it did not leave extensivearchaeological traces. Nonetheless, migration of modern
or near-modern peoples from northern Africa into theMiddle East appears to have taken place during the LastInterglaciation (Klein 1989, p. 341), and may have beenaccompanied by population growth. Harpending et al.(1993) suggest that many independent populationexpansions occurred following a period of isolation,after modern human groups initially migrated from Af-rica. We propose an alternate hypothesis: that a single,major expansion occurred after a period of isolationbetween African and non-African populations, i.e., no
extended period of isolation among non-African groupstook place. Assuming an expansion in Africa beginning100,000 years ago, we estimated that such a non-Africanexpansion may have taken place -65,000 years ago.
This date is roughly consistent with archaeological dataindicating that modern humans had reached Australiaby 50,000 or more years ago (Roberts et al. 1990).
If, as Klein (1994) has suggested, population growthin Africa did not occur until -60,000 years ago, thenon-African expansion is estimated to have taken placecloser to 40,000 years ago. In this case the arrival of thefirst modern humans in Australia would have precededthe proposed non-African expansion. The proposedexpansion would roughly coincide with entry of modernhumans into Europe (Brauer 1989).
Figure 6c shows the distribution of pairwise differ-
0.NcCo0
CO0.00.
990
Mountain et al.: Indian mtDNA-Sequence Diversity 991
ences between African and non-African sequences. Themean of 13.04 differences, while not much greater thanthe mean for the within-African distribution (12.80 dif-ferences), is substantially greater than the mean for thenon-African distribution (8.96 differences). Such a pat-tern suggests that Africans and non-Africans separatedat about the time of an expansion. Furthermore, thestarlike M2 cluster in figure 5 includes not only non-Africans but also a number of African individuals, sug-gesting that the non-African population arose from asubpopulation in Africa.The value of 01 for the non-African distribution, cor-
responding to the population size after the expansion,is essentially twice that of the African distribution (table3). The 00 values, however, are roughly the same. Thenon-African distribution has a lower variance than theAfrican distribution, reflecting a more starlike tree forthese sequences. Such a pattern suggests that the non-African populations underwent a larger expansion thandid the African populations. This is consistent with ar-chaeological data showing little evidence of a majorexpansion within Africa (Klein 1989).The world tree inferred here (fig. 5) is consistent with
a major expansion of modern humans taking place out-side of Africa some time after an initial expansion withinAfrica. This conclusion is comparable to dates estimatedby other groups studying mtDNA data. Ballinger et al.(1992) suggest that an origin of Mongoloid people tookplace -59,000-118,000 (average 88,950) years ago,while Lum et al. (1994) estimated a date of 85,000 yearsbefore present for the sequence divergence of Polyne-sians. One question that arises is where such an expan-sion might have originated, if it was centered in a singlearea. While it may have begun in or near Africa, it mayalso have begun further east. Ballinger et al (1992) sug-gest an origin in southern China. India, geographicallycentral to Eurasia and Oceania, may have been relativelyeasy to reach from Africa along the coast and is anothercandidate for a center of origin. We hope to acquirefurther insights into the histories of these and other In-dian groups, in the context of world populations,through analyses of additional mtDNA sequences andof nuclear DNA loci.
AcknowledgmentsWe would like to thank M. Stoneking for supplying com-
puter files of mtDNA sequences; M. Slatkin, H. Harpending,and A. Rogers for helpful comments on an earlier version ofthe manuscript; A. Rogers for providing the "mom" computerprogram; F. Calafell for discussions and computations; and R.Scott for graphics. We also thank Anindya Sinha, J. Pillai, andSubash Chandran of the Centre for Ecological Sciences, IndianInstitute of Science for their assistance with collection of sam-ples. This research was supported by NIH grant GM 28428.
ReferencesAquadro CF, Greenberg BD (1983) Human mitochondrialDNA variation and evolution: analysis of nucleotide se-quences from seven individuals. Genetics 103:287-312
Anderson S, Bankier AT, Barrell BG, de Bruijn MHL, CoulsonAR, Drouin J, Eperon ICE, et al (1981) Sequence and organi-zation of the human mitochondrial genome. Nature290:457-465
Avise JC, Neigel JE, Arnold J (1984) Demographic influenceson mitochondrial DNA lineage survivorship in animal popu-lations. J Mol Evol 20:99-105
Ballinger SW, Schurr TG, Torroni A, Gan YY, Hodge JA,Hassan K, Chen K-H, et al (1992) Southeast Asian mito-chondrial DNA analysis reveals genetic continuity of ancientmongoloid migrations. Genetics 130:139-152
Bamshad M, Jorde LB, Crawford MH, Cann RL (1994) Hu-man mitochondrial DNA evolution in east Indian caste pop-ulations of Andrah Pradesh. Am J Phys Anthropol Suppl18:53
Bhattacharyya S (1993) Ecological organization of Indian ru-ral populations. PhD dissertation, Indian Institute of Sci-ence, Bangalore
Brauer G (1989) The evolution of modern humans: a compari-son of the African and non-African evidence. In: Mellars P,Stringer C (eds), The human revolution: behavioural andbiological perspectives on the origins of modern humans.Edinburgh University Press, Edinburgh, pp 123-154
Brown WM, George M Jr, Wilson AC (1979) Rapid evolutionof animal mitochondrial DNA. Proc Natl Acad Sci USA76:1967-1971
Cann RL, Stoneking M, Wilson AC (1987) MitochondrialDNA and human evolution. Nature 325:31-35
Cavalli-Sforza LL, Piazza A, Menozzi P (1994) History andgeography of human genes. Princeton University Press,Princeton
Clark JD (1989) The origin and spread of modern humans: abroad perspective on the African evidence. In: Mellars P,Stringer C (eds) The human revolution: behavioural andbiological perspectives on the origins of modern humans.Edinburgh University Press, Edinburgh, pp 565-588
D'Aquila RT, Bechtel LJ, Videler JA, Eron JJ, Gorczyca P,Kaplan JC (1991) Maximising sensitivity and specificity ofPCR by pre-amplification heating. Nucleic Acids Res19:3749
Efron B (1982) The jackknife, bootstrap, and other resamplingplans. Society for Industrial and Applied Mathematics, Phil-adelphia
Felsenstein J (1985) Confidence limits on phylogenies: an ap-proach using the bootstrap. Evolution 39:783-791
(1989) PHYLIP-Phylogeny inference package (version3.2). Cladistics 5:164-166
Gadgil M, Guha R (1993) This fissured land: an ecologicalhistory of India. University of California Press, Berkeley
Gadgil M, Iyer P (1989) On the diversification of common prop-erty resource use by Indian society. In: Berkes F (ed) Commonproperty resources: ecology and community-based sustainabledevelopment. Belhaven Press, London, pp 240-255
Giles RE, Blanc H, Cann HM, Wallace DC (1980) Maternalinheritance of mitochondrial DNA. Proc Natl Acad Sci USA77:6715-6719
992 Am. J. Hum. Genet. 56:979-992, 1995
Gyllensten U, Wharton D, Josefsson A, Wilson AC (1991)Paternal inheritance of mitochondrial DNA in mice. Nature352:255-257
Harpending HC, Sherry ST, Rogers AR, Stoneking M (1993)The genetic structure of ancient human populations. CurrAnthropol 34:483-496
Hartl DL, Clark AG (1989) Principles of population genetics.Sinauer, Sunderland, MA
Herre W, Rohrs M (1977) Zoological considerations of farm-ing and domestication. In: Reed C (ed) Origins of agricul-ture. Manton, The Hague, pp 245-280
Higgins DG, Sharp PM (1988) CLUSTAL: a package for per-forming multiple sequence alignment on a microcomputer.Gene 73:237-244
Higuchi R (1989) Simple and rapid preparation of samplesfor PCR. In: Erlich HA (ed) PCR technology: principles andapplications for DNA amplification. Stockton, New York,pp 31-38
Hoeh WR, Blakley KH, Brown WM (1991) Heteroplasmysuggests limited biparental inheritance of Mytilus mitochon-drial DNA. Science 251:1488-1451
Jha DN (1974) Temples as landed magnates in early medievalsouth India. In: Sharma RS, Jha V (eds) Indian society: his-torical probings. Manohar, New Delhi
Joshi NV, Gadghil M, Patil S (1993) Exploring cultural diver-sity of the people of India. Curr Sci 64:10-17
Karve I (1961) Hindu society: an interpretation. Sangam,Pune, India
Karve I, Malhotra KC (1968) A biological comparison of eightendogamous groups of the same rank. Curr Anthropol9:109-124
Kimura M (1980) A simple method for estimating evolution-ary rate of base substitutions through comparative studiesnucleotide sequences. J Mol Evol 16:111-120
Klein RG (1989) The human career: human biological andcultural origins. University of Chicago Press, Chicago
(1994) An introduction to the problem of modern hu-man origins. In: Nitecki MH, Nitecki V (eds) Origins ofanatomically modern humans, Plenum, New York, pp 3-17
Lum JK, Rickards O, Ching C, Cann RL (1994) Polynesianmitochondrial DNAs reveal three deep maternal lineageclusters. Hum Biol 66:567-590
Malhotra KC (1984) Population structure among the Dhangarcaste-cluster of Maharashtra, India. In: Lukacs JR (ed) Thepeople of south Asia: the biological anthropology of India,Pakistan, and Nepal. Plenum, New York, pp 295-324
NeiM (1987) Molecular evolutionary genetics. Columbia Uni-versity Press, New York
Piazza A, Menozzi P, Cavalli-Sforza L (1981) The makingand testing of geographic gene-frequency maps. Biometrics37:635-659
Powell B (1896; reprint 1981) Indian village community. Mod-ern Asian Publishers, Delhi
Roberts RG, Jones R. Smith MA (1990) Thermoluminescencedating of a 50,000-year-old human occupation site in north-ern Australia. Nature 345:153-156
Robin ED, Wong R (1988) Mitochondrial DNA moleculesand virtual number of mitochondria per cell in mammaliancells. J Cell Physiol 136:507-513
Rogers AR. Genetic evidence for a Pleistocene population ex-plosion. Evolution (in press)
Rogers AR, Harpending H (1992) Population growth makeswaves in the distribution of pairwise genetic differences.Mol Biol Evol 9:552-569
Roychoudhury AK (1984) Genetic relationships between In-dian populations and their neighbors. In: Lukacs JR (ed)The people of south Asia: thebiological anthropology ofIndia, Pakistan, and Nepal. Plenum, New York, pp 283-293 /
Saitou N, Nei M (1987) The neighb r-joining method: a newmethod for reconstructing phylogenetic trees. Mol Biol Evol4:406-425
Slatkin M, Hudson RR (1991) Pairwise comparisons of mito-chondrial DNA sequences in stable and exponentially grow-ing populations. Genetics 129:555-562
Sokal RR, Michener CD (1958) A statistical method for evalu-ating systematic relationships. Univ Kansas Sci Bull38:1409-1437
Vidyarthi LP (1983) Tribes of India. In: Satyavati GV (ed)Peoples of India: some genetical aspects. Indian Council ofMedical Research, New Delhi, pp 85-103
Vigilant L, Stoneking M, Harpending H. Hawkes K, WilsonAC (1991) African populations and the evolution of humanmitochondrial DNA. Science 253:1503-1507
Wakeley J (1993) Substitution rate variation among sites inhypervariable region 1 of human mitochondrial DNA. J MolEvol 37:613-623
Wilson AC, Cann RL, Carr SM, George M, Gyllensten UB,Helm-Bychowski KM, Higuchi RG, et al (1985) Mitochon-drial DNA and two perspectives in evolutionary genetics.Biol J Linnean Soc 26:375-400
Wolfram S (1988) Mathematica: a system for doing mathemat-ics by computer. Addison-Wesley, Menlo Park