Embed Size (px)
Citation preview

Demographic PVAs
Simulating Demographic Stochasticity and Density
Dependence

Demographic stochasticity
• Simulated by performing so-called Monte Carlo simulations: the fate of each individual in a certain class and a certain year is decided by a set of independent random choices, all of which are based on the same set of mean vital rates
• However this can greatly slow a program

Variability caused by demographic stocahsticity in binomial vital rates
0 5 10 15 20 25 30 350
0.02
0.04
0.06
0.08
0.1
0.12
0.14
Number of individuals
Var
ianc
e in
out
com
e

Techniques to how to perform Monte Carlo simulations
• For vital rates that are probabilities:
Pick a uniform random number and compare its value to the probabilities of different fates an individual might experience

How to use a uniform random number to decide between fates in a Monte Carlo simulation
a34
a34+a44
1
Die
a34+a44+a54
a34+a44+a54+a64
Survive and shrink to class 3
Survive and stay to class 4
Survive and grow to class 5
Survive and grow to class 6
0

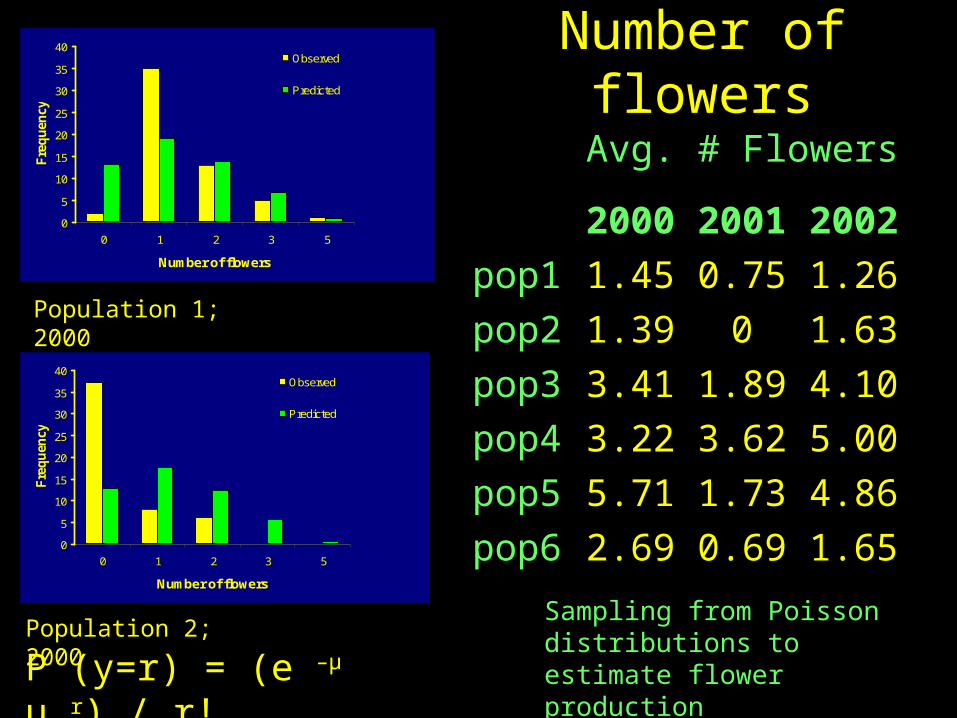
Adding demographic stochasticity to reproduction
• Determine if the individual lives
• Use a Poisson or another discrete distributions to obtain the individual fertility
Number of flowers
0
5
10
15
20
25
30
35
40
0 1 2 3 5
Number of flowers
Fre
qu
ency
Observed
Predicted
0
5
10
15
20
25
30
35
40
0 1 2 3 5
Number of flowers
Fre
qu
ency
Observed
Predicted
P (y=r) = (e –μ μ r) / r!
Population 1; 2000
Population 2; 2000Sampling from Poisson distributions to estimate flower production
Avg. # Flowers
2000 2001 2002
pop1 1.45 0.75 1.26
pop2 1.39 0 1.63
pop3 3.41 1.89 4.10
pop4 3.22 3.62 5.00
pop5 5.71 1.73 4.86
pop6 2.69 0.69 1.65

Number of seeds per flower
number of seeds per flower
138.0
124.0
110.0
96.0
82.0
68.0
54.0
40.0
26.0
12.0
8
6
4
2
0
Std. Dev = 28.97
Mean = 63.2
N = 30.00
Population 1; 2000
Sampling from normal distributions to estimate seed production
Avg. # Seeds
2000 2001 2002
pop1 63 63 53
pop2 56 62 42
pop3 54 43 43
pop4 55 49 38
pop5 63 54 41
pop6 68 50 33

Including density dependence
• Two factors make it more difficult to account for density dependence in demographic PVAs
1. We will rarely have as many years of vital rate estimates from a demographic study
2. There are many more variable that are potentially density dependent

Three questions we must consider:
• Which vital rates are density-dependent?
• How do those rates change with density?
• Which classes contribute to the density that each vital rate “feels”?

Two more limited approaches to building density-dependent projection matrix models
1. Assume that there is a maximum number or density of individuals in one or more classes, or of the population as a whole , that the available resources can support, and construct a simulation model that prevents the population vector from exceeding this limit.
Two more limited approaches to building density-dependent projection matrix models
2. Choose one or at most a few vital rates that, on the basis some evidence are suspected to be strongly density dependent

Placing a limit on the size of one or more classes
Caps or ceilings on population density are most often used to introduce density dependence when the focal species is territorial

The Iberian Lynx

Gaona et al. (1998)lynx population in Doñana National Park post
breeding census birth-pulse population
Cubs Juveniles Floaters Breeders
Cubs 0 0 0 b x c x p x s4
Juveniles s1 0 0 0
Floaters 0 s2 (1-g) s3 (1-g) 0
Breeders 0 s2 (g) s3 (g) s4
b = probability that a territory-holding female will breed in a given yearc = number of cubs produced by females that do breed
p = proportion of cubs that are female

• Density dependence acts on g, which represent the probability that a surviving juvenile or floater will acquire a territory next year
• Just before the birth pulse that precedes census t+1, there will be s4n4(t) breeding females still in possession of a territory and K- s4n4(t) vacant territories available.
Gaona et al. (1998)lynx population in Doñana National Park post
breeding census birth-pulse population

Gaona et al. (1998)lynx population in Doñana National Park post
breeding census birth-pulse population
• g= [K-s4n4(t)]/[s2n2(t)+ s3n3(t)]


Density dependent functions
tEstEs exp000
The Ricker function

Density dependent functions
tE
stEs
1
000
Beverton-Holt model

Density dependent functions
)(tnfbtE iii
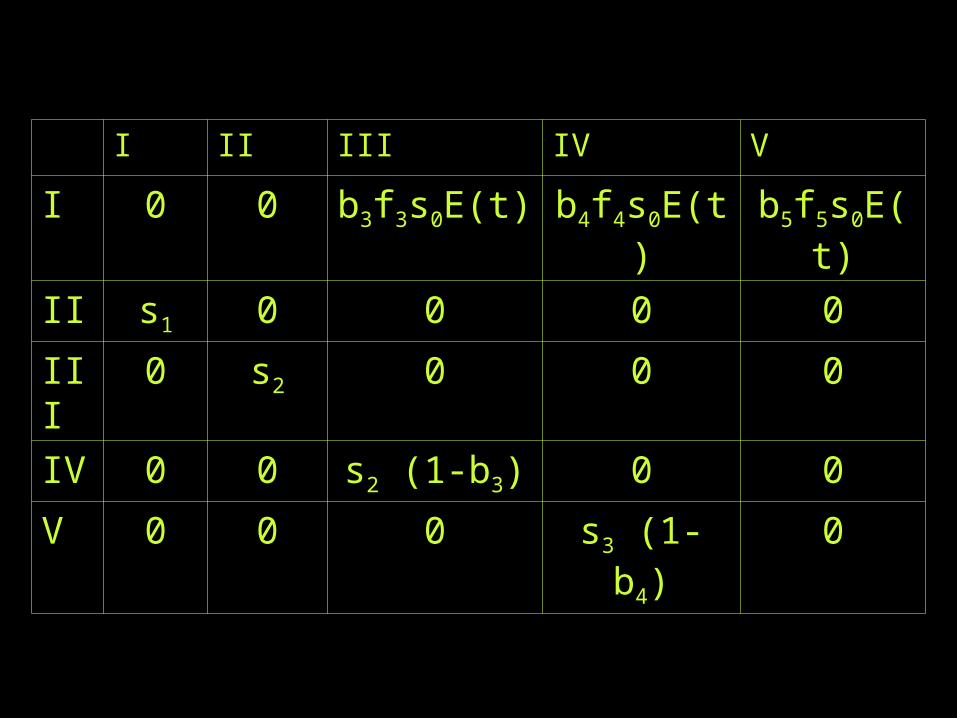
I II III IV V
I 0 0 b3f3s0E(t) b4f4s0E(t) b5f5s0E(t)
II s1 0 0 0 0
III 0 s2 0 0 0
IV 0 0 s2 (1-b3) 0 0
V 0 0 0 s3 (1-b4) 0