Embed Size (px)
Citation preview

20th Population Census Conference 19 – 21 June, 2002
Ulaanbaatar, Mongolia
Utilization and Analysis of the 2000 Round of Censuses
DEMOGRAPHIC TRENDS IN MALAYSIA WITH SPECIAL FOCUS ON WOMEN
Rabieyah Mat & Roszaini Omar
Department of Statistics, Malaysia http://www.statistics.gov.my

20th Population Census Conference 19 – 21 June, 2002
Ulaanbaatar, Mongolia
Utilization and Analysis of the 2000 Round of Censuses
DEMOGRAPHIC TRENDS IN MALAYSIA WITH SPECIAL
FOCUS ON WOMEN
Rabieyah Mat & Roszaini Omar Department of Statistics, Malaysia
Table of Contents
1 INTRODUCTION____________________________________________________1
2 BACKGROUND _____________________________________________________2
3 POPULATION DISTRIBUTION________________________________________5
4 CHANGING AGE STRUCTURE________________________________________6
5 DIFFERENTIAL AGE DISTRIBUTION TRENDS _______________________14
6 AGE PATTERNS BY SEX RATIO _____________________________________15
7 TRENDS IN THE DEPENDENCY RATIO ______________________________17
8 MARITAL STATUS _________________________________________________18
9 MEAN AGE AT FIRST MARRIAGE ___________________________________21
10 CONCLUSION _____________________________________________________23

20th Population Census Conference,19 – 21 June, 2002,Ulaanbaatar, Mongolia
Demographic Trends In Malaysia With Special Focus On Women
1
1 INTRODUCTION
1.1 The examination of the demographic trends in Malaysia from a gender
perspective is imperative given the increasing concerns of the Malaysian
government to address women’s issues. The National Policy for women
formulated in 1989 which reflected the governments commitment towards
the advancement of women will continue to be operationalized which
included the implementation of gender sensitive and awareness training
programmes. Data base by gender is being developed to provide input for
planning and implementation of programmes for women. Growing
importance is being given to the production of statistics by gender.
1.2 As in most countries around the world, women make up for almost half of
the total population of Malaysia. In view of the current concern and
commitment of the Malaysian Government towards its development and in
the spirit of sharing of information during this seminar, this paper sets out
to shed some light on Malaysian women’s demographic trends in Malaysia
based on the 1970, 1980 and 1991 Population Census and present trend
based on the 2000 Population Census. It examines the changing
demographic pattern of the population by age group and sex. With the aim
to focus on women, this paper provides basic data on the disribution of
women by age group and marital status.

20th Population Census Conference,19 – 21 June, 2002,Ulaanbaatar, Mongolia
Demographic Trends In Malaysia With Special Focus On Women
2
2 BACKGROUND
2.1 History of Census
The 2000 Population and Housing Census of Malaysia was the fourth
decennial census to be conducted since the formation of Malaysia in 1963.
The 2000 Census collected data on the characteristic of the living quarters,
households and population in Malaysia. The three earlier censuses were
conducted in 1970, 1980 and 1991. Prior to the formation of Malaysia, the
census was conducted as early as 1901.
2.2 Legal Basis
Under the Constitution of Malaysia, census taking is a federal
responsibility and the legal basis for the census is provided by the Census
Act of 1960, which empowers the government to conduct a census from
time to time. The responsibility for conducting the 2000 Population and
Housing Census was vested upon the Department of Statistics, which
implemented the project in collaboration with the state governments of
Malaysia.
2.3 Census Organisation
The entire Population and Housing Census Malaysia 2000 project was
under the direct purview of the Census Steering Committee (CSC) chaired
by the Chief Secretary to the Government. Technical support was provided

20th Population Census Conference,19 – 21 June, 2002,Ulaanbaatar, Mongolia
Demographic Trends In Malaysia With Special Focus On Women
3
by the Census Technical Committee chaired by the Director-General of the
Economic Planning Unit. The Chief Statistician of Malaysia was appointed
the Commissioner of Census who was responsible for the entire 2000
Census operation.
2.4 Census Reference Date and Survey Period
In selecting the census reference day, due consideration was given to a
variety of factors. The census reference date should fall on a day whereby
population movement is at its minimal. The selected date should not fall on
public holidays, school holidays, festive seasons or on any major event-
taking place such as the performance of the Haj where a sizable number of
persons would be performing the pilgrimage and this may not be counted.
The monsoon period and the fasting month should also be avoided for field
operational reasons.
The Census reference date for the three Censuses of 1980, 1991 and 2000
were on 10th June, 14th August and 5th July respectively. In the 2000
Census the enumeration was carried out over a period of sixteen days
beginning from 5th July until 20th July 2000. Consistent with usual
practice, mopping-up activities were also undertaken after the enumeration
period, that is, from 21st July until 30th July.

20th Population Census Conference,19 – 21 June, 2002,Ulaanbaatar, Mongolia
Demographic Trends In Malaysia With Special Focus On Women
4
2.5 Enumeration Procedure
The ‘de jure’ approach was adopted for the first time in the 2000 Census
whereby all persons on Census Day (5th July 2000) were enumerated
according to their place of usual residence. This differed from the ‘de
facto’ approach used in the previous censuses whereby all persons were
enumerated at the place where they physically were on Census Night.
2.6 Areas Covered
The whole of Malaysia was divided into small census geographic units
known as enumeration blocks (EB). Each EB was assigned an enumerator
and a combination of 7 EBs formed a census circle (CC) which was the
responsibility of a supervisor. A District Superintendent was responsible
for each census district (CD) comprising about 15 CCs. All District
Superintendents in one administrative district (AD) came under the
responsibility of the Assistant Commissioner of Census who, in most cases
was the District Officer in the administrative district concerned. All
Assistant Commissioners of each state were under the control of the
Deputy Commissioner for that state. The Deputy Commissioner of each
state was in turn responsible directly to the Commissioner of Census.

20th Population Census Conference,19 – 21 June, 2002,Ulaanbaatar, Mongolia
Demographic Trends In Malaysia With Special Focus On Women
5
2.7 Persons Covered
All persons including foreigners who stayed or intended to stay in
Malaysia for six months or more in the year 2000 were included in the
Census. They were counted at their place of usual residence in line with
the ‘de jure’ approach adopted in Census 2000.
2.8 Topics Enumerated
The list of topics canvassed in the 2000 Census was arranged under three
broad headings namely Population, Household and Housing. Comparisons
were made with those canvassed in the three previous Malaysian censuses
in 1970, 1980 and 1991 as encapsulated in Appendix 1.
3 POPULATION DISTRIBUTION
3.1 In the year 2000, the population of Malaysia was 23.3 million after taking
into account census under-enumeration. The population increased more
than two folds over the 30 year period from 10.3 million in 1970 to 23.3
million in the year 2000. The increase had resulted in an average annual
growth rate of about 2.6% per annum for the 1980-1991 period and the
1991-2000 period.
3.2 Population density in Malaysia continued to increase over the census
period. From 31 persons per square kilometre in 1970 the density has
20th Population Census Conference,19 – 21 June, 2002,Ulaanbaatar, Mongolia
Demographic Trends In Malaysia With Special Focus On Women
6
increased to 42 in 1980, leaping to 56 in 1991 and further to 71 in the year
2000. Likewise the level of urbanization in Malaysia is on the increase.
The percentage of population living in urban areas increased from 26.9%
in 1970 to 34.2% in 1980 and 50.6% in 1990. By the year 2000, more than
two thirds of the population (61.8%) reside in the urban areas of Malaysia.
3.3 Historically, the censuses in Malaysia provide, among other socio-
economic characteristic, information on ethnicity. This information is vital
as major input in the formulation and monitoring of government policies
and programmes spelt out in the 5 year Development Plans. Malaysia is a
multi-racial country with more than 70 identified ethnic groups. These
ethnic groups are broadly classified into 4 major groups namely
Malays/Bumiputera, Chinese, Indians and others. Of the total number of
Malaysians in the year 2000, Malays/Bumiputera comprised 65.1%,
Chinese 26.0%, Indians 7.7% and the others 1.2%. These proportions saw
a marked increase in the Malays/Bumiputera group which were 60.6% in
1991, 59.3% in 1980 and 55.6% in 1970.
4 CHANGING AGE STRUCTURE
4.1 The age structure of the population largely depends on the changing trends
in fertility, mortality and migration. The transition from high fertility and
mortality rates to low rates causes predictable shifts in the age structure of
the population in Malaysia. The age pyramid (Chart 1, 2 and 3 ) show the

20th Population Census Conference,19 – 21 June, 2002,Ulaanbaatar, Mongolia
Demographic Trends In Malaysia With Special Focus On Women
7
changes that took place during the 1970, 1980, 1990 and 2000 in the
age/sex compositions of the Malaysian population.
4.2 It is clear that in the 1970’s, Malaysia had typical age structures produced
by relatively high birth and death rates which are reflected by the high
percentage of young children and the regular shape of the pyramid. By
1990, Malaysia experienced a more rapid decline in birth and death rates
(Table 1). The proportion of the young population continued to decline
while the older age group increased. This trend continued to the present
era in the year 2000.
Table 1: Crude Birth Rates (CBR) and Crude Death Rates (CDR)
Crude Birth Rate Crude Death Rate
Total Male Female Total Male Female
1960 40.9 40.7 41.0 9.5 10.2 8.7
1970 32.4 32.8 31.9 6.7 7.5 5.8
1980 30.6 31.4 29.9 5.3 6.0 4.5
1990 27.9 28.4 27.4 4.6 5.2 4.1
2000 24.5 25.0 24.0 4.4 5.0 3.8

20th Population Census Conference,19 – 21 June, 2002,Ulaanbaatar, Mongolia
Demographic Trends In Malaysia With Special Focus On Women
8
Chart 1: MALAYSIAPopulation by Age Group and Sex
1970, 1980, 1991, 2000
6000000 4000000 2000000 0 2000000 4000000 6000000
0 - 4
10 - 14
20 - 24
30 - 34
40 - 44
50 - 54
60 - 64
70 - 74
Ag
e G
rou
p
Population (Stacked)
2000 1991 1980 1970
FEMALE MALE

20th Population Census Conference,19 – 21 June, 2002,Ulaanbaatar, Mongolia
Demographic Trends In Malaysia With Special Focus On Women
9
Chart 2: Percentage of Population by Age Group 1970, 1980, 1991, 2000
60 40 20 0 20 40 60
0 - 4
10 - 14
20 - 24
30 - 34
40 - 44
50 - 54
60 - 64
70 - 74A
ge
Gro
up
Percentage Population (Stacked)
2000 1991 1980 1970
FEMALE MALE

20th Population Census Conference,19 – 21 June, 2002,Ulaanbaatar, Mongolia
Demographic Trends In Malaysia With Special Focus On Women
10
Chart 3: Population by Age Group & Sex 2000
1500000 1000000 500000 0 500000 1000000 1500000
0 - 4
10 - 14
20 - 24
30 - 34
40 - 44
50 - 54
60 - 64
70 - 74A
ge
Gro
up
Population
FEMALE MALE

20th Population Census Conference,19 – 21 June, 2002,Ulaanbaatar, Mongolia
Demographic Trends In Malaysia With Special Focus On Women
11
4.3 In a normal situation, the age distribution by sex for a growing population
resembles the shape of a pyramid where the number of persons in any age
group is normally larger than that in the immediate older age group. This
regular pattern may be modified by changes in any component such as age,
selective migration or continuous reductions in fertility. In 1970, 1980,
1991 and 2000 the age structure of the population in Malaysia reflected
this shape.
4.4 Table 2a (percentage) & Table 2b (absolute values), shows that overall, the
share of the population below the age of 4 years declined from 15.9% in
1970 to 13.6% in 1980 and further to 12.8% in 1991. By the year 2000, the
percentage decreased further to 11.1%. For the males under the same age,
the proportion fell from 16.1% in 1970 to 11.3% in 2000. The share of the
females in the same age category fell by 4.7% percentage points in the
corresponding period from 15.7% in 1970 about 11.0% to 22.2% in 2000.
4.5 The number and percentage of the population in the 25 and above age
group increased in the 1970-2000 period. While the natural progression of
the population surviving from one age cohort to the following age cohort is
always smaller in number to the effects of mortality, any increase in the
corresponding age group would suggest a net inflow of population
attributed to external migration. For example, the population in the age
groups 15-24 and 25-34 in 1970 survived approximately to the age groups
25-34 and 35-44 respectively in 1991 and 35-44 and 45-50 in the year
2000. This results in the rise in proportion for the age group for example in
the 25-44 from 21.5% in 1980 to 29.7% in 2000.

20th Population Census Conference,19 – 21 June, 2002,Ulaanbaatar, Mongolia
Demographic Trends In Malaysia With Special Focus On Women
12
TABLE 2a: PERCENTAGE OF TOTAL POPULATION BY AGE GROUP AND SEX
THE POPULATION AND HOUSING CENSUS MALAYSIA 1970, 1980, 1991 AND 2000
AGE GROUP
1970 1980 1991 2000
TOTAL SEX TOTAL SEX TOTAL SEX TOTAL SEX
MALE FEMALE MALE FEMALE MALE FEMALE MALE FEMALE
TOTAL 100.00 100.00 100.00 100.00 100.00 100.00 100.00 100.00 100.00 100.00 100.00 100.00
0 - 4 15.86 16.06 15.65 13.55 13.85 13.24 12.77 13.02 12.50 11.13 11.29 10.97
5 - 9 15.66 15.87 15.45 13.57 13.83 13.31 12.82 13.05 12.59 11.48 11.65 11.31
10 - 14 13.43 13.53 13.33 12.44 12.62 12.25 11.20 11.34 11.05 10.86 10.99 10.74
15 - 19 10.90 10.69 11.12 11.37 11.20 11.54 9.95 9.89 10.00 10.14 10.07 10.22
20 - 24 8.29 8.06 8.52 9.63 9.24 10.02 8.92 8.80 9.05 8.64 8.52 8.76
25 - 29 6.31 6.22 6.41 8.06 7.87 8.24 8.68 8.55 8.80 8.13 8.03 8.23
30 - 34 6.04 5.96 6.13 6.66 6.69 6.63 7.95 7.90 8.00 7.71 7.66 7.76
35 - 39 4.86 4.71 5.01 5.11 5.20 5.02 6.65 6.65 6.65 7.36 7.33 7.39
40 - 44 4.26 4.24 4.28 4.75 4.82 4.68 5.33 5.39 5.27 6.45 6.50 6.41
45 - 49 3.54 3.48 3.60 3.60 3.56 3.65 3.82 3.91 3.73 5.10 5.17 5.02
50 - 54 3.13 3.17 3.09 3.16 3.15 3.16 3.47 3.48 3.46 3.99 4.09 3.89
55 - 59 2.49 2.61 2.37 2.43 2.39 2.48 2.56 2.51 2.61 2.70 2.77 2.64
60 - 64 2.15 2.23 2.08 2.05 2.01 2.09 2.14 2.05 2.23 2.41 2.37 2.45
65 - 69 1.33 1.45 1.20 1.43 1.44 1.43 1.39 1.32 1.47 1.50 1.42 1.59
70 - 74 0.91 0.93 0.89 1.12 1.11 1.13 1.11 1.03 1.19 1.14 1.07 1.22
75+ 0.84 0.79 0.89 1.07 1.03 1.11 1.25 1.12 1.39 1.25 1.09 1.42

20th Population Census Conference,19 – 21 June, 2002,Ulaanbaatar, Mongolia
Demographic Trends In Malaysia With Special Focus On Women
13
TABLE 2b: TOTAL POPULATION BY AGE GROUP AND SEX
THE POPULATION AND HOUSING CENSUS MALAYSIA 1970, 1980, 1991 AND 2000
1970 1980 1991 2000
AGE GROUP
TOTAL MALE FEMALE TOTAL MALE FEMALE TOTAL MALE FEMALE TOTAL MALE FEMALE
10,319,324 5,198,418 5,120,906 13,136,109 6,588,756 6,547,353 17,498,091 8,828,580 8,669,511 22,198,276 11,262,136 10,936,140
0 - 4 1,636,244 834,724 801,520 1,779,564 912,497 867,067 2,233,649 1,149,819 1,083,830 2,471,108 1,270,988 1,200,120
5 - 9 1,616,043 825,025 791,018 1,782,782 911,412 871,370 2,243,666 1,152,009 1,091,657 2,549,311 1,312,400 1,236,911
10 - 14 1,386,024 703,514 682,510 1,633,536 831,730 801,806 1,959,516 1,001,121 958,395 2,411,581 1,237,519 1,174,062
15 - 19 1,125,011 555,511 569,500 1,493,464 737,713 755,751 1,740,361 873,259 867,102 2,251,565 1,134,431 1,117,134
20 - 24 855,677 419,210 436,467 1,265,133 608,779 656,354 1,561,527 776,862 784,665 1,917,252 959,086 958,166
25 - 29 651,349 323,351 327,998 1,058,434 518,755 539,679 1,518,279 754,937 763,342 1,804,016 904,154 899,862
30 - 34 623,741 309,815 313,926 874,744 440,840 433,904 1,390,755 697,434 693,321 1,710,728 862,286 848,442
35 - 39 501,368 245,040 256,328 671,303 342,508 328,795 1,163,706 586,998 576,708 1,633,946 825,390 808,556
40 - 44 439,562 220,533 219,029 624,041 317,324 306,717 933,012 475,833 457,179 1,432,771 731,770 701,001
45 - 49 365,119 180,924 184,195 473,354 234,297 239,057 668,750 345,623 323,127 1,131,445 582,645 548,800
50 - 54 323,095 164,804 158,291 414,754 207,698 207,056 606,986 306,871 300,115 885,662 460,501 425,161
55 - 59 256,944 135,571 121,373 319,848 157,209 162,639 448,308 221,870 226,438 600,433 311,720 288,713
60 - 64 222,289 116,023 106,266 269,745 132,581 137,164 373,735 180,700 193,035 534,248 266,597 267,651
65 - 69 136,756 75,426 61,330 188,166 94,581 93,585 243,509 116,117 127,392 333,274 159,559 173,715
70 - 74 93,635 48,115 45,520 146,563 72,881 73,682 193,705 90,598 103,107 253,722 120,776 132,946
75+ 86,467 40,832 45,635 140,678 67,951 72,727 218,627 98,529 120,098 277,214 122,314 154,900

20th Population Census Conference,19 – 21 June, 2002,Ulaanbaatar, Mongolia
Demographic Trends In Malaysia With Special Focus On Women
14
5 DIFFERENTIAL AGE DISTRIBUTION TRENDS
5.1 The trend of age distribution of Malaysia changed its direction around the
1960’s when it started experiencing fertility decline (from 6.0 total fertility
rate (TFR) in 1960 to 4.0 in 1980 and down to 3.2 in 2000). The age
distribution was younger in the 1970’s but became increasingly older in
the 1990’s.
Table 3: Age Distribution by broad Age Group, 1970-2000
Broad Age Group
(Years)
1970 1980 1991 2000
0-14 44.9 39.6 36.8 35.4
15-64 52.0 56.8 59.5 62.6
65+ above 3.1 3.6 3.7 3.9
Total 100.0 100.0 100.0 100.0
5.2 The proportion under age 15 saw a rapid decline from 44.9% in 1970 to
35.4% in the year 2000. The proportion aged 65 and over pointed at a
different direction. From 3.1% in 1970, it has increased to almost 4.0% in
the year 2000. The proportion of the elderly was on the increase while the
proportion of children decreased reflecting the decline in both birth and
death rates beginning in the 1970’s. The upwards trends of the 15-64 age
group (52.0% in 1970 to 62.6% in 2000) reflects the baby boom observed
after the second world war. Table 3 shows the dominant direction of age
distribution towards the working age group (15-64 years). This is also
reflected by the increasing median age from 15.5 years in 1970 to 20.5
years in the year 2000.

20th Population Census Conference,19 – 21 June, 2002,Ulaanbaatar, Mongolia
Demographic Trends In Malaysia With Special Focus On Women
15
Table 4: Mean Age and Median Age by Males and Females Malaysia 1970, 1980, 1991 and 2000
1970 1980 1991 2000
Mean Age
Male 22.2 23.4 24.5 26.1
Female 22.2 23.8 25.2 26.3
Total 22.2 23.6 24.9 26.6
Median Age
Male 15.4 15.9 20.2 20.6
Female 15.5 16.1 20.3 20.6
Total 15.5 16.0 20.3 20.6
5.3 The increase in the median age from 1970 to 2000 was in line with the
decline in fertility alongside increases in life expentancy. The median age
of the population increased for both males and females. There were
marginal differentials in the overall median age between both sexes. It was
however noted that the median age of females were slightly higher than the
males throughout the 30 year period.
6 AGE PATTERNS BY SEX RATIO
6.1 The sex ratio defined as the number of males per 100 females tends to
reduce at older ages. Overall, the sex ratio has increased. From 102 in
1970 the sex ratio increased to 103 in 2000. Over the years the excess of
females over males is most marked in the older age groups as shown in
Table 5. Although, more males are born than females , the ratio changes
as they age. It is interesting to note that both males and females have

20th Population Census Conference,19 – 21 June, 2002,Ulaanbaatar, Mongolia
Demographic Trends In Malaysia With Special Focus On Women
16
experienced increasing life expectancy over the years. However, current
levels show that on average the life expectancy of females at birth is
about 5 years longer than the males as reflected in Table 6.
Table 5 :Sex Ratio by age groups, 1970-2000
Age Groups 1970 1980 1991 2000
0-14 104 105 105 106
15-19 98 98 101 102
20-54 98 98 101 103
55-64 111 97 96 104
65+above 108 98 87 87
Total 102 101 102 103
Table 6: Life expectancy at birth by sex , 1970, 1980, 1991, 2000
Sex 1970 1980 1991 2000
Male 61.6 66.5 69.2 70.2
Female 65.6 71.0 73.4 75.0
6.2 At the young age group ( 0-14 years) the sex ratio increased from 104 in
1970 to 106 in 2000. There is a marked increase in the 15-19 age group
from 98 in 1970 to 102 in 2000. Likewise, in the 20-54 age group the sex
ratio is reversed from excess females over males in 1970 and 1980 to
excess males over females in 1991 and 2000. In the older age group
particularly the 55 – 64, the sex ratio over the years appeared to be
somewhat eratic from more males in 1970 to less males compared to
females in 1980 and 1991 and to the same situation as in 1970 by the year

20th Population Census Conference,19 – 21 June, 2002,Ulaanbaatar, Mongolia
Demographic Trends In Malaysia With Special Focus On Women
17
2000. The 65 and over age group saw a steady decline of the sex ratio
from 108 in 1990 to 98 in 1980 and stabilised at 87 in 1991 and 2000.
7 TRENDS IN THE DEPENDENCY RATIO
7.1 The dependency ratio is presented in three ways: the under age 15
dependency ratio, the aged 65 and above and the total dependency ratio
which is the sum of these two ratios. It is seen as shown in Table 7 that the
under-age 15 dependency ratio declined rapidly while the age 65 and over
dependency ratio remained stable. The downward trends of the under-age
15 dependency rate overides the aged 65 and our depedency ratio thereby
causing the total dependency ratio to decline from 92.4% in 1970 to 59.7%
in the year 2000. This change clearly reflected the overall marked
improvement of the well-being of the population in Malaysia over the
years. The significant decline of the overall dependency ratio was mainly
attributed by the sharp decline of the young who were dependant on the
working age group. This also reflected the marked increase of the working
age group.
Table 7: Age Dependency Ratio (%) 1970-2000
Dependency Ratio 1970 1980 1991 2000
Under Aged 15 86.5 69.6 61.9 53.5
Aged 65 + above 5.9 6.4 6.3 6.2
Total 92.4 76.0 68.2 59.7

20th Population Census Conference,19 – 21 June, 2002,Ulaanbaatar, Mongolia
Demographic Trends In Malaysia With Special Focus On Women
18
8 MARITAL STATUS
8.1 Marriage undoubtedly has an effect on the overall fertility levels and thus
on the size and age structure of the population. A classification of the
Malaysian population aged 15 years and above by marital status is given in
Table 8 for the years 1970, 1980, 1991 and 2000. It is observed that
change in the structure and composition of families are closely related to
trends marriage in and marital status of the population. The distribution of
population (aged 15 years and over) by marital status categorised by never
married, currently married, widowed and divorced/permanently separated
show marginal differences between 1970, 1980, 1991 and 2000.
8.2 Basically all marital status categories recorded a slight reduction in
percentages except for those never married which showed a small increase
from 31.3% in 1970 to 35.0% in the year 2000. However, it is interesting
to observe that in the never married category, the proportion among the
males was much higher than the proportion of never married women. The
difference was almost 10 percentage points, between the sexes throughout
the census period.
8.3 The proportion of never married males in 1970 was 36.7% while the
females registered 26.0% In 2000, the proprotion of males in this category
increased to 39.%. The percentage of unmarried females increased at the
same rate to 30.9% in the year 2000.

20th Population Census Conference,19 – 21 June, 2002,Ulaanbaatar, Mongolia
Demographic Trends In Malaysia With Special Focus On Women
19
Table 8: Percentage Distribution of the Population aged 15 years and over by Marital Status and by Sex, Malaysia
1970, 1980, 1991 and 2000. Total
Marital Status 1970 1980 1991 2000
Never Married 31.3 35.0 34.6 35.0
Currently Married 60.2 57.9 59.4 59.8
Widowed 7.2 5.7 5.0 4.4
Divorced or permanently separated
1.3 1.4 1.0 0.8
Total 100.0 100.0 100.0 100.0
Number (000’) 5,681.4 7,881.2 11,061.3 14,766.3
Male
Marital Status 1970 1980 1991 2000
Never Married 36.7 39.7 39.2 39.0
Currently Married 59.3 57.5 58.6 58.9
Widowed 2.9 2.1 1.7 1.7
Divorced or permanently separated
1.1 0.7 0.5 0.4
Total 100.0 100.0 100.0 100.0
Number (000’) 2,835.2 3,885.6 5,525.6 7,325.1
Female
Marital Status 1970 1980 1991 2000
Never Married 26.0 30.5 30.0 30.9
Currently Married 61.0 58.2 60.2 60.6
Widowed 11.5 9.2 8.2 7.2
Divorced or permanently separated
1.5 2.1 1.5 1.3
Total 100.0 100.0 100.0 100.0
Number (000’) 2,846.2 3,995.6 5,535.6 7,325.0

20th Population Census Conference,19 – 21 June, 2002,Ulaanbaatar, Mongolia
Demographic Trends In Malaysia With Special Focus On Women
20
8.4 Chart 3 illustrates the stable pattern in the proportion of married women
over the last 3 decades. Between 1970 and 1980 the proportion of married
women slightly dropped from 61.0% in 1970 to 58.2% in 1980 but
stabilised at around 60% in 1991 and 2000. Along with the trend towards
later mariages, there have been slight decreasing rates of widowed and
divorced categories.
Chart 3 – Marital Status of Women 1970, 1980, 1991 and 2000.
8.5 As Table 9 suggests, amongst the married women, the highest proportion
married are in the 30-34 age group. The percentage unmarried remained at
about 16-17% for the past three decades. It is obvious that amongst the
younger age group (15-19), the rates has declined over the 30 year period
Marital Status of Women, 1970, 1980, 1991, 2000
2630.5 30 30.9
6158.2
60.2 60.6
11.59.2 8.2 7.2
1.5 2.1 1.5 1.30
10
20
30
40
50
60
70
1970 1980 1991 2000
Year
Per
cen
tag
e
Currently married
Never married
Widowed
Divorced

20th Population Census Conference,19 – 21 June, 2002,Ulaanbaatar, Mongolia
Demographic Trends In Malaysia With Special Focus On Women
21
from 5.4% in 1970 to 1.2% in 2000. The marriage rate showed a marked
increase in the 35-39 age group. This pattern is in line with the increasing
mean age at marriage. The shift of the increasing proportion of married
women in the older age group over the 1970-2000 period reflects the
overall improvement in the well-being of the women. The proportion of
women in the 65 and above who remained married increased almost two
folds from 2.5% in 1970 to 4.3% in 2000.
Table 9: Percentage distribution of currently married females
(aged 15 years and above) 1970, 1980, 1991 and 2000
Age Group 1970 1980 1991 2000 15-19 5.4 3.2 1.9 1.2
20-24 14.2 13.3 9.2 6.7
25-29 15.7 17.8 16.6 14.0
30-34 16.3 16.1 17.7 16.3
35-39 13.2 12.6 15.2 16.2
40-44 10.8 11.5 12.0 14.0
45-49 8.5 8.5 8.3 10.7
50-54 6.4 6.5 7.1 7.8
55-59 4.2 4.5 4.9 4.9
60-64 2.8 2.9 3.3 3.9
65 above 2.5 3.1 3.8 4.3
Total 100.00 100.00 100.0 100.0
Total numbers 1,736,936 2,326,319 3,335,086 4,438,432
9 MEAN AGE AT FIRST MARRIAGE
9.1 In a community where almost all births occur in marriage, the age at first
marriage would have a strong influence on the level of fertility which in

20th Population Census Conference,19 – 21 June, 2002,Ulaanbaatar, Mongolia
Demographic Trends In Malaysia With Special Focus On Women
22
turn will affect the age structure of the population. Between 1970 and
2000, the mean age at first marriage in Malaysia increased for both sexes.
Overall, the mean age increased form 23.8 years in 1970 to 26.9 years by
the year 2000 as shown in Table 10.
Table 10: Mean Age at Marriage by Sex 1970,1980,1991 and 20001
Years Males Females Total
1970 25.6 22.1 23.8
1980 26.6 23.5 25.0
1991 28.2 24.7 26.4
2000 28.6 25.1 26.9
9.2 In 1970, males were marrying at an average age of 25.6 years, some three
and a half years older than their female counterparts, that is, 22.1 years.
The corresponding average age at marriage for males and females in 1980
was 26.6 and 23.5 years respectively. The increase in the postponement of
marriage for males and females was more noticeable in the rural areas than
in the urban areas. In the rural areas, an increase of 1.9 years for males and
1.1 years for females was observed. A rise in the average age at first
marriage would be a contributory factor in the decline of fertility levels
which subsequently would lead to a smaller proportion of the population at
the younger ages.
1 The calculation is based on those in the 15-54 age group

20th Population Census Conference,19 – 21 June, 2002,Ulaanbaatar, Mongolia
Demographic Trends In Malaysia With Special Focus On Women
23
10 CONCLUSION
Official statistics play an important role in monitoring women’s demographic trends
within the country. The demographic trends explored from this report has looked at
patterns which is characterised by marginal differences between men an women of
varying ages. It also looked at birth rates, death rates, fertility, mean and median ages,
sex ratio, dependency ratio and marital status.
It is recognised that Malaysia will continue to grow at a gradual rate of 2.0% per year.
With women forming half of the total population of the country, these are some of the
important aspects that need to be monitored for the country’s continued development,
growth and progress.
Rabieyah Mat & Roszaini Omar Department of Statistics Putrajaya, Malaysia June, 2002.
20th Population Census Conference,19 – 21 June, 2002,Ulaanbaatar, Mongolia APPENDIX 1
Demographic Trends In Malaysia With Special Focus On Women
1
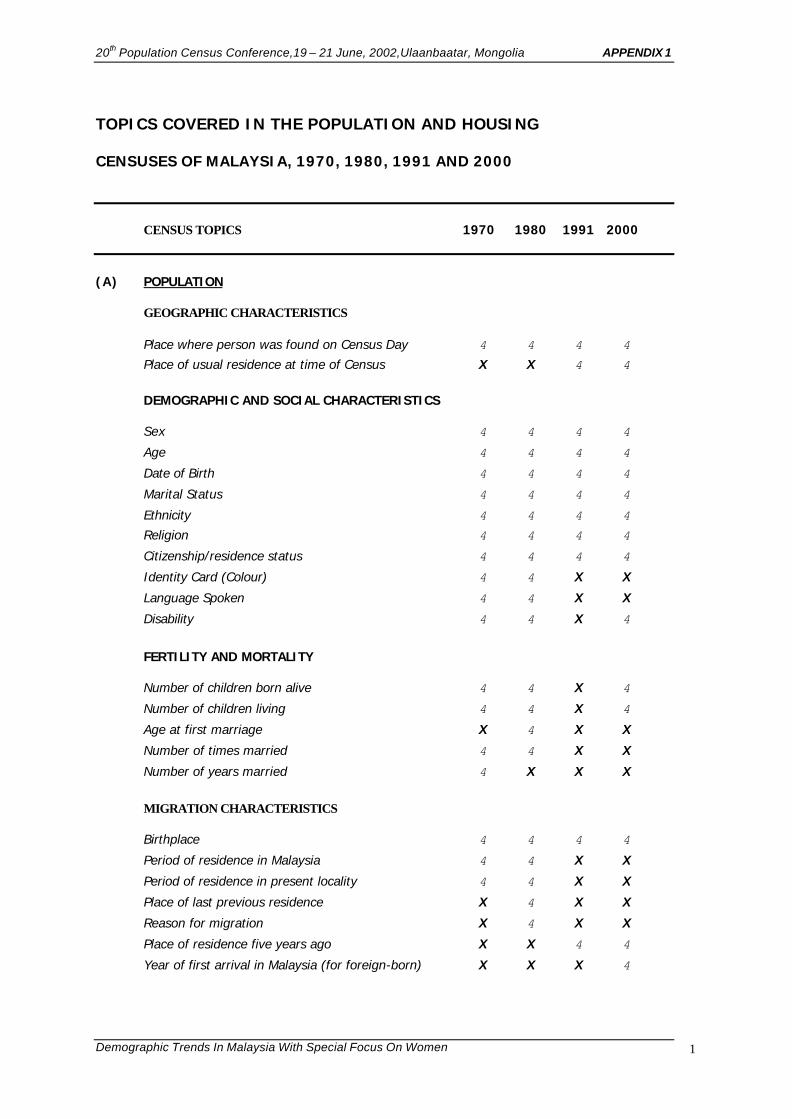
TOPICS COVERED IN THE POPULATION AND HOUSING
CENSUSES OF MALAYSIA, 1970, 1980, 1991 AND 2000
CENSUS TOPICS 1970 1980 1991 2000
(A) POPULATION
GEOGRAPHIC CHARACTERISTICS
Place where person was found on Census Day 4 4 4 4
Place of usual residence at time of Census X X 4 4
DEMOGRAPHIC AND SOCIAL CHARACTERISTICS Sex 4 4 4 4
Age 4 4 4 4
Date of Birth 4 4 4 4
Marital Status 4 4 4 4
Ethnicity 4 4 4 4
Religion 4 4 4 4
Citizenship/residence status 4 4 4 4
Identity Card (Colour) 4 4 X X
Language Spoken 4 4 X X
Disability 4 4 X 4
FERTILITY AND MORTALITY Number of children born alive 4 4 X 4
Number of children living 4 4 X 4
Age at first marriage X 4 X X
Number of times married 4 4 X X
Number of years married 4 X X X
MIGRATION CHARACTERISTICS Birthplace 4 4 4 4
Period of residence in Malaysia 4 4 X X
Period of residence in present locality 4 4 X X
Place of last previous residence X 4 X X
Reason for migration X 4 X X
Place of residence five years ago X X 4 4
Year of first arrival in Malaysia (for foreign-born) X X X 4

20th Population Census Conference,19 – 21 June, 2002,Ulaanbaatar, Mongolia APPENDIX 1
Demographic Trends In Malaysia With Special Focus On Women
2
CENSUS TOPICS 1970 1980 1991 2000
EDUCATION CHARACTERISTICS
Literacy 4 4 X 4
School attendance 4 4 4 4
Highest level of schooling attained 4 4 4 4
Highest educational certificate obtained 4 4 4 4
Vocational training X 4 X X
Field of study X X X 4
ECONOMIC CHARACTERISTICS
Type of economic activity (during previous week) 4 4 4 4
Number of hours worked (during previous week) X X 4 4
Type of economic activity (during last twelve months) 4 4 X X Occupation 4 4 4 4
Industry 4 4 4 4
Employment status 4 4 4 4
Employment Sector (Government/Private/Own) X X X 4
(B) HOUSEHOLD HOUSEHOLD CHARACTERISTICS Relationship to head of household 4 4 4 4
Number of persons in household 4 4 4 4
Type of occupancy 4 X X X
Rent (furnished/unfurnished) 4 X X 4
Main cooking fuel 4 X X X Household equipment 4 4
(a) 4
(a) 4
(a)
Household income 4 4 X X
(a) This topic was canvassed in the household section of the questionnaire in the Population Census. (C) LIVING QUARTERS
Location of living quarters 4 4 4 4
Type of living quarters 4 4 4 4
Type of foundation 4 X X X
Construction material of outer walls 4 4 4 4
Construction material of roof 4 4 X X
Condition 4 4 X X

20th Population Census Conference,19 – 21 June, 2002,Ulaanbaatar, Mongolia APPENDIX 1
Demographic Trends In Malaysia With Special Focus On Women
3
CENSUS TOPICS 1970 1980 1991 2000
Occupancy status 4 4 X 4 Year (period) of construction 4 4 4 X
Type of ownership (tenure) 4 4 4 4
Rent (furnished/unfurnished) 4 X 4 4
Type of water supply 4 4 4 4
Type of lighting 4 4 4 4
Type of toilet facility 4 4 4 4
Bathing facility 4 4 X X
Cooking facility 4 4 X X
Main cooking fuel 4 X X X
No of bedrooms 4 4 X 4
Garbage collection facility X X X 4
Number of persons (occupants) 4 4 4 4
Number of households 4 4 4 4