Embed Size (px)
Citation preview

Demographics and Performance in New York City's School Networks
An Initial Inquiry
ABOUT THE AUTHORS
Norm Fruchter is a principal associate and Christina Mokhtar is a principal research associate at
the Annenberg Institute for School Reform at Brown University. Toi Sin Arvidsson is a doctoral
student at Teachers College, Columbia University. The late John Beam was principal analyst at
Pumphouse Projects. Warren Simmons, executive director of the Annenberg Institute, wrote the
Introduction “Reflections on National Significance.”
ACKNOWLEDGMENTS
We are grateful for the help, critiques, and support provided by Ray Domanico and Asa Wilkes at
the New York City Independent Budget office, Jason Becker at Allovue, and Rosann Tung and
Megan Hester at the Annenberg Institute for School Reform. Participants in Leslie Santee
Siskin’s New York University seminar on high school research offered many useful suggestions.
Our colleague John Beam’s analyses of New York City principals’ evaluations of their networks
sparked our initial efforts. His death, on November 11, 2014, when this study was nearing com-
pletion, ended many decades of commitment to improving learning and living conditions across
New York City’s struggling neighborhoods.
ABOUT THE ANNENBERG INSTITUTE FOR SCHOOL REFORM AT BROWN UNIVERSITY
The Annenberg Institute for School Reform (AISR) is a national policy-research and reform-sup-
port organization, affiliated with Brown University, that focuses on improving conditions and
outcomes for all students in urban public schools, especially those attended by traditionally
underserved children. AISR’s vision is the transformation of traditional school systems into
“smart education systems” that develop and integrate high-quality learning opportunities in all
areas of students’ lives – at school, at home, and in the community. AISR conducts research;
works with a variety of partners committed to educational improvement to build capacity in
school districts and communities; and shares its work through print and Web publications.
© 2015 Brown University, Annenberg Institute for School Reform
SUGGESTED CITATION
Demographics and Performance in New York City's School Networks: An Initial Inquiry. 2015. Fruchter, N., T. S. Arvidsson, C. Mokhtar, J. Beam, and W. Simmons. Providence, RI: Brown University, AnnenbergInstitute for School Reform.
Norm Fruchter
Toi Sin Arvidsson
Christina Mokhtar
John Beam
with an introduction by
Warren Simmons
Demographics and Performance in New York City's School Networks
An Initial Inquiry
Contents
1 Executive Summary
4 Reflections on National Significance
9 About the New York City Networks Study
10 History of School Networks in New York City
14 Findings: Network Demographics
18 Findings: Academic Outcomes
33 Conclusions
34 References
36 Appendix
Annenberg Institute for School Reform 1
Reflections on National Significance
Large urban districts across the United States face an often-daunting challenge: Whatkind of system will best administer and support schools with widely differing needs andresult in high achievement for all the city’s students? New York City is no exception. Thecity’s current school support system – the Children First Networks (CFNs) – organizedschools into non-geographic networks that aimed to preserve school autonomy by pro-viding instructional support that was separate from supervision. Supporters of this systemalso anticipated that spreading out the networks geographically would break the relation-ship between demographics and student achievement. Our study found that while someprincipals and educators felt that the CFNs have successfully supported their needs, thenetworks have not been very successful in meeting the needs of students and communi-ties. Student and school demographics are still the best predictor of student and schooloutcomes. The lessons from New York City’s experiment are not only highly relevant tothe new city administration, but can also help inform similar discussions in other cities.
Research by the University of Chicago Consortium on Chicago School Research and theexperiences of New York City and London support the idea that effective professionallearning communities must be firmly anchored in local neighborhoods and organizedaround the needs of students and their communities. This builds the capacity of educatorsto get to know their students well and reflect their aspirations and needs; allows for thecreation of multiple pathways to learning through internships and other local partner-ships; encourages parental involvement in support of learning; takes advantage of the cul-tural capital of communities; and strengthens communities, along with many otherbenefits. This approach is consistent with AISR’s concept of a smart education system – ahigh-functioning district working with local community partners to provide a comprehen-sive web of supports for children and families and foster high levels of learning anddevelopment.
Another characteristic of the CFNs is the high degree of autonomy of schools. But auton-omy, per se, is no guarantee of improved performance – it may work well for schools thatalready have high capacity, but is less successful for struggling schools. Even strongschools have many needs that are beyond their control, and many are under-resourced.
Communities welcome chances to pursue some learning opportunities in distant loca-tions, but most of all what they want is strong neighborhood schools. Pursuing innovationand choice, some initiatives have undermined the quality of local schools, particularly inpoor neighborhoods. Future investment in school support networks and professional
Executive Summary
2 Demographics and Performance in New York City's School Networks: An Initial Inquiry
learning communities should allow for innovations, including technology, that can facili-tate exploration and collaboration without putting an excessive burden on the pooreststudents and on educators and network staff forced to travel far from their neighborhoods.But to effectively address the pernicious achievement and opportunity gaps that plagueour educational systems, future investments must focus on supports that will create thriv-ing schools with a firm anchor in thriving communities.
About the Study and the History of School Networks in New York City
How to structure the New York City school system so that it most effectively administersand supports its schools and students has been a contentious issue for decades – witnessthe progression of governance and structural changes from community control to decen-tralization to autonomy to market-based choice. From 2003 to 2012, the administrationof Mayor Michael Bloomberg implemented major structural changes in the New York Cityschool system and invested great hopes in the potential of those changes to improve stu-dent academic performance.
One of the previous administration’s critical structural changes was the formation of asso-ciational, rather than geographic, networks of schools. The city system is now organizedinto fifty-five Children First Networks (CFNs) that provide instructional and operationalsupport to their member schools. Though these networks offer the bulk of the system’sinstructional and administrative support to the city’s schools, very little public informationabout the networks’ student and school composition or their academic effectiveness hasbeen available.
Given the recent changes in city government and school system leadership, as well as theneed for more information about this relatively new school support structure, the Annen-berg Institute for School Reform at Brown University undertook and funded this researchstudy in 2012 to explore several issues critical to the networks’ continued existence. Wehope our study informs discussion about the best way to organize school systems toimprove outcomes for all the city’s students. We also hope our findings will be useful toother cities across the nation facing the same challenges.1
The study addressed two research questions:
• What are the patterns of student demographics – race/ethnicity, poverty, special edu-cation, English language learner (ELL) status, and student performance – within andacross the school system’s CFNs and their member schools?
• What do the CFNs contribute to the academic outcomes of their member schools?
1 The study was fullyfunded by the AnnenbergInstitute.
About the Study and the History of School Networks in New York City
Annenberg Institute for School Reform 3
Findings: Network Demographics
The CFNs vary considerably in terms of member schools’ size, enrollment, grade levelsserved, and race/ethnicity. When we compared the extent of segregation in the networksto the extent of segregation in the community school districts in 2002, the year beforethat systemic organizational structure was terminated, we found that the CFNs in 2012were less racially/ethnically segregated at the elementary and middle school levels thanthe community school districts were in 2002. This reduction in segregation probablyreflects the non-geographic nature of network membership.
Findings: Academic Outcomes
We analyzed the variations in the CFNs’ compositional factors (network size, mix ofschools, and student demographics), and computed a series of academic outcomesacross the networks. We analyzed the variance in academic performance across the net-works, and considered the relationship between network choice student demographic,and student academic performance. Our findings are:
• Choice of network is associated with school-level academic performance, but not veryrobustly.
• School-level student demographics predict academic performance far more stronglythan network membership does.
• When key student demographic variables – such as poverty and the percentages ofEnglish language learners and students with disabilities – are held constant at the city-wide average, network membership has very little effect on student academic per-formance, except possibly for high school graduation rates.2
2 In the month before thisstudy was released, theNew York City SchoolsChancellor announced anew systemic policy thatmade school districtsuperintendents respon-sible for supportingschools and holdingthem accountable forresults and that dis-solved the Children FirstNetworks.

4 Demographics and Performance in New York City's School Networks: An Initial Inquiry
Large urban districts across the United States face an often-daunting challenge: Whatkind of system will best administer and support schools with widely differing needs andcapacities, ultimately resulting in high achievement for all the city’s students? Does a sys-tem better support its residents if it is geographically organized, or should students andschools have broad access to high-quality options outside of their neighborhoods? Shouldschools have a high degree of autonomy to decide what works best for them, or shouldaccountability and support systems be more centralized? Should systems that holdschools accountable be separate from systems that provide schools with support, orshould they be unified?
New York City has debated these issues for decades. The latest choice of the administra-tion of Michael Bloomberg and Joel Klein was a system – the Children First Networks(CFNs) – that was non-geographically based, that granted a high level of autonomy toschools, and that separated accountability and support systems. The lessons from thisexperiment are not only highly relevant to the new administration in New York City, butcan also help inform similar discussions in other cities.
This report shares findings from a study undertaken on the CFNs by the Annenberg Insti-tute for School Reform (AISR). While some principals and educators have expressed satis-faction with the way the CFNs have supported their needs, this study showed that thenetworks have not been very successful at meeting the needs of students and communi-ties. They have little impact, on average, on student achievement or school performance.Student demographics – that old, persistent, inequitable gateway to life opportunities –still seems, according to the findings, to be the best predictor of student and school out-comes. The CFNs aimed to break the links between student demographics and academicoutcomes, but they have not succeeded in doing that. In this introduction to the report, Iwould like to take a deeper look at why that might be.
Creating the Right Kind of Professional Learning Communities
Research supports the effectiveness of some professional learning communities (PLCs) toimprove student learning. But what kind of professional networks contribute to studentgains? Our study found little evidence-based rationale behind the characteristics of eachCFN – educational level and size of schools served or level of student need – or the wayprincipals choose networks – often by perceived common interests or ties among princi-pals and educators. The interests of administrators and educators must be balanced withthe business of schools, which is to educate young people. Network resources should bedevoted to and organized around the needs of students and their communities, especiallyin an era where city budgets are more and more limited.
Reflections on National SignificanceIntroduction to the New York City Networks Study by Warren Simmons, Executive Director, Annenberg Institute for School Reform at Brown University

Annenberg Institute for School Reform 5
AISR’s two decades of research and experience supporting excellence and equity inurban public education suggest that the most successful school systems have deep ties tothe neighborhoods they serve. This helps build the capacity of educators to get to knowtheir students well and reflect their aspirations and needs, allows for the creation of mul-tiple pathways to learning through internships and other local partnerships, encouragesparental involvement in support of learning, takes advantage of the cul-tural capital of communities, and strengthens communities, along withmany other benefits. Some approaches to school support networks, likePromise Neighborhoods,3 the Strive network,4 and the communityschools model5 are built around this recognition. This approach is consis-tent with AISR’s concept of a smart education system – a high-functioningdistrict working with local community partners to provide a comprehen-sive web of supports for children and families and foster high levels of learning anddevelopment. Such a system places children and families at the center, involves cross-sector partnerships, aims at improving a broad set of outcomes for students and families,and involves shared accountability for improving those outcomes.
Geographical vs. Non-geographical Networks
The tension between neighborhood schools and non-geographically based learningoptions is not new. Strategies like busing and magnet schools have sought to create morehigh-quality choices for students and families, but have often met with resistance, sincethey place greater burdens on the students who must travel the farthest. They also fail totake advantage of community-based assets; make it harder for teachers to get to knowtheir students; and make it harder for parents and community residents to participate intheir children’s schooling and hold the educational system accountable.
Networks of support for schools that are spread out geographically, like New York’s CFNs,run into similar problems. In the section on the History of School Networks in New YorkCity, this report cites some of the concerns of former chair of the New York City Council’sEducation Committee, Robert Jackson, that network staff lose too much time travelingbetween schools and that parents have no place in their community to engage networkstaff. The lack of a geographic network shuts out parents – when there is no physical loca-tion to go to and the networks cover large geographic distances, there is little visibility,accessibility, and transparency.
There is strong evidence that the best professional networks for education are deeplyembedded in local communities. Research by the University of Chicago Consortium onChicago School Research (CCSR) identified strong professional learning communities andparent-community ties as two of the five essential supports and community resources thatfacilitate school improvement and contribute to improvements in student learning, butnote that community resources are often weakest in high-needs neighborhoods (Sebringet al. 2006). Reform efforts that disrupt neighborhood ties are in danger of even furthereroding those potential supports.
3 See McAfee and Torre 2015, and http:// promiseneighborhoodsinstitute.org/.
4 See http://www.strivetogether.org/.
5 See http://www.communityschools.org/.
6 Demographics and Performance in New York City's School Networks: An Initial Inquiry
Research on school reform efforts in New York City and London show that schools dobest when the social and political capital of communities are accessed. In a 2007 AISRstudy of thirteen New York City Schools that succeeded in preparing low-performing stu-dents for graduation and college, Carol Ascher and Cindy Maguire (2007) found that thebeat-the-odds schools rely on local community assets to maintain high expectations forcollege:
Parents are involved in college planning through workshops on testing, collegerequirements, and financial aid. Relationships with local community-based organiza-tions provide an array of critical resources, from student internships to help with col-lege essays. (p. viii)
The BTO schools collaborated with local community-based organizations, where stu-dents were able to participate�in service learning and the kinds of extracurricularactivities and community service opportunities valued by admissions officers – tradi-tionally more available to middle-class students. (p. 11)
Another AISR project, the Transatlantic School Innovation Alliance (TSIA), aimed toimprove teaching, learning, and educational leadership by creating a peer network ofprincipals and practitioners in urban secondary schools in the United States and England.A 2011 TSIA report found that “the most successful schools in London are not isolatedand separate from their local community and other schools but actively encourage andembrace interaction with others” (Mishook, McAlister & Edge 2011, p. 8).
An issue of AISR’s journal Voices in Urban Education (VUE), “A Smart System in London,”examined how Tower Hamlets, a local education authority (equivalent to a U.S. schooldistrict), in the TSIA study that serves a high percentage of immigrants and low-incomestudents, has been highly successful across a range of health, social, educational, andeconomic indicators. Strong and intentional local community partnerships, coordinatedneighborhood services, family involvement and training, home visits, and service deliverymonitoring are some of the key features of the Tower Hamlets system (Rothman 2008).
In contrast, structural efforts to support schools in New York City over the period of theBloomberg administration, particularly Children First Networks, have in some waysundermined the community assets associated with geographic organization. AISR’s 2011TSIA report found, for instance:
The repeated shifts in the support structure since 2002 may have disrupted informalgeographically based networks that previously existed. . . . Principals had no mecha-nisms for learning from or working with nearby schools facing the same neighborhoodissues and serving similar populations. The strategy of replacing large traditional highschools with small themed schools has meant the recruitment of hundreds of newprincipals and assistant principals spread across the city, a growing proportion ofwhom are recruited from fields other than education and have few relationships withother school leaders. (Mishook, McAlister & Edge 2011, pp. 13–14)

Annenberg Institute for School Reform 7
Autonomy: Not a Silver Bullet
Another key feature of New York City’s CFNs is the high degree of autonomy granted toschools and the separation of support functions from monitoring and accountability func-tions. Autonomy, per se, is no guarantee of improved performance – it may work well forschools that already have high capacity, but is less successful for struggling schools. TheTSIA report found (Mishook, McAlister & Edge 2011):
Network leaders serve at the pleasure of principals and have no formal authority overthem. Critics note that that this approach might be insufficient to develop the capacityof new principals and new teachers. . . . While experienced principals may benefitfrom autonomy, the hundreds of new principals and tens of thousands of new teachersmight require more direction and guidance. (p. 13)
The multiple reorganizations of that school system have, on the one hand, increasedindividual school autonomy and accountability, while at the same time dismantlingmany of the older structures that allowed and even encouraged schools to shareknowledge and best practices. This movement from a more collaborative to a morecompetitive system has produced real tradeoffs. (p. 17)
Schools – even high-capacity ones – can’t solve all problems on their own. The BTOstudy on New York City beat-the-odds schools (Ascher & Maguire 2007) found:
The BTO schools we investigated in our qualitative study should be considered strongschools – high administrative capacity to develop and sustain critical academic pro-gramming was reflected in high student achievement. Some BTO principals appreci-ated the increased autonomy they had experienced over the past several years, sayingit had allowed them to design curriculum and other interventions to meet the needs oftheir students. But they didn’t believe that they could solve every problem internally.(p. 14)
The New York City Department of Education has decentralized budgetary decisionmaking to the school level. But some BTO schools do not have adequate resources,and state or district mandates interfere with their ability to allocate scarce resources toaddress school needs. (p. viii)
Investing in the Future
New York City, like any large city, is composed of neighborhoods with substantial socialand cultural differences. And, like other large cities, it has struggled with how to organizeits education system to balance the need for schools to support each other with the needfor schools to support their students and families. The previous structure of geographicallybased Community School Districts attempted to locate control in neighborhoods acrossthe city, on the assumption that schools governed locally would build professional capac-ity more responsive to their communities. That assumption turned out to be wrong. TheChildren First Networks dissolved the geographical ties among schools on the assumptionthat this would reduce the influence of demographics on student achievement. Thatassumption also turned out to be wrong.

8 Demographics and Performance in New York City's School Networks: An Initial Inquiry
What is the solution? AISR’s work leads us to believe that transforming our nation’s urbanpublic schools at scale cannot be achieved without a strong anchor in local communities.Demands that we let students – or educators, or schools – pursue high-quality opportuni-ties no matter where they are located make sense when many students are trapped inlow-performing neighborhood schools. But surely behind these demands is the realitythat what we really want is to create high-quality opportunities in every neighborhoodand respect local values, needs, and aspirations. In the name of innovation and choice,some initiatives have undermined the quality of neighborhood schools, particularly inpoor neighborhoods.
Many great learning opportunities can still work over distance. Young people from less-privileged neighborhoods should have ample access to these opportunities, and princi-pals and educators should have the necessary time and resources to engage in livelyprofessional networks with their peers in other locations. Investment in innovation zonesshould include technology that allows exploration and collaboration without necessarilytraveling long distances. But above all, cities, states, the federal government, and theirpartners, when they are investing in school systems, must focus on the kinds of supportsthat strengthen neighborhood communities and their schools. Without being closely con-nected to thriving communities, schools will wither, and even the best ones can onlyhope to become outposts of learning, lone surviving community assets in ruined land-scapes. As a nation, we can do better.
Annenberg Institute for School Reform 9
How the New York City school system should be structured to most effectively administerand support its schools and students has been a contentious issue for decades – witnessthe progression of governance and structural changes from community control to decen-tralization to autonomy to market-based choice.
As part of its structural reorganization of the New York City school system, the administra-tion of Mayor Michael Bloomberg implemented networks of schools to provide instruc-tional and operational support. Many policymakers, school leaders, and frontlinepractitioners perceive networks as providing more effective school support than the previ-ous community school district structures managed. But many parent leaders, advocates,and elected officials have criticized the lack of network transparency, accessibility, andaccountability, and have decried the limited, diffuse, and differentiated nature of supportsthat networks provide.6 Though the city’s schools are currently organized into fifty-fiveChildren First Networks (CFNs), we know very little about the networks’ student demo-graphics and academic performance, and even less about whatever effects the networksmight have on student academic outcomes. Therefore this initial study seeks to explorethe following questions:
• What are the patterns of student demographics – race/ethnicity, poverty, special edu-cation, and English language learner (ELL) status – and student performance withinand across the school system’s CFNs?
• What do the networks contribute to the academic outcomes of their member schools?
Given the recent changes in mayoral and school system leadership, this seems an appro-priate moment to investigate the demographics and the achievement outcomes of theschool system’s networks. The Annenberg Institute for School Reform at Brown University,building on its years of work in New York City in support of various education initiatives,undertook and funded this research study in 2012 to explore several issues critical to thenetworks’ efforts. We hope to inform discussions about the best way to organize schoolsystems so that they improve conditions and outcomes for all the City’s students. We alsohope our findings will be useful to other cities across the nation facing the same chal-lenges.
About the New York City Networks Study
6 At an October 2013 con-ference sponsored by theOffice of the PublicAdvocate for New YorkCity and the AnnenbergInstitute for SchoolReform at Brown Univer-sity, a recommendationto terminate the networkstructure received almostunanimous support fromthe attendees. Con-versely, more than a hun-dred principals wrotethen-Mayor-elect Bill deBlasio in November 2013urging the networks’continuation (Decker &Wall 2013).
10 Demographics and Performance in New York City's School Networks: An Initial Inquiry
Until recently, the New York City school system was organized by geography rather thanby networks of associated schools. From 1970 to 2003, the city’s elementary and middleschools were administered by thirty-two geographically based community school districts(CSDs).7 Schools within each district varied considerably in student composition, size,educational philosophy, instructional practice, and student outcomes. School district geo-graphic boundaries often yoked together very different schools serving very differentneighborhoods.
The network as a structural concept was initiated in 1994, through a grant from theAnnenberg Foundation of $25 million to the New York Networks for School Renewal(NYNSR).8 NYNSR was composed of four school reform organizations – New Visions forPublic Schools, the Center for Educational Innovation, the Center for Collaborative Edu-cation, and the Association of Community Organizations for Reform Now (ACORN).9
NYNSR’s founding proposal to the Annenberg Foundation pledged to create more than100 small schools, “organized according to a set of principles that stressed small size,autonomy, personalization, and the formation of professional teaching communities. Theproposal envisioned that the participating schools would form networks for mutual sup-port and accountability, and that eventually, a Learning Zone would be establishedthrough which successful networks could demonstrate new forms of school organization,administration, and governance for the New York City school system” (Institute for Educa-tion and Social Policy 2001, p. 1).
Through the resulting five-year (1996–2001) effort, “NYNSR created, restructured, or reor-ganized almost 140 schools serving almost 50,000 students” (IESP 2001, p. 33). Testscores and graduation rates at NYNSR schools exceeded citywide averages, and longitu-dinal achievement gains at member schools topped the performance of comparisonschools. Other analyses indicated that NYNSR small schools were more cost-effectivethan comparison schools (Stiefel et al. 2000, p. 22, 27–39).
The 140 NYNSR schools were grouped into networks managed by the four sponsororganizations, and each sponsor distributed discretionary funding from the AnnenbergFoundation to their member schools. But the pressures of creating new schools, the lim-ited funding available for the entire effort,10 and the lack of sustained school system sup-port combined to marginalize the networks’ efforts. The concept of a Learning Zone thatschools could choose to join, and within which schools would be granted autonomyfrom administrative constraints in exchange for producing positive student outcomes, sur-vived the NYNSR experiment. Several leaders of successful NYNSR schools helpeddevelop an equivalent zone as the school system was reorganized during the subsequentdecade.
7 New York City’s highschools were centrallyadministered.
8 This grant was part of theAnnenberg Challenge, a$500 million initiative byAmbassador Walter H.Annenberg consisting ofeighteen projects inthirty-five states. TheAnnenberg Foundationalso provided a grant tothe Annenberg Institutefor School Reform tocoordinate Challengeactivities. See http://annenberginstitute.org/challenge/about/about.html.
9 The New York ACORNchapter has beenreplaced by the New YorkCommunities for Change.See http://www.nycommunities.org/.
10 If the entire AnnenbergFoundation grant hadbeen allocated exclusivelyto support NYNSR’smember schools, only$35,000 per schoolwould have been avail-able to participatingschools in each of thefive project years. Lesswas actually availablebecause of the project’sadministrative costs.
History of School Networks in New York City
Annenberg Institute for School Reform 11
In 2002, with Michael Bloomberg as New York City’s new mayor, the New York State leg-islature passed a mayoral control law that transformed the city school system into a citydepartment, thereby abolishing the thirty-two locally elected community school boardsand terminating their powers over the community school districts. The new law alsoseverely limited the power of the citywide Board of Education, which was renamed thePanel for Educational Policy.11
Mayor Bloomberg and New York City Department of Education Chancellor Joel Klein ini-tiated massive structural change that consolidated the city system into ten geographicregions, organized primarily to provide instructional support. Each of the ten regions washeaded by a superintendent who supervised a team of some ten to twelve local instruc-tional superintendents, who each provided instructional support to ten to twelve schools.Six borough-based Regional Operations Centers were established to help schools dealwith logistical, fiscal, personnel, and other management issues.
In 2004, Chancellor Klein initiated the Autonomy Zone, a pilot effort similar to NYNSR’sproposed Learning Zone, in which twenty-nine school principals and the directors ofthree charter schools signed performance agreements that held those schools accountablefor meeting student academic performance targets in exchange for the power to makecritical decisions at the school level “about staffing, scheduling, curricula, instruction,and assessment that had typically been determined by central office” (Nadelstern 2012).In 2005, the Autonomy Zone grew to include forty-eight schools.
In 2006, Chancellor Klein expanded the option of joining the Autonomy Zone to all thesystem’s schools, and some 330 principals chose to participate. The Autonomy Zone wasrenamed the Empowerment Schools Project. Participating principals formed networks ofapproximately twenty-five schools each and hired instructional leaders to guide their net-works’ development. Because the Regional Operations Centers that provided fiscal, man-agement, and logistics support were still borough-based, the Empowerment SchoolsProject created Integrated Service Centers to provide support to member schools.
In 2007, the citywide regional structure, through which all the system’s schools had beenadministered (other than those participating in the Empowerment Schools Project), wasdissolved. The system’s principals were asked to join one of three types of school supportorganizations:
• the Empowerment Support Organization, another relabeling of the original AutonomyZone;
• one of four citywide Learning Support Organizations (LSOs) developed within theNew York City Department of Education (DOE) and offering assistance, support, andoversight; or
• one of six Partnership School Organizations (PSOs) managed by external schoolreform nonprofits or universities, which also offered varieties of support.
Each of these school support organizations grouped their participating schools into net-works – essentially teams of instructional coaches supporting groups of schools, some-times sharing an educational philosophy12 – and schools paid an annual fee to their
11 Norm Fruchter, one ofthe authors of thisreport, serves as a may-oral appointee on thePanel for EducationalPolicy.
12 “The reasons schoolsinitially chose to affiliatewith a specific networkvary greatly. Many net-works remain histori-cally based around aneducational philosophy(e.g., project-basedlearning) or principalswho were previouslysocially networking withtheir colleagues. A fewnetworks were formedbased on geographicproximity; however,most span several bor-oughs. Some networkswere created based onsimilar student popula-tions (e.g., a large num-ber of the specialeducation high schoolsare together in one net-work, as are the schoolsthat target ELL stu-dents). Some networksare grade-level specific,with only a few net-works spanning kinder-garten through grade12.” (Wohlstetter, Smith& Gallagher 2013, p.536) “Some networksare organized around adistinct educational phi-losophy or schoolmodel; others around acommon set of studentneeds; and othersaround strong personalrelationships”(Parthenon Group2013).
12 Demographics and Performance in New York City's School Networks: An Initial Inquiry
support organizations to help defray the cost of services provided. The Regional Opera-tions Centers were terminated, but the Integrated Service Centers continued to providelogistical and management support (Childress et al. 2011).
By 2010, all the system’s schools were reorganized into some fifty-five Children First Net-works (CFNs) and five citywide clusters that supervised the networks’ efforts. The Inte-grated Service Centers were dissolved, and the network teams were expanded to provideboth instructional and operational supports. The DOE developed evaluation metrics toassess the networks’ efforts, and over time, a small number of networks were disbandedand new networks constituted.13 Schools are permitted to change their networks annu-ally. According to the DOE, less than 8 percent of all the networked schools request sucha change each year.
Currently, there are fifty-five CFNs across the city school system, each staffed by (NewYork City Department of Education, n.d.):
• a network leader and a deputy;
• an instructional improvement unit of five achievement coaches, one exclusively forspecial education;
• five management specialists focused on providing support for operations, humanresources and payroll, budget and procurement, data and information technology, andother school logistics;
• three student and family services personnel providing support for special education,youth development, ELLs, and other student issues such as attendance, safety, and dis-cipline.
These networks are the school system’s major form of instructional and operational sup-port to the city’s schools. The DOE’s Office of School Support monitors the networks’ per-formance and provides oversight and support for instructional, administrative, operations,finance, personnel, and facilities issues (New York City Department of Education n.d.).
Aside from a substantial reduction in the cost of school support services, we know littleabout how effectively the CFNs have served the city’s schools.14 On October 25, 2012,Robert Jackson, then the chair of the New York City Council’s Education Committee,introduced a hearing on the DOE’s networks by saying that, since the latest reorganiza-tion in 2010, “very little information about CFNs has been available despite the fact thatCFNs have been the sole support structure for all schools” (City Council, City of NewYork, 2012). Jackson went on to say:
The primary concern has to do with the effectiveness of CFNs as school support struc-tures. Little is known about CFN evaluation, but there appears to be high turnoveramong network staff. Some networks may be more effective than others, but . . . we’veheard repeatedly that some network staff spend too much time traveling betweenschools in networks that are not organized geographically, resulting in less time spenthelping schools. Parents also complain that there is no network office in their commu-
13 “Over the past threeyears (2010–2013), theDOE has closed eightnetworks due to poorperformance andlaunched six new ones intheir place” (Wohlstetter,Smith & Gallagher 2013,p. 5).
14 The city’s IndependentBudget Office (IBO)recently published aSchools Brief showing asubstantial decrease inschool support servicesfrom 2002-2003, theschool year before theBloomberg administra-tion eliminated commu-nity school districts, tothe 2011-2012 schoolyear. In expenditureadjusted for inflation,school support costsreached almost $377 mil-lion in 2003, comparedto $293 million in 2012, a22 percent reduction. Interms of dollars per stu-dent spent on schoolsupport, costs fell from$345 per student in 2002-2003 to $281 per studentin 2011-2012, an almost19 percent reduction(New York City Independ-ent Budget Office 2014,p. 1).
Annenberg Institute for School Reform 13
nity where they can go to meet network staff. We’ve also heard criticism that networkswork primarily with school principals and spend very little time working with teachersor School Leadership Teams. . . . A major concern we’ve heard is the lack of networkaccountability. As one parent leader said, networks are “not held accountable for fail-ures but often celebrated for the successes.” We understand that the DOE has struc-tured CFNs as a choice system, in which principals can switch to a new network ifthey’re not happy with their current one, but this open marketplace approach itselfraises some concerns, as networks are forced to market themselves to schools.
Compounding these concerns was the issue of transparency in the DOE’s management ofits school support networks. At the same hearing, the DOE’s then–chief academic officerand senior deputy chancellor, Shael Polakow-Suransky, while disputing that networkswere not being held accountable, testified that the department should have been moretransparent about the networks’ roles (Cromidas 2012):
The larger point you’re making – “Have we not done a good job sharing with the pub-lic all the information we have and can share?” – is right.
The network structure evolved very swiftly from an initial pilot to a systemwide effort. Lit-tle research seems to have been conducted about critical implementation issues such asthe optimal network size and scale, the most appropriate mix of member schools, and themost effective staffing for school-level instructional support. This study hopes to providemore information and knowledge about the CFNs by exploring two critical issues:
• What are the patterns of student demographics – race/ethnicity, poverty, special edu-cation, English language learner (ELL) status, and student performance – within andacross the school system’s fifty-seven CFNs and their member schools?
• What do the CFNs contribute to the academic outcomes of their member schools?
14 Demographics and Performance in New York City's School Networks: An Initial Inquiry
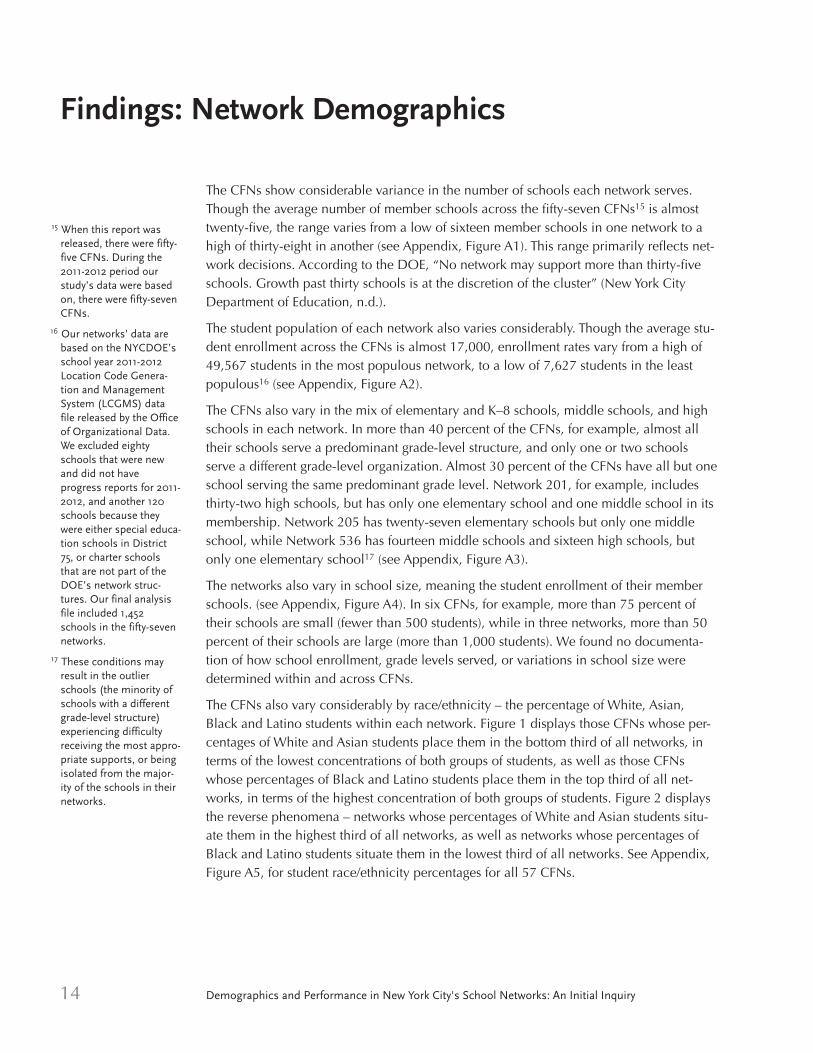
The CFNs show considerable variance in the number of schools each network serves.Though the average number of member schools across the fifty-seven CFNs15 is almosttwenty-five, the range varies from a low of sixteen member schools in one network to ahigh of thirty-eight in another (see Appendix, Figure A1). This range primarily reflects net-work decisions. According to the DOE, “No network may support more than thirty-fiveschools. Growth past thirty schools is at the discretion of the cluster” (New York CityDepartment of Education, n.d.).
The student population of each network also varies considerably. Though the average stu-dent enrollment across the CFNs is almost 17,000, enrollment rates vary from a high of49,567 students in the most populous network, to a low of 7,627 students in the leastpopulous16 (see Appendix, Figure A2).
The CFNs also vary in the mix of elementary and K–8 schools, middle schools, and highschools in each network. In more than 40 percent of the CFNs, for example, almost alltheir schools serve a predominant grade-level structure, and only one or two schoolsserve a different grade-level organization. Almost 30 percent of the CFNs have all but oneschool serving the same predominant grade level. Network 201, for example, includesthirty-two high schools, but has only one elementary school and one middle school in itsmembership. Network 205 has twenty-seven elementary schools but only one middleschool, while Network 536 has fourteen middle schools and sixteen high schools, butonly one elementary school17 (see Appendix, Figure A3).
The networks also vary in school size, meaning the student enrollment of their memberschools. (see Appendix, Figure A4). In six CFNs, for example, more than 75 percent oftheir schools are small (fewer than 500 students), while in three networks, more than 50percent of their schools are large (more than 1,000 students). We found no documenta-tion of how school enrollment, grade levels served, or variations in school size weredetermined within and across CFNs.
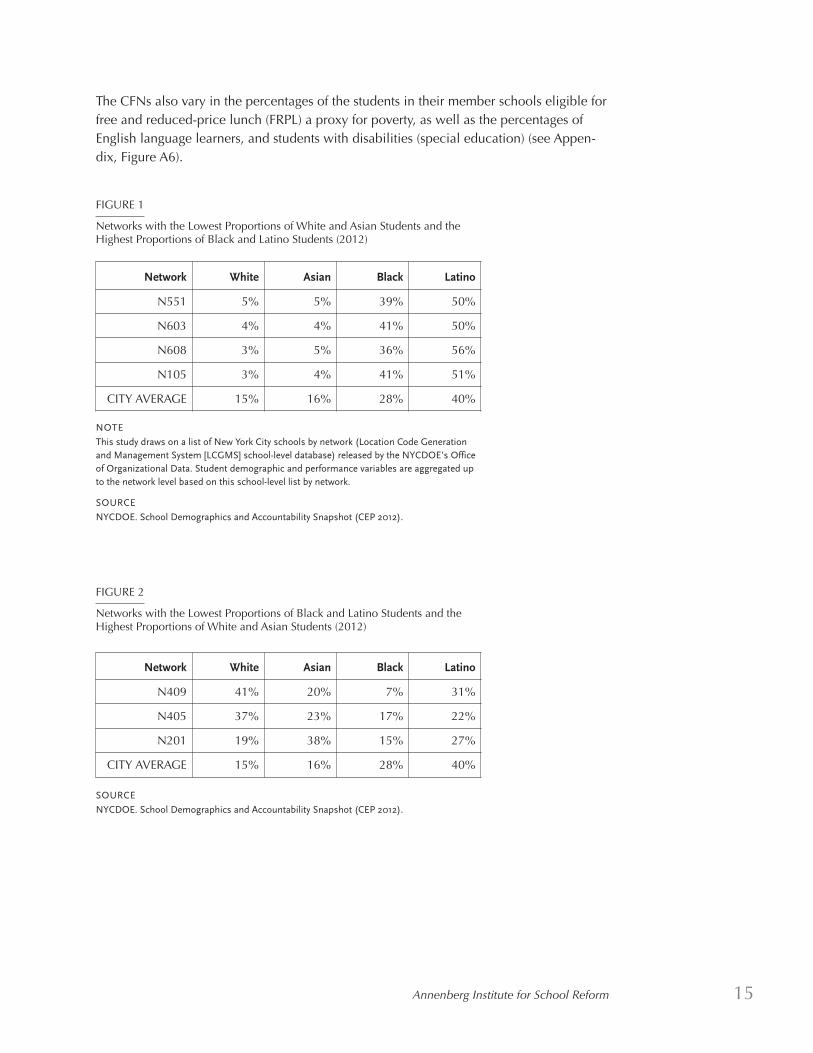
The CFNs also vary considerably by race/ethnicity – the percentage of White, Asian,Black and Latino students within each network. Figure 1 displays those CFNs whose per-centages of White and Asian students place them in the bottom third of all networks, interms of the lowest concentrations of both groups of students, as well as those CFNswhose percentages of Black and Latino students place them in the top third of all net-works, in terms of the highest concentration of both groups of students. Figure 2 displaysthe reverse phenomena – networks whose percentages of White and Asian students situ-ate them in the highest third of all networks, as well as networks whose percentages ofBlack and Latino students situate them in the lowest third of all networks. See Appendix,Figure A5, for student race/ethnicity percentages for all 57 CFNs.
Findings: Network Demographics
15 When this report wasreleased, there were fifty-five CFNs. During the2011-2012 period ourstudy’s data were basedon, there were fifty-sevenCFNs.
16 Our networks’ data arebased on the NYCDOE’sschool year 2011-2012Location Code Genera-tion and ManagementSystem (LCGMS) datafile released by the Officeof Organizational Data.We excluded eightyschools that were newand did not haveprogress reports for 2011-2012, and another 120schools because theywere either special educa-tion schools in District75, or charter schoolsthat are not part of theDOE’s network struc-tures. Our final analysisfile included 1,452schools in the fifty-sevennetworks.
17 These conditions mayresult in the outlierschools (the minority ofschools with a differentgrade-level structure)experiencing difficultyreceiving the most appro-priate supports, or beingisolated from the major-ity of the schools in theirnetworks.
Annenberg Institute for School Reform 15
The CFNs also vary in the percentages of the students in their member schools eligible forfree and reduced-price lunch (FRPL) a proxy for poverty, as well as the percentages ofEnglish language learners, and students with disabilities (special education) (see Appen-dix, Figure A6).
Network White Asian Black Latino
N551 5% 5% 39% 50%
N603 4% 4% 41% 50%
N608 3% 5% 36% 56%
N105 3% 4% 41% 51%
CITY AVERAGE 15% 16% 28% 40%
NOTE
This study draws on a list of New York City schools by network (Location Code Generationand Management System [LCGMS] school-level database) released by the NYCDOE’s Officeof Organizational Data. Student demographic and performance variables are aggregated upto the network level based on this school-level list by network.
SOURCE
NYCDOE. School Demographics and Accountability Snapshot (CEP 2012).
SOURCE
NYCDOE. School Demographics and Accountability Snapshot (CEP 2012).
FIGURE 1
Networks with the Lowest Proportions of White and Asian Students and theHighest Proportions of Black and Latino Students (2012)
FIGURE 2
Networks with the Lowest Proportions of Black and Latino Students and theHighest Proportions of White and Asian Students (2012)
Network White Asian Black Latino
N409 41% 20% 7% 31%
N405 37% 23% 17% 22%
N201 19% 38% 15% 27%
CITY AVERAGE 15% 16% 28% 40%
16 Demographics and Performance in New York City's School Networks: An Initial Inquiry
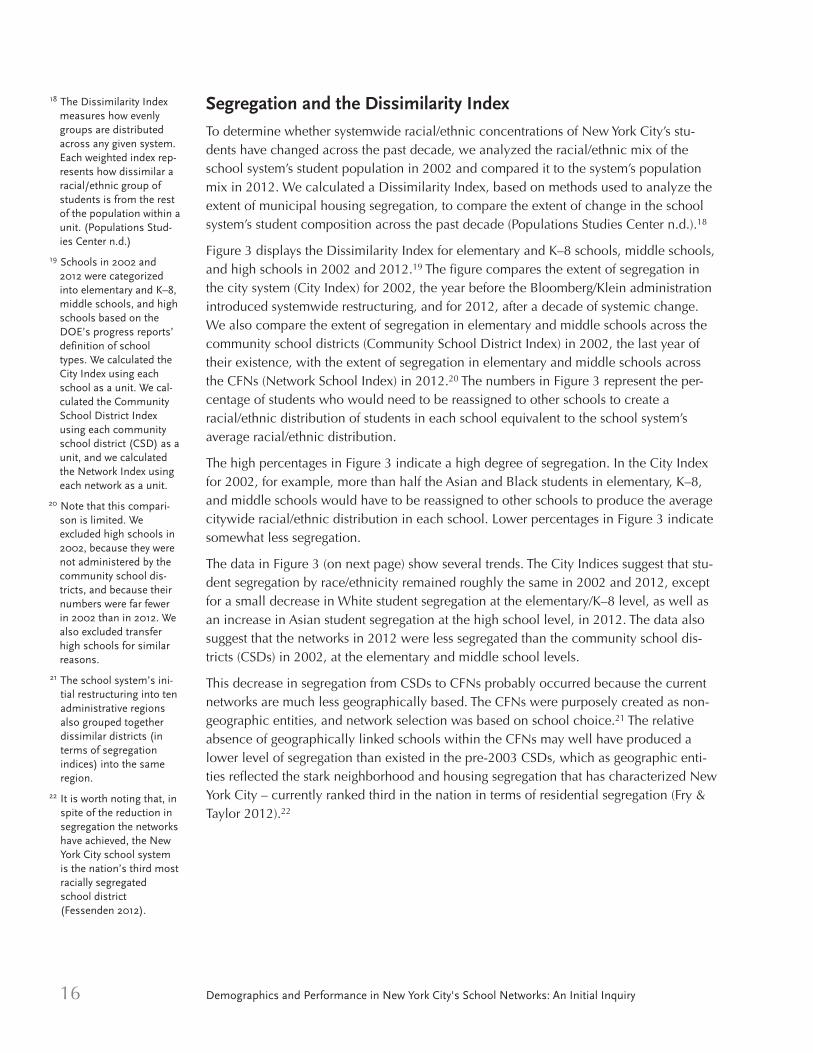
Segregation and the Dissimilarity Index
To determine whether systemwide racial/ethnic concentrations of New York City’s stu-dents have changed across the past decade, we analyzed the racial/ethnic mix of theschool system’s student population in 2002 and compared it to the system’s populationmix in 2012. We calculated a Dissimilarity Index, based on methods used to analyze theextent of municipal housing segregation, to compare the extent of change in the schoolsystem’s student composition across the past decade (Populations Studies Center n.d.).18
Figure 3 displays the Dissimilarity Index for elementary and K–8 schools, middle schools,and high schools in 2002 and 2012.19 The figure compares the extent of segregation inthe city system (City Index) for 2002, the year before the Bloomberg/Klein administrationintroduced systemwide restructuring, and for 2012, after a decade of systemic change.We also compare the extent of segregation in elementary and middle schools across thecommunity school districts (Community School District Index) in 2002, the last year oftheir existence, with the extent of segregation in elementary and middle schools acrossthe CFNs (Network School Index) in 2012.20 The numbers in Figure 3 represent the per-centage of students who would need to be reassigned to other schools to create aracial/ethnic distribution of students in each school equivalent to the school system’saverage racial/ethnic distribution.
The high percentages in Figure 3 indicate a high degree of segregation. In the City Indexfor 2002, for example, more than half the Asian and Black students in elementary, K–8,and middle schools would have to be reassigned to other schools to produce the averagecitywide racial/ethnic distribution in each school. Lower percentages in Figure 3 indicatesomewhat less segregation.
The data in Figure 3 (on next page) show several trends. The City Indices suggest that stu-dent segregation by race/ethnicity remained roughly the same in 2002 and 2012, exceptfor a small decrease in White student segregation at the elementary/K–8 level, as well asan increase in Asian student segregation at the high school level, in 2012. The data alsosuggest that the networks in 2012 were less segregated than the community school dis-tricts (CSDs) in 2002, at the elementary and middle school levels.
This decrease in segregation from CSDs to CFNs probably occurred because the currentnetworks are much less geographically based. The CFNs were purposely created as non-geographic entities, and network selection was based on school choice.21 The relativeabsence of geographically linked schools within the CFNs may well have produced alower level of segregation than existed in the pre-2003 CSDs, which as geographic enti-ties reflected the stark neighborhood and housing segregation that has characterized NewYork City – currently ranked third in the nation in terms of residential segregation (Fry &Taylor 2012).22
18 The Dissimilarity Indexmeasures how evenlygroups are distributedacross any given system.Each weighted index rep-resents how dissimilar aracial/ethnic group ofstudents is from the restof the population within aunit. (Populations Stud-ies Center n.d.)
19 Schools in 2002 and2012 were categorizedinto elementary and K–8,middle schools, and highschools based on theDOE’s progress reports’definition of schooltypes. We calculated theCity Index using eachschool as a unit. We cal-culated the CommunitySchool District Indexusing each communityschool district (CSD) as aunit, and we calculatedthe Network Index usingeach network as a unit.
20 Note that this compari-son is limited. Weexcluded high schools in2002, because they werenot administered by thecommunity school dis-tricts, and because theirnumbers were far fewerin 2002 than in 2012. Wealso excluded transferhigh schools for similarreasons.
21 The school system’s ini-tial restructuring into tenadministrative regionsalso grouped togetherdissimilar districts (interms of segregationindices) into the sameregion.
22 It is worth noting that, inspite of the reduction insegregation the networkshave achieved, the NewYork City school systemis the nation’s third mostracially segregatedschool district (Fessenden 2012).

Annenberg Institute for School Reform 17
Summary of Demographic Findings
Our demographic analyses suggest two conclusions. First, several CFNs have very lownumbers of one school type (defined by grade level) combined with large numbers ofothers. Since these outlier schools have few, if any, similar schools to collaborate with,the supports their networks provide may well be limited.
Second, though the CFNs are quite segregated, they were less segregated at the elemen-tary and middle school levels in 2012 than the community school districts were in 2002.This reduction probably results from the non-geographic nature of network membership,in which schools are linked by education philosophy, shared curricular concentrations,principals’ prior affiliations (particularly with network support staff), similar student popu-lations, or similar grade organizations, rather than by geography.
2002
CITY INDEX
Elementaryand K–8
MiddleSchool
HighSchool
White 69% 63% 56%
Asian 58% 54% 47%
Black 60% 53% 43%
Latino 50% 47% 43%
2012
CITY INDEX
Elementaryand K–8
MiddleSchool
HighSchool
White 65% 63% 57%
Asian 60% 57% 53%
Black 60% 55% 44%
Latino 48% 47% 43%
2002
COMMUNITY SCHOOL
DISTRICT INDEX
Elementaryand K–8
MiddleSchool
*HighSchool
White 49% 52% N/A
Asian 47% 48% N/A
Black 46% 44% N/A
Latino 44% 43% N/A
2012
NETWORK INDEX
Elementaryand K–8
MiddleSchool
HighSchool
White 40% 44% 36%
Asian 34% 37% 38%
Black 33% 34% 27%
Latino 30% 25% 24%
SOURCE
NYCDOE. School Demographics and Accountability Snapshot (CEP 2012).
* High schools in 2002 were centrally administered and not part of thecommunity school district system.
FIGURE 3
Dissimilarity Index in 2002 and in 2012
18
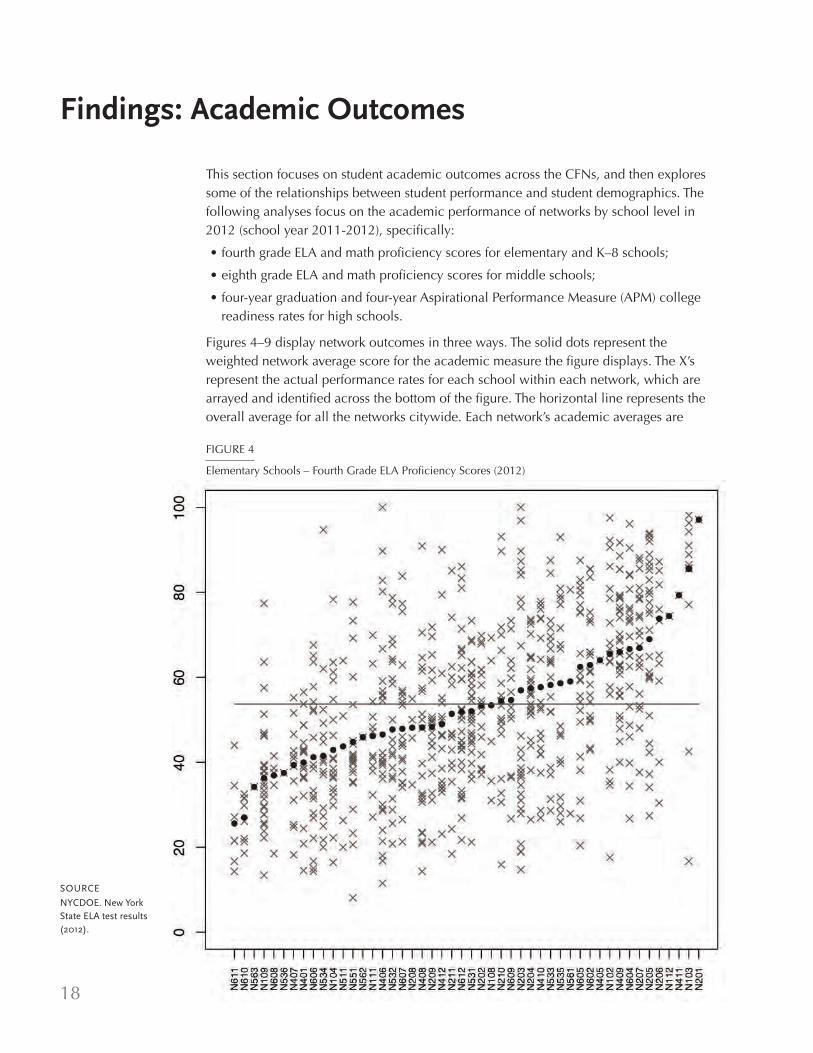
This section focuses on student academic outcomes across the CFNs, and then exploressome of the relationships between student performance and student demographics. Thefollowing analyses focus on the academic performance of networks by school level in2012 (school year 2011-2012), specifically:
• fourth grade ELA and math proficiency scores for elementary and K–8 schools;
• eighth grade ELA and math proficiency scores for middle schools;
• four-year graduation and four-year Aspirational Performance Measure (APM) collegereadiness rates for high schools.
Figures 4–9 display network outcomes in three ways. The solid dots represent theweighted network average score for the academic measure the figure displays. The X’srepresent the actual performance rates for each school within each network, which arearrayed and identified across the bottom of the figure. The horizontal line represents theoverall average for all the networks citywide. Each network’s academic averages are
SOURCE
NYCDOE. New YorkState ELA test results(2012).
FIGURE 4
Elementary Schools – Fourth Grade ELA Proficiency Scores (2012)
Findings: Academic Outcomes
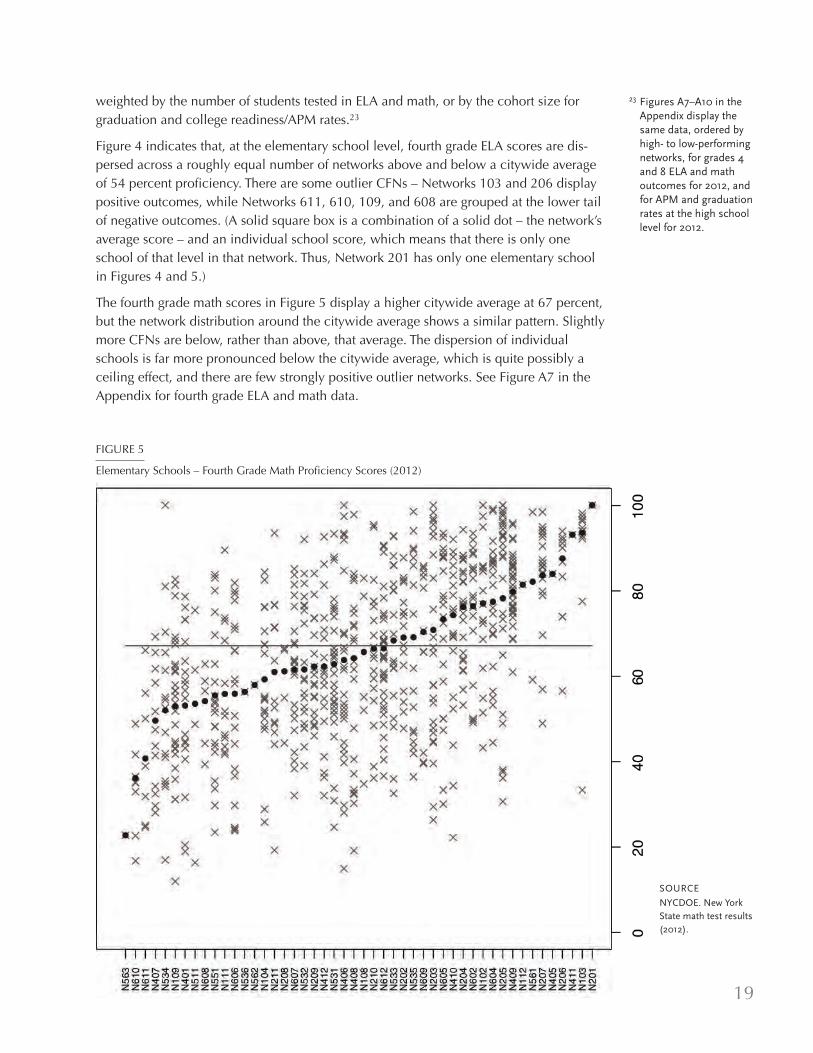
19
weighted by the number of students tested in ELA and math, or by the cohort size forgraduation and college readiness/APM rates.23
Figure 4 indicates that, at the elementary school level, fourth grade ELA scores are dis-persed across a roughly equal number of networks above and below a citywide averageof 54 percent proficiency. There are some outlier CFNs – Networks 103 and 206 displaypositive outcomes, while Networks 611, 610, 109, and 608 are grouped at the lower tailof negative outcomes. (A solid square box is a combination of a solid dot – the network’saverage score – and an individual school score, which means that there is only oneschool of that level in that network. Thus, Network 201 has only one elementary schoolin Figures 4 and 5.)
The fourth grade math scores in Figure 5 display a higher citywide average at 67 percent,but the network distribution around the citywide average shows a similar pattern. Slightlymore CFNs are below, rather than above, that average. The dispersion of individualschools is far more pronounced below the citywide average, which is quite possibly aceiling effect, and there are few strongly positive outlier networks. See Figure A7 in theAppendix for fourth grade ELA and math data.
FIGURE 5
Elementary Schools – Fourth Grade Math Proficiency Scores (2012)
SOURCE
NYCDOE. New YorkState math test results(2012).
23 Figures A7–A10 in theAppendix display thesame data, ordered byhigh- to low-performingnetworks, for grades 4and 8 ELA and mathoutcomes for 2012, andfor APM and graduationrates at the high schoollevel for 2012.
20 Demographics and Performance in New York City's School Networks: An Initial Inquiry
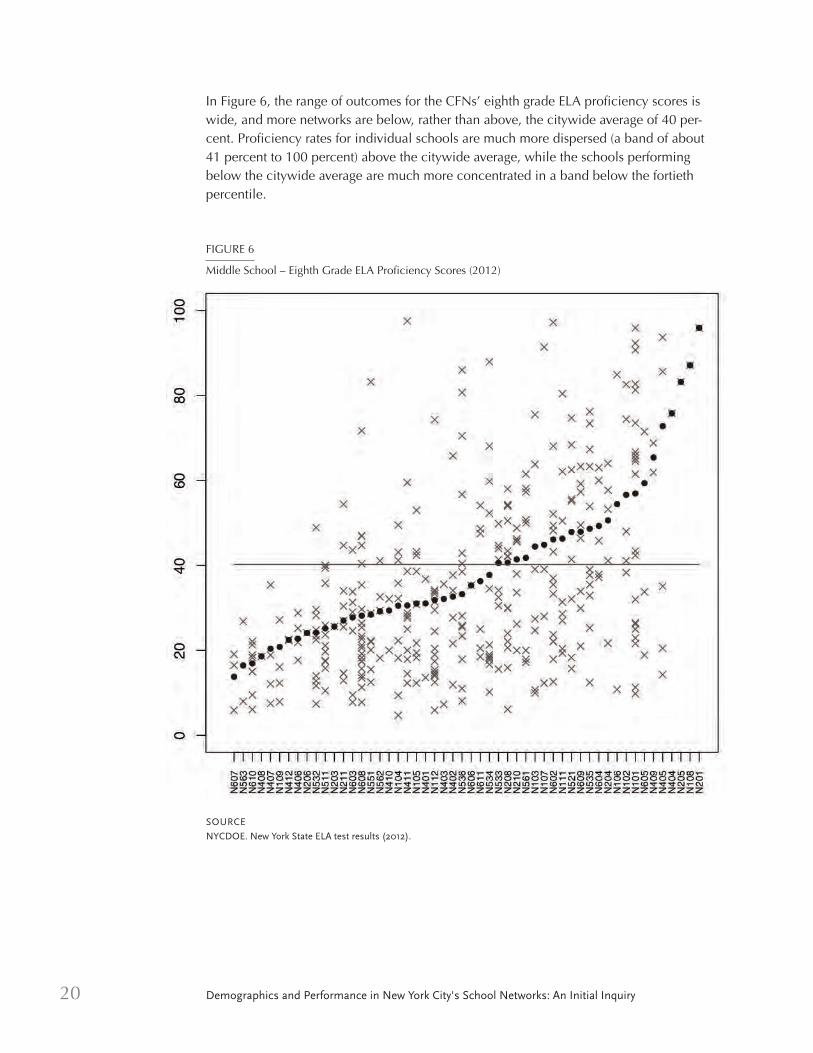
In Figure 6, the range of outcomes for the CFNs’ eighth grade ELA proficiency scores iswide, and more networks are below, rather than above, the citywide average of 40 per-cent. Proficiency rates for individual schools are much more dispersed (a band of about41 percent to 100 percent) above the citywide average, while the schools performingbelow the citywide average are much more concentrated in a band below the fortiethpercentile.
FIGURE 6
Middle School – Eighth Grade ELA Proficiency Scores (2012)
SOURCE
NYCDOE. New York State ELA test results (2012).
Annenberg Institute for School Reform 21
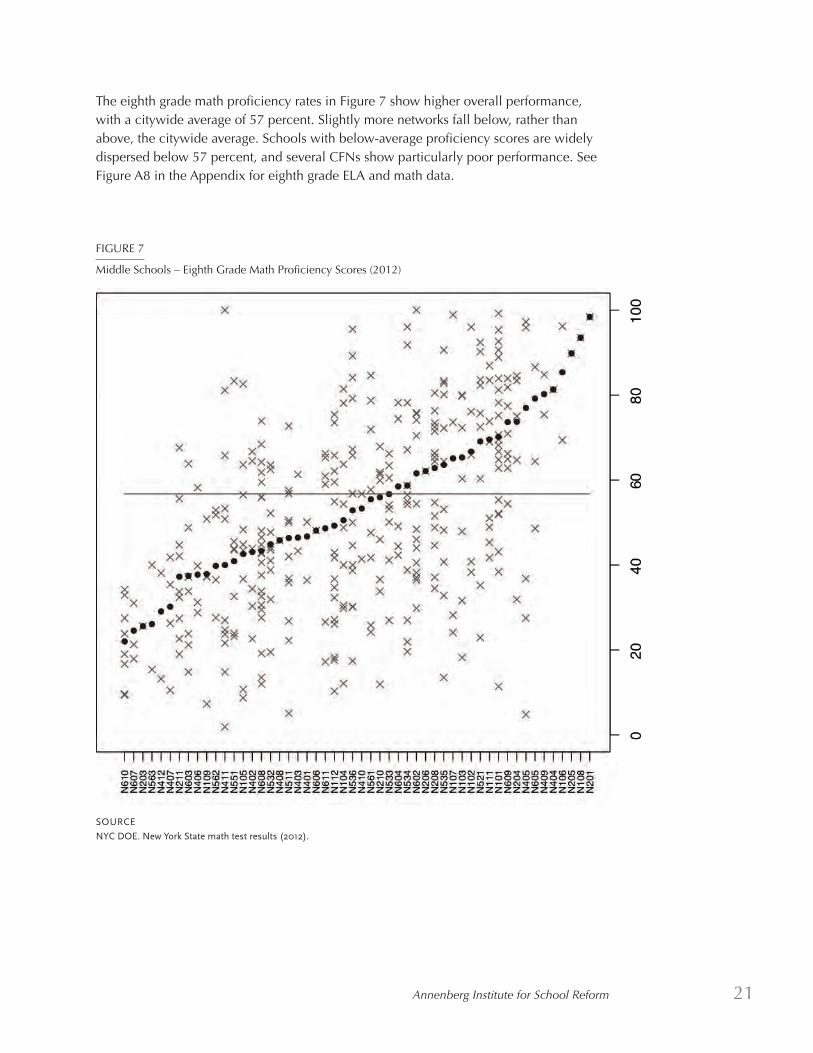
The eighth grade math proficiency rates in Figure 7 show higher overall performance,with a citywide average of 57 percent. Slightly more networks fall below, rather thanabove, the citywide average. Schools with below-average proficiency scores are widelydispersed below 57 percent, and several CFNs show particularly poor performance. SeeFigure A8 in the Appendix for eighth grade ELA and math data.
FIGURE 7
Middle Schools – Eighth Grade Math Proficiency Scores (2012)
SOURCE
NYC DOE. New York State math test results (2012).
22 Demographics and Performance in New York City's School Networks: An Initial Inquiry
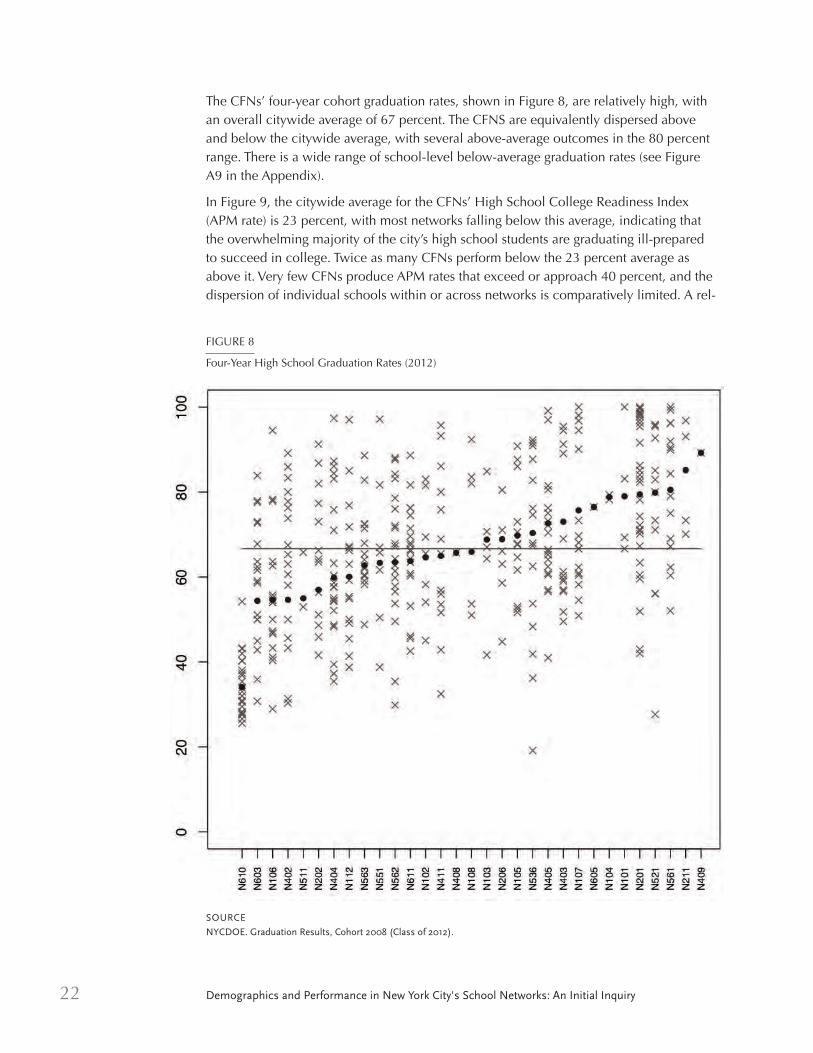
The CFNs’ four-year cohort graduation rates, shown in Figure 8, are relatively high, withan overall citywide average of 67 percent. The CFNS are equivalently dispersed aboveand below the citywide average, with several above-average outcomes in the 80 percentrange. There is a wide range of school-level below-average graduation rates (see FigureA9 in the Appendix).
In Figure 9, the citywide average for the CFNs’ High School College Readiness Index(APM rate) is 23 percent, with most networks falling below this average, indicating thatthe overwhelming majority of the city’s high school students are graduating ill-preparedto succeed in college. Twice as many CFNs perform below the 23 percent average asabove it. Very few CFNs produce APM rates that exceed or approach 40 percent, and thedispersion of individual schools within or across networks is comparatively limited. A rel-
FIGURE 8
Four-Year High School Graduation Rates (2012)
SOURCE
NYCDOE. Graduation Results, Cohort 2008 (Class of 2012).

Annenberg Institute for School Reform 23
atively small number of schools in CFNs score above 60 percent college readiness. Mem-ber schools in Networks 201,24 521, 405, and 101 display strong APM performance (seeFigure A10 in the Appendix).
In summary, network outcomes on the fourth and eighth grade ELA and math tests showcurves of roughly similar performance above and below the citywide average, withhigher math results. The curve of network graduation outcomes is higher, again with anequivalent dispersion above and below the citywide average. Network college-ready(APM) performance is quite low, and twice as many networks fall below the citywideaverage as above it. Overall, fewer networks show positive, rather than negative, out-comes.
SOURCE
NYCDOE. Regents-based math/ELA Aspirational Performance Measure, Cohort 2008 (Class of 2012).
FIGURE 9
High School Aspirational Performance Measure/College Readiness Rates (2012)
24 Network 201 includesmost of the school sys-tem’s specialized, test-entry high schools, aswell as many other high-performing, over-sub-scribed high schools.
24 Demographics and Performance in New York City's School Networks: An Initial Inquiry
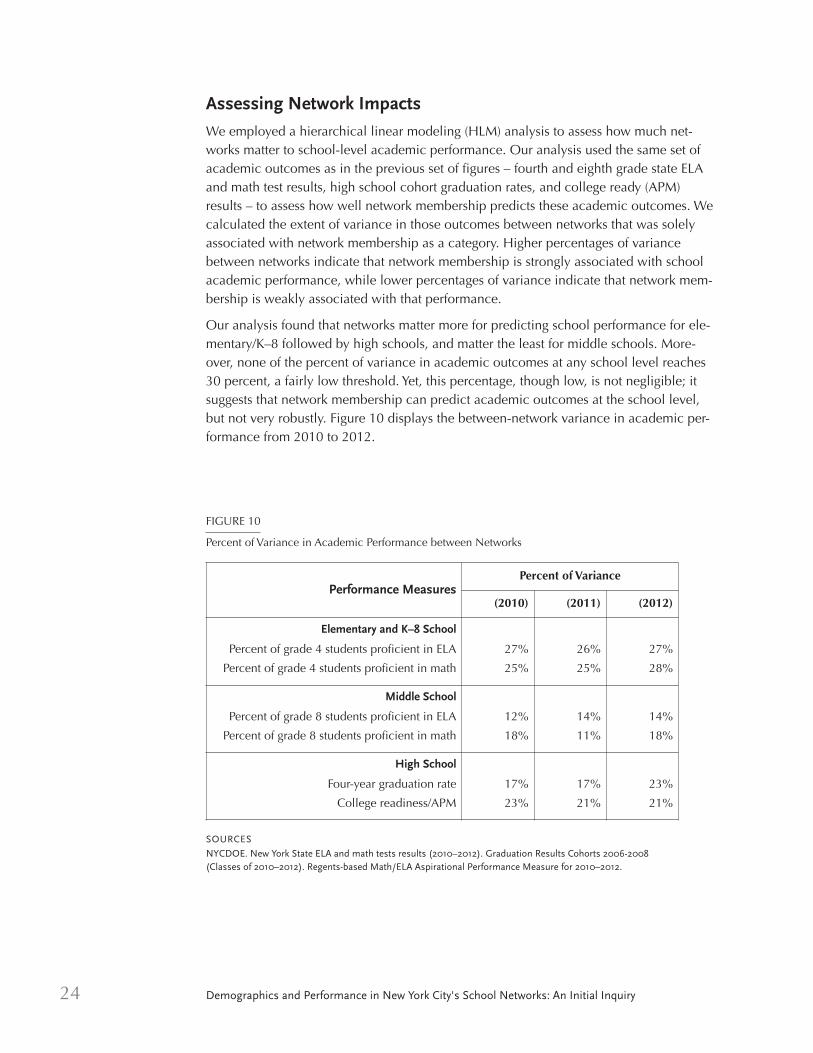
Assessing Network Impacts
We employed a hierarchical linear modeling (HLM) analysis to assess how much net-works matter to school-level academic performance. Our analysis used the same set ofacademic outcomes as in the previous set of figures – fourth and eighth grade state ELAand math test results, high school cohort graduation rates, and college ready (APM)results – to assess how well network membership predicts these academic outcomes. Wecalculated the extent of variance in those outcomes between networks that was solelyassociated with network membership as a category. Higher percentages of variancebetween networks indicate that network membership is strongly associated with schoolacademic performance, while lower percentages of variance indicate that network mem-bership is weakly associated with that performance.
Our analysis found that networks matter more for predicting school performance for ele-mentary/K–8 followed by high schools, and matter the least for middle schools. More-over, none of the percent of variance in academic outcomes at any school level reaches30 percent, a fairly low threshold. Yet, this percentage, though low, is not negligible; itsuggests that network membership can predict academic outcomes at the school level,but not very robustly. Figure 10 displays the between-network variance in academic per-formance from 2010 to 2012.
Performance MeasuresPercent of Variance
(2010) (2011) (2012)
Elementary and K–8 School
Percent of grade 4 students proficient in ELA 27% 26% 27%
Percent of grade 4 students proficient in math 25% 25% 28%
Middle School
Percent of grade 8 students proficient in ELA 12% 14% 14%
Percent of grade 8 students proficient in math 18% 11% 18%
High School
Four-year graduation rate 17% 17% 23%
College readiness/APM 23% 21% 21%
FIGURE 10
Percent of Variance in Academic Performance between Networks
SOURCES
NYCDOE. New York State ELA and math tests results (2010–2012). Graduation Results Cohorts 2006-2008(Classes of 2010–2012). Regents-based Math/ELA Aspirational Performance Measure for 2010–2012.
Annenberg Institute for School Reform 25
Selection issues may upwardly bias the extent of variance in academic outcomesbetween networks that our analysis found. Network membership is not random; itdepends on school choice, which is influenced by factors such as principals’ relation-ships with like-minded colleagues, school affiliations based on educational philosophy orinstructional practice, or a range of similar hard-to-measure factors. How much thesechoice/selection issues affect the percentages of variance across the networks’ academicoutcomes is quite difficult to assess, especially given the limited data available to us.Additional research that specified the effects of the relationships underlying networkchoice might well produce considerably lower percentages of variance in academic out-comes across networks.
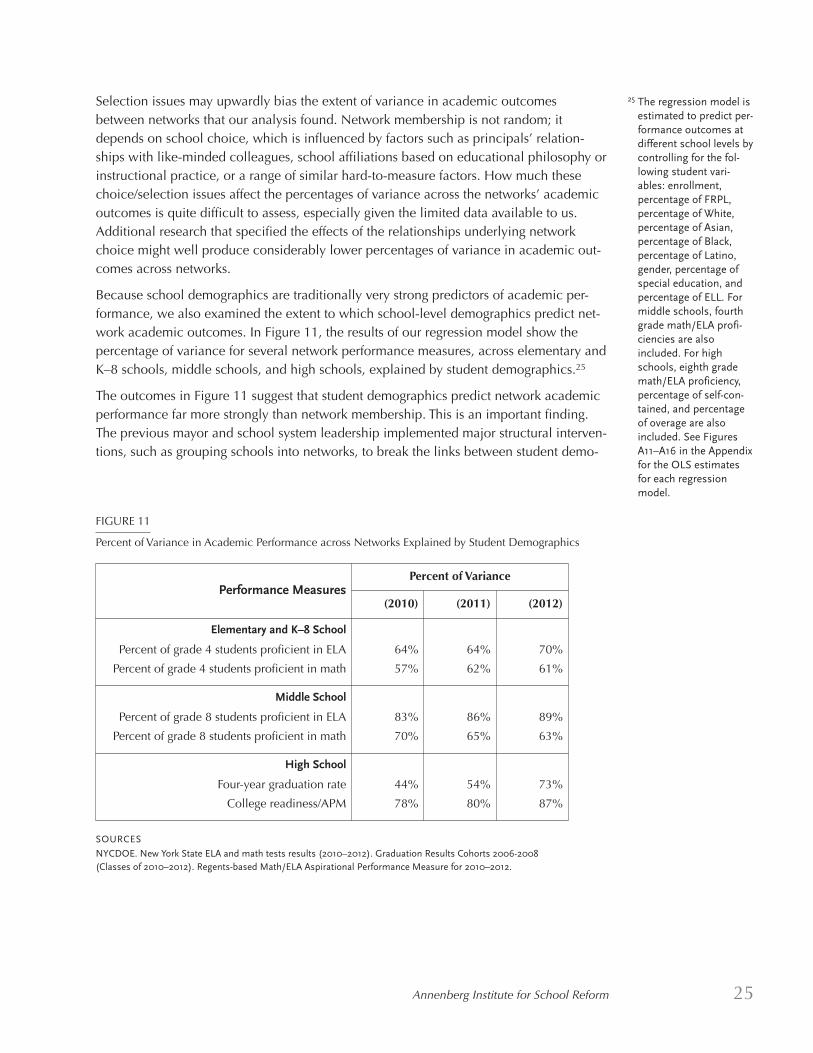
Because school demographics are traditionally very strong predictors of academic per-formance, we also examined the extent to which school-level demographics predict net-work academic outcomes. In Figure 11, the results of our regression model show thepercentage of variance for several network performance measures, across elementary andK–8 schools, middle schools, and high schools, explained by student demographics.25
The outcomes in Figure 11 suggest that student demographics predict network academicperformance far more strongly than network membership. This is an important finding.The previous mayor and school system leadership implemented major structural interven-tions, such as grouping schools into networks, to break the links between student demo-
Performance MeasuresPercent of Variance
(2010) (2011) (2012)
Elementary and K–8 School
Percent of grade 4 students proficient in ELA 64% 64% 70%
Percent of grade 4 students proficient in math 57% 62% 61%
Middle School
Percent of grade 8 students proficient in ELA 83% 86% 89%
Percent of grade 8 students proficient in math 70% 65% 63%
High School
Four-year graduation rate 44% 54% 73%
College readiness/APM 78% 80% 87%
FIGURE 11
Percent of Variance in Academic Performance across Networks Explained by Student Demographics
SOURCES
NYCDOE. New York State ELA and math tests results (2010–2012). Graduation Results Cohorts 2006-2008(Classes of 2010–2012). Regents-based Math/ELA Aspirational Performance Measure for 2010–2012.
25 The regression model isestimated to predict per-formance outcomes atdifferent school levels bycontrolling for the fol-lowing student vari-ables: enrollment,percentage of FRPL, percentage of White,percentage of Asian,percentage of Black, percentage of Latino,gender, percentage ofspecial education, andpercentage of ELL. Formiddle schools, fourthgrade math/ELA profi-ciencies are alsoincluded. For highschools, eighth grademath/ELA proficiency,percentage of self-con-tained, and percentageof overage are alsoincluded. See FiguresA11–A16 in the Appendixfor the OLS estimatesfor each regressionmodel.
26 Demographics and Performance in New York City's School Networks: An Initial Inquiry
graphics and academic outcomes. Yet our findings indicate that the CFNs’ academic out-comes are influenced far more strongly by student and school demographics than by net-work membership.
To more precisely assess how much the networks influence academic performance, wedeveloped an HLM analysis that groups schools by network membership, controls forschool-level student demographics, and predicts how a hypothetical school with sys-temwide average student demographics would perform in each network.26
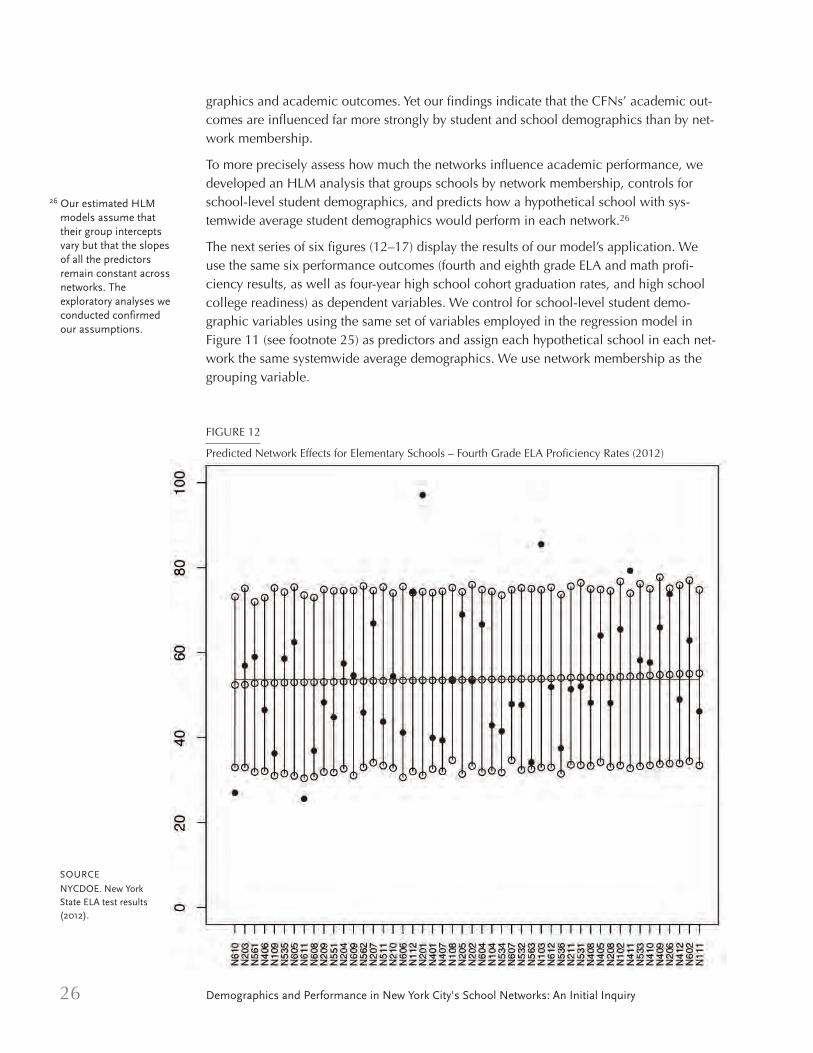
The next series of six figures (12–17) display the results of our model’s application. Weuse the same six performance outcomes (fourth and eighth grade ELA and math profi-ciency results, as well as four-year high school cohort graduation rates, and high schoolcollege readiness) as dependent variables. We control for school-level student demo-graphic variables using the same set of variables employed in the regression model in Figure 11 (see footnote 25) as predictors and assign each hypothetical school in each net-work the same systemwide average demographics. We use network membership as thegrouping variable.
SOURCE
NYCDOE. New YorkState ELA test results(2012).
26 Our estimated HLMmodels assume thattheir group interceptsvary but that the slopesof all the predictorsremain constant acrossnetworks. Theexploratory analyses weconducted confirmedour assumptions.
FIGURE 12
Predicted Network Effects for Elementary Schools – Fourth Grade ELA Proficiency Rates (2012)
Annenberg Institute for School Reform 27
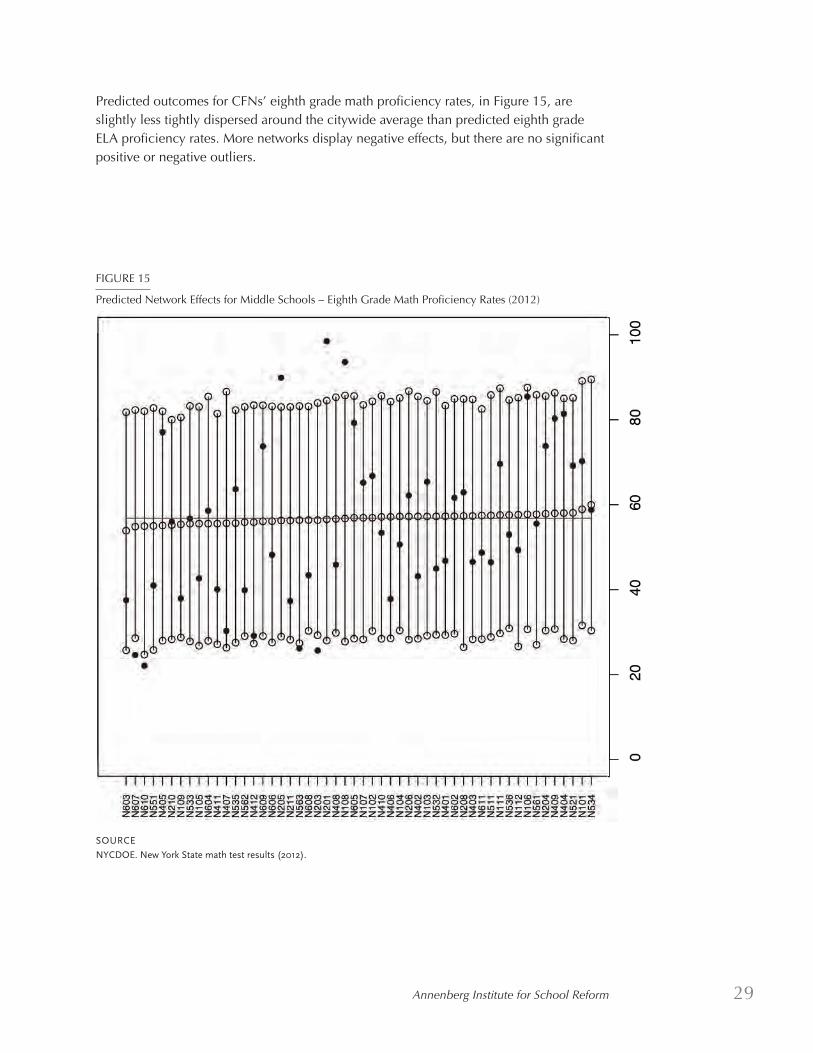
The outcomes in Figures 12–17 show the predicted school-level academic performanceof each network when the demographic variables are held constant at the citywide aver-age. The horizontal line in each figure represents the citywide performance averageacross all schools and CFNs. The vertical lines display the confidence intervals of the pre-dicted performance for each network, and the middle hollow dot is the point estimatewithin the predicted performance range of each network. The solid dots represent theactual average performance of each network. Network effects on academic performancemeasures are represented by the distances between the middle hollow dots and the hori-zontal line indicating average citywide performance. Positive network effects are indi-cated when each network’s hollow dot falls above the city average performance line.Negative network effects are indicated when each network’s hollow dot falls below thecity average line.
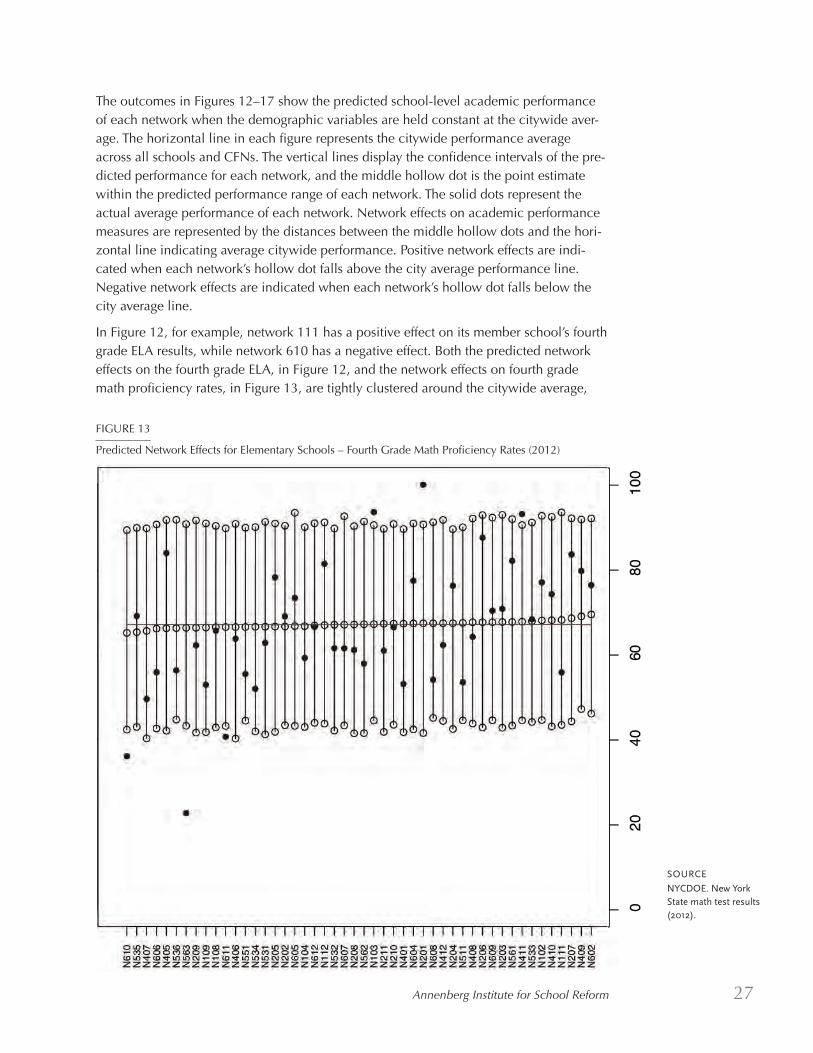
In Figure 12, for example, network 111 has a positive effect on its member school’s fourthgrade ELA results, while network 610 has a negative effect. Both the predicted networkeffects on the fourth grade ELA, in Figure 12, and the network effects on fourth grademath proficiency rates, in Figure 13, are tightly clustered around the citywide average,
FIGURE 13
Predicted Network Effects for Elementary Schools – Fourth Grade Math Proficiency Rates (2012)
SOURCE
NYCDOE. New YorkState math test results(2012).

28 Demographics and Performance in New York City's School Networks: An Initial Inquiry
with no apparent positive or negative outliers. These results indicate that the CFNs havevery little, if any, effect on fourth grade ELA and math proficiency rates. We found similarresults in the 2010 and 2011 analyses we conducted.
Predicted effects for networks’ eighth grade ELA proficiency rates, in Figure 14, are alsovery tightly dispersed around the citywide average. The results indicate very little, if any,network effects on eighth grade ELA proficiency and no significant positive or negativeoutlier CFNs.
FIGURE 14
Predicted Network Effects for Middle Schools – Eighth Grade ELA Proficiency Rates (2012)
SOURCE
NYCDOE. New York State ELA test results (2012).
Annenberg Institute for School Reform 29
Predicted outcomes for CFNs’ eighth grade math proficiency rates, in Figure 15, areslightly less tightly dispersed around the citywide average than predicted eighth gradeELA proficiency rates. More networks display negative effects, but there are no significantpositive or negative outliers.
SOURCE
NYCDOE. New York State math test results (2012).
FIGURE 15
Predicted Network Effects for Middle Schools – Eighth Grade Math Proficiency Rates (2012)

30 Demographics and Performance in New York City's School Networks: An Initial Inquiry
The four-year graduation rate, Figure 16, shows higher overall predicted outcomes, withmost networks’ performance falling above the citywide average. The pattern of predictedoutcomes is similar to the actual pattern of four-year graduation rates, shown previouslyin Figure 8.
FIGURE 16
Predicted Network Effects for High Schools – Four-year Graduation Rates (2012)
SOURCE
NYCDOE. Graduation Results, Cohort 2008 (Class of 2012).
Annenberg Institute for School Reform 31
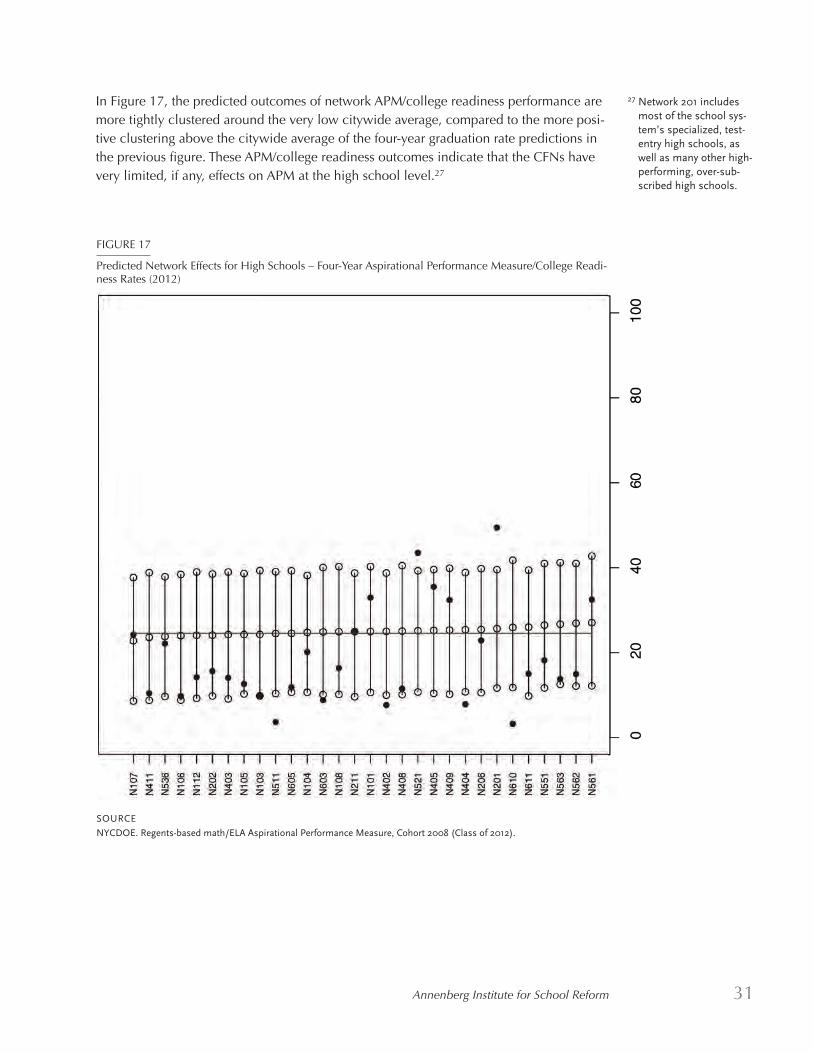
In Figure 17, the predicted outcomes of network APM/college readiness performance aremore tightly clustered around the very low citywide average, compared to the more posi-tive clustering above the citywide average of the four-year graduation rate predictions inthe previous figure. These APM/college readiness outcomes indicate that the CFNs havevery limited, if any, effects on APM at the high school level.27
SOURCE
NYCDOE. Regents-based math/ELA Aspirational Performance Measure, Cohort 2008 (Class of 2012).
FIGURE 17
Predicted Network Effects for High Schools – Four-Year Aspirational Performance Measure/College Readi-ness Rates (2012)
27 Network 201 includesmost of the school sys-tem’s specialized, test-entry high schools, aswell as many other high-performing, over-sub-scribed high schools.
32 Demographics and Performance in New York City's School Networks: An Initial Inquiry
Summary of Academic Findings
The results of our analyses of networks’ variance in academic outcomes suggest that net-work membership can predict academic outcomes at the school level, but not veryrobustly, and that student demographics predict academic performance far more stronglythan network membership. Moreover, when key demographic variables such as poverty,the percentages of students with disabilities, and English language learners are held con-stant at the citywide average, network membership seems to have very little effect onmember schools’ performance, except possibly for high school graduation rates. Almostall of our HLM analyses show predicted network performance tightly clustered aroundthe citywide average, with neither positive nor negative outliers.28 Our analyses do notidentify any “beat-the-odds” CFNs, meaning particularly effective networks whose stu-dent outcomes significantly transcend the norm of network performance.29 Our findingsindicate that demography is still destiny, in terms of the networks’ overall contributions toschools’ academic outcomes.
It is important to stress the limits of our work. Our analyses are neither growth-based norvalue-added. Though both our HLM and regression analyses findings are consistent, androbust, for 2010, 2011, and 2012 school years, they do not assess growth in student aca-demic outcomes within and across CFNs. Nor do they address the contributions of partic-ular CFNs to student academic growth in individual schools. Our study does not examinethe instructional or administrative practices of particular networks, or identify any specificcharacteristics of networks other than their demographics and academic outcomes. Ouranalysis is too coarse-grained to pick up small but important differences across networks,because our effort is essentially a bird’s-eye view of network contributions to student aca-demic outcomes across the city school system.
28 We carried out both HLMand regression analysesof the academic out-comes of the 2002 com-munity school districts.The percent of variancein academic outcomesattributable to the com-munity school districts in2002 was much higherthan the percent of vari-ance in academic out-comes attributable to thenetworks. The findings ofour 2002 regressionanalyses of the contribu-tion of district demo-graphics to academicoutcomes were similar toour 2012 findings, con-firming the preeminentrole of student demo-graphics in shaping bothcommunity school dis-trict and network aca-demic outcomes (seeFigures A17–A20 in theAppendix for the schoolperformances of theschool districts in 2002).
29 A recent study by theResearch Alliance forNew York City Schoolsidentified several suc-cessful small highschools, and found thattheir principals andteachers perceived theirschools’ “partnershipswith networks as rela-tively unimportant” totheir schools’ effective-ness (Villavicencio &Marinell 2014, p. 14).

Annenberg Institute for School Reform 33
The networks are highly variable in terms of size (number of member schools), studentenrollment, differing grade levels, and student demographics. Choice at the school level,usually by the principal, seems to determine network membership.
Though we found considerable racial/ethnic segregation within and across the networks,the extent of that segregation at the elementary/K–8 and middle school levels decreasedfrom the community school districts in 2002 to the CFNs in 2012. This reduction wasmost likely a result of the non-geographic nature of the CFNs.
Our analyses indicate that network membership can predict academic outcomes at theschool level, but not very robustly. We also found that student demographics are a farstronger predictor of school-level academic performance across the networks than net-work membership. When our analyses controlled for student demographics, we foundthat the networks had little effect on school-level academic outcomes, except possibly forthe four-year high school cohort graduation rates. Demography still seems to determinedestiny in the current, network-organized school system.
Conclusions
34 Demographics and Performance in New York City's School Networks: An Initial Inquiry
Ascher, C., and C. Maguire. 2007. Beating the Odds: How Thirteen NYC Schools BringLow-Performing Ninth-Graders to Timely Graduation and College Enrollment. Provi-dence, RI: Brown University, Annenberg Institute for School Reform.
Childress, S., M. Higgins, A. Ishimaru, and S. Takahashi. 2011. “Managing for Results atthe New York City Department of Education.” In Education Reform in New York City:Ambitious Change in the Nation's Most Complex School System, edited by J. A. O’Day,C. S. Bitter, and L. M. Gomez. Cambridge, MA: Harvard University Press.
City Council, City of New York. 2012. Transcript of the Minutes of the Committee on Edu-cation, Oversight Hearing on New York City’s Networks for School Support (October25). New York: Ubiqus. Available at http://legistar.council.nyc.gov/LegislationDetail.aspx?ID=1203370&GUID=2D2A5062-242F-4D80-85E5-33AC4E7EFBDF&Options=&Search=.
Cromidas, Rachel. 2012. “Tensions Flare as Officials Defend Their School Support Sys-tems,” New York: Gotham Schools, http://ny.chalkbeat.org/2012/10/25/tension-flare-as-officials-defend-their-school-support-systems/#.VMU3y8ZeOfs.
Decker, G., and P. Wall. 2013. “Fearing Change, Principals Lobby de Blasio to ProtectNetworks.” New York: Gotham Schools.
Fessenden, Ford. 2012. “A Portrait of Segregation in New York City’s Schools,” New YorkTimes, http://www.nytimes.com/interactive/2012/05/11/nyregion/segregation-in-new-york-city-public-schools html?ref=education.
Fry, R., and P. Taylor. 2012. The Rise of Residential Segregation by Income. Social andDemographic Trends. Washington, DC: Pew Research Center, http://www.pewsocialtrends.org/files/2012/08/Rise-of-Residential-Income-Segregation-2012.2.pdf.
Institute for Education and Social Policy. 2001. Final Report of the Evaluation of New YorkNetworks for School Renewal. New York: Institute for Education and Social Policy,Steinhardt School of Education, New York University. Available athttp://files.eric.ed.gov/fulltext/ED464164.pdf.
Mishook, J., S. McAlister, and K. Edge. 2011. Peer Networks in School Reform: Lessonsfrom England and Implications for the United States. Providence, RI: Brown University,Annenberg Institute for School Reform. Available at http://annenberginstitute.org/?q=publication/peer-networks-school-reform-lessons-england-and-implications-united-states.
Nadelstern, Eric. 2012. The Evolution of School Support Networks in New York City.Working Paper 2012-2 of the Center on Reinventing Public Education. Seattle, WA:University of Washington Bothell.
References
Annenberg Institute for School Reform 35
New York City Department of Education. n.d. School Support. New York: NYCDOE,http://schools.nyc.gov/AboutUs/schools/support/default.htm.http://schools.nyc.gov/AboutUs/schools/support/OSS.htm, and4B52384E3262/153599/NetworkDirectory.pdf.
New York City Independent Budget Office. 2014. As the System for Providing SupportServices to Schools Changed, Funding Levels Changed, Too. New York: NYCIBO.
Parthenon Group. 2013. An Assessment of the New York City Department of EducationSchool Support Structure. Boston, MA: Parthenon Group.
Populations Studies Center. n.d. “Calculation Formula for Segregation Measures, TheIndex of Dissimilarity.” Racial Residential Segregation Management Project. Michigan:University of Michigan, http://enceladus.isr.umich.edu/race/calculate.html
Rothman, R. (Ed.). 2008. Voices in Urban Education no. 21 (Fall). Themed issue: “A SmartSystem in London.” http://vue.annenberginstitute.org/issues/21
Sebring, P. B., E. Allensworth, A. S. Bryk, J. Q. Easton, and S. Luppescu. 2006. The Essen-tial Supports for School Improvement: Research Report. Chicago: Consortium onChicago School Research. https://ccsr.uchicago.edu/publications/essential-supports-school-improvement.
Stiefel, L., R. Berne, P. Iatarola, and N. Fruchter. 2000. “High School Size: Effects onBudgets and Performance in New York City,” Educational Evaluation and Policy Analysis22, no. 1 (Spring): 27–39.
Villavicencio, A., and W. H. Marinell. 2014. Inside Success: Strategies of 25 EffectiveSmall High Schools in NYC. New York: The Research Alliance for New York CitySchools, Steinhardt School of Culture, Education, and Human Development, New YorkUniversity.
Wohlstetter, P., J. Smith, and A. Gallagher. 2013. “New York City’s Children First Net-works: Turning Accountability on its Head,” Journal of Educational Administration 51,no. 4.
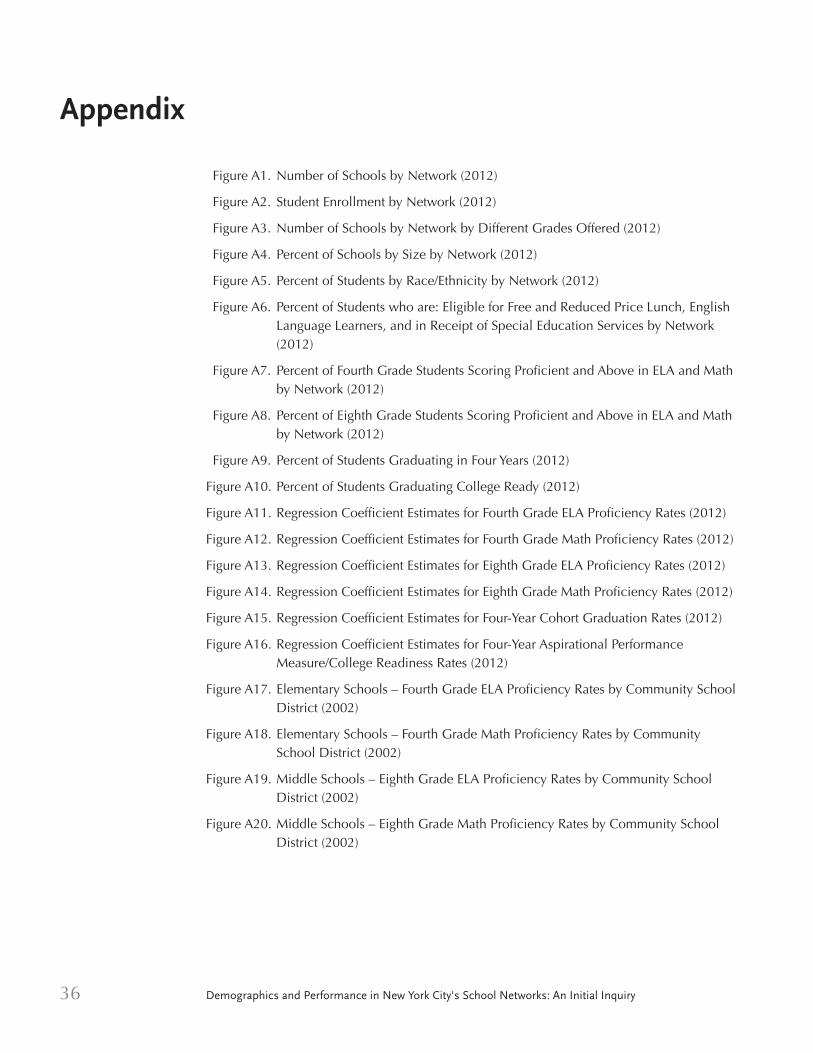
36 Demographics and Performance in New York City's School Networks: An Initial Inquiry
Figure A1. Number of Schools by Network (2012)
Figure A2. Student Enrollment by Network (2012)
Figure A3. Number of Schools by Network by Different Grades Offered (2012)
Figure A4. Percent of Schools by Size by Network (2012)
Figure A5. Percent of Students by Race/Ethnicity by Network (2012)
Figure A6. Percent of Students who are: Eligible for Free and Reduced Price Lunch, EnglishLanguage Learners, and in Receipt of Special Education Services by Network(2012)
Figure A7. Percent of Fourth Grade Students Scoring Proficient and Above in ELA and Mathby Network (2012)
Figure A8. Percent of Eighth Grade Students Scoring Proficient and Above in ELA and Mathby Network (2012)
Figure A9. Percent of Students Graduating in Four Years (2012)
Figure A10. Percent of Students Graduating College Ready (2012)
Figure A11. Regression Coefficient Estimates for Fourth Grade ELA Proficiency Rates (2012)
Figure A12. Regression Coefficient Estimates for Fourth Grade Math Proficiency Rates (2012)
Figure A13. Regression Coefficient Estimates for Eighth Grade ELA Proficiency Rates (2012)
Figure A14. Regression Coefficient Estimates for Eighth Grade Math Proficiency Rates (2012)
Figure A15. Regression Coefficient Estimates for Four-Year Cohort Graduation Rates (2012)
Figure A16. Regression Coefficient Estimates for Four-Year Aspirational Performance Measure/College Readiness Rates (2012)
Figure A17. Elementary Schools – Fourth Grade ELA Proficiency Rates by Community SchoolDistrict (2002)
Figure A18. Elementary Schools – Fourth Grade Math Proficiency Rates by CommunitySchool District (2002)
Figure A19. Middle Schools – Eighth Grade ELA Proficiency Rates by Community SchoolDistrict (2002)
Figure A20. Middle Schools – Eighth Grade Math Proficiency Rates by Community SchoolDistrict (2002)
Appendix
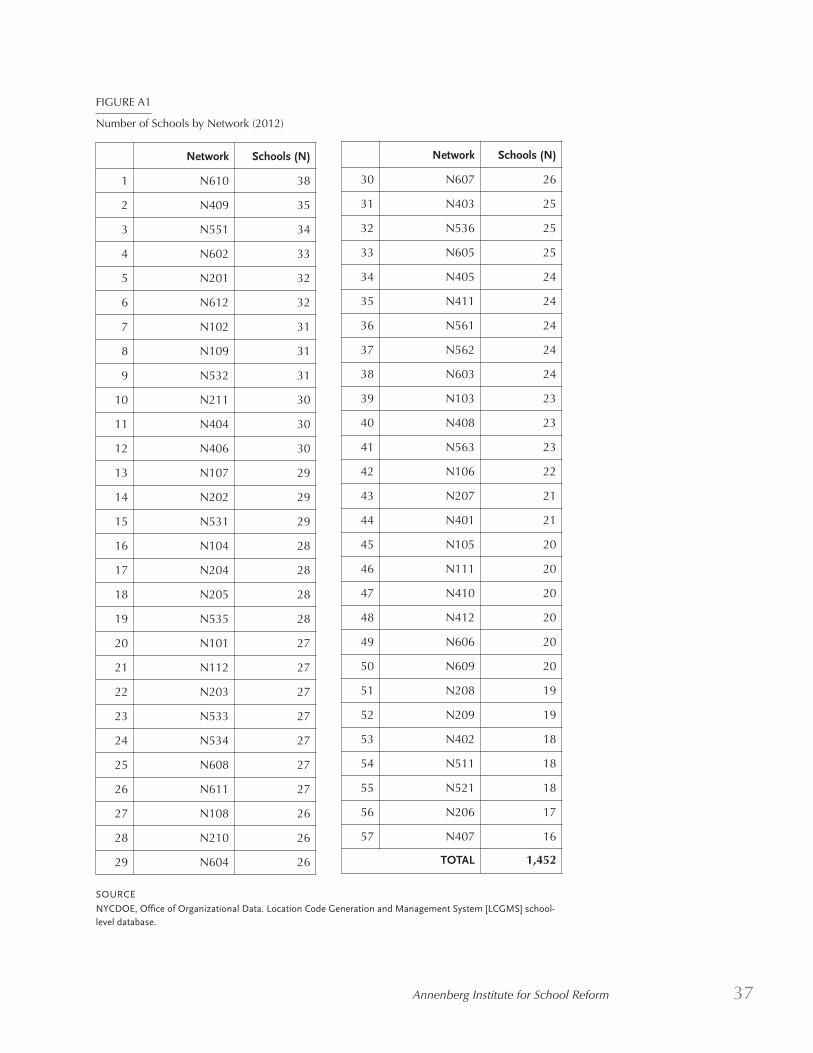
Annenberg Institute for School Reform 37
FIGURE A1
Number of Schools by Network (2012)
Network Schools (N)
1 N610 38
2 N409 35
3 N551 34
4 N602 33
5 N201 32
6 N612 32
7 N102 31
8 N109 31
9 N532 31
10 N211 30
11 N404 30
12 N406 30
13 N107 29
14 N202 29
15 N531 29
16 N104 28
17 N204 28
18 N205 28
19 N535 28
20 N101 27
21 N112 27
22 N203 27
23 N533 27
24 N534 27
25 N608 27
26 N611 27
27 N108 26
28 N210 26
29 N604 26
Network Schools (N)
30 N607 26
31 N403 25
32 N536 25
33 N605 25
34 N405 24
35 N411 24
36 N561 24
37 N562 24
38 N603 24
39 N103 23
40 N408 23
41 N563 23
42 N106 22
43 N207 21
44 N401 21
45 N105 20
46 N111 20
47 N410 20
48 N412 20
49 N606 20
50 N609 20
51 N208 19
52 N209 19
53 N402 18
54 N511 18
55 N521 18
56 N206 17
57 N407 16
TOTAL 1,452
SOURCE
NYCDOE, Office of Organizational Data. Location Code Generation and Management System [LCGMS] school-level database.
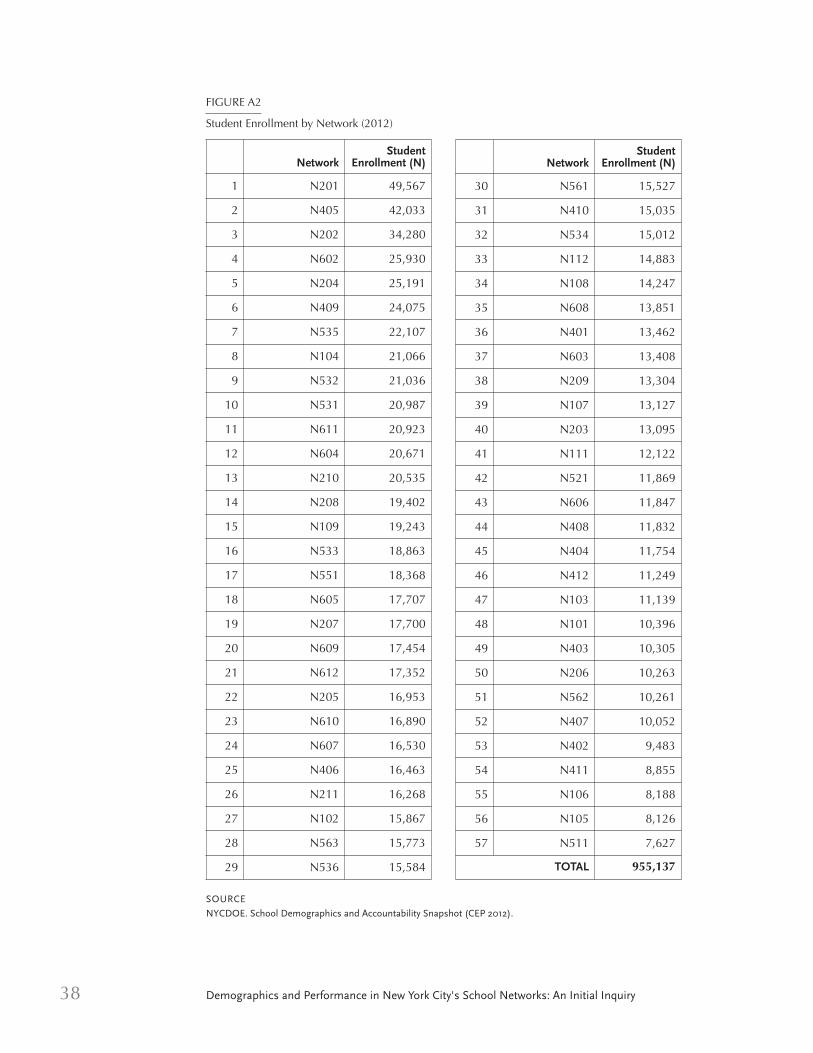
38 Demographics and Performance in New York City's School Networks: An Initial Inquiry
FIGURE A2
Student Enrollment by Network (2012)
NetworkStudent
Enrollment (N)
30 N561 15,527
31 N410 15,035
32 N534 15,012
33 N112 14,883
34 N108 14,247
35 N608 13,851
36 N401 13,462
37 N603 13,408
38 N209 13,304
39 N107 13,127
40 N203 13,095
41 N111 12,122
42 N521 11,869
43 N606 11,847
44 N408 11,832
45 N404 11,754
46 N412 11,249
47 N103 11,139
48 N101 10,396
49 N403 10,305
50 N206 10,263
51 N562 10,261
52 N407 10,052
53 N402 9,483
54 N411 8,855
55 N106 8,188
56 N105 8,126
57 N511 7,627
TOTAL 955,137
SOURCE
NYCDOE. School Demographics and Accountability Snapshot (CEP 2012).
NetworkStudent
Enrollment (N)
1 N201 49,567
2 N405 42,033
3 N202 34,280
4 N602 25,930
5 N204 25,191
6 N409 24,075
7 N535 22,107
8 N104 21,066
9 N532 21,036
10 N531 20,987
11 N611 20,923
12 N604 20,671
13 N210 20,535
14 N208 19,402
15 N109 19,243
16 N533 18,863
17 N551 18,368
18 N605 17,707
19 N207 17,700
20 N609 17,454
21 N612 17,352
22 N205 16,953
23 N610 16,890
24 N607 16,530
25 N406 16,463
26 N211 16,268
27 N102 15,867
28 N563 15,773
29 N536 15,584
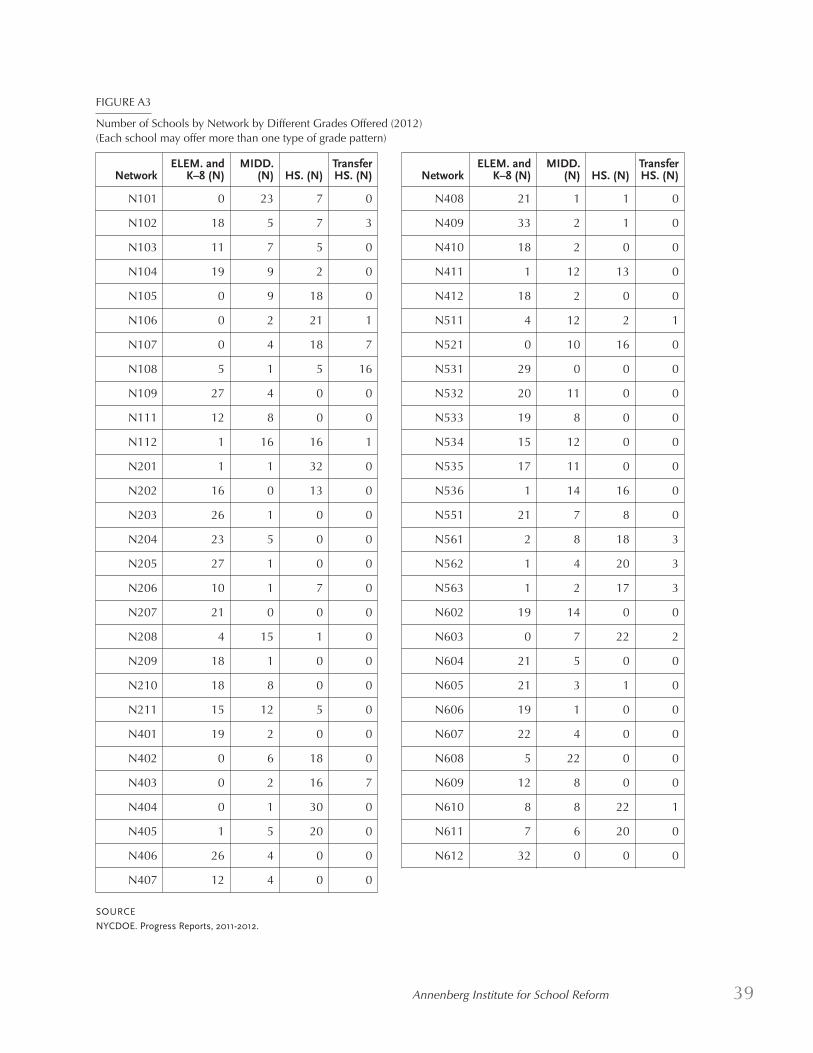
Annenberg Institute for School Reform 39
FIGURE A3
Number of Schools by Network by Different Grades Offered (2012)(Each school may offer more than one type of grade pattern)
NetworkELEM. and
K–8 (N)MIDD.
(N) HS. (N)Transfer HS. (N)
N101 0 23 7 0
N102 18 5 7 3
N103 11 7 5 0
N104 19 9 2 0
N105 0 9 18 0
N106 0 2 21 1
N107 0 4 18 7
N108 5 1 5 16
N109 27 4 0 0
N111 12 8 0 0
N112 1 16 16 1
N201 1 1 32 0
N202 16 0 13 0
N203 26 1 0 0
N204 23 5 0 0
N205 27 1 0 0
N206 10 1 7 0
N207 21 0 0 0
N208 4 15 1 0
N209 18 1 0 0
N210 18 8 0 0
N211 15 12 5 0
N401 19 2 0 0
N402 0 6 18 0
N403 0 2 16 7
N404 0 1 30 0
N405 1 5 20 0
N406 26 4 0 0
N407 12 4 0 0
NetworkELEM. and
K–8 (N)MIDD.
(N) HS. (N)Transfer HS. (N)
N408 21 1 1 0
N409 33 2 1 0
N410 18 2 0 0
N411 1 12 13 0
N412 18 2 0 0
N511 4 12 2 1
N521 0 10 16 0
N531 29 0 0 0
N532 20 11 0 0
N533 19 8 0 0
N534 15 12 0 0
N535 17 11 0 0
N536 1 14 16 0
N551 21 7 8 0
N561 2 8 18 3
N562 1 4 20 3
N563 1 2 17 3
N602 19 14 0 0
N603 0 7 22 2
N604 21 5 0 0
N605 21 3 1 0
N606 19 1 0 0
N607 22 4 0 0
N608 5 22 0 0
N609 12 8 0 0
N610 8 8 22 1
N611 7 6 20 0
N612 32 0 0 0
SOURCE
NYCDOE. Progress Reports, 2011-2012.
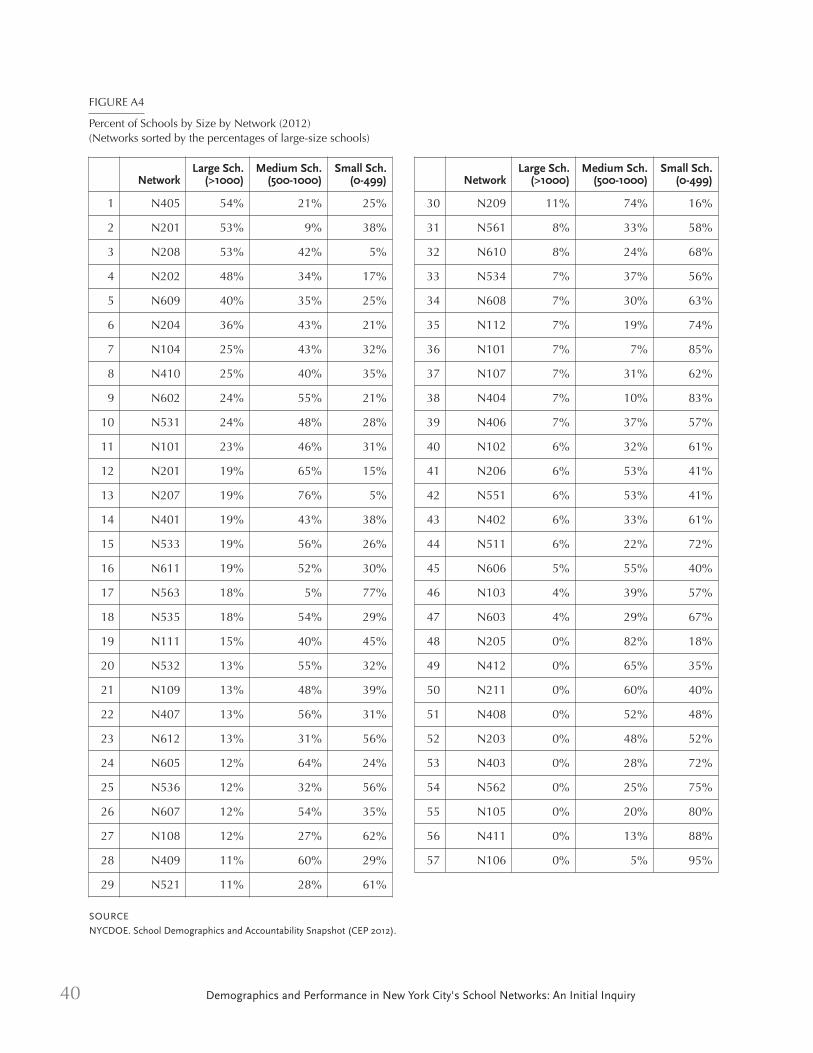
40 Demographics and Performance in New York City's School Networks: An Initial Inquiry
FIGURE A4
Percent of Schools by Size by Network (2012)(Networks sorted by the percentages of large-size schools)
NetworkLarge Sch.(>1000)
Medium Sch.(500-1000)
Small Sch.(0-499)
1 N405 54% 21% 25%
2 N201 53% 9% 38%
3 N208 53% 42% 5%
4 N202 48% 34% 17%
5 N609 40% 35% 25%
6 N204 36% 43% 21%
7 N104 25% 43% 32%
8 N410 25% 40% 35%
9 N602 24% 55% 21%
10 N531 24% 48% 28%
11 N101 23% 46% 31%
12 N201 19% 65% 15%
13 N207 19% 76% 5%
14 N401 19% 43% 38%
15 N533 19% 56% 26%
16 N611 19% 52% 30%
17 N563 18% 5% 77%
18 N535 18% 54% 29%
19 N111 15% 40% 45%
20 N532 13% 55% 32%
21 N109 13% 48% 39%
22 N407 13% 56% 31%
23 N612 13% 31% 56%
24 N605 12% 64% 24%
25 N536 12% 32% 56%
26 N607 12% 54% 35%
27 N108 12% 27% 62%
28 N409 11% 60% 29%
29 N521 11% 28% 61%
SOURCE
NYCDOE. School Demographics and Accountability Snapshot (CEP 2012).
NetworkLarge Sch.(>1000)
Medium Sch.(500-1000)
Small Sch.(0-499)
30 N209 11% 74% 16%
31 N561 8% 33% 58%
32 N610 8% 24% 68%
33 N534 7% 37% 56%
34 N608 7% 30% 63%
35 N112 7% 19% 74%
36 N101 7% 7% 85%
37 N107 7% 31% 62%
38 N404 7% 10% 83%
39 N406 7% 37% 57%
40 N102 6% 32% 61%
41 N206 6% 53% 41%
42 N551 6% 53% 41%
43 N402 6% 33% 61%
44 N511 6% 22% 72%
45 N606 5% 55% 40%
46 N103 4% 39% 57%
47 N603 4% 29% 67%
48 N205 0% 82% 18%
49 N412 0% 65% 35%
50 N211 0% 60% 40%
51 N408 0% 52% 48%
52 N203 0% 48% 52%
53 N403 0% 28% 72%
54 N562 0% 25% 75%
55 N105 0% 20% 80%
56 N411 0% 13% 88%
57 N106 0% 5% 95%
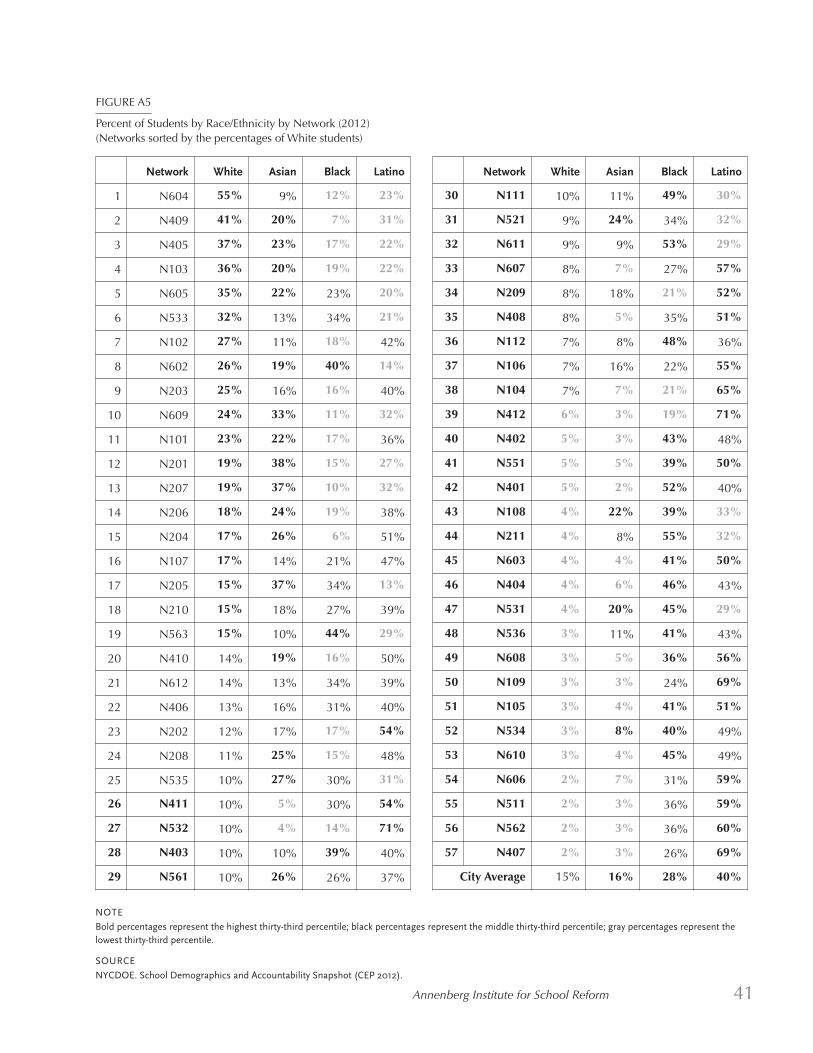
Annenberg Institute for School Reform 41
FIGURE A5
Percent of Students by Race/Ethnicity by Network (2012)(Networks sorted by the percentages of White students)
Network White Asian Black Latino
1 N604 55% 9% 12% 23%
2 N409 41% 20% 7% 31%
3 N405 37% 23% 17% 22%
4 N103 36% 20% 19% 22%
5 N605 35% 22% 23% 20%
6 N533 32% 13% 34% 21%
7 N102 27% 11% 18% 42%
8 N602 26% 19% 40% 14%
9 N203 25% 16% 16% 40%
10 N609 24% 33% 11% 32%
11 N101 23% 22% 17% 36%
12 N201 19% 38% 15% 27%
13 N207 19% 37% 10% 32%
14 N206 18% 24% 19% 38%
15 N204 17% 26% 6% 51%
16 N107 17% 14% 21% 47%
17 N205 15% 37% 34% 13%
18 N210 15% 18% 27% 39%
19 N563 15% 10% 44% 29%
20 N410 14% 19% 16% 50%
21 N612 14% 13% 34% 39%
22 N406 13% 16% 31% 40%
23 N202 12% 17% 17% 54%
24 N208 11% 25% 15% 48%
25 N535 10% 27% 30% 31%
26 N411 10% 5% 30% 54%
27 N532 10% 4% 14% 71%
28 N403 10% 10% 39% 40%
29 N561 10% 26% 26% 37%
Network White Asian Black Latino
30 N111 10% 11% 49% 30%
31 N521 9% 24% 34% 32%
32 N611 9% 9% 53% 29%
33 N607 8% 7% 27% 57%
34 N209 8% 18% 21% 52%
35 N408 8% 5% 35% 51%
36 N112 7% 8% 48% 36%
37 N106 7% 16% 22% 55%
38 N104 7% 7% 21% 65%
39 N412 6% 3% 19% 71%
40 N402 5% 3% 43% 48%
41 N551 5% 5% 39% 50%
42 N401 5% 2% 52% 40%
43 N108 4% 22% 39% 33%
44 N211 4% 8% 55% 32%
45 N603 4% 4% 41% 50%
46 N404 4% 6% 46% 43%
47 N531 4% 20% 45% 29%
48 N536 3% 11% 41% 43%
49 N608 3% 5% 36% 56%
50 N109 3% 3% 24% 69%
51 N105 3% 4% 41% 51%
52 N534 3% 8% 40% 49%
53 N610 3% 4% 45% 49%
54 N606 2% 7% 31% 59%
55 N511 2% 3% 36% 59%
56 N562 2% 3% 36% 60%
57 N407 2% 3% 26% 69%
City Average 15% 16% 28% 40%
NOTE
Bold percentages represent the highest thirty-third percentile; black percentages represent the middle thirty-third percentile; gray percentages represent thelowest thirty-third percentile.
SOURCE
NYCDOE. School Demographics and Accountability Snapshot (CEP 2012).
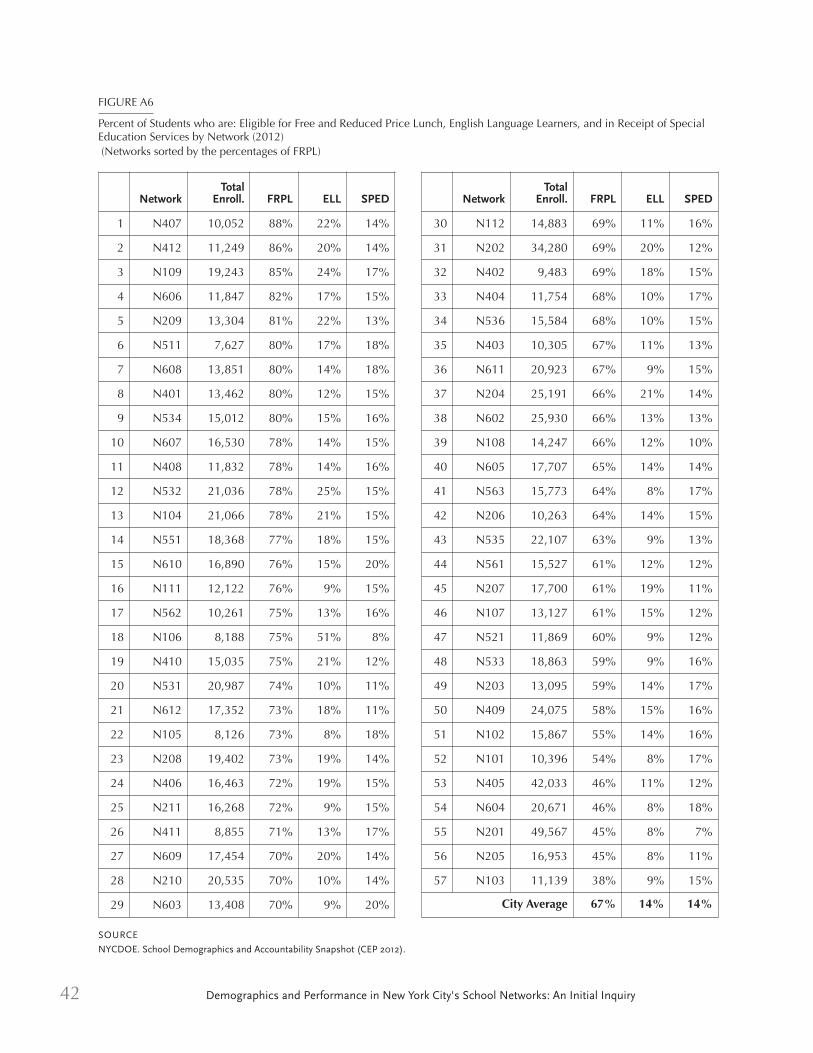
42 Demographics and Performance in New York City's School Networks: An Initial Inquiry
FIGURE A6
Percent of Students who are: Eligible for Free and Reduced Price Lunch, English Language Learners, and in Receipt of SpecialEducation Services by Network (2012)(Networks sorted by the percentages of FRPL)
NetworkTotal
Enroll. FRPL ELL SPED
1 N407 10,052 88% 22% 14%
2 N412 11,249 86% 20% 14%
3 N109 19,243 85% 24% 17%
4 N606 11,847 82% 17% 15%
5 N209 13,304 81% 22% 13%
6 N511 7,627 80% 17% 18%
7 N608 13,851 80% 14% 18%
8 N401 13,462 80% 12% 15%
9 N534 15,012 80% 15% 16%
10 N607 16,530 78% 14% 15%
11 N408 11,832 78% 14% 16%
12 N532 21,036 78% 25% 15%
13 N104 21,066 78% 21% 15%
14 N551 18,368 77% 18% 15%
15 N610 16,890 76% 15% 20%
16 N111 12,122 76% 9% 15%
17 N562 10,261 75% 13% 16%
18 N106 8,188 75% 51% 8%
19 N410 15,035 75% 21% 12%
20 N531 20,987 74% 10% 11%
21 N612 17,352 73% 18% 11%
22 N105 8,126 73% 8% 18%
23 N208 19,402 73% 19% 14%
24 N406 16,463 72% 19% 15%
25 N211 16,268 72% 9% 15%
26 N411 8,855 71% 13% 17%
27 N609 17,454 70% 20% 14%
28 N210 20,535 70% 10% 14%
29 N603 13,408 70% 9% 20%
NetworkTotal
Enroll. FRPL ELL SPED
30 N112 14,883 69% 11% 16%
31 N202 34,280 69% 20% 12%
32 N402 9,483 69% 18% 15%
33 N404 11,754 68% 10% 17%
34 N536 15,584 68% 10% 15%
35 N403 10,305 67% 11% 13%
36 N611 20,923 67% 9% 15%
37 N204 25,191 66% 21% 14%
38 N602 25,930 66% 13% 13%
39 N108 14,247 66% 12% 10%
40 N605 17,707 65% 14% 14%
41 N563 15,773 64% 8% 17%
42 N206 10,263 64% 14% 15%
43 N535 22,107 63% 9% 13%
44 N561 15,527 61% 12% 12%
45 N207 17,700 61% 19% 11%
46 N107 13,127 61% 15% 12%
47 N521 11,869 60% 9% 12%
48 N533 18,863 59% 9% 16%
49 N203 13,095 59% 14% 17%
50 N409 24,075 58% 15% 16%
51 N102 15,867 55% 14% 16%
52 N101 10,396 54% 8% 17%
53 N405 42,033 46% 11% 12%
54 N604 20,671 46% 8% 18%
55 N201 49,567 45% 8% 7%
56 N205 16,953 45% 8% 11%
57 N103 11,139 38% 9% 15%
City Average 67% 14% 14%
SOURCE
NYCDOE. School Demographics and Accountability Snapshot (CEP 2012).
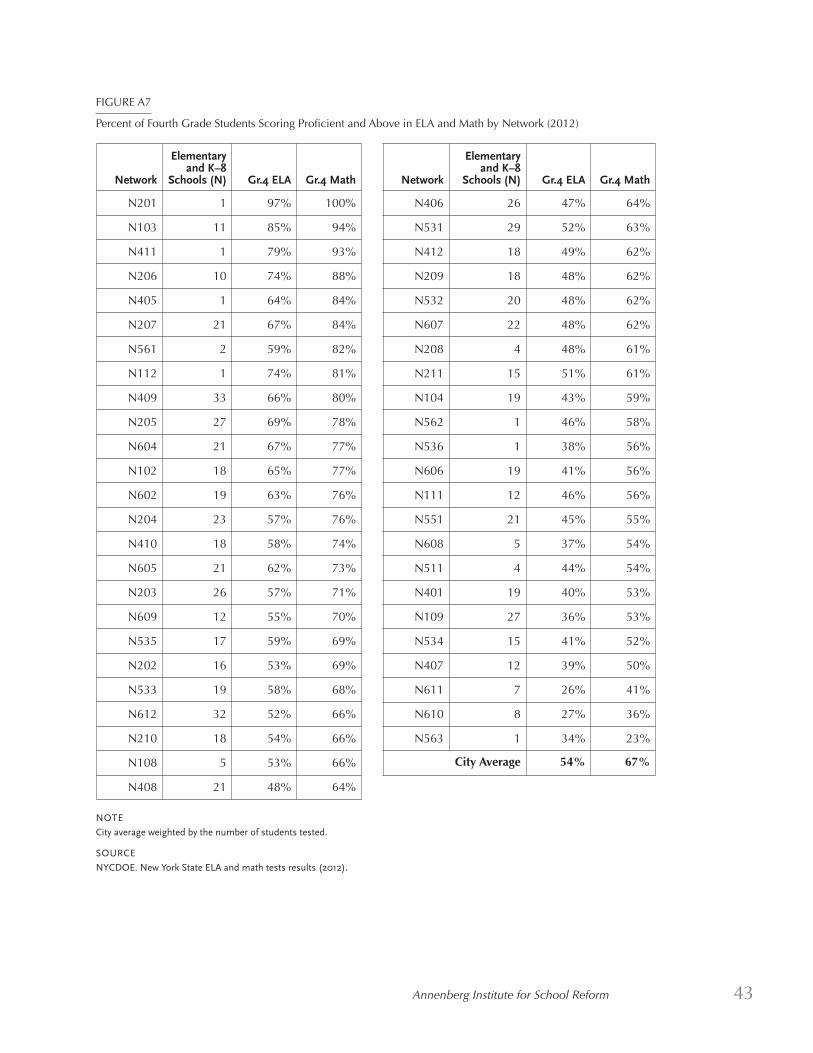
Annenberg Institute for School Reform 43
FIGURE A7
Percent of Fourth Grade Students Scoring Proficient and Above in ELA and Math by Network (2012)
NOTE
City average weighted by the number of students tested.
SOURCE
NYCDOE. New York State ELA and math tests results (2012).
Network
Elementaryand K–8
Schools (N) Gr.4 ELA Gr.4 Math
N201 1 97% 100%
N103 11 85% 94%
N411 1 79% 93%
N206 10 74% 88%
N405 1 64% 84%
N207 21 67% 84%
N561 2 59% 82%
N112 1 74% 81%
N409 33 66% 80%
N205 27 69% 78%
N604 21 67% 77%
N102 18 65% 77%
N602 19 63% 76%
N204 23 57% 76%
N410 18 58% 74%
N605 21 62% 73%
N203 26 57% 71%
N609 12 55% 70%
N535 17 59% 69%
N202 16 53% 69%
N533 19 58% 68%
N612 32 52% 66%
N210 18 54% 66%
N108 5 53% 66%
N408 21 48% 64%
Network
Elementaryand K–8
Schools (N) Gr.4 ELA Gr.4 Math
N406 26 47% 64%
N531 29 52% 63%
N412 18 49% 62%
N209 18 48% 62%
N532 20 48% 62%
N607 22 48% 62%
N208 4 48% 61%
N211 15 51% 61%
N104 19 43% 59%
N562 1 46% 58%
N536 1 38% 56%
N606 19 41% 56%
N111 12 46% 56%
N551 21 45% 55%
N608 5 37% 54%
N511 4 44% 54%
N401 19 40% 53%
N109 27 36% 53%
N534 15 41% 52%
N407 12 39% 50%
N611 7 26% 41%
N610 8 27% 36%
N563 1 34% 23%
City Average 54% 67%
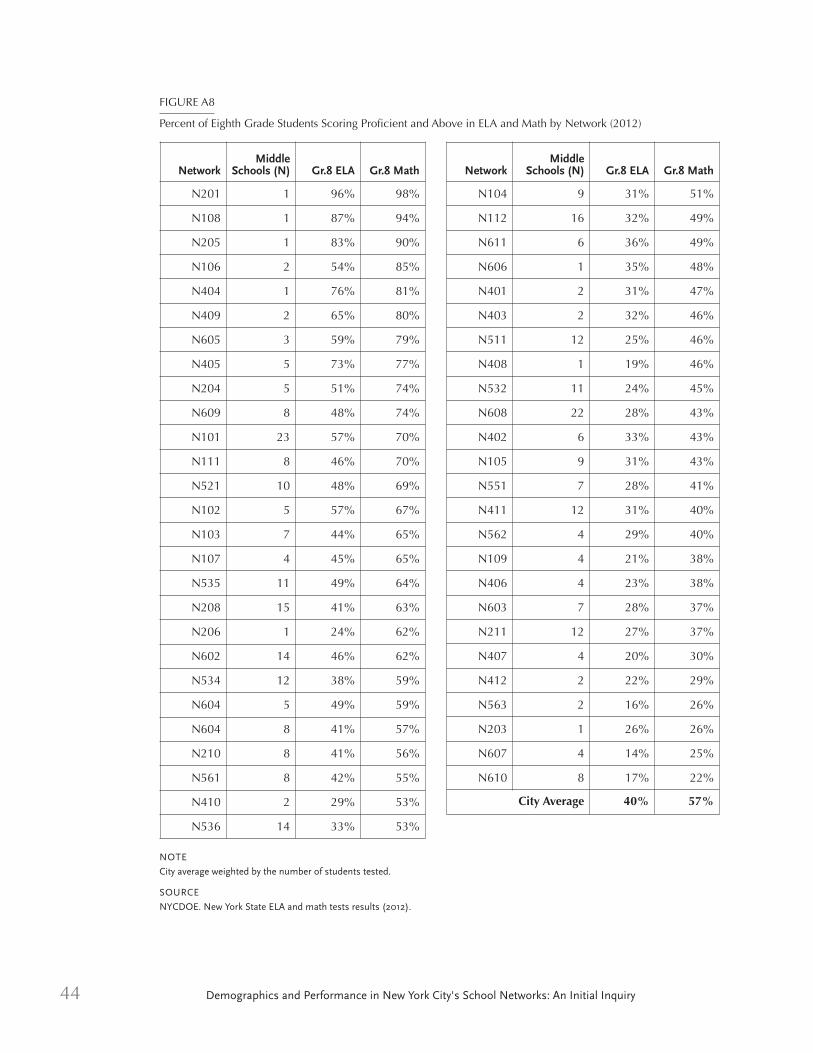
44 Demographics and Performance in New York City's School Networks: An Initial Inquiry
FIGURE A8
Percent of Eighth Grade Students Scoring Proficient and Above in ELA and Math by Network (2012)
NOTE
City average weighted by the number of students tested.
SOURCE
NYCDOE. New York State ELA and math tests results (2012).
NetworkMiddle
Schools (N) Gr.8 ELA Gr.8 Math
N201 1 96% 98%
N108 1 87% 94%
N205 1 83% 90%
N106 2 54% 85%
N404 1 76% 81%
N409 2 65% 80%
N605 3 59% 79%
N405 5 73% 77%
N204 5 51% 74%
N609 8 48% 74%
N101 23 57% 70%
N111 8 46% 70%
N521 10 48% 69%
N102 5 57% 67%
N103 7 44% 65%
N107 4 45% 65%
N535 11 49% 64%
N208 15 41% 63%
N206 1 24% 62%
N602 14 46% 62%
N534 12 38% 59%
N604 5 49% 59%
N604 8 41% 57%
N210 8 41% 56%
N561 8 42% 55%
N410 2 29% 53%
N536 14 33% 53%
NetworkMiddle
Schools (N) Gr.8 ELA Gr.8 Math
N104 9 31% 51%
N112 16 32% 49%
N611 6 36% 49%
N606 1 35% 48%
N401 2 31% 47%
N403 2 32% 46%
N511 12 25% 46%
N408 1 19% 46%
N532 11 24% 45%
N608 22 28% 43%
N402 6 33% 43%
N105 9 31% 43%
N551 7 28% 41%
N411 12 31% 40%
N562 4 29% 40%
N109 4 21% 38%
N406 4 23% 38%
N603 7 28% 37%
N211 12 27% 37%
N407 4 20% 30%
N412 2 22% 29%
N563 2 16% 26%
N203 1 26% 26%
N607 4 14% 25%
N610 8 17% 22%
City Average 40% 57%
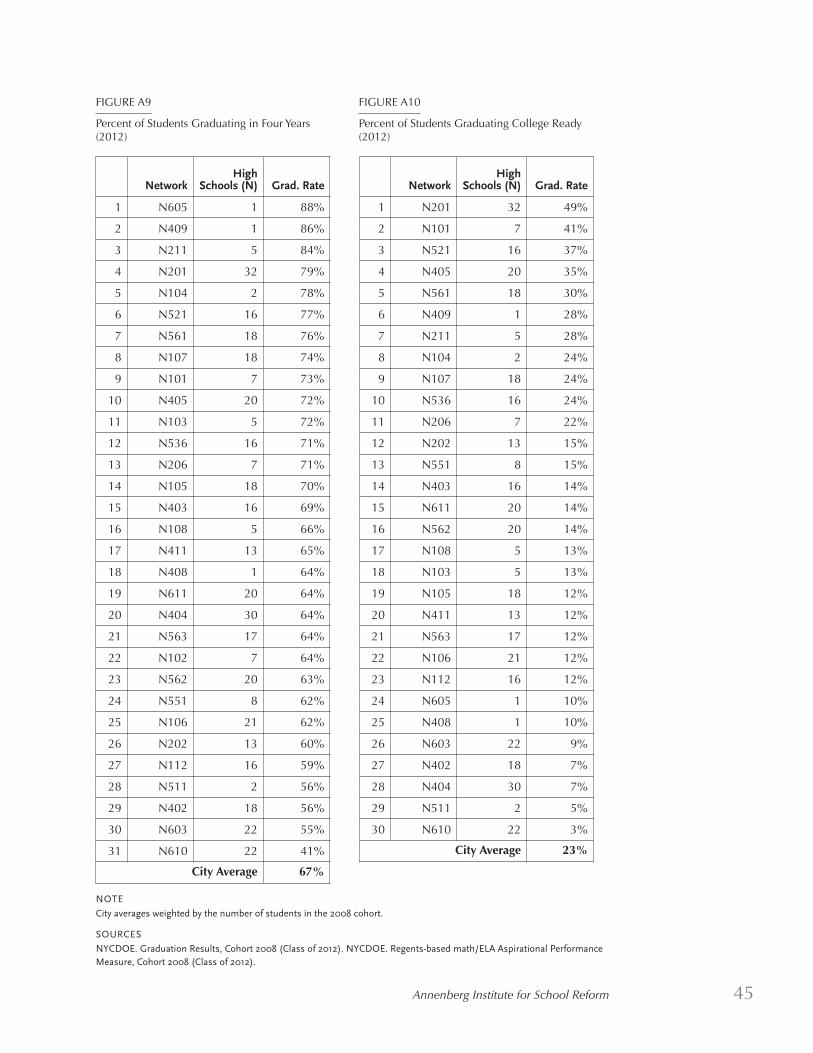
Annenberg Institute for School Reform 45
FIGURE A9
Percent of Students Graduating in Four Years(2012)
NetworkHigh
Schools (N) Grad. Rate
1 N605 1 88%
2 N409 1 86%
3 N211 5 84%
4 N201 32 79%
5 N104 2 78%
6 N521 16 77%
7 N561 18 76%
8 N107 18 74%
9 N101 7 73%
10 N405 20 72%
11 N103 5 72%
12 N536 16 71%
13 N206 7 71%
14 N105 18 70%
15 N403 16 69%
16 N108 5 66%
17 N411 13 65%
18 N408 1 64%
19 N611 20 64%
20 N404 30 64%
21 N563 17 64%
22 N102 7 64%
23 N562 20 63%
24 N551 8 62%
25 N106 21 62%
26 N202 13 60%
27 N112 16 59%
28 N511 2 56%
29 N402 18 56%
30 N603 22 55%
31 N610 22 41%
City Average 67%
NetworkHigh
Schools (N) Grad. Rate
1 N201 32 49%
2 N101 7 41%
3 N521 16 37%
4 N405 20 35%
5 N561 18 30%
6 N409 1 28%
7 N211 5 28%
8 N104 2 24%
9 N107 18 24%
10 N536 16 24%
11 N206 7 22%
12 N202 13 15%
13 N551 8 15%
14 N403 16 14%
15 N611 20 14%
16 N562 20 14%
17 N108 5 13%
18 N103 5 13%
19 N105 18 12%
20 N411 13 12%
21 N563 17 12%
22 N106 21 12%
23 N112 16 12%
24 N605 1 10%
25 N408 1 10%
26 N603 22 9%
27 N402 18 7%
28 N404 30 7%
29 N511 2 5%
30 N610 22 3%
City Average 23%
NOTE
City averages weighted by the number of students in the 2008 cohort.
SOURCES
NYCDOE. Graduation Results, Cohort 2008 (Class of 2012). NYCDOE. Regents-based math/ELA Aspirational PerformanceMeasure, Cohort 2008 (Class of 2012).
FIGURE A10
Percent of Students Graduating College Ready(2012)
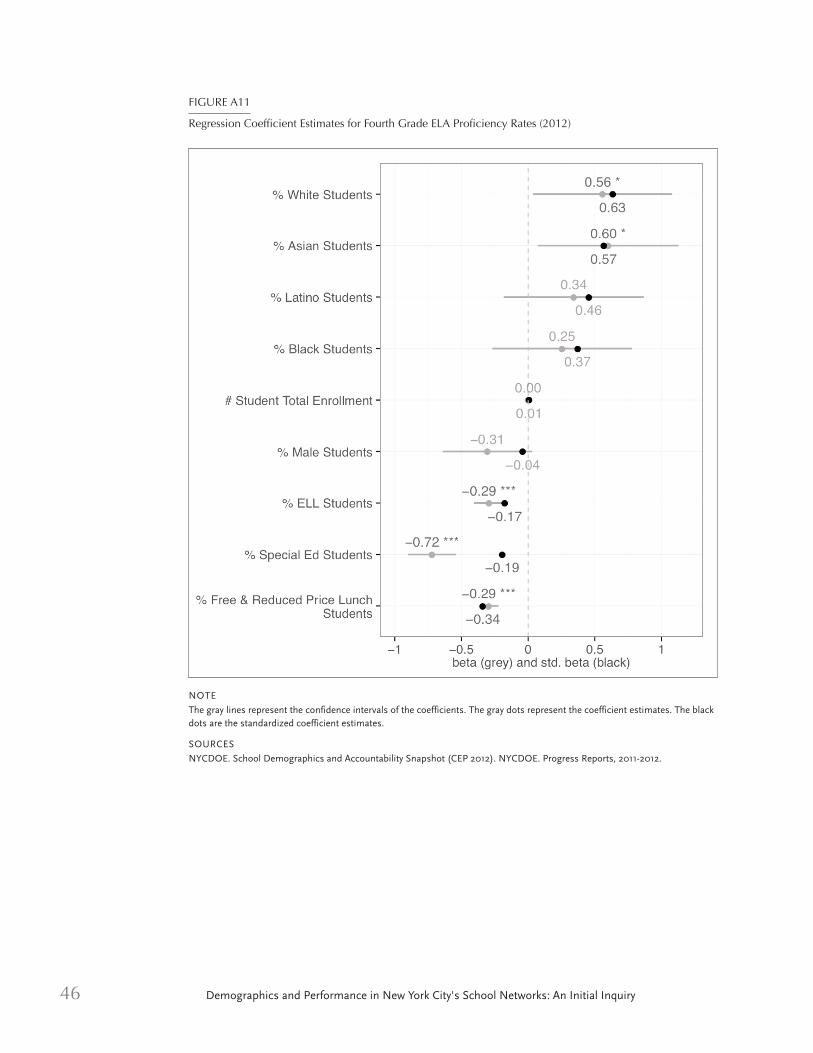
46 Demographics and Performance in New York City's School Networks: An Initial Inquiry
FIGURE A11
Regression Coefficient Estimates for Fourth Grade ELA Proficiency Rates (2012)
NOTE
The gray lines represent the confidence intervals of the coefficients. The gray dots represent the coefficient estimates. The blackdots are the standardized coefficient estimates.
SOURCES
NYCDOE. School Demographics and Accountability Snapshot (CEP 2012). NYCDOE. Progress Reports, 2011-2012.
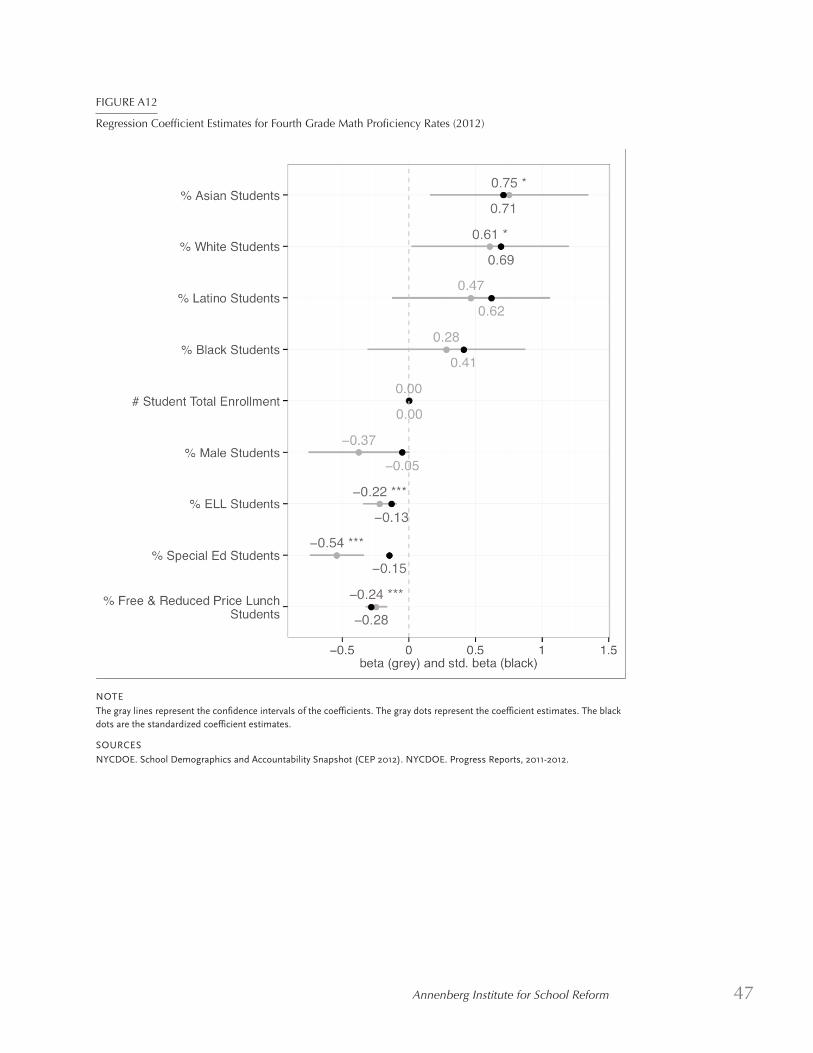
Annenberg Institute for School Reform 47
FIGURE A12
Regression Coefficient Estimates for Fourth Grade Math Proficiency Rates (2012)
NOTE
The gray lines represent the confidence intervals of the coefficients. The gray dots represent the coefficient estimates. The blackdots are the standardized coefficient estimates.
SOURCES
NYCDOE. School Demographics and Accountability Snapshot (CEP 2012). NYCDOE. Progress Reports, 2011-2012.
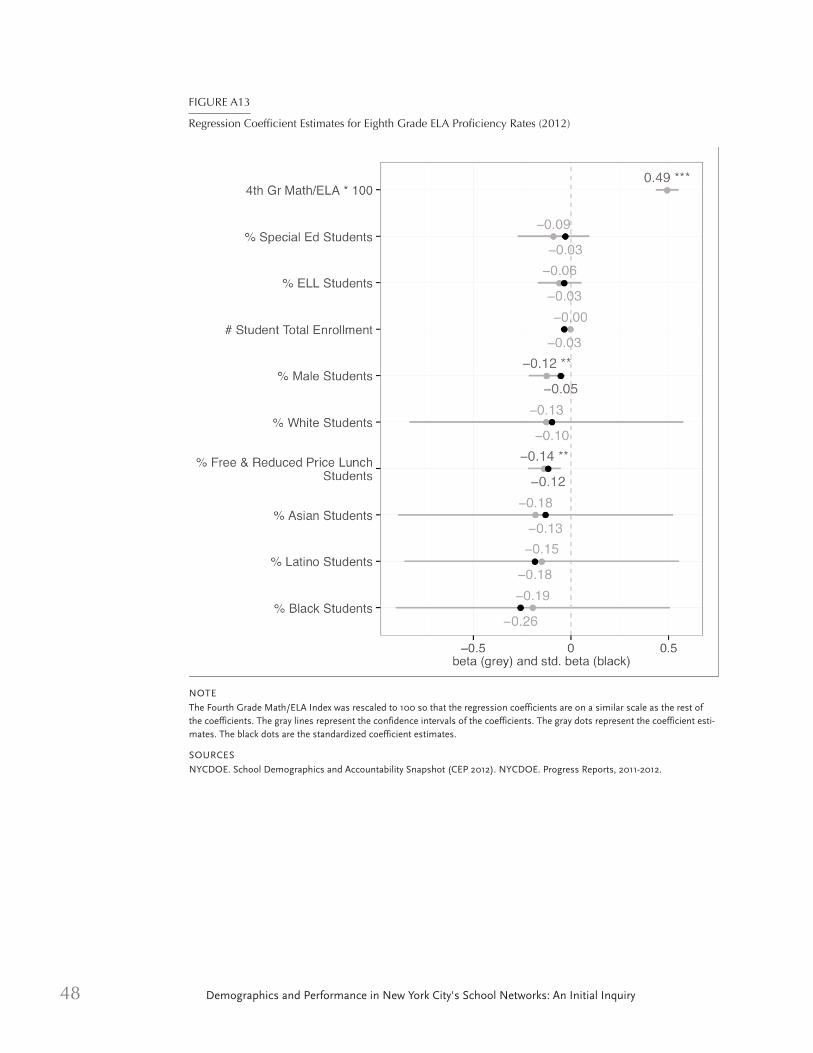
48 Demographics and Performance in New York City's School Networks: An Initial Inquiry
FIGURE A13
Regression Coefficient Estimates for Eighth Grade ELA Proficiency Rates (2012)
NOTE
The Fourth Grade Math/ELA Index was rescaled to 100 so that the regression coefficients are on a similar scale as the rest ofthe coefficients. The gray lines represent the confidence intervals of the coefficients. The gray dots represent the coefficient esti-mates. The black dots are the standardized coefficient estimates.
SOURCES
NYCDOE. School Demographics and Accountability Snapshot (CEP 2012). NYCDOE. Progress Reports, 2011-2012.
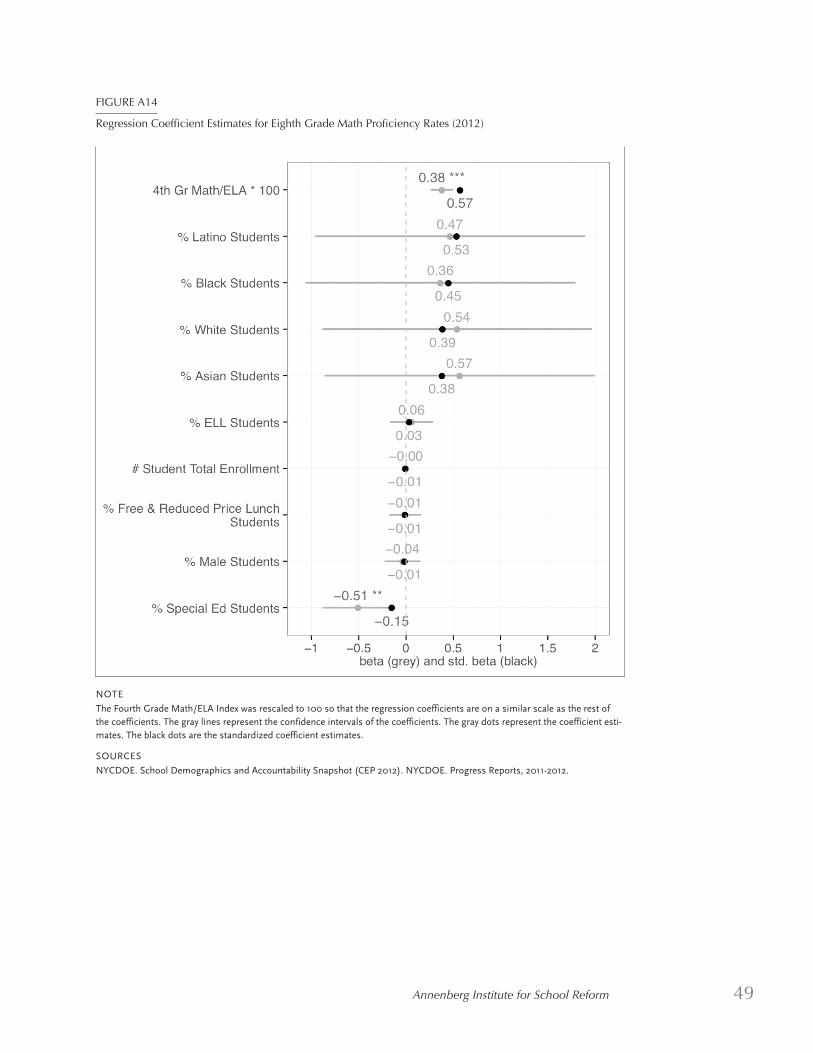
Annenberg Institute for School Reform 49
FIGURE A14
Regression Coefficient Estimates for Eighth Grade Math Proficiency Rates (2012)
NOTE
The Fourth Grade Math/ELA Index was rescaled to 100 so that the regression coefficients are on a similar scale as the rest ofthe coefficients. The gray lines represent the confidence intervals of the coefficients. The gray dots represent the coefficient esti-mates. The black dots are the standardized coefficient estimates.
SOURCES
NYCDOE. School Demographics and Accountability Snapshot (CEP 2012). NYCDOE. Progress Reports, 2011-2012.
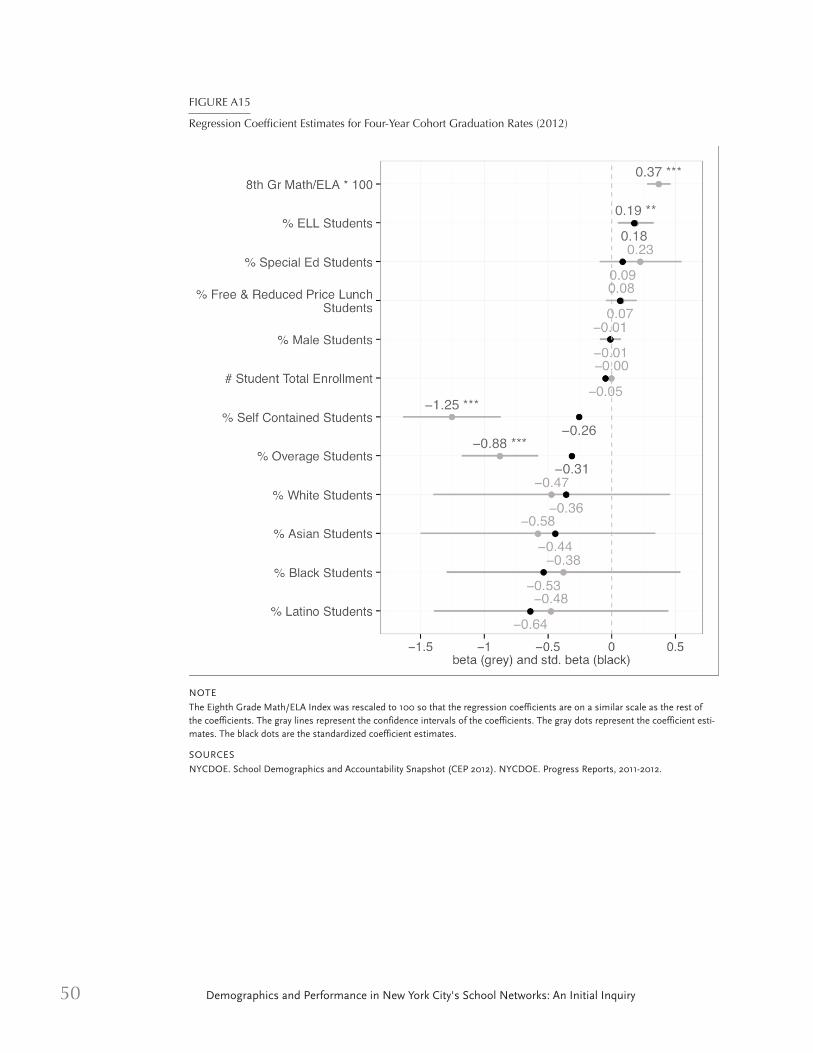
50 Demographics and Performance in New York City's School Networks: An Initial Inquiry
FIGURE A15
Regression Coefficient Estimates for Four-Year Cohort Graduation Rates (2012)
NOTE
The Eighth Grade Math/ELA Index was rescaled to 100 so that the regression coefficients are on a similar scale as the rest ofthe coefficients. The gray lines represent the confidence intervals of the coefficients. The gray dots represent the coefficient esti-mates. The black dots are the standardized coefficient estimates.
SOURCES
NYCDOE. School Demographics and Accountability Snapshot (CEP 2012). NYCDOE. Progress Reports, 2011-2012.
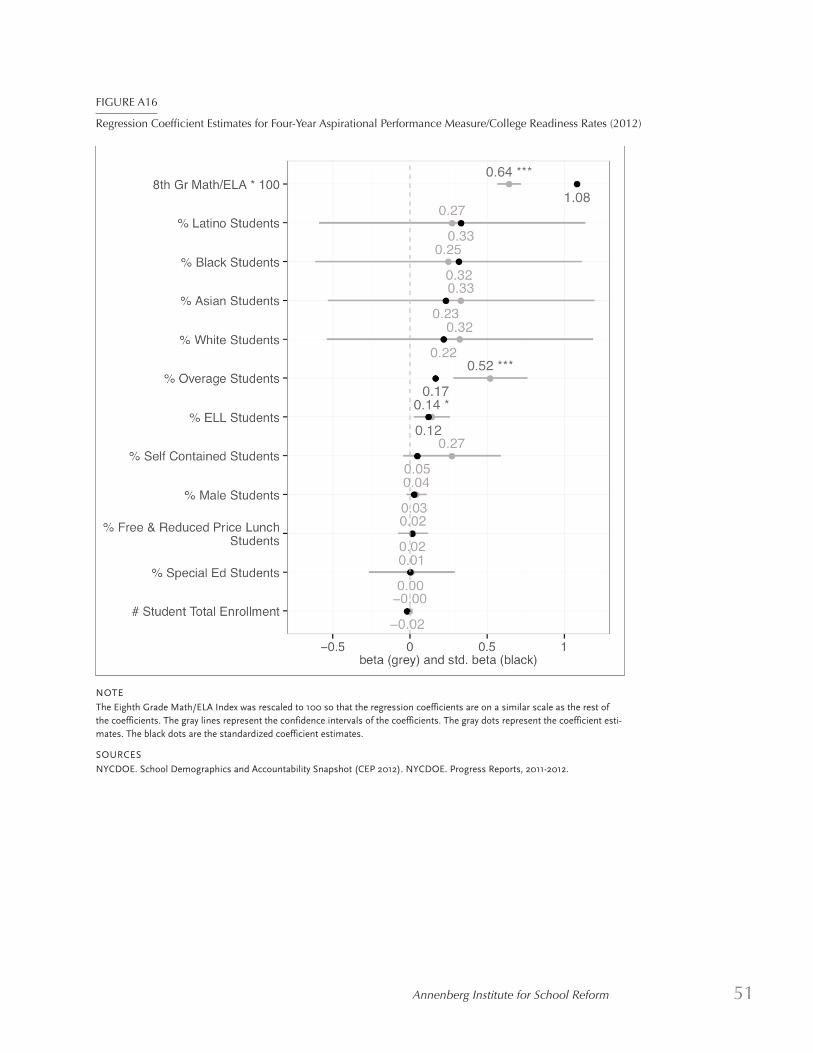
Annenberg Institute for School Reform 51
FIGURE A16
Regression Coefficient Estimates for Four-Year Aspirational Performance Measure/College Readiness Rates (2012)
NOTE
The Eighth Grade Math/ELA Index was rescaled to 100 so that the regression coefficients are on a similar scale as the rest ofthe coefficients. The gray lines represent the confidence intervals of the coefficients. The gray dots represent the coefficient esti-mates. The black dots are the standardized coefficient estimates.
SOURCES
NYCDOE. School Demographics and Accountability Snapshot (CEP 2012). NYCDOE. Progress Reports, 2011-2012.
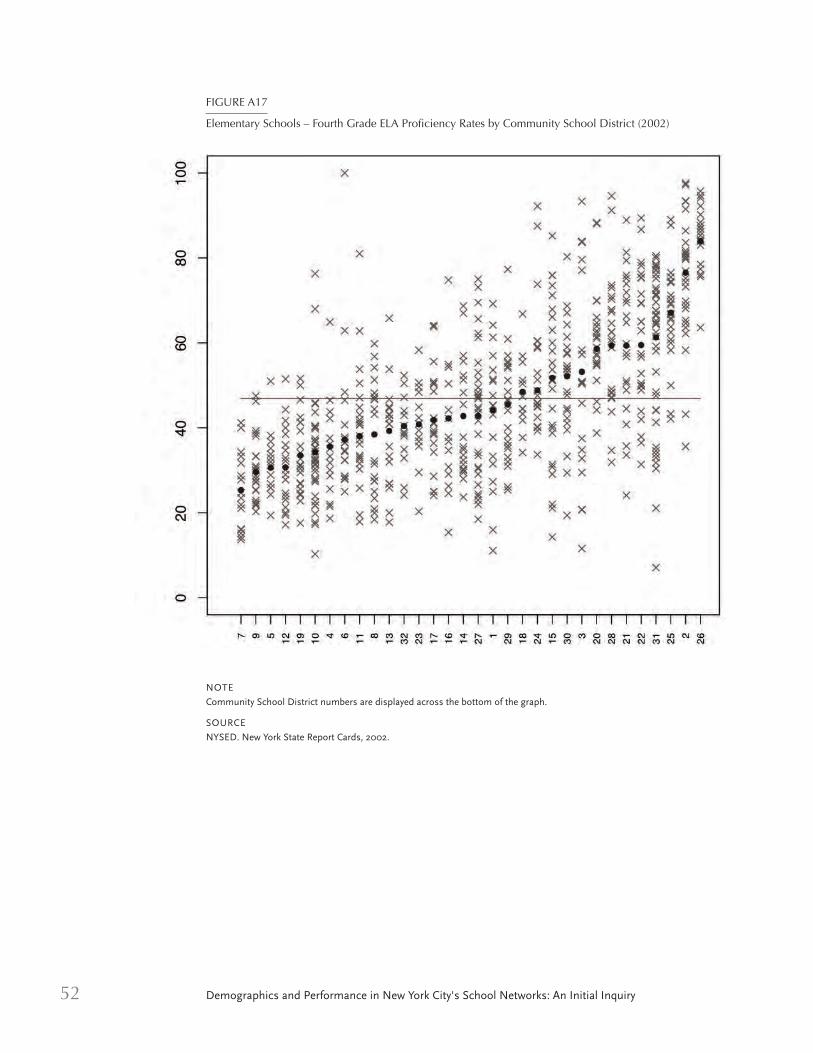
52 Demographics and Performance in New York City's School Networks: An Initial Inquiry
FIGURE A17
Elementary Schools – Fourth Grade ELA Proficiency Rates by Community School District (2002)
NOTE
Community School District numbers are displayed across the bottom of the graph.
SOURCE
NYSED. New York State Report Cards, 2002.
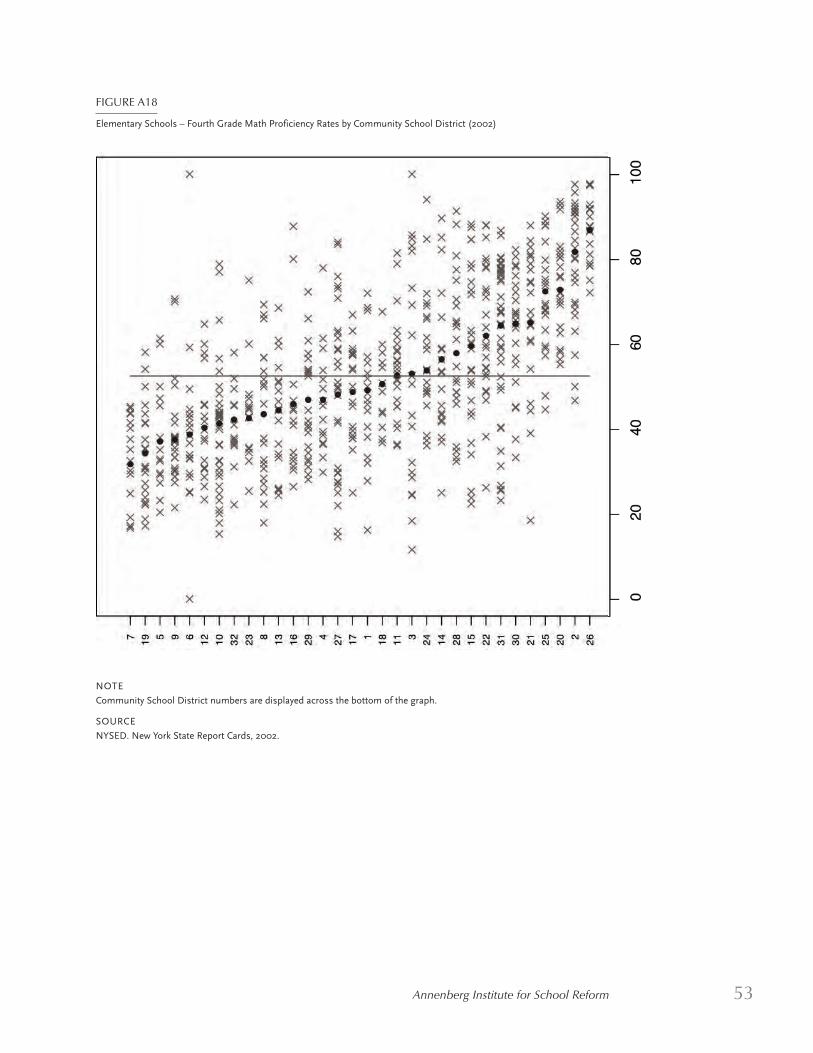
Annenberg Institute for School Reform 53
FIGURE A18
Elementary Schools – Fourth Grade Math Proficiency Rates by Community School District (2002)
NOTE
Community School District numbers are displayed across the bottom of the graph.
SOURCE
NYSED. New York State Report Cards, 2002.
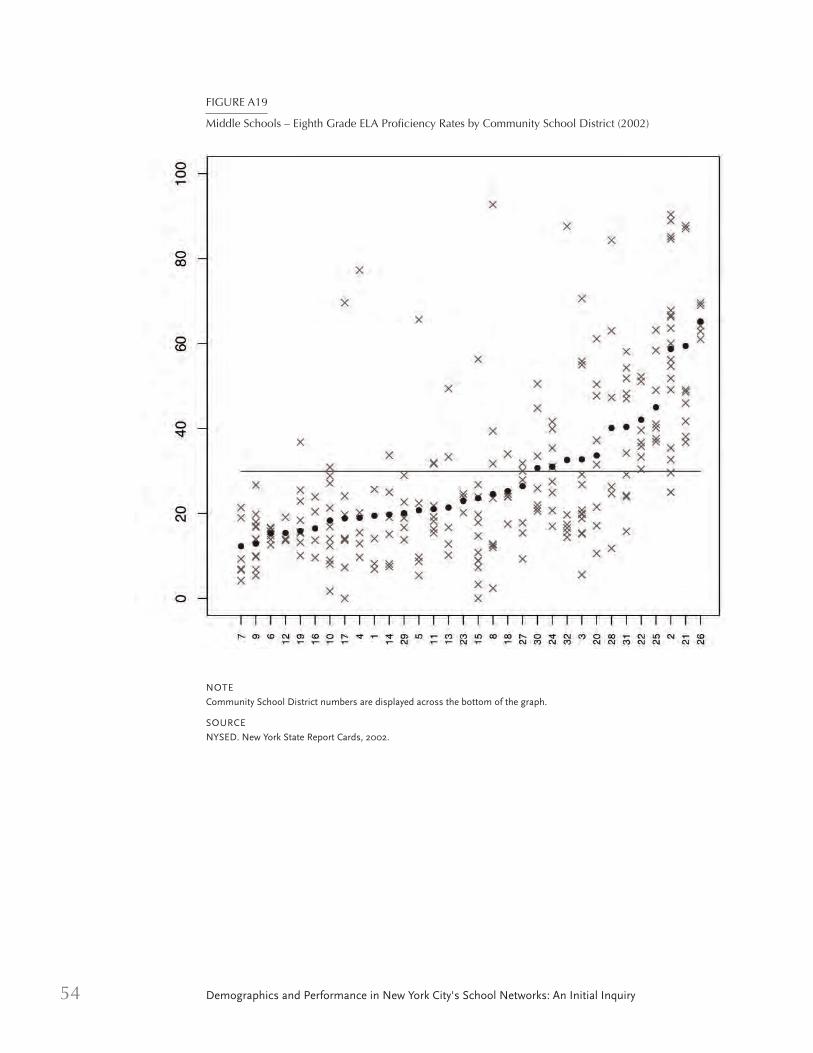
54 Demographics and Performance in New York City's School Networks: An Initial Inquiry
FIGURE A19
Middle Schools – Eighth Grade ELA Proficiency Rates by Community School District (2002)
NOTE
Community School District numbers are displayed across the bottom of the graph.
SOURCE
NYSED. New York State Report Cards, 2002.
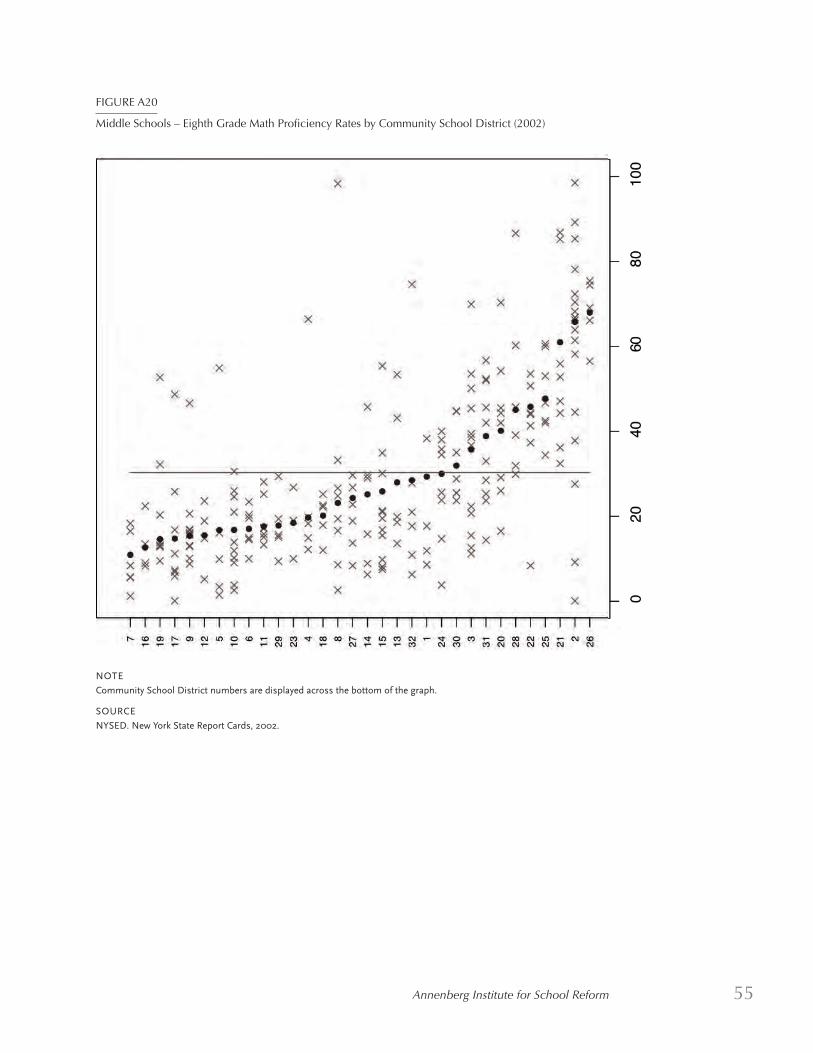
Annenberg Institute for School Reform 55
NOTE
Community School District numbers are displayed across the bottom of the graph.
SOURCE
NYSED. New York State Report Cards, 2002.
FIGURE A20
Middle Schools – Eighth Grade Math Proficiency Rates by Community School District (2002)