Embed Size (px)
Citation preview
5
Comprehensive Land Use Planning DEMOGRAPHY
Volume 2
A Guide to Sectoral Studies
in the CLUP Preparation
I. INTRODUCTION
Literally translated from the Greek language, the term demography means description of the people. The Multi-Lingual Demographic dictionary of the United Nations defines demography as the scientific study of the human population primarily with respect to size, structure and development. It is therefore concerned with the current size and characteristics of human population, how they were attained and how they are changing.
Population, as defined in the Glossary of Definition of the National statistical Coordination Board (NSCB) is the total number of individuals in a territory at a specified time. It covers both nationals and aliens; native- and foreign-born persons, internees, refugees and other groups physically present within the borders of a country at a specified time. Thus, the total population of the planning area i.e. the city or municipality, is the number of individuals physically present at a specified time, that is the census period. The demographic profile provides planners and users of the Comprehensive Land Use Plan (CLUP) a backgrounder and general information on the population composition and distribution of the city/ municipality. The changes in population brought about by its components such as birth, death, and migration relate to the historical and projected growth of the population. Population composition includes the characteristics of the population in terms of age groupings and sex ratios. It provides the basis for social and economic planning considerations. Economic dependency ratios and participation measures as in labor force participation ratios are derived from population composition data. School age population and the enrollment participation ratios are also derived from population composition characteristics. Population distribution which is the geographic pattern of the location of people, is important in determining centers of population, hierarchy of settlements, and growth points in the city/ municipality. Urbanization trends and density levels are also derived from population distribution patterns. It is essential to take into account population projections, its size and characteristics, at city and municipal levels, which would serve as basis for estimating future needs and potentials in short and long-range planning. Other population data include marital status, ethnic origin and dialect spoken; religious affiliation; literacy rate and number of disabled persons. Such information do not affect the total size of the population but are also determinants of the structure and composition of the population.
6
II. POPULATION AND DEVELOPMENT INTERRELATIONSHIPS A. Relevance to Sectoral Planning The essential needs of the Filipinos such as food, education, health, housing, recreation, safety and other social and cultural amenities, which the development programs aim to provide cannot be realized without taking into account the size, composition and distribution of the population. It should be understood that population is the most important set of information for planning. It is the basis for determining the level of needs for public services like schools, health centers, recreational facilities, power, water, protective services, etc. Population creates local demand for goods and services affecting the level of economic activities in sustaining their viable existence in an area. The present and projected size of the population is an equally important input in assessing housing and other basic needs adequacy as well as calculating future demand. It also serves as a guide for allocating land for various uses. The following topics illustrate the usage of population data by different sectors. 1. Social Sectors (Education, Health, Housing, Sports and Recreation, Social Welfare and
Protective Services)
a. Education The age structure and population age groups determine the number of school-going age population, and their impact on educational facilities and manpower requirements. The geographical distribution and density of population should be considered in the distribution/location of educational services and facilities. b. Health, Nutrition and Family Planning Population size would be a parameter in the analysis of health facility and health manpower requirements. Birth and death rates are important indicators in planning maternal and child health services as well as in family planning other health-related development services/programs. c. Housing and Community Development An increasing population connotes an increasing demand for housing with necessary amenities and livelihood opportunities. Squatter settlement sizes and rates of expansion of the informal sectors have to be estimated in order to help shape relocation and housing targets in order to provide them with decent housing. d. Social Services and Welfare Services Data about age cohorts by age and economic circumstances are necessary in quantifying potential social welfare services demand. Similarly, a census of the physically handicapped and survey results showing the magnitude of those below the poverty line are necessary inputs in planning for welfare and livelihood programs related to these needs of those vulnerable groups of the population.
7
e. Peace and Order/Protective Services Population size, its growth would determine the number of peace keeping personnel that the city/ municipality would require. 2. Economic Services (Agriculture, Commerce and Trade, Industry and Tourism) Population size, its growth, its spatial and age distribution affect the demand for economic good and services (food, clothing, and other manufactured products), the mix of industrial output and the need to generate employment opportunities. Population density and rural population would exert impact on finite/limited cultivable land resources, thus raising concerns for intensive cultivation to increase productivity or encroachment on forest areas. a. Labor and Employment Analysis of the labor force determines the predominant development sectors in terms of employment of the population in an area, that is, the possible labor market. Areas with considerable unemployment may be determined and the data can guide the planners in redirecting development towards the area to create job opportunities for existing and projected population. 3. Infrastructure Population size and its growth determine the demand for power and water supply, drainage and sewerage and solid waste disposal systems among households. Population density is considered in planning water supply, drainage sewerage and energy systems since the concentration of potential consumers is ideal for the construction of physical facilities such as pipelines and transmission lines.
Population size, its growth and geographical distribution would bear on the planning of transportation facilities inasmuch as the flow of commodities from production to consumption areas is induced by the demand of population for such commodities. Daytime population should be considered in highly urbanized centers of the metropolis. B. Population and Sustainable Development Framework (Culled from the Gender Responsive Population & Development Planning Guide of POPCOM) Sustainable Development (SD) and Population The attainment of SD is based on the fundamental human rights of people -- women and men -- in the development process1. SD involves the interrelationships of human development, environment/
1 These are articulated in various international instruments like the International Conference on Population and development (ICPD-
POA), Agenda 21, World Summit of Social Development (WSSD), HABITAT, and Beijing Platform of Action (BPA) and Millennium Declaration.
The Millennium Declaration, which is a global consensus comprehensively map out key provisions of international instruments and
reiterates the need for all governments to address poverty at the same time ensure environmental integrity. The Millennium Development Goals (MDGs) containing 16 global targets and 48 global indicators provide concrete measures to assess development on a regular basis at country level.

8
natural resources and the economy. These interrelationships are summarized through the Gender Responsive Population and Sustainable Development Framework (Figure 1):
Figure 1. Gender-Responsive Population and Sustainable Development Framework
Population Factors
The demographic processes of fertility, mortality and migration affect the population outcomes (size, age-sex structure and spatial distribution of the population). For example, if the average number of children born to a woman of reproductive age (15-49) increased from 3 to 4, this would mean a larger number of children aged 0 to 14. Productive/Reproductive Capacities and Resources The impact of population outcomes on productive and reproductive capacities and resources is basically based on the perspectives that:
• men and women are the most valuable resources and constitute the pool of human resources • they are the actors and agents of development through the goods and services they produce
However, existing inequalities and discrimination against women in social, economic, cultural and political spheres need to be eliminated to ensure that women are also mobilized as key actors in development. Moreover, their contributions and capacities along the reproductive spheres need to be recognized as an important component of development. When equality and equity for men and women is attained, they are free to make informed choice about their sexual and reproductive rights; and when couples and individuals have full access to
Population Factors (OUTCOMES)
Size Structure
Distribution
(PROCESS) Fertility
Mortality Migration
Productive/ Reproductive
Capacities & Resources
(Income, Employment,
Access, Control, Participation)
Natural Capital Human Capital
Economic Capital
Development
Consumption of goods and Services
Inter-generational Well-Being/
Fulfillment of Rights of women and
men
NON-DISCRIMINAT I
ON
EMPOWERMENT: Welfare, access, participation, conscientization, control
GOOD GOVERNANCE: Effective, Transparent, Participatory, Gender-responsive
EQUITY
EQUALITY
9
services including education, reproduction health/family planning, their families will be: (1) healthier resulting in greater productivity; and, (2) smaller which may result to the moderation of population growth and improvement in economic growth.
Changes in population outcomes also affect the formation and use of productive resources –natural, economic and human capital. For example, population pressure on natural resources can contribute to deforestation, erosion and degradation of the environment, which affect productive capacities, hence, the availability of goods and services. The environment and natural resources are the support system and sources of raw materials needed in the production of goods and services. Men and women to improve their lives and attain well being which is indicated by long, healthy and productive life enhanced by the fulfillment of their fundamental human rights need these goods and services. Consumption of Goods and Services
The consumption of goods and services, in turn, is partly determined by the availability of such goods and services. Thus, poor households with low purchasing power2 in the market due to low income can still increase their consumption of goods and services if they can access subsidized goods and services made available by the public sector or private donors. Otherwise, acquisition of goods and services may decrease which will eventually affect the well-being of the members of the poor households. Development The indicators of better life or well-being (that is, the capacity “to do and to be”) are partly determined by the consumption of goods and services. Thus, better health can be partly attributed to the degree of consumption of preventive and curative health services; educational attainment, by the consumption of education services; and fertility, by the use of contraceptive services, etc.
The attainment of better life or well-being, in turn, impacts on women’s and men‘s fertility behaviors, mortality patterns and migration practices, which could result in more manageable population levels that may, in the long run, contribute to the achievement of sustainable development. When people consider the social, economic and environmental consequences of their actions, the intergenerational well-being goal of sustainable development is not compromised. Gender-Responsive Governance in Population and Sustainable Development
A new world order evolved resulting from the shift of development focus from GNP to human development and well-being. Governance has to be reinvented based on the following principles: effectiveness and efficiency, transparency and accountability, participatory and gender responsiveness. These principles, which characterize good governance, basically create an enabling environment which ensures the following:
• Establishment of effective policies and mechanisms designed to address population and gender issues appropriately by all agencies and sectors;
• Elimination of barriers that impede the mainstreaming of vulnerable and marginalized groups in the development process;
2 Purchasing power refers to the amount of goods and services a given amount of money -- or, more generally, liquid assets -- can buy. As
Adam Smith noted, having money gives one the ability to "command" others' labor, so purchasing power to some extent is power over other people.
10
• Identification and removal of legal, economic and political barriers through
comprehensive policy reforms and strong affirmative action;
• Promotion and respect of people’s fundamental rights and elimination of threats to women’s lives and well being as a result of lack of power and influence.
The importance of participatory governance, which includes the civil society, particularly the women’s groups, cannot be over emphasized. This is considered vital in making development interventions that are legitimate and acceptable. III. STRATEGIC APPROACH TO DEMOGRAPHIC STUDY Demography is concerned with the collection and analysis of data relating to population indicators and the interpretation of these data against social, biological, economic, political, geographical, ecological, and historical background. A. Demographic Profiling
To provide a comprehensive demographic profile of the planning area, it is imperative that both population processes and population outcomes be taken into explicit considerations. Thus, the data requirements listed below were derived from NSO population data and POPDEV Core Indicators as defined in Annex 1, NSCB Resolution No. 14, S. 2002. (Refer to Annex 1.A for the list of core indicators and Annex 3 for the discussion on Relevant Demographic Concepts to POPDEV Planning). The basic data on population can be derived from NSO census publications. However, the local government has the option to use locally generated data/information especially in cases where there are permanent population movements, e.g. presence of resettlement projects, population dislocation due to natural calamities/force majuere, and such other events that may have triggered in or out migration. For a more gender-responsive analysis, it is suggested that data/indicators be sex-disaggregated, as much as possible. 1. Data Gathering/Collection Basic Data Requirements
Listed below are the basic data needed for demographic profiling of a planning area. While data from NSO cover significant details, the demographic characteristics may be validated and expounded using documents/reports published by other agencies/institutions and by conducting interview/primary survey.
11
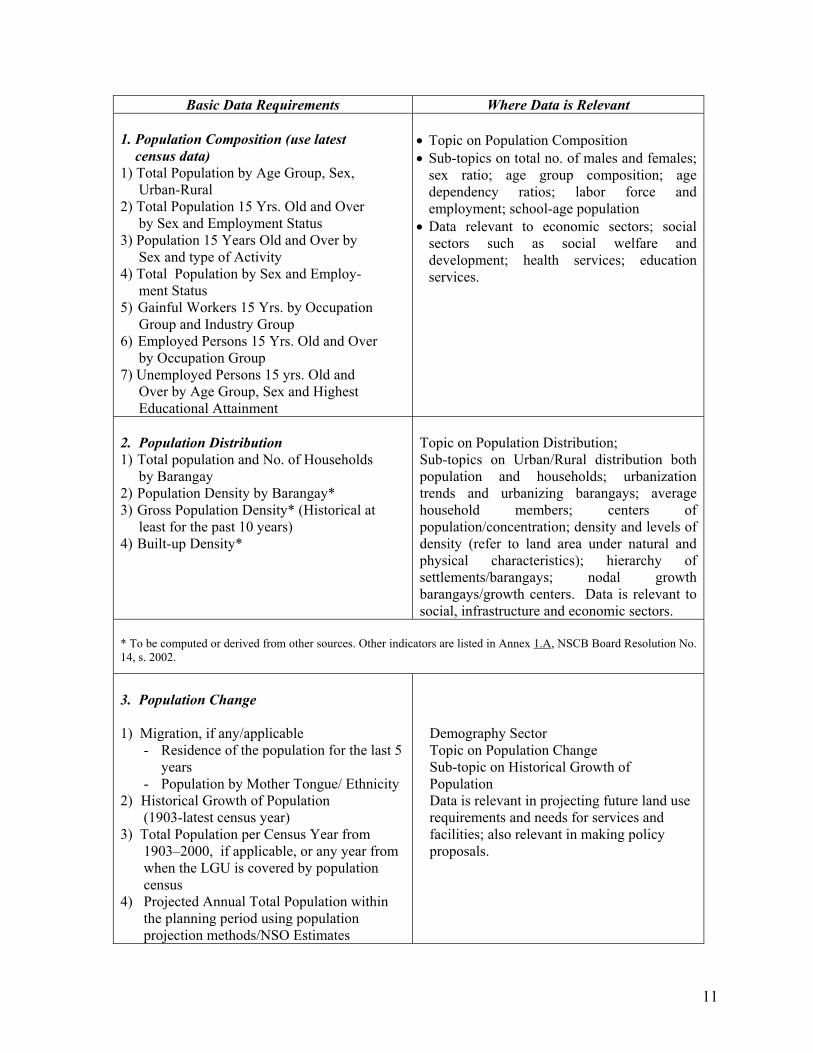
Basic Data Requirements Where Data is Relevant 1. Population Composition (use latest census data) 1) Total Population by Age Group, Sex, Urban-Rural 2) Total Population 15 Yrs. Old and Over by Sex and Employment Status 3) Population 15 Years Old and Over by Sex and type of Activity 4) Total Population by Sex and Employ- ment Status 5) Gainful Workers 15 Yrs. by Occupation Group and Industry Group 6) Employed Persons 15 Yrs. Old and Over by Occupation Group 7) Unemployed Persons 15 yrs. Old and Over by Age Group, Sex and Highest Educational Attainment
• Topic on Population Composition • Sub-topics on total no. of males and females;
sex ratio; age group composition; age dependency ratios; labor force and employment; school-age population
• Data relevant to economic sectors; social sectors such as social welfare and development; health services; education services.
2. Population Distribution 1) Total population and No. of Households by Barangay 2) Population Density by Barangay* 3) Gross Population Density* (Historical at least for the past 10 years) 4) Built-up Density*
Topic on Population Distribution; Sub-topics on Urban/Rural distribution both population and households; urbanization trends and urbanizing barangays; average household members; centers of population/concentration; density and levels of density (refer to land area under natural and physical characteristics); hierarchy of settlements/barangays; nodal growth barangays/growth centers. Data is relevant to social, infrastructure and economic sectors.
* To be computed or derived from other sources. Other indicators are listed in Annex 1.A, NSCB Board Resolution No. 14, s. 2002.
3. Population Change 1) Migration, if any/applicable
- Residence of the population for the last 5 years
- Population by Mother Tongue/ Ethnicity 2) Historical Growth of Population
(1903-latest census year) 3) Total Population per Census Year from
1903–2000, if applicable, or any year from when the LGU is covered by population census
4) Projected Annual Total Population within the planning period using population projection methods/NSO Estimates
Demography Sector Topic on Population Change Sub-topic on Historical Growth of Population Data is relevant in projecting future land use requirements and needs for services and facilities; also relevant in making policy proposals.
12
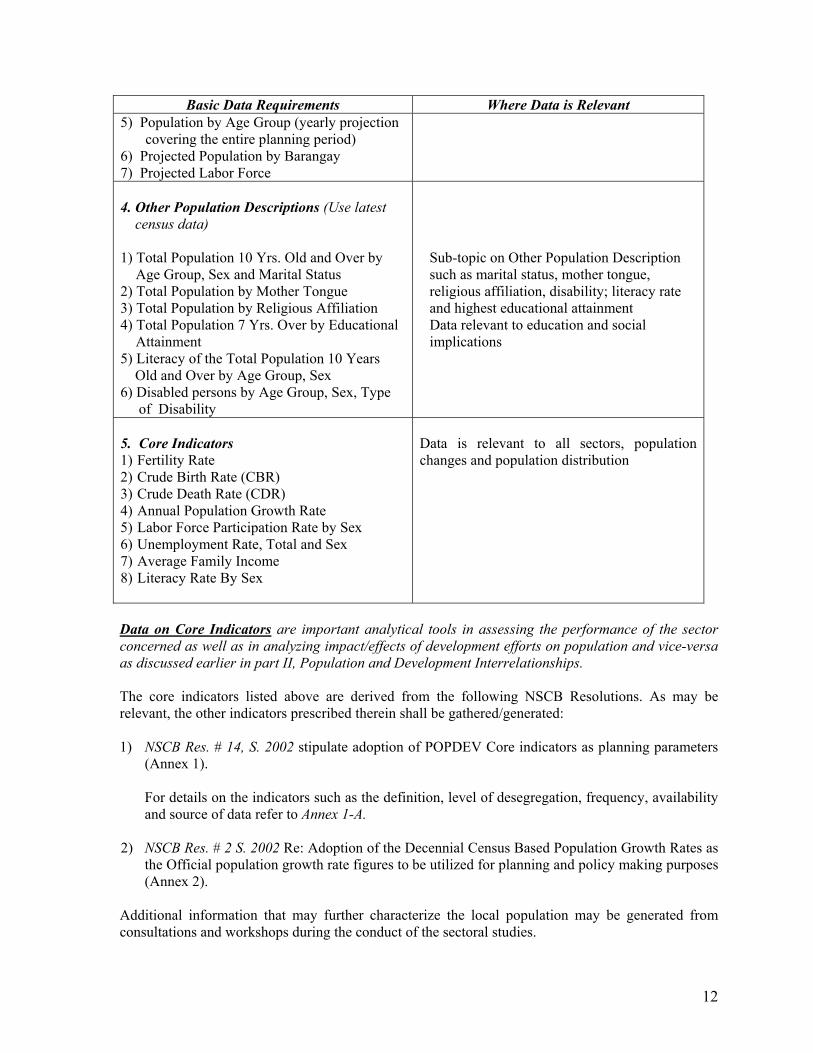
Basic Data Requirements Where Data is Relevant 5) Population by Age Group (yearly projection
covering the entire planning period) 6) Projected Population by Barangay 7) Projected Labor Force 4. Other Population Descriptions (Use latest census data) 1) Total Population 10 Yrs. Old and Over by
Age Group, Sex and Marital Status 2) Total Population by Mother Tongue 3) Total Population by Religious Affiliation 4) Total Population 7 Yrs. Over by Educational
Attainment 5) Literacy of the Total Population 10 Years Old and Over by Age Group, Sex 6) Disabled persons by Age Group, Sex, Type of Disability
Sub-topic on Other Population Description such as marital status, mother tongue, religious affiliation, disability; literacy rate and highest educational attainment Data relevant to education and social implications
5. Core Indicators 1) Fertility Rate 2) Crude Birth Rate (CBR) 3) Crude Death Rate (CDR) 4) Annual Population Growth Rate 5) Labor Force Participation Rate by Sex 6) Unemployment Rate, Total and Sex 7) Average Family Income 8) Literacy Rate By Sex
Data is relevant to all sectors, population changes and population distribution
Data on Core Indicators are important analytical tools in assessing the performance of the sector concerned as well as in analyzing impact/effects of development efforts on population and vice-versa as discussed earlier in part II, Population and Development Interrelationships. The core indicators listed above are derived from the following NSCB Resolutions. As may be relevant, the other indicators prescribed therein shall be gathered/generated: 1) NSCB Res. # 14, S. 2002 stipulate adoption of POPDEV Core indicators as planning parameters
(Annex 1). For details on the indicators such as the definition, level of desegregation, frequency, availability and source of data refer to Annex 1-A.
2) NSCB Res. # 2 S. 2002 Re: Adoption of the Decennial Census Based Population Growth Rates as
the Official population growth rate figures to be utilized for planning and policy making purposes (Annex 2).
Additional information that may further characterize the local population may be generated from consultations and workshops during the conduct of the sectoral studies.
13
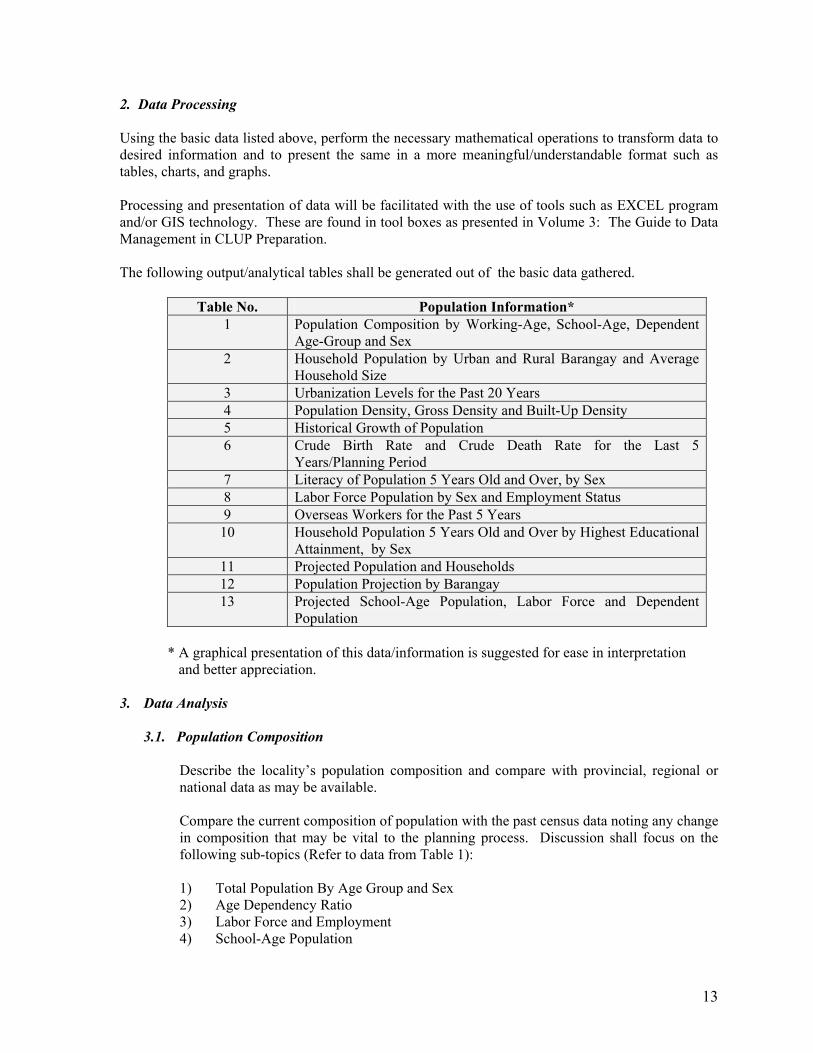
2. Data Processing Using the basic data listed above, perform the necessary mathematical operations to transform data to desired information and to present the same in a more meaningful/understandable format such as tables, charts, and graphs. Processing and presentation of data will be facilitated with the use of tools such as EXCEL program and/or GIS technology. These are found in tool boxes as presented in Volume 3: The Guide to Data Management in CLUP Preparation. The following output/analytical tables shall be generated out of the basic data gathered.
Table No. Population Information* 1 Population Composition by Working-Age, School-Age, Dependent
Age-Group and Sex 2 Household Population by Urban and Rural Barangay and Average
Household Size 3 Urbanization Levels for the Past 20 Years 4 Population Density, Gross Density and Built-Up Density 5 Historical Growth of Population 6 Crude Birth Rate and Crude Death Rate for the Last 5
Years/Planning Period 7 Literacy of Population 5 Years Old and Over, by Sex 8 Labor Force Population by Sex and Employment Status 9 Overseas Workers for the Past 5 Years
10 Household Population 5 Years Old and Over by Highest Educational Attainment, by Sex
11 Projected Population and Households 12 Population Projection by Barangay 13 Projected School-Age Population, Labor Force and Dependent
Population * A graphical presentation of this data/information is suggested for ease in interpretation and better appreciation.
3. Data Analysis
3.1. Population Composition
Describe the locality’s population composition and compare with provincial, regional or national data as may be available.
Compare the current composition of population with the past census data noting any change
in composition that may be vital to the planning process. Discussion shall focus on the following sub-topics (Refer to data from Table 1): 1) Total Population By Age Group and Sex 2) Age Dependency Ratio 3) Labor Force and Employment 4) School-Age Population
14
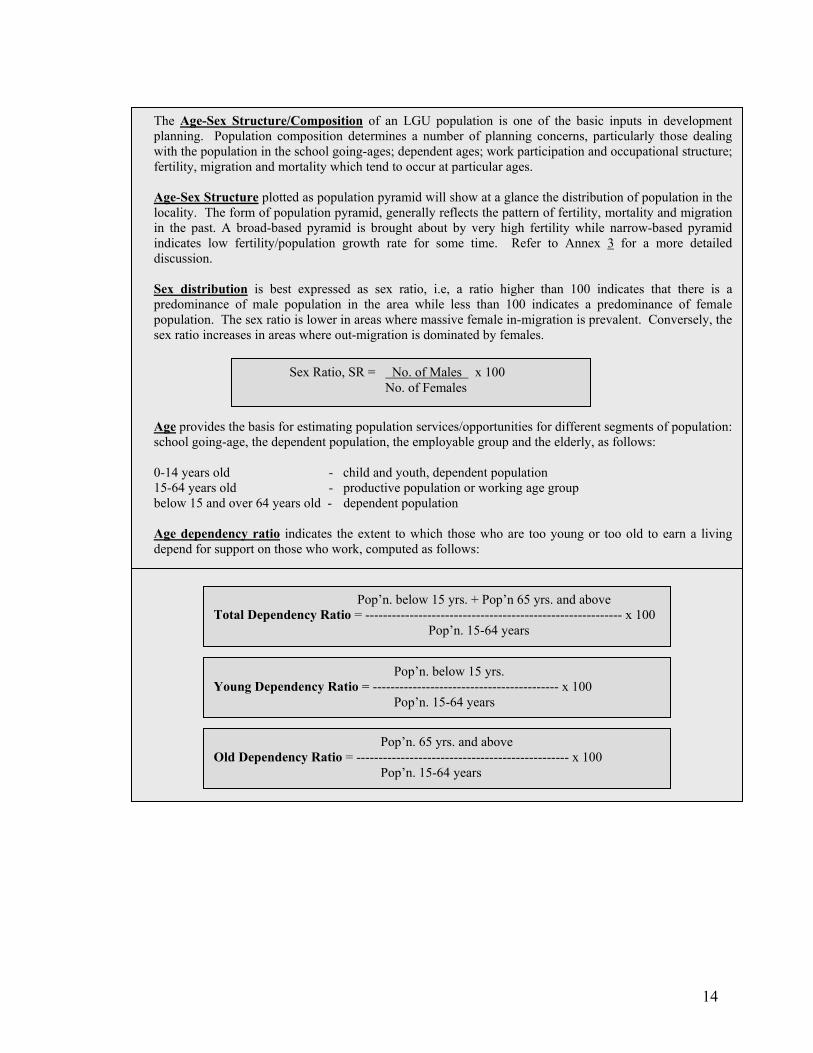
The Age-Sex Structure/Composition of an LGU population is one of the basic inputs in development planning. Population composition determines a number of planning concerns, particularly those dealing with the population in the school going-ages; dependent ages; work participation and occupational structure; fertility, migration and mortality which tend to occur at particular ages.
Age-Sex Structure plotted as population pyramid will show at a glance the distribution of population in the locality. The form of population pyramid, generally reflects the pattern of fertility, mortality and migration in the past. A broad-based pyramid is brought about by very high fertility while narrow-based pyramid indicates low fertility/population growth rate for some time. Refer to Annex 3 for a more detailed discussion.
Sex distribution is best expressed as sex ratio, i.e, a ratio higher than 100 indicates that there is a predominance of male population in the area while less than 100 indicates a predominance of female population. The sex ratio is lower in areas where massive female in-migration is prevalent. Conversely, the sex ratio increases in areas where out-migration is dominated by females.
Age provides the basis for estimating population services/opportunities for different segments of population: school going-age, the dependent population, the employable group and the elderly, as follows:
0-14 years old - child and youth, dependent population 15-64 years old - productive population or working age group below 15 and over 64 years old - dependent population
Age dependency ratio indicates the extent to which those who are too young or too old to earn a living depend for support on those who work, computed as follows:
Sex Ratio, SR = No. of Males x 100 No. of Females
Pop’n. below 15 yrs. Young Dependency Ratio = ------------------------------------------ x 100 Pop’n. 15-64 years
Pop’n. below 15 yrs. + Pop’n 65 yrs. and above Total Dependency Ratio = ---------------------------------------------------------- x 100 Pop’n. 15-64 years
Pop’n. 65 yrs. and above Old Dependency Ratio = ------------------------------------------------ x 100
Pop’n. 15-64 years
15
3.2. Population Distribution
Describe the distribution of population in the locality focusing on:
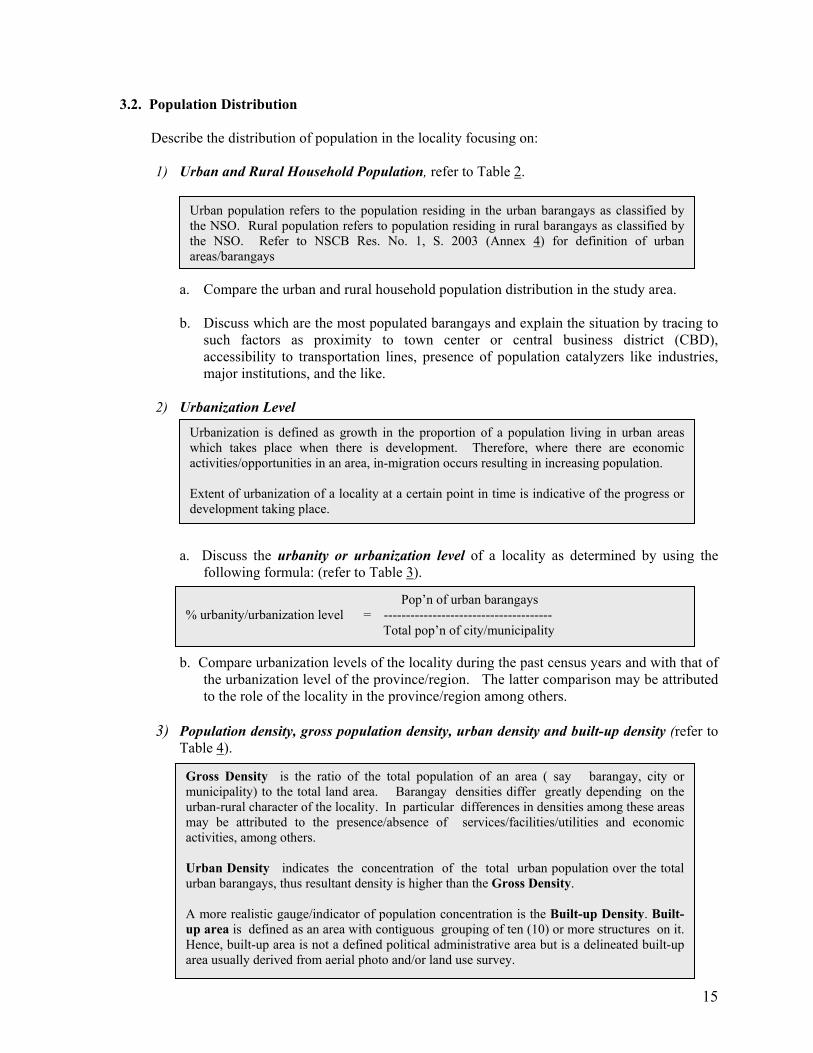
1) Urban and Rural Household Population, refer to Table 2.
a. Compare the urban and rural household population distribution in the study area. b. Discuss which are the most populated barangays and explain the situation by tracing to
such factors as proximity to town center or central business district (CBD), accessibility to transportation lines, presence of population catalyzers like industries, major institutions, and the like.
2) Urbanization Level
a. Discuss the urbanity or urbanization level of a locality as determined by using the
following formula: (refer to Table 3).
b. Compare urbanization levels of the locality during the past census years and with that of the urbanization level of the province/region. The latter comparison may be attributed to the role of the locality in the province/region among others.
3) Population density, gross population density, urban density and built-up density (refer to
Table 4).
Pop’n of urban barangays % urbanity/urbanization level = -------------------------------------- Total pop’n of city/municipality
Urbanization is defined as growth in the proportion of a population living in urban areas which takes place when there is development. Therefore, where there are economic activities/opportunities in an area, in-migration occurs resulting in increasing population. Extent of urbanization of a locality at a certain point in time is indicative of the progress or development taking place.
Urban population refers to the population residing in the urban barangays as classified by the NSO. Rural population refers to population residing in rural barangays as classified by the NSO. Refer to NSCB Res. No. 1, S. 2003 (Annex 4) for definition of urban areas/barangays
Gross Density is the ratio of the total population of an area ( say barangay, city or municipality) to the total land area. Barangay densities differ greatly depending on the urban-rural character of the locality. In particular differences in densities among these areas may be attributed to the presence/absence of services/facilities/utilities and economic activities, among others. Urban Density indicates the concentration of the total urban population over the total urban barangays, thus resultant density is higher than the Gross Density. A more realistic gauge/indicator of population concentration is the Built-up Density. Built- up area is defined as an area with contiguous grouping of ten (10) or more structures on it. Hence, built-up area is not a defined political administrative area but is a delineated built-up area usually derived from aerial photo and/or land use survey.
16
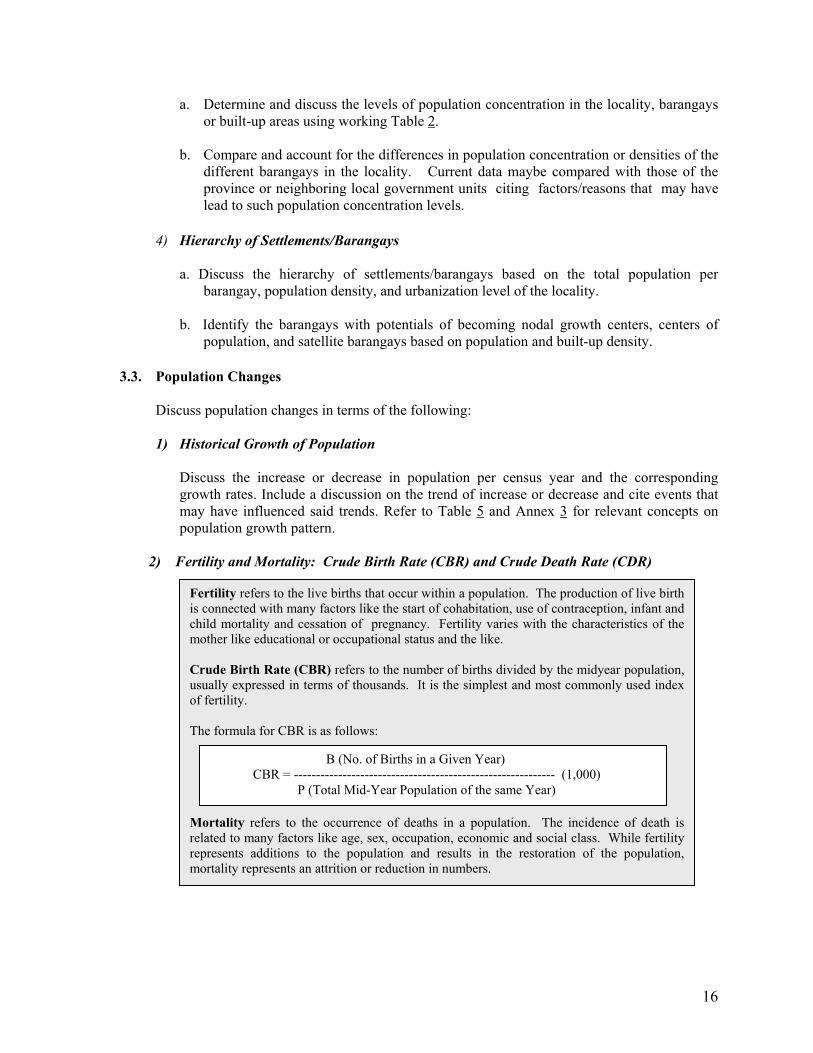
a. Determine and discuss the levels of population concentration in the locality, barangays or built-up areas using working Table 2.
b. Compare and account for the differences in population concentration or densities of the
different barangays in the locality. Current data maybe compared with those of the province or neighboring local government units citing factors/reasons that may have lead to such population concentration levels.
4) Hierarchy of Settlements/Barangays
a. Discuss the hierarchy of settlements/barangays based on the total population per barangay, population density, and urbanization level of the locality.
b. Identify the barangays with potentials of becoming nodal growth centers, centers of
population, and satellite barangays based on population and built-up density. 3.3. Population Changes
Discuss population changes in terms of the following:
1) Historical Growth of Population
Discuss the increase or decrease in population per census year and the corresponding growth rates. Include a discussion on the trend of increase or decrease and cite events that may have influenced said trends. Refer to Table 5 and Annex 3 for relevant concepts on population growth pattern.
2) Fertility and Mortality: Crude Birth Rate (CBR) and Crude Death Rate (CDR)
Fertility refers to the live births that occur within a population. The production of live birth is connected with many factors like the start of cohabitation, use of contraception, infant and child mortality and cessation of pregnancy. Fertility varies with the characteristics of the mother like educational or occupational status and the like. Crude Birth Rate (CBR) refers to the number of births divided by the midyear population, usually expressed in terms of thousands. It is the simplest and most commonly used index of fertility. The formula for CBR is as follows: Mortality refers to the occurrence of deaths in a population. The incidence of death is related to many factors like age, sex, occupation, economic and social class. While fertility represents additions to the population and results in the restoration of the population, mortality represents an attrition or reduction in numbers.
B (No. of Births in a Given Year) CBR = ----------------------------------------------------------- (1,000) P (Total Mid-Year Population of the same Year)

17
a. Present and compare the CBR and CDR of the locality for the last five years or
between two planning periods (Refer to Table 6). Any observed trend (increase/decrease) will be useful in the subsequent analysis of the health situation and in proposing for the needed interventions.
3.4. Other Population Characteristics
Analyze and discuss information and knowledge on other population descriptions using basic data gathered from NSO. Marital Status Both the marital status and age-sex distribution when analyzed can indicate the fertility pattern in a locality. Discuss which among the age group recorded the highest number of married female and relate it to the number of children ever born. Mother Tongue/Ethnicity Data on mother tongue are used in the analysis of ethnic origin of a person. Present the percentage distribution of the various dialects/languages spoken by the population. Discuss why majority of the population speak a certain dialect by relating it to the municipality’s location and immigration trend.
Religious Affiliation Mention the various religions in the locality and give percentage distribution of each. This information shall be useful input for the LGUs in determining required places of worship per religious affiliation.
Literacy Rate Literacy rate is the percentage of the population who have at least completed a year in elementary education to the population seven years old and over. Determine the proportion of the populace who are able to read and write. Compare the literate urban population with the rural population. (Refer to Table 7).
Crude Death Rate (CDR) similar to CBR, CDR is a rough measure of mortality. It refers to the number of deaths per 1,000 population. CDR is computed by dividing the number of deaths in a given year by the mid-year population of the same year multiplied by 1,000. Refer to Annex 3 for more detailed discussion of the concepts.
D (No. of Deaths in a Given Year) CDR = ----------------------------------------------------------- (1,000) P (Total Mid-Year Population of the same Year)
18
Labor Force Labor force or the economically active population refers to population 15 years old and above who are either employed or unemployed. Of the labor force population, compute for the percentage of those employed and unemployed, by sex. Employed persons refer to those engaged in any of the major occupation. (Refer to Table 8). Determine which among the major occupation has the highest number of employed persons and examine the distribution to major industry group.
Other relevant information Discuss other characteristics of the population that may have significance to the planning process such as disabled persons, migration pattern, overseas workers, etc. (Refer to Tables 9 to 13).
B. Population Projections and Estimates
Population Projections are a basic requirement in planning a city/municipality. These projections are primarily used as basis for estimating future needs for basic services (e.g., education and health services), determining level of demand for facilities and utilities, economic-related needs and corresponding spatial requirements, among others. There are three basic methods in projecting the future level of population, namely:
a. Mathematical method – estimates the future population using mathematical formulae such as the geometric rate, exponential growth rate and in some cases the participation rate or the ratio and proportion method.
b. Economic method – considering that population growth is closely related to changing
economic circumstances, the future population can also be projected in terms of future economic conditions. This method depends on a projection of the future employment opportunities or job-population ratios in the future.
c. Component or cohort-survival method – projects the future population by various
demographic components such as age and sex using information on births, deaths, and migration.
For simplification purposes, this manual presents only the mathematical method particularly the geometric and participation rate methods. As mentioned earlier, the official population projections published by NSO/NSCB shall be used for planning purposes. The planner is therefore suggested to coordinate/consult with the Provincial or Regional Census Officer before making projections, as city/municipal estimates may have already been done. The LGU may decide to use locally generated population base data as warranted by local developments/situation.
19
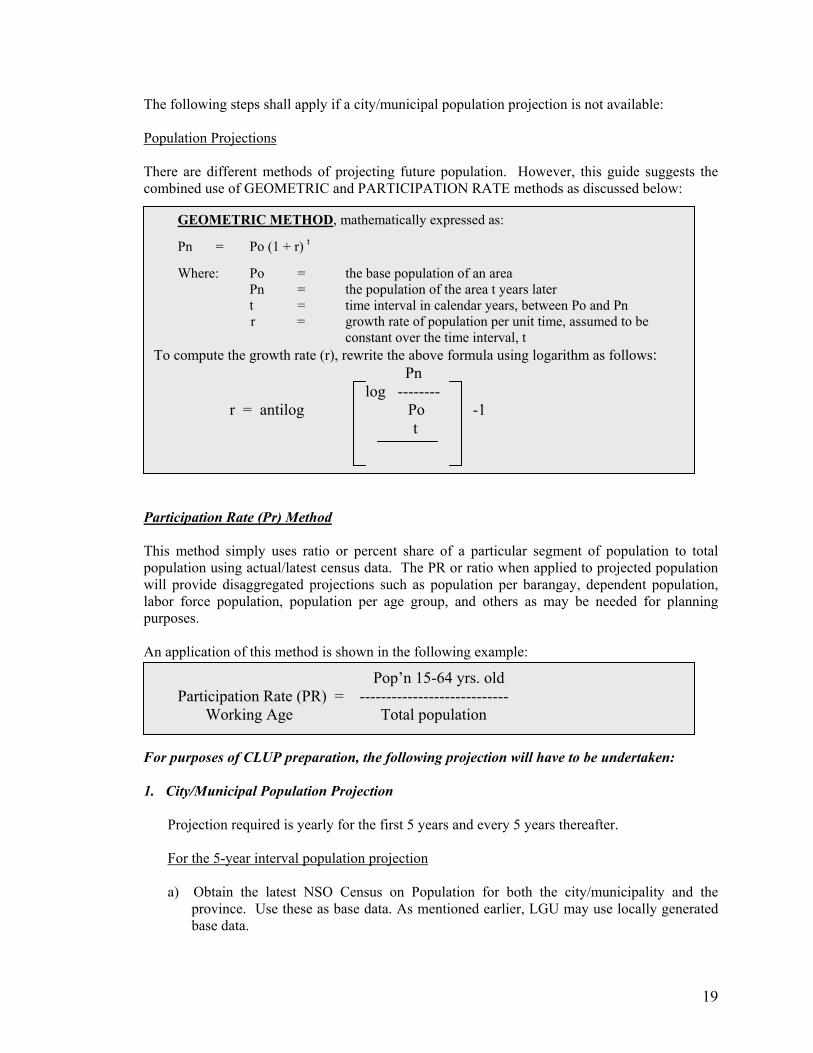
The following steps shall apply if a city/municipal population projection is not available: Population Projections There are different methods of projecting future population. However, this guide suggests the combined use of GEOMETRIC and PARTICIPATION RATE methods as discussed below:
Participation Rate (Pr) Method
This method simply uses ratio or percent share of a particular segment of population to total population using actual/latest census data. The PR or ratio when applied to projected population will provide disaggregated projections such as population per barangay, dependent population, labor force population, population per age group, and others as may be needed for planning purposes. An application of this method is shown in the following example: For purposes of CLUP preparation, the following projection will have to be undertaken: 1. City/Municipal Population Projection Projection required is yearly for the first 5 years and every 5 years thereafter.
For the 5-year interval population projection
a) Obtain the latest NSO Census on Population for both the city/municipality and the
province. Use these as base data. As mentioned earlier, LGU may use locally generated base data.
GEOMETRIC METHOD, mathematically expressed as: Pn = Po (1 + r) t
Where: Po = the base population of an area Pn = the population of the area t years later t = time interval in calendar years, between Po and Pn
r = growth rate of population per unit time, assumed to be constant over the time interval, t
To compute the growth rate (r), rewrite the above formula using logarithm as follows: Pn log -------- r = antilog Po -1 t
Pop’n 15-64 yrs. old Participation Rate (PR) = ---------------------------- Working Age Total population
20
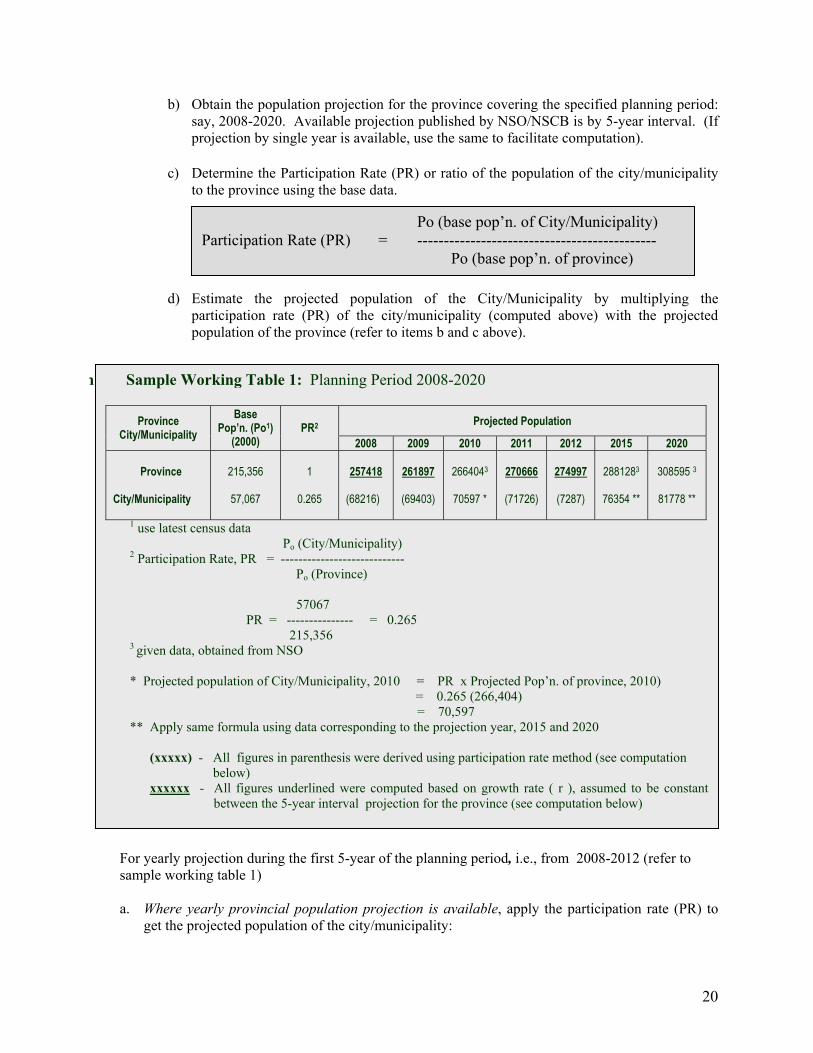
b) Obtain the population projection for the province covering the specified planning period: say, 2008-2020. Available projection published by NSO/NSCB is by 5-year interval. (If projection by single year is available, use the same to facilitate computation).
c) Determine the Participation Rate (PR) or ratio of the population of the city/municipality
to the province using the base data.
d) Estimate the projected population of the City/Municipality by multiplying the
participation rate (PR) of the city/municipality (computed above) with the projected population of the province (refer to items b and c above).
For yearly projection during the first 5-year of the planning period, i.e., from 2008-2012 (refer to sample working table 1) a. Where yearly provincial population projection is available, apply the participation rate (PR) to
get the projected population of the city/municipality:
m Sample Working Table 1: Planning Period 2008-2020
Projected Population
Province
City/Municipality Base
Pop’n. (Po1) (2000)
PR2 2008 2009 2010 2011 2012 2015 2020
Province City/Municipality
215,356
57,067
1
0.265
257418
(68216)
261897
(69403)
2664043
70597 *
270666
(71726)
274997
(7287)
2881283
76354 **
308595 3
81778 **
1 use latest census data Po (City/Municipality) 2 Participation Rate, PR = ---------------------------- Po (Province) 57067 PR = --------------- = 0.265 215,356 3 given data, obtained from NSO * Projected population of City/Municipality, 2010 = PR x Projected Pop’n. of province, 2010) = 0.265 (266,404) = 70,597 ** Apply same formula using data corresponding to the projection year, 2015 and 2020 (xxxxx) - All figures in parenthesis were derived using participation rate method (see computation below) xxxxxx - All figures underlined were computed based on growth rate ( r ), assumed to be constant
between the 5-year interval projection for the province (see computation below)
Po (base pop’n. of City/Municipality) Participation Rate (PR) = ---------------------------------------------
Po (base pop’n. of province)
21
Example: P2008 of city/municipality = PR (Projected provincial population in 2008) Do the same for year 2009, 2011 and 2012
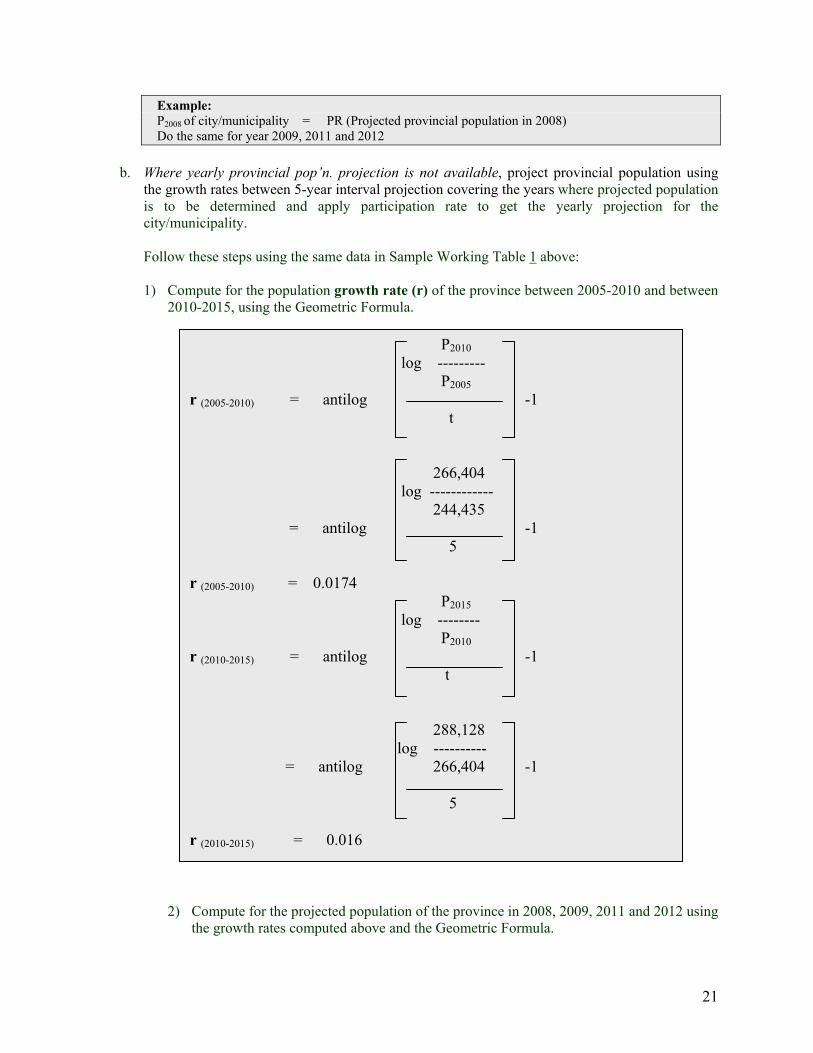
b. Where yearly provincial pop’n. projection is not available, project provincial population using
the growth rates between 5-year interval projection covering the years where projected population is to be determined and apply participation rate to get the yearly projection for the city/municipality.
Follow these steps using the same data in Sample Working Table 1 above:
1) Compute for the population growth rate (r) of the province between 2005-2010 and between
2010-2015, using the Geometric Formula.
2) Compute for the projected population of the province in 2008, 2009, 2011 and 2012 using the growth rates computed above and the Geometric Formula.
P2010 log --------- P2005 r (2005-2010) = antilog -1 t 266,404 log ------------ 244,435 = antilog -1 5 r (2005-2010) = 0.0174
P2015 log -------- P2010 r (2010-2015) = antilog -1 t
288,128 log ---------- = antilog 266,404 -1 5 r (2010-2015) = 0.016
22
3) Compute for the projected population for the city/municipality in 2008, 2009, 2011 and 2012
using the PR computed above, refer to sample working Table 1.
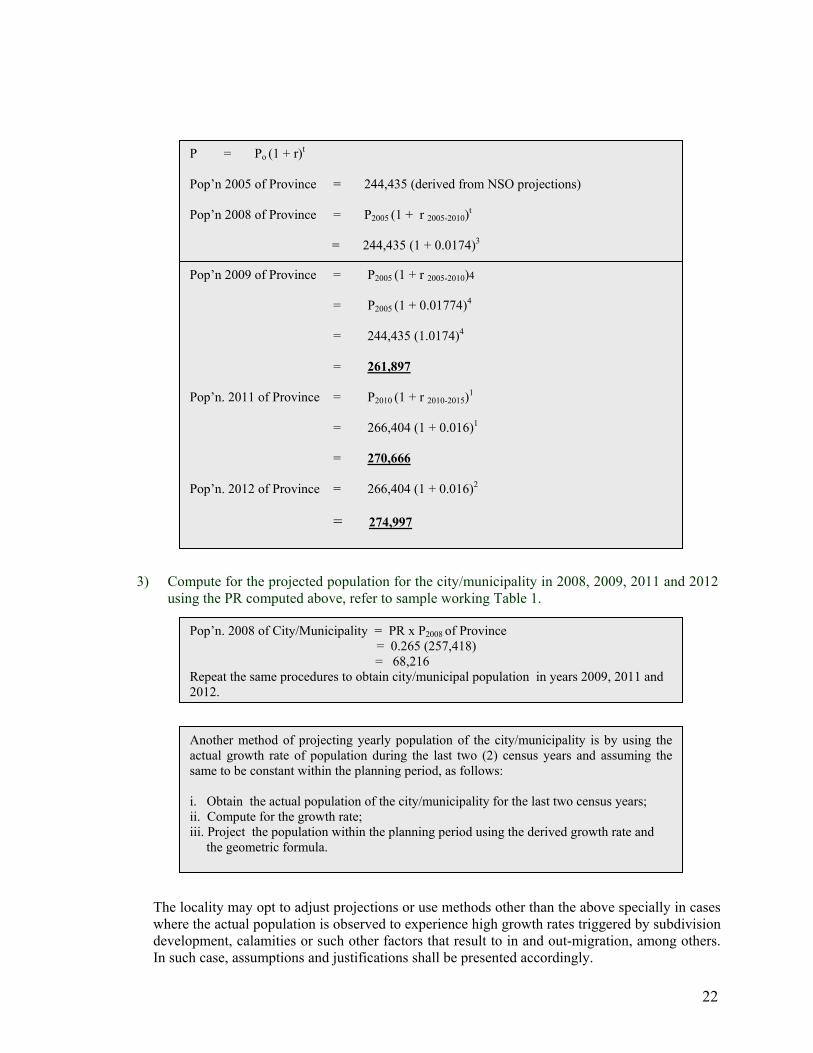
P = Po (1 + r)t
Pop’n 2005 of Province = 244,435 (derived from NSO projections)
Pop’n 2008 of Province = P2005 (1 + r 2005-2010)t
= 244,435 (1 + 0.0174)3
= 257,207 Pop’n 2009 of Province = P2005 (1 + r 2005-2010)4
= P2005 (1 + 0.01774)4
= 244,435 (1.0174)4
= 261,897 Pop’n. 2011 of Province = P2010 (1 + r 2010-2015)1
= 266,404 (1 + 0.016)1
= 270,666 Pop’n. 2012 of Province = 266,404 (1 + 0.016)2
= 274,997
Pop’n. 2008 of City/Municipality = PR x P2008 of Province = 0.265 (257,418) = 68,216
Repeat the same procedures to obtain city/municipal population in years 2009, 2011 and 2012.
Another method of projecting yearly population of the city/municipality is by using the actual growth rate of population during the last two (2) census years and assuming the same to be constant within the planning period, as follows: i. Obtain the actual population of the city/municipality for the last two census years; ii. Compute for the growth rate; iii. Project the population within the planning period using the derived growth rate and the geometric formula.
The locality may opt to adjust projections or use methods other than the above specially in cases where the actual population is observed to experience high growth rates triggered by subdivision development, calamities or such other factors that result to in and out-migration, among others. In such case, assumptions and justifications shall be presented accordingly.

23
2. Yearly Population by Barangay
a. Get the breakdown on population by barangay of the base year (see column 2 of sample working table 2)
b. Determine the participation rate (PR) or percent (%) share of each barangay to the city’s/
municipality’s total population using the base/latest census data ((see column 3 of sample working table 2)
c. Multiply the PR or percent (%) share of each barangay to each of the projected population of the
municipality obtained in the preceding section.
3. Population Projection by Age-Group The participation rate method used in projecting barangay population above applies:
Sample Working Table 2
Projected Population City/
Municipality/ Barangay
Pop’n. (Po)
(2000)
Part- icipation
Rate (PR)
2008
2009 2010 2011 2012 2015 2020
Total Barangay A Barangay B Barangay C etc.
57,067
2,879 2,806 2,554
1.00
0.050 0.049 0.044
68,216
3,411 3,343 (3,001)
69,403
3,470 3,401 3,054
70,597
3,530 3,459 3,106
71,726
3,586 3,515 3,156
72,874
3,644 3,571 3,206
76,354
3,818 3,741 3,360
81,778
4,089 4,007 3,598
Sample Computation: xxxxx - projected population of the city/municipality previously computed . Bgy. Pop’n. PR = ------------------------------------------- Pop’n. of city/municipality 2,879 PR, Bgy. A = --------------- = 0.05 57,067 Projected Pop’n Bgy. = PR of Bgy x Projected Pop,n of city/municipality Projected Pop’n for Bgy A: Pop’n. 2008 = 0.05 x 68.216 = 3,411 Pop’n. 2009 = 0.05 x 69.403 = 3,470 Pop’n. 2010 = 0.05 x 70,597 = 3,530 etc. Repeat the process for the succeeding years and for the rest of the barangays.
24
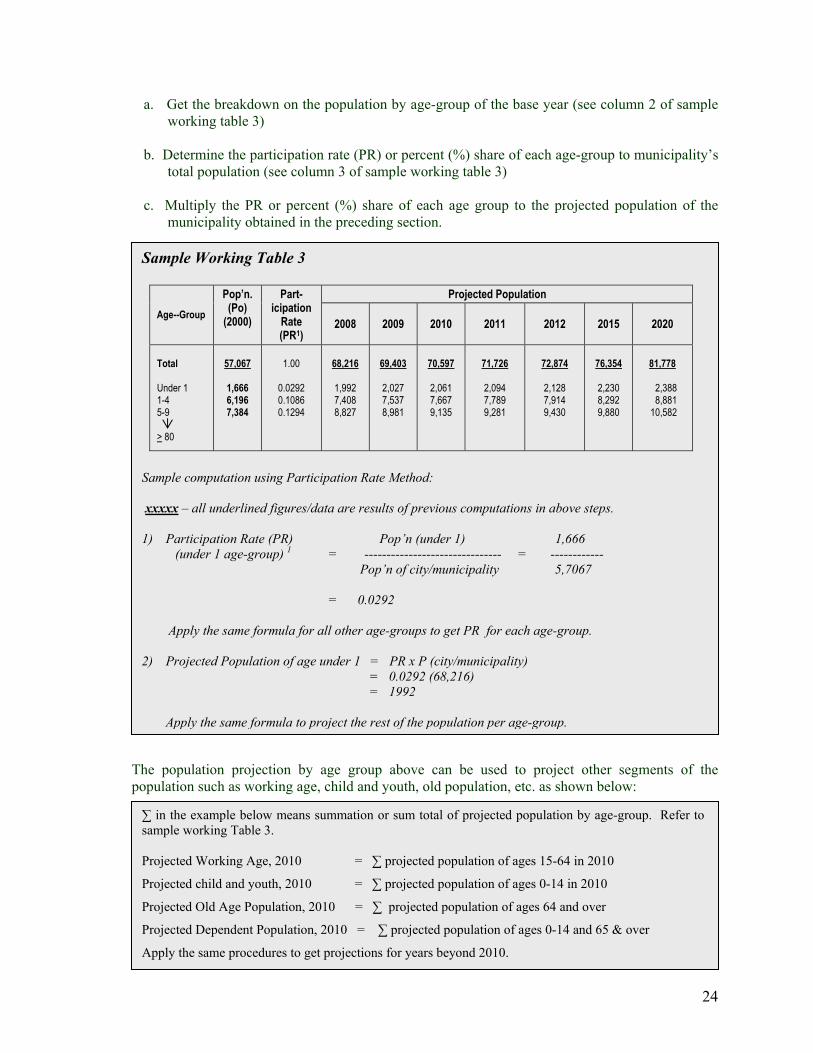
a. Get the breakdown on the population by age-group of the base year (see column 2 of sample working table 3)
b. Determine the participation rate (PR) or percent (%) share of each age-group to municipality’s
total population (see column 3 of sample working table 3)
c. Multiply the PR or percent (%) share of each age group to the projected population of the municipality obtained in the preceding section.
The population projection by age group above can be used to project other segments of the population such as working age, child and youth, old population, etc. as shown below:
Sample Working Table 3
Projected Population Age--Group
Pop’n. (Po)
(2000)
Part- icipation
Rate (PR1)
2008
2009 2010 2011 2012 2015 2020
Total Under 1 1-4 5-9 > 80
57,067
1,666 6,196 7,384
1.00
0.0292 0.1086 0.1294
68,216
1,992 7,408 8,827
69,403
2,027 7,537 8,981
70,597
2,061 7,667 9,135
71,726
2,094 7,789 9,281
72,874
2,128 7,914 9,430
76,354
2,230 8,292 9,880
81,778
2,388 8,881 10,582
Sample computation using Participation Rate Method: xxxxx – all underlined figures/data are results of previous computations in above steps. 1) Participation Rate (PR) Pop’n (under 1) 1,666 (under 1 age-group) 1 = ------------------------------- = ------------ Pop’n of city/municipality 5,7067 = 0.0292 Apply the same formula for all other age-groups to get PR for each age-group. 2) Projected Population of age under 1 = PR x P (city/municipality) = 0.0292 (68,216) = 1992 Apply the same formula to project the rest of the population per age-group.
∑ in the example below means summation or sum total of projected population by age-group. Refer to sample working Table 3. Projected Working Age, 2010 = ∑ projected population of ages 15-64 in 2010
Projected child and youth, 2010 = ∑ projected population of ages 0-14 in 2010
Projected Old Age Population, 2010 = ∑ projected population of ages 64 and over
Projected Dependent Population, 2010 = ∑ projected population of ages 0-14 and 65 & over
Apply the same procedures to get projections for years beyond 2010.
25
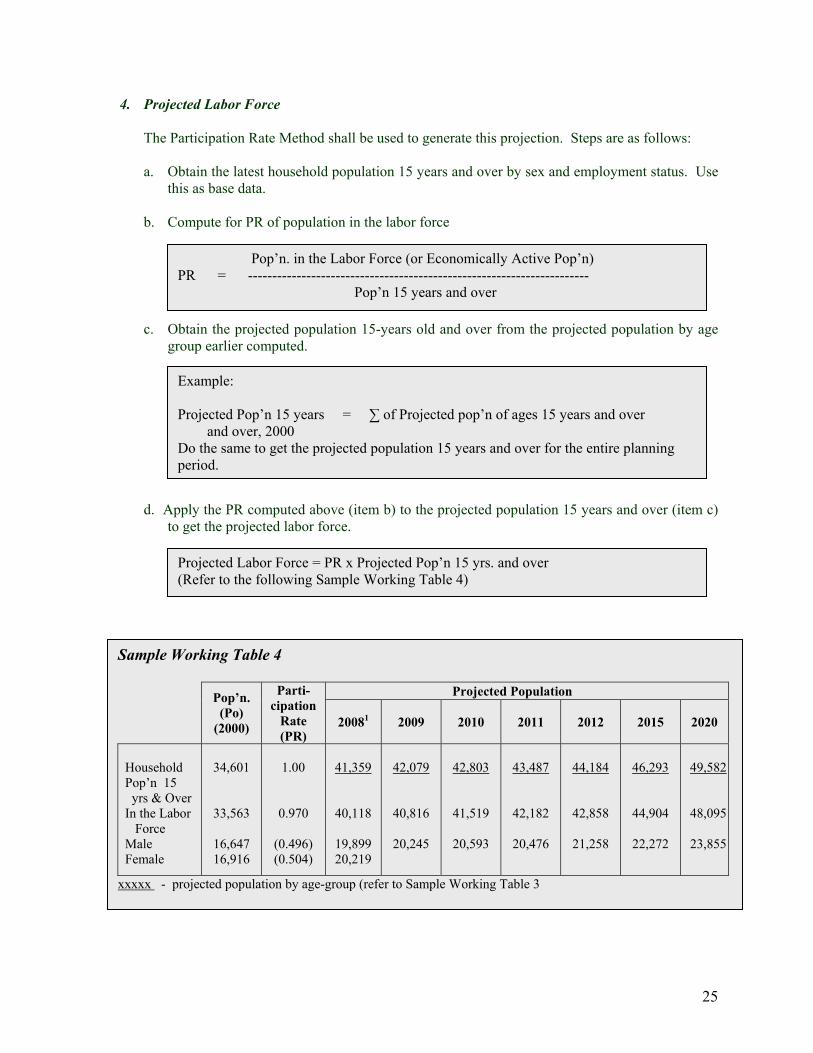
4. Projected Labor Force The Participation Rate Method shall be used to generate this projection. Steps are as follows:
a. Obtain the latest household population 15 years and over by sex and employment status. Use this as base data.
b. Compute for PR of population in the labor force
c. Obtain the projected population 15-years old and over from the projected population by age group earlier computed.
d. Apply the PR computed above (item b) to the projected population 15 years and over (item c)
to get the projected labor force.
Pop’n. in the Labor Force (or Economically Active Pop’n) PR = ---------------------------------------------------------------------- Pop’n 15 years and over
Example:
Projected Pop’n 15 years = ∑ of Projected pop’n of ages 15 years and over and over, 2000 Do the same to get the projected population 15 years and over for the entire planning period.
Sample Working Table 4
Projected Population
Pop’n. (Po)
(2000)
Parti-cipation
Rate (PR)
20081 2009 2010 2011 2012 2015 2020
Household Pop’n 15 yrs & Over In the Labor Force Male Female
34,601
33,563
16,647 16,916
1.00
0.970
(0.496) (0.504)
41,359
40,118
19,899 20,219
42,079
40,816
20,245
42,803
41,519
20,593
43,487
42,182
20,476
44,184
42,858
21,258
46,293
44,904
22,272
49,582
48,095
23,855
xxxxx - projected population by age-group (refer to Sample Working Table 3
Projected Labor Force = PR x Projected Pop’n 15 yrs. and over (Refer to the following Sample Working Table 4)
26
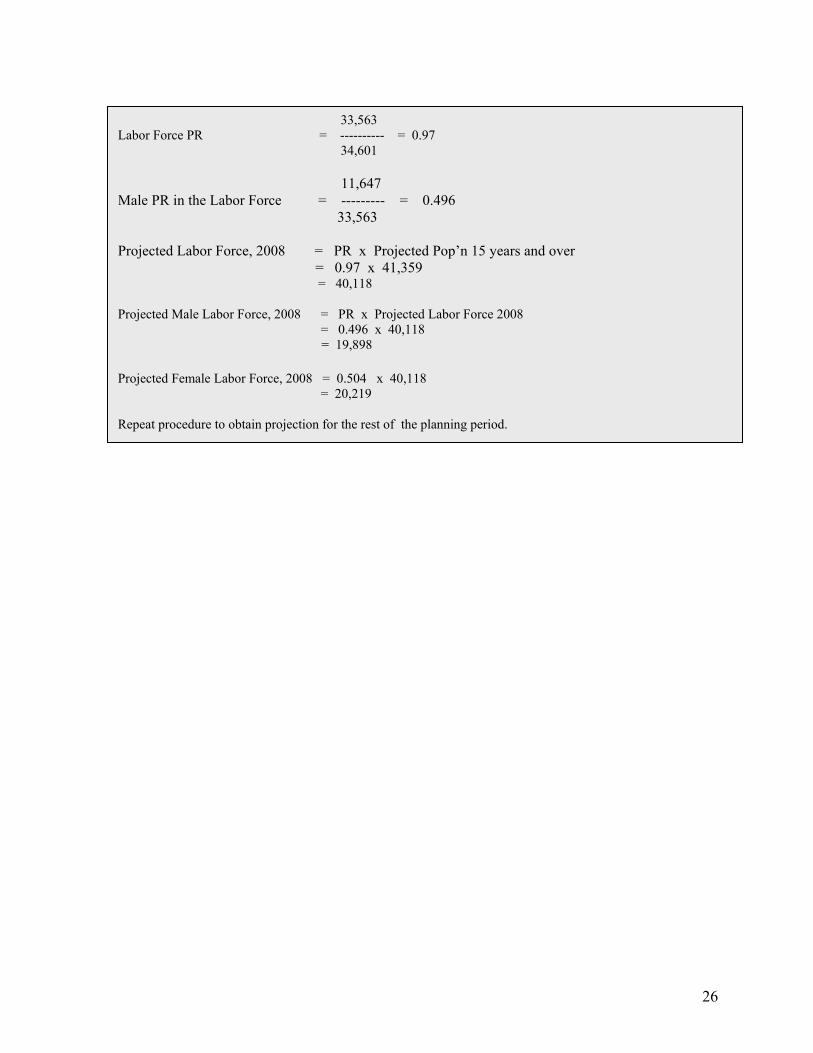
33,563 Labor Force PR = ---------- = 0.97 34,601 11,647 Male PR in the Labor Force = --------- = 0.496 33,563 Projected Labor Force, 2008 = PR x Projected Pop’n 15 years and over = 0.97 x 41,359
= 40,118 Projected Male Labor Force, 2008 = PR x Projected Labor Force 2008 = 0.496 x 40,118 = 19,898 Projected Female Labor Force, 2008 = 0.504 x 40,118 = 20,219 Repeat procedure to obtain projection for the rest of the planning period.
27
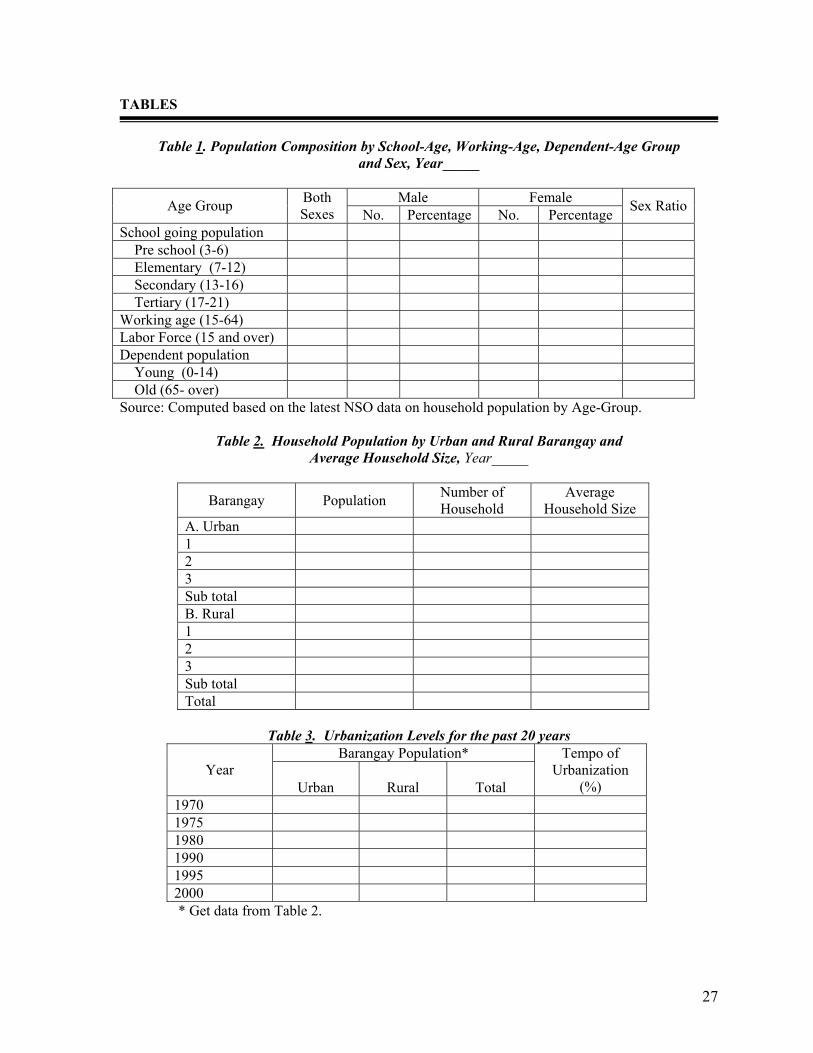
TABLES
Table 1. Population Composition by School-Age, Working-Age, Dependent-Age Group
and Sex, Year_____
Male Female Age Group Both Sexes No. Percentage No. Percentage Sex Ratio
School going population Pre school (3-6) Elementary (7-12) Secondary (13-16) Tertiary (17-21) Working age (15-64) Labor Force (15 and over) Dependent population Young (0-14) Old (65- over) Source: Computed based on the latest NSO data on household population by Age-Group.
Table 2. Household Population by Urban and Rural Barangay and Average Household Size, Year_____
Barangay Population Number of Household
Average Household Size
A. Urban 1 2 3 Sub total B. Rural 1 2 3 Sub total Total
Table 3. Urbanization Levels for the past 20 years
Barangay Population* Year
Urban
Rural
Total
Tempo of Urbanization
(%) 1970 1975 1980 1990 1995 2000
* Get data from Table 2.

28
Table 4. Population Density, Gross Density and Built-Up Density, Year ___
City/Municipality Province Barangay
Pop’n Density Built-up Density5 Popn Density URBAN Barangay 1. 2. 3. Sub-Total RURAL Barangay 1. 2. 3. Sub-Total
Bgy. Density1
Urban Density2
Bgy. Pop’n Density Rural Density3
TOTAL Gross Pop’n Density4 Gross Built-up Density Gross Density4 Source: to be computed using NSO data Pop’n in Bgy. Total Pop’n. 1Bgy Pop’n Density = ---------------- 4Gross Pop’n Density = -------------- Area of Bgy Total Area Pop’n in Urban Bgys Pop’n in Built-Up Area 2Gross Urban Density = ---------------------------- 5Built-up density per Bgy = ---------------------------- Area of Urban Bgys Bgry. Built-up Area Pop’n in Rural Bgys 3Gross Rural Density = ----------------------------- Area of Rural Bgys. Population in built-up area can be derived thru actual survey or consultation with any Bgy. Captains. At the least this may be estimated to be equal to barangay population.
29
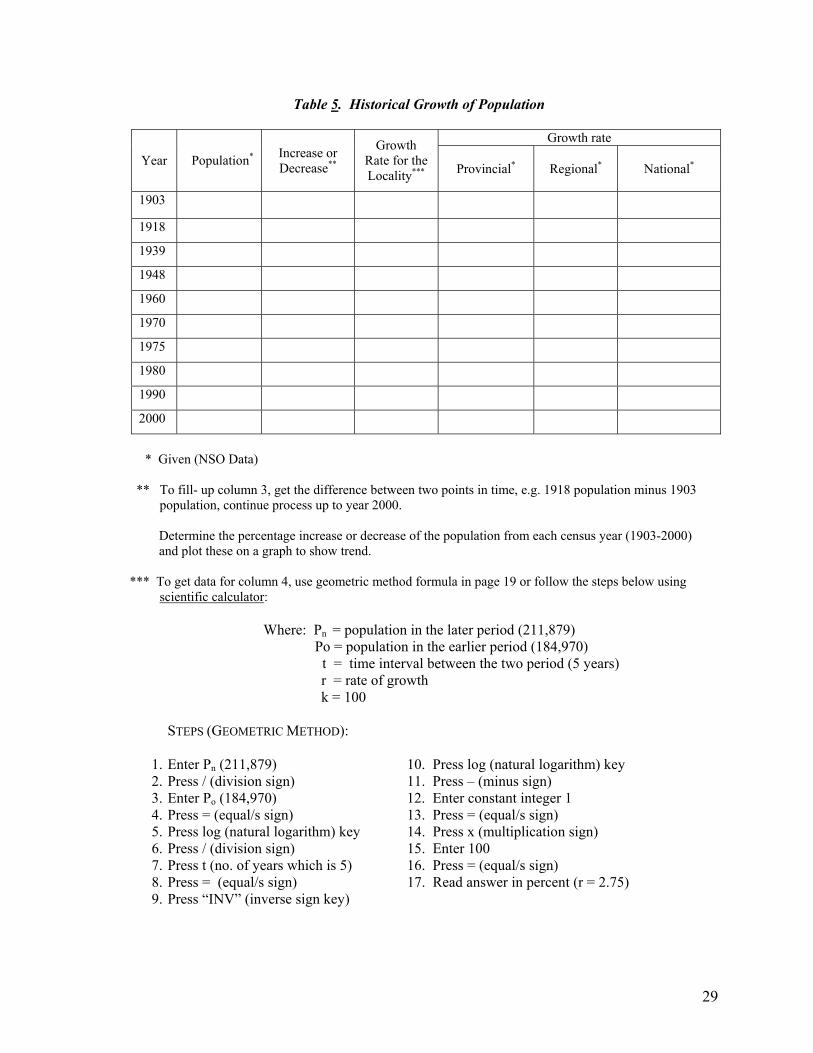
Table 5. Historical Growth of Population
Growth rate
Year
Population*
Increase or Decrease**
Growth Rate for the Locality*** Provincial* Regional* National*
1903
1918
1939 1948 1960 1970 1975 1980 1990 2000
* Given (NSO Data) ** To fill- up column 3, get the difference between two points in time, e.g. 1918 population minus 1903 population, continue process up to year 2000.
Determine the percentage increase or decrease of the population from each census year (1903-2000) and plot these on a graph to show trend.
*** To get data for column 4, use geometric method formula in page 19 or follow the steps below using
scientific calculator: Where: Pn = population in the later period (211,879) Po = population in the earlier period (184,970) t = time interval between the two period (5 years) r = rate of growth k = 100 STEPS (GEOMETRIC METHOD):
1. Enter Pn (211,879) 10. Press log (natural logarithm) key 2. Press / (division sign) 11. Press – (minus sign) 3. Enter Po (184,970) 12. Enter constant integer 1 4. Press = (equal/s sign) 13. Press = (equal/s sign) 5. Press log (natural logarithm) key 14. Press x (multiplication sign) 6. Press / (division sign) 15. Enter 100 7. Press t (no. of years which is 5) 16. Press = (equal/s sign) 8. Press = (equal/s sign) 17. Read answer in percent (r = 2.75) 9. Press “INV” (inverse sign key)
30
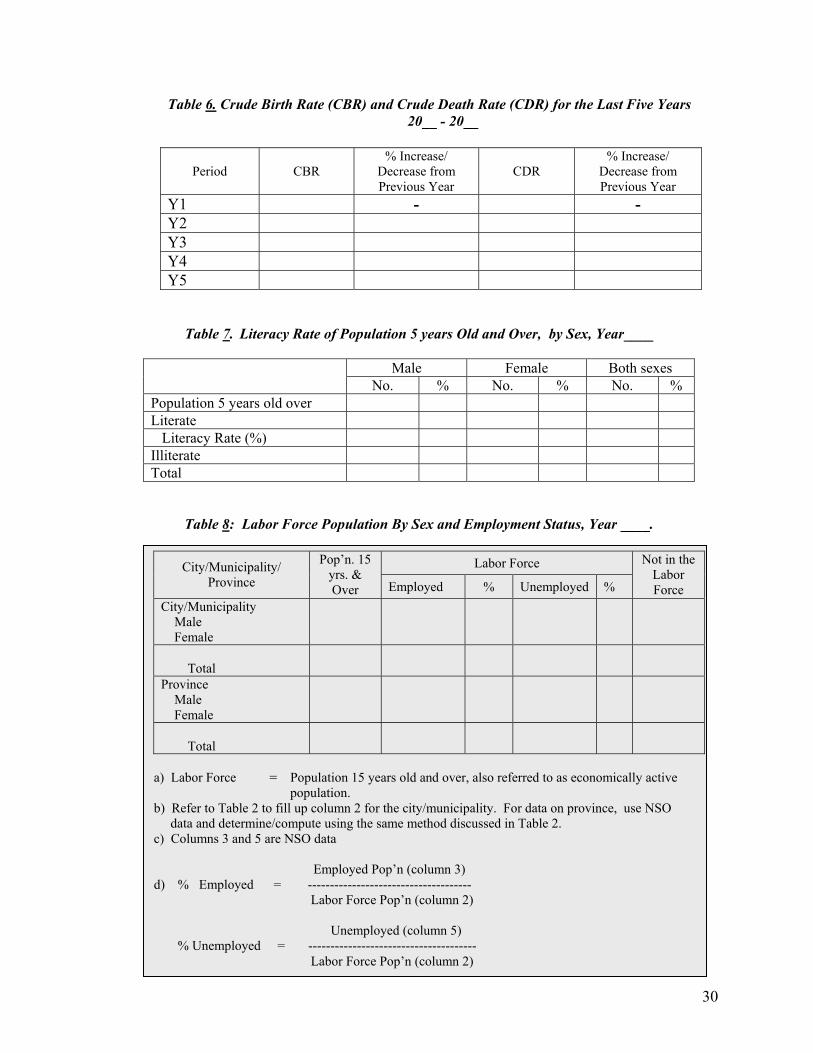
Table 6. Crude Birth Rate (CBR) and Crude Death Rate (CDR) for the Last Five Years 20__ - 20__
Period
CBR % Increase/
Decrease from Previous Year
CDR
% Increase/ Decrease from Previous Year
Y1 - - Y2 Y3 Y4 Y5
Table 7. Literacy Rate of Population 5 years Old and Over, by Sex, Year____
Male Female Both sexes
No. % No. % No. % Population 5 years old over Literate Literacy Rate (%) Illiterate Total
Table 8: Labor Force Population By Sex and Employment Status, Year ____.
Labor Force City/Municipality/ Province
Pop’n. 15 yrs. & Over Employed % Unemployed %
Not in the Labor Force
City/Municipality Male Female
Total
Province Male Female
Total
a) Labor Force = Population 15 years old and over, also referred to as economically active population. b) Refer to Table 2 to fill up column 2 for the city/municipality. For data on province, use NSO data and determine/compute using the same method discussed in Table 2. c) Columns 3 and 5 are NSO data Employed Pop’n (column 3) d) % Employed = -------------------------------------
Labor Force Pop’n (column 2) Unemployed (column 5)
% Unemployed = -------------------------------------- Labor Force Pop’n (column 2)
31
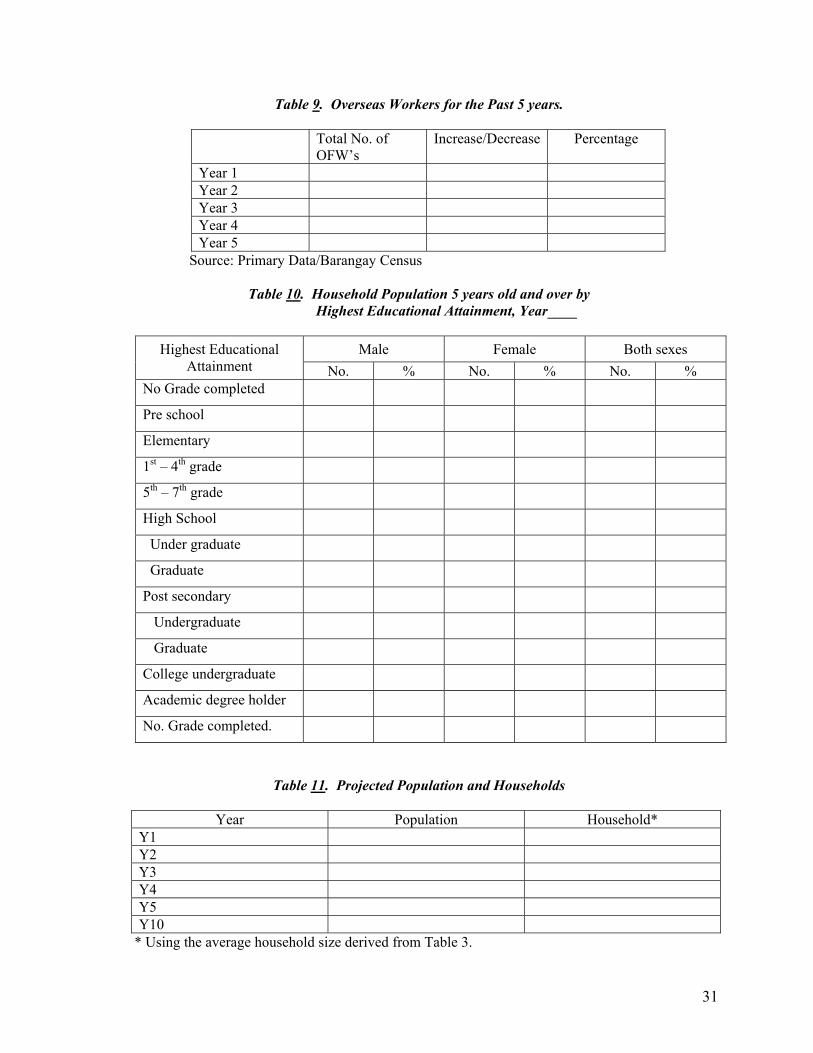
Table 9. Overseas Workers for the Past 5 years.
Total No. of OFW’s
Increase/Decrease Percentage
Year 1 Year 2 Year 3 Year 4 Year 5
Source: Primary Data/Barangay Census
Table 10. Household Population 5 years old and over by Highest Educational Attainment, Year____
Male Female Both sexes Highest Educational
Attainment No. % No. % No. % No Grade completed
Pre school
Elementary
1st – 4th grade
5th – 7th grade
High School
Under graduate
Graduate
Post secondary
Undergraduate
Graduate
College undergraduate
Academic degree holder
No. Grade completed.
Table 11. Projected Population and Households
Year Population Household* Y1 Y2 Y3 Y4 Y5 Y10
* Using the average household size derived from Table 3.
32
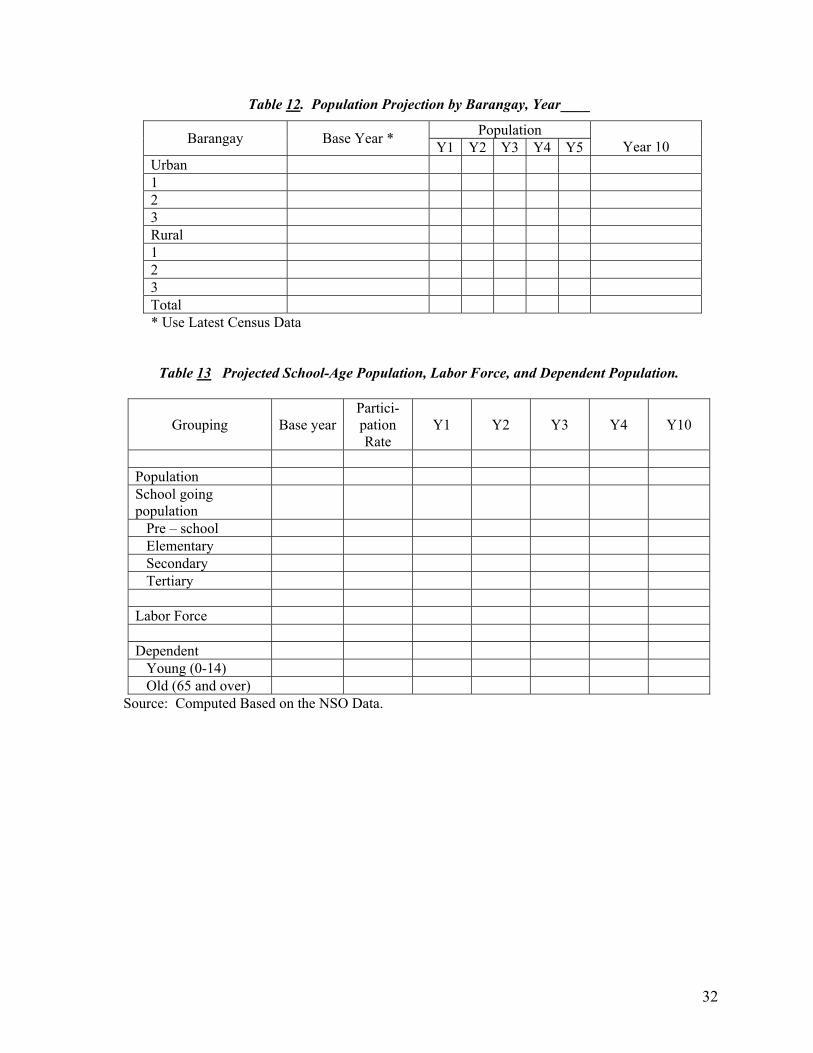
Table 12. Population Projection by Barangay, Year____
* Use Latest Census Data
Table 13 Projected School-Age Population, Labor Force, and Dependent Population.
Source: Computed Based on the NSO Data.
Population Barangay Base Year * Y1 Y2 Y3 Y4 Y5
Year 10 Urban 1 2 3 Rural 1 2 3 Total
Grouping Base yearPartici-pation Rate
Y1 Y2 Y3 Y4 Y10
Population School going population
Pre – school Elementary Secondary Tertiary Labor Force Dependent Young (0-14) Old (65 and over)

33
ANNEX 1
NSCB Resolution No.14 ADOPTION OF THE CORE INDICATORS FOR POPULATION AND DEVELOPMENT (POPDEV)
PLANNING AT THE LOCAL LEVEL
WHEREAS, population and development (POPDEV) integration is the explicit consideration of the socioeconomic and demographic interrelationships in the formulation of development plans, policies and programs;
WHEREAS, the formulation and implementation of a good local development plan depend greatly on the availability of reliable, relevant and timely data/information;
WHEREAS, with devolution mandating planning at the local level, the availability of local level data needs to be addressed;
WHEREAS, government initiatives in developing indicators/information systems that could be used in POPDEV planning at the local level should be rationalized and integrated in a single framework to avoid confusion among local planners and enable them to use these indicators more effectively in developing their plans;
WHEREAS, the Technical Committee on Population and Housing Statistics (TCPHS) thru its Technical Working Group on the Core POPDEV Indicators identified/selected the core POPDEV indicators from the list of indicators currently adopted in different government initiatives using the criteria of measurability, appropriateness, comprehensiveness and relevance;
WHEREAS, the core POPDEV indicators can be viewed as basic indicators reflecting those that are common to most of the initiatives and that are highly relevant to local development goals and to sectoral concerns;
WHEREAS, the core POPDEV indicators can serve as a basic list to which local government units (LGUs) can add more indicators as the need arises;
WHEREAS, the NSCB TCPHS, in its meeting held on 10 December 2001 decided to recommend the adoption of the core POPDEV indicators for planning at the local level;
NOW, THEREFORE, BE IT RESOLVED AS IT IS HEREBY RESOLVED, that the Board approve for adoption by all concerned the core POPDEV indicators to be utilized for planning and policy-making purposes at the local level.
BE IT RESOLVED FURTHER that :
1. The National Statistical Coordination Board (NSCB) enjoin all data producing agencies to regularly provide adequate statistics for these basic indicators of development;
2. The Commission on Population (POPCOM) monitor the adoption and use of the core POPDEV indicators in the formulation of local development plans, policies and programs;
3. The LGUs, through the Department of Interior and Local Government (DILG), endeavor to compile these statistics and establish mechanisms to operationalize the core POPDEV indicators; and
4. The LGUs appropriate some amount from their annual Internal Revenue Allotment (IRA) for inclusion of the data requirements of the core POPDEV indicators in the system of designated statistics
Approved this 5th day of June 2002, in Pasig City.

34
ANNEX 1.A
CORE INDICATORS FOR POPULATION AND DEVELOPMENT (POPDEV) PLANNING AT THE LOCAL LEVEL
Indicator
Definition Level of
Desegregation
Frequency Latest
Available Data
Source of Basic
Data I. Population
Processes 1. Crude Birth Rate
(CBR)
The number of live births per 1,000 population during a given period
National, regional, provincial, municipal, city National, regional, provincial
Annual
After every census year
1997
1995 - 2005
1) Vital statistics report, NSO 2) Population Projections, NSO
2. Crude Death Rate (CDR)
The number of deaths per 1,000 population during a given period
National, regional, provincial, municipal, city National, regional, provincial
Annual
After every census year
1997
1995-2005
1) Vital Statistics Report, NSO 2) Population Projections, NSO
3. Total Fertility Rate
The average number of children that would be born alive to a woman during her lifetime if she were to pass through her childbearing years conforming to the age-specific fertility rates of a given year
National, regional, provincial
Annual
After every census year
1997
1995-2020
1) Vital Statistics Report, NSO 2) Population Projections, NSO
4. Maternal Mortality Rate
The number of deaths among women 15-49 years old from pregnancy-related causes per 100,000 live births in a given period
National, regional, provincial
Every 5 years
1997
1990-1995
1) Vital Statistics Report, NSO 2) Technical Working Group- Maternal and Child Mortality, NSO
II. Population Outcomes 5. Annual Population Growth Rate
The pace at which the pop’n is increasing (or decreasing) during a given period on a yearly basis expressed as a percentage of the basic population
National, regional, provincial, city, municipality
Every 10 years
-
Census of Population and Housing ( CPH ), NSO
35
Indicator
Definition
Level of Desegregation
Frequency
Latest Available
Data
Source of Basic
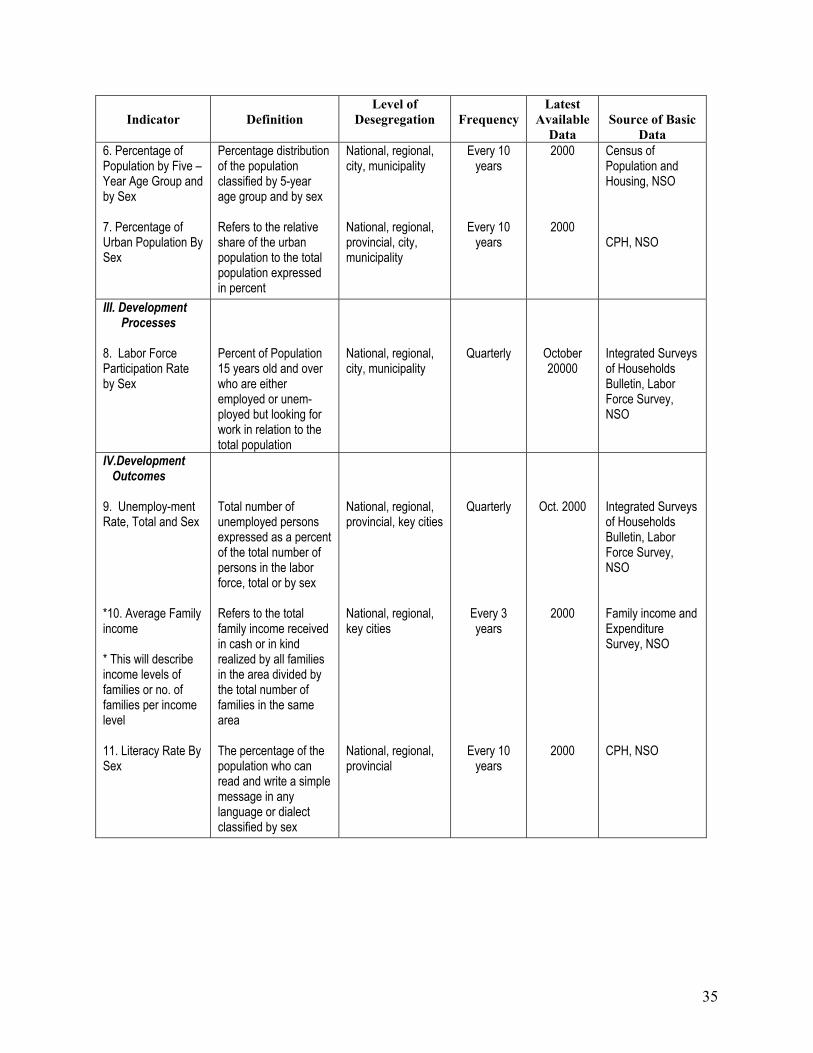
Data 6. Percentage of Population by Five –Year Age Group and by Sex 7. Percentage of Urban Population By Sex
Percentage distribution of the population classified by 5-year age group and by sex Refers to the relative share of the urban population to the total population expressed in percent
National, regional, city, municipality National, regional, provincial, city, municipality
Every 10 years
Every 10 years
2000
2000
Census of Population and Housing, NSO CPH, NSO
III. Development Processes 8. Labor Force Participation Rate by Sex
Percent of Population 15 years old and over who are either employed or unem- ployed but looking for work in relation to the total population
National, regional, city, municipality
Quarterly
October 20000
Integrated Surveys of Households Bulletin, Labor Force Survey, NSO
IV.Development Outcomes
9. Unemploy-ment Rate, Total and Sex *10. Average Family income * This will describe income levels of families or no. of families per income level 11. Literacy Rate By Sex
Total number of unemployed persons expressed as a percent of the total number of persons in the labor force, total or by sex Refers to the total family income received in cash or in kind realized by all families in the area divided by the total number of families in the same area The percentage of the population who can read and write a simple message in any language or dialect classified by sex
National, regional, provincial, key cities National, regional, key cities National, regional, provincial
Quarterly
Every 3 years
Every 10 years
Oct. 2000
2000
2000
Integrated Surveys of Households Bulletin, Labor Force Survey, NSO Family income and Expenditure Survey, NSO CPH, NSO
36
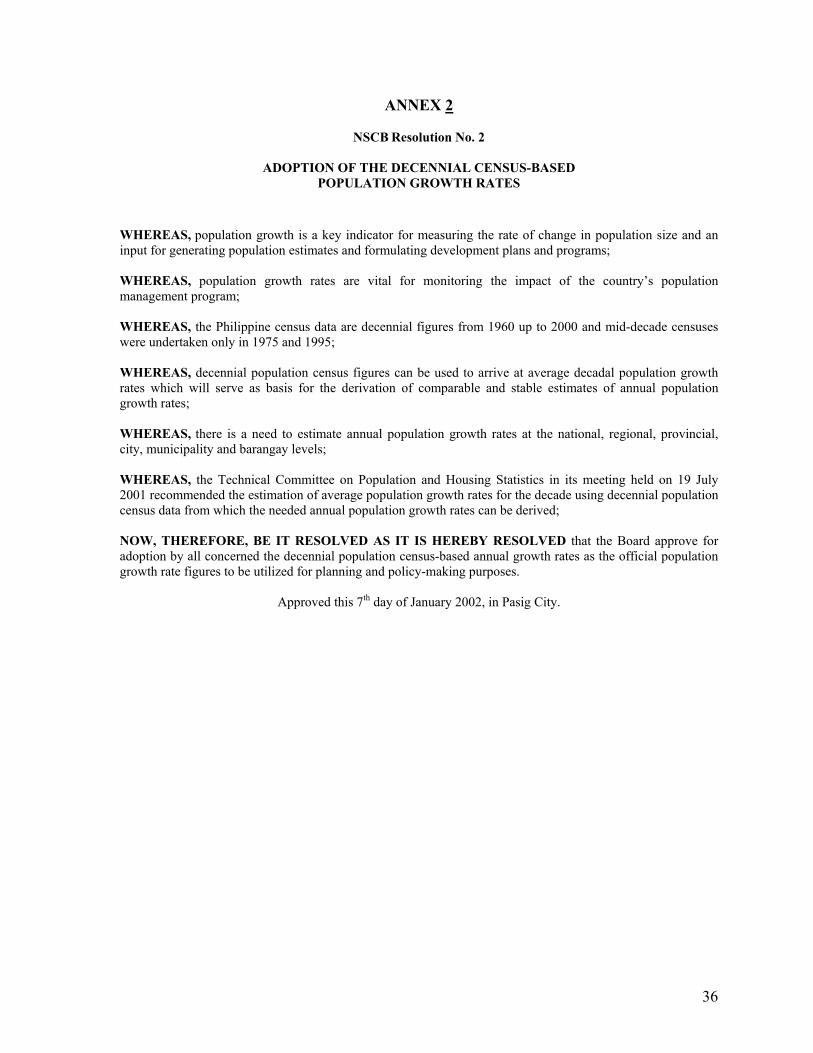
ANNEX 2
NSCB Resolution No. 2
ADOPTION OF THE DECENNIAL CENSUS-BASED POPULATION GROWTH RATES
WHEREAS, population growth is a key indicator for measuring the rate of change in population size and an input for generating population estimates and formulating development plans and programs; WHEREAS, population growth rates are vital for monitoring the impact of the country’s population management program; WHEREAS, the Philippine census data are decennial figures from 1960 up to 2000 and mid-decade censuses were undertaken only in 1975 and 1995; WHEREAS, decennial population census figures can be used to arrive at average decadal population growth rates which will serve as basis for the derivation of comparable and stable estimates of annual population growth rates; WHEREAS, there is a need to estimate annual population growth rates at the national, regional, provincial, city, municipality and barangay levels; WHEREAS, the Technical Committee on Population and Housing Statistics in its meeting held on 19 July 2001 recommended the estimation of average population growth rates for the decade using decennial population census data from which the needed annual population growth rates can be derived; NOW, THEREFORE, BE IT RESOLVED AS IT IS HEREBY RESOLVED that the Board approve for adoption by all concerned the decennial population census-based annual growth rates as the official population growth rate figures to be utilized for planning and policy-making purposes.
Approved this 7th day of January 2002, in Pasig City.
37
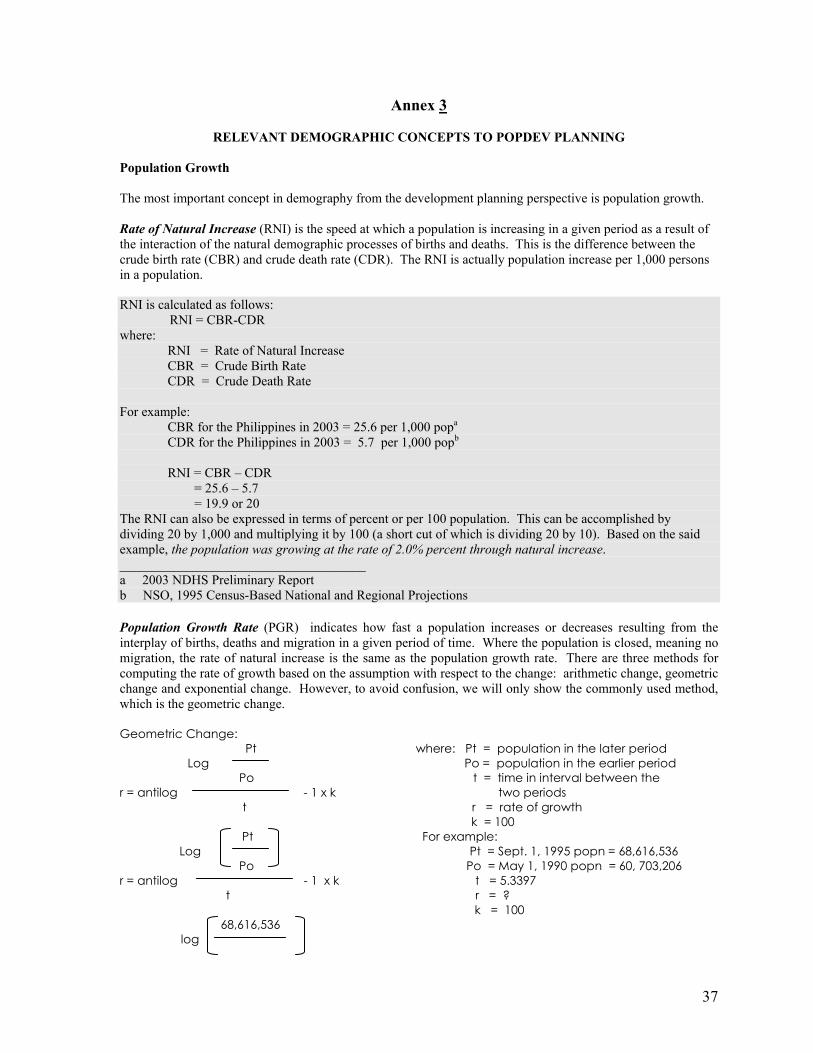
Annex 3
RELEVANT DEMOGRAPHIC CONCEPTS TO POPDEV PLANNING Population Growth The most important concept in demography from the development planning perspective is population growth. Rate of Natural Increase (RNI) is the speed at which a population is increasing in a given period as a result of the interaction of the natural demographic processes of births and deaths. This is the difference between the crude birth rate (CBR) and crude death rate (CDR). The RNI is actually population increase per 1,000 persons in a population. RNI is calculated as follows: RNI = CBR-CDR where: RNI = Rate of Natural Increase CBR = Crude Birth Rate CDR = Crude Death Rate For example: CBR for the Philippines in 2003 = 25.6 per 1,000 popa
CDR for the Philippines in 2003 = 5.7 per 1,000 popb
RNI = CBR – CDR = 25.6 – 5.7 = 19.9 or 20 The RNI can also be expressed in terms of percent or per 100 population. This can be accomplished by dividing 20 by 1,000 and multiplying it by 100 (a short cut of which is dividing 20 by 10). Based on the said example, the population was growing at the rate of 2.0% percent through natural increase. _____________________________________ a 2003 NDHS Preliminary Report b NSO, 1995 Census-Based National and Regional Projections Population Growth Rate (PGR) indicates how fast a population increases or decreases resulting from the interplay of births, deaths and migration in a given period of time. Where the population is closed, meaning no migration, the rate of natural increase is the same as the population growth rate. There are three methods for computing the rate of growth based on the assumption with respect to the change: arithmetic change, geometric change and exponential change. However, to avoid confusion, we will only show the commonly used method, which is the geometric change. Geometric Change: Pt where: Pt = population in the later period Log Po = population in the earlier period Po t = time in interval between the r = antilog - 1 x k two periods t r = rate of growth k = 100 Pt For example: Log Pt = Sept. 1, 1995 popn = 68,616,536 Po Po = May 1, 1990 popn = 60, 703,206 r = antilog - 1 x k t = 5.3397 t r = ? k = 100 68,616,536 log
38
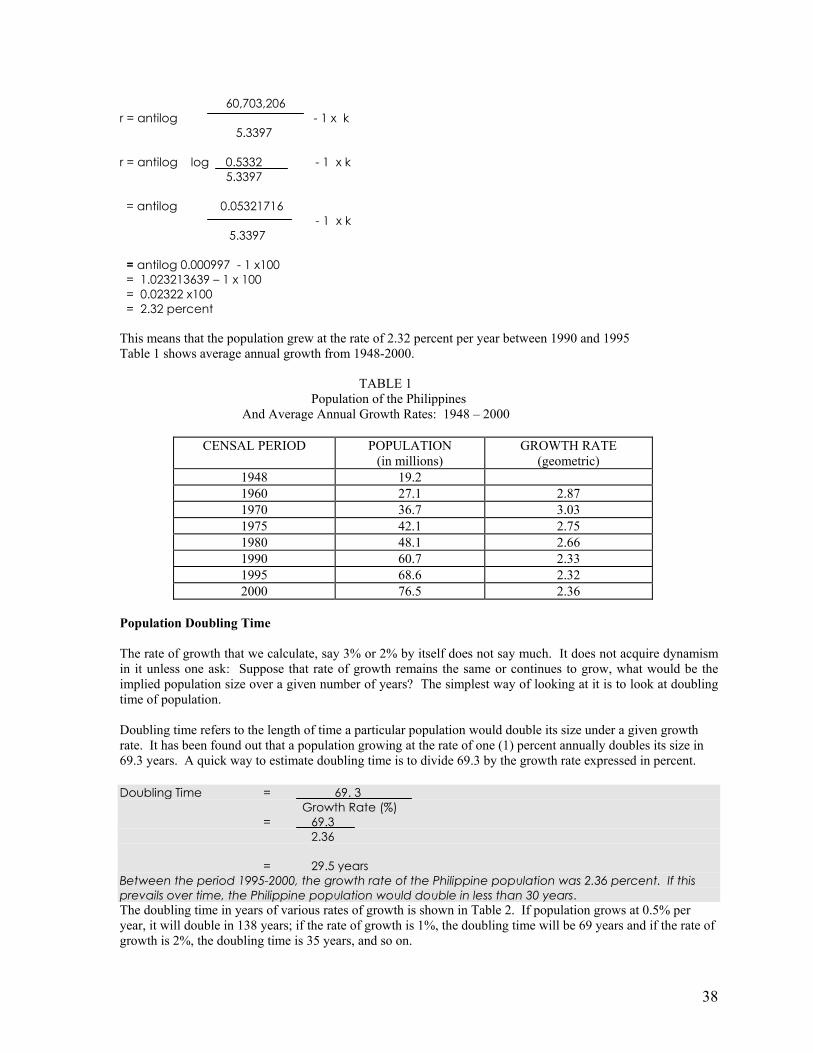
60,703,206 r = antilog - 1 x k 5.3397 r = antilog log 0.5332 - 1 x k 5.3397 = antilog 0.05321716 - 1 x k 5.3397 = antilog 0.000997 - 1 x100 = 1.023213639 – 1 x 100 = 0.02322 x100 = 2.32 percent This means that the population grew at the rate of 2.32 percent per year between 1990 and 1995 Table 1 shows average annual growth from 1948-2000.
TABLE 1 Population of the Philippines
And Average Annual Growth Rates: 1948 – 2000
CENSAL PERIOD POPULATION (in millions)
GROWTH RATE (geometric)
1948 19.2 1960 27.1 2.87 1970 36.7 3.03 1975 42.1 2.75 1980 48.1 2.66 1990 60.7 2.33 1995 68.6 2.32 2000 76.5 2.36
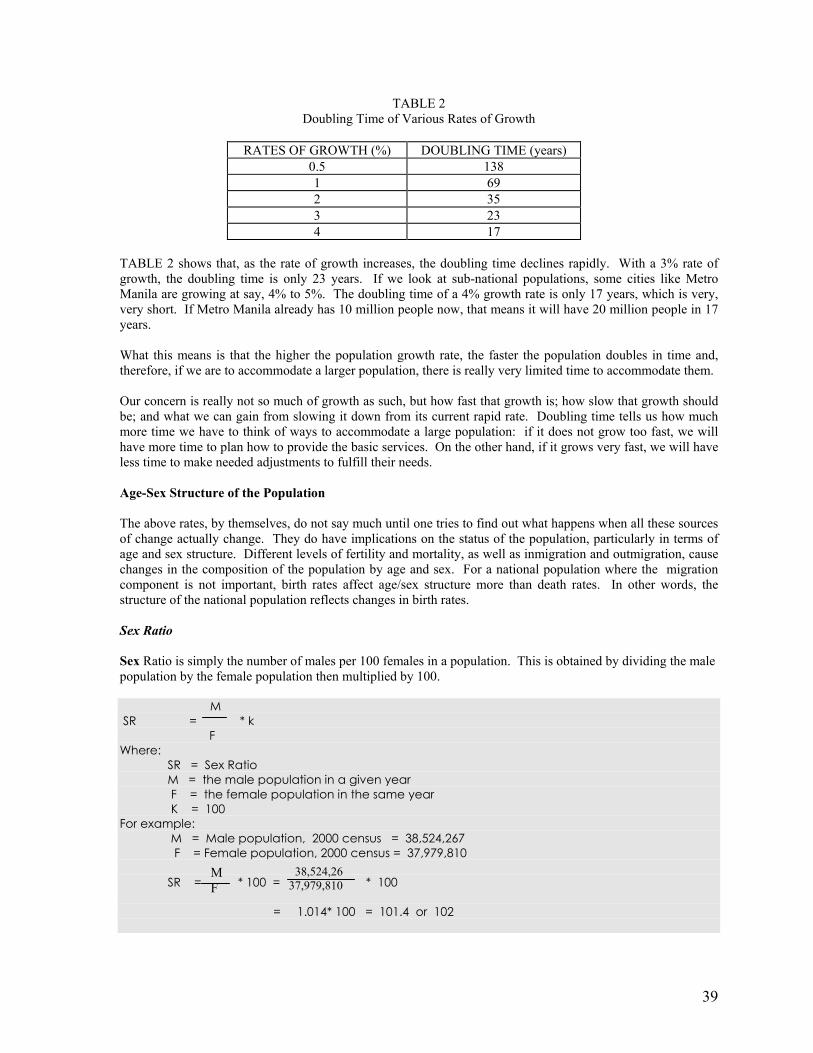
Population Doubling Time The rate of growth that we calculate, say 3% or 2% by itself does not say much. It does not acquire dynamism in it unless one ask: Suppose that rate of growth remains the same or continues to grow, what would be the implied population size over a given number of years? The simplest way of looking at it is to look at doubling time of population. Doubling time refers to the length of time a particular population would double its size under a given growth rate. It has been found out that a population growing at the rate of one (1) percent annually doubles its size in 69.3 years. A quick way to estimate doubling time is to divide 69.3 by the growth rate expressed in percent. Doubling Time = 69. 3 Growth Rate (%) = 69.3 2.36 = 29.5 years Between the period 1995-2000, the growth rate of the Philippine population was 2.36 percent. If this prevails over time, the Philippine population would double in less than 30 years. The doubling time in years of various rates of growth is shown in Table 2. If population grows at 0.5% per year, it will double in 138 years; if the rate of growth is 1%, the doubling time will be 69 years and if the rate of growth is 2%, the doubling time is 35 years, and so on.
39
TABLE 2 Doubling Time of Various Rates of Growth
RATES OF GROWTH (%) DOUBLING TIME (years)
0.5 138 1 69 2 35 3 23 4 17
TABLE 2 shows that, as the rate of growth increases, the doubling time declines rapidly. With a 3% rate of growth, the doubling time is only 23 years. If we look at sub-national populations, some cities like Metro Manila are growing at say, 4% to 5%. The doubling time of a 4% growth rate is only 17 years, which is very, very short. If Metro Manila already has 10 million people now, that means it will have 20 million people in 17 years. What this means is that the higher the population growth rate, the faster the population doubles in time and, therefore, if we are to accommodate a larger population, there is really very limited time to accommodate them. Our concern is really not so much of growth as such, but how fast that growth is; how slow that growth should be; and what we can gain from slowing it down from its current rapid rate. Doubling time tells us how much more time we have to think of ways to accommodate a large population: if it does not grow too fast, we will have more time to plan how to provide the basic services. On the other hand, if it grows very fast, we will have less time to make needed adjustments to fulfill their needs. Age-Sex Structure of the Population The above rates, by themselves, do not say much until one tries to find out what happens when all these sources of change actually change. They do have implications on the status of the population, particularly in terms of age and sex structure. Different levels of fertility and mortality, as well as inmigration and outmigration, cause changes in the composition of the population by age and sex. For a national population where the migration component is not important, birth rates affect age/sex structure more than death rates. In other words, the structure of the national population reflects changes in birth rates. Sex Ratio Sex Ratio is simply the number of males per 100 females in a population. This is obtained by dividing the male population by the female population then multiplied by 100. M SR = * k F Where: SR = Sex Ratio M = the male population in a given year F = the female population in the same year K = 100 For example: M = Male population, 2000 census = 38,524,267 F = Female population, 2000 census = 37,979,810 SR = * 100 = * 100 = 1.014* 100 = 101.4 or 102
MF
38,524,26 37,979,810
40
Based on the 2000 total population count, there were 101 males for every 100 females in the Philippines
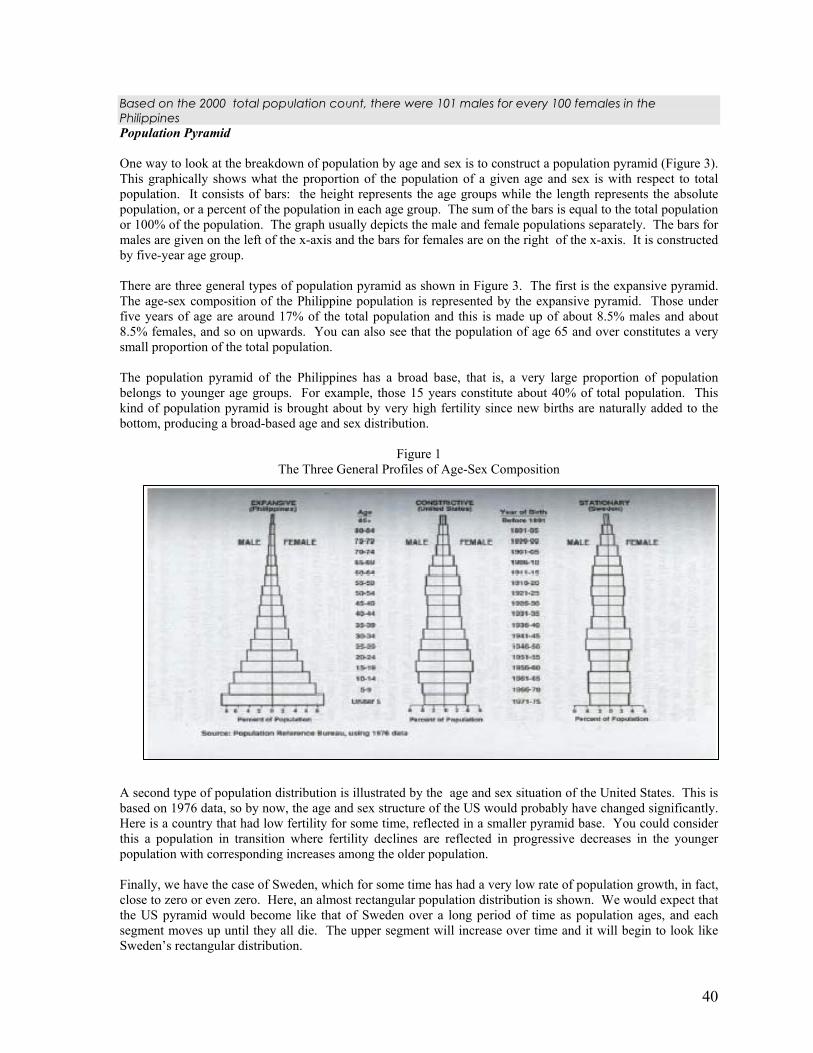
Population Pyramid One way to look at the breakdown of population by age and sex is to construct a population pyramid (Figure 3). This graphically shows what the proportion of the population of a given age and sex is with respect to total population. It consists of bars: the height represents the age groups while the length represents the absolute population, or a percent of the population in each age group. The sum of the bars is equal to the total population or 100% of the population. The graph usually depicts the male and female populations separately. The bars for males are given on the left of the x-axis and the bars for females are on the right of the x-axis. It is constructed by five-year age group. There are three general types of population pyramid as shown in Figure 3. The first is the expansive pyramid. The age-sex composition of the Philippine population is represented by the expansive pyramid. Those under five years of age are around 17% of the total population and this is made up of about 8.5% males and about 8.5% females, and so on upwards. You can also see that the population of age 65 and over constitutes a very small proportion of the total population. The population pyramid of the Philippines has a broad base, that is, a very large proportion of population belongs to younger age groups. For example, those 15 years constitute about 40% of total population. This kind of population pyramid is brought about by very high fertility since new births are naturally added to the bottom, producing a broad-based age and sex distribution.
Figure 1 The Three General Profiles of Age-Sex Composition
A second type of population distribution is illustrated by the age and sex situation of the United States. This is based on 1976 data, so by now, the age and sex structure of the US would probably have changed significantly. Here is a country that had low fertility for some time, reflected in a smaller pyramid base. You could consider this a population in transition where fertility declines are reflected in progressive decreases in the younger population with corresponding increases among the older population. Finally, we have the case of Sweden, which for some time has had a very low rate of population growth, in fact, close to zero or even zero. Here, an almost rectangular population distribution is shown. We would expect that the US pyramid would become like that of Sweden over a long period of time as population ages, and each segment moves up until they all die. The upper segment will increase over time and it will begin to look like Sweden’s rectangular distribution.
41
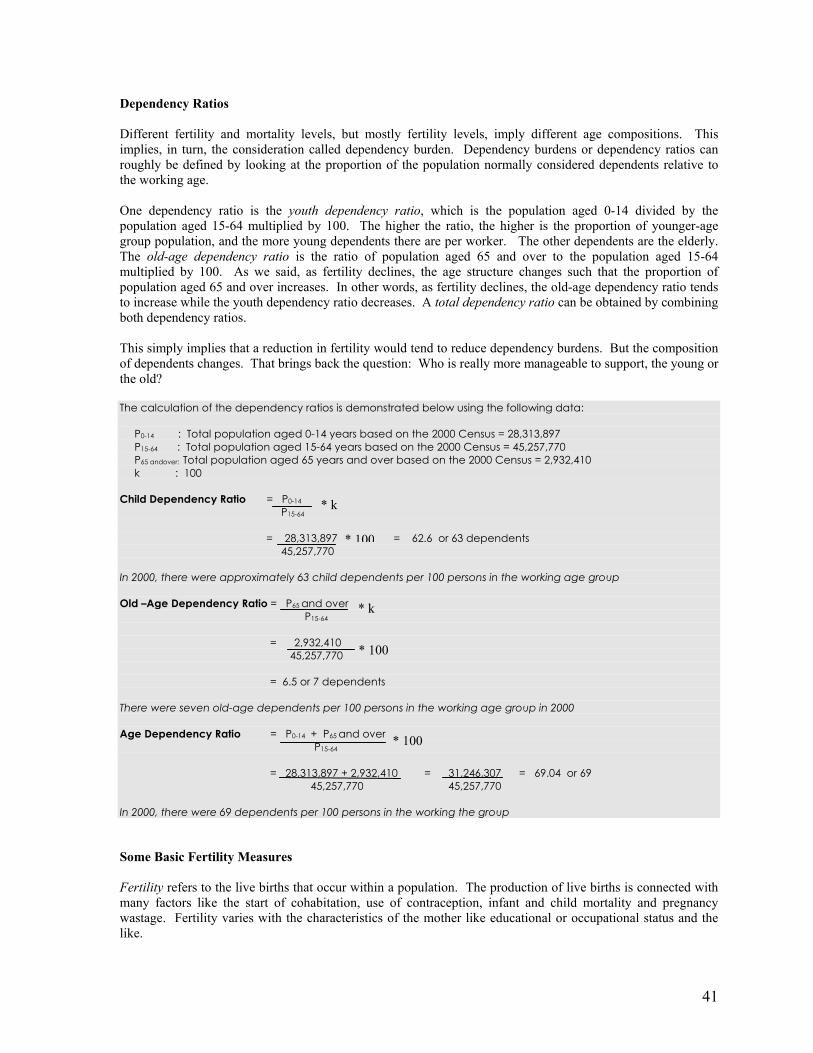
Dependency Ratios Different fertility and mortality levels, but mostly fertility levels, imply different age compositions. This implies, in turn, the consideration called dependency burden. Dependency burdens or dependency ratios can roughly be defined by looking at the proportion of the population normally considered dependents relative to the working age. One dependency ratio is the youth dependency ratio, which is the population aged 0-14 divided by the population aged 15-64 multiplied by 100. The higher the ratio, the higher is the proportion of younger-age group population, and the more young dependents there are per worker. The other dependents are the elderly. The old-age dependency ratio is the ratio of population aged 65 and over to the population aged 15-64 multiplied by 100. As we said, as fertility declines, the age structure changes such that the proportion of population aged 65 and over increases. In other words, as fertility declines, the old-age dependency ratio tends to increase while the youth dependency ratio decreases. A total dependency ratio can be obtained by combining both dependency ratios. This simply implies that a reduction in fertility would tend to reduce dependency burdens. But the composition of dependents changes. That brings back the question: Who is really more manageable to support, the young or the old? The calculation of the dependency ratios is demonstrated below using the following data: P0-14 : Total population aged 0-14 years based on the 2000 Census = 28,313,897 P15-64 : Total population aged 15-64 years based on the 2000 Census = 45,257,770 P65 andover: Total population aged 65 years and over based on the 2000 Census = 2,932,410 k : 100 Child Dependency Ratio = P0-14
P15-64 = 28,313,897 = 62.6 or 63 dependents 45,257,770 In 2000, there were approximately 63 child dependents per 100 persons in the working age group Old –Age Dependency Ratio = P65 and over P15-64 = 2,932,410 45,257,770 = 6.5 or 7 dependents There were seven old-age dependents per 100 persons in the working age group in 2000 Age Dependency Ratio = P0-14 + P65 and over P15-64
= 28,313,897 + 2,932,410 = 31,246,307 = 69.04 or 69 45,257,770 45,257,770 In 2000, there were 69 dependents per 100 persons in the working the group Some Basic Fertility Measures Fertility refers to the live births that occur within a population. The production of live births is connected with many factors like the start of cohabitation, use of contraception, infant and child mortality and pregnancy wastage. Fertility varies with the characteristics of the mother like educational or occupational status and the like.
* k
* 100
* k
* 100
* 100
42
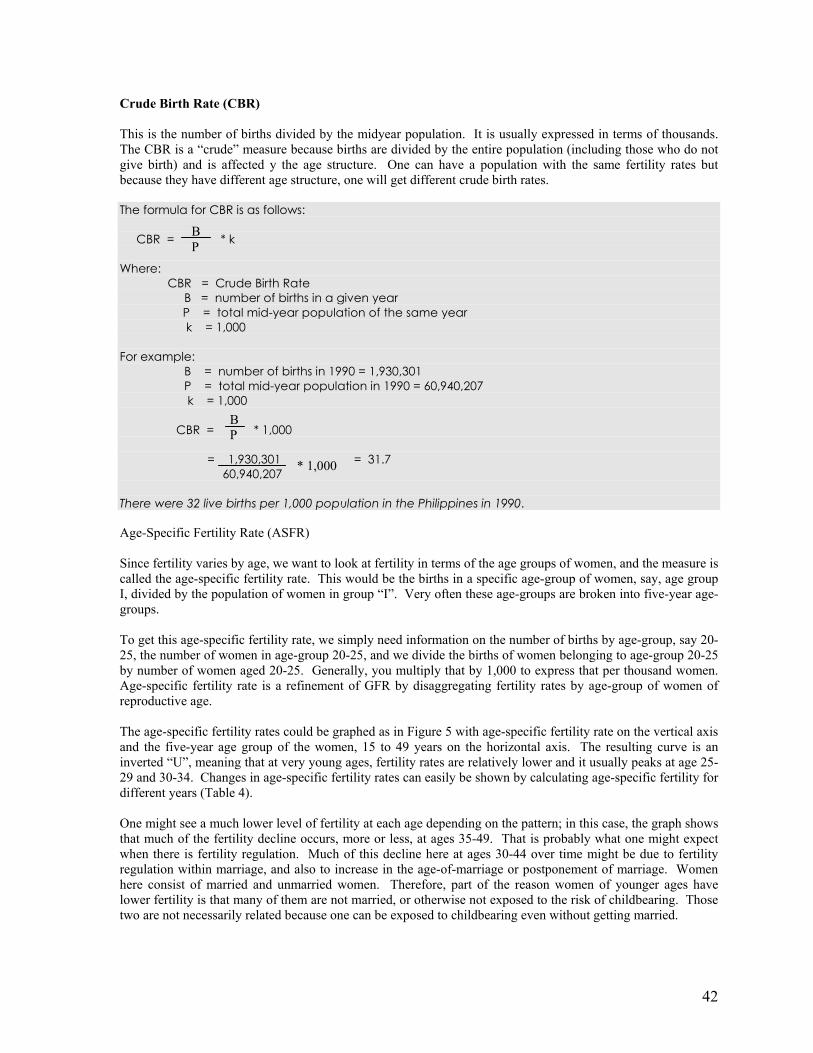
Crude Birth Rate (CBR) This is the number of births divided by the midyear population. It is usually expressed in terms of thousands. The CBR is a “crude” measure because births are divided by the entire population (including those who do not give birth) and is affected y the age structure. One can have a population with the same fertility rates but because they have different age structure, one will get different crude birth rates. The formula for CBR is as follows: CBR = * k Where: CBR = Crude Birth Rate B = number of births in a given year P = total mid-year population of the same year k = 1,000 For example: B = number of births in 1990 = 1,930,301 P = total mid-year population in 1990 = 60,940,207 k = 1,000 CBR = * 1,000 = 1,930,301 = 31.7 60,940,207 There were 32 live births per 1,000 population in the Philippines in 1990. Age-Specific Fertility Rate (ASFR) Since fertility varies by age, we want to look at fertility in terms of the age groups of women, and the measure is called the age-specific fertility rate. This would be the births in a specific age-group of women, say, age group I, divided by the population of women in group “I”. Very often these age-groups are broken into five-year age-groups. To get this age-specific fertility rate, we simply need information on the number of births by age-group, say 20-25, the number of women in age-group 20-25, and we divide the births of women belonging to age-group 20-25 by number of women aged 20-25. Generally, you multiply that by 1,000 to express that per thousand women. Age-specific fertility rate is a refinement of GFR by disaggregating fertility rates by age-group of women of reproductive age. The age-specific fertility rates could be graphed as in Figure 5 with age-specific fertility rate on the vertical axis and the five-year age group of the women, 15 to 49 years on the horizontal axis. The resulting curve is an inverted “U”, meaning that at very young ages, fertility rates are relatively lower and it usually peaks at age 25-29 and 30-34. Changes in age-specific fertility rates can easily be shown by calculating age-specific fertility for different years (Table 4). One might see a much lower level of fertility at each age depending on the pattern; in this case, the graph shows that much of the fertility decline occurs, more or less, at ages 35-49. That is probably what one might expect when there is fertility regulation. Much of this decline here at ages 30-44 over time might be due to fertility regulation within marriage, and also to increase in the age-of-marriage or postponement of marriage. Women here consist of married and unmarried women. Therefore, part of the reason women of younger ages have lower fertility is that many of them are not married, or otherwise not exposed to the risk of childbearing. Those two are not necessarily related because one can be exposed to childbearing even without getting married.
B P
B P
* 1,000
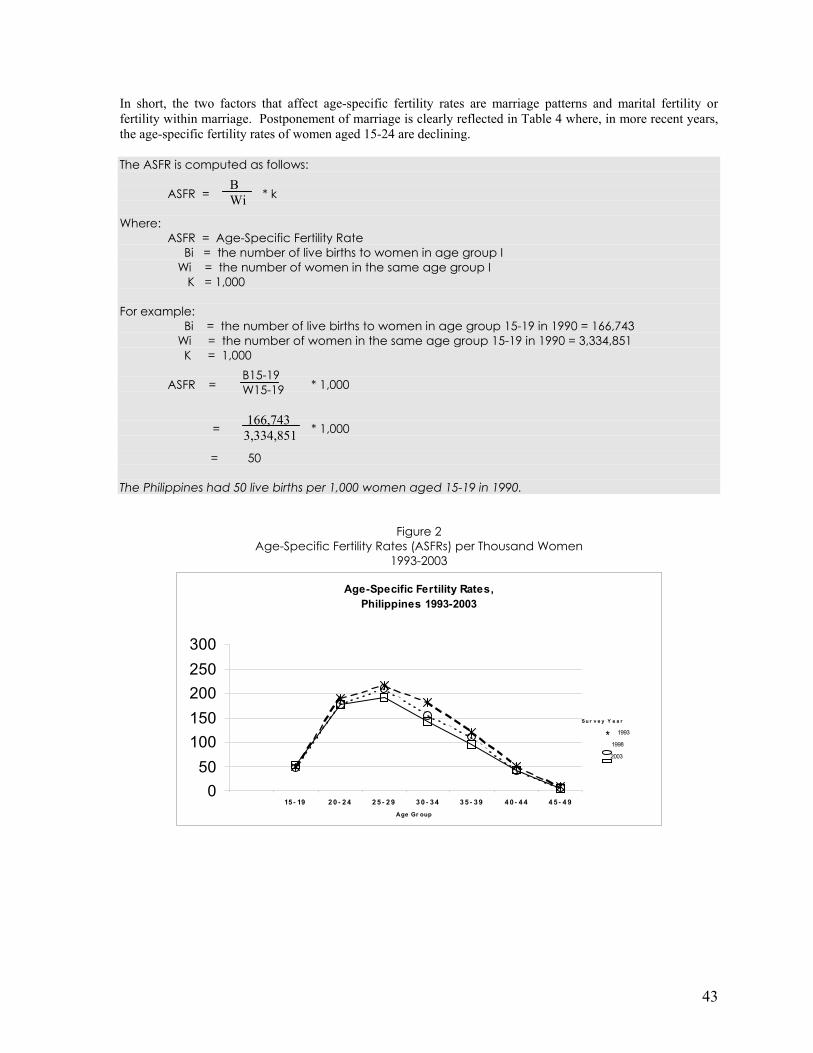
43
In short, the two factors that affect age-specific fertility rates are marriage patterns and marital fertility or fertility within marriage. Postponement of marriage is clearly reflected in Table 4 where, in more recent years, the age-specific fertility rates of women aged 15-24 are declining. The ASFR is computed as follows: ASFR = * k Where: ASFR = Age-Specific Fertility Rate Bi = the number of live births to women in age group I Wi = the number of women in the same age group I K = 1,000 For example: Bi = the number of live births to women in age group 15-19 in 1990 = 166,743 Wi = the number of women in the same age group 15-19 in 1990 = 3,334,851 K = 1,000
ASFR = * 1,000 = * 1,000 = 50 The Philippines had 50 live births per 1,000 women aged 15-19 in 1990.
Figure 2 Age-Specific Fertility Rates (ASFRs) per Thousand Women
1993-2003
Age-Specific Fertility Rates,Philippines 1993-2003
050
100150200250300
15 - 19 2 0 - 2 4 2 5 - 2 9 3 0 - 3 4 3 5 - 3 9 4 0 - 4 4 4 5 - 4 9Age Gr oup
1993
1998
2003
Su r v e y Y e a r
*
B Wi
B15-19 W15-19
166,743 3,334,851
44
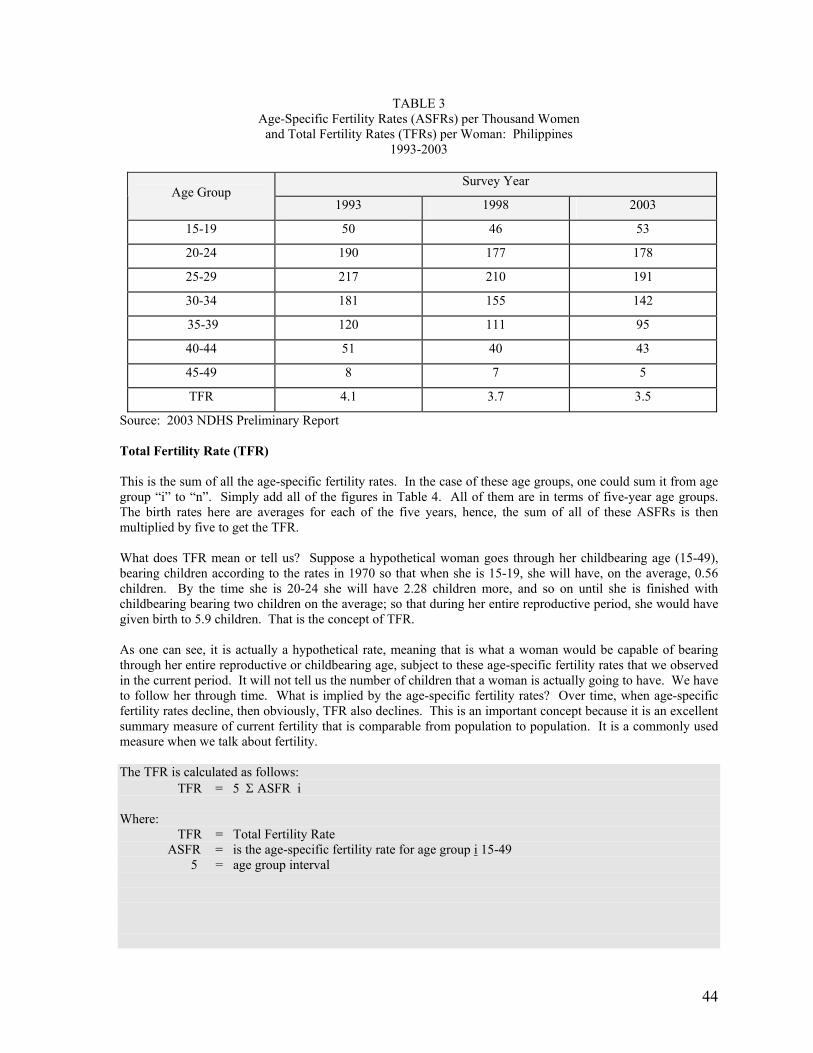
TABLE 3 Age-Specific Fertility Rates (ASFRs) per Thousand Women
and Total Fertility Rates (TFRs) per Woman: Philippines 1993-2003
Survey Year
Age Group 1993 1998 2003
15-19 50 46 53
20-24 190 177 178
25-29 217 210 191
30-34 181 155 142
35-39 120 111 95
40-44 51 40 43
45-49 8 7 5
TFR 4.1 3.7 3.5
Source: 2003 NDHS Preliminary Report Total Fertility Rate (TFR) This is the sum of all the age-specific fertility rates. In the case of these age groups, one could sum it from age group “i” to “n”. Simply add all of the figures in Table 4. All of them are in terms of five-year age groups. The birth rates here are averages for each of the five years, hence, the sum of all of these ASFRs is then multiplied by five to get the TFR. What does TFR mean or tell us? Suppose a hypothetical woman goes through her childbearing age (15-49), bearing children according to the rates in 1970 so that when she is 15-19, she will have, on the average, 0.56 children. By the time she is 20-24 she will have 2.28 children more, and so on until she is finished with childbearing bearing two children on the average; so that during her entire reproductive period, she would have given birth to 5.9 children. That is the concept of TFR. As one can see, it is actually a hypothetical rate, meaning that is what a woman would be capable of bearing through her entire reproductive or childbearing age, subject to these age-specific fertility rates that we observed in the current period. It will not tell us the number of children that a woman is actually going to have. We have to follow her through time. What is implied by the age-specific fertility rates? Over time, when age-specific fertility rates decline, then obviously, TFR also declines. This is an important concept because it is an excellent summary measure of current fertility that is comparable from population to population. It is a commonly used measure when we talk about fertility. The TFR is calculated as follows: TFR = 5 Σ ASFR i Where: TFR = Total Fertility Rate ASFR = is the age-specific fertility rate for age group i 15-49 5 = age group interval
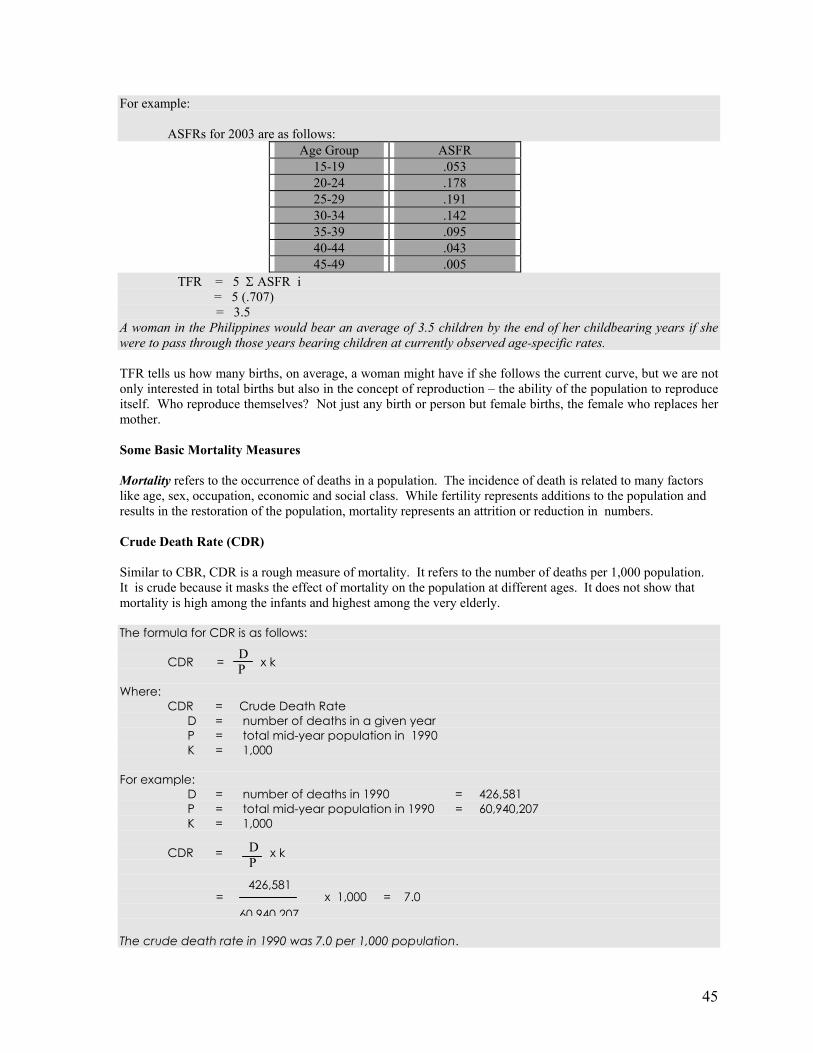
45
For example: ASFRs for 2003 are as follows:
Age Group ASFR 15-19 .053 20-24 .178 25-29 .191 30-34 .142 35-39 .095 40-44 .043 45-49 .005
TFR = 5 Σ ASFR i = 5 (.707) = 3.5 A woman in the Philippines would bear an average of 3.5 children by the end of her childbearing years if she were to pass through those years bearing children at currently observed age-specific rates. TFR tells us how many births, on average, a woman might have if she follows the current curve, but we are not only interested in total births but also in the concept of reproduction – the ability of the population to reproduce itself. Who reproduce themselves? Not just any birth or person but female births, the female who replaces her mother. Some Basic Mortality Measures Mortality refers to the occurrence of deaths in a population. The incidence of death is related to many factors like age, sex, occupation, economic and social class. While fertility represents additions to the population and results in the restoration of the population, mortality represents an attrition or reduction in numbers. Crude Death Rate (CDR) Similar to CBR, CDR is a rough measure of mortality. It refers to the number of deaths per 1,000 population. It is crude because it masks the effect of mortality on the population at different ages. It does not show that mortality is high among the infants and highest among the very elderly. The formula for CDR is as follows: CDR = x k Where: CDR = Crude Death Rate D = number of deaths in a given year P = total mid-year population in 1990 K = 1,000 For example: D = number of deaths in 1990 = 426,581 P = total mid-year population in 1990 = 60,940,207 K = 1,000
CDR = x k = x 1,000 = 7.0 The crude death rate in 1990 was 7.0 per 1,000 population.
D P
D P
426,581 60 940 207
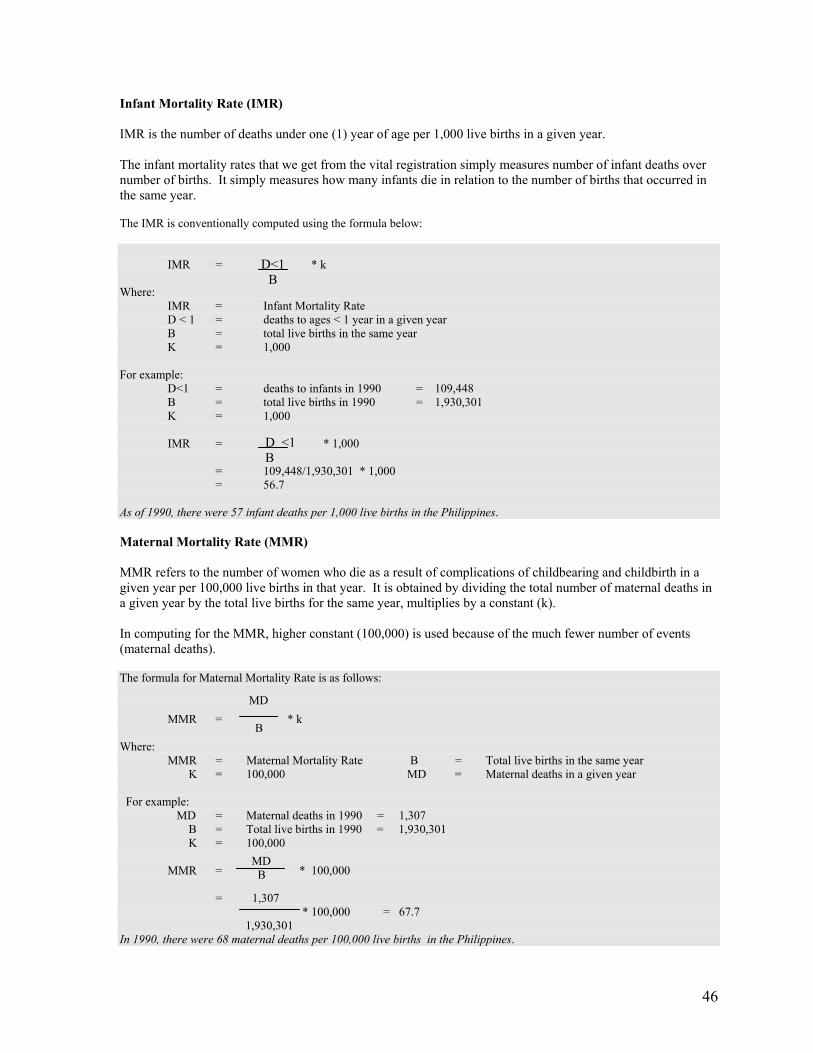
46
Infant Mortality Rate (IMR) IMR is the number of deaths under one (1) year of age per 1,000 live births in a given year. The infant mortality rates that we get from the vital registration simply measures number of infant deaths over number of births. It simply measures how many infants die in relation to the number of births that occurred in the same year. The IMR is conventionally computed using the formula below:
IMR = * k Where: IMR = Infant Mortality Rate D < 1 = deaths to ages < 1 year in a given year B = total live births in the same year K = 1,000 For example: D<1 = deaths to infants in 1990 = 109,448 B = total live births in 1990 = 1,930,301 K = 1,000 IMR = * 1,000 = 109,448/1,930,301 * 1,000 = 56.7 As of 1990, there were 57 infant deaths per 1,000 live births in the Philippines. Maternal Mortality Rate (MMR)
MMR refers to the number of women who die as a result of complications of childbearing and childbirth in a given year per 100,000 live births in that year. It is obtained by dividing the total number of maternal deaths in a given year by the total live births for the same year, multiplies by a constant (k). In computing for the MMR, higher constant (100,000) is used because of the much fewer number of events (maternal deaths). The formula for Maternal Mortality Rate is as follows: MMR = * k Where: MMR = Maternal Mortality Rate B = Total live births in the same year K = 100,000 MD = Maternal deaths in a given year For example: MD = Maternal deaths in 1990 = 1,307 B = Total live births in 1990 = 1,930,301 K = 100,000 MMR = * 100,000 = 1,307
* 100,000 = 67.7 1,930,301
In 1990, there were 68 maternal deaths per 100,000 live births in the Philippines.
D<1 B
D <1 B
MD B
MD B
47
Concept of Life Table/Life Expectancy It will take some time to describe what a life table is but essentially, it is based on age-specific mortality rates: what demographers do is to convert ASDR into mortality probabilities. It tells us what would be the risk of dying in each age group. Demographers use that information to come up with a measure that we often use – life expectancy at birth. This is a measure of overall mortality similar to TFR which, more or less, summarizes information on fertility. Life expectancy gives us a number that we can compare from time to time, and see whether the mortality situation is improving or not. Life expectancy tells us the average number of years that a person born now will live, given that he is exposed to all of mortality probabilities from age 0 up to age at year of death. Let us take an example of how life expectancy is usually calculated. List the mortality probabilities in one column, which tells you the risk of dying in that age. If we assume there is only one person and he lives to be 100, the total number of years that he lived is 100 years divided by the number of persons, which is 1, so the average number of years that he lived is 100. That is his life expectancy at birth. Suppose we come up with a more realistic number. Usually the base used by demographers is 1,000 population. Let us use 100. If all 100 of them lived for 100 years from birth to death at the same time, the life expectancy at birth would be 100 years (100 x 100/100). Suppose 50 of them die at age 50 and 50 of them die at age 100. What would be the average life expectancy that they would contribute? For those who live up to 100, 50 of them would contribute 5,000. The other 50 would die at age 50. How many life years did they contribute? 2,500. All in all, these 100 individuals would have lived 7,500 years. What is the average years that each one had lived? It would be 7,500/100 or 75, on the average. If we have 100 people at the beginning, on the average, they would have a life expectancy of 75 years. That does not mean that all of them will die at age 75. It means that some of them would die somewhere along the line. This is a crude way of computing life expectancy. Actually, it is being done using a life table where we compute how many die at age 1, at age 2, etc. We have to compute how many each member contributes to the total years lived, and averaging them out by the number of cohorts that we started out with. Eventually, we come up with this measure, which gives us summary measures of the average lifetime that can be expected from a group of people born now, if they are exposed to these kinds of mortality probabilities that are observed at the current period. Obviously, mortality rates change over different periods. Perhaps mortality declines. If so, the probabilities of dying at each age would decline and the life expectancy at birth would increase. Changes in life expectancy at birth tell us about changes in these mortality probabilities by age, which in turn tell us improvements in socio-economic conditions.
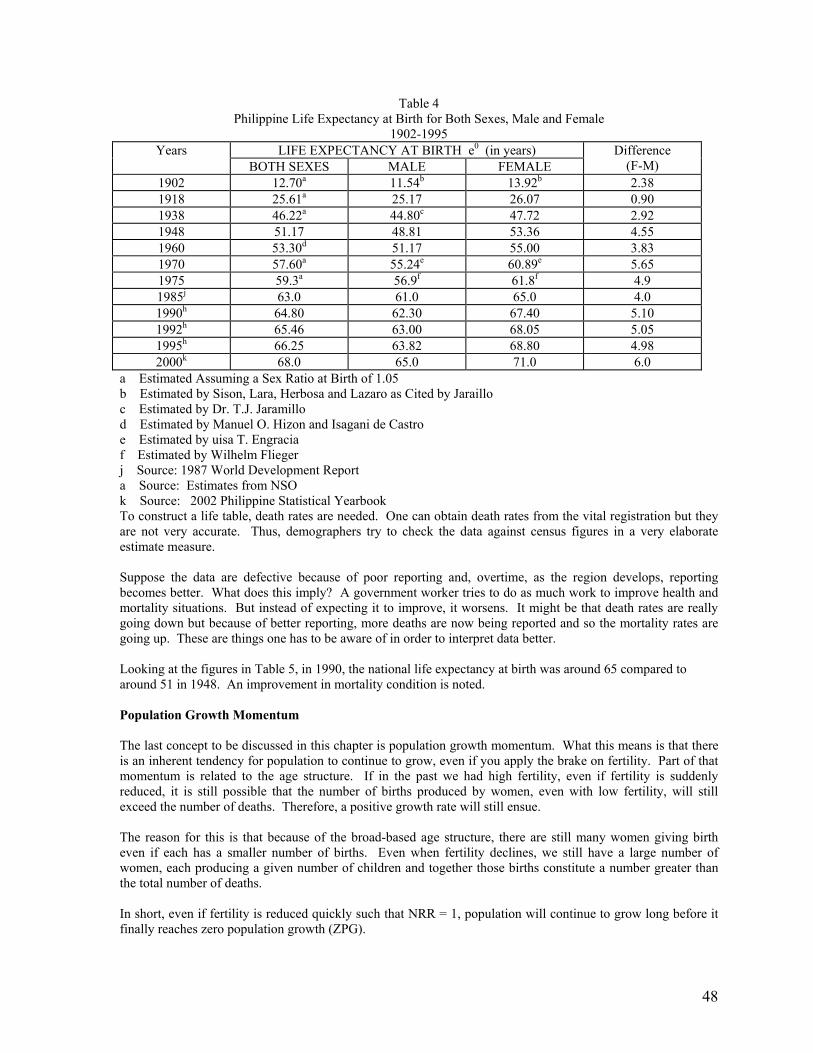
48
Table 4 Philippine Life Expectancy at Birth for Both Sexes, Male and Female
1902-1995 LIFE EXPECTANCY AT BIRTH e0 (in years) Years
BOTH SEXES MALE FEMALE Difference
(F-M) 1902 12.70a 11.54b 13.92b 2.38 1918 25.61a 25.17 26.07 0.90 1938 46.22a 44.80c 47.72 2.92 1948 51.17 48.81 53.36 4.55 1960 53.30d 51.17 55.00 3.83 1970 57.60a 55.24e 60.89e 5.65 1975 59.3a 56.9f 61.8f 4.9 1985j 63.0 61.0 65.0 4.0 1990h 64.80 62.30 67.40 5.10 1992h 65.46 63.00 68.05 5.05 1995h 66.25 63.82 68.80 4.98 2000k 68.0 65.0 71.0 6.0
a Estimated Assuming a Sex Ratio at Birth of 1.05 b Estimated by Sison, Lara, Herbosa and Lazaro as Cited by Jaraillo c Estimated by Dr. T.J. Jaramillo d Estimated by Manuel O. Hizon and Isagani de Castro e Estimated by uisa T. Engracia f Estimated by Wilhelm Flieger j Source: 1987 World Development Report a Source: Estimates from NSO k Source: 2002 Philippine Statistical Yearbook To construct a life table, death rates are needed. One can obtain death rates from the vital registration but they are not very accurate. Thus, demographers try to check the data against census figures in a very elaborate estimate measure. Suppose the data are defective because of poor reporting and, overtime, as the region develops, reporting becomes better. What does this imply? A government worker tries to do as much work to improve health and mortality situations. But instead of expecting it to improve, it worsens. It might be that death rates are really going down but because of better reporting, more deaths are now being reported and so the mortality rates are going up. These are things one has to be aware of in order to interpret data better. Looking at the figures in Table 5, in 1990, the national life expectancy at birth was around 65 compared to around 51 in 1948. An improvement in mortality condition is noted. Population Growth Momentum The last concept to be discussed in this chapter is population growth momentum. What this means is that there is an inherent tendency for population to continue to grow, even if you apply the brake on fertility. Part of that momentum is related to the age structure. If in the past we had high fertility, even if fertility is suddenly reduced, it is still possible that the number of births produced by women, even with low fertility, will still exceed the number of deaths. Therefore, a positive growth rate will still ensue. The reason for this is that because of the broad-based age structure, there are still many women giving birth even if each has a smaller number of births. Even when fertility declines, we still have a large number of women, each producing a given number of children and together those births constitute a number greater than the total number of deaths. In short, even if fertility is reduced quickly such that NRR = 1, population will continue to grow long before it finally reaches zero population growth (ZPG).

49
To illustrate: In a relatively old projection done by the World Bank, the estimated population in 1977 was 44 million. Assuming that the country at that time was able to achieve fertility reduction sufficiently fast, such that by the year 2015 we would have reached NRR = 1, our population would still continue to grow up to 2075. By that time, the population would be 128 million. The population momentum is like the momentum of a rapidly moving car. If one suddenly applies the brake, one does not stop exactly at the point where the break was slammed. The weight of the car would carry it forward before screeching to a stop. The same thing with population; the speed of the moving car can be likened to the rate of fertility. If it is very high in the past, the time it will require to reach ZPG would be much longer. Therefore, the size of the ultimate stationary population would be much higher. What does this mean? No matter what we do about fertility now, whether we succeed in reducing it quickly or not, we can expect a much larger population in the future. The question is not so much whether a population would grow or decline (although we cannot foresee a situation where population size would decline unless we declare war with a superpower nation). We expect population to increase even if fertility declines rapidly. However, if fertility does not decline rapidly, it will take longer to reach replacement fertility (NRR = 1), if we ever reach it at all. It will take even longer for ZPG to be achieved. Therefore, we will have a much larger population size in the future. It is really more of a choice between a slow or rapid population growth because population will definitely continue to grow. Our task might be easier if the population does not grow too quickly, so that we will then have more time to think of the appropriate strategy to support them.
50
Annex 4
NSCB Resolution No. 9 Series of 2003
ADOPTION OF THE OPERATIONAL DEFINITION OF URBAN AREAS IN THE PHILIPPINES
WHEREAS, the classification of urban and rural areas remains an important indicator for many data users as it provides a basis for sound policies and decisions pertaining to urban planning and delivery of basic services;
WHEREAS, the definition of urban areas, which has been in use since the 1970 Census considers population density, street pattern, and presence of establishments and facilities for basic services;
WHEREAS, there were previous attempts to revise the definition of urban areas, the most recent of which was the study undertaken by the Statistical Research and Training Center (SRTC), which proposed the following urban criteria: (1) a city/municipality is to be considered as urban in its entirety if it has a population; density of at least 4,000 (The National Capital Region is considered as entirely urban); and (2) a barangay in a city or municipality not classified as urban in the first criterion is to be considered as urban if it has a population of at least 7,000 or it is a poblacion or central district of a city or provincial capital;
WHEREAS, the Technical Committee on Population and Housing Statistics (TCPHS) reviewed the 1995 proposed redefinition and recommended the conduct of a validation of the proposed redefinition to ensure consistency, applicability and acceptability of the criteria;
WHEREAS, in 2001, the National Statistics Office (NSO), with resources from the Commission on Population and in collaboration with an Inter-Agency Working Group (IAWG) composed of experts from the private sector and representatives from the University of the Philippines Population Institute, Statistical Research and Training Center, National Economic and Development Authority, and the National Statistical Coordination Board (NSCB) spearheaded the project on the “Revalidation of the SRTC Proposed Redefinition of Urban and Rural Areas”;
WHEREAS, the results of the revalidation survey showed that there was no consistent trend in the shifting of barangay classification from urban to rural or vice-versa and that generalizations could not be made based on the SRTC Proposed Redefinition of Urban and Rural Areas;
WHEREAS, recognizing the need to formulate a more up-to-date, practical and realistic definition of urban areas in the Philippines, the POPCOM again commissioned the NSO, in 2002, to determine the most appropriate criteria in classifying an urban area;
WHEREAS, the results of the study revealed that the key factors in identifying urban areas are population, presence of establishments and presence of facilities within the two-kilometer radius;
WHEREAS, the IAWG presented to the TCPHS the proposed definition of urban areas based on the results of the study and on subsequent suggestions from a consultative forum;
WHEREAS, the TCPHS endorses the proposed definition of urban areas because of the soundness of the methodology used and simplicity of application;
NOW, THEREFORE, BE IT RESOLVED AS IT IS HEREBY RESOLVED that the Board approve for adoption by all concerned the definition of urban areas recommended by the TCPHS as follows.

51
(1) If a barangay has a population size of 5,000 or more, then a barangay is considered urban, or
(2) If a barangay has at least one establishment with a minimum of 100 employees, a barangay is considered urban, or
(3) If a barangay has 5 or more establishments with a minimum of 10 employees, and 5 or more facilities within the two-kilometer radius from the barangay hall, then a barangay is considered urban.
BE IT RESOLVED FURTHER that:
1. All barangays in the National Capital Region be automatically classified as urban;
2. All highly urbanized cities be subjected to the urban-rural criteria in order to determine its urban-rural classification;
3. The NSO adopt the recommended definition starting in the 2005 Census of Population (PopCen);
4. The NSO conduct parallel runs for generation of data on urban population using the old and new definitions in the 2005 PopCen; and 5. The NSO and NSCB spearhead the conduct of an advocacy campaign to inform users on the new definition of urban barangays.
Approved this 13th day of October 2003, in Pasig City
ATTESTED BY:
ROMULO A. VIROLA Secretary General

52
Annex 5
NSCB Resolution No. 6 Series of 2006
ADOPTING THE METHODOLOGY USED IN GENERATING THE 2000 CENSUS OF POPULATION AND HOUSING-BASED
NATIONAL, REGIONAL AND PROVINCIAL POPULATION PROJECTIONS
WHEREAS, there is a need to prepare population projections to provide planners, policy-makers and program managers with population data between censal years;
WHEREAS, the availability of more recent population data based on the 2000 Census of Population and Housing (CPH) allows the preparation of new sets of population projections;
WHEREAS, the National Statistics Office (NSO), through the Inter-Agency Working Group on Population Projections, formulated the specific methodology used in projecting the population based on the cohort-component method and submitted the same for review by the Technical Committee on Population and Housing Statistics (TCPHS);
WHEREAS, the 2000-based national, regional and provincial population projections methodology assumed certain future trends in the demographic processes of fertility, mortality and migration required by the cohort-component method of population projections;
WHEREAS, the TCPHS, has endorsed the methodology of national, regional and provincial population projections for approval by the Board;
NOW, THEREFORE, BE IT RESOLVED AS IT IS HEREBY RESOLVED, that the Board approve for adoption by all concerned the methodology for estimating the 2000-based National, Regional and Provincial Population Projections (Annex BR-07-2006-01).
BE IT RESOLVED FURTHER that:
(1) the estimates therefrom, to be released by the NSO, be hereby endorsed as the official figures to be utilized for planning and programming purposes; and
(2) Resolution No. 1-05 issued by the Board on 24 January 2005 regarding the 2000-based national population projections be superseded by this resolution.
Approved this 8th day of February 2006, in Pasig City.
Attested by:
ROMULO A. VIROLA Secretary General


![Migration Studies Minor Proposal [MIGR] - Stockton University · 2018-03-14 · Migration Studies Minor Proposal [MIGR] CIP Code: 45.0501 - Demography and Population Studies ... Historians](https://img.pdfslide.net/doc/110x75/5edc7b52ad6a402d6667282d/migration-studies-minor-proposal-migr-stockton-university-2018-03-14-migration.jpg)