Embed Size (px)
Citation preview

Demonstration of Load Rating Capabilities through Physical Load Testing: Ida County Bridge Case Study
Final Report 2 of 3August 2013
Sponsored bySoy Transportation CoalitionFederal Highway AdministrationIowa Department of Transportation(Part of InTrans Project 12-444)

About the BEC
The mission of the Bridge Engineering Center is to conduct research on bridge technologies to help bridge designers/owners design, build, and maintain long-lasting bridges.
Disclaimer Notice
The contents of this report reflect the views of the authors, who are responsible for the facts and the accuracy of the information presented herein. The opinions, findings and conclusions expressed in this publication are those of the authors and not necessarily those of the sponsors.
The sponsors assume no liability for the contents or use of the information contained in this document. This report does not constitute a standard, specification, or regulation.
The sponsors do not endorse products or manufacturers. Trademarks or manufacturers’ names appear in this report only because they are considered essential to the objective of the document.
Non-Discrimination Statement
Iowa State University does not discriminate on the basis of race, color, age, religion, national origin, sexual orientation, gender identity, genetic information, sex, marital status, disability, or status as a U.S. veteran. Inquiries can be directed to the Director of Equal Opportunity and Compliance, 3280 Beardshear Hall, (515) 294-7612.
Iowa Department of Transportation Statements
Federal and state laws prohibit employment and/or public accommodation discrimination on the basis of age, color, creed, disability, gender identity, national origin, pregnancy, race, religion, sex, sexual orientation or veteran’s status. If you believe you have been discriminated against, please contact the Iowa Civil Rights Commission at 800-457-4416 or Iowa Department of Transportation’s affirmative action officer. If you need accommodations because of a disability to access the Iowa Department of Transportation’s services, contact the agency’s affirmative action officer at 800-262-0003.
The preparation of this report was financed in part through funds provided by the Iowa Department of Transportation through its “Second Revised Agreement for the Management of Research Conducted by Iowa State University for the Iowa Department of Transportation” and its amendments.
The opinions, findings, and conclusions expressed in this publication are those of the authors and not necessarily those of the Iowa Department of Transportation or the U.S. Department of Transportation Federal Highway Administration.

Technical Report Documentation Page
1. Report No. 2. Government Accession No. 3. Recipient’s Catalog No.
Part of InTrans Project 12-444
4. Title and Subtitle 5. Report Date
Demonstration of Load Rating Capabilities through Physical Load Testing: Ida
County Bridge Case Study
August 2013
6. Performing Organization Code
7. Author(s) 8. Performing Organization Report No.
Travis Hosteng and Brent Phares Part of InTrans Project 11-411
9. Performing Organization Name and Address 10. Work Unit No. (TRAIS)
Bridge Engineering Center
Iowa State University
2711 South Loop Drive, Suite 4700
Ames, IA 50010-8664
11. Contract or Grant No.
12. Sponsoring Organization Name and Address 13. Type of Report and Period Covered
Iowa Department of Transportation, 800 Lincoln Way, Ames, IA 50010
Soy Transportation Coalition, 1255 SW Prairie Trail Parkway, Ankeny, IA 50023
Federal Highway Administration, U.S. Department of Transportation, 400 7th
Street SW, Washington, DC 20590
Final Report 2 of 3
14. Sponsoring Agency Code
SPR RB32-013
15. Supplementary Notes
Visit www.intrans.iastate.edu for color pdfs of this and other research reports.
16. Abstract
The objective of this work, Pilot Project - Demonstration of Capabilities and Benefits of Bridge Load Rating through Physical Testing,
was to demonstrate the capabilities for load testing and rating bridges in Iowa, study the economic benefit of performing such testing,
and perform outreach to local, state, and national engineers on the topic of bridge load testing and rating.
This report documents one of three bridges inspected, load tested, and load rated as part of the project, the Ida County Bridge (FHWA
#186070), including testing procedures and performance of the bridge under static loading along with the calculated load rating from the
field-calibrated analytical model. Two parallel reports document the testing and load rating of the Sioux County Bridge (FHWA
#308730) and the Johnson County Bridge (FHWA #205750). A tech brief provides overall information about the project.
17. Key Words 18. Distribution Statement
agricultural traffic routes—bridge capacities—bridge loads—bridge rating—load
restrictions—load testing—superloads
No restrictions.
19. Security Classification (of this
report)
20. Security Classification (of this
page)
21. No. of Pages 22. Price
Unclassified. Unclassified. 25 NA
Form DOT F 1700.7 (8-72) Reproduction of completed page authorized

DEMONSTRATION OF LOAD RATING CAPABILITIES
THROUGH PHYSICAL LOAD TESTING: IDA COUNTY
BRIDGE CASE STUDY
Final Report 2 of 3
August 2013
Principal Investigators
Brent Phares, Director
Bridge Engineering Center, Iowa State University
Travis Hosteng, Bridge Research Specialist
Bridge Engineering Center, Iowa State University
Authors
Travis Hosteng and Brent Phares
Sponsored by
Iowa Department of Transportation,
Soy Transportation Coalition,
Federal Highway Administration
State Planning and Research Funding
(SPR RB32-013)
Preparation of this report was financed in part
through funds provided by the Iowa Department of Transportation
through its Research Management Agreement with the
Institute for Transportation
(InTrans Project 12-444)
A report from
Institute for Transportation
Iowa State University
2711 South Loop Drive, Suite 4700
Ames, IA 50010-8664
Phone: 515-294-8103
Fax: 515-294-0467
www.intrans.iastate.edu


v
TABLE OF CONTENTS
ACKNOWLEDGMENTS ............................................................................................................ vii
INTRODUCTION ...........................................................................................................................9
OBJECTIVE AND SCOPE .............................................................................................................9
BRIDGE DESCRIPTION ................................................................................................................9
FIELD TESTING...........................................................................................................................13
Methodology ......................................................................................................................13 Instrumentation ..................................................................................................................13 Static Loading ....................................................................................................................15
LOAD TEST RESULTS................................................................................................................16
LOAD RATING ............................................................................................................................20
Model Calibration ..............................................................................................................20
Calibration Results .............................................................................................................21 Rating Factors ....................................................................................................................22
SUMMARY AND CONCLUSIONS ............................................................................................24
REFERENCES ..............................................................................................................................25

vi
LIST OF FIGURES
Figure 1. Two-lane Ida County Bridge FHWA #186070 ..............................................................10 Figure 2. Two-lane Ida County Bridge end view ..........................................................................10 Figure 3. Ida County Bridge elevation view ..................................................................................10
Figure 4. Ida County Bridge load posting ......................................................................................11 Figure 5. Ida County Bridge bearings ............................................................................................11 Figure 6. Ida County Bridge plan view ..........................................................................................12 Figure 7. Ida County Bridge profile view ......................................................................................12 Figure 8. Ida County Bridge plan view of strain transducer locations ..........................................14
Figure 9. Ida County Bridge cross-section view of strain transducer locations ............................14 Figure 10. Ida County Bridge instrumentation setup .....................................................................14 Figure 11. Ida County Bridge test truck.........................................................................................15
Figure 12. Ida County Bridge truck configuration and axle loads .................................................15 Figure 13. Transverse load position for Ida County Bridge testing ...............................................16 Figure 14. Data reproducibility for Ida County Bridge test ...........................................................17
Figure 15. Ida County Bridge center span distribution factors ......................................................18 Figure 16. Ida County Bridge approach span distribution factors .................................................18
Figure 17. Ida County Bridge top and bottom flange strains on Girder 3 for Load Case 2 ...........19 Figure 18. Finite element model of Ida County Bridge with modeled test truck footprint ...........20 Figure 19. Ida County Bridge member strain comparisons on G2 for LC2 ..................................21
Figure 20. Ida County Bridge midspan lateral distribution strain comparison for LC2 ................22 Figure 21. AASHTO load rating vehicle configurations for Ida County Bridge ...........................23
Figure 22. Iowa load rating vehicle configurations for Ida County Bridge ...................................23
LIST OF TABLES
Table 1. LFR rating factors applied ...............................................................................................22 Table 2. Ida County Bridge critical rating factors .........................................................................24
vii
ACKNOWLEDGMENTS
The authors would like to acknowledge the Soy Transportation Coalition and the Iowa
Department of Transportation (DOT) Office of Bridges and Structures for sponsoring this
research using Federal Highway Administration (FHWA) state planning and research (SPR)
funds. The authors would like to thank the technical advisory committee (TAC): Mark Dunn,
Ahmad Abu-Hawash, Darla James, Nicole Fox, Mike Steenhoek, Craig Markley, Ping Lu, and
Scott Neubauer. In addition, the authors would like to thank Justin Dahlberg, Tyler Muhlbauer,
and Doug Wood at Iowa State University for their efforts during bridge testing. Finally, the
research team would like to thank County personnel for their assistance with traffic control, use
of load trucks, and other services.


9
INTRODUCTION
The US is heavily dependent on its transportation system for the quick and efficient movement
of people, goods, and military assets. While the bulk of traffic volume utilizes state routes,
agricultural industries are dependent on both the state and local systems for their travel. With that
said, the more than 4,000 load-restricted (i.e., posted) bridges on the secondary road system
represent potential reductions in the efficiency of the movement of farm goods. This inefficiency
has the potential to reduce the cost-competitiveness of the US agricultural industry.
Currently, the rating and potential posting of bridges is completed by bridge engineers who rely
on theoretical analyses based on codified approaches. By no fault of their own, codified
approaches must be widely applicable and, as a result, many assumptions must be made.
Therefore, while the techniques provide a reliable means for assessing the safe load-carrying
capacity, they are, by their very nature, sometimes conservative.
An alternative approach is to create an analytical model that represents the behavior of a specific
bridge—as opposed to a code-specified, generic bridge—based on field test results from the
bridge itself and subsequently perform the load ratings using the calibrated model.
Currently, the Iowa Department of Transportation (DOT) Office of Bridges and Structures
identifies structures to be tested and is responsible for determining capacities and ratings based
on the load test results. In addition to determining ratings, the Iowa DOT uses data from load
tests to aid in permitting superloads and to resolve design questions. In addition, several counties
across Iowa have utilized the same approaches to evaluate the need for load restrictions.
This report documents one of three bridges inspected, load tested, and load rated as part of the
project, the Ida County Bridge (FHWA #186070), including testing procedures and performance
of the bridge under static loading along with the calculated load rating from the field-calibrated
analytical model. Two parallel reports document the testing and load rating of the Sioux County
Bridge (FHWA #308730) and the Johnson County Bridge (FHWA #205750).
OBJECTIVE AND SCOPE
The objective of this work was to demonstrate the capabilities for load testing and rating bridges
in Iowa, study the economic benefit of performing such testing, and perform outreach to local,
state, and national engineers on the topic of bridge load testing and rating.
BRIDGE DESCRIPTION
The Ida County Bridge (FHWA #186070) is a two-lane, three-span, continuous steel girder
bridge located on gravel road Orchard Avenue, approximately one mile west of Arthur, Iowa
over Odebolt Creek (approximately 60 miles west of Sioux City). The bridge was built in 1949
as a two-lane bridge with four girders and a roadway width of 20 ft curb to curb as shown in
Figure 1.

10
Figure 1. Two-lane Ida County Bridge FHWA #186070
Figures 2 and 3 show end and elevation views, respectively, at the time of testing in 2013.
Figure 2. Two-lane Ida County Bridge end view
Figure 3. Ida County Bridge elevation view

11
The current load posting for the bridge is shown in Figure 4.
Figure 4. Ida County Bridge load posting
The bridge substructure consists of concrete abutments/backwalls and concrete piers. Seven in.
curved plates provide the bearing at the abutments and rockers provide the bearing at each pier as
shown in Figure 5.
.
a. Abutment bearing b. Pier bearing
Figure 5. Ida County Bridge bearings

12
As previously noted, the bridge superstructure is a three-span continuous steel girder bridge with
two 45 ft 9 in. center-to-center of bearing end spans and a 58 ft 6 in. center-to-center of bearing
center span, for a total length of 150 ft. Figures 6 and 7 illustrate the bridge plan and profile
views, respectively.
Figure 6. Ida County Bridge plan view
Figure 7. Ida County Bridge profile view
The interior two girders of the bridge (girders G2 and G3 in Figure 7) are W27x94s, and the
exterior girders (girders G1 and G4 in Figure 7) are W24x68s. In addition, cover plates are
present on all girders in the negative moment regions on both the top and bottom flange. Cover
plates are centered over the piers and are sized as follows (width x thickness x length/span): G1
and G4 – 8.0 in. x 0.5 in. x 9 ft, G2 and G3 – 9 in. x 0.5 in. x 9 ft. The interior girders, G2-G3,
are spaced at 66 in., and the exterior girders, G1 and G4, are equally spaced 81 in. outside the
interior girders. The deck for the superstructure consists of an approximately 8 in. thick concrete
slab with concrete curbs and a steel beam/rail guardrail as illustrated in Figure 7.

13
FIELD TESTING
Methodology
The bridges selected for inclusion in this work were selected by the Iowa DOT Office of Bridges
and Structures with the assistance of the BEC and the Soy Transportation Coalition, based on the
criterion specified in the proposal. After bridge selection, preliminary information including as-
built plans, photographs, inspection reports, and geometrical data were collected, if available,
from the bridge owners (in this case, the Ida County Engineer’s Office). In addition, information
related to any critical sections within the bridges was collected from the Iowa DOT Rating
Engineer.
Once the basic bridge geometry information and photographs were obtained, an instrumentation
scheme was developed such that all critical and necessary data could be collected during load
testing. For the Ida County Bridge, the instrumentation plan included the use of strain
transducers at critical locations and three transversely-spaced load cases. Strains were collected
using Bridge Diagnostics, Inc. (BDI) strain transducers and the BDI Structural Testing System
(STS).
Load testing was then completed by monitoring the performance of the bridge as a controlled
and known load crossed the bridge. The collected data were then evaluated and used in the
creation and calibration of an analytical model. This calibrated model was then used for direct
calculation of bridge rating factors using the rating and legal loads.
Instrumentation
The instrumentation plan was developed based on the following: suggested critical sections as
specified by the Office of Bridges and Structures (in this case, midspan of the end span was
determined to be the controlling section) and the information necessary to create and calibrate an
accurate model of the bridge.
Based on these two criteria, strain transducers were installed on the top and bottom flange of
each girder at the following cross-sections, as shown in Figures 8 and 9 in plan and cross-section
views, respectively: A) a distance d, depth of girder, from the face of abutment, B) midspan of
one end span, C) a distance d, depth of girder, from the face of pier, and D) midspan of the center
span. Girders are labeled G1 through G4 from east to west. An image of a typical
instrumentation installation is shown in Figure 10.

14
Figure 8. Ida County Bridge plan view of strain transducer locations
Figure 9. Ida County Bridge cross-section view of strain transducer locations
Figure 10. Ida County Bridge instrumentation setup
15
Static Loading
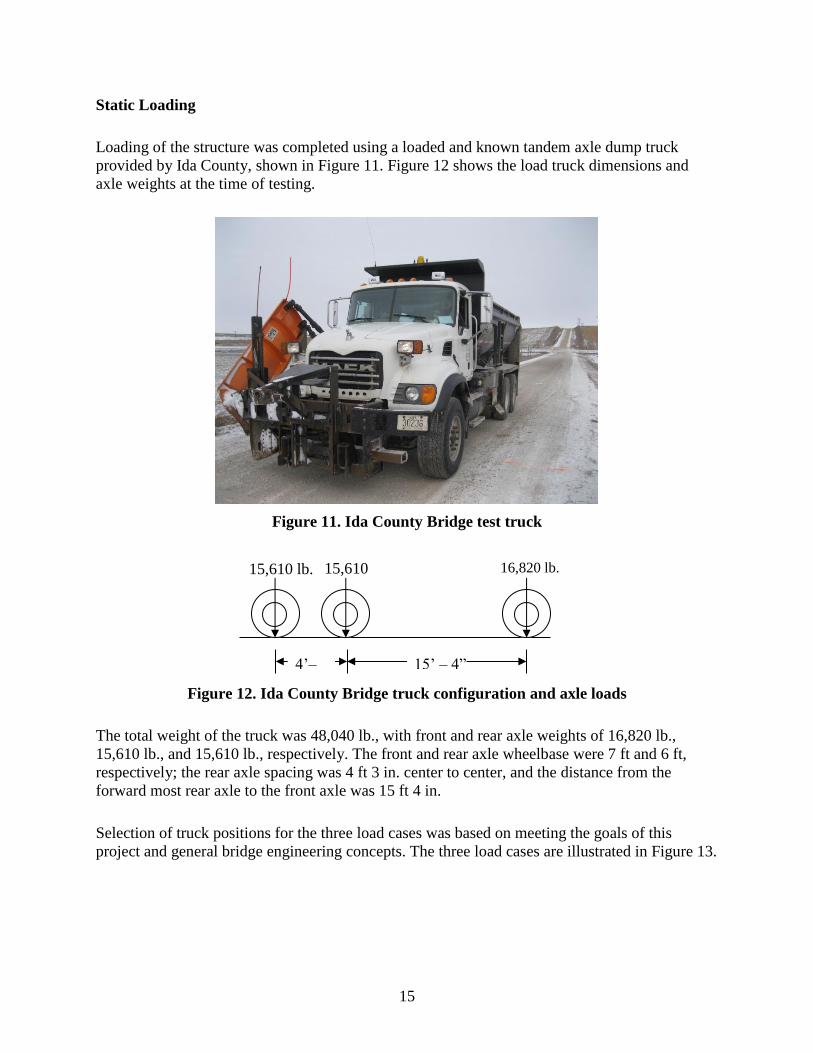
Loading of the structure was completed using a loaded and known tandem axle dump truck
provided by Ida County, shown in Figure 11. Figure 12 shows the load truck dimensions and
axle weights at the time of testing.
Figure 11. Ida County Bridge test truck
Figure 12. Ida County Bridge truck configuration and axle loads
The total weight of the truck was 48,040 lb., with front and rear axle weights of 16,820 lb.,
15,610 lb., and 15,610 lb., respectively. The front and rear axle wheelbase were 7 ft and 6 ft,
respectively; the rear axle spacing was 4 ft 3 in. center to center, and the distance from the
forward most rear axle to the front axle was 15 ft 4 in.
Selection of truck positions for the three load cases was based on meeting the goals of this
project and general bridge engineering concepts. The three load cases are illustrated in Figure 13.
15,610 lb. 15,610
lb.
16,820 lb.
4’–
3”
15’ – 4”

16
Figure 13. Transverse load position for Ida County Bridge testing
For the first load case, the truck was driven south at crawl speed with the centerline of the driver-
side wheel line offset from the east curb 2 ft. The second load case consisted of the load truck
driving south at crawl speed with the middle of the truck centered on the longitudinal centerline
of the bridge. The third and final load case involved the load truck driving south at crawl speed
with the passenger-side wheel line offset from the west curb by 2 ft.
Crawl speed indicates the load truck was moving across the bridge at less than 5 mph. At this
low speed, any dynamic effects that may be induced in the structure are negligible. The location
of the truck was recorded using the front axle as a reference point by creating a data spike for
every 10 ft traveled. This allowed the data to be presented and evaluated as a function of known
truck position.
LOAD TEST RESULTS
Following load testing, all field data were reviewed graphically to provide a qualitative
assessment of the structure’s live-load response. Some common assessments include strain
history reproducibility for tests on common load paths, elastic strain response (strains return to
zero after truck exits bridge), transverse load distribution, and axle signatures in strain data from
gauges close to the load.
Figure 14 illustrates a strain history plot versus truck position for two tests of Load Case 2 on the
bridge.

17
Figure 14. Data reproducibility for Ida County Bridge test
Comparison of the two data sets in Figure 14 indicates good reproducibility in the data. Returns
to approximately zero after passage of the load truck suggests elastic behavior in the response.
All load cases had similar response histories with respect to the degree of reproducibility and
elastic behavior; therefore, one data set from each load case was selected for further, more in-
depth, evaluation.
Approximations of the transverse load distribution characteristics of the structure were obtained
using the measured strains from the load tests. Using the measured strains and equation 1,
distribution factors (per wheel line) were calculated for each load case at midspan of both the
center span and the approach span and are presented in Figure 15 and 16, respectively.
2*
1
n
i
i
iDF
, decimal percentage of a single wheel line (1)
where:
i = maximum measured bottom flange strain from ith girder.

18
Figure 15. Ida County Bridge center span distribution factors
Figure 16. Ida County Bridge approach span distribution factors
0.00
0.10
0.20
0.30
0.40
0.50
0.60
0.70
0.80
0.90
1.00
1.10
1.20
G1 G2 G3 G4
Dis
trib
uti
on
Fac
tor
(wh
ee
l lin
es)
Girder Number
LC1
LC2
LC3
AASHTOSingleLane
0.00
0.10
0.20
0.30
0.40
0.50
0.60
0.70
0.80
0.90
1.00
1.10
1.20
G1 G2 G3 G4
Dis
trib
uti
on
Fac
tor
(wh
ee
l lin
es)
Girder Number
LC1
LC2
LC3
AASHTOSingleLane

19
In addition to the calculated distribution factors from the field strains, the American Association
of State Highway and Transportation Officials (AASHTO) Standard Specification (1996) load
distribution factors are also presented for comparison. In all cases, the field-measured
distribution factors are less than those calculated using the code-specified equations.
Based on the information available from the inspection reports and plan sheets, it was believed
that shear connectors were not utilized on the original structure. With that said, evaluation of the
top and bottom strain magnitudes for each girder was completed to determine the location of the
neutral axis and therefore the presence and degree of any unintended composite action. The
field-calculated neutral axis information was then utilized during the model calibration discussed
in the next section. Figure 17 illustrates the top and bottom flange strains measured on girder G3
for Load Case 2.
Figure 17. Ida County Bridge top and bottom flange strains on Girder 3 for Load Case 2
Similar plots were generated for all girders at both midspan cross sections (sections B and D in
Figure 8), for evaluation of the neutral axis location at each location. Based on the data
illustrated in Figure 17 and similar plots for all girders, it was determined that the Ida County
Bridge exhibited some degree of unintended composite action at all girder locations. The exterior
two girders, G1 and G4, displayed the least significant amount of composite action.
-40
-20
0
20
40
60
80
100
-50 0 50 100 150 200
Mic
rost
rain
Truck Position (ft)
Top
Bottom

20
LOAD RATING
This section briefly discusses the model calibration, validation procedures, and calculated rating
factors for the Ida County Bridge.
Model Calibration
Information gathered from the bridge and the load test data evaluation was utilized to generate an
initial two-dimensional, finite element model of the bridge using BDI’s WinGEN modeling
software as illustrated in Figure 18.
Figure 18. Finite element model of Ida County Bridge with modeled test truck footprint
Overall bridge geometry, girder and deck dimensions, approximate boundary (support restraint)
conditions, neutral axis information from the field data, along with known and calculated
material properties (modulus of elasticity, moment of inertia, etc.) were input for the basic model
generation. Once the model was generated, a two-dimensional footprint and corresponding axle
loads of the test truck, along with the load test data files, were input into the software.
With the initial model created, the load test procedures were reproduced analytically using BDI’s
WinSAC structural analysis and data correlation software. The software accomplishes this by
moving the analytical truck footprint of the test truck across the model in consecutive load cases
simulating the truck paths used during field testing. The analytical responses of this simulation
were then compared (both statistically and graphically) to the field responses to validate the
model’s basic structure and to identify modeling deficiencies.
Model calibration continued until an acceptable level of correlation between the measured and
analytical responses was achieved. This calibration involved an iterative process of optimizing
material and stiffness properties (both cross-sectional and boundary conditions) until they were
quantified realistically and the analytical model test results closely matched those from the field
test results.

21
For bridges of this type and configuration, an acceptable level of correlation is on the order of
less than 10 percent error. In the case of the Ida County Bridge, the majority of the calibration
effort was spent optimizing the approximate end restraint and stiffness characteristics observed
in the test data.
Calibration Results
At the conclusion of the model calibration, the final model produced a 0.9631 correlation and
approximately 8.5 percent error with the measured responses, which can be considered an
excellent match for a continuous steel girder structure such as the Ida County Bridge. The final
model was found to closely match the member strains in magnitude and strain history as shown
in Figure 19.
Figure 19. Ida County Bridge member strain comparisons on G2 for LC2
In addition, the model’s midspan lateral distribution of strain closely matched that of the actual
structure as shown in Figure 20.

22
Figure 20. Ida County Bridge midspan lateral distribution strain comparison for LC2
Rating Factors
This section briefly discusses the methods and findings of the load rating procedures for the Ida
County Bridge. All appropriate bridge elements were load rated in accordance with the
AASHTO load factor rating (LFR) guidelines shown in Table 1.
Table 1. LFR rating factors applied
Factor Inventory Operating
Dead Load 1.3 1.3
Live Load 2.17 1.3
Impact Load 1.3 1.3
All structural dead loads were applied automatically by the modeling program’s self-weight
function. Member capacities were calculated according to the AASHTO Manual for Bridge
Evaluation (2013) guidelines and the final calibrated finite-element model provided the structural
responses due to the rating and legal trucks. A concrete compressive strength of 3 ksi and a steel
reinforcing yield strength of 33 ksi were utilized based on the structure’s age.
A library of the rating and Iowa legal loads was generated in WinGEN allowing these vehicles to
be evaluated on the calibrated analytical model. Figures 21 and 22 illustrate the AASHTO rating
vehicle configuration and Iowa legal load configurations, respectively, used for the Ida County
Bridge. Given the 20 ft wide roadway, both one-lane and two-lane loaded scenarios were
considered.

23
Figure 21. AASHTO load rating vehicle configurations for Ida County Bridge
Figure 22. Iowa load rating vehicle configurations for Ida County Bridge
Using WinSAC, all of the rating and Iowa legal loads were applied individually to the structure
as outlined in the specifications. Member rating factors were then output for each vehicle and are
presented in Table 2.
28'
14' 14' - 22' - 30'
HS 20(14-22-30)weight = 72 kips
8 32 32
19'
15' 4'
16 17 17
51'
10' 4' 33' 4'
Type 3
weight = 50 kips
Type 3S2B
weight = 80 kips
40'
10' 4' 22' 4'
11 15.5 15.5 15.5 15.5 12 17 17 17 17
Type 3S2A
weight = 73 kips
43'
15' 4' 10' 10' 4'
14.5 12 12 13.5 14 14
Type 3-3
weight = 80 kips
19'
Type 4
weight = 54.5 kips
11' 4' 4'12.5 14 14 14
43'
Type 3S3A
weight = 80 kips
11' 4' 20' 4' 4'
12 13 13 14 14 14
62'
Type 4S3
weight = 96 kips
12' 4' 4' 4'34' 4'
60'
Type 3S3B
weight = 90 kips
12' 4' 33' 7' 4'
14 14 14 14 14 14 12
12 17 17 17 17 10

24
Table 2. Ida County Bridge critical rating factors
Rating Vehicle Location/Limiting Capacity
Inventory Rating
Factor
Operating Rating
Factor
Two
Lane
One
Lane
Two
Lane
One
Lane
HS-20(14) Two Lane Interior, One Lane
Exterior, Center Span, (+) Flexure
0.80 1.10 1.34 1.84
HS-20(22) Two Lane Interior, One Lane
Exterior, Center Span, (+) Flexure
0.96 1.31 1.60 2.19
HS-20(30) Two Lane Interior, One Lane
Exterior, Center Span, (+) Flexure
1.10 1.52 1.84 2.53
Type 4 Two Lane Interior, One Lane
Exterior, Center Span, (+) Flexure
0.92 1.27 1.54 2.11
Type 3S3A Two Lane Interior, One Lane
Exterior, Center Span, (+) Flexure
0.98 1.35 1.64 2.26
Type 3-3 Two Lane Interior, One Lane
Exterior, Center Span, (+) Flexure
1.00 1.35 1.67 2.26
Type 3S3B Two Lane Interior, One Lane
Exterior, Pier, (-) Flexure
1.01 1.39 1.69 2.32
Type 4S3 Two Lane Interior, One Lane
Exterior, Pier, (-) Flexure
0.94 1.27 1.57 2.12
Type 3 Two Lane Interior, One Lane
Exterior, Center Span, (+) Flexure
1.01 1.39 1.69 2.32
Type 3S2B Two Lane Interior, One Lane
Exterior, Pier, (-) Flexure
1.06 1.45 1.78 2.42
Type 3S2A Two Lane Interior, One Lane
Exterior, Center Span, (+) Flexure
1.05 1.44 1.75 2.40
Midspan and Endspan
Lane Load
Two Lane Interior, One Lane
Exterior, Pier, (-) Flexure
1.15 1.39 1.93 2.32
Both Endspans Lane
Load
Two Lane Interior, One Lane
Exterior, Pier, (-) Flexure
2.11 2.58 3.52 4.31
Midspan Lane Load Two Lane Interior, One Lane
Exterior, Pier, (-) Flexure
1.62 1.94 2.70 3.23
Single Endspan Lane
Load
Two Lane Interior, One Lane
Exterior, Pier, (-) Flexure
2.03 2.50 3.39 4.18
The bridge met operational rating criteria (RF>1.0) for all standard design and posting loads for both
one and two lanes loaded, as shown in Table 2. The inventory rating criteria (RF>1.0) was also
satisfied for the rating vehicle and all Iowa legal loads for one lane loaded. However, the bridge met
the inventory rating criteria for all but the HS-20 (14 ft and 22 ft) rating vehicle and Type 4, Type
3S3A, and Type 4S3 Iowa legal loads for two lanes loaded. The critical rating factor for all vehicles
was controlled by the flexural capacity of the girders near midspan of the center span.
SUMMARY AND CONCLUSIONS
Overall, the live load response data recorded during the field testing of the Ida County Bridge
revealed no abnormalities. The test data exhibited response magnitudes and shapes typical of a
three-span continuous, steel girder structure.

25
Following testing of the structure, a two-dimensional finite element model of the structure was
created using the collected structural information, and subsequently calibrated until an acceptable
match between the measured and analytical responses was achieved. A very good correlation
between the measured and computed response was obtained during the modeling process. The
calibrated model was then utilized to conduct load ratings for the bridge by applying the
AASHTO rating vehicle and Iowa legal loads to the model. Comparison of the input member
capacities with the model-generated moments resulted in output rating factors for all vehicles.
The load rating results were controlled by the ultimate flexural capacity of the girders near
midspan of the center span. The results indicated the bridge had satisfactory operating level
ratings (RF>1.0) for all standard AASHTO design and rating loads for both one and two lanes
loaded. Furthermore, the inventory rating criteria (RF>1.0) was also satisfied for the rating
vehicle and all Iowa legal loads for one lane loaded. However, the bridge met the inventory
rating criteria for all except the HS-20 (14 ft and 22 ft) rating vehicle and Type 4, Type 3S3A,
and Type 4S3 Iowa legal loads for two lanes loaded.
REFERENCES
AASHTO (1996). AASHTO Standard Specifications. Washington, DC.
AASHTO (2013). Manual for the Bridge Evaluation, Second Edition – 2013 Revisions.
Washington, DC.


![INDEX [publications.iowa.gov]publications.iowa.gov/28669/1/Iowa_Conservationist_Index_1952_19… · "Crawfish vs Tu1llt>," ~l'pt 53, p 166 cno·w "Fasl Gro,ving VY'inlt•l Sport,"](https://img.pdfslide.net/doc/110x75/5fd3468b8b61fb082725cec4/index-crawfish-vs-tu1llt-lpt-53-p-166-cnow-fasl-groving.jpg)
![INDEX [publications.iowa.gov]publications.iowa.gov/28752/1/Iowa_Conservationist_Index_1956_1957.pdfINDEX IOWA CONSERVATIONIST, VOLUMES 15 AND 16 JANUARY 1956- DECEMBER 1957 A '\ t:](https://img.pdfslide.net/doc/110x75/5ecb9a99006b0b3d202e401d/index-index-iowa-conservationist-volumes-15-and-16-january-1956-december-1957.jpg)