Embed Size (px)
Citation preview

FINAL REPORT Demonstration of New, Highly Perchlorate-Selective Ion
Exchange Resin Coupled with Resin-Optimized, Single-Vessel Engineering Design
ESTCP Project ER-200542
March 2013
Jim Summerfield The Dow Chemical Company

ESTCP # ER0542
i
Table of Contents
List of Acronyms and Abbreviations iii List of Figures iv List of Tables iv 1 Introduction 1 1.1 Background 1 1.2 Objectives of the Demonstration 1 1.3 Regulatory Drivers 1 1.4 Stakeholder/End-User Issues 2 2 Technology Description 2 2.1 Technology Overview 2 2.2 Technology Development 13 2.3 Advantages and Limitations of the Technology 14 3 Demonstration Design 16 3.1 Performance Objectives 16 4 Facilities/Site Description 17 4.1 Facility/Site Location and Operation 18 5 Test Design 19 5.1 Pre-Demonstration Testing and Analysis 19 5.2 Operational Testing 20 5.2.1 Demonstration Set-Up and Start-Up 20 5.2.2 Period of Operation 21 5.2.3 Treatment Rate 23 5.2.4 Residuals Handling 23 5.2.5 Operating Parameters for the Technology 23 5.2.6 Experimental Design 24 5.2.7 Performance Monitoring 25 5.3 Demobilization 27 5.4 Quality Assurance/Quality Control 27 5.5 Health and Safety Plan (HASP) 27 5.6 Management and Staffing 27 5.7 Demonstration Schedule 28 6 Performance Assessment 28 6.1 Performance Criteria 28 6.2 Performance Confirmation Methods 29 6.3 Data Analysis, Interpretation and Evaluation 30 6.4 Performance Data – West Valley Water District 30 6.5 Performance Data – City of Colton, CA 32 6.6 Performance Data – City of Rialto, CA 34 7 Cost Assessment 35 7.1 Cost Reporting 35 7.2 Cost Analysis 35

ESTCP # ER0542
ii
8 Implementation Issues 36 8.1 Environmental Checklist 36 8.2 Other Regulatory Issues 36 8.3 End-User Issues 36 9 References 37 10 Points of Contact 38 11 Conclusion 39 Appendix A. Analytical Methods Supporting the Sampling Plan 40 Appendix B. Quality Assurance Plan (QAPP) 53 Appendix C. Health and Safety Plan (HASP) 58 Appendix D. Water Sampling Procedure 60

ESTCP # ER0542
iii
List of Acronyms and Abbreviations
Acronym Definition BV Bed Volume CADHS California Department of Health Services Cap Loading Capacity of resin CAPEX Capital Expenditure Cl- Chloride Anion DVB Divinyl Benzene eq equivalent(s) ft Foot (feet) gal gallon(s) gpm gallons per minute HASP Health and Safety Plan HCO3
- Bicarbonate Anion in inch(es) l, L liter(s) lbs pound(s) MCL Maximum Contaminant Level ml milliliter(s) mm millimeter(s) Mp Mass of perchlorate loaded on resin over time µg microgram(s) Na+ Sodium Cation NH4ClO4 Ammonium Perchlorate NO3
- Nitrate Anion NPDES National Pollutant Discharge Elimination System NSF National Sanitation Foundation OH- Hydroxide Anion OPEX Operating Expenditure QAPP Quality Assurance Project Plan Pi Inlet perchlorate concentration Po Outlet perchlorate concentration ppm parts per million SO4
2- Sulfate Anion USEPA United States Environmental Protection Agency Vr Volume of resin Vw Volume of water treated by resin over time WVWD West Valley Water District
ESTCP # ER0542
iv
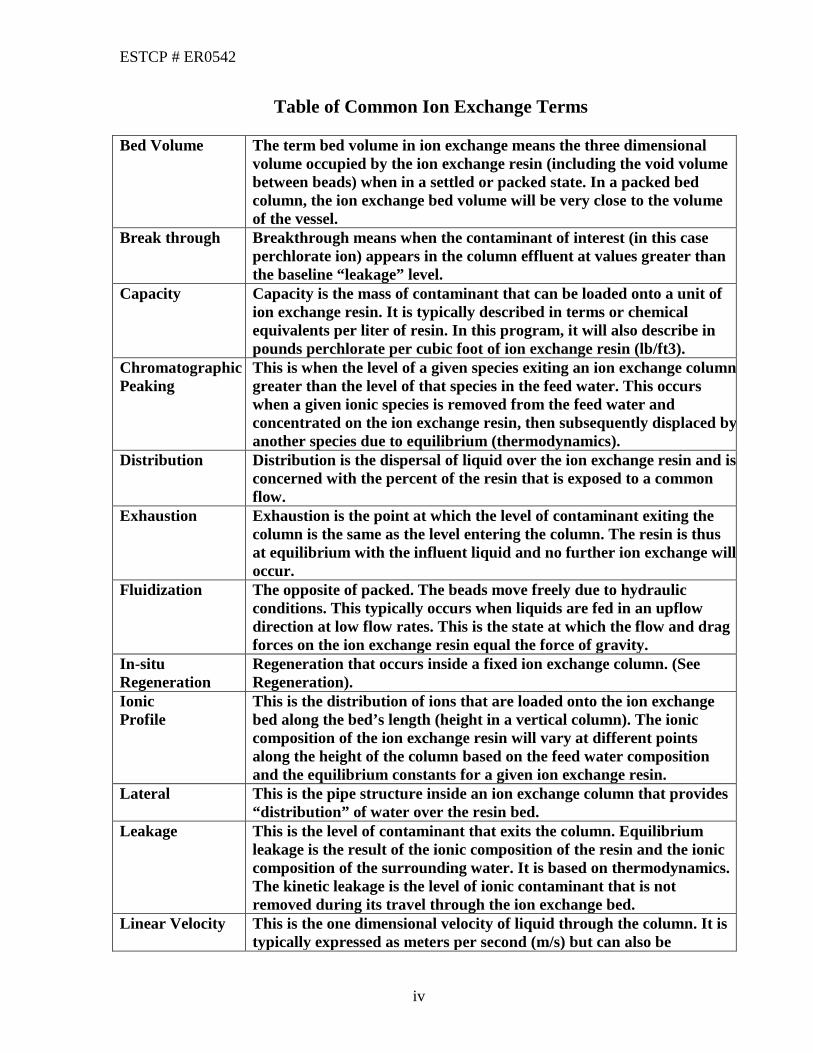
Table of Common Ion Exchange Terms
Bed Volume The term bed volume in ion exchange means the three dimensional volume occupied by the ion exchange resin (including the void volume between beads) when in a settled or packed state. In a packed bed column, the ion exchange bed volume will be very close to the volume of the vessel.
Break through Breakthrough means when the contaminant of interest (in this case perchlorate ion) appears in the column effluent at values greater than the baseline “leakage” level.
Capacity Capacity is the mass of contaminant that can be loaded onto a unit of ion exchange resin. It is typically described in terms or chemical equivalents per liter of resin. In this program, it will also describe in pounds perchlorate per cubic foot of ion exchange resin (lb/ft3).
Chromatographic Peaking
This is when the level of a given species exiting an ion exchange column greater than the level of that species in the feed water. This occurs when a given ionic species is removed from the feed water and concentrated on the ion exchange resin, then subsequently displaced by another species due to equilibrium (thermodynamics).
Distribution Distribution is the dispersal of liquid over the ion exchange resin and is concerned with the percent of the resin that is exposed to a common flow.
Exhaustion Exhaustion is the point at which the level of contaminant exiting the column is the same as the level entering the column. The resin is thus at equilibrium with the influent liquid and no further ion exchange will occur.
Fluidization The opposite of packed. The beads move freely due to hydraulic conditions. This typically occurs when liquids are fed in an upflow direction at low flow rates. This is the state at which the flow and drag forces on the ion exchange resin equal the force of gravity.
In-situ Regeneration
Regeneration that occurs inside a fixed ion exchange column. (See Regeneration).
Ionic Profile
This is the distribution of ions that are loaded onto the ion exchange bed along the bed’s length (height in a vertical column). The ionic composition of the ion exchange resin will vary at different points along the height of the column based on the feed water composition and the equilibrium constants for a given ion exchange resin.
Lateral This is the pipe structure inside an ion exchange column that provides “distribution” of water over the resin bed.
Leakage This is the level of contaminant that exits the column. Equilibrium leakage is the result of the ionic composition of the resin and the ionic composition of the surrounding water. It is based on thermodynamics. The kinetic leakage is the level of ionic contaminant that is not removed during its travel through the ion exchange bed.
Linear Velocity This is the one dimensional velocity of liquid through the column. It is typically expressed as meters per second (m/s) but can also be
ESTCP # ER0542
v
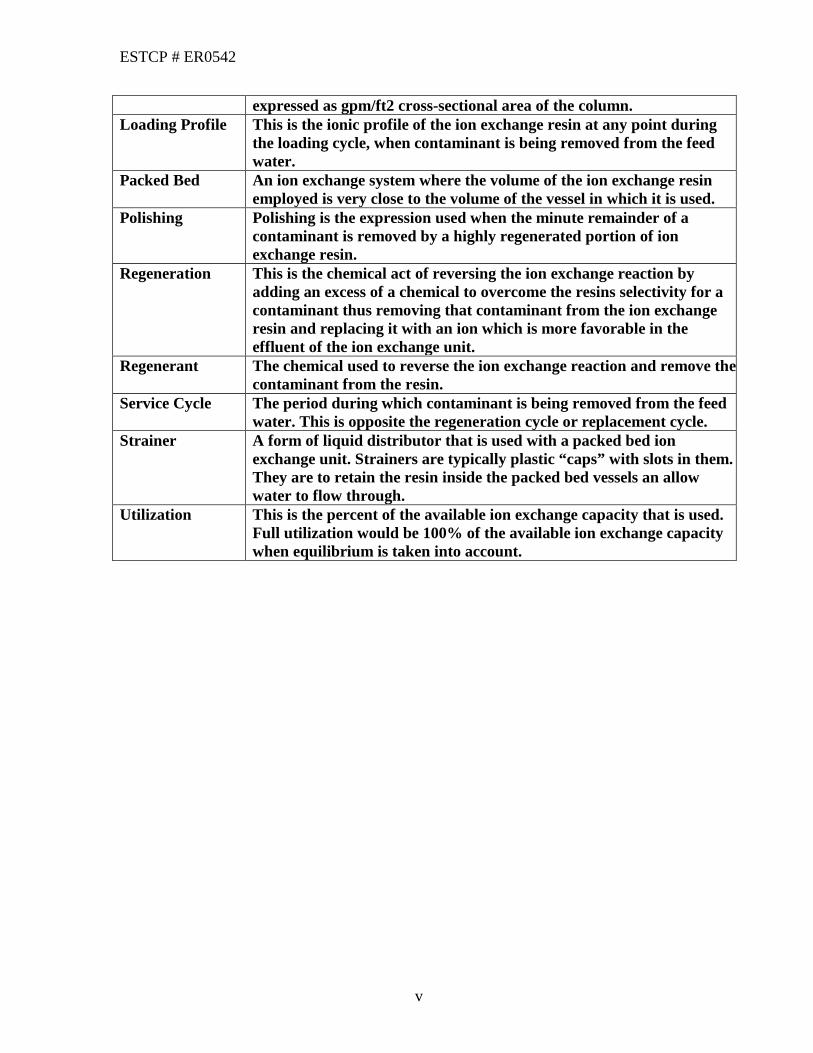
expressed as gpm/ft2 cross-sectional area of the column. Loading Profile This is the ionic profile of the ion exchange resin at any point during
the loading cycle, when contaminant is being removed from the feed water.
Packed Bed An ion exchange system where the volume of the ion exchange resin employed is very close to the volume of the vessel in which it is used.
Polishing Polishing is the expression used when the minute remainder of a contaminant is removed by a highly regenerated portion of ion exchange resin.
Regeneration This is the chemical act of reversing the ion exchange reaction by adding an excess of a chemical to overcome the resins selectivity for a contaminant thus removing that contaminant from the ion exchange resin and replacing it with an ion which is more favorable in the effluent of the ion exchange unit.
Regenerant The chemical used to reverse the ion exchange reaction and remove the contaminant from the resin.
Service Cycle The period during which contaminant is being removed from the feed water. This is opposite the regeneration cycle or replacement cycle.
Strainer A form of liquid distributor that is used with a packed bed ion exchange unit. Strainers are typically plastic “caps” with slots in them. They are to retain the resin inside the packed bed vessels an allow water to flow through.
Utilization This is the percent of the available ion exchange capacity that is used. Full utilization would be 100% of the available ion exchange capacity when equilibrium is taken into account.

ESTCP # ER0542
vi
List of Figures
Figure Page 1. Chemical description of a strongly basic anion exchange resin. 2 2. Typical Lead-Lag Carbon Vessel Design currently used for perchlorate removal. 4 3. Example of a typical Counter-Current Regenerated Ion Exchange Vessel. 5 4. Typical Packed-Bed Ion ExchangeVessel. 6 5a. Schematic of vessel for ESTCP demonstration project. Normal operation. 7 5b. Schematic of vessel for ESTCP demonstration project. Service mode. 7 6a. Engineering drawing for ESTCP vessel skid, View #1 8 6b. Engineering drawing for ESTCP vessel skid, View #2 9 6c. Engineering drawing for ESTCP vessel skid, View #3 10 6d. Engineering drawing for ESTCP vessel skid, View #4 11 7. Resin exhaustion and replacement process for ESTCP demonstration project. 12 8. Pilot column employing proposed vessel design. 14 9. West Valley Water District (WVWD) Well #11. 18 10. City of Colton, Dominick Reservoir and Wells #15 and #17 Treatment System. 18 11. City of Rialto Well #4. 19 12. Face Piping and Well Connection – West Valley Water District 21 13. Process Flow Diagram for ESTCP Resin Loading and Service Vessel. 22 14. Time Line for ESTCP Demonstration Project. 23 15. Daily Log Sheet for ESTCP Demonstration Project. 26 16. West Valley Water District – Cycle #1 31 17. West Valley Water District – Cycle #2 31 18. West Valley Water District – Cycle #3 32 19. City of Colton CA – Cycle #1 33 20. City of Colton CA – Cycle #2 33 21. City of Rialto CA – Cycle #1 34
List of Tables
Table Page 3-1. Performance Objectives. 16 4-1. Water Analyses for the ESTCP Demonstration Sites. 17 5-1. Perchlorate Loading Predictions for ESTCP Demonstration Sites. 20 5-2. Management and Staffing for ESTCP Demonstration Project. 27 6-1. Performance Criteria for ESTCP Demonstration Project. 28 6-2. Expected Performance and Performance Confirmation Methods. 29 7-1. Cost Tracking for ESTCP Demonstration Project 35 10-1. Points of Contact 38
ESTCP # ER0542
1
1 Introduction
1.1 Background Ammonium perchlorate is used in the formulation for solid rocket fuel to propel military projectiles. This formulation has been demonstrated to be highly effective, stable under ambient conditions, and low in toxicity compared to previous liquid formulations. For these reasons, ammonium perchlorate is a very important material to our military and national security. Through handling and maintenance practices believed to be satisfactory based on the low toxicity profile of ammonium perchlorate, this material was introduced to the environment. Because of ammonium perchlorate’s solubility in water and stability, it has persisted in the environment and has migrated to aquifers in populated areas and hence entered some potable water sources. Health studies have found that perchlorate can mimic iodine in the human thyroid and potentially disrupt thyroid function.a For this reason, many states and the United States Environmental Protection Agency (USEPA) are considering creating regulations on the amount of perchlorate allowed in drinking water. Through litigation, much of the financial burden of removing perchlorate from the environment has fallen to the Department of Defense (DoD). As this trend is likely to continue, it is important that the most cost effective method of removing perchlorate from drinking water be determined and employed. This project will demonstrate the most cost effective method of employing ion exchange to remove low levels of perchlorate from drinking water. A highly-perchlorate-selective ion exchange resin will be used in a novel vessel, designed to fully utilize the resins’ capacity while minimizing operational problems encountered with current lead-lag, dual vessel systems. While this project will employ resin on a once-use basis, the vessel design can be successfully used for external regeneration operating models. It is not suitable for in-situ resin regeneration.
1.2 Objectives of the Demonstration
It is the objective of this project is to demonstrate a novel vessel design and operating practice which can fully utilize the capacity of highly perchlorate selective ion exchange resin while mitigating other operational problems that often result in premature resin replacement. This will be done at three municipalities in Southern California (City of Rialto, City of Colton, and West Valley Water District) at full-scale (1250 gpm). In addition to minimizing cost, this vessel design is both small in foot print and low in profile which is beneficial for aesthetics as many of the wells are located in residential areas.
1.3 Regulatory Drivers
While no national regulations currently exist for the amount of perchlorate allowed in drinking water, several states including California have implemented a drinking water limit on perchlorate. The Maximum Contaminant Level (MCL) for perchlorate in California is 6 ppb and levels as low as 1 ppb have been suggested, but not implemented. Low levels of perchlorate in ground water coupled with low MCL’s will increase the number of drinking water wells that require treatment. Ion exchange

ESTCP # ER0542
2
has been demonstrated to be a very effective process technology for these conditions and is quite applicable as a well-head treatment technology based on effectiveness, cost, and scalability.
1.4 Stakeholder/End-user Issues
This demonstration should yield accurate cost and operational data which will enable both the DoD and water utilities to make decisions about what technology to employ for a given well. It will also validate the predictive models used in making these decisions such that accurate costs can be predicted with just a simple water analysis.
2 Technology Description 2.1 Technology Overview
As previously mentioned, ammonium perchlorate (NH4ClO4) is both extremely soluble in water and very stable. In solution, it will exist as a soluble salt of perchlorate anion (ClO4
-) and a counter cation, depending on the ambient ground water. As perchlorate exists as a charged anion, it can be removed from solution by ion exchange technology. Ion exchange resins are insoluble polymer beads that have the ability to reversibly exchange ions. The beads are in the range of 0.35 mm to 1.1 mm in diameter and typically used in packed beds of 24in. to 72in. in depth. Most commercial ion exchange resins used in water treatment are made of a copolymer of styrene and divinylbenzene (DVB) that is functionalized to fix the exchange site to the copolymer backbone. Strongly acidic cation exchange resins possess a sulfonic acid exchange site while strongly basic anion exchange resins possess a quaternary amine exchange site. We will be employing strongly basic anion exchange resin in this demonstration program. Figure 1 shows the chemical composition of a standard strongly basic anion exchange resin. In regenerable applications, the exchangeable ion is determined by Figure 1. Chemical description of a strongly basic anion exchange resin.
CH2
HC
CH3
N+ CH3
CH3
Cl-
Styrene Copolymer
Positively Charged Quaternary Ammonium Functional Group
Negatively Charged Counter Ion (exchangeable)

ESTCP # ER0542
3
the choice of regenerating reagent. Due to thermodynamic considerations that will not be discussed here, ion exchange resins have a higher selectivity for some ions over others. A typical strongly basic anion exchange resin has the following selectivity profile:
OH- < HCO3
- < Cl- < NO3- < SO4
2- < ClO4-
It is this difference in selectivity that allows ion exchange resin to be used to remove low levels of one ion in the background of higher concentrations of another ion. The physical and chemical composition of the ion exchange resin can be manipulated to affect this relative selectivity. In the case of this demonstration project, the resin employed has been developed specifically to have a very high selectivity for perchlorate ion. This is marketed commercially as AmberliteTM PWA2. It should be noted that the perchlorate-selective ion exchange resin being used in this project has been utilized commercially for perchlorate removal. Hence, the resin is not the focus of this demonstration. It is the single vessel design and how the design maximizes the use of the ion exchange resin on which we will concentrate in this demonstration. In this application, the exchange reaction can be written as:
R+-Cl- + Na+ClO4
- ----- R+-ClO4- + Na+Cl-
In this case, sodium ion (Na+) has been used to represent the counter-ion to maintain electrical neutrality in the chemical equation. R represents the immobile ion exchange site bound to the resin copolymer.
The selectivity for this highly perchlorate selective resin is as follows:
OH- < SO42- << Cl- = HCO3
- < NO3- << ClO4
-
The current practice for employing ion exchange resin for the removal of perchlorate from drinking water is to use standard activated carbon service vessels in a lead-lag configuration (2 vessels in series) with a minimum of 3 ft of bed depth per vessel. When the lead vessel is exhausted, the polishing vessel is placed in the lead position, the resin in the lead vessel is replaced with fresh resin, and this vessel is placed in the polishing position. These vessels are typically 10-12ft in diameter with a 7-8 ft straight side. They also employ vertical strainers mounted in the bottom dish to retain the resin inside the vessel. These vertical strainers result in poor distribution of water over the media and inefficient use of this media. In addition, these vessels are used in a down-flow mode with water entering the top of the vessels and exiting to bottom. This operational mode has two deficiencies. First, the long operating time in the down-flow mode tends to compact the resin and increase pressure drop. Second, there is a tendency to build up suspended solids on the top of the bed. Both of these issues require back wash of the resin bed to mitigate the effects. This back washing can fluidize the ion exchange bed and disturb the resin loading profile. In this manner, some of the resin that is saturated in perchlorate can end up residing in the bottom of the vessel, near the exit. This will result in increased leakage and potentially

ESTCP # ER0542
4
premature resin replacement. Figure 2 is a schematic of standard activated carbon vessels employed in the lead-lag configuration. Additionally, the use of two large vessels requires more area for foot print, has a higher profile, and utilizes more resin (greater pressure drop and pumping costs) than the proposed technology. Figure 2. Typical Lead-Lag Carbon Vessel design Counter-current regenerated ion exchange systems were developed in the 1950’s to decrease leakage of unwanted ions and to increase chemical efficiency. Previously, only co-current regenerated ion exchange systems existed. In a co-current regenerated system, the flow directions of the service cycle and the regeneration cycle are the same, i.e. down-flow. During regeneration, the top of the resin bed always sees the virgin regeneration solution while the bottom of the bed sees a mixture of diluted regenerant and liberated ions from the regeneration process. Thus, the bottom of the bed is less regenerated than the top and contains an inventory of unwanted ions that “leak” off the resin during the subsequent service cycle. A counter-current regenerated system uses opposite directions for the service cycle and the regeneration cycle. In this manner, the resin at the exit (top) of the bed during the service cycle is the resin at the entrance to the bed during the regeneration cycle. Thus, it is the resin that sees the virgin regenerant solution and is highly regenerated. Because the resin has a very low inventory of unwanted ions present during the subsequent service
Conventional Carbon Vessels
Underutilized resin
Compaction occurs from down-flow
Flow Direction
Flow Direction

ESTCP # ER0542
5
cycles, “leakage” of unwanted ions is very low. The key tenant of these counter-current systems was to maintain the ion profile of the ion exchange resin bed so highly regenerated resin would always be present at the exit of the bed to polish the treated water to very low levels of unwanted ions. Also, any partially exhausted resin would reside at the entrance to the bed. The early systems employed down-flow service cycles and up-flow regeneration with either a downward “blocking” flow of water or air to hold the bed in a packed state during regeneration. In either case, a mid-lateral was employed to remove liquid from the system at a place that was neither the top nor the bottom of the vessel. A further refinement to this design was the split-flow, counter-current regenerated system. In this design, the mid-lateral was placed below the surface of the resin bed such that the top of the resin bed was regenerated in a co-flow manner and the bottom of the bed was regenerated in a counter-current manner. Figure 3 is a schematic of this type of counter-current regenerated ion exchange bed. Finally, the reverse-flow, counter-current regenerated, packed-bed demineralizer was developed. This design used fixed nozzle (strainer) plates to keep the resin profile intact and removed the need for an internal mid-lateral. It also employed up-flow service and down-flow regeneration. Figure 4 is a schematic of a typical packed-bed, ion exchange vessel. In the 1960’s, the mixed bed demineralizer was developed. This employed two types of ion exchange resin (cation and anion exchange resin) in the same bed. These resins needed to be separated prior to regeneration and then the respective fractions needed to be held in position during regeneration as not to allow cross-contamination of the resin. Figure 3. Example of a typical Counter-Current Regenerated Ion Exchange Vessel.
Regenerant
Regeneration direction
Water hold-down
Effluent
ESTCP # ER0542
6
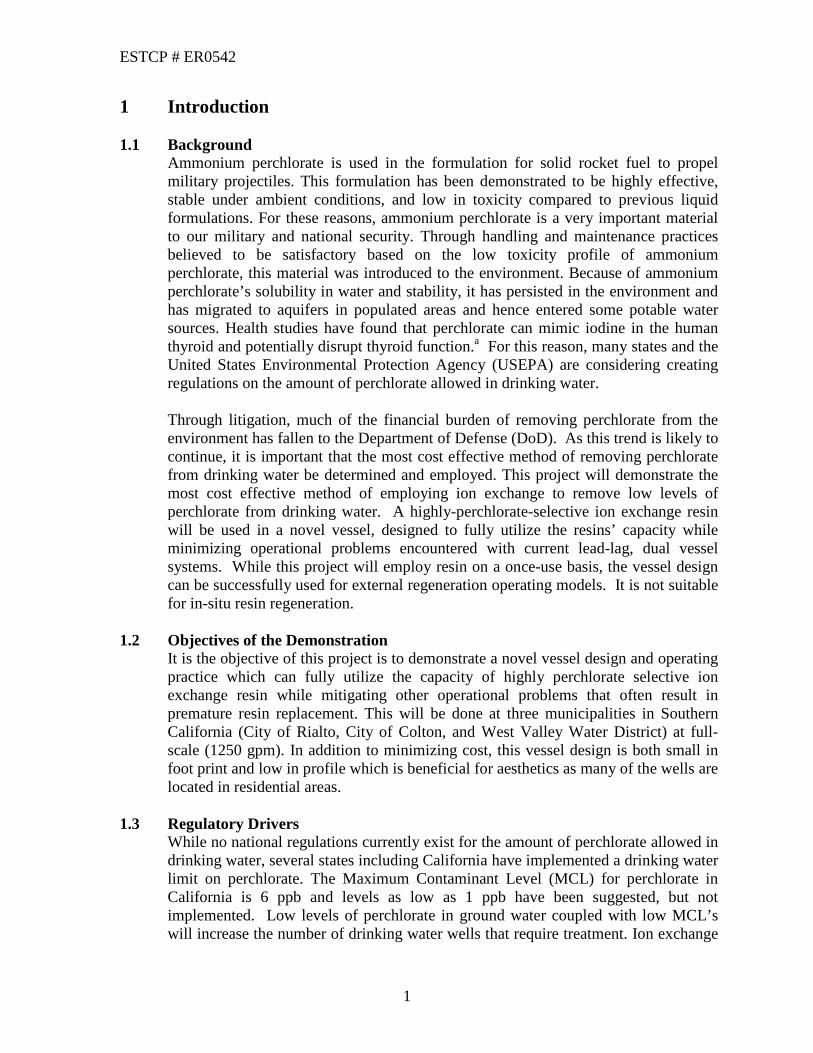
Figure 4. Typical Packed-Bed Ion Exchange Vessel.
Elements of each of these technologies were drawn upon to create a vessel design which would optimize the use of, once-use resin. Figures 5a and 5b show a schematic of this vessel design. The design is based on a reverse-flow, packed-bed system. The resin (5 ft bed depth) is contained between two fixed, flat nozzle plates and in this manner the resin loading profile is maintained intact. Up-flow operation allows bed decompaction during any disruption of flow, thus reducing the need to backwashing to reduce bed compaction. An unscreened central internal lateral is used to remove the bottom (exhausted) portion while the top portion of the bed is retained intact. While in the service mode (Figure 5b) with water flowing up and packing the bed against the upper nozzle plate, the valve on the unscreened central lateral is opened. Resin below this lateral is flushed out of the system and is collected for disposal while all resin above this central lateral remains in the vessel, packed against the upper nozzle plate. After the exhausted resin has been removed from the bed, the top layer of resin is allowed to fall to the bottom (entrance) and fresh resin can be added to the top to create a new polishing zone. This allows lead-lag operation inside a single vessel. Figures 6a, 6b, 6c and 6d show the basic engineering drawings of the vessel to be used on this demonstration project. Figure 7 shows the various stages of operation and how the resin bed is managed to remove the exhausted resin while keeping the fresh resin in the vessel.
Water In
Water Out RegenerantChemical In
RegenerantChemical Out
Nozzle Plates to retain resin in a packed state
Resin Bed

ESTCP # ER0542
7
Figure 5a. Schematic of vessel for ESTCP demonstration project. Normal operation. Figure 5b. Schematic of vessel for ESTCP demonstration project. Service mode.
Resin In
Water In
Flow DirectionRESIN OUT
Unscreened sub-surface lateral to remove bottom
layer of resin during resin repalcement /
addition steps.
Resin In
Water In
Water Out
RESIN OUTUnscreened sub-surface lateral to remove bottom
layer of resin during resin repalcement /
addition steps.
Flow Direction

ESTCP # ER0542
8
Figure 6a. Engineering drawing of ESTCP vessel skid. View #1

ESTCP # ER0542
9
Figure 6b. Engineering drawing of ESTCP vessel skid, View #2

ESTCP # ER0542
10
Figure 6c. Engineering drawing of ESTCP vessel skid, View #3

ESTCP # ER0542
11
Figure 6d. Engineering drawing of ESTCP vessel skid, View #4

ESTCP # ER0542
12
Figure 7. Resin exhaustion and replacement process for ESTCP demonstration project (up-flow water service).
Wave Front
partially exhausted
Unused ResinUnused Resin Unused Resin
Unused Resin
Saturated ResinSaturated Resin to Waste
Unused Resin
Fresh Resin Fresh Resin
1 2 3
4 5
Wave Front
partially exhausted
Wave Front
partially exhausted
Wave Front
partially exhausted
Wave Front
partially exhausted
Wave Front
partially exhausted
Unused ResinUnused Resin Unused Resin
Unused Resin
Saturated ResinSaturated Resin to Waste
Unused Resin
Fresh Resin Fresh Resin
1 2 3
4 5
Wave Front
partially exhausted
Wave Front
partially exhausted
Wave Front
partially exhausted
Wave Front
partially exhausted

ESTCP # ER0542
13
In this application, the key design criteria are focused around the linear velocity of water through the ion exchange bed and the bed depth. The velocity needs to be sufficient to maintain the ion exchange bed in a packed state (against the upper nozzle plate) when running in the up-flow mode. For anion exchange resin of this type, this linear velocity is approximately 10 gpm/ft2 of cross-sectional area. For an 8 ft diameter vessel (50 ft2 cross-sectional area), this flow rate is about 500 gpm. If the linear velocity is too low, and fluidization of the ion exchange bed occurs, poor contact between the liquid and the beads could allow perchlorate ion to pass through the bed without being removed. Also, the rate at which perchlorate ions can migrate from the bulk liquid phase into the resin is partially dictated by the linear velocity of the water through the ion exchange bed. Higher flow rates are favorable for low concentrations of solute but shorten the time this solute is in contact with the ion exchange resin. Balancing these two variables typically results in a “mass transfer zone” which is the portion of the ion exchange bed through which the ion of interest is being removed from the water. It can be described by a linear distance over which the concentration of the ion of interest goes from the influent concentration to zero. As long as this mass transfer zone is shorter than the bed height, the ion exchange process can be employed. When the mass transfer zone is longer than the available resin bed, leakage of the unwanted ion out of the ion exchange bed will occur. It is easy to manage the velocity of water through the bed for a given flow rate by adjusting the diameter of the bed to give the desired velocity. One can then set the bed depth to manage the tradeoff between run length and pressure drop. Higher bed depths will give longer run lengths at the expense of higher pressure drops.
2.2 Technology Development
AmberliteTM PWA2 has been used commercially at the Lincoln Avenue Water Company and has been shown to be capable for removing perchlorate to below detection level. Results from a three-cubic foot (3-ft3) pilot program are discussed in a technical paper entitled, “Development of a Highly Selective Ion Exchange Resin for Removal of Perchlorate From Groundwater”.b In addition, this article describes the validation of a proprietary computer model as a predictive tool for resin performance. Figure 8 shows four photographs from a 6 in diameter pilot column employing the proposed design. In this trial, a single nozzle was employed in the top and bottom of the column and a 1 in unscreened central lateral with ¼ in holes was installed. A 60 in bed depth of Amberlite™ PWA2 resin was added to the column. Water was introduced at a flow rate that equaled the proposed linear velocity of the full-scaled design. The bed was easily packed against the upper nozzle plate. Once the bed was packed, the valve on the central lateral was opened and the resin below the central lateral was removed through the holes in this lateral. When the resin level reached the central lateral, no more resin was removed from the vessel and the resin above this lateral remained in a well-packed state. Resin removal was completed within 3 minutes.

ESTCP # ER0542
14
Figure 8. Pilot column employing proposed vessel design. 2.3 Advantages and Limitations of the Technology
The key factor affecting the cost of the system will be the management of the upper portion of the ion exchange bed during the removal of the lower exhausted portion. Removing unexhausted resin will result in higher resin use than anticipated and reduce the benefit of the design. There is also the obvious factor of resin capacity which has the major effect on the cost. This, however, has been well studied and the predictive model has been validated making this issue less of a risk and concern for the success of the demonstration. Another factor affecting the overall cost performance equation is resin disposal. The used ion exchange media in this system as well as many other systems of similar design is disposed of in a properly approved facility (landfill or incineration). The cost of this disposal has not been prohibitive and has not detrimentally affected the economics of using ion exchange technology for perchlorate removal from drinking water sources.
Advantage: Compared to the lead-lag ion exchange process, the primary advantage of the technology being demonstrated is ion exchange resin utilization. While some lead-lag systems may allow full saturation of the lead bed, practical experience has shown that most lead beds are replaced for reasons other than perchlorate saturation, e.g. pressure drop due to compaction of suspended solids loading. The secondary advantage is the small foot-print for the water utility which allows deployment of this technology to locations in neighborhoods and locations with limited land.

ESTCP # ER0542
15
Limitation: A limitation of the technology is more frequent resin change-outs. Also, most lead-lag systems employ large amounts of resin and the resin change-out procedures and infrastructure have been established to remove these large resin quantities. A more efficient method and infrastructure for smaller and more frequent resin change-outs will need to be established in the marketplace. Advantage: Chromatographic peaking of perchlorate has not been an issue with ion exchange technology because most of the resins employed have a high selectivity for perchlorate. However, equilibrium leakage of perchlorate at quantities higher than the effluent specification can occur if the resin containing perchlorate is located near the exit of the vessel. In the case of lead-lag systems, the resin loading profile in the polishing vessel is not disturbed. Thus, the perchlorate inventory in the bed is not redistributed toward the exit and equilibrium leakage has not been an issue. With the proposed vessel design, some resin turbulence and mixing will occur when the upper portion of resin is allowed to fall into the bottom of the vessel after resin removal (from the bottom portion). During the 6” pilot column tests, it was observed that after the transfer of the lower portion of the ion exchange bed, the upper portion of the bed “fell” to the bottom over a period of a couple of minutes in a manner that mixed small portions of resin from the same general area of the bed, but did not create significant turn-over of the beds such that resin that was at the bottom of this portion of the bed ended up at the top. Thus, in general, the relative “order” of the resin was intact after it was allowed to “fall” into the bottom of the column. It is expected that this minor redistribution will not impact the overall resin utilization or the perchlorate leakage from the vessel. Advantage: The other prominent technologies applied to perchlorate removal include biological treatment via fixed-, fluidized-, and membrane-bioreactors, and surfactant modified activated carbon (referred to as “tailored carbon”). As an overall technology, ion exchange is a very robust and predictive technology. It is governed by the laws of thermodynamics and kinetics and, thus, can be well modeled. Biological processes rely on the control of a live system and require addition of substrates to the water to keep the biological system active and healthy. Ion exchange has a long history of safe use in potable water treatment and results in little health risk to the public. Biological systems present the possibility for contamination of drinking water with undesirable microorganisms. Advantage: While modified activated carbon has been shown to be effective, not enough is known about its long term performance, cost, and robustness to make an accurate comparison to ion exchange resin. Advantage: Compared to other ion exchange based systems, the primary advantage of this technology is that it is designed to minimize the cost-per-unit of perchlorate removed. While capital cost and resin cost may be higher than other approaches, life-cost and unit cost should be lower. Additionally, the small foot print, low profile, and scalability make this an attractive alternative for wellhead treatment in residential areas or where space is limited or at a premium.

ESTCP # ER0542
16
3 Performance Objectives 3.1 Performance Objectives
The key performance objective for the demonstration is to offer lower perchlorate removal costs to water utilities and U.S. Government sites. This is achieved if perchlorate levels exiting the primary treatment vessel can be maintained below the stated target of 6 ppb and the resin utilization can be maximized. Thus perchlorate leakage and overall resin utilization are the key performance criteria for this demonstration and system design. This is governed by the ability to maintain the resin bed integrity with respect to perchlorate exhaustion profile, during periods of discontinuous operation (start/stop) and resin change-outs. It should be noted that this demonstration project examined resin utilization as it pertains to single-use/throw-away operation.
Table 3-1. Performance Objectives
Type of Performance Objective
Performance Criteria Performance Metrics Actual Performance
Quantitative
1. Meets drinking water standard for perchlorate
Perchlorate content out of primary vessel < 6 ppb, CA recommended regulatory level
Meets
2. Utilizes resin capacity Calculated and measure capacity utilization >/= predicted from computer model
Meets
3. Effectively separates exhausted resin from fresh (polishing resin)
Measurement of calculated perchlorate mass versus measured perchlorate mass on resin removed from system
Adequate*
4. Yields acceptable pressure drops
Pressure drop measured over course of demonstration <4 psig/ft.
Meets
5. Ease-of-use / robust System stays operational - >98% asset utilization.
Meets
Qualitative
6. Meets drinking water standard for organics
Does not impart organics to water as measured by state lab.
Meets/Exceeds
7. Reduces treatment cost Resin utilization and separation results in calculated treatment cost < current cost
Meets

ESTCP # ER0542
17
8. Recovers from suspended solids
Pressure drop decreases after resin change outs or down-flow flushes
Meets
9. Breakthrough is measurable and predictable
Shape of the perchlorate breakthrough curve
Meets
10. System can handle start/stop operation
Difference in throughput and stability of break- through curve under continuous vs frequent start/stop operation.
Meets
*Adequate performance means resin separation and removal was achieved, however at this scale was more difficult than what was experienced in the pilot study.
4 Facilities/Site Description
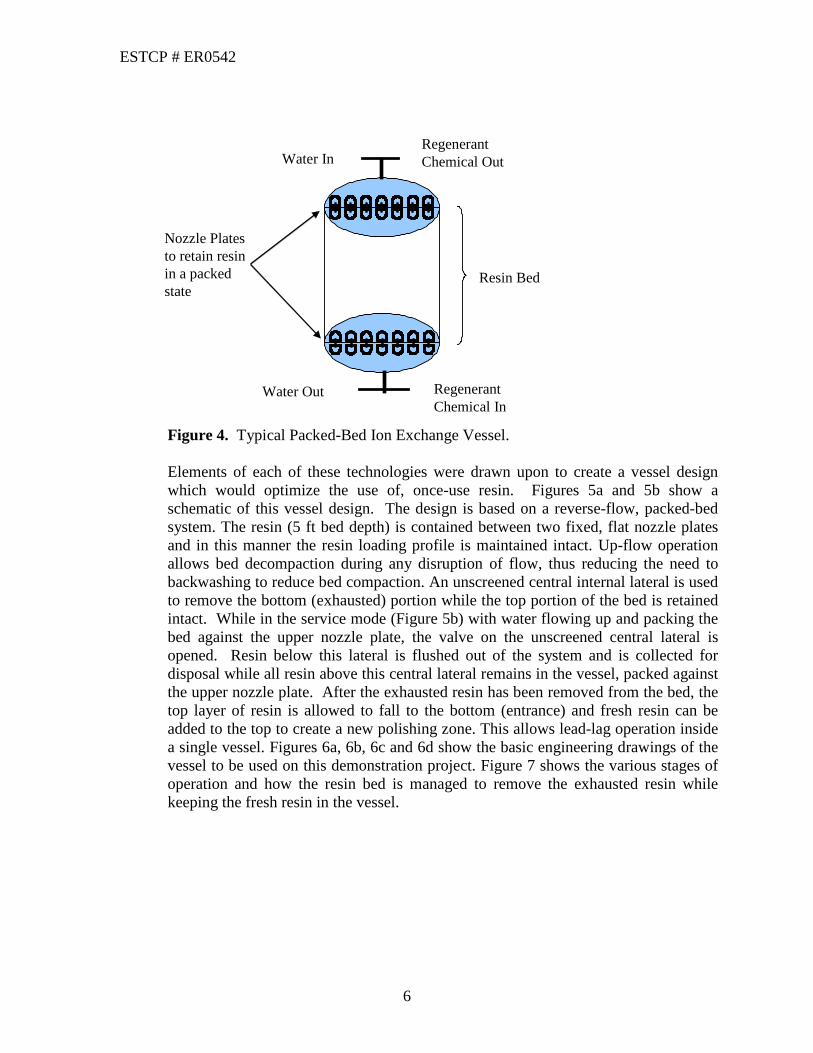
The test sites for this demonstration were selected by ESTCP. Each site has a high volume well (> 1000 gpm) on a ground water source that has shown persistent perchlorate contamination. Each city has perchlorate in the ground water at levels between 6-60 ppb. The recommended regulatory level for the state of California is 6 ppb.
The partial water analysis for each of the three demonstration site is listed in Table 3-2. Each of the sites represents drinking water wells that have been taken out of service due to perchlorate contamination or have had treatment added to allow for distribution and sale of the water. Figures 9, 10, and 11 show photographs of the West Valley Water District, City of Colton, and City of Rialto sites (respectively) where the demonstrations will take place. Table 4-1. Water Analyses for the ESTCP Demonstration sites ESTCP - Demonstration Site Water Analyses Site Rialto #4 WVWD #11 Colton #15&17 Ion Units ClO4
- ppb 60-90 6 5 SO4
2- ppm 7 73 73 Cl- ppm 4 14 14 NO3
- ppm 12 40 40 HCO3
- ppm as CaCO3
150 180 180
It should be noted that the nitrate levels for the waters at the West Valley Water District and the City of Colton sites are near the MCL. The perchlorate selective resin (AmberliteTM PWA2) being used for this demonstration also exhibits high selectivity for nitrate. Because perchlorate is the only significant ion to displace nitrate loaded on the resin and the perchlorate ion concentration is quite low, nitrate spiking, i.e. elution of nitrate at levels greater than the MCL) did not occur.

ESTCP # ER0542
18
4.1 Facility/Site Location and Operations Only the City of Colton site has existing perchlorate removal treatment on the well. This is a conventional system as described previously. Current operating and cost data was not readily available.
Figure 9. West Valley Water District (WVWD) Well # 11. Figure 10. City of Colton Dominick Reservoir and Wells #15 and #17 Treatment System.
ESTCP # ER0542
19
Figure 11. City of Rialto, Well #4 5 Test Design
5.1 Pre-Demonstration Testing and Analysis
For each of the chosen sites, a computer simulation has been run to predict the throughput for each bed. The predictive model utilized is proprietary to the Dow Chemical Company and is not publically available. These data appear in Table 5-1. Resin capacity as measured by the total mass of perchlorate ion removed for each cycle (concentration x volume) will be measured against this prediction as a key performance criteria. It should be noted that the ion exchange resin being used in this demonstration project (Amberlite™ PWA2) has a very steep perchlorate equilibrium isotherm. This means that the perchlorate loading capacity of the resin (R-ClO4), to equilibrium saturation, increases sharply as the perchlorate content of the challenge water increases. This results in the resin having little sensitivity with respect to throughput (i.e.volume of water treated) based on varying amounts of perchlorate in the influent.

ESTCP # ER0542
20
Table 5-1. Perchlorate Loading Predictions for ESTCP Demonstration Sites
ESTCP - Perchlorate Loading Estimates Loading Estimate PWA2 PWA2 PWA2 To Full Equilibrium Units Rialto #4 WVWD #11 Colton #15&17 R-ClO4, eq/l eq/l 0.092 0.013 0.013 Loading, lb/ft3 lb/ft3 0.570 0.083 0.083 Throughput, gal/ft3 gal/ft3 3,793,353 1,657,652 1,657,652
5.2 Operational Testing 5.2.1 Demonstration Set-Up and Start-Up
Site preparation – The perchlorate removal systems supplied for this demonstration are designed to be temporary, transportable and to minimize demonstration cost to ESTCP. For this reason, they are designed with minimal site preparation required and no automated instrumentation or control. Site preparation included: • Preparing a graded crushed stone base on which to place the treatment skids • Connection from the well pump and to the water distribution system • Development of the ability to discharge water to the appropriate waste outlet for
times when the wells must be run to clear suspended solids from the system The treatment systems used mechanical flow meters so no electrical connections are necessary. Equipment Mobilization and Installation - The vessels are skid mounted, each with its own frame as shown in Figure 6. Some face piping will be left off the system for shipping purposes. Each system was delivered by flat-bed truck and off-loaded by a small crane on site. Once off-loaded and sited, interconnecting piping was installed in the field and the system will be connected to the well feed pump and the drinking water distribution piping with manual shut-off valves used to isolate the system. No bypass is included because it is assumed these wells cannot be used for public consumption without treatment.

ESTCP # ER0542
21
Figure 12. Face Piping and Well Connection – West Valley Water District
System Start-up (Shakedown) – Before operation began, all necessary CADHS permits were obtained by the participating utilities. Once installed, the well pumps were run to drain until the water runs clear of any visible suspended solids. The vessels were then filled with water to leak test the piping. When the piping and valves were leak tested and tightened as necessary, one-half of the water was drained from the system and new ion exchange resin was loaded into the vessels using the custom resin loading system shown in Figure 13. When the proper amount of resin was loaded in each vessel, a 20-bed volume (of resin installed) rinse of the resin was conducted in accordance with National Sanitation Foundation (NSF) protocols for AmberliteTM PWA2, perchlorate selective ion exchange resin.
5.2.2 Period of Operation
An anticipated program timeline is presented in the Gantt chart in Figure 14. This schedule applied to all three sites, depending when each water purveyor obtained a CADHS permit to distribute this water for sale.

ESTCP # ER0542
22
Figure 13. Process Flow Diagram for ESTCP Resin Loading and Service Vessel.
ESTCPVessels
72" x 72"Open Top
Service TankTo Waste
Hose from eductorfor filling resin into
AdvancedAmberpack
vessels
Hose fromunderdrain to
sluice resin fromVessels into B/W
tank
Hose from treated water to B/Wresins or educt resin into
Advanced Amberpack vessels
Hose from AdvancedAmberpack vessels to
sluice resin into B/W tank

ESTCP # ER0542
23
Figure 14. Time Line for ESTCP Demonstration Project. 5.2.3 Treatment Rate
The systems are designed to treat 1250 gpm of ground water. Higher flow rates can be achieved but at the expense of pressure drop. A lower limit on flow rate is estimated to be 500 gpm. Below this flow rate, the risk of fluidizing the bed becomes an issue.
5.2.4 Residuals Handling
There are two expected residuals from this demonstration: water and used ion exchange resin. Water that is used for rinsing new resin, slurrying resin into or out of the vessels, or run to clear due to suspended solids must be disposed of in a manner which is approved by the state of California and the local regulations. This water was sent to nearby drains or retention basins. Spent ion exchange resin that is loaded with perchlorate was disposed of by incineration under a service contract with Siemens Industries Inc. Both are consistent with currently performed best practices and are acceptable to both state and local authorities.
5.2.5 Operating Parameters for the Technology
They key operating parameters are flow rate and volume treated. These parameters were measured via a mechanical flow meter with data manually recorded periodically. While there is no upper limit on the flow rate from a perchlorate removal stand point, the upper limit was bounded by the capability of the well pump and the pressure drop across the system. Flow rates below 500 gpm were avoided because these may result in fluidization of the ion exchange bed which could allow perchlorate to escape the primary demonstration vessel. The system is designed to operate continuously, but it can accept periodic shutdowns. Because of its simplicity, the system is basically either “on” or “off” which is defined by when the well pump is running. No “operation” per se is required. However, those involved with producing water from these wells were educated on the process, the program, and given a set of emergency instructions and contacts should the system need to be taken out of service for any reason.
Activity May Jun. Jul. Aug. Sep. Oct. Nov. Dec. CADPH Permitting Start-up Cycle 1 loading Resin Change-out Replace Resin Cycle 2 loading Resin Change-out Replace Resin Cycle 3 loading Complete samples Data Analysis Technical report Cost analysis
2H2012
Start-up
Tech Report
Samples Samples Samples Samples Data Analysis
1H2010 2H2010 1H2011 2H2011 1H2012
Loading Cycle 1
Load Cycle 2
Cost Report
ESTCP Perchlorate Demonstration Project Timeline 2008 Years 2010-2012
Load Cycle 3 Samples

ESTCP # ER0542
24
There is little that is required between resin change-outs under normal operation. Water samples were taken on at least a weekly basis and measured for perchlorate content. In this manner, the rate at which the resin is exhausting can be monitored and resin change outs scheduled appropriately. The perchlorate concentrations and the volume of water treated will be used to calculate the mass of perchlorate removed by the system and, thus, the economics of the process.
5.2.6 Experimental Design
This program is designed as a demonstration of a system design and operation at full-scale. As such, the operating parameters will not be varied significantly to determine system response to variables and operating ranges. The program will: • Define the perchlorate exhaustion profile for a packed bed of ion exchange resin • Demonstrate that a defined and fixed portion of that bed can be controllably
removed • Show that a new exhaustion profile can be reestablished by the addition of fresh
resin. In this manner, the lead-lag aspects of the traditional two vessel approach can be accomplished in one low profile vessel. This will be repeated for three partial exhaustion cycles.
The perchlorate exhaustion profile was established based on multiple water samples taken along the height of the ion exchange bed. In this case, the sampling taps are located every 6 in. up the straight side of the vessel as well as on the inlet and outlet of the primary and polishing vessels. These sampling taps extend 12 inches into the resin bed to assist in getting a representative sample. The sampling procedure is described in Appendix D. By measuring the perchlorate content of this water as a function location (height) in the bed and as a function of throughput, the shape of the exhaustion profile (mass transfer zone) was determined and its progress through the ion exchange bed could be monitored. A computer simulation program was used to estimate when the resin will become exhausted. These results appear in Table 5-1, expressed as lbs ClO4
- / ft3 of resin to complete exhaustion and converted to throughput (gallons) per ft3 of resin based on the concentration of perchlorate in the water. In the case of the West Valley Water District site, this number is 1,657,652 gal/ft3. The objective was to exhaust and remove 100 ft3 of resin per cycle. We will target getting 11 water sample sets during this time period. Thus water sampling will occur every 15,000,000 gallon or approximately every 8 days during the first cycle assuming that the system is continuously operated at the design flow rate of 1250 gpm. The first cycle is expected to last approximately 90 days.
100 ft3 resin x 1,657,652 gallons x 1 = 15,069,563 gal ft3 resin 11 sample sets sample set 15,069,563 gallons x minutes x hr x day = 8.37 days Sample set 1250 gal 60 min 24 hr sample set
ESTCP # ER0542
25
The mass of perchlorate removed by this 100 ft3 of resin is calculated from the difference in perchlorate concentration between the inlet and the sample tap corresponding to the 100 ft3 of resin employed over the loading cycle, multiplied by the total treatment volume. During resin change outs, a composite sample of the exhausted resin may be taken. This material will be stripped of perchlorate in the laboratory and the mass of perchlorate recovered will be compared to the calculated mass of perchlorate removed as a way to verify the mass balance for perchlorate. The ability for the system to handle multiple starts and stops was monitored by recording each time the system was started and stopped and relating the corresponding water sampling data to each event to determine if the perchlorate loading zone is being disturbed during these start-stop events. An elongated mass transfer zone, compared to initial results, is a sign that resin is getting redistributed in the system during start-stop operation. If the system should be run on a steady basis for the first two resin loads, a forced start-stop period will be conducted and the results observed and recorded.
The ability for the system to handle minor suspended solids load was determined by
the pressure drop across the system during each of the loading cycles. There was also be an opportunity to visually observe the lower portion of the resin bed during the resin transfer/replenishment operations.
5.2.7 Performance Monitoring Data Collection: The primary data will be perchlorate content of the water at all points in the system and the volume of water treated for these corresponding samples. These data was generated from analysis of water samples taken on a regular basis from multiple points in the system. A mechanical flow meter on the inlet to the system will display the instantaneous flow rate and measure volumetric throughput. The date, time, instantaneous flow rate, and throughput was recorded on a daily basis by Utility personnel. Figure 15 shows an example data collection sheet for this information. P1 is the inlet pressure to the system. P2 refers to the intermediate pressure between the demonstration and safety polishing vessels. P3 corresponds to the outlet of the safety polishing vessel. At approximately 11 evenly spaced intervals throughout each cycle, water samples were collected from all sample ports and sent to the laboratory for perchlorate analysis. Some samples were tested for other common and interfering ions such as nitrate and sulfate. Figures 5a and 5b (page 7 above) shows the schematic drawing of the treatment system and the location of the sample points. The timing of these samples will be determined by the computer model predictions for run length (throughput) and amended, as needed, by field data and experience as the program proceeds. Water samples were obtained by plant operators into 125 ml polyethylene sample bottles and sealed. As perchlorate and the other common inorganic salts are very stable, no special preservatives or handling procedures were required for these samples. In addition to the samples taken for the demonstration program, routine samples required by the state of California to distribute this drinking water were taken by the water utility and submitted to a state

ESTCP # ER0542
26
approved laboratory in accordance with USEPA, CADHS, and any other local regulatory requirements. Figure 15. Example Daily Log Sheet for ESTCP Demonstration Program.
Experimental Controls: The primary baseline data is the inlet water analysis and the outlet water quality at the initial time (t=0). Inlet water samples will also be taken with each sample set. This is not a side-by-side comparison study to other technologies or other configurations of ion exchange resin. Thus, comparisons for performance and cost must come from independent sites and independent tests. One of the test sites (City of Colton) has an operating perchlorate removal system using ion exchange resin with the traditional carbon vessel configuration. This should provide a good opportunity to compare the demonstration unit with a conventional unit for size, performance, and cost. Available data will be gathered from the utility and used as baseline data for competing technologies.
Analytical/Testing Methods: Analytical/Testing Methods are described in detail in
Appendix A. Ion Exchange Resins: The ion exchange resins, used in this demonstration project, will come from commercial stock. As such it will be manufactured and tested using standard Rohm and Haas Company Quality Control and Quality Assurance methods and practices. The lot number for each batch of ion exchange resin employed will be recorded in the site log book and be recorded in the electronic file belonging to the Principal Investigator.
ESTCP Demonstration Program System Log Sheet Location ______________________________________
(Record Date and Time for ALL starts and stops of this system)System Status and Observations OperatorP1 P2 P3Throughput
(gallons)Flow rate
(gpm)
Date Time

ESTCP # ER0542
27
5.3 Demobilization As per the ESTCP contract, the systems used in this demonstration program will be left in place and turned over to the water utilities to use as they see fit.
5.4 Quality Assurance / Quality Control
The Quality Assurance Project Plan is described, in detail, in Appendix B. 5.5 Health and Safety Assurance Plan (HASP)
Appendix C describes the Health and Safety Plan. 5.6 Management and Staffing
Table 5-4 shows the roles and responsibilities of the primary participants in this demonstration project.
Table 5-2. Management and Staffing for ESTCP Demonstration Project. Name Organization Role Responsibility Jim Summerfield Dow Chemical Principal
Investigator Coordinate all efforts to conduct demonstration. Conduct performance and cost analyses. Write reports and documentation.
Dr. Scott Boyce Dow Chemical ESTCP Liaison Ensure all obligations to ESTCP are being met. Primary communications with ESTCP.
Jay Miers Dow Chemical Principal Investigator
Conduct performance and cost analyses. Assist in documentation.
Chris Savino Layne Christensen Co.
Engineering Manager
Lead effort to engineer and fabricate physical equipment.
Cathy Swanson Siemens Industries
Resin Replacement and disposal Services
Manage services to install and start-up equipment, change-out resins, and resin disposal.
Teresa Fonseca Clinical Labs of San Bernardino
Analytical Services Laboratory analysis of perchlorate in water samples from each site.
Tom Crowley West Valley Water District
Host Utility Manager
Coordinate site issues and maintain responsibility for distributed water.
Mike Cory City of Colton Host Utility Manager
Coordinate site issues and maintain responsibility for distributed water.
Peter Fox City of Rialto Host Utility Manager
Coordinate site issues and maintain responsibility for distributed water.

ESTCP # ER0542
28
5.7 Demonstration Schedule Figure 14 (on page 23 above) depicts a Gantt chart of the expected schedule for this demonstration.
6 Performance Assessment 6.1 Performance Criteria
Table 6-1 describes, in detail, the performance used to evaluate the performance of the perchlorate treatment technology in this demonstration project. “Primary” criteria directly address the project’s performance objectives. Table 6-1: Performance Criteria for ESTCP Demonstration Project.
Performance Criteria
Description Primary or Secondary
Contaminant reduction
The system must achieve perchlorate effluent below the CA proposed limit of 6 ppb from primary vessel. Target is <1.0 ppb
Primary
Resin Separation
System must be able to effectively separate exhausted resin from unexhausted resin.
Primary
Resin Utilization
Primary vessel should maximize the use of the ion exchange resin. The target is >95% utilization of exchange capacity.
Primary
Cost The total CAPEX and OPEX must be below current market prices to be successful/valuable.
Primary
Breakthrough Predictability
Demonstrate the ability to monitor the location and rate of change of the perchlorate breakthrough front (mass transfer zone).
Secondary
Ease-of-Use The partial replacement of ion exchange resin must be fast, effective, simple and reliable.
Secondary
Robust process The system must be able to handle frequent start-stop events without resulting in premature breakthrough.
Primary
Solids Handling It will be beneficial if the system can tolerate some suspended solids loading as this makes the process robust and reduces pretreatment requirements.
Secondary
Overall ease and robustness
The overall ease of ownership should be high. This is based on installation, start-up, operation, and change-outs
Secondary
ESTCP # ER0542
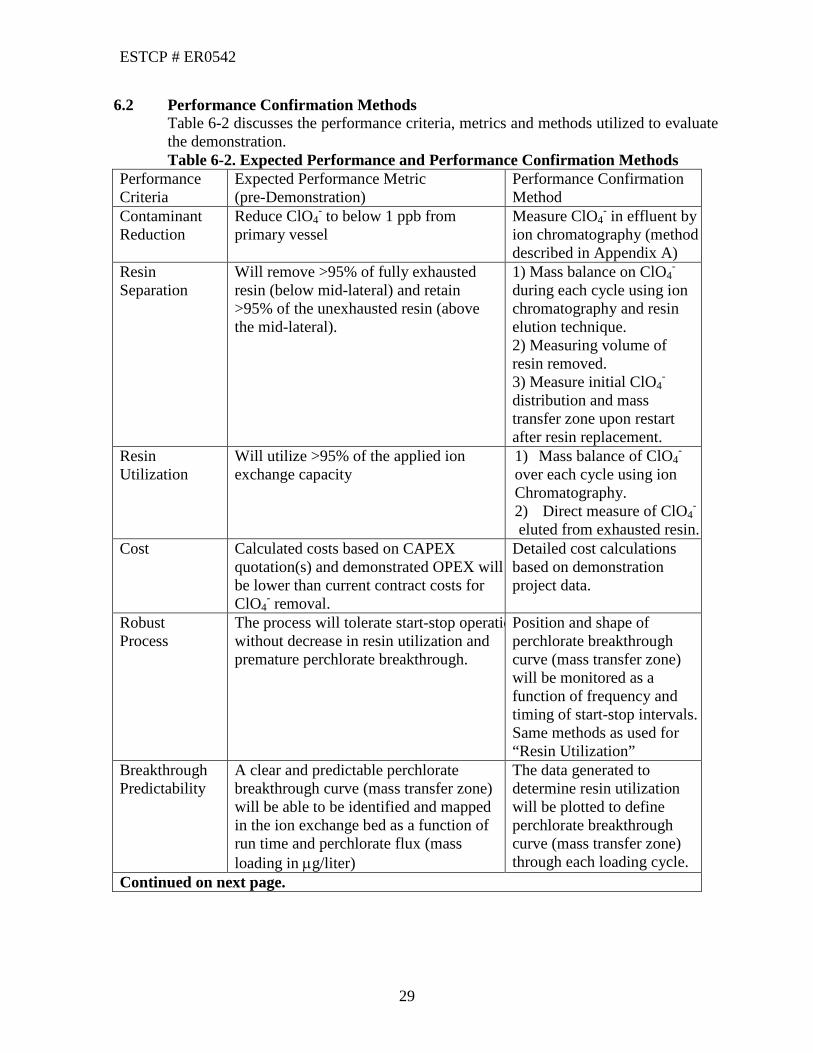
29
6.2 Performance Confirmation Methods Table 6-2 discusses the performance criteria, metrics and methods utilized to evaluate the demonstration. Table 6-2. Expected Performance and Performance Confirmation Methods
Performance Criteria
Expected Performance Metric (pre-Demonstration)
Performance Confirmation Method
Contaminant Reduction
Reduce ClO4- to below 1 ppb from
primary vessel Measure ClO4
- in effluent by ion chromatography (method described in Appendix A)
Resin Separation
Will remove >95% of fully exhausted resin (below mid-lateral) and retain >95% of the unexhausted resin (above the mid-lateral).
1) Mass balance on ClO4-
during each cycle using ion chromatography and resin elution technique. 2) Measuring volume of resin removed. 3) Measure initial ClO4
- distribution and mass transfer zone upon restart after resin replacement.
Resin Utilization
Will utilize >95% of the applied ion exchange capacity
1) Mass balance of ClO4-
over each cycle using ion Chromatography. 2) Direct measure of ClO4
- eluted from exhausted resin.
Cost Calculated costs based on CAPEX quotation(s) and demonstrated OPEX will be lower than current contract costs for ClO4
- removal.
Detailed cost calculations based on demonstration project data.
Robust Process
The process will tolerate start-stop operatio without decrease in resin utilization and premature perchlorate breakthrough.
Position and shape of perchlorate breakthrough curve (mass transfer zone) will be monitored as a function of frequency and timing of start-stop intervals. Same methods as used for “Resin Utilization”
Breakthrough Predictability
A clear and predictable perchlorate breakthrough curve (mass transfer zone) will be able to be identified and mapped in the ion exchange bed as a function of run time and perchlorate flux (mass loading in µg/liter)
The data generated to determine resin utilization will be plotted to define perchlorate breakthrough curve (mass transfer zone) through each loading cycle.
Continued on next page.

ESTCP # ER0542
30
Table 6-2 continued. Performance Criteria
Expected Performance Metric (pre-Demonstration)
Performance Confirmation Method
Ease-of-use The system will be easy to load, easy to operate, and easy to change resins with no special operator attention or expertise.
An operator log will be kept to record any excursions in operations and detailed notes and photos will be taken during resin change outs to characterize and record the ease-of-operation/use.
Solids Handling Capability
The system will be able to handle a small amount of suspended solids without significant disruption to service.
Suspended solids will be measured on the incoming water during each cycle and the pressure drop across the system will be observed, recorded, and monitored during these loading cycles.
6.3 Data Analysis, Interpretation and Evaluation
The critical data are the concentration of perchlorate in equilibrium with each fraction of ion exchange resin along the height of the bed, including the effluent. These data come directly from the measurement of perchlorate in the water samples taken at intervals throughout each cycle at specified volumetric throughputs. The perchlorate concentration is plotted as a function of bed height and volume throughput for each set of samples. In this manner, a “graphical picture” of the shape and progression of the exhaustion wave front (mass transfer zone) can be attained. From this picture, the resin utilization is determined and also ascertains the impact of any process upsets such as frequent start-stop operation. The redistribution of perchlorate containing resin after each resin transfer can also be seen in this manner. This redistribution and the total mass of perchlorate eluted from the resin removed from the system will enable a mass balance on perchlorate to be obtained and, hence, the efficiency of the vessel design toward resin management.
6.4 West Valley Water District – Performance Data West Valley Water District Well #11 system demonstration occurred from January
11, 2010 thru May 10, 2011. No significant operational issues prevented timely completion of this demonstration and with great support from West Valley Water employees during the demonstration period, all operations were monitored very closely. Resin compaction did result in limited ability to remove the resin required between cycles and disrupted the natural chromatographic distribution of perchlorate loading on the media. There is no doubt that this affected the unit from operating optimally, however the data would suggest that the unit did perform adequately. The data from the 3 performance cycles at West Valley Water District are shown below in Figures 16, 17 and 18. These data show the perchlorate concentration in the lead bed at various points along the straight side of the vessel at 6” increments versus the

ESTCP # ER0542
31
volumetric throughput in millions of gallons (MG) and the date the sample were taken.
0.0
2.0
4.0
6.0
8.0
10.0
12.0
14.0
inlet 12 18 24 30 36 42 48 54 outlet
Perc
hlor
ate
(ppb
)
Sample Point (inches from inlet-bottom)
West Valley Water District - ESTCP Run #1 Starting 1/11/2010
2.68 MG (1/13/2010)
20.7 MG (1/25/2010)
42.1 MG (2/8/2010)
58.8 MG (2/18/10)
81.9 MG (3/8/10)
102.5 MG (3/22/10)
143.2 MG (4/19/10)
163.9 MG (5/3/10)
186.3 MG (5/17/10)
211.9 MG (6/2/10)
232.7 MG (6/15/10)
242.0 MG (6/28/10)Location of mid-vessel lateral
Figure 16. West Valley Water District, Cycle #1
0.0
5.0
10.0
15.0
20.0
25.0
Inlet 12 18 24 30 36 42 48 54 Oulet
Perc
hlor
ate
(ppb
)
Sample Point (inches from inlet-bottom)
West Valley Water District - ESTCP Cycle #2 Starting 7/20/2010
270.0 MG (7/20/10)
292.0 MG (8/06/10)
311.2 MG (8/16/10)
334.4 MG (8/31/10)
365.7 MG (9/21/10)
394.3 MG (10/11/10)
413 MG (10/26/10)
431.3 MG (11/8/10)
469.4 MG (12/7/10)
Location of mid-vessel lateral
Figure 17. West Valley Water District, Cycle #2

ESTCP # ER0542
32
0.0
5.0
10.0
15.0
20.0
25.0
Inlet 12 18 24 30 36 42 48 54 Oulet
Perc
hlor
ate
(ppb
)
Sample Point (inches from inlet-bottom)
West Valley Water District - ESTCP Cycle #3 Starting 12/13/2010
477.1 MG (12/13/10)
493.5 MG (1/6/2011)
549 MG (3/2/11)
599.8 MG (4/13/11)
632.6 MG (5/10/11)
24" - Location of mid-vessel lateral
Figure 18. West Valley Water District, Cycle #3 6.5 City of Colton – Performance Data The City of Colton demonstration at Wells #15 and #17 encountered flow balancing
issues after the first cycle of operation. The demonstration unit is tied into the feed header of an existing perchlorate removal system and due to normal hydraulic balancing, the demonstration unit regularly was starved of water. Other issues during the demonstration period including broken nozzles, plugged nozzles and compacted resin and well pump issues, resulted in sporadic operation and data acquisition. The data below covers 2 cycles of operation from July 26, 2010 to March 19, 2012. Due to limited achievable flow of water to the demonstration unit, a 3rd cycle of operation has been delayed indefinitely. The performance data are shown in Figures 19 and 20.

ESTCP # ER0542
33
0.0
1.0
2.0
3.0
4.0
5.0
6.0
7.0
8.0
9.0
A-Inlet 12 18 24 30 36 42 48 54 B-Oulet
Perc
hlor
ate
(ppb
)
Sample Point (inches from inlet-bottom)
City of Colton CA- ESTCP Run #1 Starting 7/26/2010
0.00 MG (7/26/2010)18.6 MG (8/09/2010)36.4 MG (8/23/2010)54.8 MG (9/7/10)70.8 MG (9/20/10)87.8 MG (10/4/2010)104.6 MG (10/18/10)121 MG (11/1/10)137.6 MG (11/15/10)152.2 MG (11/29/10)167.7 MG (12/14/10)182.4 MG (12/28/10)196.8 MG (1/10/11)
Location of mid-vessel lateral
Figure 19. City of Colton, Cycle #1
0.0
2.0
4.0
6.0
8.0
10.0
12.0
A-Inlet 12 18 24 30 36 42 48 54 B-Oulet
Perc
hlor
ate
(ppb
)
Sample Point (inches from inlet-bottom)
Colton - ESTCP Cycle #2 Starting January 2011
Start 198 MG (1/17/11)225 MG (2/22/11)242 MG (3/21/11)255 MG (4/5/11)267 MG (4/19/11)277.5 MG (5/3/11)289 MG (5/16/11)297.6 MG (9/20/11)306.4 MG (10/4/11)311.7 (12/7/11)321.5 MG (12/19/11)326.7 MG (12/27/11)332.3 MG (1/3/12)352.3 MG (2/6/12)369.7 MG (3/19/12)
24" - Location of mid-vessel lateral
One well source with lower
Figure 20. City of Colton, Cycle #2

ESTCP # ER0542
34
6.6 City of Rialto – Performance Data City of Rialto Well #4 demonstration site encountered multiple operational setbacks
during the proposed operational period. There was in a water rights dispute with neighboring municipalities, plus the demonstration unit was not permitted for producing potable water. All water produced during operation was discharged to a low-lying retention pond adjacent to the well site and was not conducive to significant in-service operations. Due to these circumstances, the operation of the unit and data collected was sporadic at best. Below are the data for this site, shown in Figure 21.
0.0
10.0
20.0
30.0
40.0
50.0
60.0
70.0
80.0
90.0
100.0
Inlet 12 18 24 30 36 42 48 54 Oulet
Perc
hlor
ate
(ppb
)
Sample Point (inches from inlet-bottom)
Rialto- ESTCP Run #1 Starting 11/03/20100.0.MG (11/3/10)21.3 MG (11/16/10)30.8 MG (11/23/10)62.9 MG (12/13/10)90.8 MG (4/4/2011)95.8 MG (4/18/11)138.4 MG (5/10/11)150.2 MGD (10/26/11)163.3 MGD (11/7/11)182.4 MG (11/21/11)198.6 MG (12/5/11)213.4 MG (12/19/11)228.6 MG (1/3/12)234.5 MG (1/9/12)245.7 MG (1/16/12)262.2 MG (2/7/12)275.3 MG (2/20/12)288.0 MG (3/5/12)300.9 MG (3/19/12)321.5 MG (4/9/12)
Location of mid-vessel lateral
Figure 21. City of Rialto, Cycle #1

ESTCP # ER0542
35
7 Cost Assessment 7.1 Cost Reporting
Cost reporting will be as per the Table 7-1. Table 7-1. Cost Tracking Cost Category Sub-Category Details Unit Unit price Usage Total cost
Capital Costs
Capital equipment $435,000 Site works $370,000
Installation Man-power Man-hours Supplies Rentals
Start-up Costs
Man-power Man power Man-hours $250 80 $20,000
Other services
Disinfection Biological testing $2,000
Operating cost
Water Sampling See below Man-hours Supplies Bottle $1,000
Other services Repairs/ upgrades $329,000
Resin Costs Initial fill resin ft3 $325 978 $317,850 1st Change out resin ft3 $325 200 $65,000 2nd Change out resin ft3 $325 100 $32,500
Resin Changes Man-power Man-power Man-hours $250 48 $12,000 Other services Disposal Cost resin ft3 $100 820 $82,000
Analytical Water Samples each No. Samples $32,000 Resin Samples No. Samples $0 Reg. Samples No. Samples $0
7.2 Cost Analysis
Cost Comparison: In the concentration range of interest (roughly 4-200 ppb ClO4-),
the only commercially applied technology is ion exchange. All these systems use the standard carbon vessel design which we believe is inefficient in resin utilization. Cost Basis: The primary cost comparison will be based on the combination of capital cost, resin utilization, resin exchange and disposal costs. Where possible, we will extract these costs from commercial systems and contracts. Many perchlorate removal systems are operated on a service basis where the water utility pays on a volume-treated basis with some baseline costs. We will compare actual and projected costs, based on the demonstration, to existing contract costs. Cost Drivers: As the perchlorate selective resin to be used in this Demonstration project (AmberliteTM PWA2) is relatively insensitive to perchlorate concentration with respect to resin utilization, the primary cost drivers are expected to be the impacts of abnormal operations on resin utilization. These will include frequent on-

ESTCP # ER0542
36
off cycling of the system and suspended solids in the feed water. The latter should be considered a separate contaminant issue. Pressure drop will also have an impact on cost. Deeper beds will result in more pressure drop and, thus, more energy usage to pump the water. However, deeper beds will also decrease the frequency of resin replacements, saving on man-power and service fees. Life Cycle Cost: As this is a full scale demonstration over a significant period of time, determining life cycle costs will be a straight forward exercise. The capital cost will be amortized over a 10 year period and the operating costs will be directly proportional to the costs from the demonstration project.
8 Implementation Issues
8.1 Environmental Checklist
California Department of Health Services (CADHS) Permit: As the water produced from this demonstration project will be placed into the municipal distribution system, each participating utility must obtain a permit from the CADHS. This will include issues outside the scope of this program, such as other contaminants, disinfection practices, and analytical responsibilities. Rohm and Haas Company will not be distributing this water and therefore cannot be the holder of these permits. As mandated by the National Sanitation Foundation (NSF) certification for AmberliteTM PWA2, the resin used in this demonstration must be rinsed for 20 Bed Volumes (BV = volume of resin installed in the vessel) before this water can be distributed for human consumption. This initial rinse of water will need to be discharged. It will be the responsibility of the participating Utilities to obtain the necessary permits.
8.2 Other Regulatory Issues
As Principal Investigator, I have met once with CADHS in person and once by teleconference to discuss this design, system, and program. We will need to have a joint meeting with each participating Utility and the local CADHS office to finalize permitting requirements and plans.
8.3 End-User Issues
As Principal Investigator, I have met with the managers of each of the participating utilities. In general they are cooperative and excited about participating in this program and specific demonstration project. The biggest interest is in the potential to attain the anticipated high rate of perchlorate removal in a small foot-print and low profile unit. The biggest concern among each of the utilities is the CADHS permitting issues. The long term decisions to expand use of this vessel design and concept will be based on a successful demonstration that a stable, controllable and predictable process is achievable in a single vessel as determined by CADHS. Procurement Issues: While 8 ft. diameter pressure vessels are common industrial items, they are rarely kept in inventory. While all of the elements of the design of our
ESTCP # ER0542
37
vessels have been practiced before, they have not been combined into one vessel design as we are using them. Thus we are considering this program to use a modification of commercially-available, off-the-shelf, items. As with all lined, pressure vessels of size, these items are made-to-order items and thus require up to 16 week lead time. Once demonstrated, this vessel design can be fabricated by existing vessel manufacturers and a supply infrastructure for end users already exists.
Custom Service Vessel: A custom service vessel is being designed for use in the resin transfer operations. This will make the resin transfers easy and enable them to be completed without liquid discharges. This tank will be built and owned by the service company conducting the resin change outs (Layne Christensen) but the design can be offered to the participating Utilities if they should wish to buy or build such a service vessel for their own use after this program. This service vessel will be skid mounted and mobile.
Transfer of Assets – The assets (tanks and resin) from this demonstration project will be transferred to the Utilities at the end of this program. These units have been designed as fully manual units to keep demonstration costs to ESTCP down and the units may not be in a readily usable form when transferred. These units should be retrofitted with some remotely-actuated valves and minimal instrumentation to allow remote monitoring and operation of the systems. Additionally, in order to be able to obtain a CADHS permit, a polishing vessel is being provided as a safety/back-up system in the event of unexpected early breakthrough of perchlorate. This vessel will have little utility if this program proves to be successful. It is slightly more costly, but it may be more prudent to employ two of the modified vessels. They can be separated into two fully functional systems once the demonstration program has been deemed successful.
9 References a. Committee to Assess the Health Implications of Perchlorate Ingestion, National
Research Council, “Health Implications of Perchlorate Ingestion”, ISBN 0309095689.
b. Carlin, Hoffman, Mallmann, and Peschman, 2004, “Development of a Highly Selective Ion Exchange Resin for Removal of Perchlorate From Groundwater”, paper presented at the 2004 National Ground Water Association symposium on Perchlorate.

ESTCP # ER0542
38
10 Points of Contact Table 10-1. Points of Contact for ESTCP Demonstration Project. Point of Contact Organization
Address Phone Email
Role in Project
Jim Summerfield Dow Water and Process Solutions 5065 State Street. #255 Saginaw, MI 48603
989-781-0306 [email protected]
Principal Investigator
Jay A. Miers Dow Water and Process Solutions 100 Independence Mall Wes Philadelphia, PA 19106
989-638-2241 [email protected]
Principal Investigator
Scott D. Boyce Dow Chemical 727 Norristown Rd. Spring House, PA 19477
215-641-7518 [email protected]
ESTCP Liaison
Chris Savino Layne Christensen 97 Chimney Pond Rd Bridgewater, NJ 08807
732-469-8720 csavino@layne christensen.com
Mike Cory City of Colton 160 S. 10th St. Colton, CA 92324
909-370-6101 [email protected]
Tom Crowley West Valley Water District 855 W. Baseline Rd. Rialto, CA 92376
909-875-1804 [email protected]
Peter Fox City of Rialto 150 S. Palm Rd. Rialto, CA 92376
909-421-7244 [email protected]

ESTCP # ER0542
39
11 Conclusions
• West Valley Water District achieved the required <6 ppb perchlorate in the treated water over the entire 3 cycles of operation
• City of Colton achieved the required <6 ppb perchlorate in the treated water over 2 cycles of operation
• City of Rialto achieved the required <6 ppb perchlorate in the treated water during 1 cycle of operation
• Cycle throughput ranged from 200-320 MM gallon (~6 months) and was not directly correlated to influent perchlorate concentration
• Resin compaction during the cycle time compromised resin removal from the subsurface lateral and disturbed the natural chromatographic profile of the resin bed
• Overall performances of each the unit were compromised by resin compaction and effective removal, but the economic benefit was not lost.
• Capital costs and site preparation are quite low and very affordable at approximately $275,000 per unit. Additional costs are likely based on individual site requirements
• Conservative annual operating cost are estimated as follows: o 5 month cycle = 2.4 cycles per year o 100 CF of resin per cycle
100 CF x 2.4 cycles x $190/CF = $45,600 o Resin removal and disposal = $13,000/cycle
$13,000 x 2.4 cycles = $31,200 o Total annual operating cost = $76,800 ($45,600+$31,200) o Estimate every 3 years replacing all media (lead and lag vessels) =
326 CF x $190/CF = $61,940 326 CF x $100/CF = $32,600 (disposal cost) Resin removal and installation = $15,000 Total = $109,540
• Critical learnings: o All 3 sites produced water below 6 ppb perchlorate during the entire
demonstration time o Minute amounts of suspended solids in the feed water will accumulate
resulting in a significant mass during 6 months of operation o Resin compaction observed at all 3 demonstration sites o Compaction prevented efficient removal of media from the lead vessel as
demonstrated in the pilot, but did not result overall failure of operations o Robust stainless steel nozzles are much preferred over plastic nozzles

ESTCP # ER0542
40
Appendix A: Analytical Methods for Water Sample Analysis
TECHNICAL DOCUMENT NO. TD2003-370
Separation Science Section
ecc: J. H. Barrett B. Hoffman C. Bevan E. Lundquist C. Hickey J. T. Mc Nulty
2003/09/29
SUBJECT: DETECTION OF PPB LEVELS OF PERCHLORATE IN ION
EXCHANGE RESIN EXTRACTS BY ION CHROMATOGRAPY/MASS SPECTROMETRY
AUTHOR: Alexander, James N.
WORK DONE BY: Breaux, Alfred J., Alexander, James N.
REQUESTED BY: Carlin, William H.
SAP NO.: 8000473
REFERENCES: 1. Ion Exchange Resin Screening for Selective Perchlorate Removal from Ground Water, A. M. Rothman and J. N. Alexander, TD2003-044, 01/27/03.
2. Dionex Application Note 134, “Determination of Low Concentrations of Perchlorate in Drinking and Ground Waters Using Ion Chromatography” and Product Note, “IonPac AS16 Anion-Exchange Column”.
3. Improved Method for the Determination of Trace Perchlorate in Ground and Drinking Waters by Ion Chromatography, P. E. Jackson, et al., J. of Chromatography A, 888 (2000) 151-158.

ESTCP # ER0542
41
4. Analysis of Perchlorate in Groundwater by Electrospray Ionization Mass Spectrometry/Mass Spectrometry, C. J. Koester, et al., Environ. Sci. Technol., 34 (2000) 1862-1864.
5. Determination of Perchlorate at Trace Levels in Drinking Water by Ion-Pair Extraction with Electrospray Ionization Mass Spectrometry, M. L. Magnunson, et al., Anal. Chem., 72 (2000) 25-29.
OBJECTIVE: Develop an ion chromatography/mass spectrometry (IC/MS) method to analyze ion exchange resin effluents for ppb levels of perchlorate.
SUMMARY: Pollution, primarily from defense plants, has resulted in wells tainted by perchlorate in 22 states from Massachusetts to California. Ion Exchange Research (IER) is actively pursuing the development of a perchlorate selective ion exchange resin, which can significantly lower the cost of treating contaminated municipal wells, and other wells near sites of contamination. IER has identified final ion exchange resin candidates and competitive resins for comparison testing. This testing required the measurement of ppb levels of perchlorate in column effluents. We developed an ion chromatography/mass spectrometry method to study these low ppb levels.
KEYWORDS: perchlorate; ground water; drinking water; Ion Exchange; IER, IC/MS

ESTCP # ER0542
42
BACKGROUND: Pollution, primarily from defense plants, has resulted in wells tainted by perchlorate in 22 states from Massachusetts to California. The concern is that perchlorate is selectively concentrated in the thyroid and it displaces iodide, which is required for proper thyroid function and related hormone balance in the body. Safe levels have yet to be defined by the EPA, but states have set levels as low as 1 ppb. Ion Exchange Research is actively pursuing the development of a perchlorate selective ion exchange resin, which can significantly lower the cost of treating contaminated municipal wells, and other wells near sites of contamination. IER needed to determine the selectivity of various resin candidates and competitive resins for perchlorate in the presence of chloride, nitrate, and sulfate, common ground water anions. The selectivity determination required the ability to measure ppb levels of perchlorate in solution. We developed an ion chromatography/mass spectrometry method to study these low ppb levels. EXPERIMENTAL:
An anion exchange chromatographic isocratic method with electrospray ionization and mass spectrometry detection (IC/ESI-MS) was used in the perchlorate analysis. Sample Preparation The anion exchange extracts were analyzed as-is or diluted with Milli-Q water and transferred to 1.5-mL autosampler vials. Samples were diluted to reach a perchlorate concentration within the calibration curve. Two injections were made from each vial. Perchlorate Calibration Standard Preparation Weigh 0.13 g of Sodium Perchlorate (A. C. S. reagent, 99%) [81.2% perchlorate] into a 1 oz vial, then add Milli-Q water to a total of 10.6 g (9,958 ppm, Stock 1). Shake and/or sonicate for 10 minutes to dissolve solids. Weigh 0.1 g of Stock 1 into a 1 oz vial, and then add Milli-Q water to a total weight of 10 g (100 ppm). Shake for 1 minute. Weigh 0.2 g of 100 ppm standard into a 1 oz vial, and then add Milli-Q water to a total weight of 20 g (1 ppm). Weigh 6 g of 1 ppm standard into a 1 oz vial, and then add Milli-Q water to a total weight of 8 g (750 ppb). Weigh 2 g of 1 ppm standard into a 1 oz vial, and then add Milli-Q water to a total weight of 4 g (500 ppb). Weigh 1 g of 1 ppm standard into a 1 oz vial, and then add Milli-Q water to a total weight of 5 g (200 ppb). Weigh 0.75 g of 1 ppm standard into a 1 oz vial, and then add Milli-Q water to a total weight of 5 g (150 ppb). Weigh 1 g of 1 ppm standard into a 1 oz vial, and then add Milli-Q water to a total weight of 10 g (100

ESTCP # ER0542
43
ppb). Weigh 5 g of 100 ppb standard into a 1 oz vial, and then add Milli-Q water to a total weight of 10 g (50 ppb). Weigh 2 g of 50 ppb standard into a 1 oz vial, and then add Milli-Q water to a total weight of 10 g (10 ppb). Weigh 5 g of 10 ppb standard into a 1 oz vial, and then add Milli-Q water to a total weight of 10 g (5 ppb). Weigh 2 g of 5 ppb standard into a 1 oz vial, and then add Milli-Q water to a total weight of 10 g (1 ppb). Weigh 5 g of 1 ppb standard into a 1 oz vial, and then add Milli-Q water to a total weight of 10 g (0.5 ppb). Weigh 4 g of 100 ppb standard into a 1 oz vial, and then add Milli-Q water to a total weight of 10 g (0.2 ppb).
Instrument: 1. Dionex DX-500 IC system equipped with GP40 Gradient Pump, AS3500 autosampler, and ED40 Electrochemical detector
2. Waters ZQ mass spectrometer with nebulized assist electrospray ionization (ESI)
Column: Dionex IonPac AS11, 2 x 250 mm Guard column: Dionex IonPac AG11, 2 x 50 mm Eluent: Time 200 mM NaOH Milli-Q water
Init. 50 50 9 50 50
Flow rate: 0.25 mL/min Back pressure: 825 psi Injection volume: 45 µL (partial loop injection mode from a 100 µL loop) Column temp.: 30°C
Detection: Suppressed conductivity and mass spectrometry Suppressor: ASRS-Ultra (Dionex) 2 mm @ 100 mV Regenerant: Milli-Q water, 3 mL/min MS conditions ESI tip voltage: -2.40 kV Source temp.: 120°C Cone: 40 V Desolvation temp.: 300°C Extractor: 1 V Desolvation gas: N2 @ 400 L/h RF lens: 2.5 V Cone gas: N2 @ 100 L/h Collection mode: centroid Experiment 1 (selected ion monitoring, [SIM]) Mass: m/z 98.8 Dwell time: 1.0 s Inner scan delay: 0.1 s Run time: 9 min.

ESTCP # ER0542
44
RESULTS AND DISCUSSION: A previous report (Ref 1.) discusses the studies for resin screening which were done with water containing perchlorate in the presence of either sulfate or chloride, two ions which would be problematic in the field. The resin bound perchlorate was eluted with a high concentration of sodium nitrate. The detection limit for perchlorate was 0.5 ppm and was accomplished with suppressed conductivity detection. For the next series of studies IER was interested in measuring low ppb levels of perchlorate in water from final candidate resins. A review of the literature showed that Dionex (Ref 2 and 3) was able to achieve 2 ppb limits of detection using suppressed conductivity detection by making large volume injections (1 mL) followed by an isocratic separation. Another approach to low level detection is to use a mass spectrometer as a detector. Two groups have tried this using electrospray ionization. One group (Ref 4.) used MS/MS to selectively identify perchlorate. They did not use any chromatography to separate perchlorate from other ions and found that ion suppression from other anions like bicarbonate, chloride, and sulfate limited their detection of perchlorate to 0.5 ppb. To measure levels this low required the use of the method of standard addition for accurate quantification. Another group (Ref 5.) also used flow injection analysis to measure perchlorate down to the 0.2 ppb range. Their approach utilized an extraction method that required a 500 mL water sample. A cationic surfactant is added to the water sample, which forms an ion-pair with perchlorate, and then the ion-pair is extracted into dichloromethane. Both approaches are at the detection limits we desired but are complicated in analysis and sample preparation. Based on our experience with ion chromatography and mass spectrometry it seemed likely that IC/ESI-MS could be used to reach the detection limit of 0.2 ppb. In addition, this could be accomplished without any complicated sample preparation other than dilution with water. The key component that allows us to measure ppm and ppb levels of anions with conductivity detection is the suppression device. This device is located after the separation column (Figure 1) and coverts the mobile

ESTCP # ER0542
45
phase that contains mM levels of NaOH into water. With a low conductance background conductivity detection can be used. The mass spectrometer also requires a low conductance background for measuring low levels of ions in the gas phase. Figure 2 below shows a simple schematic of the suppressor opperation. In addition to using the suppressor, two other modifications were made to the
method. One, was injecting a larger sample volume than typical. For this analysis we injected 45 uL without seeing any band broadening effects. The second step that we took was to optimize the electrospray source parameters for obtaining high sensitivity for perchlorate before the analysis. Thus, the method development needed to make this analysis successful was minimal. Figure 3 shows a separation of a 0.5 ppm perchlorate standard with conductivity and MS detection. This shows that with the conductivity detector we are at the limit of detection at this level, but with the mass spectrometer in the selected ion monitoring (SIM) mode (m/z 98.8) there is plenty of signal. A mass spectrum for perchlorate is shown in Figure 4. A series of perchlorate standards ranging from 0.2 to 1 ppb is shown in Figure 5 and Figure 6 shows the corresponding calibration curve. This data demonstrates that with mass spectrometry detection that there is
ESTCP # ER0542
46
linearity over this calibration range. A broader calibration range is shown in Figure 7. Figure 8 shows a wash extract from a resin candidate. The chromatograms show excellent peak shape for perchlorate and the ability to measure low levels in the presence of sulfate. Table I lists the results of a recent low-level perchlorate analysis. CONCLUSIONS: Using ion chromatography/mass spectrometry we were able to provide perchlorate uptake information for a series of resins that enabled IER to identify a candidate anion resin for water remediation. We looked at effluent from resins while passing a water solution containing perchlorate in the presence of sulfate, nitrate, or chloride. We also looked at regeneration effluents to determine the amount of perchlorate that was released from the resin when regenerated with a nitrate solution. From this testing, one resin was identified as a lead candidate for a disposable perchlorate remediation resin. The LOD for perchlorate, using this method, and based on a perchlorate standard in water, is 0.2 ppb.
James N. Alexander IV JNA:jwt Attachments

ESTCP # ER0542
47
0.50 1.00 1.50 2.00 2.50 3.00 3.50 4.00 4.50 5.00 5.50 6.00 6.50 7.00 7.50 8.00Time91
100
%
9
100
%
011303005 SIR of 1 Channel ES- TIC
2.93e66.42
011303005 ConductivityAn1
1.37e52.17
0.600.36 1.461.170.97 1.82
6.523.673.283.203.012.74 4.513.94 4.06 6.285.715.315.154.96 5.52 7.417.297.02 7.99
MS detection(SIM mode)
Conductivity detection
ClO4-
Figure 3. Separation of a 0.5 ppm perchlorate standard by mass spectrometry (top) and conductivity (bottom) detection modes.
0.50 1.00 1.50 2.00 2.50 3.00 3.50 4.00 4.50 5.00 5.50 6.00 6.50 7.00 7.50 8.00Time91
100
%
9
100
%
011303005 SIR of 1 Channel ES- TIC
2.93e66.42
011303005 ConductivityAn1
1.37e52.17
0.600.36 1.461.170.97 1.82
6.523.673.283.203.012.74 4.513.94 4.06 6.285.715.315.154.96 5.52 7.417.297.02 7.99
MS detection(SIM mode)
Conductivity detection
ClO4-
Figure 3. Separation of a 0.5 ppm perchlorate standard by mass spectrometry (top) and conductivity (bottom) detection modes.

ESTCP # ER0542
48
40 50 60 70 80 90 100 110m/z0
100
%
98.9
42.8
41.8
60.8
100.8
Figure 4. Mass spectrum of a 1 ppm perchlorate standard obtained by infusion.
ClO4
98.948511
Cl
O
O
O
O -
40 50 60 70 80 90 100 110m/z0
100
%
98.9
42.8
41.8
60.8
100.8
Figure 4. Mass spectrum of a 1 ppm perchlorate standard obtained by infusion.
ClO4
98.948511
Cl
O
O
O
O -

ESTCP # ER0542
49
1.00 2.00 3.00 4.00 5.00 6.00 7.00 8.00Time26
100
%
24
100
%
23
100
%
23
100
%
081303030 SIR of 1 Channel ES- TIC
7.00e42.11 5.82
081303029 SIR of 1 Channel ES- TIC
7.00e4
5.80
081303028 SIR of 1 Channel ES- TIC
7.00e42.09
5.80
081303027 SIR of 1 Channel ES- TIC
7.00e42.11
1 ppb
0.5 ppb
blank
0.2 ppb
Figure 5. Separation of three low ppb perchlorate standards with mass spectrometry detection.
ClO4-
1.00 2.00 3.00 4.00 5.00 6.00 7.00 8.00Time26
100
%
24
100
%
23
100
%
23
100
%
081303030 SIR of 1 Channel ES- TIC
7.00e42.11 5.82
081303029 SIR of 1 Channel ES- TIC
7.00e4
5.80
081303028 SIR of 1 Channel ES- TIC
7.00e42.09
5.80
081303027 SIR of 1 Channel ES- TIC
7.00e42.11
1 ppb
0.5 ppb
blank
0.2 ppb
Figure 5. Separation of three low ppb perchlorate standards with mass spectrometry detection.
1.00 2.00 3.00 4.00 5.00 6.00 7.00 8.00Time26
100
%
24
100
%
23
100
%
23
100
%
081303030 SIR of 1 Channel ES- TIC
7.00e42.11 5.82
081303029 SIR of 1 Channel ES- TIC
7.00e4
5.80
081303028 SIR of 1 Channel ES- TIC
7.00e42.09
5.80
081303027 SIR of 1 Channel ES- TIC
7.00e42.11
1 ppb
0.5 ppb
blank
0.2 ppb
Figure 5. Separation of three low ppb perchlorate standards with mass spectrometry detection.
ClO4-

ESTCP # ER0542
50
Compound name: Perchlorate (SIR, 99)Correlation coefficient: r = 0.999860, r^2 = 0.999720Calibration curve: 14578.8 * x + -395.32Response type: External Std, AreaCurve type: Linear, Origin: Exclude, Weighting: Null, Axis trans: None
0.0 10.0 20.0 30.0 40.0 50.0ppb-395
735836
Response
Calibration Range: 0.2 to 50 ppb
0.00 1.00 2.00 3.00 4.00 5.00 ppb-395
84042
Response
Figure 6. Calibration curve for perchlorate with mass spectrometry detection. Insert shows the linearity at low ppb levels.
Compound name: Perchlorate (SIR, 99)Correlation coefficient: r = 0.999860, r^2 = 0.999720Calibration curve: 14578.8 * x + -395.32Response type: External Std, AreaCurve type: Linear, Origin: Exclude, Weighting: Null, Axis trans: None
0.0 10.0 20.0 30.0 40.0 50.0ppb-395
735836
Response
Calibration Range: 0.2 to 50 ppb
0.00 1.00 2.00 3.00 4.00 5.00 ppb-395
84042
Response
0.00 1.00 2.00 3.00 4.00 5.00 ppb-395
84042
Response
Figure 6. Calibration curve for perchlorate with mass spectrometry detection. Insert shows the linearity at low ppb levels.
Compound name: Perchlorate (SIR, 99)Coefficient of Determination: 0.998936Calibration curve: -4.65463 * x̂ 2 + 12895 * x + 58513.1Response type: External Std, AreaCurve type: 2nd Order, Origin: Exclude, Weighting: Null, Axis trans: None
0 100 200 300 400 500 600 700ppb0
7343781
Response
Figure 7. Calibration curve for perchlorate with mass spectrometry detection over a broad calibration range.
Calibration Range: 0.2 to 750 ppb
Compound name: Perchlorate (SIR, 99)Coefficient of Determination: 0.998936Calibration curve: -4.65463 * x̂ 2 + 12895 * x + 58513.1Response type: External Std, AreaCurve type: 2nd Order, Origin: Exclude, Weighting: Null, Axis trans: None
0 100 200 300 400 500 600 700ppb0
7343781
Response
Figure 7. Calibration curve for perchlorate with mass spectrometry detection over a broad calibration range.
Calibration Range: 0.2 to 750 ppb

ESTCP # ER0542
51
1.00 2.00 3.00 4.00 5.00 6.00 7.00 8.00Time2
100
%
5
100
%
5
100
%
2
100
%
081303006 SIR of 1 Channel ES- TIC
7.00e52.33
5.82
081303017 SIR of 1 Channel ES- TIC
7.00e55.83
081303016 SIR of 1 Channel ES- TIC
7.00e55.74
081303015 SIR of 1 Channel ES- TIC
7.00e55.82
10 ppb Std.
30 min
60 min
90 min
10 ppb
9 ppb
8 ppb
Figure 8. Separation of a 10 ppb perchlorate standard and three effluent samples (different collection times) that contain low ppb perchlorate levels in the presence of sulfate.
ClO4-

ESTCP # ER0542
52
TABLE I.
Ultimate Dilution Test Experiments
Results in ppbCollection Time
Run # Resin % R-ClO4 Background 0:30 1:00 1:3075 PWA2 (Plant sample) 2.0 SO4 10 9 8
76 Dowex 1 (light color) 2.0 SO4 878 863 867
77 PWA2 (Plant sample) 1.0 NO3 19 19 18
78 Dowex 1 (light color) 1.0 NO3 1140 1135 1122
79 PWA2 (Lot 304621) 1.0 NO3 28 23 19
80 PWA2 (Lot 327958) 1.0 NO3 27 21 19

ESTCP # ER0542
53
Appendix B: Quality Assurance Project Plan (QAPP)
B.1 Purpose and Scope of the Plan The purpose of this Quality Assurance Project Plan (QAPP) is to ensure that the experimental protocols and practices for this demonstration project will yield performance and cost information that is both accurate and useful for making water treatment technology decisions. It addresses sampling protocols for water and resin samples; analytical methods and practices to ensure accuracy, repeatability and precision; data recording, transcribing, storage, interpretation and reporting for all key independent and dependent variables.
B.2 Quality Assurance Responsibilities There will be three primary areas of quality oversight; field operations, analytical practices, and data management. • Jim Summerfield (Principal Investigator) will have responsibility for
managing quality in the field operations including the daily data collection by the utilities, the water sampling, the resin change-outs, and other field operations and will manage the quality of data, data storage, interpretation and reporting.
B.3 Data Quality Parameters
There are four (4) key independent variables from which all other information and results flow. These are: water flow rate, water volume treated (as related to a given sample of water or resin), perchlorate content of the bulk water (at any given point in the resin column, and perchlorate content of the ion exchange resin (as a function of bed height). Each of these independent variables requires a validation to ensure the data points are usable. Water Flow Rate and Treated Water Volume Flow rate and treated water volume will be determined by a mechanical flow meter and monitored daily. Calibration of the flow meters and validation of these data are described in Section B4. Because of the mass of water treated in this demonstration program, other forms of validation are impractical. It is expected that there will be significant variation in flow rates and volumes (as a function of time) because of demand fluctuations on the system. Thus, no statistical tools will be applied to these data.

ESTCP # ER0542
54
Water Perchlorate Content The perchlorate contents of the water entering, exiting and at various points in the bed are the most critical pieces of information for the demonstration project. The validation and calibration practices and procedures will be discussed in section C.4. of this QAPP. To ensure that these samples are representative of their parts of the system, the sample taps are designed to extend into the ion exchange bed at least 6 inches which eliminates the impact of wall effects on distribution within the ion exchange bed. This design criterion will be validated during final inspection of the equipment. Appendix D describes the water sampling protocol which will be used to ensure water samples are representative of the water in the bed (or in the inlet/outlet piping) at the time of sampling. It also describes the storage and labeling practices to be used to identify and protect the integrity of each sample. Duplicate samples will be taken for ALL water sampling and sample sets will be shipped separately to avoid loss of samples via shipping error. Because the water from this demonstration program will be served to the public via the participating utilities, there will be occasion for the water to be tested at state (of California)-certified laboratories. This opportunity will be used to validate our sampling and analytical methods. Resin Perchlorate Content The perchlorate content of the ion exchange resin at the end of each cycle is a key, independent variable for completing the perchlorate mass balance. All of the resin removed from the vessel during resin change outs will be collected and homogenized by agitation. Core samples will be taken from this resin to ensure the sample is representative of the entire “batch” of exhausted resin. Additionally, during at least one of the resin replacements, a core sample will be taken from the primary service vessel prior to the resin replacement. Analyses from various fractions of this sample will be compared to the homogenized sample as a check on sample precision. The results of these sample analyses can be compared to the calculated perchlorate loadings based on fundamental equilibrium equations. Because these resin analytical techniques are developmental, no defined range of agreement will be set as a precondition to the acceptability of these data.
B.4 Calibration Procedures, Quality Control Checks and Corrective Action
Water Flow rate and Volume Treated The flow rate and treated volume are both determined by a mechanical flow meter. These meters are calibrated at the time of production. This calibration will be accepted for the first water treatment cycle. During each resin change out, an external ultrasonic flow meter will be used to validate the mechanical flow meters. These flow rates should agree to within 3%. If the measured rates should not agree, the ultrasonic flow meter will be calibrated in the shop and the flow test

ESTCP # ER0542
55
will be repeated. If the flow rates should still differ by >3%, the mechanical flow meter will be replaced. Treated Water Volume It will be assumed that the flow volume measurement is accurate if the flow rate test should be accurate. Flow and volume data will be recorded on a daily basis by utility operating personnel. These data will be audited by the water sampling service company during each water sampling event to ensure data entries are occurring on time and in a complete manner. Water Perchlorate Content The calibration of the ion chromatograph as well as the validation of the ion chromatography test method is described in Appendix A (Analytical Methods for Water Sample Analysis) of this Demonstration Plan. During each of the targeted 11 sample sets, duplicate samples will be run on the 1st, 5th, and last (9th) sample from the set. Additionally, a control sample (of known perchlorate content) will be run with each set of samples analyzed. Data from the water analyses will be plotted (x-axis = perchlorate content of water, y-axis = height in the ion exchange bed) to graphically present the shape, size, and progression of the perchlorate mass transfer zone within the ion exchange resin bed. In this manner, perchlorate breakthrough can be monitored and compared to the equilibrium, predictive model. It is expected that these data will be comparable within 10%. If they should not agree to within 10%, a technical review will be initiated. If this technical review should not identify the discrepancy in the data versis the model, a “lab shadow” test will be conducted using samples of the raw water from the utility and controlled conditions in ½ in. diameter laboratory columns.
B.5 Demonstration Procedures The most significant unknown in this demonstration project is the hydraulic behavior of the resin under the resin removal conditions. Significant fluidization around the central lateral, used to hold the upper portion of the bed in a packed state, could result in loss of unexhausted resin and, thus, lower resin utilization more than desired. Sight glasses will be installed in the vessels to assist in visual observations of the resin behavior during change outs. Conditions such as flow rates and valve opening/sequencing will be amended as needed during the demonstration project to minimize resin mixing and turbulence. The final proof statements will be generated from quantitative measurements of perchlorate on the ion exchange resin and not these observations.
B.6 Calculation and Data Quality Indicators. The quality of the data will be reflected in the ability to close the mass balance on perchlorate. The mass of perchlorate removed by the system is calculated by the volume of water treated over a given period of time multiplied by the difference in perchlorate concentration into and out of the primary service vessel.

ESTCP # ER0542
56
Mp = Vw x (Pi-Po) where: Mp = mass of perchlorate loaded over time period of interest, Vw = Volume of water treated over time period of interest, Pi = inlet perchlorate concentration, and Po = outlet perchlorate concentration. The result of the above equation will be compared to the mass of perchlorate that is stripped from the resin and measured by Ion Chromatography. The loading capacity of the resin is determined by dividing the mass of perchlorate removed by the amount (volume) or resin employed for this removal. Cap = Mp/Vr where: Cap = the capacity of the resin and Vr = volume of resin.
B.7 Performance and System Audits All performance and system audits will be performed as needed by the Principle Investigator, Jim Summerfield.
B.8 Quality Assurance Reports All Quality Assurance activities will be documented by QA Officer on a quarterly basis. This documentation will include a description of audit practices, results, and recommended adjustments to the program/practices to improve or ensure quality. These reports will be copied to the Principal Investigator; maintained by the QA Officer; and included in the final project documentation.

ESTCP # ER0542
57
B.9 Data Format Raw data for flow rate and treated volume will be collected in a log book as shown in Figure 13 on page 21 in the main body of this Demonstration Plan. These data will be transcribed and transmitted electronically to Jim Summerfield by the participating utility. These data will be incorporated into a Microsoft ExcelTM spreadsheet to facilitate trending and further mathematical use. The raw data from the perchlorate analysis of water samples will be printed from the Ion Chromatograph onto a results sheet. These data will be forwarded to Jim Summerfield who will transcribe this data into a Microsoft ExcelTM spreadsheet to facilitate plotting, trending, and further mathematical use. If a contract is utilized, the data will be transmitted electronically to Jim Summerfield where it will transcribed in a Microsoft Excel spreadsheet.
Procedures and observations during the resin change outs will be recorded in a log book.
B.10 Data Storage and Archiving Procedures All data will be maintained electronically on a central server (shared drive) or individual computer at the Dow Chemical Company and will us consolidate all data in one place for review and manipulation. Hard copies of all raw data will be maintained by Jim Summerfield and included with the final documentation from the Demonstration Project. This documentation will include both an electronic copy and a hard copy of this consolidated data.

ESTCP # ER0542
58
Appendix C: Health and Safety Plan (HASP)
C.1 Purpose and Scope The purpose of this plan is to ensure the health and safety of the personnel associated with the Dow Chemical Company’s ESTCP demonstration project, the people who will receive water derived from this demonstration, and the local environment around each demonstration site. This plan will consider the water used to rinse, and transfer resin into and out of the system, the new and perchlorate-loaded ion exchange resin, and the treated water that is intended for distribution to the public.
Dow Chemical Company’s role is to demonstrate the technology for removal of perchlorate from the water. It is the role of the participating utilities to perform all other treatments which could include filtration and disinfection and all other federal, state, and local sampling and testing for regulatory purposes.
C.2 Acute Health Hazards
The materials handled during this demonstration project are water and ion exchange resin. Both of these materials are considered safe and non-toxic when exposed to normal levels. Material Safety Data Sheets for the ion exchange resin used as part of this demonstration project will be kept on site with the operations log-books. Care will be taken to avoid acute hazards which may be encountered from off-loading and installing the systems because of the systems’ shear size and mass. A brief safety review will be conducted with the rigging personnel prior to off-loading the units from their delivery trucks. Potential hazards will be identified, and procedures to avoid them, will be determined and executed during the off-loading period. In the same manner, other installation hazards, such as the use of hand tools and ladders, will be reviewed with the contractor before installation work is initiated. A general first aid kit will be assembled and presented at the site during start-up and resin change out procedures.
C.3 Chronic Hazards Again, there are no known chronic health hazards associated with exposure to water or ion exchange resins. The use of ion exchange resins in potable water use is governed by the EPA and by the CA Department of Health Services (CADHS). AmberliteTM PWA2 has been certified for use in potable water by the National Sanitation Foundation (NSF) and CADHS. The NSF pretreatment protocol requires a 20 BV rinse of the resin before water can be served to the public.

ESTCP # ER0542
59
C.4 Environmental Issues The rinse water from the 20 BV resin pre-rinse will need to be disposed of in a manner that meets local and state regulations. This water will be collected and/or discharged to the local waste water treatment facility. This is also true of waters that are used to transfer resin into and out of the system during resin loading and change-outs.
Exhausted ion exchange resin will contain several pounds of perchlorate. While this material is not toxic in this form, it will be disposed of via incineration to ensure perchlorate can not be released back into the environment from this spent resin.

ESTCP # ER0542
60
Appendix D. Water Sampling Procedure
Developed by J. Miers, July 7, 2006 D.1 Purpose and Scope
The purpose of this procedure is to give guidance on how water samples should be taken for Dow Chemical Company’s ESTCP demonstration project to ensure that samples are representative, labeled and handled properly such that the data these samples yield are both usable and valuable. This procedure is limited to water samples taken from the water taps provided on the ESTCP demonstration vessels. It addresses sampling procedures, sample containers, labeling, storage/handling, and shipping procedures.
D.2 System Description
The ESTCP demonstration system consists of two, 8 ft. diameter x 4 ft. straight side ion exchange vessels piped in-series. The primary service vessel is a novel design and will include water sampling taps located every 6 in. up the straight side of the vessel. There will also be a water sample tap at the inlet and outlet to the primary service vessel as well as the outlet of the secondary (polishing) vessels. These sample taps will be ¼ in. diameter stems with manual ball valves for control. The sample taps on the straight side of the primary service vessel will extend 6 inches into the ion exchange bed to ensure there are no hydraulic wall effects to the sample location and will terminate in a screened opening to ensure resin does not exist the vessel during water sampling. Figure E1 shows a schematic diagram of the vessel system with the relative location and labeling of the sample taps. Figure E1. Relative Location of Sample Taps for ESTCP System.
A From well pump
B
C
D
E
F
G
I
J
H
Relative Location of Sample Taps for ESTCP System
Primary Service Vessel
Polishing Vessel

ESTCP # ER0542
61
D.3 Equipment
Equipment required for the sampling procedure at each site includes: • 20 – 150 ml plastic coated amber glass bottles with screw-on lids • 20 sample labels • Indelible ink pen • Packaging tape • Electrical tape • Log-book for recording observations and issues during sampling. • x 5-gallon liquid containers for waste water • (1) 1- liter sample bottle for flushing taps • Suitable box or container for water samples
D.4 Labeling Protocol
Sample labels will use the follow information and identification sequence: Dow Chemical Company ESTCP Demonstration Project ER0542 Potable Water Sample – do not drink. X – mmddyy-Y where: X = C for the City of Colton site = R for the City of Rialto site = W for the West Valley Water District site mm = the month expressed numerically (use 0 the first digit for Jan. – Sept) dd = the day of the month (use 0 for the first digit for days 1-9) yy = the year (06 for 2006, 07 for 2007) Y = the sample tap identification as described in Figure E1. Use upper case letters for the first sample and lower case letters for the duplicate sample.
D.5 Sampling Procedure
Complete all steps on each sample tap prior to progressing to the next sample tap. Sample the taps in order, from A-J. 1. Prepare the labels according to the protocol above but do not affix the labels
until after the sample has been taken. 2. Using the 1-liter sample bottle, purge 1-liter of water from the sample tap
prior to sampling. Place this water in the 5-gallon (or other) waste water containers.
3. Using a new, clean 150 ml amber bottle, rinse the bottle with 150 ml of water from the sample tap to be sampled. Place this water in the 5-gallon waste water containers.
4. Fill the 150 ml bottle to the top with water from the sample tap. 5. Tightly secure the screw on the lid of the sample bottle. 6. Wipe the outside of the sample bottle with a clean dry rag/towel to prepare for
label.

ESTCP # ER0542
62
7. Affix the appropriate label to the sample bottle; apply transparent packaging tape to the label to waterproof it; apply electrical tape to the lid to insure it remains in place during transport; and place the bottle in the box/container for safe transport.
8. Repeat steps 3-7 on the same sample tap for the duplicate sample. 9. Repeat steps 3-8 on each sample tap until all samples and duplicates have
been taken. Dispose of the waste water from this sampling procedure in an approved manner according to local regulations.
D.6 Packaging and Shipping
Prepare packages for the water samples such that the samples are not separated or damaged in transit. Send the primary and duplicate (if required) samples in separate packages with separate shipping labels such that there are two sample packages being shipped separately. Samples from multiple locations can be shipped together as long as the primary and duplicate samples are separated and sent separately. Initially, all water samples were sent to Dow’s research facility in Spring House PA. However, they were no able to handle the enormous number water samples in a timely manner, therefore a state of California certified lab was contracted to perform the required analyses. The lab (Clinical Labs of San Bernardino) is the same lab used by the municipalities for their state certified water analyses. Send all water samples to the following address: Attn: Mr. William Carlin Bldg. 10, Room 208/R The Dow Chemical Company Corporate Research Center 727 Norristown Rd. Spring House, PA 19477 Or Delivered by each municipality to: Clinical Labs of San Bernardino PO BOX 329 San Bernardino, CA 92402