Embed Size (px)
Citation preview

Demonstration of Particulate Matter (PM) Sensor in post-DPF
EnvironmentA Presentation to:
California Air Resources BoardResearch Division
Innovative Clean Air Technologies (ICAT)2008 Grant Program
ByHoneywell Laboratories
Plymouth, Minnesota
April 7, 2010

2
Program Objectives
Description of particulate matter sensor
Experimental design
Bypass Testing
Failed diesel particulate filter testing
Sensor ruggedness
Summary and Conclusions
Recommendations and Next Steps

3
Program objectives
Honeywell International intended to demonstrate a particulate matter (PM) sensor to provide on-board diagnostics for a diesel engine to monitor compliance with proposed particulate matter exhaust limits of 0.03 gm/bhp-hr as identified in California Code of Regulations, Title 13, Section 1971.1(e).
Program also intended to improve the understanding of the PM sensor response to the charge characteristics of the exhaust particles.

4
Statement of Work
• Conduct on-engine testing of PM sensor within the post-DPF environment.
• Determine probe responsiveness and signal accuracy by comparing sensor with calibrated particle measuring equipment
• Measure sensor response in post-DPF environment using a functional DPF and then failing that DPF while providing the conditions approaching the 3x certification levels of 0.03 gm/bhp-hr.
• Correlate sensor output with both particle and charge distributions.

5
PM Sensor - Basic Concept and Operating Principle
Charged particle cloud
Q
Sensor andPre-amplifier
Particle charge induces a charge, q, on the grounded probe. The induced charge is measured as a current
Sensor capable of functioning in harsh exhaust envi ronment.Possibility of detecting individual cylinder events
Rapid Response of PM Sensor to Cylinder Emission
How the sensor works:
• Diesel exhaust contains charged particles.
• These charged particles induce an image charge in sensor electrode.
• Rapid sensor response allows detection of current fluctuations as individual cylinders fire.
To Signal Processing

6
Description of PM sensor and electronics
Sensor with preamplifier attached
Schematic of sensor testing configuration
• Sensor constructed of inner conducting electrode surrounded by electrically isolating, thermally rugged shielding.
Rugged sensor can be installed directly into Exhaus t Pipe
PreAmp
Electrode
SensorBody
• Pre-Amplifier integrated with probe to minimize signal noise.
• Second stage Amplifier to ultimately be integrated with first stage.
1 inch
7
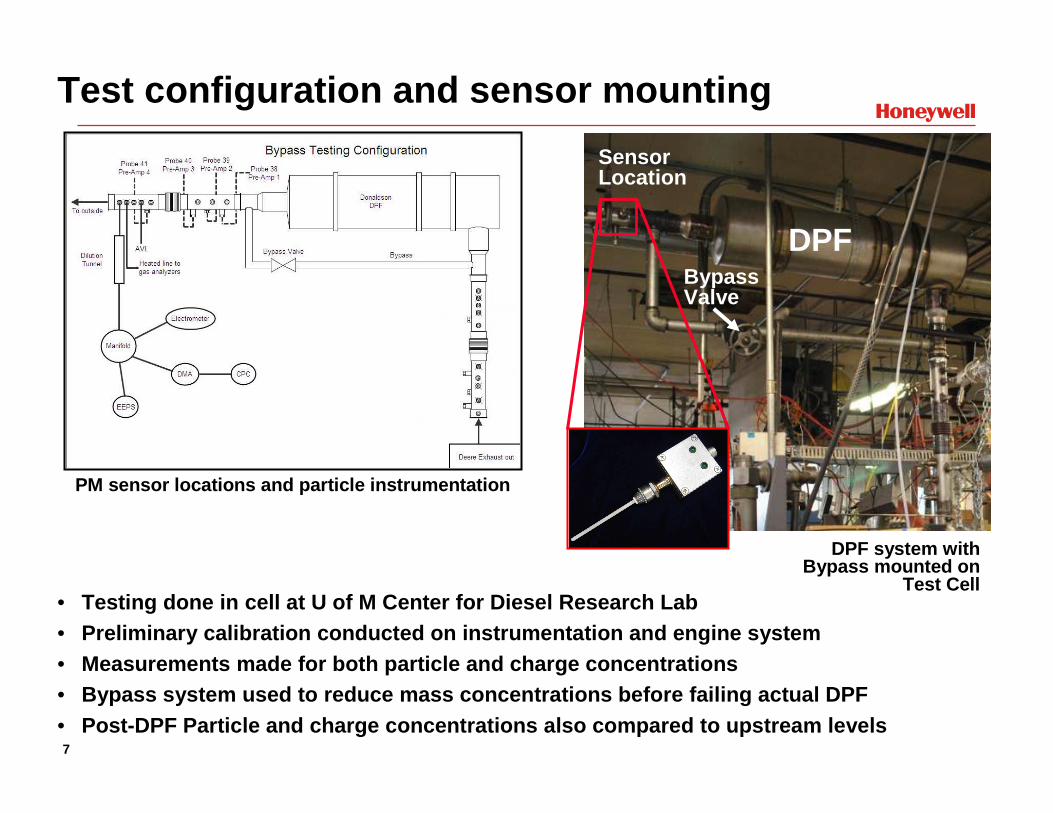
Test configuration and sensor mounting
DPF system with Bypass mounted on
Test Cell
PM sensor locations and particle instrumentation
• Testing done in cell at U of M Center for Diesel Res earch Lab• Preliminary calibration conducted on instrumentatio n and engine system• Measurements made for both particle and charge conce ntrations• Bypass system used to reduce mass concentrations be fore failing actual DPF• Post-DPF Particle and charge concentrations also co mpared to upstream levels
DPFBypassValve
SensorLocation

8
Exhaust measurements - correlation of particle measu rement Instrumentation
1.0E+03
5.0E+05
1.0E+06
1.5E+06
2.0E+06
2.5E+06
3.0E+06
3.5E+06
1 10 100 1000
Dp, nm
dN/d
logD
p, p
art/
cm3
SMPS ELPI
Correlation of Mass Concentration Equipment
• Particle equipment was found to correlate extremely well both for both mass and number concentrations.
Excellent comparison between particle measurement I nstrumentation Exhaust particulate seen to be mainly accumulation mode
1.0E+00
1.0E+01
1.0E+02
1.0E+03
1.0E+04
1.0E+05
1.0E+06
1 10 100 1000
Dp, nm
dN/d
logD
p, p
art/
cm3
1400 RPM 50 Nm
1400 RPM 50 Nm
1400 RPM 450 Nm
1400 RPM 450 Nm
SMPS hollow symbolsEEPS solid symbols
• Measurements at different engine conditions shows response to accumulation mode and nuclei mode, the latter at the 50Nm loading

9
Effect of bypass
Change in Number size distribution with Bypass Open ing
1.0E+04
1.0E+05
1.0E+06
1.0E+07
1.0E+08
1 10 100 1000
Particle Size Dp (nm)
dN/d
logD
p (p
artic
les/
cm3 )
SMPS 0% SMPS 25% SMPS 50% SMPS 100% SMPS UpstreamEEPS 0% EEPS 25% EEPS 50% EEPS 100% EEPS Upstream
• Accumulation mode for particle distribution with very little nucleation mode
• Mass and number concentrations correlate to bypass
• As bypass is changed, shape of distribution remains roughly the same.
• When bypass closed, majority of mass is coming through the trap.
• Small nucleation mode tale seen at around 10 nm
Increased penetration of particles as bypass opened
Similar distribution shape

10
Sensor and mass concentration with bypass
• When bypass closed, majority of mass is penetrating DPF.
Change in Mass concentration with Bypass Opening
Sensor data shows ability to measure small concentr ations, but sensor appears to have threshold limit at lower concentrations
• PM sensor response for closed bypass. implies potential sensor response threshold
• Geometry changes in exhaust could cause sensor variation.
Comparison of multiple sensors with mass concentrat ion

11
Strategies for Failing the DPF
• Most effective, reproducible failure method was end cap failure
• Small holes in end cap simulate artificial “crack” in DPF
• Ability to manage flow through the DPF drove selection of failure method
Showing strategy for simulating end cap failure
Potential DPF failure mechanisms considered
• Thermal Separation
• Ring Crack Failure
• End Cap failure
Visualization of Flow penetration through DPF
Simulated failure based on real world failure mecha nisms
DrilledHole

12
Failing the DPF
• Attempts were made to maintain channel walls while holes drilled in end cap
• Failure area progressed from center of DPF to outer perimeter
• For larger failure areas channel ends were milled off and then DPF channels cleared
• Number of openings to be drilled for each subsequent test was selected based upon previous measurements.
Uniform pattern of holes across face of DPF provide d failure mode
Colors represent failure area and number of holes
Milled holeset

13
Sensor response during initial DPF failing
• Testing conducted for initial DPF failure modes on first engine indicated rough correlation between PM sensor and mass concentration.
• Between 200 and 300 holes sensor signal increased at greater rate than mass concentration.
• Variation in sensor response to similar mass concentrations indicate possibility of sensor response to location.
Preliminary DPF failure modes show sensor has capab ility to respond
to changing levels of DPF failure

14
Bypass and Failed DPF measurements
• Rate of change of mass penetration for bypass openings more uniform than in DPF.
• Initial failure modes of DPF did not achieve threshold level .
PM sensor indicates initial correlation with mass c oncentration
• PM sensor roughly follows mass concentration for bypass modes.
• Response for functioning DPF indicates possible minimum operational level of sensor

15
Sensor response to “failure” rates
PM sensor correlates with “equivalent area” of faile d DPF, but with low sensitivity
• Bypass opening converted to “ area equivalent“ number of holes
• Non-linearity observed in sensor response
• Maximum rate of change of sensor response starts at mass concentrations near OBD threshold level.

16
Charge Measurement Results during DPF Failure
10%
100%
1 10 100 1000Dp (nm)
Fra
ctio
n C
harg
ed
300 Holes 600 Holes 900 Holes 1800 Milled 1000 K 1500 K
• Minimal number of nucleation mode particles are charged
• Fraction of charged accumulation mode particles remains relatively constant over all failing modes
• Net charge for both the bypass and DPF smaller than upstream levels.
• Effect of charged particle removal by DPF needs to be determined
Fraction of charged particles vs.. DPF failure
Pre- and Post-DPF Net Charge
Increase in the penetration of Net charge with incr ease in open area of the DPF

17
Effect of engine substitution on sensor response
• Sensor response reduced when new engine substituted
• Potential Issues
• Reduced sensor response occurred even with larger number of holes in DPF
• Difference in new exhaust configuration
• Substitute engine operated to produce similar mass and charge concentration in exhaust upstream of DPF
• Sensor saw increase in vibration and signal noise
• Response differences raise concern in applying over wide range of engines.
Different sensor response seen between engines

18
Sensor ruggedness testing
• Preliminary measurements were made with the sensor mounted on a heavy duty Diesel truck driven under highway conditions.
• Sensor installation to observe physical effects on the sensor
• Vibration reduction mounting used for one sensor.
• Post test examination of sensor indicated no adverse physical effects

19
Summary and conclusions
• For PM sensor tested under this program.
• The sensor operated over extended time periods without mechanical failures (coating de-lamination or degradation).
• The sensor does not appear to quantitatively detect variation in mass concentrations down at a level sufficient for OBD detection of DPF faults.
• Select tests indicate detection capability at or below the 0.03 gm/bhp-hr mass concentrations, but with large variance in sensor response.
• Initial on-engine measurements produced a rough correlation between PM sensor response and mass concentration, but only at high failure levels of the DPF.
• Testing on a second engine, however, indicated that sensor response was drastically reduced.
• Signal-noise, while improved through amplification and signal processing still remains a limitation.
• Additional sensor evaluation indicated that internal probe connections may be one cause of the noise.
• A preliminary correlation between the particle charge and exhaust mass concentration has been observed.
• Additional quantification of the charge on the exhaust particles is necessary for understanding this environment
• Changes in the PM sensor response on a different eng ine suggest that a single post-DPF sensor solution may not work.
• Initial data analysis indicates that a two sensor solution is more promising, relying on the relative signal change between upstream and downstream sensors.
• Pre- and Post- signal differentiation (either integrated spectral or time based) could develop a “finger print” to recognize DPF failure

20
Recommendations and next steps
• Continued evaluation of the PM sensor in the post-D PF environment, specifically using a two-sensor soluti on (upstream and downstream PM sensors). • Experimental investigation of time-based and frequency-based processing
methods with a down-select to provide a quantitative sensor response for DPF failure.
• Develop a threshold trigger for DPF failure indication (triggered when the post-DPF sensor signal is “sufficiently close” to the pre-DPF signal). Would not be useful for determining OBD levels until at the point of failure.
• Further investigate the “discreet voltage filtering ” characteristic of a single sensor to exclude sensor voltages below a certain “noise” threshold.
• A more complete understanding of the charging proce ss in the exhaust and the interaction of particle charge dist ributions within the DPF may would assist in understanding of senso r limitations.

21
Acknowledgements
Honeywell wishes to acknowledge the following indiv iduals and organizations for their support of and participatio n in this project:
• California Air Resources Board Steve Church
• University of Minnesota, Center for Diesel Research P rof. David Kittelson
Adam Ragatz
Win Watts
Darrick Zarling
• ENSYSENG Greg Hampson
• Honeywell, ACS Labs Ryan Becker
Pete Reutiman
Nicholas Moelders
Fouad Nusseibeh

22
Acknowledgements
The statements and conclusions in this report are t hose of the grantee and not necessarily those of the California Air Res ources Board. The
mention of commercial products, their source, or th eir use in connection with material reported herein is not to be construed as
actual or implied endorsement of such products.
Conducted under a grant by the CaliforniaAir Resources Board of the California
Environmental Protection Agency