Embed Size (px)
Citation preview
June 17, 2014
RPA Inc. T55 University Ave. Suite 501 I Toronto, ON, Canada M5J 2H7 I + 1 (416) 947 0907 www.rpacan.com
DENISON MINES CORP.
TECHNICAL REPORT ON AMINERAL RESOURCE ESTIMATE UPDATEFOR THE PHOENIX URANIUM DEPOSIT,WHEELER RIVER PROJECT,EASTERN ATHABASCA BASIN,NORTHERN SASKATCHEWAN,CANADA
NI 43-101 Report
Qualified Person:William E. Roscoe, Ph.D., P.Eng.
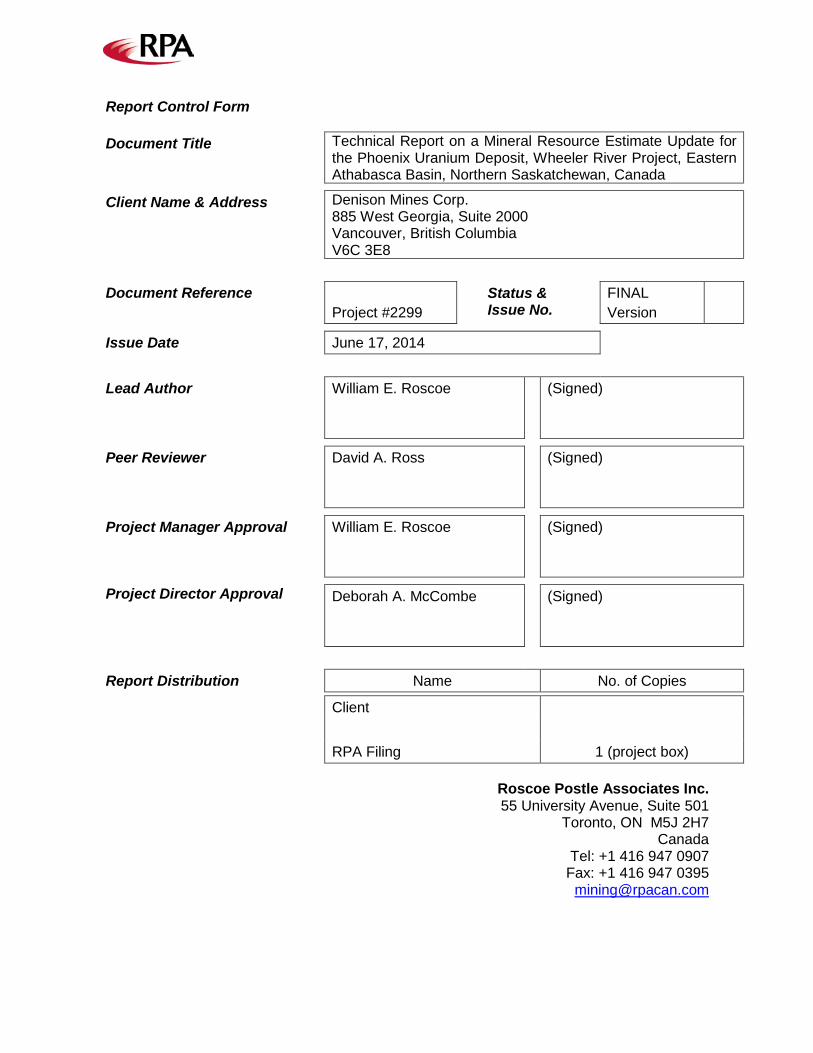
Report Control Form Document Title Technical Report on a Mineral Resource Estimate Update for
the Phoenix Uranium Deposit, Wheeler River Project, Eastern Athabasca Basin, Northern Saskatchewan, Canada
Client Name & Address
Denison Mines Corp. 885 West Georgia, Suite 2000 Vancouver, British Columbia V6C 3E8
Document Reference
Project #2299
Status & Issue No.
FINAL Version
Issue Date June 17, 2014 Lead Author William E. Roscoe
(Signed)
Peer Reviewer David A. Ross
(Signed)
Project Manager Approval William E. Roscoe
(Signed)
Project Director Approval Deborah A. McCombe
(Signed)
Report Distribution Name No. of Copies Client RPA Filing 1 (project box)
Roscoe Postle Associates Inc.
55 University Avenue, Suite 501 Toronto, ON M5J 2H7
Canada Tel: +1 416 947 0907
Fax: +1 416 947 0395 [email protected]
www.rpacan.com
Page i Denison Mines Corp. – Phoenix Deposit, Wheeler River Project, Project #2299 Technical Report NI 43-101 – June 17, 2014
TABLE OF CONTENTS PAGE
1 SUMMARY ...................................................................................................................... 1-1 Executive Summary ....................................................................................................... 1-1 Technical Summary ....................................................................................................... 1-3
2 INTRODUCTION ............................................................................................................. 2-1
3 RELIANCE ON OTHER EXPERTS ................................................................................. 3-1
4 PROPERTY DESCRIPTION AND LOCATION ................................................................ 4-1
5 ACCESSIBILITY, CLIMATE, LOCAL RESOURCES, INFRASTRUCTURE AND PHYSIOGRAPHY ............................................................................................................... 5-1
6 HISTORY ........................................................................................................................ 6-1 Ownership ..................................................................................................................... 6-1 Exploration and Development History ............................................................................ 6-1
7 GEOLOGICAL SETTING AND MINERALIZATION .......................................................... 7-1 Regional Geology .......................................................................................................... 7-1 Local and Property Geology........................................................................................... 7-5 Structural Geology ....................................................................................................... 7-12 Uranium Mineralization ................................................................................................ 7-15
8 DEPOSIT TYPES ............................................................................................................ 8-1
9 EXPLORATION ............................................................................................................... 9-1
10 DRILLING .................................................................................................................... 10-1 Drill Hole Surveying ..................................................................................................... 10-7 Sampling Method and Approach ................................................................................ 10-11 Core and Use of Probe Data ...................................................................................... 10-13
11 SAMPLE PREPARATION, ANALYSES AND SECURITY ............................................ 11-1 Sample Preparation and Analytical Procedures ........................................................... 11-1 Analytical Quality Assurance and Quality Control ........................................................ 11-6 Security and Confidentiality.......................................................................................... 11-7
12 DATA VERIFICATION ................................................................................................. 12-1 QA/QC Program .......................................................................................................... 12-1 Drill Hole Database Check ........................................................................................... 12-1 External Laboratory Check Analysis ............................................................................ 12-2 Sample Standards, Blanks and Field Duplicates .......................................................... 12-4 Disequilibrium ............................................................................................................ 12-10
13 MINERAL PROCESSING AND METALLURGICAL TESTING ..................................... 13-1
14 MINERAL RESOURCE ESTIMATE ............................................................................. 14-1 General Statement ....................................................................................................... 14-1 Drill Hole Database ...................................................................................................... 14-2
www.rpacan.com
Page ii Denison Mines Corp. – Phoenix Deposit, Wheeler River Project, Project #2299 Technical Report NI 43-101 – June 17, 2014
Geological Interpretation and 3D Solids ....................................................................... 14-5 Dry Bulk Density ........................................................................................................ 14-12 Statistics .................................................................................................................... 14-14 Variography ............................................................................................................... 14-18 Block Model Interpolation ........................................................................................... 14-18 Mineral Resource Classification ................................................................................. 14-23 Block Model Validation ............................................................................................... 14-25 Mineral Resource Estimate ........................................................................................ 14-27
15 MINERAL RESERVE ESTIMATE ................................................................................ 15-1
16 MINING METHODS ..................................................................................................... 16-1
17 RECOVERY METHODS .............................................................................................. 17-1
18 PROJECT INFRASTRUCTURE .................................................................................. 18-1
19 MARKET STUDIES AND CONTRACTS ...................................................................... 19-1
20 ENVIRONMENTAL STUDIES, PERMITTING, AND SOCIAL OR COMMUNITY IMPACT ......................................................................................................................................... 20-1
21 CAPITAL AND OPERATING COSTS .......................................................................... 21-1
22 ECONOMIC ANALYSIS............................................................................................... 22-1
23 ADJACENT PROPERTIES .......................................................................................... 23-1
24 OTHER RELEVANT DATA AND INFORMATION ........................................................ 24-1
25 INTERPRETATION AND CONCLUSIONS .................................................................. 25-1
26 RECOMMENDATIONS................................................................................................ 26-1
27 REFERENCES ............................................................................................................ 27-1
28 DATE AND SIGNATURE PAGE .................................................................................. 28-1
29 CERTIFICATE OF QUALIFIED PERSON .................................................................... 29-1
LIST OF TABLES PAGE
Table 1-1 Mineral Resource Estimate as of May 28, 2014 (100% Basis) .......................... 1-1 Table 4-1 Land Tenure Details ......................................................................................... 4-2 Table 6-1 2010 SRK Mineral Resource Estimate .............................................................. 6-5 Table 6-2 RPA Mineral Resource Estimate as of December 31, 2012 (100% Basis) ........ 6-5 Table 10-1 Drilling Statistics ........................................................................................... 10-4 Table 10-2 Gryphon Zone Mineral Intersections ............................................................. 10-5 Table 11-1 Quality Control Sample Allocations ............................................................... 11-7 Table 14-1 Mineral Resource Estimate for the Phoenix Deposit as of May 28, 2014 (100% Basis) ............................................................................................................................... 14-1 Table 14-2 Vulcan Database Records ............................................................................ 14-2 Table 14-3 Basic Statistics of Grade and GxD Composites for Phoenix Deposit Zones A and B HG and LG Domains ............................................................................................ 14-15 Table 14-4 Block Model Interpolation Parameters ........................................................ 14-20
www.rpacan.com
Page iii Denison Mines Corp. – Phoenix Deposit, Wheeler River Project, Project #2299 Technical Report NI 43-101 – June 17, 2014
Table 14-5 Volume Comparison for Wireframe and Blocks by Domain ......................... 14-25 Table 14-6 Statistics of Block Grades Compared to Composite Grades by Domain...... 14-26 Table 14-7 Mineral Resource Estimate for the Phoenix Deposit at a Cut-off Grade of 0.8% U3O8 as of May 28, 2014 ................................................................................................ 14-28 Table 14-8 Indicated Mineral Resources at Various Cut-off Grades .............................. 14-29
LIST OF FIGURES PAGE
Figure 4-1 Wheeler River Property Location Map ............................................................. 4-3 Figure 4-2 Wheeler River Property Map ............................................................................ 4-4 Figure 7-1 Regional Geology and Uranium Deposits ........................................................ 7-3 Figure 7-2 Simplified Geological Map of Athabasca Basin ................................................ 7-4 Figure 7-3 Schematic Section of the Athabasca and Basement Rock Types .................... 7-8 Figure 7-4 Basement Geology ........................................................................................ 7-10 Figure 7-5 Schematic of the Quartzite Ridge .................................................................. 7-11 Figure 7-6 WS Reverse Fault Offset of the Unconformity ............................................... 7-14 Figure 8-1 Schematic of Unconformity Type Uranium Deposit .......................................... 8-3 Figure 10-1 Phoenix Deposit Drill Hole Location Map ..................................................... 10-6 Figure 10-2 Calibration Curve for Geiger-Mueller SN 3818 Probe ................................ 10-10 Figure 11-1 Phoenix Deposit U3O8 (wt%) Versus U3O8 from U Partial ............................ 11-5 Figure 12-1 U3O8 DNC Versus ICP-OES Assay Values .................................................. 12-3 Figure 12-2 USTD1 Analyses ......................................................................................... 12-5 Figure 12-3 USTD2 Analyses ......................................................................................... 12-5 Figure 12-4 USTD3 Analyses ......................................................................................... 12-6 Figure 12-5 USTD4 Analyses ......................................................................................... 12-6 Figure 12-6 USTD5 Analyses ......................................................................................... 12-7 Figure 12-7 USTD6 Analyses ......................................................................................... 12-7 Figure 12-8 Blank Sample Analyses Results .................................................................. 12-9 Figure 12-9 Field Duplicate Analyses ............................................................................. 12-9 Figure 12-10 WR-318 Radiometric vs. Assay % U3O8 Values ....................................... 12-11 Figure 12-11 WR-334 Radiometric vs. Assay % U3O8 Values ....................................... 12-12 Figure 12-12 WR-273 Radiometric vs. Assay % U3O8 Values ....................................... 12-12 Figure 12-13 WR-435 Radiometric vs. Assay % U3O8 Values ....................................... 12-13 Figure 12-14 WR-548 Radiometric vs. Assay % U3O8 Values ....................................... 12-13 Figure 12-15 WR-525 Radiometric vs. Assay % U3O8 Values ....................................... 12-14 Figure 12-16 WR-401 Radiometric vs. Assay % U3O8 Values ....................................... 12-14 Figure 12-17 WR-306 Radiometric vs. Assay % U3O8 Values ....................................... 12-15 Figure 12-18 WR-539 Radiometric vs. Assay % U3O8 Values ....................................... 12-15 Figure 14-1 Zones A and B Drill Hole Locations ............................................................. 14-3 Figure 14-2 Zone A Basement Drill Hole Locations......................................................... 14-4 Figure 14-3 Zone A Typical Cross Section with HG and LG Domains ............................. 14-7 Figure 14-4 Zone A Typical Cross Section with HG and LG Domains ............................. 14-8 Figure 14-5 Zone A Typical Cross Section with HG and LG Domains ............................. 14-9 Figure 14-6 Zone B Typical Cross Section with HG and LG Domains ........................... 14-10 Figure 14-7 Zone A-Basement Longitudinal Section ..................................................... 14-11 Figure 14-8 Logarithmic Plot of Dry Bulk Density Versus Uranium Grade ..................... 14-13 Figure 14-9 Dry Bulk Density Wax Versus Dry/Wet Methods ........................................ 14-13 Figure 14-10 Grade Composite Histograms for Zones A and B HG and LG Domains ... 14-16
www.rpacan.com
Page iv Denison Mines Corp. – Phoenix Deposit, Wheeler River Project, Project #2299 Technical Report NI 43-101 – June 17, 2014
Figure 14-11 Grade vs. Density Plots for Zones A and B HG and LG Domains ............ 14-17 Figure 14-12 Zone A 3D Block Model ........................................................................... 14-21 Figure 14-13 Zone A 3D HG Domain Block Model ........................................................ 14-22 Figure 14-14 Zone B Block Model Showing Inferred and Indicated Resources ............. 14-24 Figure 14-15 Indicated Mineral Resources Tonnes and Grade at Various Cut-off Grades ..... ....................................................................................................................................... 14-29
www.rpacan.com
Page 1-1 Denison Mines Corp. – Phoenix Deposit, Wheeler River Project, Project #2299 Technical Report NI 43-101 – June 17, 2014
1 SUMMARY EXECUTIVE SUMMARY Roscoe Postle Associates Inc. (RPA) was retained by Denison Mines Corp. (Denison) on
behalf of the Wheeler River Joint Venture to prepare an independent Technical Report on the
Phoenix uranium deposit. The purpose of this report is to support an updated Mineral
Resource estimate for the Phoenix deposit prepared by Denison and audited by RPA. The
Phoenix deposit is an Athabasca Basin unconformity-type uranium deposit. This report has
been prepared to conform to NI 43-101 Standards of Disclosure for Mineral Projects.
Denison is a Toronto-based mining company focused on uranium exploration and
development in Canada, Mongolia, Mali, Namibia, and Zambia. Denison is listed on the
Toronto Stock Exchange (symbol DML) and on the New York Stock Exchange MKT (symbol
DNN).
Denison owns 60% of the Wheeler River Joint Venture, Cameco Corporation owns 30%, and
JCU (Canada) Exploration Company Limited owns the remaining 10%. The Wheeler River
Property consists of 19 contiguous claims in northern Saskatchewan. Denison’s additional
assets include a 22.5% interest in the McClean Lake mill in Saskatchewan, one of three
licensed uranium mills in Canada.
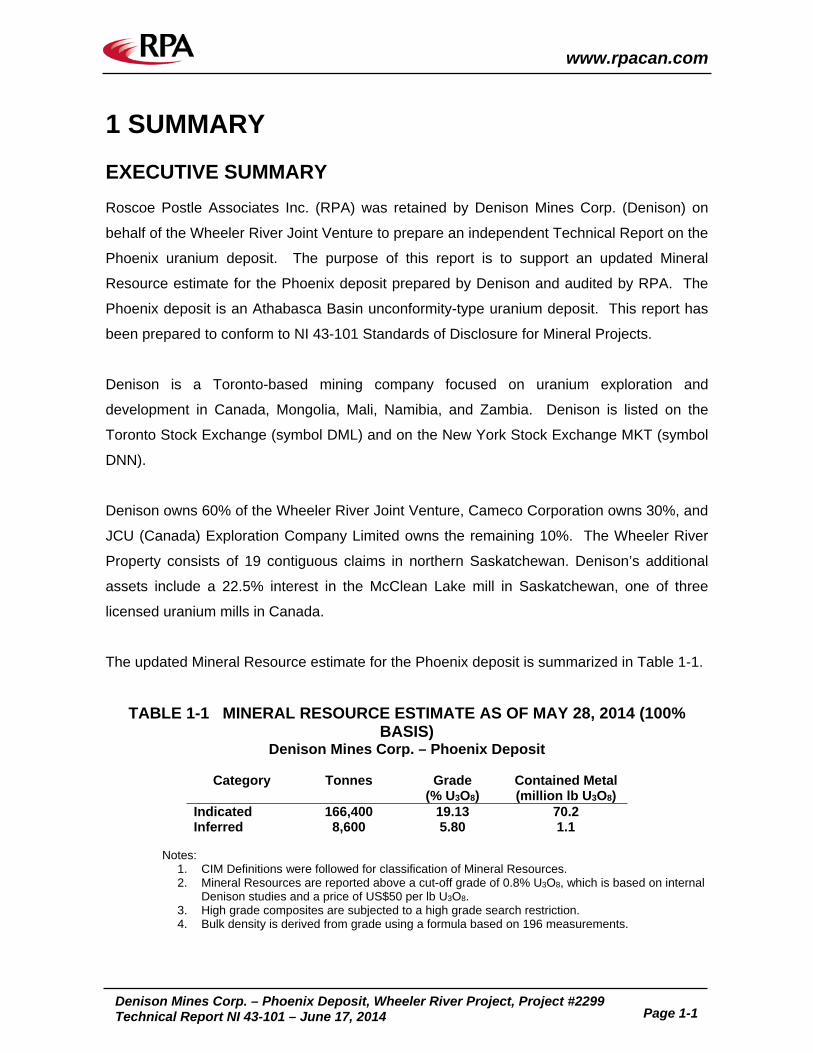
The updated Mineral Resource estimate for the Phoenix deposit is summarized in Table 1-1.
TABLE 1-1 MINERAL RESOURCE ESTIMATE AS OF MAY 28, 2014 (100% BASIS)
Denison Mines Corp. – Phoenix Deposit
Category Tonnes Grade (% U3O8)
Contained Metal (million lb U3O8)
Indicated 166,400 19.13 70.2 Inferred 8,600 5.80 1.1
Notes:
1. CIM Definitions were followed for classification of Mineral Resources. 2. Mineral Resources are reported above a cut-off grade of 0.8% U3O8, which is based on internal
Denison studies and a price of US$50 per lb U3O8. 3. High grade composites are subjected to a high grade search restriction. 4. Bulk density is derived from grade using a formula based on 196 measurements.
www.rpacan.com
Page 1-2 Denison Mines Corp. – Phoenix Deposit, Wheeler River Project, Project #2299 Technical Report NI 43-101 – June 17, 2014
CONCLUSIONS Drilling at the Wheeler River Property from 2008 to 2014 has discovered and delineated the
Phoenix uranium deposit at the intersection of the Athabasca sandstone basal unconformity
with a regional fault zone, the WS fault, and graphitic pelite basement rocks.
The Phoenix deposit consists of two separate lenses known as zone A and zone B located
approximately 400 m below surface within a one kilometre long, northeast trending
mineralized corridor. Both lenses contain a higher grade core within a lower grade
mineralized envelope and extend southeastward from the WS fault along the unconformity.
Some mineralization also occurs on the northwest side of the WS fault but commonly at a
slightly lower elevation.
In addition to the zones A and B, a new domain (zone A basement) of uranium mineralization
below and adjacent to zone A has been identified in basement rocks and included in this
report.
Mineral Resources for Phoenix, based on 196 diamond drill holes totalling 89,835 m, were
estimated by Denison and audited by RPA. Indicated Resources total 166,400 t at 19.13%
U3O8 containing 70.2 million lbs U3O8. Inferred Resources total 8,600 t at 5.80% U3O8
containing 1.1 million lbs U3O8.
In RPA’s opinion, a Preliminary Economic Assessment could be carried out on the Phoenix
deposit.
New uranium mineralization has recently been discovered at the Gryphon zone located three
kilometres northwest of the Phoenix deposit. Although intersected by only two drill holes to
date, the Gryphon discovery warrants considerable follow-up drilling in RPA’s view.
RECOMMENDATIONS The Wheeler River Joint Venture is planning a summer 2014 exploration program consisting
of a 14,000 m (20 hole) diamond drill program with two rigs beginning in June 2014. The
budget for this program is $3.6 million. Emphasis will be on following up the newly
discovered Gryphon zone mineralization in the K North target area as well as similar
geological targets along trend of Gryphon. A 3D DC-resistivity survey is also planned for the
www.rpacan.com
Page 1-3 Denison Mines Corp. – Phoenix Deposit, Wheeler River Project, Project #2299 Technical Report NI 43-101 – June 17, 2014
area north of the Phoenix deposit. RPA has reviewed and concurs with the Wheeler River
Joint Venture planned 2014 exploration program.
In addition to this work, RPA recommends that a Preliminary Economic Assessment be
considered at an estimated cost of approximately C$200,000.
If additional drill holes are completed at Phoenix, RPA recommends that Denison continue to
collect drill core density data to increase the confidence of estimated densities of the entire
grade range.
TECHNICAL SUMMARY
PROPERTY DESCRIPTION AND LOCATION The Phoenix deposit is located within the Wheeler River Property (the Property), which is
located in the eastern Athabasca Basin of northern Saskatchewan approximately 600 km
north of Saskatoon, 260 km north of La Ronge, and 110 km southwest of Points North
Landing, in northern Saskatchewan. The centre of the Property is located approximately 35
km north-northeast of the Key Lake mill and 35 km southwest of the McArthur River mine,
which are operated by Cameco Corporation (Cameco).
LAND TENURE The Wheeler River Property comprises 19 contiguous claims held as a Joint Venture among
Denison (60%), Cameco (30%), and JCU (Canada) Exploration Co. Ltd. (10%) with no back-
in rights or royalties that need to be paid.
ACCESS AND INFRASTRUCTURE Access to the Phoenix deposit is by road, helicopter, or fixed wing aircraft from Saskatoon.
Vehicle access to the Property is by Highway 914, which terminates at the Key Lake mill.
The ore haul road between the Key Lake and McArthur River operations traverses the
eastern part of the Property. An older access road, the Fox Lake Road, between Key Lake
and McArthur River provides access to most of the northwestern side of the Property. Gravel
and sand roads and drill trails provide access by either four-wheel-drive or all-terrain-vehicle
to the rest of the Property.
www.rpacan.com
Page 1-4 Denison Mines Corp. – Phoenix Deposit, Wheeler River Project, Project #2299 Technical Report NI 43-101 – June 17, 2014
La Ronge is the nearest commercial/urban center where most exploration supplies and
services can be obtained. Two airlines offer daily, scheduled flight services between
Saskatoon and La Ronge.
Field operations are currently conducted from Denison’s Wheeler River camp, three
kilometres southwest of the Phoenix deposit. The camp, which is operated by Denison,
provides accommodation for up to forty exploration personnel. Fuel and miscellaneous
supplies are stored in existing warehouse and tank facilities at the camp. The site generates
its own power. Abundant water is available from the numerous lakes and rivers in the area.
HISTORY The Wheeler River Property was staked on July 6, 1977, due to its proximity to the Key Lake
uranium discoveries, and was vended into an agreement on December 28, 1978 among
AGIP Canada Ltd. (AGIP), E&B Explorations Ltd. (E&B), and Saskatchewan Mining
Development Corporation (SMDC), with each holding a one-third interest. On July 31, 1984,
all parties divested a 13.3% interest and allowed Denison Mines Limited, a predecessor
company to Denison Mines Corp., to earn a 40% interest. On December 1, 1986, E&B
allowed PNC Exploration (Canada) Co. Ltd. (PNC) to earn a 10% interest from one-half of its
20% interest. In the early 1990s, AGIP sold its 20% interest to Cameco, which was a
successor to SMDC. In 1996, Imperial Metals Corporation, a successor to E&B, sold an 8%
interest to Cameco and a 2% interest to PNC. Participating interests in 2004 were Cameco
(48%), JCU (a successor to PNC, 12%), and Denison (40%).
In late 2004, Denison entered into an agreement to earn a further 20% interest by expending
$7 million within six years. In November 2004, Denison became the operator of the Wheeler
River Joint Venture. When the earn-in obligations were completed; the participating interests
were Denison-60%, Cameco-30%, and JCU-10%. Since November 2004, Denison has been
the project operator.
Except for the years 1990-1995, exploration activities comprising airborne and ground
geophysical surveys, geochemical surveys, prospecting and diamond drilling have been
carried out on the Wheeler River Property continuously from 1978 to present.
www.rpacan.com
Page 1-5 Denison Mines Corp. – Phoenix Deposit, Wheeler River Project, Project #2299 Technical Report NI 43-101 – June 17, 2014
GEOLOGY AND MINERALIZATION The Phoenix uranium deposit is located near the southeastern margin of the Athabasca
Basin in the southwest part of the Churchill Structural Province of the Canadian Shield. The
Athabasca Basin is a broad, closed and elliptically shaped, cratonic basin with dimensions of
425 km (east-west) by 225 km (north-south). The bedrock geology of the area consists of
Archean and Paleo-Proterozoic gneisses unconformably overlain by up to 1,500 m of flat-
lying, unmetamorphosed sandstones and conglomerates of the mid-Proterozoic Athabasca
Group. The Wheeler River Property is located near the transition zone between two
prominent litho-structural domains within the Precambrian basement; the Mudjatik Domain to
the west and the Wollaston Domain to the east.
The Wheeler River Property lies in the eastern part of the Athabasca Basin where
undeformed, late Paleoproterozoic to Mesoproterozoic sandstone, conglomerate, and
mudstone of the Athabasca Group unconformably overlie early Paleoproterozoic and
Archean crystalline basement rocks. The Phoenix deposit mineralization, generally occurring
at depths ranging from 390 m to 420 m, is interpreted to be structurally controlled by the
northeast-southwest trending (55º azimuth) WS shear fault which dips 55º to the southeast.
The local geology of the Wheeler River Property is consistent with the regional geology and
consists of the following units from top to bottom:
Quaternary Deposits: The Property is partially covered by lakes and muskeg, which overlie a complex succession of glacial deposits up to 120 m in thickness These include eskers and outwash sand plains, well-developed drumlins, till plains, and glaciofluvial plain deposits.
Athabasca Group: Little-deformed late Paleoproterozoic to Mesoproterozoic
Athabasca Group strata comprised of Manitou Falls Formation sandstones and conglomerates unconformably overlie the crystalline basement and have a thickness that varies from 170 m over the quartzite ridge to at least 560 m on the western side of the Property.
Basement Geology: Basement rocks at the Phoenix deposit are part of the Wollaston
Domain and are comprised of metasedimentary and granitoid gneisses. The metasedimentary rocks belong to the Wollaston Supergroup and include graphitic and non-graphitic pelitic and semipelitic gneisses, meta-quartzite, and rare calc-silicate rocks together with felsic and quartz feldspathic granitoid gneisses.
The Phoenix deposit is an Athabasca Basin unconformity-type uranium deposit. Uranium
mineralization is in the form of the oxide uraninite/pitchblende (UO2). Values of all
www.rpacan.com
Page 1-6 Denison Mines Corp. – Phoenix Deposit, Wheeler River Project, Project #2299 Technical Report NI 43-101 – June 17, 2014
accompanying metals are low, particularly in comparison with several sandstone-hosted
deposits, which can have very high values for Ni, Co, and As.
Alteration is typical unconformity-associated style, with a form and nature similar to other
Athabasca Basin deposits. The sandstones are altered for as much as 200 m above the
unconformity, and exhibit varying degrees of silicification and desilicification, as well as
dravitization, chloritization, and illitization. In addition, hydrothermal hematite and drusy
quartz are present in the sandstone and often in the basement rocks.
The mineralization in the Phoenix deposit occurs at the unconformity contact between
sandstone of the Athabasca group and underlying lower Proterozoic Wollaston Group
metasedimentary rocks. Mineralization and alteration have been traced over a strike length
of approximately one kilometre. Since the discovery hole WR-249 was drilled in 2008, 253
drill holes have reached the target depth, delineating two distinct zones (A and B) of high-
grade mineralization and the smaller Zone A basement.
EXPLORATION Following the discovery of the Phoenix deposit in 2008, Denison as operator of the Wheeler
River Joint Venture, completed additional geophysical surveys and drilling programs in each
of the years 2009, 2010, 2011, 2012, 2013, and 2014.
Geophysical surveys included 67.6 line-km of DC Resistivity/Induced Polarization in 2009,
76.2 km of ground EM surveying in 2010, and large amounts of additional DC/IP surveying in
each of 2011 (120.6 line-km) and 2012 (48.2 line-km).
Diamond drilling during the period 2009-2012 was primarily focussed on definition drilling at
the Phoenix deposit, but numerous holes were also completed on other targets on the
Wheeler River Property. Diamond drilling during the period 2013-2014 was primarily
focussed on exploration for additional lenses or deposits, but also included a component of
infill delineation drilling on zone A to move all of the 2012 Inferred Mineral Resource into the
indicated category, and to extend the higher grade portions of the deposit.
DRILLING Since 1978 a total of 575 diamond drill holes and 61 reverse circulation (RC) drill holes
totalling 377,187 m have been completed within the Wheeler River Property of which 253 drill
www.rpacan.com
Page 1-7 Denison Mines Corp. – Phoenix Deposit, Wheeler River Project, Project #2299 Technical Report NI 43-101 – June 17, 2014
holes totaling 117,822 m of diamond drilling have delineated the Phoenix trend. Of the 253
drill holes, 196 (141 at Zone A, 55 at Zone B) drill holes totaling 89,835 (64,491 m at Zone A,
25,344 m at Zone B) m have been completed over zone A and zone B. Well-established
drilling industry practices were used in the drilling programs.
During the most recent drill program from January to March 2014, 11 diamond drill holes
were completed at zone A.
All drill holes on the Wheeler River Property were logged with a radiometric probe to
measure the natural gamma radiation, from which an indirect estimate of uranium content
can be made. The gamma probes were calibrated and radiometric estimates of %U3O8 were
used in the drill hole database where core recovery was less than 80%, which involves
approximately 23% of the drill holes used for resource estimation. Well established drilling
industry practices were used in all of the drilling programs.
ANALYSES AND DATA VERIFICATION Drill core from the Phoenix deposit was photographed, logged, marked for sampling, split,
bagged, and sealed for shipment by Denison personnel at their field logging facility. All
samples for assay or geochemical analysis were transported by Denison personnel to the
Saskatchewan Research Council Geoanalytical Laboratories (SRC) in Saskatoon, SK.
Uranium analyses were carried out at SRC which is accredited by the Standards Council of
Canada as an ISO/IEC 17025 Laboratory for Mineral Analysis Testing and is also accredited
ISO/IEC 17025:2005 for the analysis of U3O8.
To compare results of two different analytical methods, at two separate laboratories, Denison
sent one in every 25 samples to the SRC’s Delayed Neutron Counting (DNC) laboratory, a
separate lab facility located at SRC Analytical Laboratories in Saskatoon.
Analytical standards were used to monitor analytical precision and accuracy, and field
standards were used as an independent monitor of laboratory performance. Six uranium
assay standards have been prepared for use in monitoring the accuracy and precision of
uranium assays received from the laboratory. Denison employed a lithological blank
composed of quartzite to monitor the potential for contamination during sampling,
processing, and analysis. Core duplicates were obtained by collecting a second sample of
the same material, through splitting the original sample, or other similar technique, and were
www.rpacan.com
Page 1-8 Denison Mines Corp. – Phoenix Deposit, Wheeler River Project, Project #2299 Technical Report NI 43-101 – June 17, 2014
submitted as an independent sample. Duplicates were typically collected at a minimum rate
of one per 20 samples in order to obtain a collection rate of 5%. In RPA’s opinion, the
sample preparation and analytical methods are standard in the industry. Results of the
quality assurance and data verification efforts demonstrate that the data are of sufficient
quality for Mineral Resource estimates.
MINERAL RESOURCES Denison has estimated Mineral Resources for the Phoenix deposit based on results of
several surface diamond drilling campaigns from 2008 to 2014. The Denison drill hole
database and Mineral Resource estimate have been audited by RPA. Table 1-1 summarizes
the Phoenix deposit Mineral Resource estimate, of which Denison’s share is 60%. The
effective date of the Mineral Resource estimate is May 28, 2014.
Denison has interpreted the geology, structure, and mineralization at Phoenix using data
from 196 diamond drill holes and developed three dimensional (3D) wireframe models which
represent 0.05% U3O8 grade envelopes. For both Zone A and zone B, the wireframes each
contain a higher grade (HG) domain within an envelope of lower grade material, resulting in
four main domains. A fifth domain has been added for the current estimate consisting of a
small zone of structurally controlled basement mineralization at the north end of zone A.
Based on 196 dry bulk density determinations, Denison developed a formula relating bulk
density to grade which was used to assign a density value to each assay. Bulk density
values were used to weight grades during the resource estimation process and to convert
volume to tonnage.
Composited uranium grade times density (GxD) values and density (D) values were
interpolated into each block model domain using an inverse distance squared (ID2) algorithm
for each mineralized domain. Domain boundaries were treated as hard boundaries, so that
composites from any given domain could not influence block grades in other domains. Very
high grade composites were not capped but grades greater than a designated threshold level
for each domain were subject to restricted search ellipse dimensions in order to reduce their
influence. Block grade was derived from the interpolated GxD value divided by the
interpolated D value for each block. Block tonnage was based on volume times the
interpolated D value.
www.rpacan.com
Page 1-9 Denison Mines Corp. – Phoenix Deposit, Wheeler River Project, Project #2299 Technical Report NI 43-101 – June 17, 2014
The Mineral Resources for the Phoenix deposit are classified as Indicated and Inferred
based on drill hole spacing and apparent continuity of mineralization.
The Phoenix deposit block models were validated by comparison of domain wireframe
volumes with block volumes, visual comparison of composite grades with block grades,
comparison of block grades with composite grades used to interpolate grades, and
comparison with estimation by a different method.
www.rpacan.com
Page 2-1 Denison Mines Corp. – Phoenix Deposit, Wheeler River Project, Project #2299 Technical Report NI 43-101 – June 17, 2014
2 INTRODUCTION Roscoe Postle Associates Inc. (RPA) was retained by Denison Mines Corp. (Denison) on
behalf of the Wheeler River Joint Venture to prepare an independent Technical Report on the
Phoenix uranium deposit. The purpose of this report is to support an updated Mineral
Resource estimate for the Phoenix deposit. Phoenix is an Athabasca Basin unconformity-
type uranium deposit. This report has been prepared to conform to NI 43-101 Standards of
Disclosure for Mineral Projects.
Denison is a Toronto-based mining company focused on uranium exploration and
development in Canada, Mongolia, Mali, Namibia, and Zambia. Denison is listed on the
Toronto Stock Exchange (symbol DML) and on the New York Stock Exchange MKT (symbol
DNN).
Denison owns 60% of the Wheeler River Joint Venture, Cameco Corporation owns 30%, and
JCU (Canada) Exploration Company Limited owns the remaining 10%. The Wheeler River
Project comprises 19 contiguous claims in northern Saskatchewan totalling 11,720 ha.
In addition, Denison has a 22.5% interest in the McClean Lake mill in Saskatchewan, one of
the three licensed conventional uranium mills in Canada. Denison’s primary exploration
properties are located in the eastern side of the Athabasca Basin, along the same geological
terrain that hosts all of Canada’s currently producing uranium mines, currently accounting for
16% of global production.
SOURCES OF INFORMATION This report was prepared by William Roscoe, Ph.D., P.Eng., Principal Geologist, RPA. Dr.
Roscoe last visited the Property on June 16, 2014 and held discussions with technical
personnel in RPA’s Toronto office on May 4, 2014.
All geological and sampling data were provided by Denison. Drilling and geological data
were generated during the period May 2005 to March 2014. All field activities are currently
managed by Denison.
www.rpacan.com
Page 2-2 Denison Mines Corp. – Phoenix Deposit, Wheeler River Project, Project #2299 Technical Report NI 43-101 – June 17, 2014
The following Denison personnel have contributed to the geological, geophysical,
environmental, and resource estimation sections of this technical report:
• Steve Blower, P.Geo., Vice President Exploration • Lawson Forand, P.Geo., Exploration Manager • Larry Petrie, MSc, P.Geo., Senior Geophysicist • Clark Gamelin, P.Geo., Senior Project Geologist • Chad Sorba, P.Geo., Senior Project Geologist
Specific activities completed were:
• Site visit and validation of data available for the resource estimate. • Determination of correlation between assays and radiometric logs used for U3O8
grade estimation. • Compilation of new Phoenix resource models. • Geological interpretation of mineralized zones. • Audit of drill hole database and assay certificates. • Mineral Resource estimation and classification. • Verification of Mineral Resource estimate.
William E. Roscoe, Ph.D., P.Eng., RPA Principal Geologist, was assisted in the review of the
Denison database and resource estimate by Mark Mathisen, C.P.G., RPA Senior Geologist.
Most of the Denison resource modelling was completed by Mark Mathisen while he was
Director – Project Resources for Denison Mines Services Corp., a subsidiary of Denison,
prior to his joining RPA in April 2014.
The documentation reviewed, and other sources of information, are listed in Section 27
References.
www.rpacan.com
Page 2-3 Denison Mines Corp. – Phoenix Deposit, Wheeler River Project, Project #2299 Technical Report NI 43-101 – June 17, 2014
LIST OF ABBREVIATIONS Units of measurement used in this report conform to the Metric system. All currency in this
report is Canadian dollars (C$) unless otherwise noted.
a annum kWh kilowatt-hour A ampere L litre bbl barrels Lb pound btu British thermal units L/s litres per second °C degree Celsius m metre C$ Canadian dollars M mega (million); molar cal calorie m2 square metre cfm cubic feet per minute m3 cubic metre cm centimetre µ micron cm2 square centimetre MASL metres above sea level d day µg microgram dia diameter m3/h cubic metres per hour dmt dry metric tonne mi mile dwt dead-weight ton min minute °F degree Fahrenheit µm micrometre ft foot Mm millimetre ft2 square foot Mph miles per hour ft3 cubic foot MVA megavolt-amperes ft/s foot per second MW megawatt g gram MWh megawatt-hour G giga (billion) oz Troy ounce (31.1035g) Gal Imperial gallon oz/st, opt ounce per short ton g/L gram per litre ppb part per billion Gpm Imperial gallons per minute ppm part per million g/t gram per tonne psia pound per square inch absolute gr/ft3 grain per cubic foot psig pound per square inch gauge gr/m3 grain per cubic metre RL relative elevation ha hectare s second hp horsepower st short ton hr hour stpa short ton per year Hz hertz stpd short ton per day in. inch t metric tonne in2 square inch tpa metric tonne per year J joule tpd metric tonne per day k kilo (thousand) US$ United States dollar kcal kilocalorie USg United States gallon kg kilogram USgpm US gallon per minute km kilometre V volt km2 square kilometre W watt km/h kilometre per hour wmt wet metric tonne kPa kilopascal wt% weight percent kVA kilovolt-amperes yd3 cubic yard kW kilowatt yr year
www.rpacan.com
Page 3-1 Denison Mines Corp. – Phoenix Deposit, Wheeler River Project, Project #2299 Technical Report NI 43-101 – June 17, 2014
3 RELIANCE ON OTHER EXPERTS This report has been prepared by Roscoe Postle Associates Inc. (RPA) for Denison Mines
Corp. The information, conclusions, opinions, and estimates contained herein are based on:
• Information available to RPA at the time of preparation of this report, • Assumptions, conditions, and qualifications as set forth in this report, and • Data, reports, and other information supplied by Denison Mines Corp. and other
third party sources.
For the purpose of this report, RPA has relied on ownership information provided by Denison
Mines Corp. RPA has not researched property title or mineral rights for the Wheeler River
Project and expresses no opinion as to the ownership status of the property.
Except for the purposes legislated under provincial securities laws, any use of this report by
any third party is at that party’s sole risk.
www.rpacan.com
Page 4-1 Denison Mines Corp. – Phoenix Deposit, Wheeler River Project, Project #2299 Technical Report NI 43-101 – June 17, 2014
4 PROPERTY DESCRIPTION AND LOCATION PROPERTY LOCATION The Phoenix deposit is located within the Wheeler River Property, which is located in the
eastern Athabasca Basin of northern Saskatchewan approximately 600 km north of
Saskatoon, 260 km north of La Ronge and 110 km southwest of Points North Landing, in
northern Saskatchewan (Figure 4-1). The centre of the Property is located approximately 35
km northeast of the Key Lake mill and 35 km southwest of the McArthur River mine, which
are operated by Cameco Corporation (Cameco). The Property straddles the boundaries of
NTS map sheets 74H-5, 6, 11 and 12. The UTM coordinates of the approximate centre of
the Property are 475,000E and 6,370,000N (NAD83, Zone 13N).
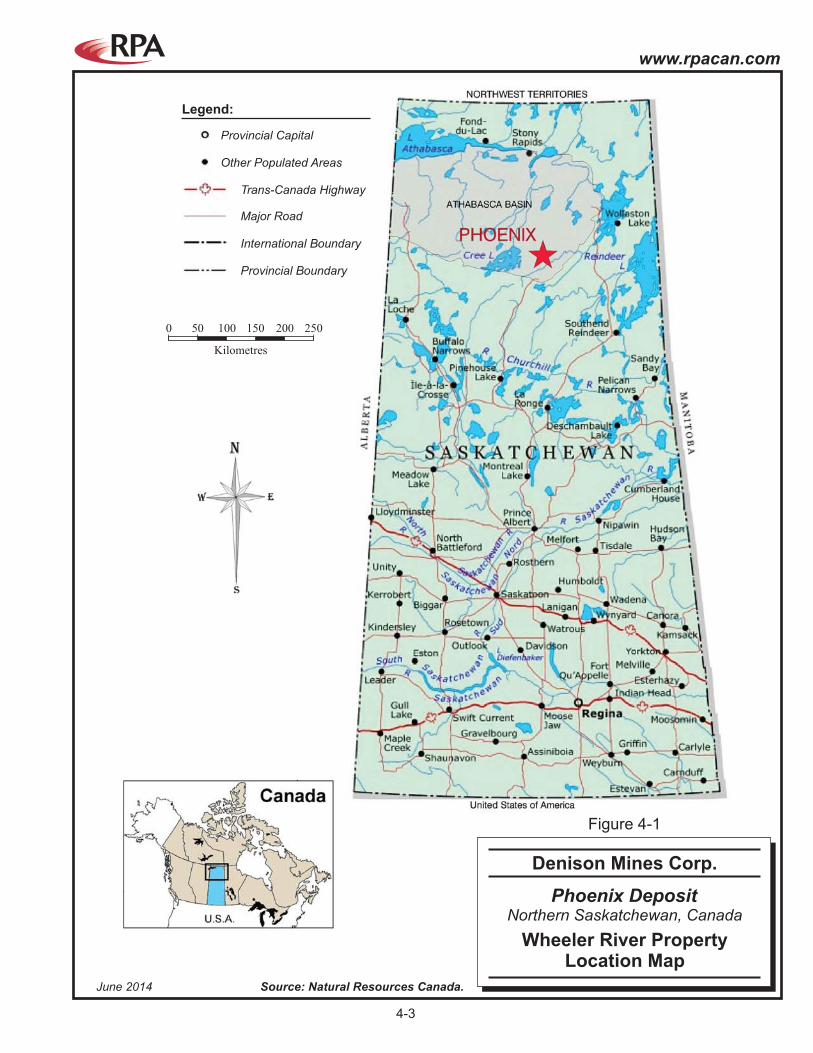
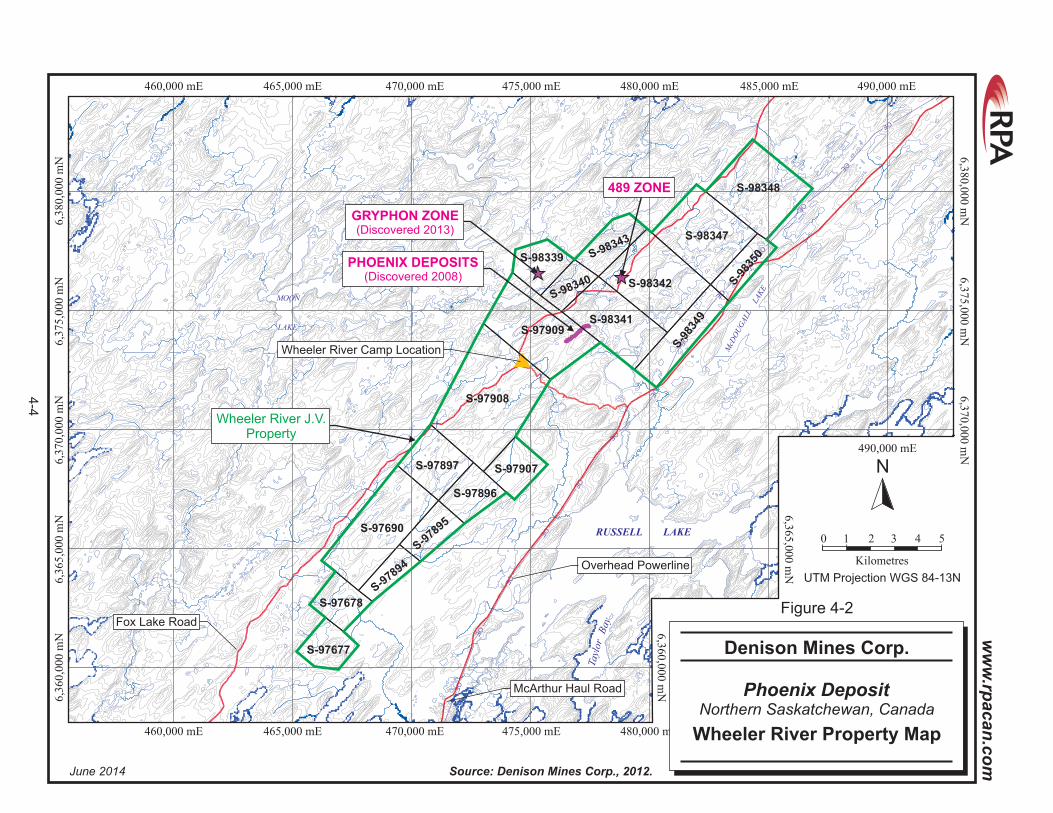
LAND TENURE Wheeler River comprises 19 contiguous claims held as a Joint Venture among Denison
(60%), Cameco (30%), and JCU (Canada) Exploration Co. Ltd. (10%) with no back-in rights
or royalties that need to be paid. The claims are shown in Figure 4-2 and listed in Table 4-1.
Denison has been the operator of the Property since November 10, 2004.
RPA is not aware of any other significant factors or risks that may affect access, title, or the
right or ability to perform work on the property.

www.rpacan.com
Page 4-2 Denison Mines Corp. – Phoenix Deposit, Wheeler River Project, Project #2299 Technical Report NI 43-101 – June 17, 2014
TABLE 4-1 LAND TENURE DETAILS Denison Mines Corp. – Phoenix Deposit
Disposition # Hectares Annual
Assessment ($)
Excess Credit ($)
Years Protected
S-97677 322 8,050 161,000 20 S-97678 335 8,375 167,500 20 S-97690 1,087 27,175 543,500 20 S-97894 246 6,150 123,000 20 S-97895 314 7,850 157,000 20 S-97896 356 8,900 178,000 20 S-97897 524 13,100 262,000 20 S-97907 352 8,800 176,000 20 S-97908 1,619 40,475 809,500 20 S-97909 1,036 25,900 518,000 20 S-98339 362 9,050 181,000 20 S-98340 250 6,250 125,000 20 S-98341 802 20,050 401,000 20 S-98342 1,016 25,400 508,000 20 S-98343 362 9,050 181,000 20 S-98347 939 23,475 469,500 20 S-98348 951 23,775 475,500 20 S-98349 540 13,500 270,000 20 S-98350 307 7,675 153,500 20
Provincial Capital
Legend:
Trans-Canada Highway
Other Populated Areas
Major Road
International Boundary
Provincial Boundary
0 50 250
Kilometres
100 150 200
June 2014 Source: Natural Resources Canada.
Phoenix Deposit
Wheeler River PropertyLocation Map
Denison Mines Corp.
Northern Saskatchewan, Canada
Figure 4-1
4-3
www.rpacan.com
S-98343
S-98340
S-98341
S-9
8349
S-98342
S-98347
S-9
8350
S-98348
S-97896
S-97897 S-97907
S-97908
S-97909
S-98339
S-97678
S-97677
S-97894
S-97690
S-97895
465,000 mE 485,000 mE480,000 mE475,000 mE470,000 mE 490,000 mE6,3
75,0
00 m
N6,3
80,0
00 m
N
6,3
65,0
00 m
N
6,3
70,0
00 m
N
6,3
60,0
00 m
N
6,3
75,0
00 m
N6,3
80,0
00 m
N6,3
65,0
00 m
N6,3
70,0
00 m
N6,3
60,0
00 m
N
490,000 mE
460,000 mE
465,000 mE 480,000 mE475,000 mE470,000 mE460,000 mE
Wheeler River Camp Location
Overhead Powerline
Fox Lake Road
McArthur Haul Road
Wheeler River J.V.Property
PHOENIX DEPOSITS(Discovered 2008)
GRYPHON ZONE(Discovered 20 )13
LAKE
Tayl
or
Bay
McD
OU
GA
LL
LA
KE
MOON
LAKE
RUSSELL
489 ZONE
0 1
Kilometres
UTM Projection WGS 84-13N
2 3 4 5
N
June 2014 Source: Denison Mines Corp., 2012.
Phoenix Deposit
Wheeler River Property Map
Denison Mines Corp.
Northern Saskatchewan, Canada
Figure 4-2
4-4
ww
w.rp
acan
.co
m
www.rpacan.com
Page 5-1 Denison Mines Corp. – Phoenix Deposit, Wheeler River Project, Project #2299 Technical Report NI 43-101 – June 17, 2014
5 ACCESSIBILITY, CLIMATE, LOCAL RESOURCES, INFRASTRUCTURE AND PHYSIOGRAPHY ACCESSIBILITY Access to the Phoenix deposit is by road, helicopter, or fixed wing aircraft from Saskatoon.
Vehicle access to the Property is by Highway 914, which terminates at the Key Lake mill.
The ore haul road between the Key Lake and McArthur River operations lies within the
eastern part of the Property. An older access road, the Fox Lake Road, between Key Lake
and McArthur River provides access to most of the northwestern side of the Property. Gravel
and sand roads and drill trails provide access by either four-wheel-drive or all-terrain-vehicle
to the rest of the Property.
CLIMATE The climate is typical of the continental sub-arctic region of northern Saskatchewan, with
temperatures ranging from +32°C in summer to -45°C in winter. Winters are long and cold,
with mean monthly temperatures below freezing for seven months of the year. Winter snow
pack averages 70 cm to 90 cm. Field operations are possible year round with the exception
of limitations imposed by lakes and swamps and the periods of break-up and freeze-up.
Freezing of surrounding lakes, in most years, begins in November and breakup occurs
around the middle of May. The average frost-free period is approximately 90 days.
Average annual total precipitation for the region is approximately 450 mm, of which 70% falls
as rain, with more than half occurring from June to September. Snow may occur in all
months but rarely falls in July or August. The prevailing annual wind direction is from the
west with a mean speed of 12 km/hr.
LOCAL RESOURCES AND INFRASTRUCTURE La Ronge is the nearest commercial/urban centre where most exploration supplies and
services can be obtained. Two airlines offer daily, scheduled flight services between
Saskatoon and La Ronge (located approximately 600 km and 260 km respectively, south of
www.rpacan.com
Page 5-2 Denison Mines Corp. – Phoenix Deposit, Wheeler River Project, Project #2299 Technical Report NI 43-101 – June 17, 2014
the project site). Most company employees are on a two week-in and two week-off schedule.
Contractor employees are generally on a longer work schedule.
As noted previously, the Phoenix deposit is well located with respect to all weather roads and
the provincial power grid. Most significantly, the operating Key Lake mill complex, owned
and operated by Cameco is approximately 35 km south of the Property.
Field operations are currently conducted from Denison’s Wheeler River camp, three
kilometres southwest of Phoenix (Figure 4-2). The camp, which is operated by Denison,
provides accommodations for up to forty exploration personnel. Fuel and miscellaneous
supplies are stored in existing warehouse and tank facilities at the camp. The site generates
its own power. Abundant water is available from the numerous lakes and rivers in the area.
PHYSIOGRAPHY The Property is characterized by a relatively flat till plain with elevations ranging from 477 m
to 490 m above sea level (MASL). Throughout the area, there is a distinctive northeasterly
trend to landforms resulting from the passage of Pleistocene glacial ice from the northeast to
the southwest. The topography and vegetation at Phoenix are typical of the taiga forested
land common to the Athabasca Basin area of northern Saskatchewan.
The area is covered with 30 m to 50 m of overburden. The terrain is gently rolling and
characterized by forested sand and dunes. Vegetation is dominated by black spruce and
jack pine, with occasional small stands of white birch occurring in more productive and well-
drained areas. Lowlands are generally well drained, but also can contain some muskeg and
poorly drained bog areas with vegetation varying from wet, open, non-treed vistas to variable
density stands of primarily black spruce as well as tamarack depending on moisture and soil
conditions. Lichen growth is common in this boreal landscape mostly associated with mature
coniferous stands and bogs.
www.rpacan.com
Page 6-1 Denison Mines Corp. – Phoenix Deposit, Wheeler River Project, Project #2299 Technical Report NI 43-101 – June 17, 2014
6 HISTORY OWNERSHIP The Wheeler River Property was staked on July 6, 1977, due to its proximity to the Key Lake
uranium discoveries, and was vended into an agreement on December 28, 1978 among
AGIP Canada Ltd. (AGIP), E&B Explorations Ltd. (E&B), and Saskatchewan Mining
Development Corporation (SMDC), with each holding a one-third interest. On July 31, 1984,
all parties divested a 13.3% interest and allowed Denison Mines Limited, a predecessor
company to Denison Mines Corp., to earn a 40% interest. On December 1, 1986, E&B
allowed PNC Exploration (Canada) Co. Ltd. (PNC) to earn a 10% interest from one-half of its
20% interest. In the early 1990s, AGIP sold its 20% interest to Cameco, which was a
successor to SMDC. In 1996, Imperial Metals Corporation, a successor to E&B, sold an 8%
interest to Cameco and a 2% interest to PNC. Participating interests in 2004 were Cameco-
48%, JCU-12% (a successor to PNC), and Denison-40%.
In late 2004, Denison entered into an agreement to earn a further 20% interest by expending
$7 million within six years. In November 2004, Denison became the operator of the Wheeler
River Joint Venture. When the earn-in obligations were completed; the participating interests
were Denison-60%, Cameco-30%, and JCU-10%. Since November 2004, Denison has been
the project operator.
EXPLORATION AND DEVELOPMENT HISTORY Except for the years 1990-1994, exploration activities comprising airborne and ground
geophysical surveys, geochemical surveys, prospecting and diamond drilling have been
carried out on the Wheeler River Property continuously from 1978 to present.
Subsequent to the discovery of the Key Lake mine in 1975 and 1976, the Key Lake
exploration model (Dahlkamp and Tan 1977) has emphasized the spatial association
between uranium deposition at, immediately above, or immediately below the unconformity
with graphitic pelite units in the basement subcrop under the basal Athabasca sandstone.
The graphitic pelite units are commonly intensely sheared and are highly conductive in
contrast to the physically more competent adjoining rock types that include semipelite,
www.rpacan.com
Page 6-2 Denison Mines Corp. – Phoenix Deposit, Wheeler River Project, Project #2299 Technical Report NI 43-101 – June 17, 2014
psammite, meta-arkose, or granitoid gneiss. From the late 1970s to the present, the Key
Lake model has been useful in discovering blind uranium deposits throughout the Athabasca
Basin (Jefferson, et al. 2007); although it is worth noting that the vast majority of
electromagnetic (EM) conductors are unmineralized.
Following the Key Lake exploration model, EM techniques were the early geophysical
methods of choice for the Wheeler River Property area during the period 1978-2004 and over
152 line-kilometres of conductors have been delineated on the Property. These conductive
units have been delineated to depths of 1,000 m, through the quartz-rich Athabasca Group
sandstones that are effectively transparent from an EM perspective.
These conductors or conductor systems were assigned a unique designation and follow-up
exploration drilling successfully identified several zones of uranium mineralization.
In 1982 AGIP discovered the MAW Zone. This alteration system contains rare earth element
(REE) mineralization in a structurally disrupted zone which extends from the unconformity to
the present surface. There is no evidence of uranium mineralization. The REE mineralization
contains yttrium values greater than 2.0%, boron values up to 2.5%, and total rare earth
oxide (REO) up to 8.1%.
In 1986 SMDC intersected uranium mineralization associated with Ni-Co-As sulphides at the
unconformity in the M Zone (DDH ZM-10, 0.79% U3O8 over 5.75 m), and also discovered
uranium mineralization at the O Zone. O Zone mineralization is associated with a 72 m
vertical unconformity offset. The O Zone basement-hosted mineralization grades 0.048%
U3O8 over 0.9 m at 378.8 m in drill hole ZO-02.
In 1988 Cameco intersected weak basement-hosted mineralization in two holes in the K
Zone. Drill hole ZK-04 reported 0.08% U3O8 over 2.4 m at 580.0 m and 0.19% U3O8 over 2.3
m at 587.7 m, and drill hole ZK-06 returned 0.17% U3O8 over 7.7 m at 532.0 m and 0.06%
U3O8 over 4.4 m at 564.6 m.
From 1995 to 1997, exploration by Cameco identified strong alteration and illitic and dravitic
geochemical enrichment associated with major structures in both the sandstone and the
basement and a significant unconformity offset associated with the “quartzite ridge” which
had been delineated as a result of drilling the Q conductor system.
www.rpacan.com
Page 6-3 Denison Mines Corp. – Phoenix Deposit, Wheeler River Project, Project #2299 Technical Report NI 43-101 – June 17, 2014
In 1998, further drilling was carried out at the Q Zone and also at the R Zone (the Phoenix
deposit area). At the latter, two drill holes were abandoned in sandstone due to quartz
dissolution (desilicification). The possibility that this sandstone alteration might be of
significance was not emphasized at the time.
In 1999, a geological setting similar to McArthur River’s P2 trend was intersected at the WC
Zone, where faulted graphite-pyrite pelitic gneiss overlay the quartzite ridge. The former
operator (Cameco) noted extensive dravite (boron) alteration in the overlying sandstones.
In 2002, drill hole WR-185 intersected a 175 m unconformity offset along the west contact of
the quartzite ridge. This area was the initial focus of the Wheeler River Joint Venture after
Denison became operator in 2004.
In 2003, 61 shallow reverse circulation holes were drilled, targeting the
sandstone/overburden interface exploring for alteration zones in the upper sandstone. No
anomalies were detected. Drill hole WR-190A tested the WS UTEM conductor and was
abandoned at 364 m due to deteriorating drilling conditions. This drill hole is located only 90
m from the eventual Phoenix discovery drill hole WR-249. Noticeable desilicification and
bleaching of the sandstone were present, but no noteworthy geochemical anomalies were
identified. A direct current (DC) resistivity survey was also completed to map trends of
alteration within the Athabasca sandstones and underlying basement rocks that might be
related to uranium mineralization.
In November 2004, Denison became operator of the Wheeler River Joint Venture and in
2005 carried out property-wide airborne Fugro GEOTEM and Falcon Gravity surveys with
five subsequent ground TEM grids completed on GEOTEM anomalies. The focus for
Denison, based on a McArthur River analogy, was the quartzite ridge, particularly the west,
or footwall side of the ridge. Several small regional campaigns were carried out to test EM
conductors located by airborne and ground geophysical surveys.
Although 2007 drilling on various 2003 resistivity anomalies did not discover any significant
uranium mineralization, there was some support for the concept that resistivity did “map”
alteration chimneys within the Athabasca sandstone. Alteration chimneys in the Athabasca
sandstone above the unconformity or basement-hosted uranium mineralization have been
described from almost all Athabasca Basin uranium deposits, following the first thorough
www.rpacan.com
Page 6-4 Denison Mines Corp. – Phoenix Deposit, Wheeler River Project, Project #2299 Technical Report NI 43-101 – June 17, 2014
description of their occurrence at the McClean deposits (Saracoglu, et al. 1983) (Wallis, et al.
1984). The chimneys nearly always have a prominent structural component consisting of
broken and rotated sandstone and a high degree of fracturing and brecciation. These
structural features are accompanied by alteration consisting of variable amounts of bleaching
(removal of diagenetic hematite), silicification, desilification, druzy quartz-lined fractures,
secondary hematite, dravite, and/or clay minerals which can cause resistivity anomalies.
In 2007 a 154.8 line-km geophysical IP and MT survey using Titan 24 DC resistivity
technology was undertaken with the prime goals being the extension of Cameco’s 2003
resistivity survey, surveying of the K and M zones and exploration of the REa or “Millennium”
(WS zone) zone, which appeared to have attractive geological features in an underexplored
part of the Property. The results showed the following:
• A very strong resistivity high which delineated the quartzite unit.
• Two strong, well defined resistivity lows both occurring in areas where previous drill holes had been lost in the Athabasca sandstone.
• Well defined resistivity chimneys.
During the winter and spring of 2008, the North Grid resistivity survey data was reinterpreted
and three drill targets, A, B, and C were proposed. These targets were well defined
alteration or resistivity chimneys situated close to the hanging wall of the quartzite unit in
areas where previous attempts to drill ground EM conductors (the WS and the REA) had
failed to reach the unconformity.
Drill hole WR-249 in 2008 is considered to be the discovery hole for the Phoenix deposit.
Subsequent drilling has identified four mineralized zones over a strike length of more than
one kilometre: Phoenix zones A and B, plus the Phoenix C and D target areas. Drilling on
the Phoenix deposit is described in Section 10.
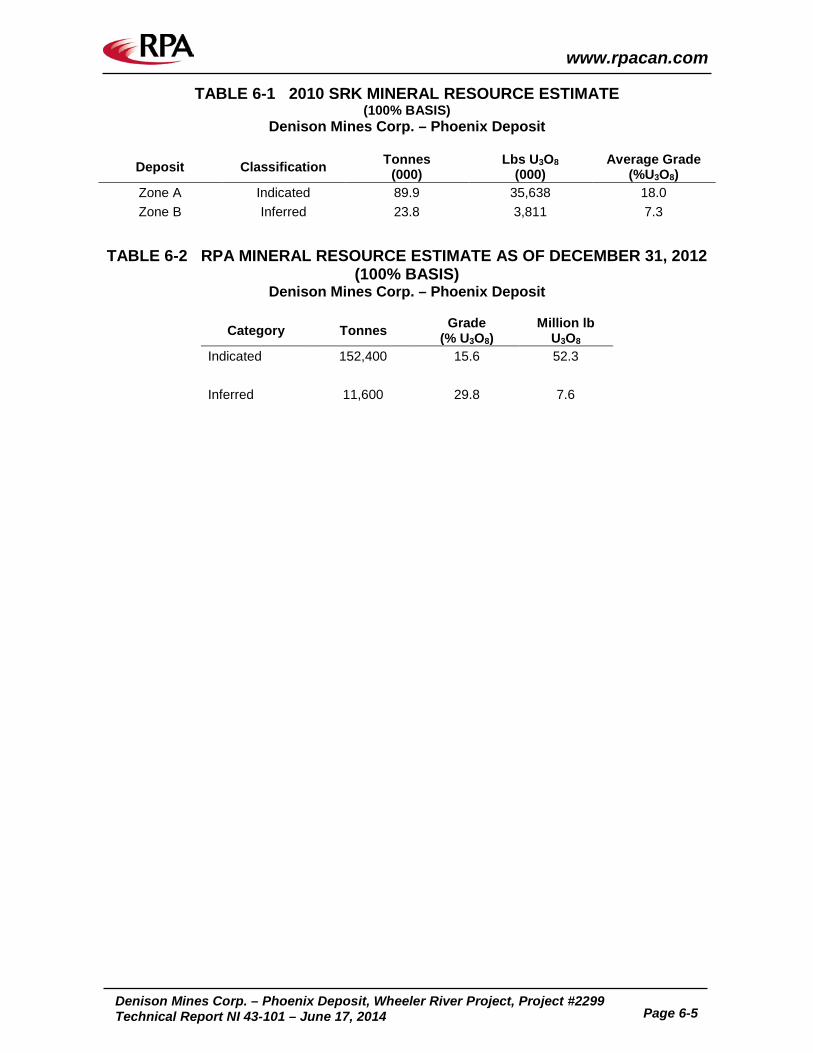
An initial Mineral Resource estimate was reported for the Phoenix deposit in a NI 43-101
Technical Report by SRK Consulting (Canada) Inc. (SRK) dated November 17, 2010 (Table
6-1). An updated Mineral Resource estimate for the Phoenix deposit zones A and B was
prepared by RPA on December 31, 2012 (Table 6-2). Both previous Mineral Resource
estimates are superseded by the Mineral Resource described in this report, which
incorporates additional drilling since 2012.
www.rpacan.com
Page 6-5 Denison Mines Corp. – Phoenix Deposit, Wheeler River Project, Project #2299 Technical Report NI 43-101 – June 17, 2014
TABLE 6-1 2010 SRK MINERAL RESOURCE ESTIMATE (100% BASIS)
Denison Mines Corp. – Phoenix Deposit
Deposit Classification Tonnes (000)
Lbs U3O8 (000)
Average Grade (%U3O8)
Zone A Indicated 89.9 35,638 18.0 Zone B Inferred 23.8 3,811 7.3
TABLE 6-2 RPA MINERAL RESOURCE ESTIMATE AS OF DECEMBER 31, 2012 (100% BASIS)
Denison Mines Corp. – Phoenix Deposit
Category Tonnes Grade (% U3O8)
Million lb U3O8
Indicated 152,400 15.6 52.3
Inferred 11,600 29.8 7.6
www.rpacan.com
Page 7-1 Denison Mines Corp. – Phoenix Deposit, Wheeler River Project, Project #2299 Technical Report NI 43-101 – June 17, 2014
7 GEOLOGICAL SETTING AND MINERALIZATION Portions of the following geological descriptions are taken from internal Denison reports of
2009 to 2014.
REGIONAL GEOLOGY
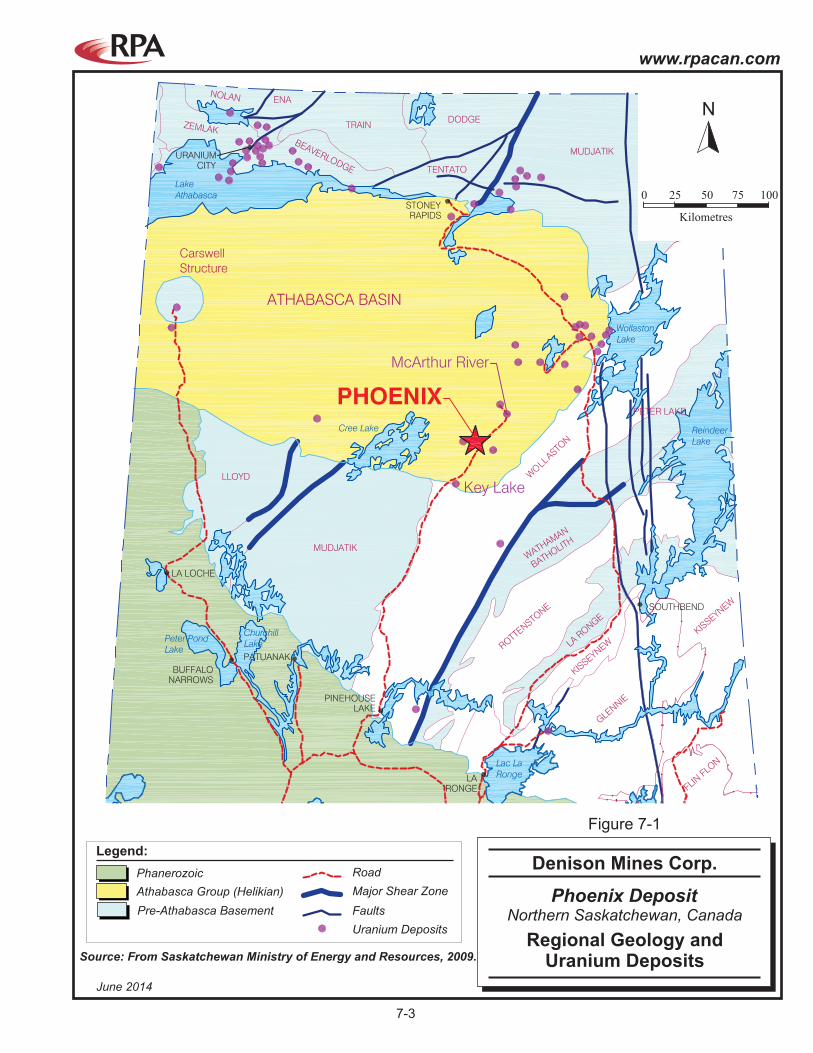
GENERAL The Phoenix uranium deposit is located near the southeastern margin of the Athabasca
Basin in the southwest part of the Churchill Structural Province of the Canadian Shield
(Figure 7-1). The Athabasca Basin is a broad, closed, and elliptically shaped, cratonic basin
with an area of 425 km (east-west) by 225 km (north-south). The bedrock geology of the
area consists of Archean and Paleo-Proterozoic gneisses unconformably overlain by up to
1,500 m of flat-lying, unmetamorphosed sandstones and conglomerates of the mid-
Proterozoic Athabasca Group. The Wheeler River project is located near the transition zone
between two prominent litho-structural domains within the Precambrian basement, the
Mudjatik Domain to the west and the Wollaston Domain to the east.
The Mudjatik Domain is characterized by elliptical domes of Archean granitoid orthogenesis
separated by keels of metavolcanic and metasedimentary rocks, whereas Wollaston Domain
is characterized by tight to isoclinal, northeasterly trending, doubly plunging folds developed
in Paleoproterozoic metasedimentary rocks of the Wollaston Supergroup (Yeo and Delaney
2007), which overlie Archean granitoid orthogenesis identical to those of Mudjatik Domain.
The area is cut by a major northeast-striking fault system of Hudsonian Age. The faults
occur predominantly in the basement rocks but often extend up into the Athabasca Group
due to several periods of post-depositional movement. Diabase sills and dikes up to 100 m
in width and frequently associated with the faulting have intruded into both the Athabasca
rocks and the underlying basement.
www.rpacan.com
Page 7-2 Denison Mines Corp. – Phoenix Deposit, Wheeler River Project, Project #2299 Technical Report NI 43-101 – June 17, 2014
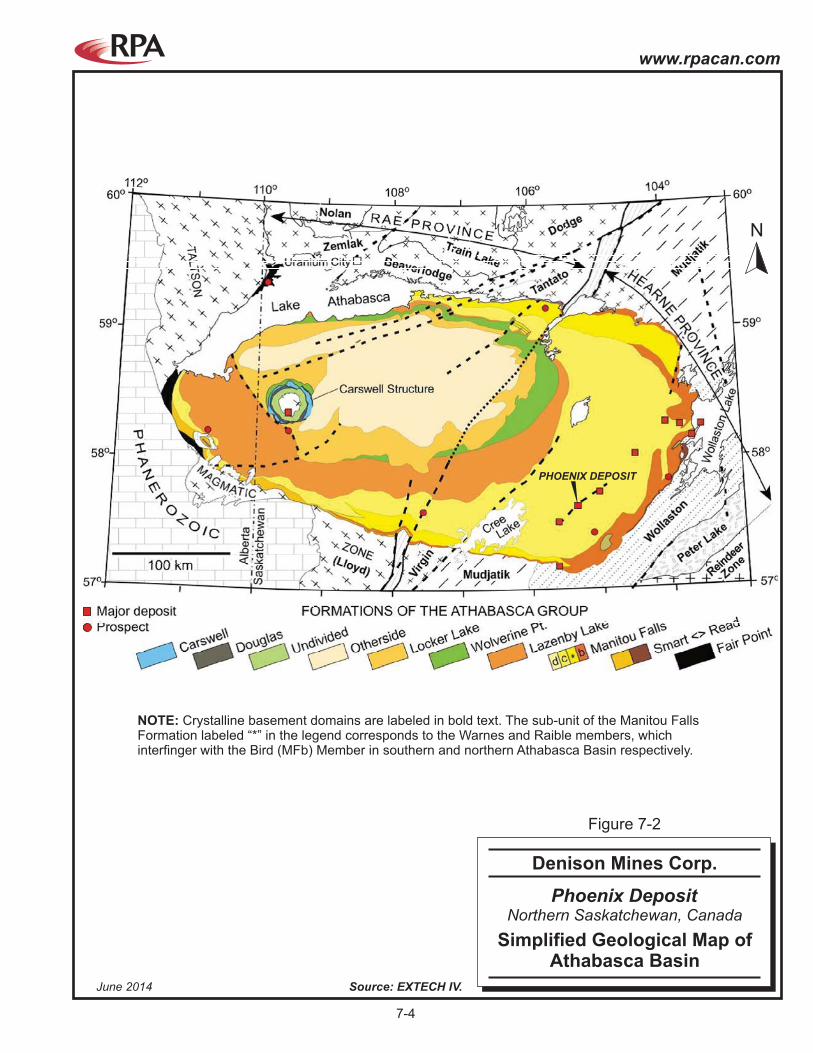
THE METAMORPHOSED BASEMENT The basement rocks underlying the Athabasca Group have been divided into three tectonic
domains: the Western Craton, the Cree Lake Mobile Zone, and the Rottenstone Complex
(Figures 7-1 and 7-2). The central Cree Lake Mobile Zone is bounded in the northwest by
the Virgin River Shear and Black Lake fault and in the southeast by the Needle Falls Shear
Zone.
The Cree Lake Mobile Zone has been further subdivided into the Mudjatik Domain in the
west half and the Wollaston Domain in the east half. The lithostructural character of these
domains is the result of the Hudsonian Orogeny in which an intense thermo-tectonic period
remobilized the Archean age rocks and led to intensive folding of the overlying Aphebian-age
supracrustal metasedimentary units. The Mudjatik domain represents the orogenic core and
comprises non-linear, felsic, granitoid to gneissic rocks surrounded by subordinate thin
gneissic supracrustal units. These rocks, which have reached granulite-facies metamorphic
grades, usually occur as broad domal features. The adjacent Wollaston Domain consists of
Archean granitoid gneisses overlain by an assemblage of Aphebian pelitic, semipelitic, and
arkosic gneisses, with minor interlayered calc-silicate rocks and quartzites. These rocks are
overlain by an upper assemblage of semipelitic and arkosic gneisses with magnetite bearing
units.
The Wollaston Domain basement rocks are unconformably overlain by flat lying,
unmetamorphosed sandstones, and conglomerates of the Helikian age Athabasca Group,
which is a major aquifer in the area.
THE ATHABASCA GROUP The Athabasca Group sediments consist of unmetamorphosed pink to maroon quartz-rich
pebbly conglomerate and red siltstone of the Read Formation and maroon quartz pebble
conglomerate, maroon to white pebbly sandstone, sandstone and clay-clast-bearing
sandstone belonging to the Manitou Falls Formation. The sandstone is poorly sorted near
the base, where conglomerates form discontinuous layers of variable thickness. Minor shale
and siltstone occur in the upper half of the succession. Locally, the rocks may be silicified
and indurated or partly altered to clay and softened. In spite of their simple composition,
their diagenetic history is complex (Jefferson et al. 2007). The predominant regional
background clay is dickite.
Phanerozoic
Legend:
Pre-Athabasca Basement
Athabasca Group (Helikian)
Road
Major Shear Zone
Faults
Uranium Deposits
0 25
Kilometres
50 75 100
N
Source: From Saskatchewan Ministry of Energy and Resources, 2009.
June 2014
Phoenix Deposit
Regional Geology andUranium Deposits
Denison Mines Corp.
Northern Saskatchewan, Canada
Figure 7-1
7-3
www.rpacan.com
PHOENIX DEPOSIT
N
June 2014 Source: EXTECH IV.
NOTE: Crystalline basement domains are labeled in bold text. The sub-unit of the Manitou FallsFormation labeled “*” in the legend corresponds to the Warnes and Raible members, whichinterfinger with the Bird (MFb) Member in southern and northern Athabasca Basin respectively.
Phoenix Deposit
Simplified Geological Map ofAthabasca Basin
Denison Mines Corp.
Northern Saskatchewan, Canada
Figure 7-2
7-4
www.rpacan.com

www.rpacan.com
Page 7-5 Denison Mines Corp. – Phoenix Deposit, Wheeler River Project, Project #2299 Technical Report NI 43-101 – June 17, 2014
The basin is interpreted to have developed from a series of early northeast-trending fault-
bounded sub-basins that coalesced. The topographic profile of the unconformity suggests a
gentle inward slope in the east, moderate to steep slopes in the north and south and a
steeper slope in the west.
The Manitou Falls Formation, which underlies most of the eastern part of the basin (Figure 7-
2), is further subdivided into four members from bottom to top:
• Read Formation (formerly the MFa Member) - a sequence of poorly sorted sandstone and minor conglomerate;
• Bird Member (MFb) - interbedded sandstone and conglomerate distinguished from
the underlying MFa and overlying MFc by the presence of at least 1% to 2% conglomerate in beds thicker than 2 cm;
• Collins Member (MFc) - a sandstone with rare clay intraclasts;
• Dunlop Member (MFd) - a fine-grained sandstone with abundant (>1%) clay
intraclasts.
QUATERNARY DEPOSITS In the eastern Athabasca Basin, Quaternary glacial deposits up to 100 m thick drape bedrock
topography of ridges, typically associated with granitic gneiss domes, and structurally
controlled valleys (Campbell 2007). At least three tills, locally separated by stratified gravel,
sand, and silt, can be distinguished. The dominant ice-flow direction was southwesterly, but
a late glacial re-advance was southerly in eastern parts of the basin and westerly along its
northern edge.
LOCAL AND PROPERTY GEOLOGY The Wheeler River Property lies in the eastern part of the Athabasca Basin where
undeformed, late Paleoproterozoic to Mesoproterozoic sandstone, conglomerate, and
mudstone of the Athabasca Group unconformably overlie early Paleoproterozoic and
Archean crystalline basement rocks. Mineralization at Phoenix generally occurs at depths
ranging from 390 m to 420 m and is interpreted to be structurally controlled by the northeast-
southwest trending (055º azimuth) WS fault which dips 55º to the southeast.
The local geology of the Wheeler River Property is very much consistent with the regional
geology described above with the following units from top to bottom.
www.rpacan.com
Page 7-6 Denison Mines Corp. – Phoenix Deposit, Wheeler River Project, Project #2299 Technical Report NI 43-101 – June 17, 2014
QUATERNARY DEPOSITS The Property is partially covered by lakes and muskeg, which overlie a complex succession
of glacial deposits up to 120 m in thickness These include eskers and outwash sand plains,
well-developed drumlins, till plains, and glaciofluvial plain deposits (Campbell 2007). The
orientation of the drumlins reflects southwesterly ice flow.
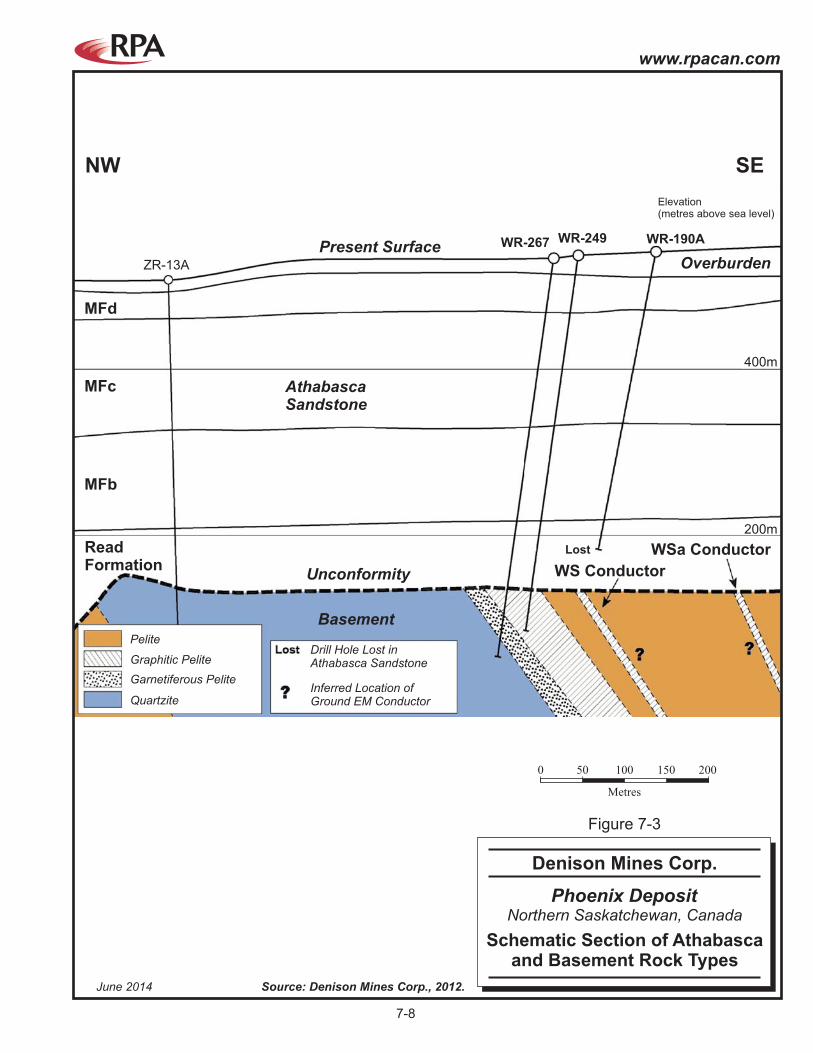
ATHABASCA GROUP Little-deformed late Paleoproterozoic to Mesoproterozoic Athabasca Group strata comprised
of Manitou Falls Formation sandstones and conglomerates unconformably overlie the
crystalline basement and have a considerable range (Figure 7-3) from 170 m over the
quartzite ridge to at least 560 m on the western side of the Property.
The Manitou Falls Formation is locally separated from the underlying Read Formation
(formerly the MFa) by a paraconformity, and comprises three units, the Bird Member (MFb),
Collins Member (MFc), and Dunlop Member (MFd), which are differentiated based on
conglomerates and clay intraclasts (Bosman and Korness 2007) (Ramaekers et al. 2007).
Thickness of the Read Formation ranges from zero metres at the north end of the property
and over parts of the quartzite ridge to 200 m west of the quartzite ridge. The thickness of
the MFb, which is absent above the quartzite ridge, is as much as 210 m in the northeastern
part of the Property. The MFc unit is a relatively clean sandstone with locally scattered
granules or pebbles and one-pebble-thick conglomerate layers interpreted to be pebble lag
deposits. The MFc ranges in thickness from 30 m to 150 m. The MFd is distinguished from
the underlying MFc sandstone by the presence of at least 0.6% clay intraclasts (Bosman and
Korness, 2007). The MFd is as thick as 140 m. The upper 100 m to 140 m of sandstone is
typically buff colored, medium- to coarse-grained, quartz rich and cemented by silica,
kaolinite, illite, sericite, or hematite. Alteration of the sandstone is noted along much of the
Phoenix deposit trend.
Variations in thickness of the Athabasca sub-units reflect syndepositional subsidence. In
particular, the thinning of the Read Formation towards the quartzite ridge, and the absence of
both the Read and the MFb Member over much of the ridge, indicate syn-Read uplift of the
latter along the thrust fault that bounds it to the west. This is supported by the Read
Formation sedimentary breccia, interpreted as a fault-scarp talus deposit, along the western
margin of the ridge.
www.rpacan.com
Page 7-7 Denison Mines Corp. – Phoenix Deposit, Wheeler River Project, Project #2299 Technical Report NI 43-101 – June 17, 2014
Although the predominant regional background clay in the Athabasca Basin is dickite, the
Wheeler River Property lies within a broad illite anomaly trending northeasterly from Key
Lake through the McArthur River area (Earle and Sopuck 1989). Chlorite and dravite are also
relatively common in sandstones within this zone.
The topography of the sub-Athabasca basement varies dramatically across the Property.
From elevations of 160 MASL to 230 MASL along its southeastern edge, the unconformity
rises gently to a pronounced northeasterly trending ridge up to 350 MASL, coincident with
the subcrop of a quartzite unit in the crystalline basement. The unconformity surface drops
steeply westward to as low as 30 MBSL. The unconformity surface is less variable in the
northern part of the Property, ranging from 40 MASL in the northeast to 200 MASL in the
northwest.
The west side of the quartzite unit forms a prominent topographic scarp, rising up to 200 m
above the Athabasca sandstone lying to the west. A breccia of angular quartzite blocks,
centimetres to metres in size, with a finely-laminated sandstone matrix, has been intersected
in numerous drill holes along the western margin (footwall) of the quartzite ridge. The
quartzite breccia is often intimately associated with uranium mineralization that occurs at
numerous locations along the footwall of the quartzite unit.
The Athabasca sandstones were deposited as a succession of sandy and gravelly braided
river deposits in westward-flowing streams. The conglomerates typical of MFb indicate
increased stream competence, due either to increased flow (i.e., higher precipitation) or
increased subsidence. The mud chips typical of MFd are fragments of thin mud beds
deposited from suspension during the late stages of a flood and re-worked by the next one.
Hence, they indicate intermittent, possibly seasonal, stream flow (Liu et al. 2011).
Drill Hole Lost inAthabasca Sandstone
Unconformity
Basement
AthabascaSandstone
WSa Conductor
WS Conductor
Lost
400m
200m
MFd
MFc
MFb
ReadFormation
Present Surface WR-267 WR-249 WR-190A
Overburden
NW SE
ZR-13A
Elevation(metres above sea level)
Pelite
Graphitic Pelite
Inferred Location ofGround EM Conductor
Garnetiferous Pelite
Quartzite
0 50
Metres
100 150 200
Source: Denison Mines Corp., 2012.June 2014
Phoenix Deposit
Schematic Section of Athabascaand Basement Rock Types
Denison Mines Corp.
Northern Saskatchewan, Canada
Figure 7-3
7-8
www.rpacan.com
www.rpacan.com
Page 7-9 Denison Mines Corp. – Phoenix Deposit, Wheeler River Project, Project #2299 Technical Report NI 43-101 – June 17, 2014
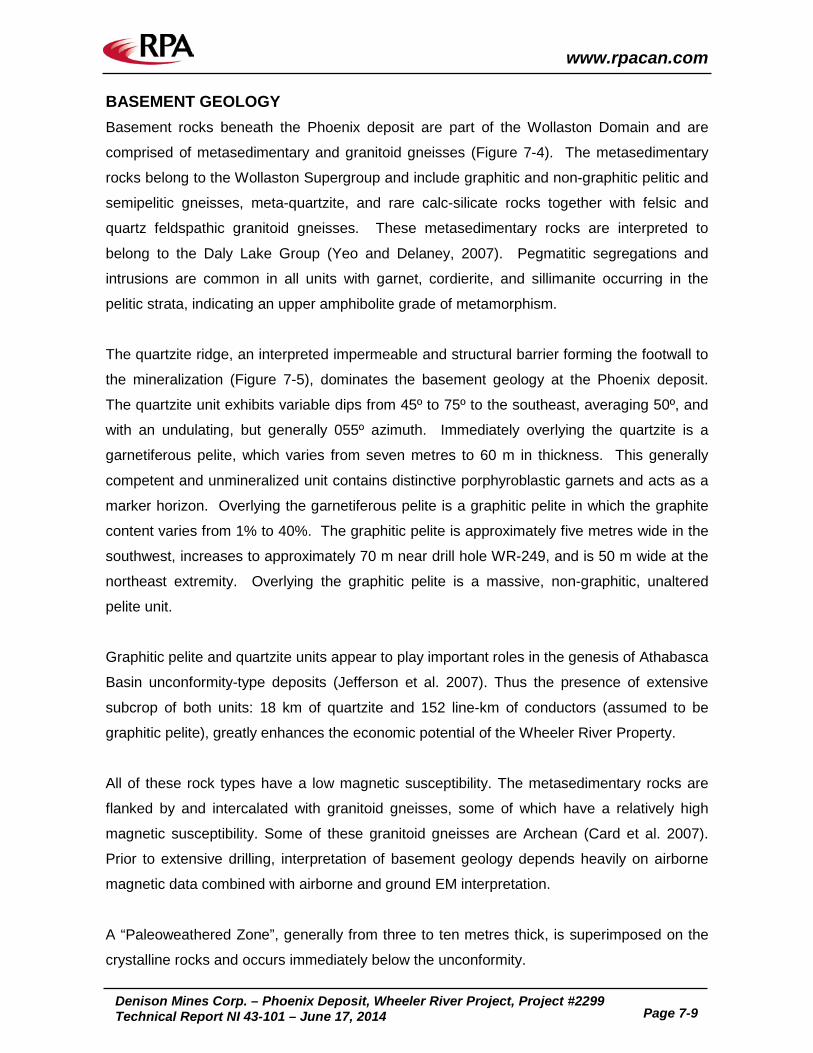
BASEMENT GEOLOGY Basement rocks beneath the Phoenix deposit are part of the Wollaston Domain and are
comprised of metasedimentary and granitoid gneisses (Figure 7-4). The metasedimentary
rocks belong to the Wollaston Supergroup and include graphitic and non-graphitic pelitic and
semipelitic gneisses, meta-quartzite, and rare calc-silicate rocks together with felsic and
quartz feldspathic granitoid gneisses. These metasedimentary rocks are interpreted to
belong to the Daly Lake Group (Yeo and Delaney, 2007). Pegmatitic segregations and
intrusions are common in all units with garnet, cordierite, and sillimanite occurring in the
pelitic strata, indicating an upper amphibolite grade of metamorphism.
The quartzite ridge, an interpreted impermeable and structural barrier forming the footwall to
the mineralization (Figure 7-5), dominates the basement geology at the Phoenix deposit.
The quartzite unit exhibits variable dips from 45º to 75º to the southeast, averaging 50º, and
with an undulating, but generally 055º azimuth. Immediately overlying the quartzite is a
garnetiferous pelite, which varies from seven metres to 60 m in thickness. This generally
competent and unmineralized unit contains distinctive porphyroblastic garnets and acts as a
marker horizon. Overlying the garnetiferous pelite is a graphitic pelite in which the graphite
content varies from 1% to 40%. The graphitic pelite is approximately five metres wide in the
southwest, increases to approximately 70 m near drill hole WR-249, and is 50 m wide at the
northeast extremity. Overlying the graphitic pelite is a massive, non-graphitic, unaltered
pelite unit.
Graphitic pelite and quartzite units appear to play important roles in the genesis of Athabasca
Basin unconformity-type deposits (Jefferson et al. 2007). Thus the presence of extensive
subcrop of both units: 18 km of quartzite and 152 line-km of conductors (assumed to be
graphitic pelite), greatly enhances the economic potential of the Wheeler River Property.
All of these rock types have a low magnetic susceptibility. The metasedimentary rocks are
flanked by and intercalated with granitoid gneisses, some of which have a relatively high
magnetic susceptibility. Some of these granitoid gneisses are Archean (Card et al. 2007).
Prior to extensive drilling, interpretation of basement geology depends heavily on airborne
magnetic data combined with airborne and ground EM interpretation.
A “Paleoweathered Zone”, generally from three to ten metres thick, is superimposed on the
crystalline rocks and occurs immediately below the unconformity.
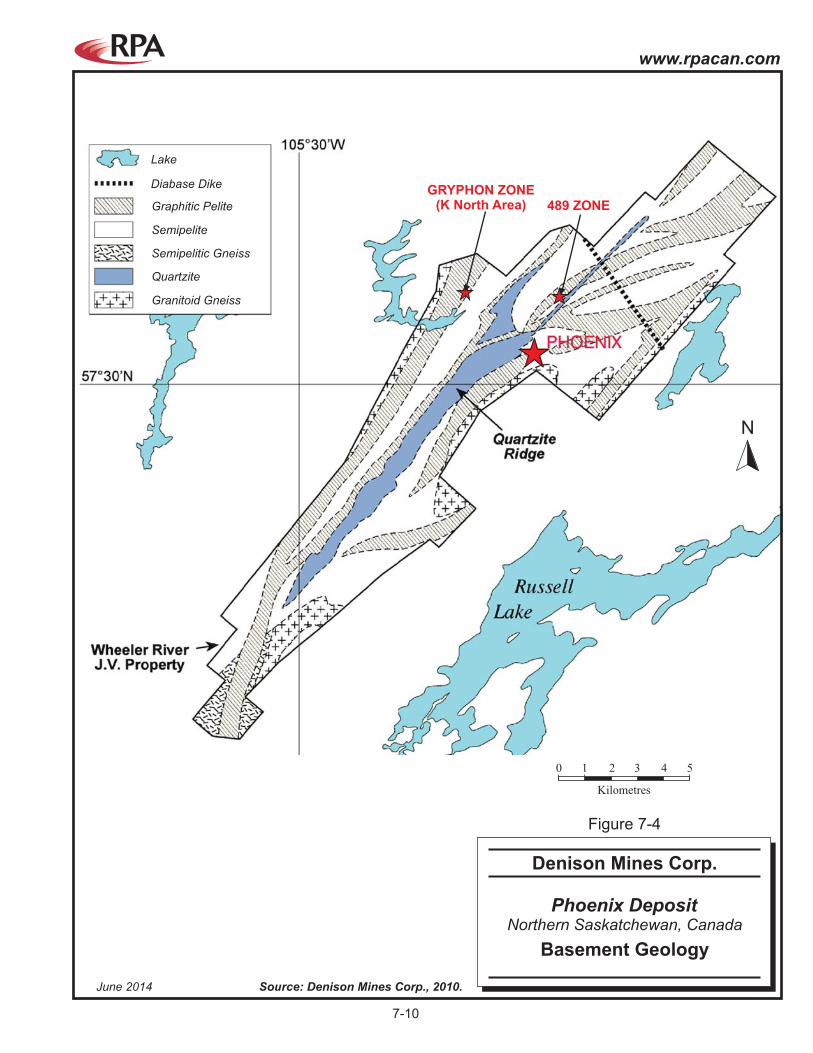
GRYPHON ZONE(K North Area) 489 ZONE
Lake
Graphitic Pelite
Diabase Dike
Semipelite
Semipelitic Gneiss
Quartzite
Granitoid Gneiss
0 1 5
Kilometres
2 3 4
N
Source: Denison Mines Corp., 2010.June 2014
Phoenix Deposit
Basement Geology
Denison Mines Corp.
Northern Saskatchewan, Canada
Figure 7-4
7-10
www.rpacan.com
PhoenixDeposit
Quartzite Breccia
Semipelitic Gneiss withGraphitic Pelite Interlayers
Graphitic Pelite
Quartzite
Granitoid Gneiss
Thrust
Shear
Source: Denison Mines Corp., 2010.June 2014
Phoenix Deposit
Schematic of theQuartzite Ridge
Denison Mines Corp.
Northern Saskatchewan, Canada
Figure 7-5
7-11
www.rpacan.com
www.rpacan.com
Page 7-12 Denison Mines Corp. – Phoenix Deposit, Wheeler River Project, Project #2299 Technical Report NI 43-101 – June 17, 2014
STRUCTURAL GEOLOGY The Wheeler River Property lies in the Wollaston Domain, a northeast-trending fold and
thrust belt with recumbently folded, early Paleoproterozoic, Wollaston Supergroup
metasedimentary rocks intercalated with granitoid gneisses, some of which are of Archean
age.
Numerous hypothetical structural models have been proposed for the Wheeler River
Property. The most simple is to infer a southeast dipping homocline. The presence of
mechanically competent quartzite units, as well as the bounding units of competent granitoid
gneiss, together with the many kilometres of relatively incompetent graphitic pelite provides a
situation for the extensive development of thrust and strike slip/wrench fault tectonics, as well
as later normal faults, at competent/incompetent interfaces (Liu et al. 2011).
The major structural feature at the Phoenix deposit is the northeast-southwest trending (055º
azimuth) WS reverse fault which dips 55º to the southeast and lies within or at the base of
the graphitic pelite unit along the western edge (footwall) of the quartzite ridge, which
appears to have acted as a buttress for thrusting and reverse faulting (Kerr 2010) (Kerr,
Gamelin et al. 2011). Deformation within the WS shear has occurred partly by ductile
shearing, but mainly by fracturing. A progressive sequence of fracturing is evident by
variations in the strike and dip of slickensides. The principal stress directions responsible for
early deformation were northwest-southeast. A change in the principal stress to an east-
west direction led to later strike-slip movement along the WS shear. Later extension is
indicated by northwest-striking normal faults, which dip steeply to the southwest.
With the limited data currently available it appears that the WS structure was most active
during deposition of the Read Formation, however, continued uplift is indicated by westward
tilting of MFc strata along the fault zone. Reverse fault displacements on the western edge of
the quartzite ridge occurred primarily within the highly resistant quartzite unit. Within the
Wheeler River area, vertical offset on the footwall of the quartzite unit can be as much as 60
m; however, at the Phoenix deposit, known vertical displacements in the hanging wall
sequence are always less than 10 m (Figure 7-6).
Mineralization hosted in the lower 15 m of the Athabasca sandstone appears to have some
relationship to the extensions of the WS shear and its various hanging wall splays; hence,
www.rpacan.com
Page 7-13 Denison Mines Corp. – Phoenix Deposit, Wheeler River Project, Project #2299 Technical Report NI 43-101 – June 17, 2014
movement on these faults must have continued after deposition of rocks of the Read
Formation and probably the MFd member of the Manitou Falls Formation. The WS shear
and its various interpreted hanging wall splays may have been the main conduit for the
mineralizing fluids. Thus determining favourable locations along the WS shear, where zones
of long-lived permeability are present, is of critical importance. A northwesterly trending
diabase dyke, probably part of the 1.27 Ga Mackenzie dyke swarm, cuts across the
sandstones on the northern part of the Property.
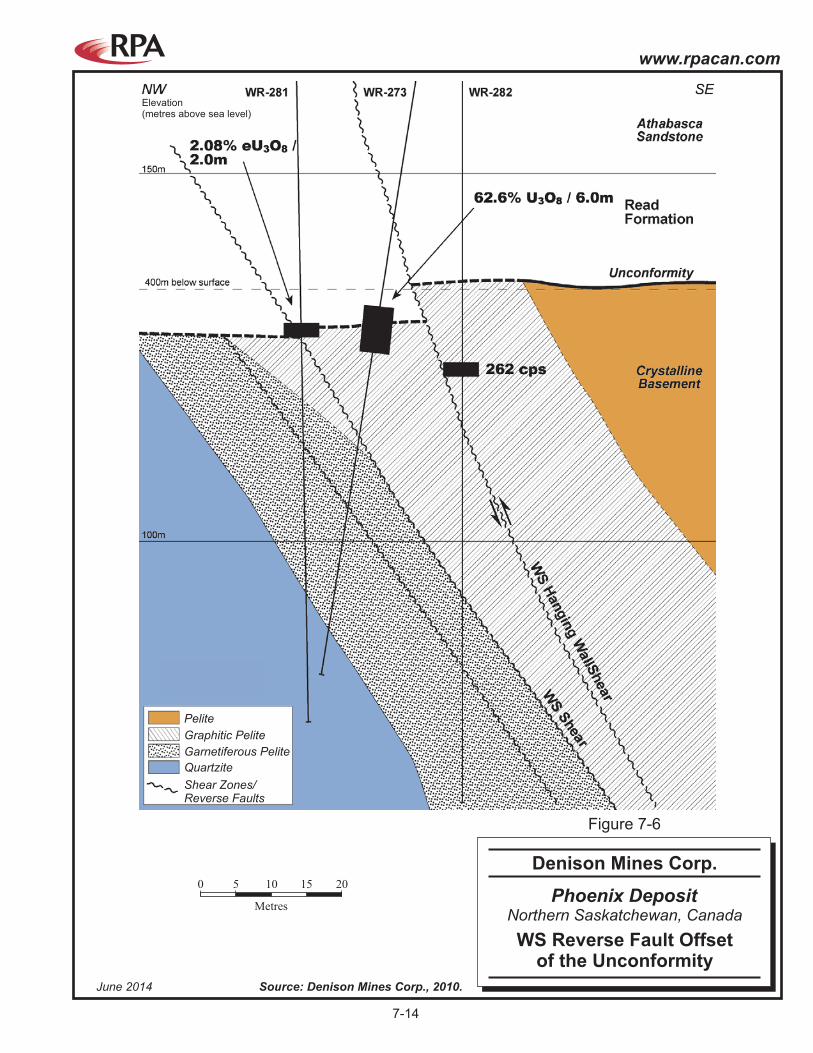
Elevation(metres above sea level)
0 5
Metres
10 15 20
Pelite
Graphitic Pelite
Garnetiferous Pelite
Quartzite
Shear Zones/Reverse Faults
Source: Denison Mines Corp., 2010.June 2014
Phoenix Deposit
WS Reverse Fault Offsetof the Unconformity
Denison Mines Corp.
Northern Saskatchewan, Canada
Figure 7-6
7-14
www.rpacan.com
www.rpacan.com
Page 7-15 Denison Mines Corp. – Phoenix Deposit, Wheeler River Project, Project #2299 Technical Report NI 43-101 – June 17, 2014
URANIUM MINERALIZATION
TYPE OF MINERALIZATION Uranium mineralization at the Phoenix deposit occurs at the unconformity between
Athabasca sandstone and basement rocks, with the most intense mineralization adjacent to
the WS fault. A minor amount is fracture hosted in the basement extending below the north
part of zone A. The Phoenix deposit is an unconformity-associated type of uranium deposit.
Mineralization is in the form of the oxide uraninite/pitchblende (UO2). Values of all
accompanying metals are low, particularly in comparison with other unconformity or
sandstone-hosted deposits, which can have very high values for Ni, Co, and As (Jefferson et
al. 2007). For example, drill hole WR-273, from 406.0 m to 406.5 m, assays 78.3% U3O8, 35
ppm Ni, 30 ppm Co, 0.05 ppm As, 26 ppm Zn, 221 ppm Ag, 284 ppm Cu, and 9.83% Pb.
Some intersections can have significantly higher values for many trace elements, e.g., drill
hole WR-287, from 408.5 m to 409.0 m, assays 26.8% U3O8, 461 ppm Ni, 119 ppm Co, 170
ppm As, 1,070 ppm Zn, 11.2 ppm Ag, 3,200 ppm Cu, and 2.25% Pb.
In April, 2014 Denison reported the discovery of a new mineralized zone within the Wheeler
River Property. The Gryphon discovery is approximately three kilometres northwest of the
Phoenix deposit.
Mineralization at the Gryphon zone is located in basement rocks approximately 200 m
beneath the Athabasca sandstone unconformity. In this area, the unconformity drops to the
northwest in a series of reverse fault offsets. Cumulative offset is approximately 60 m of
vertical displacement over 250 m across strike. Basement rocks are Wollaston Group
gneisses that dip moderately to the southeast and consist of an upper graphitic pelite unit
overlying a quartzite/pegmatite assemblage which overlies a lower graphitic pelite unit
followed by a basal pegmatite. To date, the mineralization is hosted in fault zones at the
base of the upper graphitic pelite and within the lower graphitic pelite. The faults are
assumed to dip moderately to the southeast, conformable with the bedding and foliation in
the basement rocks. Three types of mineralization have been noted: 1) irregular fracture fill,
2) semi-massive, and 3) mineral replacement.
www.rpacan.com
Page 7-16 Denison Mines Corp. – Phoenix Deposit, Wheeler River Project, Project #2299 Technical Report NI 43-101 – June 17, 2014
ALTERATION Alteration is typical unconformity-associated style, with a form and nature similar to other
Athabasca Basin deposits. The sandstones are altered for as much as 200 m above the
unconformity and exhibit varying degrees of silicification and desilicification (which causes
many technical drilling problems), as well as dravitization, chloritization, and illitization. In
addition, hydrothermal hematite and drusy quartz are present in the sandstone and often in
the basement rocks. Alteration is focussed along structures propagating upward from the
WS shear and associated splays, and probably does not exceed 100 m width across strike,
making this a relatively narrow exploration target. The basement in the northeast part of the
Phoenix deposit is much more extensively bleached and clay altered than that to the
southwest.
DISTRIBUTION OF URANIUM MINERALIZATION AT PHOENIX The mineralization in the Phoenix deposit occurs at the unconformity contact between
sandstone of the Athabasca group and underlying lower Proterozoic Wollaston Group
metasedimentary rocks.
Mineralization and alteration have been traced over a strike length of approximately one
kilometre. Since the discovery hole WR-249 was drilled in 2008, 253 drill holes have
reached the target depth, delineating two distinct zones (A and B) of high-grade uranium
mineralization.
www.rpacan.com
Page 8-1 Denison Mines Corp. – Phoenix Deposit, Wheeler River Project, Project #2299 Technical Report NI 43-101 – June 17, 2014
8 DEPOSIT TYPES The Phoenix deposit is an Athabasca Basin unconformity-type uranium deposit. Figure 8-1
shows a general schematic of unconformity-type uranium deposits. Jefferson et al. (2007)
offered the following definition for the geological environment of this type of mineralization.
Unconformity-associated uranium deposits are pods, veins, and semi-massive replacements
consisting of mainly uraninite, close to basal unconformities, in particular those between
Proterozoic conglomeratic sandstone basins and metamorphosed basement rocks.
Prospective basins in Canada are filled by thin, relatively flat-lying, and apparently
unmetamorphosed but pervasively altered, Proterozoic (~1.8 Ga to <1.55 Ga), mainly fluvial,
red-bed quartzose conglomerate, sandstone, and mudstone. The basement gneiss was
intensely weathered and deeply eroded with variably preserved thicknesses of reddened,
clay-altered, hematitic regolith grading down through a green chloritic zone into fresh rock.
The basement rocks typically comprise highly metamorphosed interleaved Archean to
Paleoproterozoic granitoid and supracrustal gneiss including graphitic metapelite that hosts
many of the uranium deposits. The bulk of the U-Pb isochron ages on uraninite are in the
range of 1,600 Ma to 1,350 Ma. Monometallic, generally basement-hosted uraninite fills
veins, breccia fillings, and replacements in fault zones. Polymetallic, commonly
subhorizontal, semi-massive replacement uraninite forms lenses just above or straddling the
unconformity, with variable amounts of uranium, nickel, cobalt and arsenic; and traces of
gold, platinum-group elements, copper, rare-earth elements and iron.
The uranium deposits in the Athabasca Basin occur below, across and immediately above
the unconformity, which can lie within a few metres of surface at the rim of the Basin, to over
1,000 m deep near its centre. The deposits formed by extensive hydrothermal systems
occurring at the unconformity's structural boundary between the older and younger rock
units. Major deep-seated structures are also interpreted to have played an important role in
the hydrothermal process, likely acting as conduits for hot mineralized fluids that eventually
pooled and crystallized in the structural traps provided by the unconformity. One of the
necessary reducing fluids originates in the basement, and flows along basement faults. A
second, oxidizing fluid originates within the Athabasca sandstone stratigraphy and migrates
through the inherent porosity. In appropriate circumstances, these two fluids mix and
www.rpacan.com
Page 8-2 Denison Mines Corp. – Phoenix Deposit, Wheeler River Project, Project #2299 Technical Report NI 43-101 – June 17, 2014
precipitate uranium in a structural trap at or near the basal Athabasca- unconformity with
basement rocks.
Two end-members of the deposit model have been defined (Quirt 2003). A sandstone-
hosted egress-type model (e.g., Phoenix) involved the mixing of oxidized, sandstone brine
with relatively reduced fluids issuing from the basement into the sandstone. Basement-
hosted, ingress-type deposits (e.g., Rabbit Lake) formed by fluid-rock reactions between
oxidizing sandstone brine entering basement fault zones and the local wall rock. Both types
of mineralization and associated host-rock alteration occurred at sites of basement–
sandstone fluid interaction where a spatially stable redox gradient/front was present.
Although either type of deposit can be high grade, ranging in grade from a few percent to
20% U3O8, they are not physically large and typically occur as narrow, linear lenses at
considerable depth. In plain view, the deposits can be 100 m to 150 m long and a few
metres to 30 m wide and/or thick. Egress-type deposits tend to be polymetallic (U-Ni-Co-Cu-
As) and typically follow the trace of the underlying graphitic pelites and associated faults,
along the unconformity. Both the Phoenix and McArthur River deposits, however, have very
low concentrations of accessory (polymetallic) minerals.
Unconformity-type uranium deposits are surrounded by extensive alteration envelopes. In
the basement, these envelopes are generally relatively narrow but become broader where
they extend upwards into the Athabasca group for tens of metres to even 100 m or more
above the unconformity. Hydrothermal alteration is variously marked by chloritization,
tourmalinization (high boron, dravite), hematization (several episodes), illitization,
silicification/desilicification, and dolomitization (Hoeve, 1984). Modern exploration for these
types of deposits relies heavily on deep-penetrating geophysics and down-hole
geochemistry.
The geology of the Phoenix deposit area and the controls on mineralization are sufficiently
well understood for Mineral Resource estimation, in RPA’s opinion.
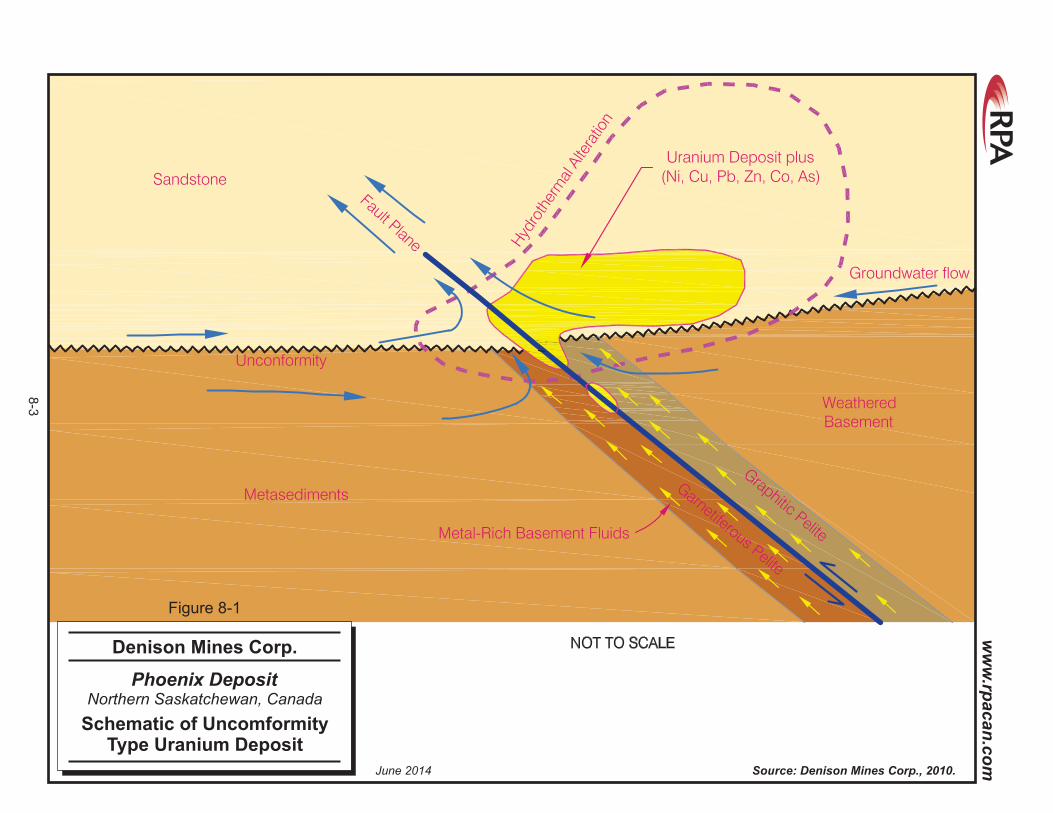
June 2014 Source: Denison Mines Corp., 2010.
Phoenix Deposit
Schematic of UncomformityType Uranium Deposit
Denison Mines Corp.
Northern Saskatchewan, Canada
Figure 8-1
8-3
ww
w.rp
acan
.co
m
www.rpacan.com
Page 9-1 Denison Mines Corp. – Phoenix Deposit, Wheeler River Project, Project #2299 Technical Report NI 43-101 – June 17, 2014
9 EXPLORATION Since discovery of the McArthur River deposit in 1988, the McArthur River exploration model
(McGill et al. 1993) has emphasized a different association between uranium mineralization
and rock type compared to the earlier Key Lake exploration model. At McArthur River, one
of the most significant rock types in the basement succession is a massive, homogenous,
and competent quartzite. Mechanically, particularly compared to the adjacent layered
members of the basement stratigraphy, the quartzite is extremely competent, and thus exerts
an important control both in basement and post-Athabasca sandstone structural evolution.
Both the footwall and hanging wall contacts of the quartzite unit, particularly where these
contacts involve highly incompetent rocks such as graphitic pelite, are sites of major thrust
and strike-slip faults.
Although these faults are loci for mineralization; the poor conductivity, low magnetic
susceptibilities and low density values associated with the quartzite limits the effectiveness of
airborne and ground geophysical methods in mapping these basement units especially when
they are covered by hundreds of metres of sandstone. Another noteworthy characteristic of
McArthur River type mineralization is the widespread presence of hydrothermal dravite,
indicating boron addition into the overlying Athabasca sandstone above the quartzite ridge.
Thus, borehole geochemistry and drilling are the primary exploration methods.
Exploration up to 2008 is described in Section 6 History. Further details of geophysical
exploration since 2008 are provided below.
Following the discovery of the Phoenix deposit in 2008, Denison as operator of the Wheeler
River Joint Venture completed DC Resistivity/Induced Polarization surveys comprising 67.6
line-km in 2009
During February and March 2010, a geophysical program consisting of 25.2 km of fixed loop
surface transient electromagnetic survey (TEM) coverage, and 51.0 km of step loop transient
EM survey coverage were completed on three lines of the previously established 2007
Wheeler River grid. Three lines of step-wise moving loop (SWML) transient electromagnetic
(TEM) surveying was completed on three previously defined resistivity anomalies in attempt
www.rpacan.com
Page 9-2 Denison Mines Corp. – Phoenix Deposit, Wheeler River Project, Project #2299 Technical Report NI 43-101 – June 17, 2014
to better define any conductive axis associated with graphitic basement features that could
act as conduits for mineralizing events.
The three lines of SWML were chosen to represent variable or subtle differences in low
amplitude resistivity signatures interpreted to be associated with breaches in sandstone
stratigraphy. In particular, the resistivity signature located on L40+00N is known to be
associated with the uranium mineralization associated with the Phoenix deposit. Although
this analysis of the survey data is primarily based on empirical observations on profile data
collected from the characteristics of the TDEM data, further analysis was required and all
data was imported into EM modelling software (Maxwell EMIT and/or EMIGMA) to better
define the characteristics of the conductive body and the surrounding half-space. Some
conductors were identified.
The 2011 exploration program on the Wheeler River Property carried out by Denison
included a 120.6 line-km Titan 24 DC/IP Survey. Additional Titan 24 surveying (48.2 line-km)
was completed in 2012.
In 2013, the Wheeler River Joint Venture completed a 128.5 line-km of Titan 24 DC/IP
Survey over two areas previously not covered (R North and K West areas) as well as a 990
line-km of helicopter borne VTEM max (time domain electromagnetics). This survey used a
bigger loop than previously used in hopes of removing noise that caused difficulties in
interpretation of a previous survey.
Geophysical exploration to date in 2014 consisted of the following work, with primary focus
directed in and around the K-North area:
• 46.05 line-km over three lines of infill Step–wise Moving Loop (SWML) EM in the K-North area to complete areas previously not covered.
• 43 line-km over two lines of SWML in the WS South area covering areas of interest from the 2013 Titan 24 DC/IP Survey.
• 48 line-km of ground gravity covering the O Zone, where historic drilling showed a
large unconformity offset with weak uranium mineralization.
• 52.65 line-km of ground gravity covering the K-North area to test if the unconformity offset seen in drill core could be defined by this method.
• An extension of the 2007 North Titan 24 DC/IP survey to complete the coverage over
the K-North area.
www.rpacan.com
Page 10-1 Denison Mines Corp. – Phoenix Deposit, Wheeler River Project, Project #2299 Technical Report NI 43-101 – June 17, 2014
10 DRILLING Diamond drilling on the Wheeler River Property is the principal method of exploration and
delineation of uranium mineralization after initial geophysical surveys. Drilling can generally
be conducted year round on the Phoenix deposit. Drill holes on Phoenix are labelled with a
prefix of the project (WR) followed by the hole number, with almost all drill holes being drilled
vertically or oriented steeply towards the northwest.
DRILLING METHODOLOGY Delineation diamond drilling at Phoenix was primarily done with NQ sized core (47.6 mm
diameter) in holes WR-249 through WR-275 and HQ sized core (63.5 mm diameter) reducing
down to NQ at 350 m in holes WR-276 through WR-561A, with most holes successfully
penetrating into the basement. In general, drilling in the higher grade areas of the Phoenix
deposit has been conducted on a nominal drill hole grid spacing of 25 m NE-SW by 10 m
NW-SE. Some additional infill holes were drilled primarily to test the spatial continuity of the
mineralization. The most notable results from drilling to date are the intersections of 6.0 m of
62.6% U3O8 in hole WR-273, 3.5 m of 58.2% U3O8 in hole WR-305, 8.4m of 38.4% U3O8 in
hole WR-401 and 10.5 m of 50.1% U3O8 in hole WR-525. The bulk of the flat lying high-
grade mineralization is positioned at and sub parallel to the unconformity.
EXPLORATION DRILLING 2005-14 In 2005, 12 holes, (4,829 m) were drilled in the vicinity of the quartzite ridge. The last hole of
2005, WR-204, intersected strong thrust faulting with sandstone wedges and intersected
1.48% U3O8 over 0.5 m at a depth of 313 m along the northwest side of the quartzite ridge.
This was the first indication of uranium mineralization associated with the quartzite ridge on
the Wheeler River Property.
In 2006, Denison drilled a total of 28 holes (10,516 m), all targeting the quartzite ridge, along
a seven kilometre length. Most holes were located on the northwest (footwall) side of the
ridge. The most significant results were from WR-214, drilled in the WR-204 area, where
probing returned 0.85% eU3O8 over 3.8 m from 310 m. This was the highest value yet
obtained on the Wheeler River Property, and was associated with the footwall thrust contact,
but in an area with no graphite.
www.rpacan.com
Page 10-2 Denison Mines Corp. – Phoenix Deposit, Wheeler River Project, Project #2299 Technical Report NI 43-101 – June 17, 2014
In 2007, 18 holes (6,147 m) were drilled. Primary targets during the winter program were
transient EM (TEM) anomalies as follow up to the airborne GEOTEM survey, and further
testing of the hanging wall of the quartzite ridge. Reinterpretation of the 2003 resistivity
survey identified three areas on the 2D sections that were deemed worthy of follow up
testing. Three holes (WR-236, 237 and 238) were drilled to follow up the strongly altered
and geochemically anomalous Cameco hole WR-192 and to test two weakly developed
sandstone resistivity anomalies. All three holes intersected significant structure and
alteration, but no mineralization or graphitic pelite in the basement.
Work during the summer of 2007 continued to test the quartzite ridge in the WR-204 area
and also further south. Almost all holes in the vicinity of the quartzite ridge returned strong
clay alteration and structure. WR-242A, located some 600 m along strike to the northeast of
WR-214 returned 0.26% U3O8 over 1.8 m and strengthened the belief that the footwall should
remain a major focus of exploration, although the JV partners noted that the hanging wall of
the quartzite unit should not be neglected.
The first hole during the summer of 2008 was WR-249 on geophysics line 4300 to test
resistivity target “A”. WR-249 was spotted 90 m northwest of WR-190A, which had been lost
in the sandstone 34 m above the unconformity in 2003. The hole encountered strong
desilicification, silicification, hydrothermal hematite, druzy quartz and increased fracture
density, with progressively more intense alteration towards the unconformity, together with a
strong grey bleached zone consisting of extremely fine grained pyrite which provided a
strong visual contrast to bleached zones in other nearby holes. At the unconformity,
disseminated and massive uranium mineralization was present from 406.65 m to 409 m. The
assay grade was 1.06% U3O8 over 2.35 m. This was the highest grade intercept on the
Wheeler River Property to date. This hole was located seven kilometres northeast of the
previous work in the WR-204 area and, more significantly, was drilled on the hanging wall
rather than the footwall side of the quartzite ridge.
Target “B” was tested by WR-251 which was located 600 m along strike from WR-249. It
intersected similar alteration along with three mineralized zones occurring both at the
unconformity and in the basement. The best intersection graded 0.78% U3O8 over 2.25 m.
www.rpacan.com
Page 10-3 Denison Mines Corp. – Phoenix Deposit, Wheeler River Project, Project #2299 Technical Report NI 43-101 – June 17, 2014
All 2008 follow up drilling was located in the WR-251 area. More uranium mineralization
(1.4% U3O8 over 4.0 m and 1.75% U3O8 over 0.5 m) was intersected in WR-253, which was
drilled to test for mineralization 15 m to the southeast of WR-251.
All drill holes during the summer of 2008 intersected either uranium mineralization or very
strong alteration close to mineralization on the hanging wall of the quartzite unit. This new
discovery was named Phoenix. Located over eight kilometres northeast of areas in the
Wheeler River Property that had been tested by previous work, the Phoenix deposit has
many geological similarities to the McArthur River mineralization, but is at a shallower depth.
The Wheeler River Property is favourably located along trend from the McArthur River
deposit and is underlain by many of the same geological features that are present on that
producing property.
During 2009, three drill programs consisting of a total of 43 diamond drill holes (19,006 m),
were carried out, each of which established significant milestones in the advancement of the
project. During the winter program, the first indications of higher grade mineralization came
from Hole WR-258, which returned 11.8% U3O8 over 5.5 m from a depth of 397 m. The
summer drill program continued to test the Phoenix discovery, with hole WR-273 returning a
value of 62.6% U3O8 over 6.0 m at a depth of 405 m. Mineralization was monomineralic
pitchblende with very low concentrations of accessory minerals and was reported to be
remarkably similar to the high-grade McArthur River P2 deposits. Most of the mineralization
occurs as a horizontal sheet at the base of the Athabasca sandstone proximal to where a
graphitic pelite unit in the basement intersects the unconformity. In addition, the alteration
changes to the northeast with intense and strong basement bleaching becoming more
prominent, and the strongest graphitic faulting yet observed. More significantly, the new
mineralized zone returned the highest grades so far intersected in more than 40 years of
continuous exploration on the Wheeler River project.
A further drill program in the fall of 2009 established continuity of the high-grade portion of
the mineralized zone and extended the overall zone as a possibly continuous unit for a strike
length of greater than one kilometre.
During 2010, 62 diamond drill holes totalling 28,362.3 m were carried out on two claims
along the Phoenix deposit trend. Of the 62 drill holes, 59 totalling 27,853.25 m were
completed to the desired depth and three were lost or abandoned due to poor ground
www.rpacan.com
Page 10-4 Denison Mines Corp. – Phoenix Deposit, Wheeler River Project, Project #2299 Technical Report NI 43-101 – June 17, 2014
conditions or excessive deviation. The three lost holes were redrilled and successfully
completed to the desired depth. Twenty-seven holes were drilled on claim S-98341 during
two drill seasons from January to April and June to August. Thirty-five holes were drilled on
claim S-97909 during two drill seasons from January to April and June to August. The two-
phase drilling program was carried out during the periods of January to April 2010 and June
to August 2010.
During 2011, a two-phase drilling program of 80 diamond drill holes totalling 38,426.6 m was
carried out on mineral dispositions S-97908, S-97909, and S-98341. Of the 80 drill holes
completed, 77 were successfully completed to design depth.
During 2012, Denison completed 51 diamond drill holes totalling 23,073 m on the Phoenix
deposit during two drilling campaigns.
In 2013, 30 diamond drill holes totaling 13,797 m were carried out on mineral dispositions
across the Wheeler River Property of which 14 were completed as infill delineation drilling on
zone A.
In 2014, an additional 11 diamond drill holes were completed on zone A to extend higher
grade portions of the deposit.
Since 1978 a total of 575 diamond drill holes and 61 reverse circulation (RC) drill holes
totalling 377,187 m have been completed within the Wheeler River Property of which 253 drill
holes totalling 117,822 m of diamond drilling have delineated the Phoenix deposit (Table 10-
1). Well-established drilling industry practices were used in the drilling programs.
TABLE 10-1 DRILLING STATISTICS Denison Mines Corp. – Phoenix Deposit
Drilling Program
Year Number of
Holes Metres Drilled
2008 14 6,499 2009 31 14,546 2010 55 25,939 2011 70 33,401 2012 51 23,073 2013 19 8,750 2014 13 5,614 Total 253 117,822
www.rpacan.com
Page 10-5 Denison Mines Corp. – Phoenix Deposit, Wheeler River Project, Project #2299 Technical Report NI 43-101 – June 17, 2014
Drilling Program Year
Number of Holes
Metres Drilled
A Deposit 141 64,492 B Deposit 55 25,344 C Target 24 10,438 D Target 25 13,657 RECON 8 3,893
To date, the Phoenix deposit area has been systematically drill tested over roughly one
kilometre of strike length at a nominal 25 m to 50 m section spacing (Figure 10-1).
All holes were logged for lithology, structure, alteration, mineralization, and geotechnical
characteristics. Data were entered into DHLogger software on laptops in the field. The
DHLogger data were transferred into a Fusion database. All drill hole data were validated
throughout the drilling program and as an integral component of the current recent resource
estimation work. Hard copies of drill logs are stored at site.
Fourteen holes totaling 8,552 m have been drilled in the K North target area since 2013.
Two discrete high grade mineralized intervals were intersected in early 2014 drilling, on the
newly discovered Gryphon Zone. The intersections are listed in Table 10-2. Based on the
geology observed in the drill core, it is likely that WR-560 intersected low grade
mineralization (the 676.2 m to 680.3 m) at the up-dip extension of the high grade zone in
WR-556. The high grade mineralization in WR-560 is interpreted to be a new lens in the
footwall, about 50 m northwest of the high grade intersection in WR-556. More follow-up
drilling is warranted in RPA’s opinion, and Denison plans an aggressive follow-up drilling
program for the summer of 2014. The Gryphon zone is located three kilometres northwest of
the Phoenix deposit.
TABLE 10-2 GRYPHON ZONE MINERAL INTERSECTIONS Denison Mines Corp. – Phoenix Deposit
Hole-ID From (m) To (m) Length (m) U3O8 (%) WR-556 697.5 701.5 4.0 15.3 WR-560 759.0 763.5 4.5 21.2
Notes:
1. Intersection interval is composited above a cut-off grade of 1.0% eU3O8
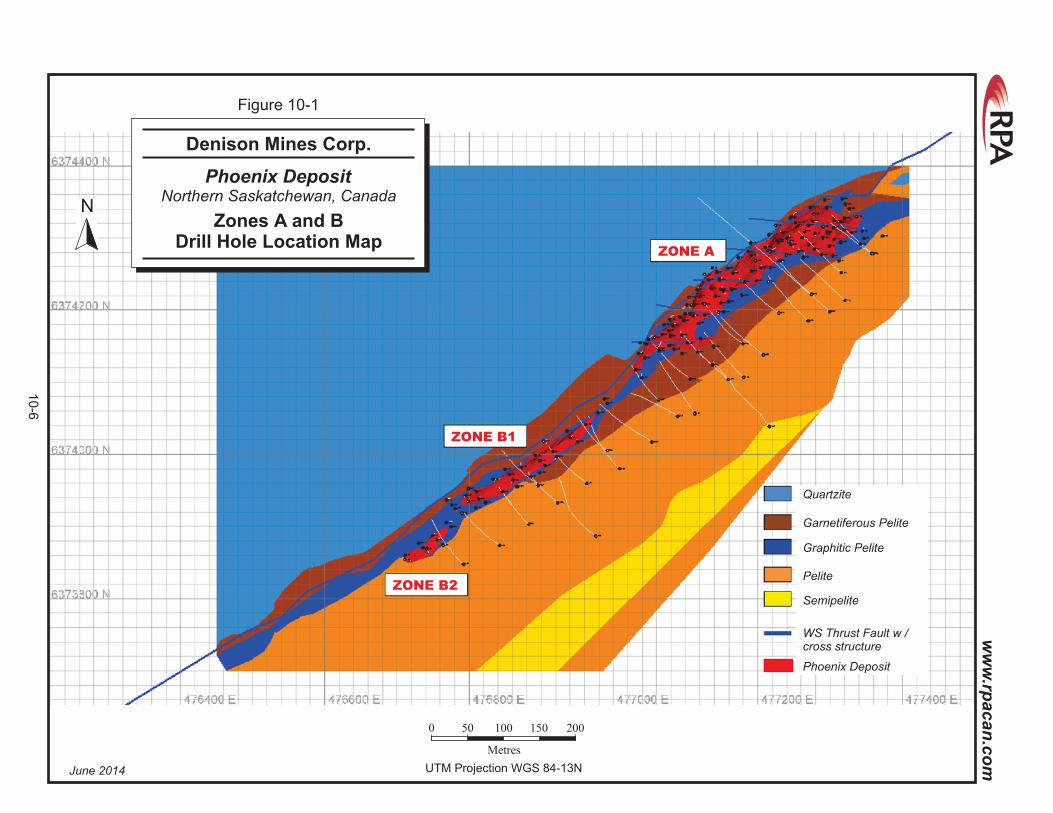
ZONE A
ZONE B1
ZONE B2
Quartzite
Garnetiferous Pelite
Graphitic Pelite
Pelite
Semipelite
WS Thrust Fault w /cross structure
Phoenix Deposit
N
0 50
Metres
100 150 200
UTM Projection WGS 84-13NJune 2014
Phoenix Deposit
Zones A and BDrill Hole Location Map
Denison Mines Corp.
Northern Saskatchewan, Canada
Figure 10-1
10
-6
ww
w.rp
acan
.co
m
www.rpacan.com
Page 10-7 Denison Mines Corp. – Phoenix Deposit, Wheeler River Project, Project #2299 Technical Report NI 43-101 – June 17, 2014
DRILL HOLE SURVEYING The collar locations of drill holes are spotted on a grid established in the field and collar sites
are surveyed by differential base station GPS using the NAD83 UTM zone 13N reference
datum. To date and in general, drilling at Phoenix has been conducted on a nominal drill hole
grid spacing of 25 m northeast-southwest by 10 m northwest-southeast.
The trajectory of all drill holes is determined with a Reflex instrument in single point mode,
which measures the dip and azimuth at 50 m intervals down the hole with an initial test taken
six metres below the casing and a final measurement at the bottom of the hole. All
mineralized and non-mineralized holes within the deposit are cemented from approximately
25 m below the mineralized zone to approximately 25 m above the zone.
RADIOMETRIC LOGGING OF DRILL HOLES All drill holes on the Wheeler River Property are logged with a radiometric probe to measure
the natural gamma radiation, from which an indirect estimate of uranium content can be
made. Most of the data (approximately 80%) used for the Phoenix Mineral Resource
estimate are obtained from chemical assays of the rock. The remainder of the data are
derived from radiometric probe results – generally when poor drill core recovery prevents
representative sampling for chemical assays.
RADIOMETRIC PROBING Probing with a Mount Sopris gamma logging unit employing a triple gamma probe (2GHF-
1000) was completed systematically on every drill hole. The probe measures natural gamma
radiation using three different detectors: one 0.5 in by 1.5 in sodium iodide (NaI) crystal
assembly and two Geiger Mueller (G-M) tubes installed above the NaI detector. These G-M
tubes have been used successfully to determine grade in very high concentrations of U3O8.
By utilizing three different detector sensitivities (the sensitivity of the detectors is very
different from one detector to another), these probes can be used in both exploration and
development projects across a wide spectrum of uranium grades. Accurate concentrations
can be measured in uranium grades ranging from less than 0.1% to as high as 80% U3O8.
Data are logged from all three detectors at a speed of 15 m/min down hole and 5 m/min up
hole through the drill rods.
www.rpacan.com
Page 10-8 Denison Mines Corp. – Phoenix Deposit, Wheeler River Project, Project #2299 Technical Report NI 43-101 – June 17, 2014
The radiometric or gamma probe measures gamma radiation which is emitted during the
natural radioactive decay of uranium (U) and variations in the natural radioactivity originating
from changes in concentrations of the trace element thorium (Th) as well as changes in
concentration of the major rock forming element potassium (K).
Potassium decays into two stable isotopes (argon and calcium) which are no longer
radioactive, and emits gamma rays with energies of 1.46 MeV. Uranium and thorium,
however, decay into daughter- products which are unstable (i.e. radioactive). The decay of
uranium forms a series of about a dozen radioactive elements in nature which finally decay
to a stable isotope of lead. The decay of thorium forms a similar series of radioelements. As
each radioelement in the series decays, it is accompanied by emissions of alpha or beta
particles or gamma rays. The gamma rays have specific energies associated with the
decaying radionuclide. The most prominent of the gamma rays in the uranium series
originate from decay of 214Bi (bismuth), and in the thorium series from decay of 208Tl
(thallium).
The natural gamma measurement is made when a detector emits a pulse of light when
struck by a gamma ray. This pulse of light is amplified by a photomultiplier tube, which
outputs a current pulse which is known as “counts per second” or “cps”. The gamma probe
is lowered to the bottom of a drill hole and data are recorded as the tool travels to the bottom
and then is pulled back up to the surface. The current pulse is carried up a conductive cable
and processed by a logging system computer which stores the raw gamma cps data.
Since the concentrations of these naturally occurring radioelements vary between different
rock types, natural gamma ray logging provides an important tool for lithologic mapping and
stratigraphic correlation. For example, in sedimentary rocks, sandstones can be easily
distinguished from shales due to the low potassium content of the sandstones compared to
the shales. The greatest value of the gamma ray log in uranium exploration, however, is in
determining equivalent uranium grade.
The basis of the indirect uranium grade calculation (referred to as "eU3O8" for "equivalent
U3O8") is the sensitivity of the detector used in the probe which is the ratio of cps to known
uranium grade and is referred to as the probe calibration factor. Each detector’s sensitivity is
measured when it is first manufactured and is also periodically checked throughout the
operating life of each probe against a known set of standard "test pits," with various known
www.rpacan.com
Page 10-9 Denison Mines Corp. – Phoenix Deposit, Wheeler River Project, Project #2299 Technical Report NI 43-101 – June 17, 2014
grades of uranium mineralization or through empirical calculations. Application of the
calibration factor, along with other probe correction factors, allows for immediate grade
estimation in the field as each drill hole is logged.
Down hole total gamma data are subjected to a complex set of mathematical equations,
taking into account the specific parameters of the probe used, speed of logging, size of bore
hole, drilling fluids and presence or absence of any type of drill hole casing. The result is an
indirect measurement of uranium content within the sphere of measurement of the gamma
detector. A Denison in-house computer program known as GAMLOG converts the
measured counts per second of the gamma rays into 10 cm increments of equivalent percent
U3O8 (%eU3O8). GAMLOG is based on the Scott’s Algorithm developed by James Scott of
the Atomic Energy Commission (AEC) in 1962 and is widely used in the industry.
The conversion coefficients for conversion of probe counts per second to %eU3O8 equivalent
uranium grades are based on the calibration results obtained at the Saskatchewan Research
Council (SRC) uranium calibration pits (sodium iodide crystal) and empirical values
developed in-house (Sweet and Petrie 2010) for the triple-gamma probe (Figure 10-2)..
The Saskatchewan Research Council (SRC) down-hole probe calibration facilities are
located in Saskatoon, SK. The calibration facilities test pits consist of four variably-
mineralized holes, each approximately four metres thick. The gamma probes are tested a
minimum of four times per year, usually before and after both the winter and summer field
seasons.
Drilling procedures, including collar surveying, down hole Reflex surveying and radiometric
probing are standard industry practice.
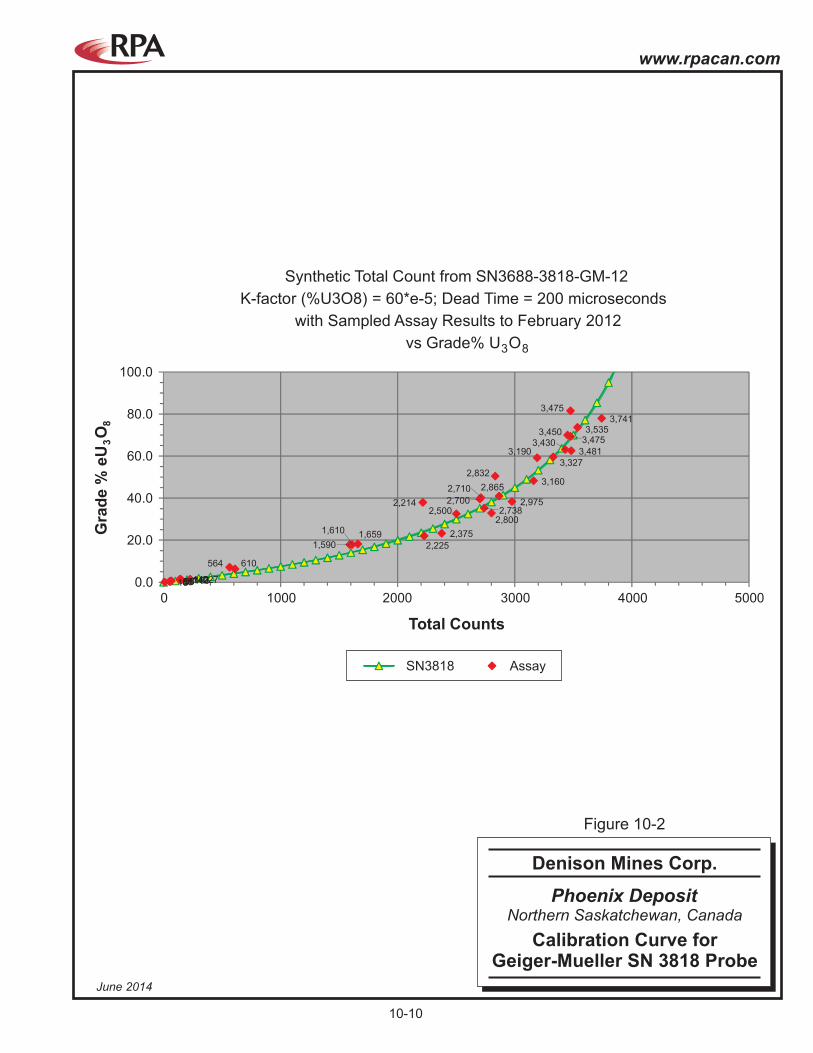
55 227105066140142
610
1,610
2,225
2,500
2,710
2,800
3,1903,430
3,327
2,375
3,481
65140
1,590
564
153
2,7382,9752,214
3,160
3,475
3,475
3,450
2,700
3,741
2,832
1,659
3,535
2,865
0.0
20.0
40.0
60.0
80.0
100.0
4000
Gra
de
%eU
3O
8
Total Counts
Synthetic Total Count from SN3688-3818-GM-12
K-factor (%U3O8) = 60*e-5; Dead Time = 200 microseconds
with Sampled Assay Results to February 2012
vs Grade% U3O8
SN3818 Assay
30000 20001000 5000
June 2014
Phoenix Deposit
Calibration Curve forGeiger-Mueller SN 3818 Probe
Denison Mines Corp.
Northern Saskatchewan, Canada
Figure 10-2
10-10
www.rpacan.com
www.rpacan.com
Page 10-11 Denison Mines Corp. – Phoenix Deposit, Wheeler River Project, Project #2299 Technical Report NI 43-101 – June 17, 2014
SAMPLING METHOD AND APPROACH
DRILL CORE HANDLING AND LOGGING PROCEDURES At each drill site, core is removed from the core tube by the drill contractors and placed
directly into three row NQ wooden core boxes with standard 1.5 m length (4.5 m total) or two
row HQ wooden boxes with standard 1.5 m (3 m total). Individual drill runs are identified with
small wooden blocks, onto which the depth in metres is recorded. Diamond drill core is
transported at the end of each drill shift to an enclosed core-handling facility at Denison’s
Wheeler River camp. The core handling procedures at the drill site are industry standard.
Drill holes are logged at the Wheeler River camp core logging facilities by Denison
personnel.
Before samples are taken for assay, the core is photographed, descriptively logged,
measured for structures, surveyed with a scintillometer, and marked for sampling. Sampling
of the holes for assay is guided by the observed geology, radiometric logs, and readings from
a hand-held scintillometer.
The general concept behind the scintillometer is similar to the gamma probe except the
radiometric pulses are displayed on a scale on the instrument and the respective count rates
are recorded manually by the technician logging the core or chips. The hand-held
scintillometer provides quantitative data only and cannot be used to calculate uranium
grades; however, it does allow the geologist to identify uranium mineralization in the core and
to select intervals for geochemical sampling, as described below.
Scintillometer readings are taken throughout the hole as part of the logging process, usually
at three metre intervals and are an average of the interval. In mineralized zones, where
scintillometer readings are above five times background (roughly 500 cps depending on the
scintillometer being used), readings are recorded over 10 cm intervals and tied to the run
interval blocks. The scintillometer profile is then plotted on strip logs to compare and adjust
the depth of the down-hole gamma logs. Core trays are marked with aluminum tags as well
as felt marker.
DRILL CORE SAMPLING Denison obtains assays for all the cored sections through mineralized intervals. All
mineralized core is measured with the scintillometer described above by removing each
www.rpacan.com
Page 10-12 Denison Mines Corp. – Phoenix Deposit, Wheeler River Project, Project #2299 Technical Report NI 43-101 – June 17, 2014
piece of drill core from the ambient background, noting the most pertinent reproducible result
in counts per second (cps), and carefully returning it to its correct place in the core box. Any
core registering over 500 cps is flagged for splitting and sent to the lab for assay. Early drill
holes were sampled using variable intervals (0.2 m to 1.0 m), but after drill hole WR-253,
were sampled using 0.5 m lengths. Barren samples are taken to flank both ends of
mineralized intersections, with flank sample lengths at least 0.5 m on either end, but may be
significantly more in areas with strong mineralization.
All core samples are split with a hand splitter according to the sample intervals marked on
the core. One-half of the core is returned to the core box for future reference and the other
half is bagged, tagged, and sealed in a plastic bag. Bags of samples for geochemical or clay
analyses are placed in large plastic pails and sealed for shipping. Bags of mineralized
samples are sealed for shipping in metal or plastic pails depending on the radioactivity level.
Several types of samples are collected routinely from drill core at Phoenix. These include:
• Systematic composite geochemical samples of both Athabasca sandstone and metamorphic basement rocks to characterize clay alteration and geochemical zoning associated with mineralization;
• Selective grab samples and split-core intervals for geochemical quantification of geologically-interesting material and mineralized material;
• Samples collected for determination of dry bulk density; and
• Non-geochemical samples for determination of mineralogy to assess alteration
patterns, lithology types, and mineralization characteristics.
Selective samples provide a quantitative assessment of mineralization grade and associated
elemental abundances, while the systematic and mineralogical samples are collected mainly
for exploration purposes to determine patterns applicable to mineral exploration. These
sampling types and approaches are typical of uranium exploration and definition drilling
programs in the Athabasca Basin.
For Systematic samples, Denison collects a suite of samples from each drill hole for
determining the content and distribution of trace elements, uranium, and clay minerals
(alteration). For ICP-MS analysis (Section 12) from the collar to approximately 350 m,
sandstone samples are collected at ten metre intervals, from 350 m to the unconformity,
sandstone samples are collected on five metre intervals. In the basement, Denison samples
on five metre intervals throughout. For inductively coupled plasma optical emission

www.rpacan.com
Page 10-13 Denison Mines Corp. – Phoenix Deposit, Wheeler River Project, Project #2299 Technical Report NI 43-101 – June 17, 2014
spectroscopy (ICP-OES) analysis (Section 12), Denison samples on 0.5 m spacing through
the mineralized zone. For the determination of clay alteration species in the sandstone
column, Denison collects samples for analysis by a PIMA analyzer. Throughout the
sandstone section, a two to three centimetre chip sample of core is collected every ten
metres up to 350 m, then every five metres to the end of hole. Near the unconformity, the
sample interval is shortened as needed. PIMA samples are also collected as needed
throughout the altered basement rocks.
The drill core handling and sampling protocols are standard in the industry.
CORE AND USE OF PROBE DATA Grade determinations in mineralized rock rely primarily on chemical assays of drill core.
Given the high rate of core recovery within the mineralized zone, chemical assays are
reliable. Locally, core can be broken and blocky, but recovery is generally good with an
average overall 89.65% recovery.
The mineralized zones (sandstones or basement), are moderately to strongly altered, and
occasionally disrupted by fault breccias. Local intervals of up to five metres with less than
80% recovery have been encountered due to washouts during the drilling process. Where
80% or less of a composited interval is recovered during drilling (>20% core loss), or where
no geochemical sampling has occurred across a mineralized interval, uranium grade
determination has been supplemented by radiometric probing. Radiometric probe data
accounts for approximately 23% of the drill holes used for the Mineral Resource estimate at
Phoenix.
There are 1,708 U3O8 assay records totalling 848 m in the Phoenix deposit database. Of
these, 1,464 U3O8 assay records totalling 726 m are in zone A and 244 U3O8 assay records
totalling 122 m are in zone B.
www.rpacan.com
Page 11-1 Denison Mines Corp. – Phoenix Deposit, Wheeler River Project, Project #2299 Technical Report NI 43-101 – June 17, 2014
11 SAMPLE PREPARATION, ANALYSES AND SECURITY As described in Section 10 Drilling, core from the Phoenix deposit and other parts of the
Wheeler River Property is photographed, logged, marked for sampling, split, bagged, and
sealed for shipment by Denison personnel at their field logging facility. All samples for assay
or geochemical analyses are sent to the Saskatchewan Research Council Geoanalytical
Laboratories (SRC) in Saskatoon, SK. Samples for clay analyses are sent to Rekasa Rocks
Inc., in Saskatoon. All samples for geochemical or clay analyses are shipped to Saskatoon
by airfreight or ground transport. All samples for U3O8 assays are transported by land to the
SRC lab by Denison personnel. SRC performs sample preparation on all samples submitted
to them. There is no sample preparation involved for the samples sent for clay analyses.
The following sections are copied or paraphrased from the September 22, 2010 SRC Sample
Report to Denison and from SRC 2009 documentation.
SAMPLE PREPARATION AND ANALYTICAL PROCEDURES
SAMPLE RECEIVING Samples are received at the SRC laboratory as either dangerous goods (qualified Transport
of Dangerous goods (TDG) personnel required) or as exclusive use only samples (no
radioactivity documentation attached). On arrival, samples are assigned an SRC group
number and are entered into the Laboratory Information Management System (LIMS).
All received sample information is verified by sample receiving personnel: sample numbers,
number of pails, sample type/matrix, condition of samples, request for analysis, etc. The
samples are then sorted by radioactivity level. A sample receipt and sample list is then
generated and e-mailed to the appropriate authorized personnel at Denison. Denison is
notified if there are any discrepancies between the paperwork and samples received.
SAMPLE SORTING To ensure that there is no cross contamination between sandstone and basement, non-
mineralized, low level, and high-level mineralized samples, they are sorted by their matrix
www.rpacan.com
Page 11-2 Denison Mines Corp. – Phoenix Deposit, Wheeler River Project, Project #2299 Technical Report NI 43-101 – June 17, 2014
and radioactivity level. Samples are firstly sorted in their group into matrix type (sandstone
and basement/mineralized).
Then the samples are checked for their radioactivity levels. Using a Radioactivity Detector
System, the samples are classified into one of the following levels:
• “Red Line” (minimal radioactivity) <500 counts/second • “1 Dot” 500 – 1,999 counts/second • “2 Dots” 2000 – 2,999 counts/second • “3 Dots” 3000 – 3,999 counts/second • “4 Dots” 4000 – 4,999 counts/second • “UR” (unreadable) >5,000 counts/second
The samples are then sorted into ascending sample numerical order and transferred to their
matrix designated drying oven.
SAMPLE PREPARATION After the drying process is complete, “Red line” and “1 dot” samples are sent for further
processing (crushing and grinding) in the main SRC laboratory. This is done in the
Basement preparation area. All radioactive samples at “2 dots” or higher are sent to a
secure radioactive facility at SRC for the same sample preparation. Plastic snap top vials
are labelled according to sample numbers and sent with the samples to the appropriate
crushing room. All highly radioactive materials are kept in a radioactive bunker until they can
be transported by TDG trained individuals to the radioactivity facility for processing.
Rock samples are jaw crushed to 60% passing -2 mm. Samples are placed into the crusher
(one at a time) and the crushed material is put through a splitter. The operator ensures that
the distribution of the material is even so there is no bias in the sampling. One portion of the
material is placed into the plastic snap top vial and the other is put in the sample bag (reject).
The first sample from each group will be checked for crushing efficiency by screening the vial
of rock through a 2 mm screen. A calculation is then carried out to ensure that 60% of the
material is -2 mm. If the quality control (QC) check fails the crushing is redone and checked
for crushing efficiency; if it still fails the QC department is notified and corrective action is
taken.
The crusher, crusher catch pan, splitter, and splitter catch pan is cleaned between each
sample using compressed air.
www.rpacan.com
Page 11-3 Denison Mines Corp. – Phoenix Deposit, Wheeler River Project, Project #2299 Technical Report NI 43-101 – June 17, 2014
The reject material is returned to its original sample bag and archived in a plastic pail with the
appropriate group number marked on the outside of the pail. The vials of material are then
sent to grinding; each vial of material is placed in pots (six pots per grind) and ground for two
minutes. The material is then returned to the vials. The operator then shakes the vial to
check the fineness of the material by looking for visible grains and listening for rattling. The
sample is then screened through a 106 μm sieve, using water. The sample is then dried and
weighed, to pass the grinding efficiency QC there must be over 90% of the material at -106
μm. The material is then transferred to a labelled plastic snap top vial.
The pots are cleaned out with silica sand and blown out with compressed air at the start of
each group. In the radioactive facility the pots are cleaned with water. Once sample pulps
are generated they are then returned to the main laboratory to be chemically processed prior
to analysis. All containers are identified with sample information and their radioactivity status
at all times. When the preparation is completed the radioactive pulps are then returned to a
secure radioactive bunker, until they can be transported back to the radioactive facility. All
rejected sample material not involved in the grinding process is returned to the original
sample container. All highly radioactive materials are stored in secure radioactive
designated areas.
Sample preparation methods for the samples used in the Phoenix Mineral Resource estimate
meet or exceed industry standards.
ANALYTICAL METHODS METHOD: ICP1-URANIUM MULTI-ELEMENT EXPLORATION ANALYSIS BY ICP-OES Method Summary: In ICP-OES analysis, the atomized sample material is ionized and the
ions then emit light (photons) of a characteristic wavelength for each element, which is
recorded by optical spectrometers. Calibrations against standard materials allow this
technique to provide a quantitative geochemical analysis.
The analytical package includes 62 analytes (46 total digestion, 16 partial digestion), with
nine analytes being analyzed for both partial and total digestions (Ag, Co, Cu, Mo, Ni, Pb, U,
V, and Zn) plus boron. These samples are also sometimes analyzed for Au by fire assay
means.
www.rpacan.com
Page 11-4 Denison Mines Corp. – Phoenix Deposit, Wheeler River Project, Project #2299 Technical Report NI 43-101 – June 17, 2014
Partial Digestion: An aliquot of pulp is digested in a digestion tube in a mixture of
HNO3:HCl, in a hot water bath for approximately one hour, then diluted to 15 mL using de-
ionized water.
Total Digestion: An aliquot of pulp is digested to dryness in a hot block digestor system
using a mixture of concentrated HF:HNO3:HClO4. The residue is dissolved in 15 ml of dilute
HNO3.
METHOD: U3O8 WT% ASSAY - THE DETERMINATION OF U3O8 WT% IN SOLID SAMPLES BY ICP-OES Method Summary: When ICP1 U values are >=1000 ppm sample pulps are re-assayed for
U3O8 using SRC's ISO/IEC 17025:2005-accredited U3O8 (wt%) method. In the case of
uranium assay by ICP-OES, a pulp is already generated from the first phase of preparation
and assaying (discussed above).
Figure 11-1 shows a plot of Phoenix analyses by the Wt% Method against analyses by the
Partial Method. It can be seen that the correlation is excellent.
Aqua Regia Digestion: An aliquot of sample pulp is digested in a 100 mL volumetric flask in
a mixture of 3:1 HCl:HNO3, on a hot plate for approximately one hour, then diluted to volume
using de-ionized water. Samples are diluted prior to analysis by ICP-OES.
Instrument Analysis: Instruments in the analysis are calibrated using certified commercial
solutions. The instruments used were PerkinElmer Optima 300DV, Optima 4300DV or
Optima 5300DV.
Detection Limits: 0.001% U3O8
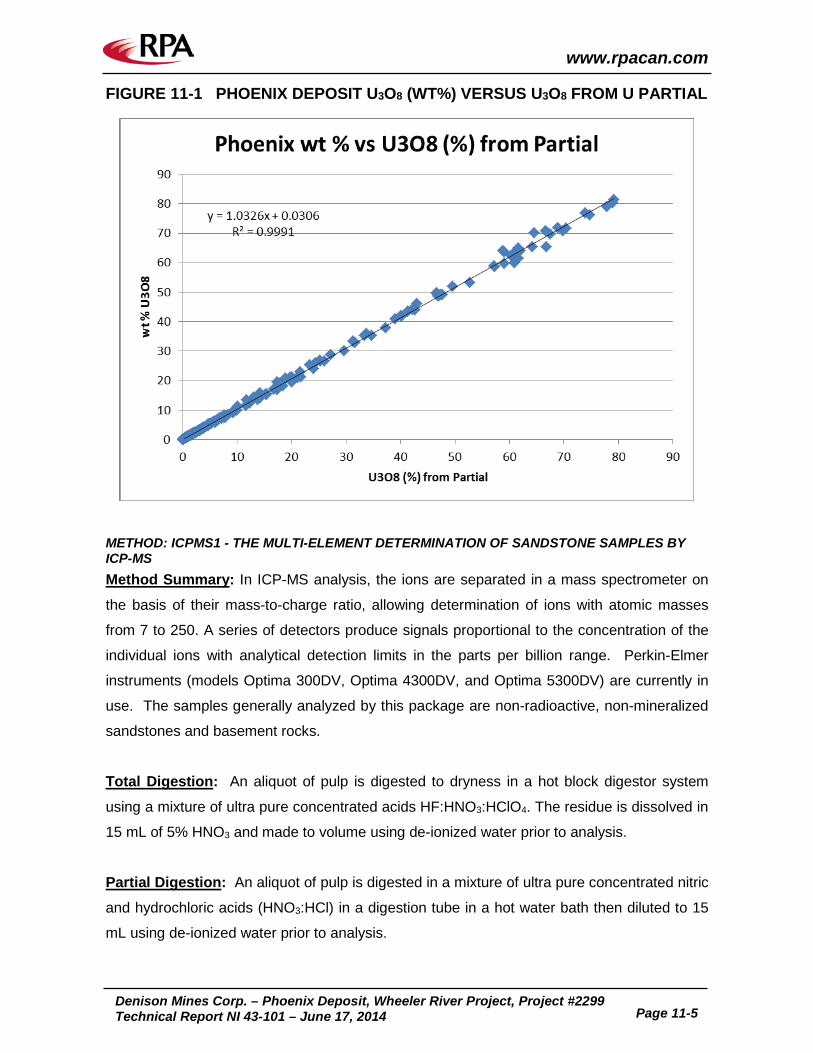
www.rpacan.com
Page 11-5 Denison Mines Corp. – Phoenix Deposit, Wheeler River Project, Project #2299 Technical Report NI 43-101 – June 17, 2014
FIGURE 11-1 PHOENIX DEPOSIT U3O8 (WT%) VERSUS U3O8 FROM U PARTIAL
METHOD: ICPMS1 - THE MULTI-ELEMENT DETERMINATION OF SANDSTONE SAMPLES BY ICP-MS Method Summary: In ICP-MS analysis, the ions are separated in a mass spectrometer on
the basis of their mass-to-charge ratio, allowing determination of ions with atomic masses
from 7 to 250. A series of detectors produce signals proportional to the concentration of the
individual ions with analytical detection limits in the parts per billion range. Perkin-Elmer
instruments (models Optima 300DV, Optima 4300DV, and Optima 5300DV) are currently in
use. The samples generally analyzed by this package are non-radioactive, non-mineralized
sandstones and basement rocks.
Total Digestion: An aliquot of pulp is digested to dryness in a hot block digestor system
using a mixture of ultra pure concentrated acids HF:HNO3:HClO4. The residue is dissolved in
15 mL of 5% HNO3 and made to volume using de-ionized water prior to analysis.
Partial Digestion: An aliquot of pulp is digested in a mixture of ultra pure concentrated nitric
and hydrochloric acids (HNO3:HCl) in a digestion tube in a hot water bath then diluted to 15
mL using de-ionized water prior to analysis.
www.rpacan.com
Page 11-6 Denison Mines Corp. – Phoenix Deposit, Wheeler River Project, Project #2299 Technical Report NI 43-101 – June 17, 2014
Geochemical Analysis: ICP-OES: Multi element total digestion:
The ICP MS detection limits for total analysis include all elements except those noted below:
Al2O3, CaO, Fe2O3, K2O, MgO, MnO, Na2O, P2O5, TiO2, Ba, Ce, Cr, La, Li, Sr and Zr.
These elements are analyzed only by ICP for total digestion leaching. Instruments are
calibrated using certified commercial solutions. The instruments used are PerkinElmer
Optima 300DV, Optima 4300DV or Optima 5300DV.
Partial digestions by ICP MS: As, Ge, Hg, Sb, Se and Te are done on the partial digestion
only, these elements are not suited to the total digestion analysis. The ICP-MS instruments
used are Perkin Elmer Elan DRC II.
ANALYTICAL QUALITY ASSURANCE AND QUALITY CONTROL The SRC laboratory has a Quality Assurance program dedicated to active evaluation and
continual improvement in the internal quality management system. The laboratory is
accredited by the Standards Council of Canada as an ISO/IEC 17025 Laboratory for Mineral
Analysis Testing and is also accredited ISO/IEC 17025:2005 for the analysis of U3O8. The
laboratory is licensed by the Canadian Nuclear Safety Commission (CNSC) for possession,
transfer, import, export, use, and storage of designated nuclear substances by CNSC
License Number 01784-1-09.3. As such, the laboratory is closely monitored and inspected
by the CNSC for compliance.
SRC is an independent laboratory, and no associate, employee, officer or director of Denison
is, or ever has been, involved in any aspect of sample preparation or analysis on samples
from the Phoenix deposit.
The SRC uses a Laboratory Management System (LMS) for Quality Assurance. The LMS
operates in accordance with ISO/IEC 17025:2005 (CAN-P-4E) “General Requirements for
the Competence of Mineral Testing and Calibration laboratories” and is also compliant to
CAN-P-1579 “Guidelines for Mineral Analysis Testing Laboratories”. The laboratory
continues to participate in proficiency testing programs organized by CANMET
(CCRMP/PTP-MAL). All analyses are conducted by SRC, a Standards Council of Canada
(CCRMP) certified analytical laboratory, which has specialized in the field of uranium
research and analysis for over 30 years.
www.rpacan.com
Page 11-7 Denison Mines Corp. – Phoenix Deposit, Wheeler River Project, Project #2299 Technical Report NI 43-101 – June 17, 2014
All instruments are calibrated using certified materials. Within each batch of 40 samples, two
quality control samples are inserted (e.g., CG515 or LS4). One in every 40 samples is
analyzed in duplicate; the reproducibility of this is 5%. Before the results leave the laboratory
the standards, blanks, and split replicates are checked for accuracy, only when the senior
scientist is fully satisfied with the results will they be issued. If for any reason there is a failure
in an analysis the subgroup affected will be reanalyzed, and checked again. A Corrective
Action Report will be issued and the problem is investigated fully to ensure that any
measures to prevent the reoccurrence can and will be taken. All human and analytical errors
are, where possible, eliminated. If the laboratory suspects any bias, the samples are re-
analyzed and corrective measures are taken.
Quality control samples (reference materials, blanks and duplicates) are included with each
analytical run, based on the rack sizes associated with the method. The rack size is the
number of samples (including QC samples) within a batch. Blanks are inserted at the
beginning, standards are inserted at random positions, and duplicates are analysed at the
end of the batch. Quality control samples are inserted based on the following rack sizes
specific to the method (Table 11-1):
TABLE 11-1 QUALITY CONTROL SAMPLE ALLOCATIONS
Denison Mines Corp. – Phoenix Deposit
Rack Size
Methods Quality Control Sample Allocation
20 Specialty methods including specific gravity, bulk density, and acid insolubility
2 standards, 1 duplicate, 1 blank
28 Specialty fire assay, assay-grade, umpire and concentrate methods
1 standard, 1 duplicate, 1 blank
40 Regular AAS, ICP-AES and ICP-MS methods
2 standards, 1 duplicate, 1 blank
84 Regular fire assay methods
2 standards, 3 duplicates, 1 blank
SECURITY AND CONFIDENTIALITY SRC considers customer confidentially and security of utmost importance and takes
appropriate steps to protect the integrity of sample processing at all stages from sample
storage and handling to transmission of results. All electronic information is password
protected and backed up on a daily basis. Electronic results are transmitted with additional
security features. Access to SRC Geoanalytical laboratories’ premises is restricted by an
www.rpacan.com
Page 11-8 Denison Mines Corp. – Phoenix Deposit, Wheeler River Project, Project #2299 Technical Report NI 43-101 – June 17, 2014
electronic security system. The facilities at the main lab are regularly patrolled by security
guards 24 hours a day.
After the analyses described above are completed, analytical data are securely sent using
electronic transmission of the results, by SRC to Denison. The electronic results are secured
using WINZIP encryption and password protection. These results are provided as a series of
Adobe PDF files containing the official analytical results and a Microsoft Excel spreadsheet
file containing only the analytical results.
In RPA’s opinion, sample preparation, security, and analytical procedures meet industry
standards.
www.rpacan.com
Page 12-1 Denison Mines Corp. – Phoenix Deposit, Wheeler River Project, Project #2299 Technical Report NI 43-101 – June 17, 2014
12 DATA VERIFICATION In order to verify that the data in the Phoenix deposit database are acceptable for Mineral
Resource estimation purposes, a review of the transfer of data from logging through to the
final database was completed. The data files supplied by Denison comprise 311 drill holes
for the Wheeler River Property that include:
• Drill hole collar position data (electronic format) • Down hole survey data (electronic format) • Sample assays (electronic format) • Borehole natural gamma data (electronic format) • Lithology data (electronic format) • Structure interpretation (electronic format) • Property location maps (electronic format)
The data were supplied in .xls, .csv, .txt, .jpg or .dxf formatted files.
QA/QC PROGRAM Denison has developed and documented several Quality Assurance and Quality Control
(QA/QC) procedures and protocols for all exploration projects operated by Denison (Denison
Mines 2009-2011). RPA reviewed Denison’s procedures and protocols and considers them
to be reasonable and acceptable.
DRILL HOLE DATABASE CHECK Denison conducted audits of historic records to ensure that the grade, thickness, elevation,
and location of uranium mineralization used in preparing the current uranium resource
estimate correspond to mineralization. The quality control measures and the data verification
procedures included the following:
• Surveyed drill hole collar coordinates and drill hole deviations were entered in the database, displayed in plan views and sections and visually compared to relative locations of the holes.
• Core logging information was visually validated on plan views and sections and
verified against photographs of the core or the core itself when questions were raised during the geological interpretation process.
www.rpacan.com
Page 12-2 Denison Mines Corp. – Phoenix Deposit, Wheeler River Project, Project #2299 Technical Report NI 43-101 – June 17, 2014
• Downhole radiometric probing results were compared with radioactivity measurements made on the core and drilling depth measurements.
• The uranium grade based on radiometric probing was validated with sample assay
results.
• The information in the database was compared against assay certificates and original probing data files.
The Phoenix deposit drill hole database has been verified on multiple occasions by Denison
geologists and external consultants. The resource database is considered adequate by RPA
to prepare a Mineral Resource estimate.
EXTERNAL LABORATORY CHECK ANALYSIS In addition to the QA/QC described above, Denison sends one in every 25 samples to the
SRC’s Delayed Neutron Counting (DNC) laboratory, a separate lab facility located at SRC
Analytical Laboratories in Saskatoon to compare the values using two different methods, by
two separate labs.
The DNC method is specific for uranium and no other elements are analyzed by this
technique. The DNC system detects neutrons emitted by the fission of U-235 in the sample,
and the instrument response is compared to the response from known reference materials to
determine the concentration of uranium in the sample. In order for the analysis to work, the
uranium must be in its natural isotopic ratio. Enriched or depleted U cannot be analyzed
accurately by DNC.
Per SRC (2009) documents the method summary for the DNC technique is as follows.
Samples previously prepared as pulps for ICP Total Digestion are used for the DNC analysis.
The pulps are irradiated in a Slowpoke 2 nuclear reactor for a given period of time. After
irradiation, the samples are pneumatically transferred to a counting system equipped with six
helium-3 detectors. After a suitable delay period, neutrons emanating from the sample are
counted. The proportion of delayed neutrons emitted is related to the uranium concentration.
For low concentrations of uranium, a minimum of one gram of sample is preferred, and larger
sample sizes (two to five grams) will improve precision. Several blanks and certified uranium
standards are analyzed to establish the instrument calibration. In addition, control samples
are analyzed with each batch of samples to monitor the stability of the calibration. At least

www.rpacan.com
Page 12-3 Denison Mines Corp. – Phoenix Deposit, Wheeler River Project, Project #2299 Technical Report NI 43-101 – June 17, 2014
one in every ten samples is analyzed in duplicate. The results of the instrument calibration,
blanks, control samples, and duplicates must be within specified limits otherwise corrective
action is required.
Analysis for U by DNC incorporates four separate flux/site conditions of varying sensitivity to
produce an effective range of analysis from zero to 150,000 µg U per capsule (samples of up
to 90% U can be analyzed by weighing a fraction of a gram to ensure that there is no more
than 150000 µg U in the capsule). Each condition is calibrated using between three and
seven reference materials. For each condition, one of these materials is designated as a
calibration check sample. As well, there is an independent control sample for each condition.
There are 48 assay pairs that used both ICP-OES Total Digestion and the DNC assay
technique. Figure 12-1 shows the correlation between the SRC Geoanalytical Lab, and the
SRC Analytical Lab. It can be seen that correlation is excellent. Uranium grades obtained
with the DNC technique were used only as check assays and were not directly used for
Mineral Resource estimation
FIGURE 12-1 U3O8 DNC VERSUS ICP-OES ASSAY VALUES
y = 1.0174x - 0.007R² = 0.999
0
10
20
30
40
50
60
70
80
90
0 10 20 30 40 50 60 70 80 90
U3O
8FI
nal (
%)
U3O8 DNC (%)
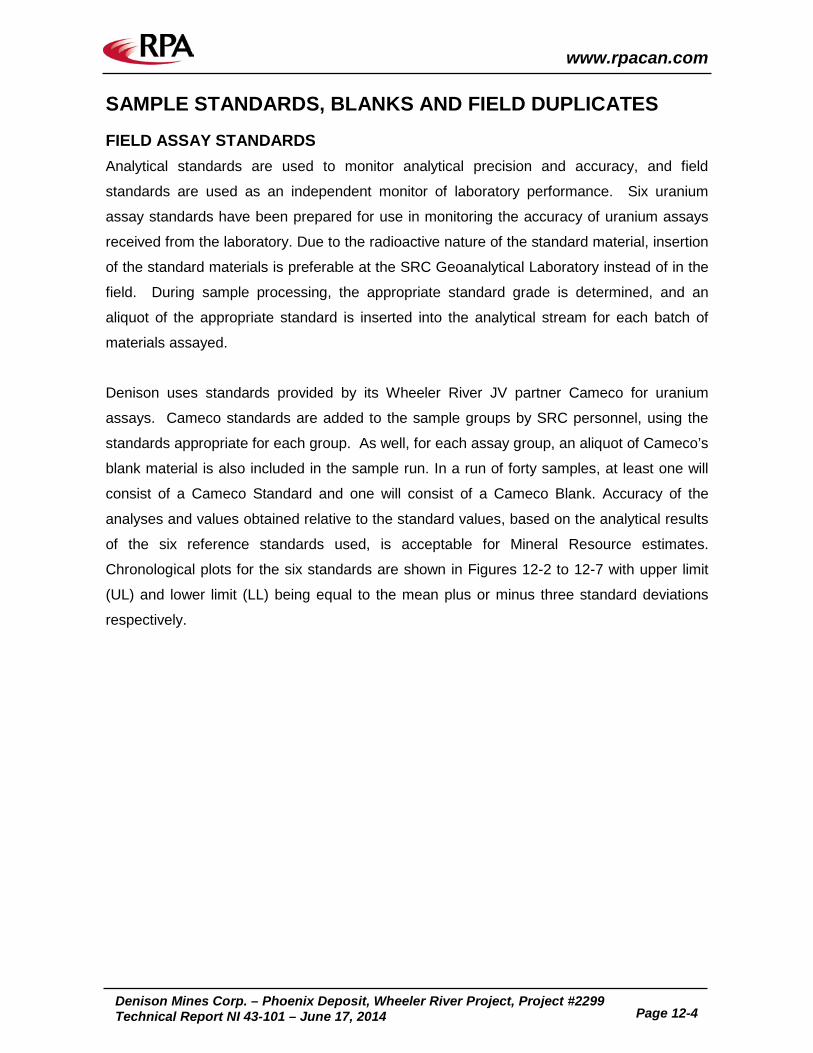
www.rpacan.com
Page 12-4 Denison Mines Corp. – Phoenix Deposit, Wheeler River Project, Project #2299 Technical Report NI 43-101 – June 17, 2014
SAMPLE STANDARDS, BLANKS AND FIELD DUPLICATES
FIELD ASSAY STANDARDS Analytical standards are used to monitor analytical precision and accuracy, and field
standards are used as an independent monitor of laboratory performance. Six uranium
assay standards have been prepared for use in monitoring the accuracy of uranium assays
received from the laboratory. Due to the radioactive nature of the standard material, insertion
of the standard materials is preferable at the SRC Geoanalytical Laboratory instead of in the
field. During sample processing, the appropriate standard grade is determined, and an
aliquot of the appropriate standard is inserted into the analytical stream for each batch of
materials assayed.
Denison uses standards provided by its Wheeler River JV partner Cameco for uranium
assays. Cameco standards are added to the sample groups by SRC personnel, using the
standards appropriate for each group. As well, for each assay group, an aliquot of Cameco’s
blank material is also included in the sample run. In a run of forty samples, at least one will
consist of a Cameco Standard and one will consist of a Cameco Blank. Accuracy of the
analyses and values obtained relative to the standard values, based on the analytical results
of the six reference standards used, is acceptable for Mineral Resource estimates.
Chronological plots for the six standards are shown in Figures 12-2 to 12-7 with upper limit
(UL) and lower limit (LL) being equal to the mean plus or minus three standard deviations
respectively.
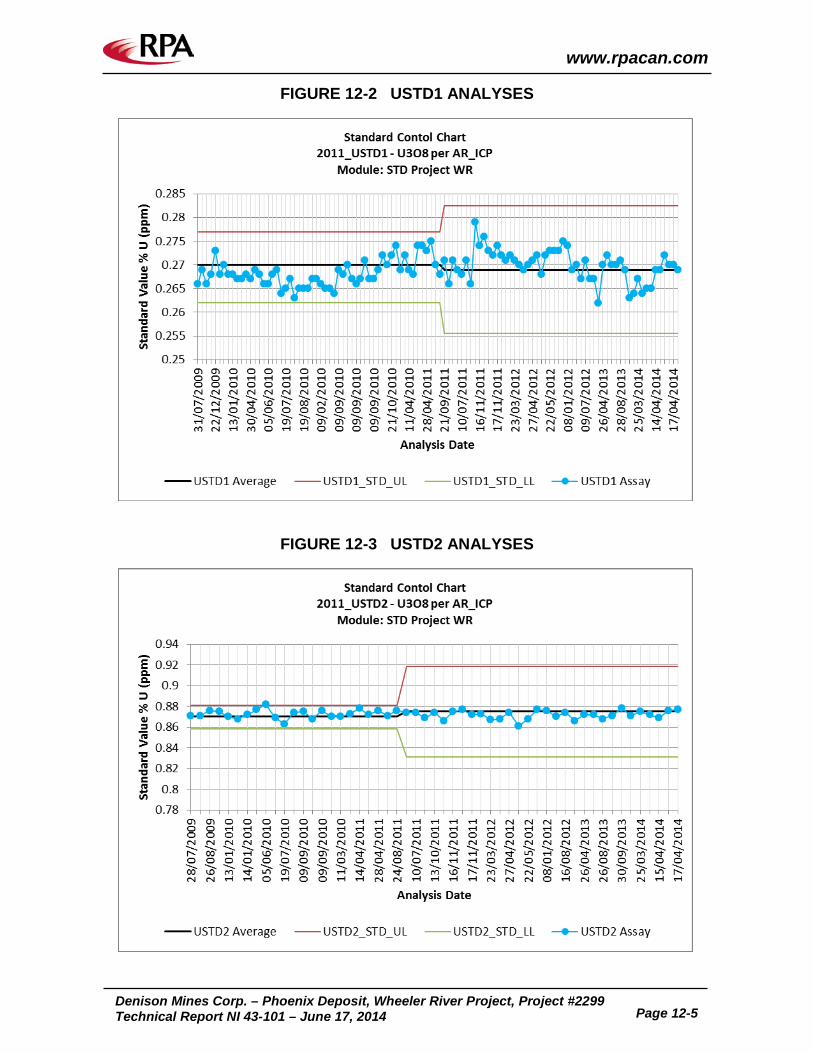
www.rpacan.com
Page 12-5 Denison Mines Corp. – Phoenix Deposit, Wheeler River Project, Project #2299 Technical Report NI 43-101 – June 17, 2014
FIGURE 12-2 USTD1 ANALYSES
FIGURE 12-3 USTD2 ANALYSES
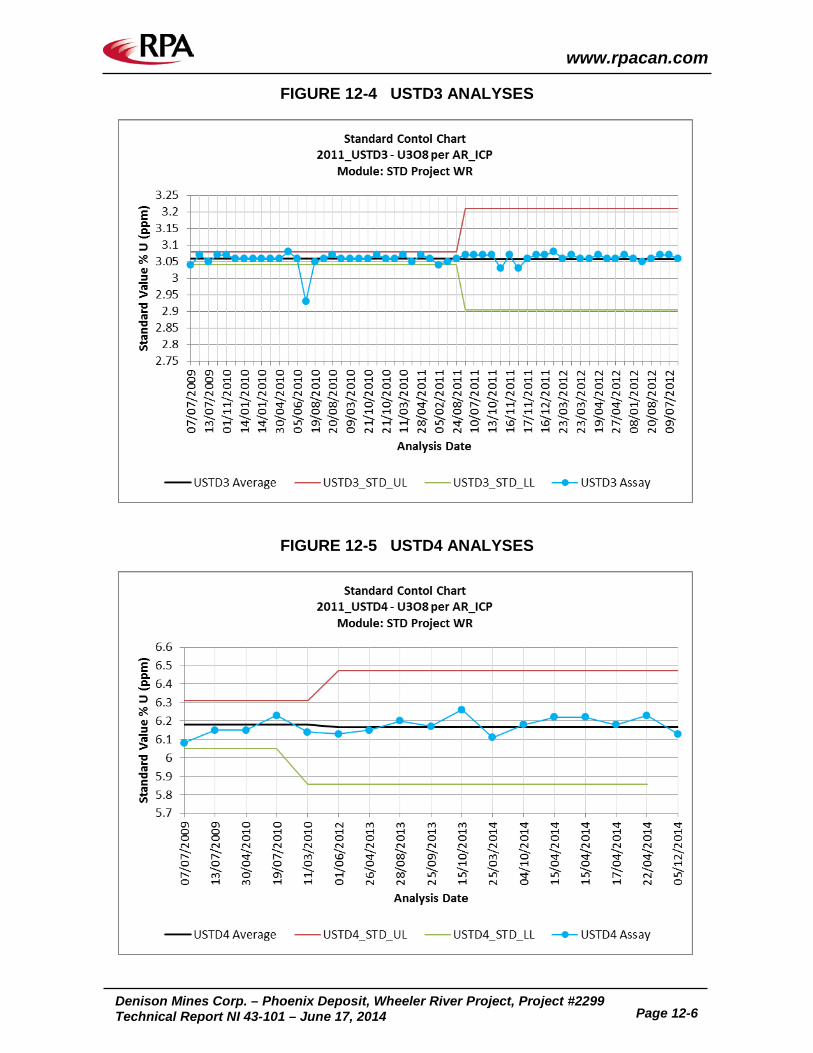
www.rpacan.com
Page 12-6 Denison Mines Corp. – Phoenix Deposit, Wheeler River Project, Project #2299 Technical Report NI 43-101 – June 17, 2014
FIGURE 12-4 USTD3 ANALYSES
FIGURE 12-5 USTD4 ANALYSES
www.rpacan.com
Page 12-7 Denison Mines Corp. – Phoenix Deposit, Wheeler River Project, Project #2299 Technical Report NI 43-101 – June 17, 2014
FIGURE 12-6 USTD5 ANALYSES
FIGURE 12-7 USTD6 ANALYSES
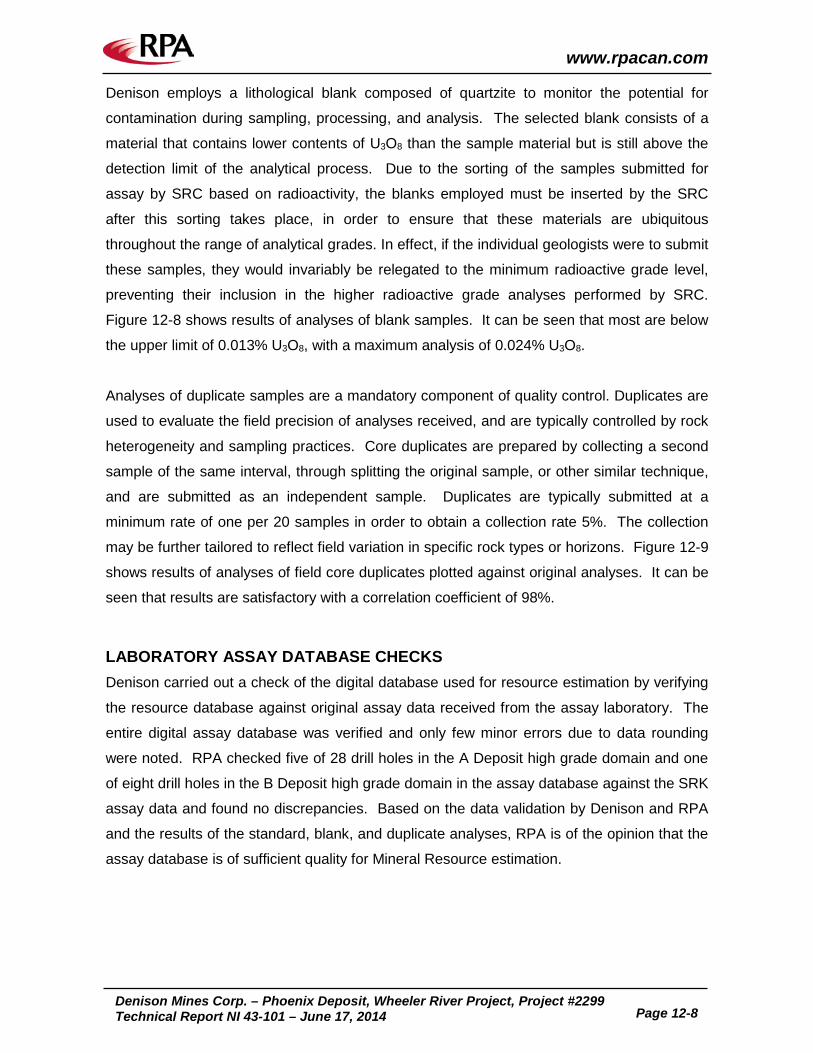
www.rpacan.com
Page 12-8 Denison Mines Corp. – Phoenix Deposit, Wheeler River Project, Project #2299 Technical Report NI 43-101 – June 17, 2014
Denison employs a lithological blank composed of quartzite to monitor the potential for
contamination during sampling, processing, and analysis. The selected blank consists of a
material that contains lower contents of U3O8 than the sample material but is still above the
detection limit of the analytical process. Due to the sorting of the samples submitted for
assay by SRC based on radioactivity, the blanks employed must be inserted by the SRC
after this sorting takes place, in order to ensure that these materials are ubiquitous
throughout the range of analytical grades. In effect, if the individual geologists were to submit
these samples, they would invariably be relegated to the minimum radioactive grade level,
preventing their inclusion in the higher radioactive grade analyses performed by SRC.
Figure 12-8 shows results of analyses of blank samples. It can be seen that most are below
the upper limit of 0.013% U3O8, with a maximum analysis of 0.024% U3O8.
Analyses of duplicate samples are a mandatory component of quality control. Duplicates are
used to evaluate the field precision of analyses received, and are typically controlled by rock
heterogeneity and sampling practices. Core duplicates are prepared by collecting a second
sample of the same interval, through splitting the original sample, or other similar technique,
and are submitted as an independent sample. Duplicates are typically submitted at a
minimum rate of one per 20 samples in order to obtain a collection rate 5%. The collection
may be further tailored to reflect field variation in specific rock types or horizons. Figure 12-9
shows results of analyses of field core duplicates plotted against original analyses. It can be
seen that results are satisfactory with a correlation coefficient of 98%.
LABORATORY ASSAY DATABASE CHECKS Denison carried out a check of the digital database used for resource estimation by verifying
the resource database against original assay data received from the assay laboratory. The
entire digital assay database was verified and only few minor errors due to data rounding
were noted. RPA checked five of 28 drill holes in the A Deposit high grade domain and one
of eight drill holes in the B Deposit high grade domain in the assay database against the SRK
assay data and found no discrepancies. Based on the data validation by Denison and RPA
and the results of the standard, blank, and duplicate analyses, RPA is of the opinion that the
assay database is of sufficient quality for Mineral Resource estimation.
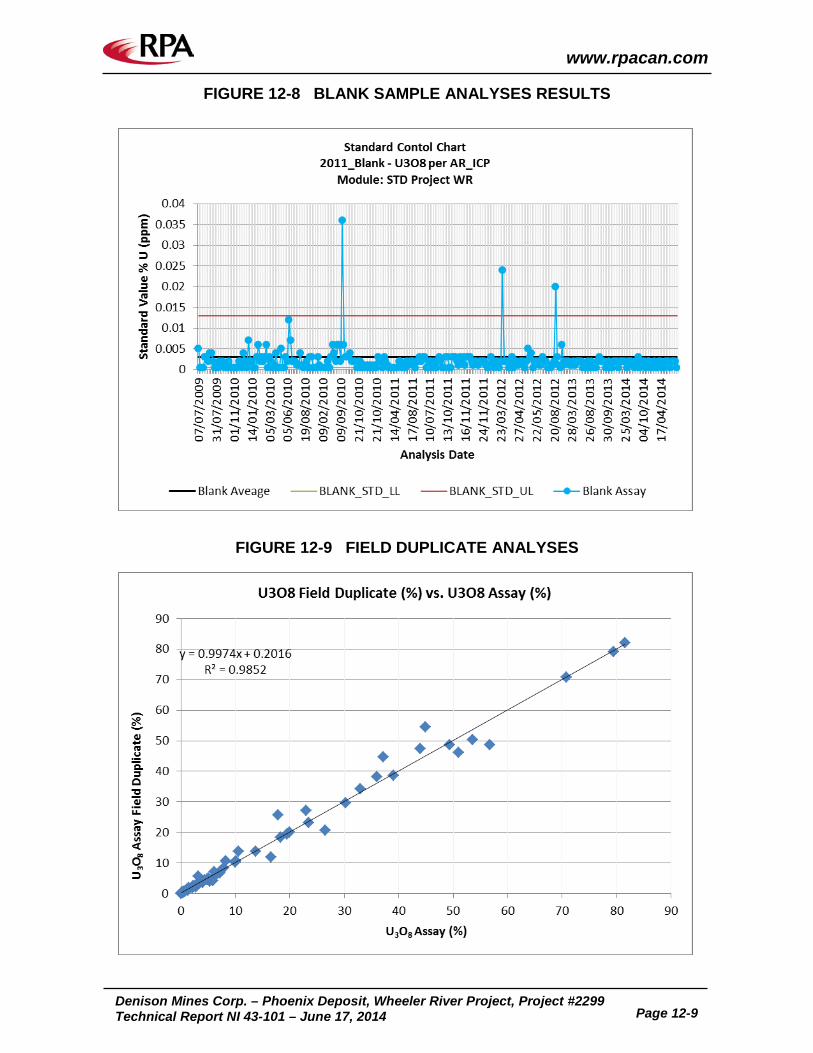
www.rpacan.com
Page 12-9 Denison Mines Corp. – Phoenix Deposit, Wheeler River Project, Project #2299 Technical Report NI 43-101 – June 17, 2014
FIGURE 12-8 BLANK SAMPLE ANALYSES RESULTS
FIGURE 12-9 FIELD DUPLICATE ANALYSES
www.rpacan.com
Page 12-10 Denison Mines Corp. – Phoenix Deposit, Wheeler River Project, Project #2299 Technical Report NI 43-101 – June 17, 2014
DISEQUILIBRIUM Radioactive isotopes lose energy by emitting radiation and transition to different isotopes in a
‘decay series’ or ‘decay chain’ until they eventually reach a stable non-radioactive state.
Decay chain isotopes are referred to as ‘daughters’ of the ‘parent’ isotope. When all the
decay products are maintained in close association with uranium-238 for the order of a
million years, the daughter isotopes will be in equilibrium with the parent. Disequilibrium
occurs when one or more decay products is dispersed as a result of differences in solubility
between uranium and its daughters, and/or escape of radon gas.
Knowledge of, and correction for, disequilibrium is important for deposits whose grade is
measured by gamma-ray probes. Disequilibrium is considered positive when there is a
higher proportion of uranium present compared to daughters. This is the case where decay
products have been transported elsewhere or uranium has been added by, for example,
secondary enrichment. Positive disequilibrium has a disequilibrium factor which is greater
than 1.0. Disequilibrium is considered negative where daughters are accumulated and
uranium is depleted. This so called ‘negative’ disequilibrium has a disequilibrium factor of
less than 1.0 but not less than zero.
Disequilibrium is determined by comparing uranium grades measured by chemical analyses
with the ‘gamma only’ radiometric grade of the same samples measured in a laboratory.
There are practical difficulties in comparing chemical analyses of uranium from drill hole
samples with corresponding values from borehole gamma logging, because of the difference
in sample size between drill core (average grades in core or chip samples) and radiometric
probe measurements (gamma response from spheres of influence up to one metre in
diameter). Also, any probe calibration (and/or assay) error can be misinterpreted as
disequilibrium. If the gamma radiation emitted by the daughter products of uranium is in
balance with the actual uranium content of the measured interval (assay), then uranium
grade can be calculated solely from the gamma intensity measurement.
Denison routinely compares borehole natural gamma data to chemical assays as part of its
QA/QC program as exampled in Figures 12-10 to 12-18. The down hole depths for gamma
results in Figures 12-10 to 12-18 have not been corrected for depth so they do not
correspond exactly to the chemical assay depths. Reasonable uranium grades can be
calculated from the triple gamma probe (Geiger Mueller, or GM, tube) empirical data up to
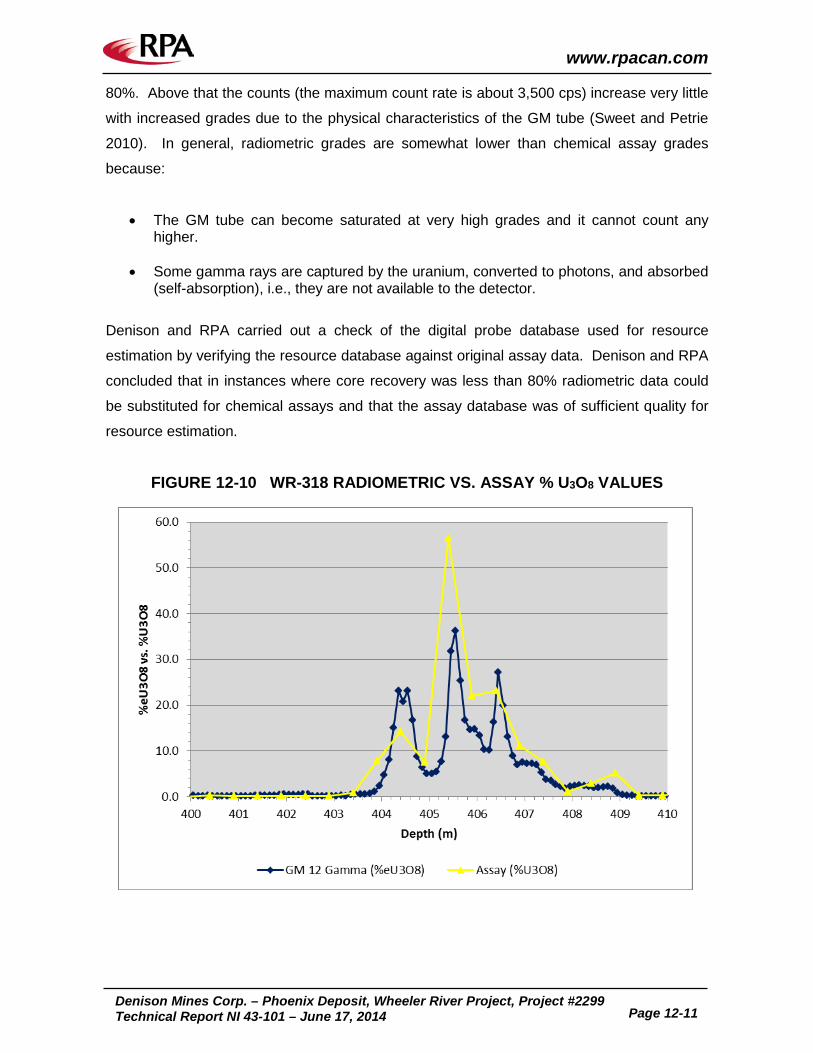
www.rpacan.com
Page 12-11 Denison Mines Corp. – Phoenix Deposit, Wheeler River Project, Project #2299 Technical Report NI 43-101 – June 17, 2014
80%. Above that the counts (the maximum count rate is about 3,500 cps) increase very little
with increased grades due to the physical characteristics of the GM tube (Sweet and Petrie
2010). In general, radiometric grades are somewhat lower than chemical assay grades
because:
• The GM tube can become saturated at very high grades and it cannot count any higher.
• Some gamma rays are captured by the uranium, converted to photons, and absorbed (self-absorption), i.e., they are not available to the detector.
Denison and RPA carried out a check of the digital probe database used for resource
estimation by verifying the resource database against original assay data. Denison and RPA
concluded that in instances where core recovery was less than 80% radiometric data could
be substituted for chemical assays and that the assay database was of sufficient quality for
resource estimation.
FIGURE 12-10 WR-318 RADIOMETRIC VS. ASSAY % U3O8 VALUES
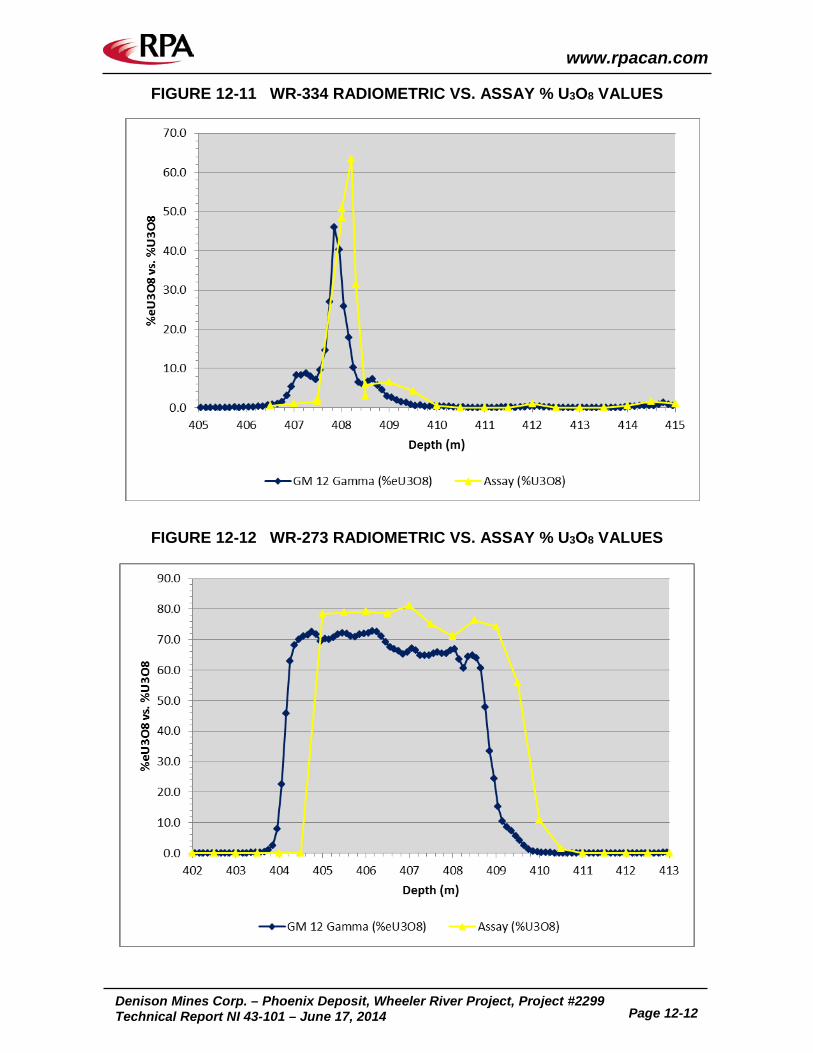
www.rpacan.com
Page 12-12 Denison Mines Corp. – Phoenix Deposit, Wheeler River Project, Project #2299 Technical Report NI 43-101 – June 17, 2014
FIGURE 12-11 WR-334 RADIOMETRIC VS. ASSAY % U3O8 VALUES
FIGURE 12-12 WR-273 RADIOMETRIC VS. ASSAY % U3O8 VALUES
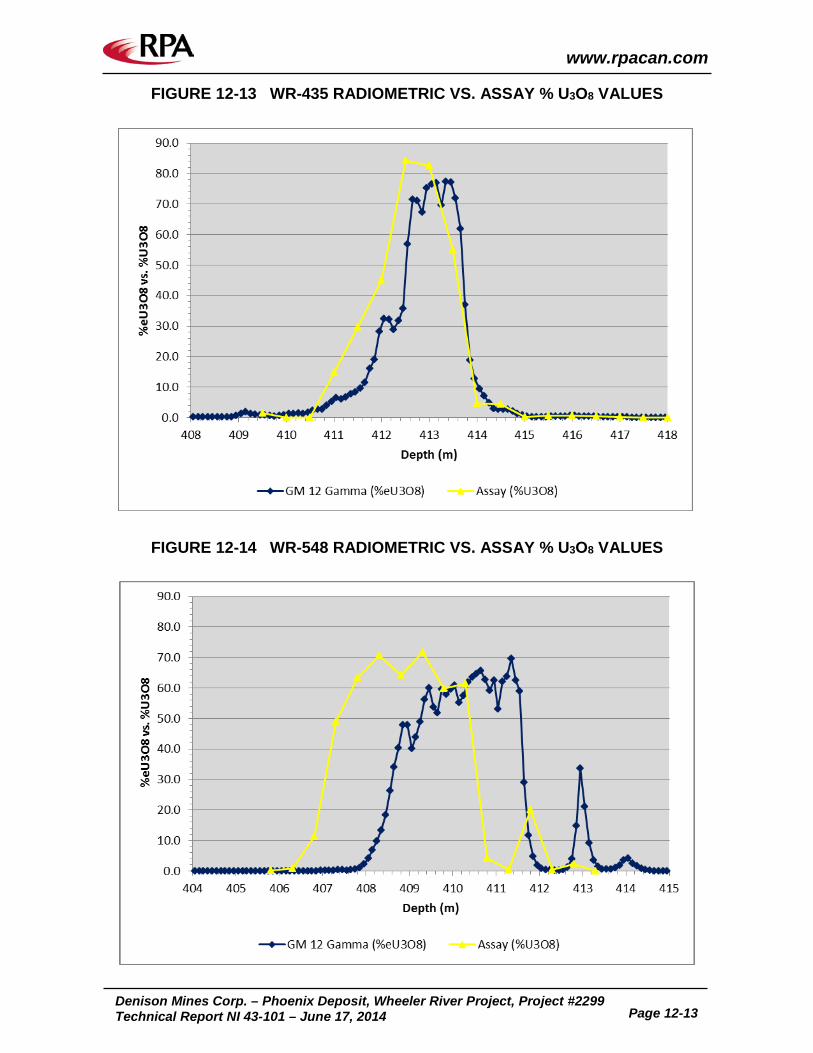
www.rpacan.com
Page 12-13 Denison Mines Corp. – Phoenix Deposit, Wheeler River Project, Project #2299 Technical Report NI 43-101 – June 17, 2014
FIGURE 12-13 WR-435 RADIOMETRIC VS. ASSAY % U3O8 VALUES
FIGURE 12-14 WR-548 RADIOMETRIC VS. ASSAY % U3O8 VALUES
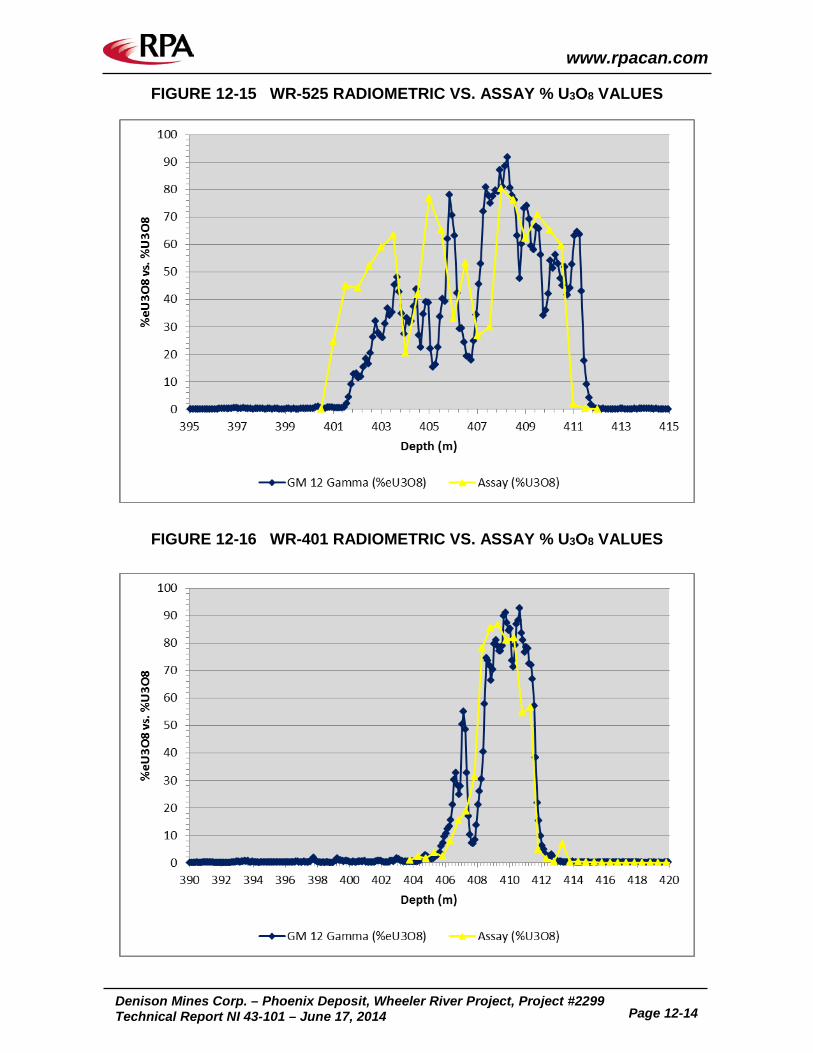
www.rpacan.com
Page 12-14 Denison Mines Corp. – Phoenix Deposit, Wheeler River Project, Project #2299 Technical Report NI 43-101 – June 17, 2014
FIGURE 12-15 WR-525 RADIOMETRIC VS. ASSAY % U3O8 VALUES
FIGURE 12-16 WR-401 RADIOMETRIC VS. ASSAY % U3O8 VALUES

www.rpacan.com
Page 12-15 Denison Mines Corp. – Phoenix Deposit, Wheeler River Project, Project #2299 Technical Report NI 43-101 – June 17, 2014
FIGURE 12-17 WR-306 RADIOMETRIC VS. ASSAY % U3O8 VALUES
FIGURE 12-18 WR-539 RADIOMETRIC VS. ASSAY % U3O8 VALUES

www.rpacan.com
Page 13-1 Denison Mines Corp. – Phoenix Deposit, Wheeler River Project, Project #2299 Technical Report NI 43-101 – June 17, 2014
13 MINERAL PROCESSING AND METALLURGICAL TESTING No representative mineral processing or metallurgical testing studies have been carried out
on the Phoenix deposit. Based on observation of drill core and geochemical data,
mineralization in the Phoenix deposit is expected to have very similar mineralogical and
paragenetic characteristics to mineralization in other deposits in the region, including
McArthur River, which is currently being mined.
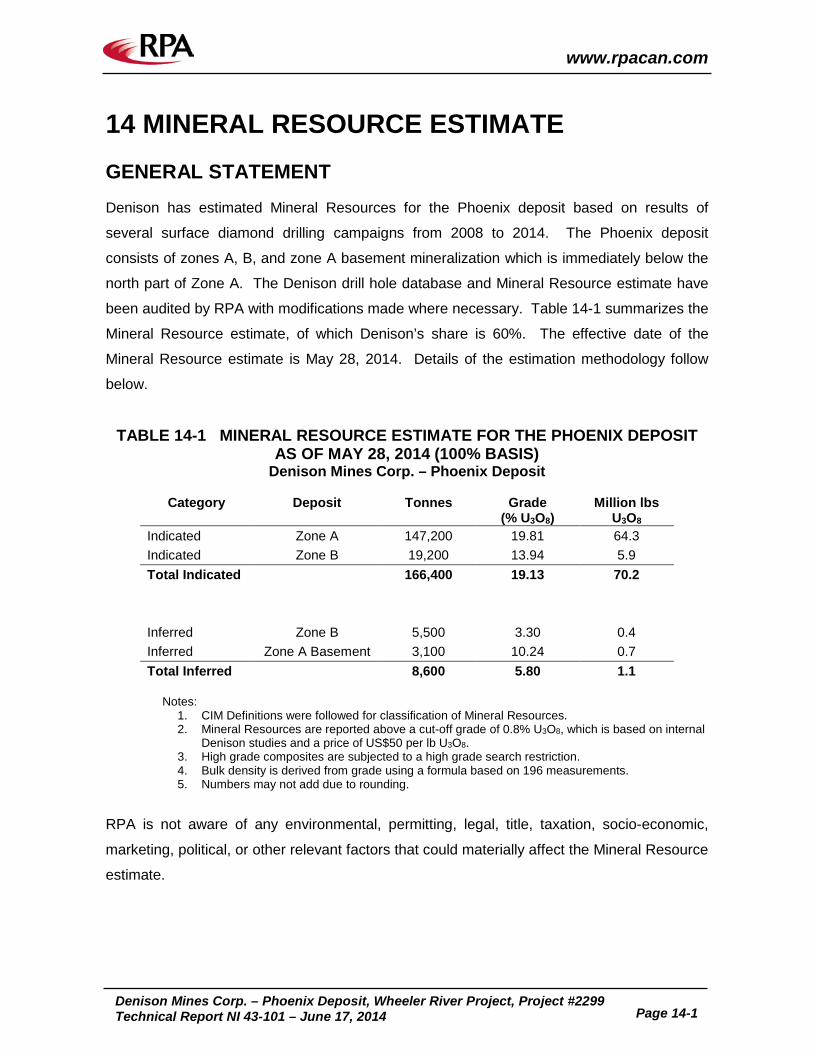
www.rpacan.com
Page 14-1 Denison Mines Corp. – Phoenix Deposit, Wheeler River Project, Project #2299 Technical Report NI 43-101 – June 17, 2014
14 MINERAL RESOURCE ESTIMATE GENERAL STATEMENT Denison has estimated Mineral Resources for the Phoenix deposit based on results of
several surface diamond drilling campaigns from 2008 to 2014. The Phoenix deposit
consists of zones A, B, and zone A basement mineralization which is immediately below the
north part of Zone A. The Denison drill hole database and Mineral Resource estimate have
been audited by RPA with modifications made where necessary. Table 14-1 summarizes the
Mineral Resource estimate, of which Denison’s share is 60%. The effective date of the
Mineral Resource estimate is May 28, 2014. Details of the estimation methodology follow
below.
TABLE 14-1 MINERAL RESOURCE ESTIMATE FOR THE PHOENIX DEPOSIT AS OF MAY 28, 2014 (100% BASIS)
Denison Mines Corp. – Phoenix Deposit
Category Deposit Tonnes Grade (% U3O8)
Million lbs U3O8
Indicated Zone A 147,200 19.81 64.3 Indicated Zone B 19,200 13.94 5.9 Total Indicated 166,400 19.13 70.2
Inferred Zone B 5,500 3.30 0.4 Inferred Zone A Basement 3,100 10.24 0.7 Total Inferred 8,600 5.80 1.1
Notes:
1. CIM Definitions were followed for classification of Mineral Resources. 2. Mineral Resources are reported above a cut-off grade of 0.8% U3O8, which is based on internal
Denison studies and a price of US$50 per lb U3O8. 3. High grade composites are subjected to a high grade search restriction. 4. Bulk density is derived from grade using a formula based on 196 measurements. 5. Numbers may not add due to rounding.
RPA is not aware of any environmental, permitting, legal, title, taxation, socio-economic,
marketing, political, or other relevant factors that could materially affect the Mineral Resource
estimate.

www.rpacan.com
Page 14-2 Denison Mines Corp. – Phoenix Deposit, Wheeler River Project, Project #2299 Technical Report NI 43-101 – June 17, 2014
DRILL HOLE DATABASE The Wheeler River Project includes drilling results from 2008 to 2014, which comprise 311
diamond drill holes totalling 148,210 m, of which 196 drill holes totalling 89,835 m have
delineated the zone A, zone B, and zone A basement lenses at Phoenix. Zone A is the
northeastern lens and strikes N52°E. Zone B consists of two subzones, B1 and B2 which
form the southwestern part of the Phoenix deposit. Zone A basement mineralization is within
a narrow fracture zone and extends below the northern end of zone A.
Upon completion of the initial data processing, the borehole data as well as radiometric
logging information was uploaded into VULCAN software. Table 14-2 lists details of the
VULCAN database used for the Phoenix resource estimate. RPA has reviewed the
database with Denison and agrees that it is suitable for Mineral Resource estimation.
TABLE 14-2 VULCAN DATABASE RECORDS Denison Mines Corp. – Phoenix Deposit
Table Name Number of Records
Collar 253 Survey 2,879
Stratigraphy 2,632 U3O8 Assay Values 2,111
eU3O8 Values 166,287 A Deposit UC – Composites 471 B Deposit UC – Composites 92
A Deposit Basement – Composites 140
Drill holes were completed on northwest-southeast oriented sections spaced at
approximately 25 m intervals along strike with a drill hole spacing of approximately 10 m
along the sections. Earlier holes were drilled at steep angles to the northwest and later holes
were collared vertically. Figure 14-1 shows zones A and B with locations of drill holes.
Figure 14-2 shows the location of the zone A basement mineralization.
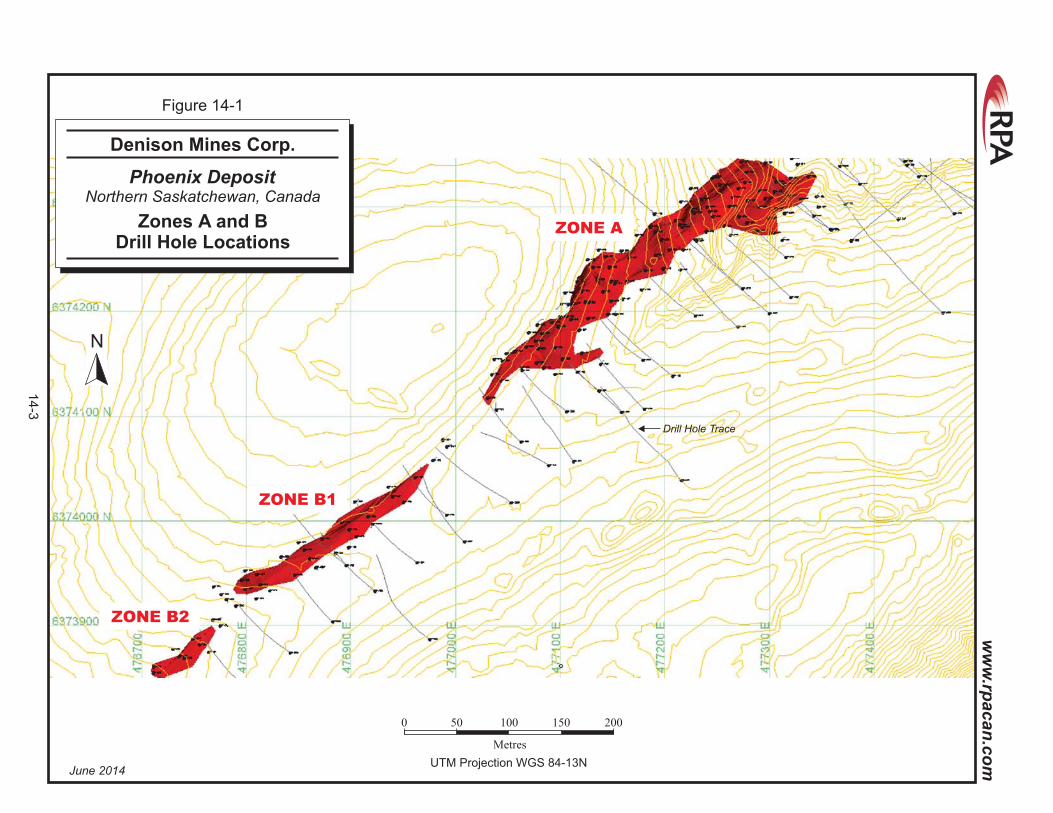
ZONE A
ZONE B1
ZONE B2
Drill Hole Trace
N
0 50
Metres
100 150 200
UTM Projection WGS 84-13NJune 2014
Phoenix Deposit
Zones and BADrill Hole Locations
Denison Mines Corp.
Northern Saskatchewan, Canada
Figure 14-1
14
-3
ww
w.rp
acan
.co
m
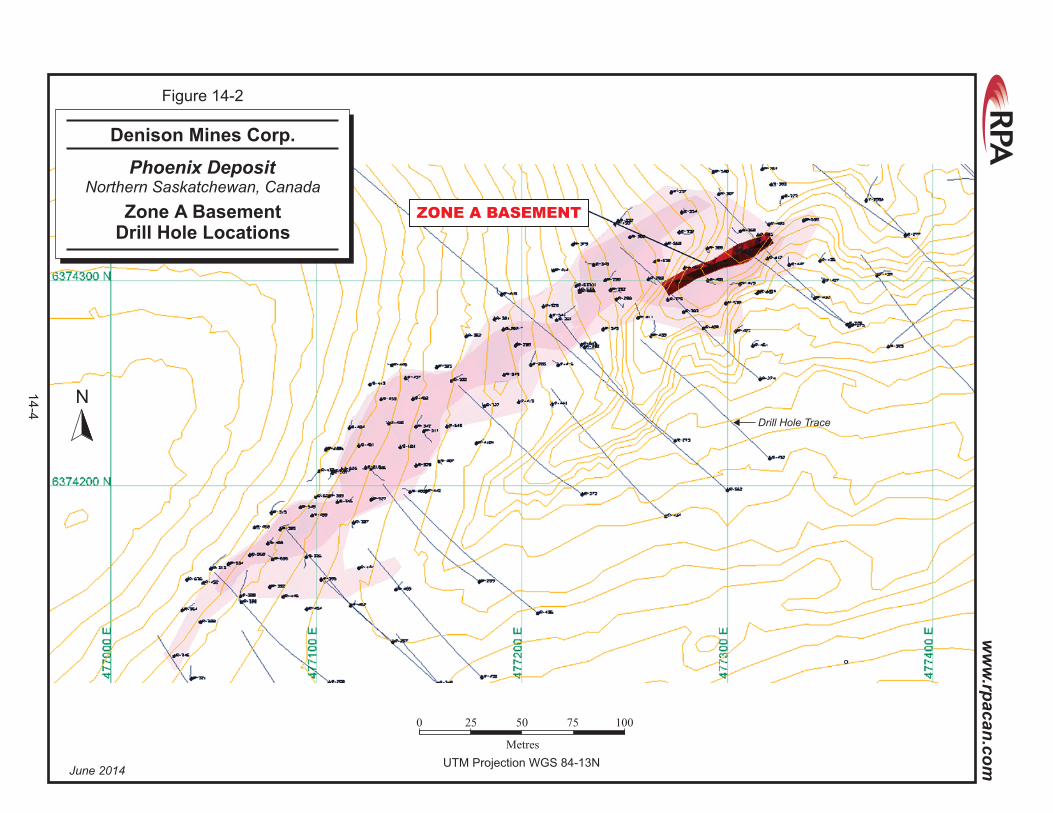
Drill Hole Trace
ZONE A BASEMENT
N
0 25
Metres
50 75 100
UTM Projection WGS 84-13NJune 2014
Phoenix Deposit
Zone BasementADrill Hole Locations
Denison Mines Corp.
Northern Saskatchewan, Canada
Figure 214-
14
4-
ww
w.rp
acan
.co
m
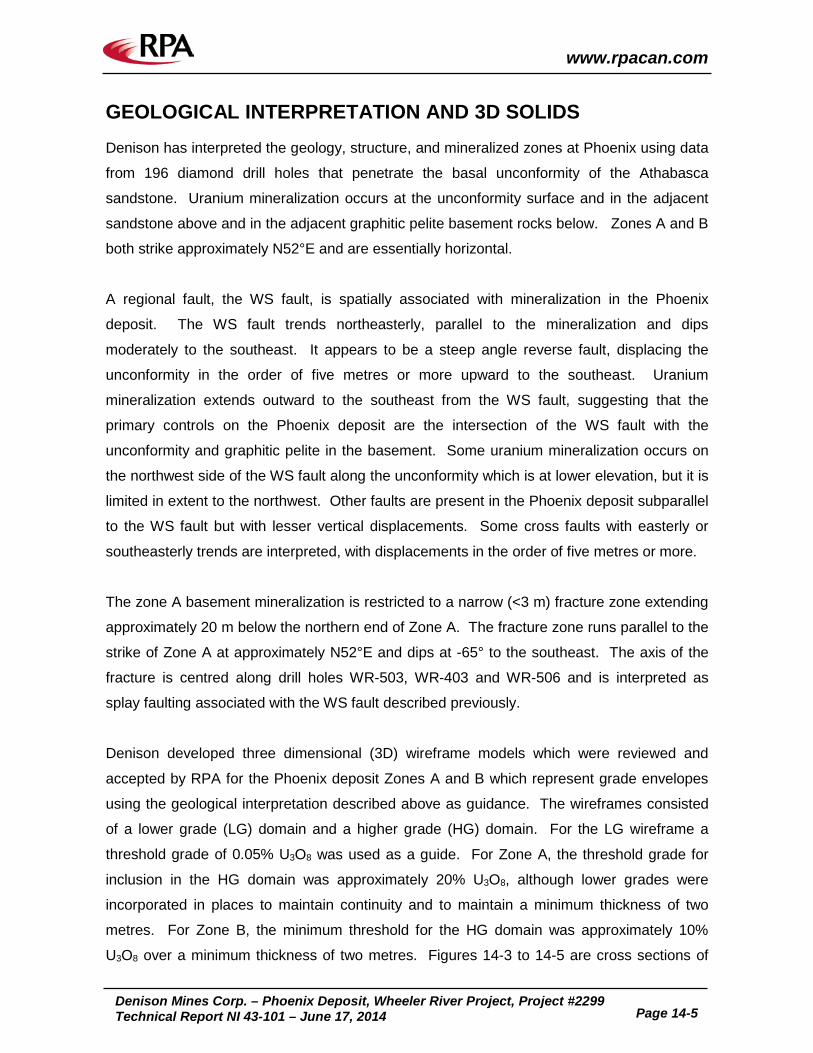
www.rpacan.com
Page 14-5 Denison Mines Corp. – Phoenix Deposit, Wheeler River Project, Project #2299 Technical Report NI 43-101 – June 17, 2014
GEOLOGICAL INTERPRETATION AND 3D SOLIDS Denison has interpreted the geology, structure, and mineralized zones at Phoenix using data
from 196 diamond drill holes that penetrate the basal unconformity of the Athabasca
sandstone. Uranium mineralization occurs at the unconformity surface and in the adjacent
sandstone above and in the adjacent graphitic pelite basement rocks below. Zones A and B
both strike approximately N52°E and are essentially horizontal.
A regional fault, the WS fault, is spatially associated with mineralization in the Phoenix
deposit. The WS fault trends northeasterly, parallel to the mineralization and dips
moderately to the southeast. It appears to be a steep angle reverse fault, displacing the
unconformity in the order of five metres or more upward to the southeast. Uranium
mineralization extends outward to the southeast from the WS fault, suggesting that the
primary controls on the Phoenix deposit are the intersection of the WS fault with the
unconformity and graphitic pelite in the basement. Some uranium mineralization occurs on
the northwest side of the WS fault along the unconformity which is at lower elevation, but it is
limited in extent to the northwest. Other faults are present in the Phoenix deposit subparallel
to the WS fault but with lesser vertical displacements. Some cross faults with easterly or
southeasterly trends are interpreted, with displacements in the order of five metres or more.
The zone A basement mineralization is restricted to a narrow (<3 m) fracture zone extending
approximately 20 m below the northern end of Zone A. The fracture zone runs parallel to the
strike of Zone A at approximately N52°E and dips at -65° to the southeast. The axis of the
fracture is centred along drill holes WR-503, WR-403 and WR-506 and is interpreted as
splay faulting associated with the WS fault described previously.
Denison developed three dimensional (3D) wireframe models which were reviewed and
accepted by RPA for the Phoenix deposit Zones A and B which represent grade envelopes
using the geological interpretation described above as guidance. The wireframes consisted
of a lower grade (LG) domain and a higher grade (HG) domain. For the LG wireframe a
threshold grade of 0.05% U3O8 was used as a guide. For Zone A, the threshold grade for
inclusion in the HG domain was approximately 20% U3O8, although lower grades were
incorporated in places to maintain continuity and to maintain a minimum thickness of two
metres. For Zone B, the minimum threshold for the HG domain was approximately 10%
U3O8 over a minimum thickness of two metres. Figures 14-3 to 14-5 are cross sections of
www.rpacan.com
Page 14-6 Denison Mines Corp. – Phoenix Deposit, Wheeler River Project, Project #2299 Technical Report NI 43-101 – June 17, 2014
Zone A showing drill holes with one metre composite grades and the outlines of the HG and
LG domains. Figure 14-6 shows the same for Zone B. Figure 14-7 is a longitudinal view of
the Zone A Basement domain.
The wireframe model developed for Zone A is approximately 380 m long, 36 m wide and
ranges in thickness from two metres to 17 m with an average thickness of five metres. The
Zone B wireframe model measures approximately 290 m long, averages 19 m wide, and is
approximately three metres thick. The wireframes were used to assign domain codes to the
blocks in the block model and for generating and coding composited assays.
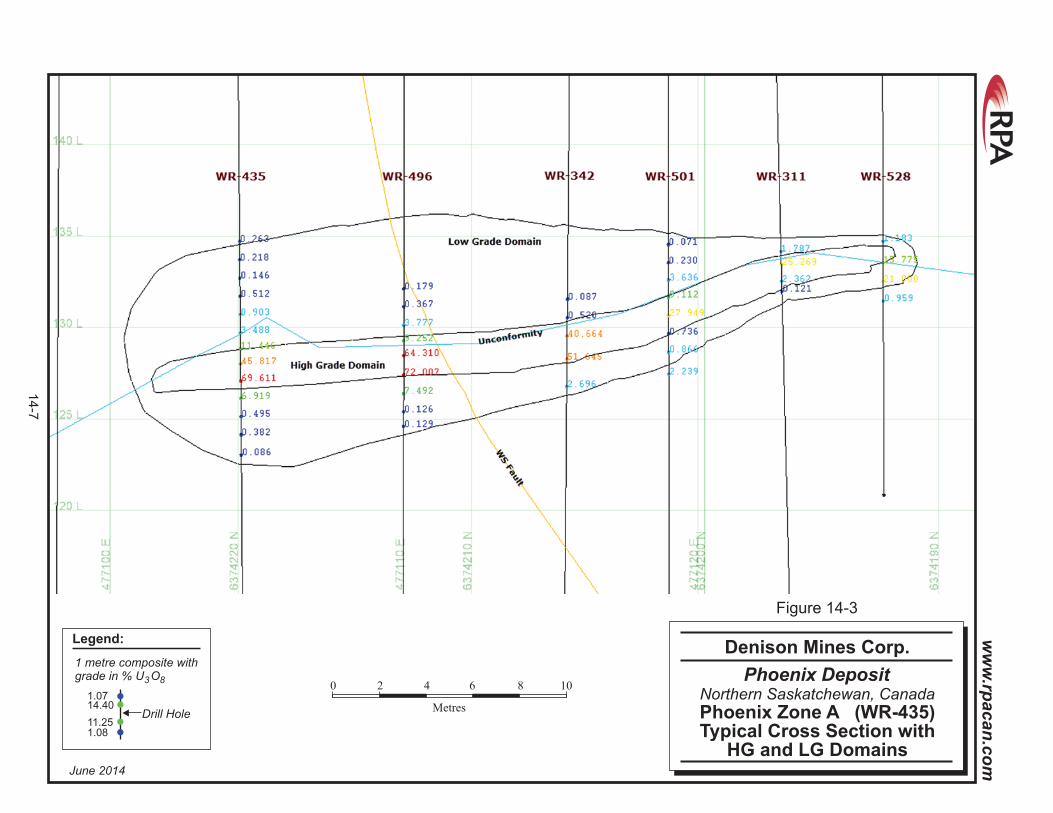
Drill Hole
3 8
Legend:
1 metre composite withgrade in % U O
1.0714.40
11.251.08
0 2 10
Metres
4 6 8
June 2014
Phoenix Deposit
Phoenix Zone A (WR-435)Typical Cross Section with
HG and LG Domains
Denison Mines Corp.
Northern Saskatchewan, Canada
Figure -314
17
4-
ww
w.rp
acan
.co
m

Drill Hole
3 8
Legend:
1 metre composite withgrade in % U O
1.0714.40
11.251.08
0 2 10
Metres
4 6 8
June 2014
Phoenix Deposit
Phoenix Zone A (WR-525)Typical Cross Section with
HG and LG Domains
Denison Mines Corp.
Northern Saskatchewan, Canada
Figure -414
18
4-
ww
w.rp
acan
.co
m
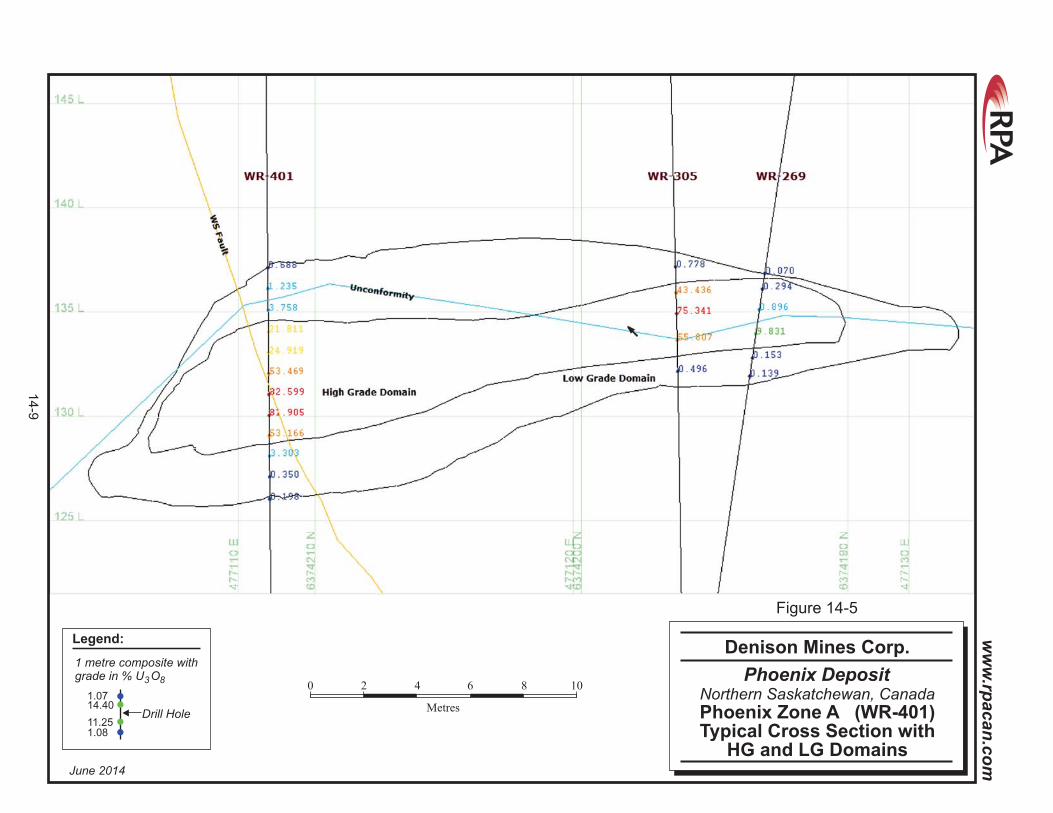
Drill Hole
3 8
Legend:
1 metre composite withgrade in % U O
1.0714.40
11.251.08
0 2 10
Metres
4 6 8
June 2014
Phoenix Deposit
Phoenix Zone A (WR-401)Typical Cross Section with
HG and LG Domains
Denison Mines Corp.
Northern Saskatchewan, Canada
Figure -514
19
4-
ww
w.rp
acan
.co
m
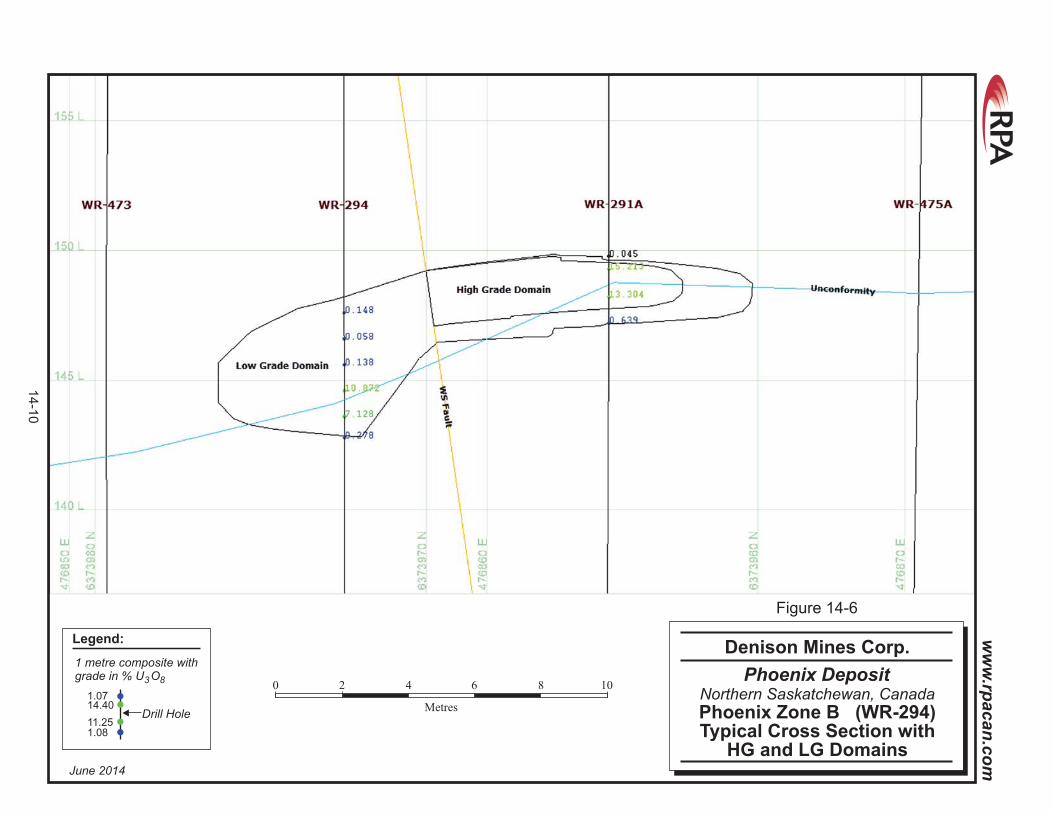
Drill Hole
3 8
Legend:
1 metre composite withgrade in % U O
1.0714.40
11.251.08
0 2 10
Metres
4 6 8
June 2014
Denison Mines Corp.
Phoenix Deposit
Phoenix Zone (WR-294)BTypical Cross Section with
Northern Saskatchewan, Canada
HG and LG Domains
Figure -614
110
4-
ww
w.rp
acan
.co
m
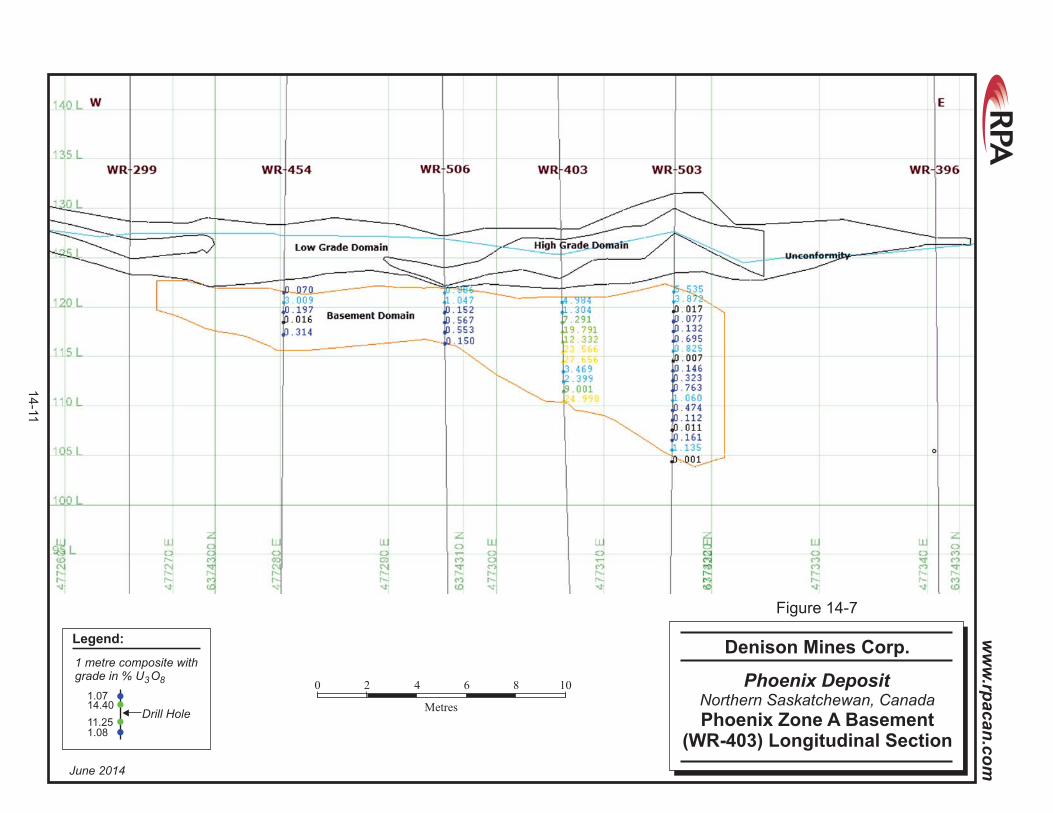
Drill Hole
3 8
Legend:
1 metre composite withgrade in % U O
1.0714.40
11.251.08
0 2 10
Metres
4 6 8
June 2014
Denison Mines Corp.
Phoenix Deposit
Phoenix Zone A Basement(WR-403) Longitudinal Section
Northern Saskatchewan, Canada
Figure -714
111
4-
ww
w.rp
acan
.co
m
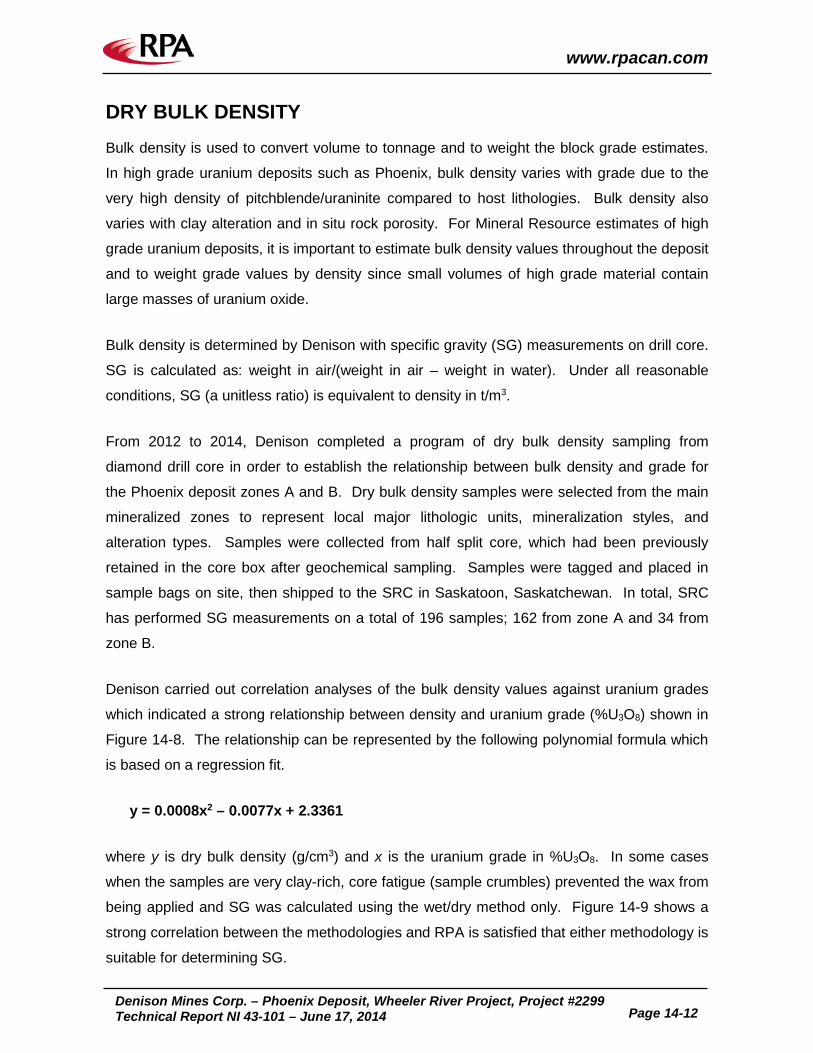
www.rpacan.com
Page 14-12 Denison Mines Corp. – Phoenix Deposit, Wheeler River Project, Project #2299 Technical Report NI 43-101 – June 17, 2014
DRY BULK DENSITY Bulk density is used to convert volume to tonnage and to weight the block grade estimates.
In high grade uranium deposits such as Phoenix, bulk density varies with grade due to the
very high density of pitchblende/uraninite compared to host lithologies. Bulk density also
varies with clay alteration and in situ rock porosity. For Mineral Resource estimates of high
grade uranium deposits, it is important to estimate bulk density values throughout the deposit
and to weight grade values by density since small volumes of high grade material contain
large masses of uranium oxide.
Bulk density is determined by Denison with specific gravity (SG) measurements on drill core.
SG is calculated as: weight in air/(weight in air – weight in water). Under all reasonable
conditions, SG (a unitless ratio) is equivalent to density in t/m3.
From 2012 to 2014, Denison completed a program of dry bulk density sampling from
diamond drill core in order to establish the relationship between bulk density and grade for
the Phoenix deposit zones A and B. Dry bulk density samples were selected from the main
mineralized zones to represent local major lithologic units, mineralization styles, and
alteration types. Samples were collected from half split core, which had been previously
retained in the core box after geochemical sampling. Samples were tagged and placed in
sample bags on site, then shipped to the SRC in Saskatoon, Saskatchewan. In total, SRC
has performed SG measurements on a total of 196 samples; 162 from zone A and 34 from
zone B.
Denison carried out correlation analyses of the bulk density values against uranium grades
which indicated a strong relationship between density and uranium grade (%U3O8) shown in
Figure 14-8. The relationship can be represented by the following polynomial formula which
is based on a regression fit.
y = 0.0008x2 – 0.0077x + 2.3361
where y is dry bulk density (g/cm3) and x is the uranium grade in %U3O8. In some cases
when the samples are very clay-rich, core fatigue (sample crumbles) prevented the wax from
being applied and SG was calculated using the wet/dry method only. Figure 14-9 shows a
strong correlation between the methodologies and RPA is satisfied that either methodology is
suitable for determining SG.
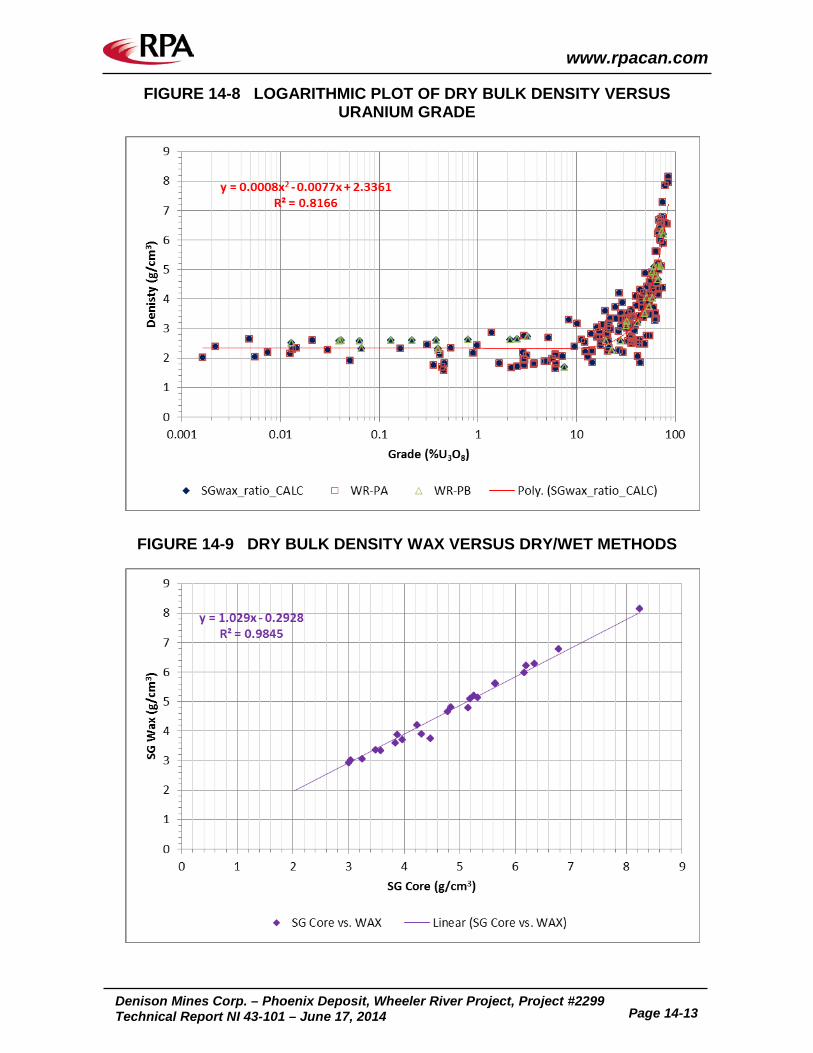
www.rpacan.com
Page 14-13 Denison Mines Corp. – Phoenix Deposit, Wheeler River Project, Project #2299 Technical Report NI 43-101 – June 17, 2014
FIGURE 14-8 LOGARITHMIC PLOT OF DRY BULK DENSITY VERSUS URANIUM GRADE
FIGURE 14-9 DRY BULK DENSITY WAX VERSUS DRY/WET METHODS
www.rpacan.com
Page 14-14 Denison Mines Corp. – Phoenix Deposit, Wheeler River Project, Project #2299 Technical Report NI 43-101 – June 17, 2014
The regression curve in Figure 14-8 is relatively flat below 10% U3O8, with density relatively
constant at 2.33 g/cm3. At grades greater than 20%, dry bulk density increases with higher
uranium grades. There are a number of strongly mineralized samples that have low dry bulk
densities and vice versa which results in significant scatter in dry bulk density values. The
lower bulk density values associated with strongly mineralized samples may be attributed to
the amount of clay alteration in the samples. Generally, clay alteration causes
decomposition of feldspar and mafic minerals with resultant replacement by lighter clay
minerals as well as loss of silica from feldspar that lowers the dry bulk density of the rock.
Denison has estimated a dry bulk density value for each grade value in the drill hole
database by using the polynomial formula shown above. In RPA’s opinion, the SG sampling
methods and resulting data are suitable for Mineral Resource estimation at Phoenix.
STATISTICS
COMPOSITES As discussed in Section 10 Drilling and Section 11 Sample Preparation, Analyses and
Security, all drill core samples with chemical assays are 0.5 m long and all radiometric
measurements are 0.1 m long. Radiometric measurements are used in lieu of chemical
assays where core recovery is less than 80%. Approximately 23% of the drill holes used for
the Phoenix deposit zone A resource estimate have radiometric measurements and
approximately 25% of those used for the zone B resource estimate have radiometric
measurements.
Denison has composited grade (G), bulk density (D), and grade multiplied by density (GxD)
values over one metre run-length intervals to create a composite database for statistical
analysis and block estimation purposes. As discussed below, block estimation was done by
interpolating GxD and density and dividing them to obtain a weighted grade estimate for
each block.
Compositing was restricted to within the wireframe models. Separate composite files were
prepared for the Zone A HG domain, Zone A LG domain, Zone B HG domain, Zone B LG
domain, and Zone A Basement domain. Table 14-3 lists descriptive statistics of composite
grade and GxD for each of these domains. Assay grades are weighted by both sample
length and density when compositing.

www.rpacan.com
Page 14-15 Denison Mines Corp. – Phoenix Deposit, Wheeler River Project, Project #2299 Technical Report NI 43-101 – June 17, 2014
Figure 14-10 shows histograms of grade for each of these domains. Composites begin in
one metre intervals where a drill hole pierces a wireframe. This can result in residual short
composites at the bottom of the wireframes. These short composites were retained if they
were between 0.5 m and 1.0 m long, and were added to the previous full length composite if
they were less than 0.5 m long. Figure 14-11 shows grade versus density plots of these
domains.
TABLE 14-3 BASIC STATISTICS OF GRADE AND GXD COMPOSITES FOR PHOENIX DEPOSIT ZONES A AND B HG AND LG DOMAINS
Denison Mines Corp. – Phoenix Deposit
Statistic Zone A Grade Zone B Grade Zone A GxD Zone B GxD
HG LG BSMT HG LG HG LG BSMT HG LG
Mean 34.86 1.77 1.56 21.65 1.57 156.50 4.20 4.48 77.51 3.75
Standard Error 1.93 0.14 0.36 3.74 0.31 12.99 0.36 1.24 16.89 0.76
Median 31.52 0.59 0.32 17.14 0.53 107.54 1.36 0.88 43.68 1.24
Mode #N/A 0.18 0.00 #N/A 0.25 #N/A 0.42 1.93 #N/A 0.35
Standard Deviation 21.62 2.69 4.26 15.85 2.64 145.26 6.63 14.28 71.67 6.46
Sample Variance 467.56 7.23 18.12 251.25 6.99 21,101.66 43.93 203.78 5,136.66 41.74
Kurtosis -0.69 10.25 23.16 -1.02 4.65 0.77 15.12 31.86 -0.87 5.24
Skewness 0.45 2.81 4.72 0.54 2.36 1.27 3.23 5.49 0.84 2.46
Range 82.31 20.13 27.66 49.24 10.86 595.34 56.99 101.48 212.74 27.49
Minimum 0.29 0.01 0.00 1.46 0.01 0.69 0.02 0.00 3.42 0.02
Maximum 82.60 20.14 27.66 50.69 10.87 596.02 57.01 101.49 216.16 27.51
Sum 4,357.3 607.7 214.9 389.7 113.0 19,562.5 1,445.5 595.6 1,395.2 270.0
Count 125 344 138 18 72 125 344 133 18 72
CV 0.62 1.52 2.73 0.73 1.68 0.93 1.58 3.19 0.92 1.72
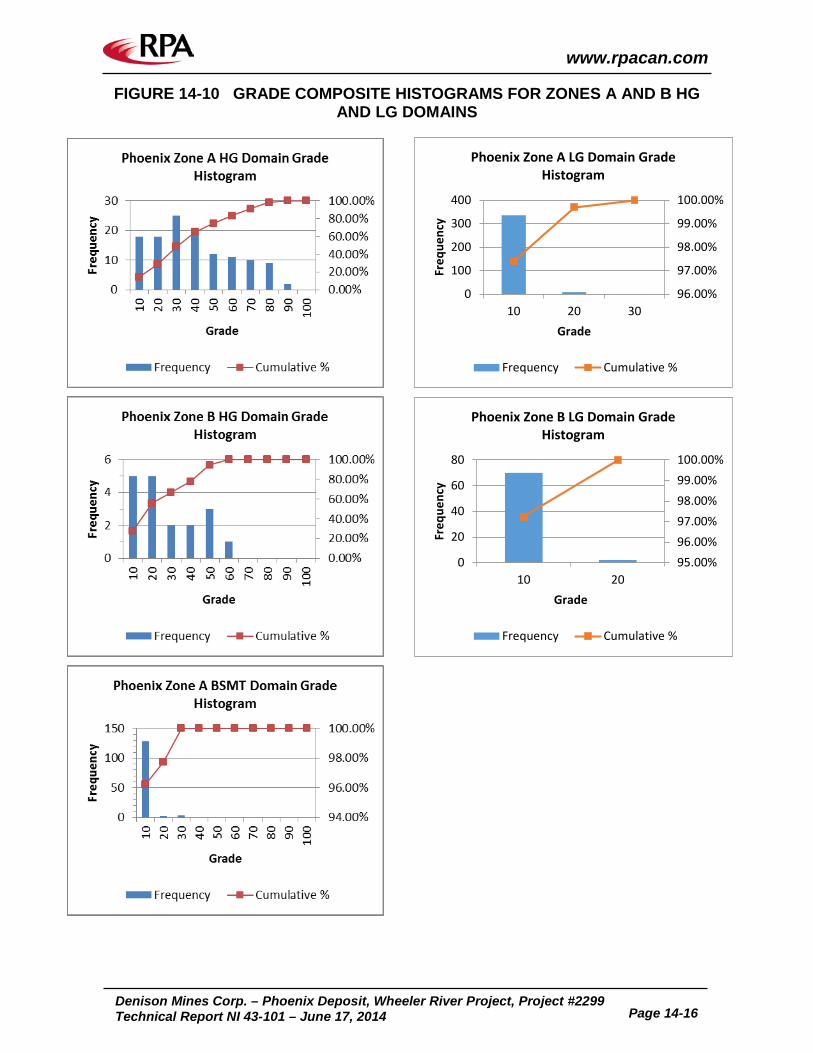
www.rpacan.com
Page 14-16 Denison Mines Corp. – Phoenix Deposit, Wheeler River Project, Project #2299 Technical Report NI 43-101 – June 17, 2014
FIGURE 14-10 GRADE COMPOSITE HISTOGRAMS FOR ZONES A AND B HG AND LG DOMAINS
96.00%
97.00%
98.00%
99.00%
100.00%
0
100
200
300
400
10 20 30
Freq
uenc
y
Grade
Phoenix Zone A LG Domain Grade Histogram
Frequency Cumulative %
95.00%96.00%97.00%98.00%99.00%100.00%
0
20
40
60
80
10 20
Freq
uenc
y
Grade
Phoenix Zone B LG Domain Grade Histogram
Frequency Cumulative %
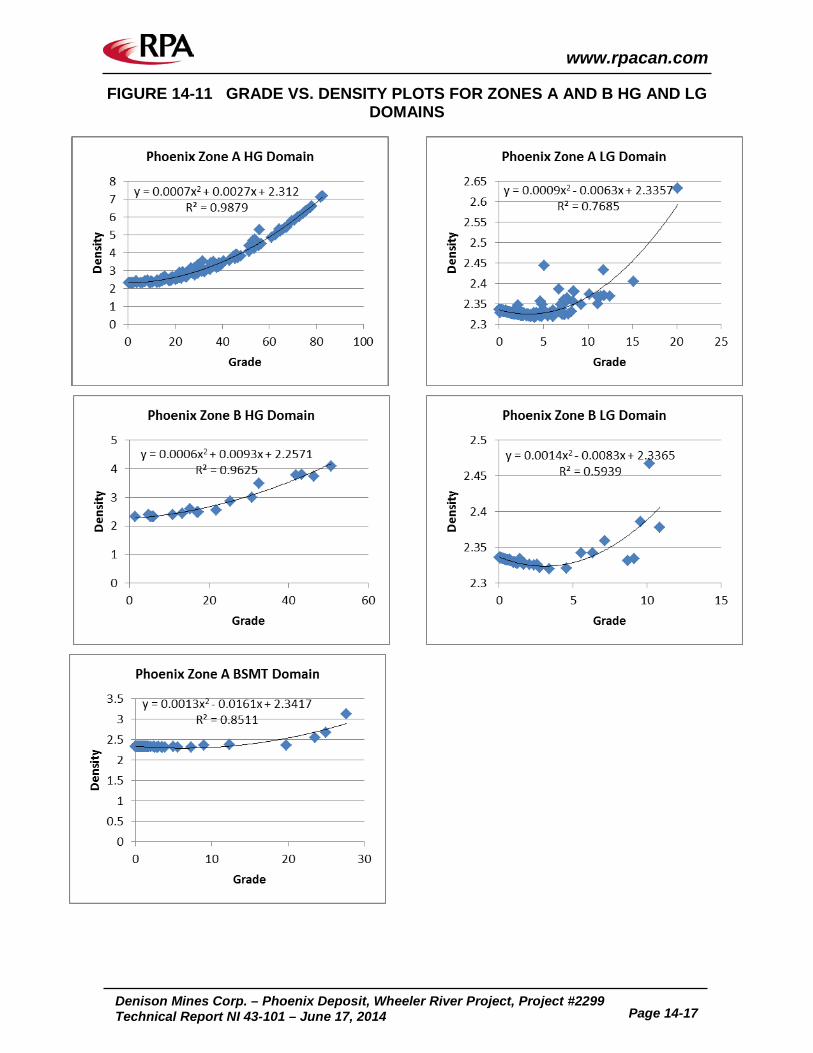
www.rpacan.com
Page 14-17 Denison Mines Corp. – Phoenix Deposit, Wheeler River Project, Project #2299 Technical Report NI 43-101 – June 17, 2014
FIGURE 14-11 GRADE VS. DENSITY PLOTS FOR ZONES A AND B HG AND LG DOMAINS
www.rpacan.com
Page 14-18 Denison Mines Corp. – Phoenix Deposit, Wheeler River Project, Project #2299 Technical Report NI 43-101 – June 17, 2014
TREATMENT OF HIGH GRADE VALUES Capping or cutting of high grade samples is sometimes warranted for Mineral Resource
estimation for scenarios when high grade outliers may have an undue influence on the
estimation process. Although the Phoenix deposit is a high grade uranium deposit, adequate
sample support, the use of high grade domains, and lack of apparent high grade outliers
made high grade capping unnecessary. The influence of high grade values, however, was
restricted during the block estimation process as discussed below.
VARIOGRAPHY For zone A, RPA reviewed variograms of grade and GxD for the HG domain composite data
and grade for the LG domain composite data. Variograms were prepared in the downhole
direction, along a northeasterly strike direction, and horizontally across the strike direction.
Variograms were of fair quality considering the limited number of composite data with a
nugget effect of approximately 10% of the sill. The GxD variograms were similar to those of
grade. The variograms suggested approximate ranges for the Zone A HG domain of 2.4 m
downhole, 35 m along strike, and 10 m or less across strike; and for the Zone A LG domain
2.1 m downhole, 25 m or less along strike, and 25 m across strike. These ranges were used
to derive search ellipse dimensions for block interpolations.
BLOCK MODEL INTERPOLATION Three dimensional block models were constructed using Vulcan version 8.1.4 Mine
Modelling Software. The variables uranium grade (G), density (D) and grade times density
(GxD) were interpolated using an inverse distance squared (ID2) algorithm for each
mineralized domain. Hard boundaries were employed at domain contacts so that
composites from within a given domain could not influence block grades in other domains.
For zones A and B, blocks were five metres long along the main northeast trend, two metres
wide across the main trend, and one metre high. For the zone A basement domain, blocks
were two metres long along the main northeast trend, one metre wide across the main trend,
and one metre high. A whole block approach was used whereby the block was assigned to
the domain where its centroid was located.
www.rpacan.com
Page 14-19 Denison Mines Corp. – Phoenix Deposit, Wheeler River Project, Project #2299 Technical Report NI 43-101 – June 17, 2014
The interpolation strategy involved setting up search parameters in two passes for each
domain. Search ellipses were oriented with the major axis oriented parallel to the dominant
northeasterly trend of the zones. The semi-major axis was oriented horizontally, normal to
the major axis (across strike) and the minor axis was vertical.
GxD and D were interpolated into the model using an initial pass. Blocks which did not
receive an interpolated grade were then interpolated in the second pass which resulted in all
blocks being populated. Block grade was derived from the interpolated GxD value by
dividing that value by the interpolated density value for each block. Grades not weighted by
density (G) were also interpolated as a check.
In order to reduce the influence of very high grade composites, grades greater than a
designated threshold level for each domain were restricted to shorter search ellipse
dimensions. If the search ellipse contained a composite greater than the specified grade, it
was used for interpolation only if it fell within the restricted search ellipse. The threshold
grade levels were chosen from the basic statistics and from visual inspection of the apparent
continuity of very high grades within each domain.
Search parameters are listed in Table 14-4 for the Phoenix deposit zones A and B, HG and
LG domains. Major axis is horizontal along the main mineralized trend of N52°E, semi-major
axis is horizontal normal to the main trend, and the minor axis is vertical.

www.rpacan.com
Page 14-20 Denison Mines Corp. – Phoenix Deposit, Wheeler River Project, Project #2299 Technical Report NI 43-101 – June 17, 2014
TABLE 14-4 BLOCK MODEL INTERPOLATION PARAMETERS Denison Mines Corp. – Phoenix Deposit
Deposit and
Domain Pass Search Radii (m) Number of Composites Used
Major Semi-major Minor Min Max Max per
DH A Deposit HG First 35 15 8 3 8 2
Second 50 25 10 3 8 2
Restricted >60% U3O8 15 6 4 3 8 2
A Deposit LG First 35 15 8 3 8 2
Second 50 25 10 3 8 2
Restricted >6% U3O8 15 6 4 3 8 2
A Deposit BSMT First 10 10 4 2 6 2
Second 20 20 4 2 6 2
Restricted >3% U3O8 10 10 4 2 6 2
B Deposit HG First 35 15 6 3 8 2
Second 50 25 10 3 8 2
Restricted >40% U3O8 15 5 4 3 8 2
B Deposit LG First 35 15 6 3 8 2
Second 50 25 10 3 8 2
Restricted >4% U3O8 15 5 4 3 8 2
Figure 14-12 is a three-dimensional isometric view looking north at the zone A block model
with colour coded grades. Higher grades are red and green. The blocks shown are mostly
in the LG domain. Figure 14-13 is an isometric view looking north at the HG domain of the
zone A block model with colour coded grades. Higher grades are red and purple.
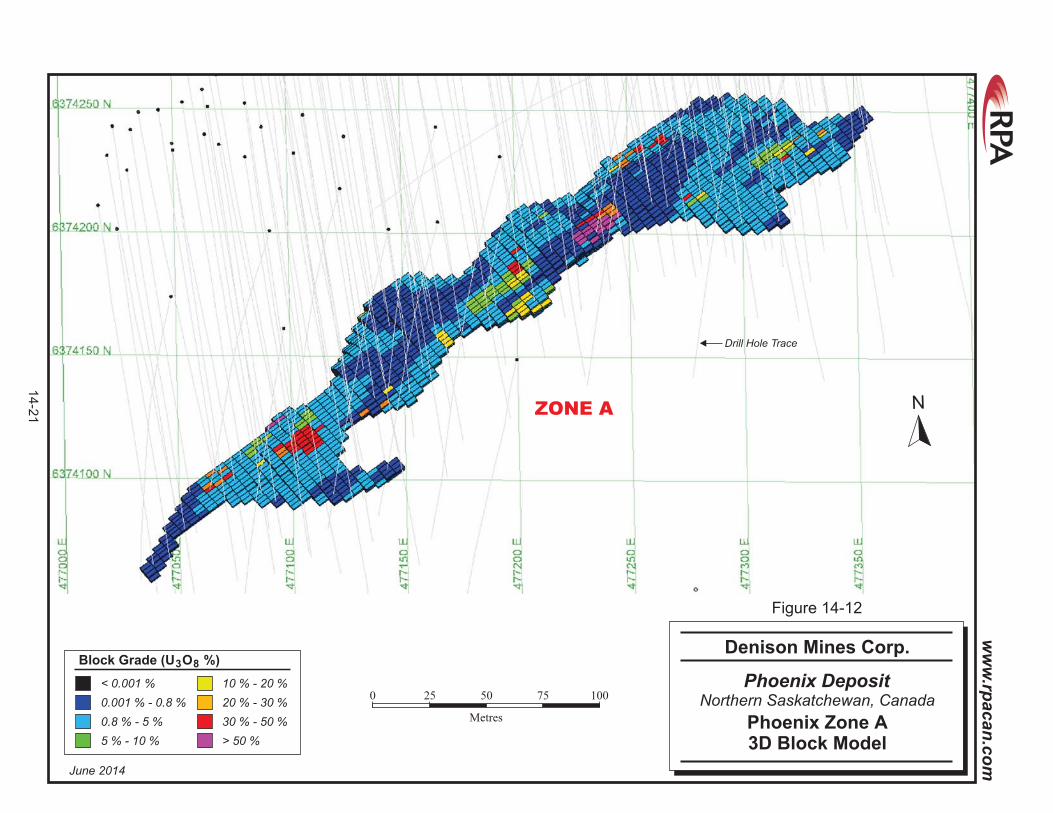
ZONE A
Drill Hole Trace
Block Grade (U O %)3 8
< 0.001 %
0.001 % - 0.8 %
0.8 % - 5 %
5 % - 10 %
10 % - 20 %
20 % - 30 %
30 % - 50 %
> 50 %
0 25
Metres
50 75 100
N
June 2014
Phoenix Deposit
Phoenix Zone A3D Block Model
Denison Mines Corp.
Northern Saskatchewan, Canada
Figure -1214
121
4-
ww
w.rp
acan
.co
m
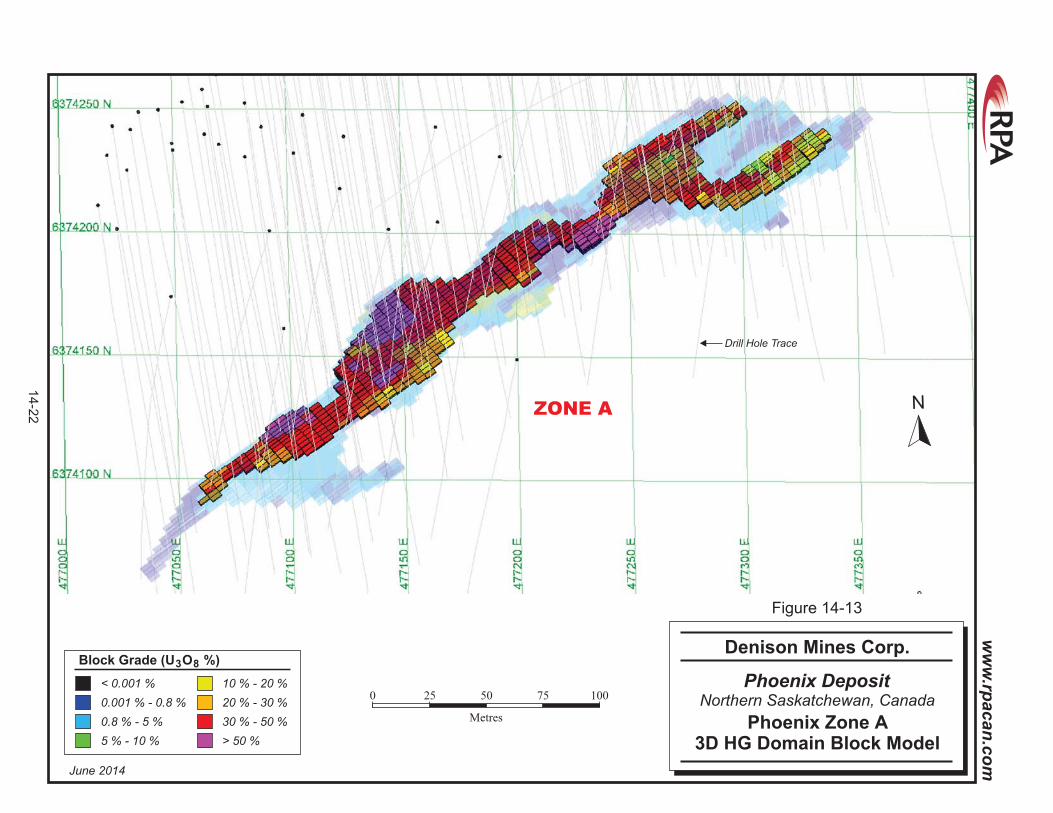
ZONE A
Drill Hole Trace
Block Grade (U O %)3 8
< 0.001 %
0.001 % - 0.8 %
0.8 % - 5 %
5 % - 10 %
10 % - 20 %
20 % - 30 %
30 % - 50 %
> 50 %
0 25
Metres
50 75 100
N
June 2014
Phoenix Deposit
Phoenix Zone A3D HG Domain Block Model
Denison Mines Corp.
Northern Saskatchewan, Canada
Figure -1314
122
4-
ww
w.rp
acan
.co
m
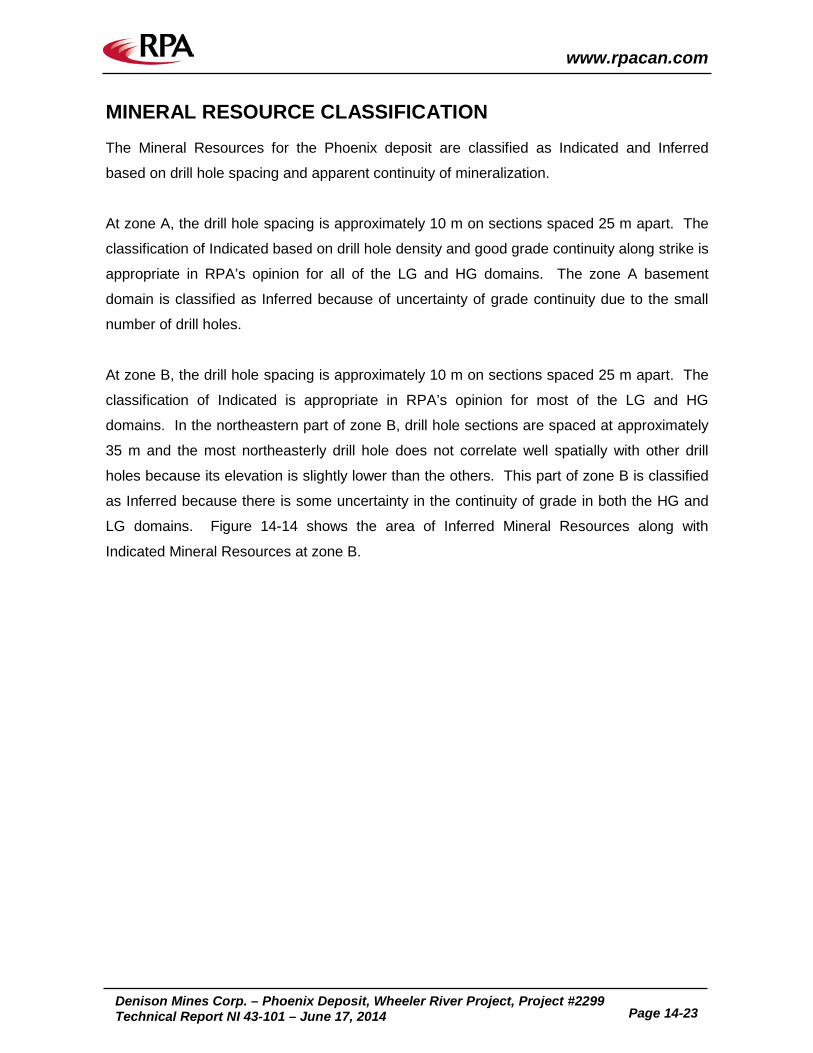
www.rpacan.com
Page 14-23 Denison Mines Corp. – Phoenix Deposit, Wheeler River Project, Project #2299 Technical Report NI 43-101 – June 17, 2014
MINERAL RESOURCE CLASSIFICATION The Mineral Resources for the Phoenix deposit are classified as Indicated and Inferred
based on drill hole spacing and apparent continuity of mineralization.
At zone A, the drill hole spacing is approximately 10 m on sections spaced 25 m apart. The
classification of Indicated based on drill hole density and good grade continuity along strike is
appropriate in RPA’s opinion for all of the LG and HG domains. The zone A basement
domain is classified as Inferred because of uncertainty of grade continuity due to the small
number of drill holes.
At zone B, the drill hole spacing is approximately 10 m on sections spaced 25 m apart. The
classification of Indicated is appropriate in RPA’s opinion for most of the LG and HG
domains. In the northeastern part of zone B, drill hole sections are spaced at approximately
35 m and the most northeasterly drill hole does not correlate well spatially with other drill
holes because its elevation is slightly lower than the others. This part of zone B is classified
as Inferred because there is some uncertainty in the continuity of grade in both the HG and
LG domains. Figure 14-14 shows the area of Inferred Mineral Resources along with
Indicated Mineral Resources at zone B.
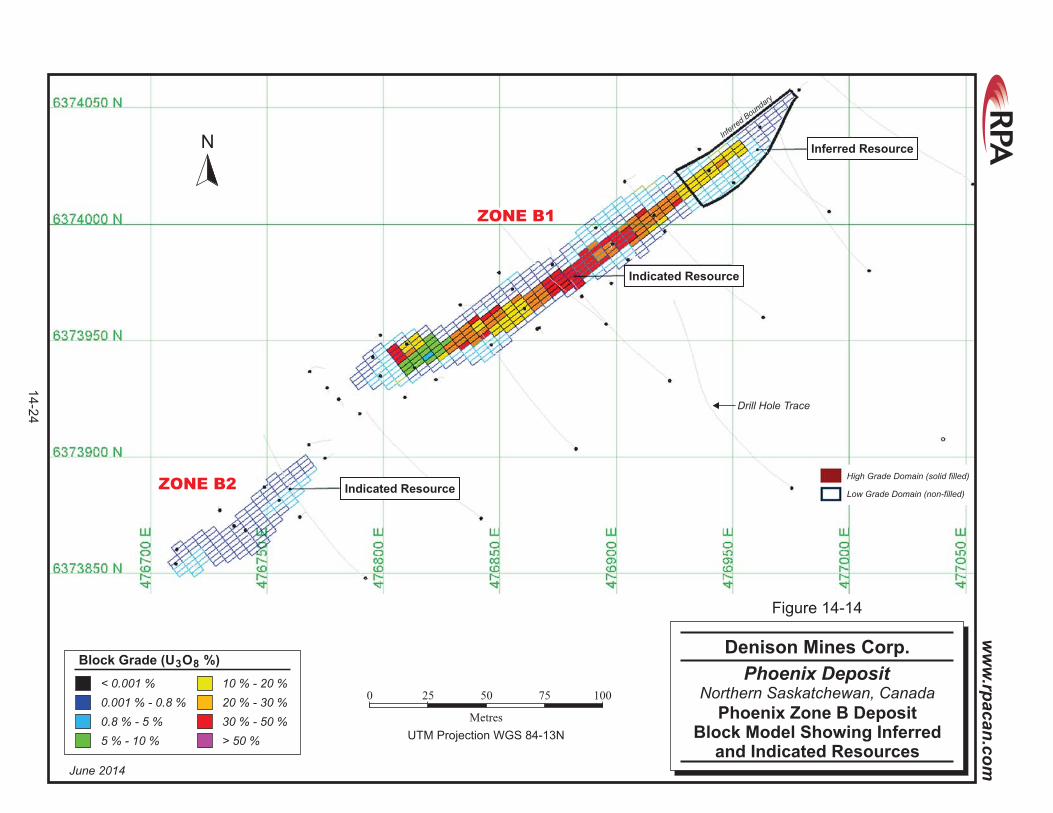
Drill Hole Trace
ZONE B1
ZONE B2
Indicated Resource
Inferred Resource
High Grade Domain (solid filled)
Infe
rred
Boundary
Low Grade Domain (non-filled)Indicated Resource
N
Block Grade (U O %)3 8
< 0.001 %
0.001 % - 0.8 %
0.8 % - 5 %
5 % - 10 %
10 % - 20 %
20 % - 30 %
30 % - 50 %
> 50 %
0 25
Metres
50 75 100
UTM Projection WGS 84-13N
June 2014
Phoenix Deposit
Phoenix Zone B DepositBlock Model Showing Inferred
and Indicated Resources
Denison Mines Corp.
Northern Saskatchewan, Canada
Figure 1414-
14
4-2
ww
w.rp
acan
.co
m
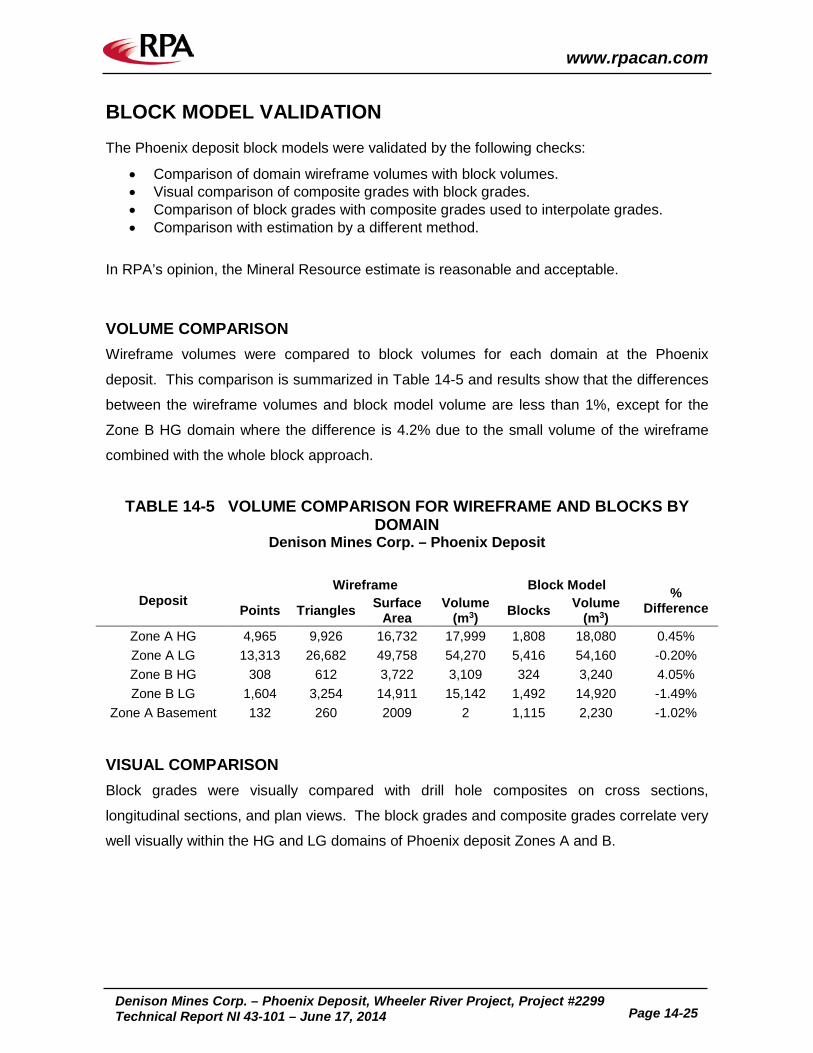
www.rpacan.com
Page 14-25 Denison Mines Corp. – Phoenix Deposit, Wheeler River Project, Project #2299 Technical Report NI 43-101 – June 17, 2014
BLOCK MODEL VALIDATION The Phoenix deposit block models were validated by the following checks:
• Comparison of domain wireframe volumes with block volumes. • Visual comparison of composite grades with block grades. • Comparison of block grades with composite grades used to interpolate grades. • Comparison with estimation by a different method.
In RPA’s opinion, the Mineral Resource estimate is reasonable and acceptable.
VOLUME COMPARISON Wireframe volumes were compared to block volumes for each domain at the Phoenix
deposit. This comparison is summarized in Table 14-5 and results show that the differences
between the wireframe volumes and block model volume are less than 1%, except for the
Zone B HG domain where the difference is 4.2% due to the small volume of the wireframe
combined with the whole block approach.
TABLE 14-5 VOLUME COMPARISON FOR WIREFRAME AND BLOCKS BY DOMAIN
Denison Mines Corp. – Phoenix Deposit
Deposit Wireframe Block Model %
Difference Points Triangles Surface Area
Volume (m3) Blocks Volume
(m3) Zone A HG 4,965 9,926 16,732 17,999 1,808 18,080 0.45% Zone A LG 13,313 26,682 49,758 54,270 5,416 54,160 -0.20% Zone B HG 308 612 3,722 3,109 324 3,240 4.05% Zone B LG 1,604 3,254 14,911 15,142 1,492 14,920 -1.49%
Zone A Basement 132 260 2009 2 1,115 2,230 -1.02%
VISUAL COMPARISON Block grades were visually compared with drill hole composites on cross sections,
longitudinal sections, and plan views. The block grades and composite grades correlate very
well visually within the HG and LG domains of Phoenix deposit Zones A and B.

www.rpacan.com
Page 14-26 Denison Mines Corp. – Phoenix Deposit, Wheeler River Project, Project #2299 Technical Report NI 43-101 – June 17, 2014
STATISTICAL COMPARISON Statistics of the block grades are compared with statistics of composite grades in Table 14-6
for all blocks and composites within the Phoenix deposit Zones A and B, HG and LG
domains. Grades are weighted by density for the composites and tonnage for the blocks.
TABLE 14-6 STATISTICS OF BLOCK GRADES COMPARED TO COMPOSITE GRADES BY DOMAIN
Denison Mines Corp. – Phoenix Deposit
Statistic Zone A HG Zone A LG Zone A BSMT Zone B HG Zone B LG
Blocks Comps Blocks Comps Blocks Comps Blocks Comps Blocks Comps Mean (%U3O8) 39.18 34.86 1.73 1.77 1.35 1.56 25.71 21.65 1.34 1.57
Standard Error 0.37 1.93 0.02 0.14 0.35 0.36 0.59 3.74 0.04 0.31
Median (%U3O8) 36.51 31.52 1.22 0.59 0.14 0.32 26.63 17.14 0.69 0.53
Mode (%U3O8) N/A N/A 0.44 0.18 0.00 0.00 N/A N/A N/A 0.25 Standard Deviation (%U3O8)
15.63 21.62 1.72 2.69 4.11 4.26 10.66 15.85 1.65 2.64
Sample Variance 244.16 467.56 2.98 7.23 16.91 18.12 113.73 251.25 2.71 6.99
Kurtosis -0.13 -0.69 16.02 10.25 25.63 23.16 -1.18 -1.02 5.04 4.65
Skewness 0.67 0.45 3.05 2.81 4.90 4.72 -0.08 0.54 2.23 2.36
Range (%U3O8) 77.76 82.31 19.85 20.13 27.82 27.66 44.86 49.24 10.48 10.86
Min (%U3O8) 4.62 0.29 0.03 0.01 0.00 0.00 3.46 1.46 0.01 0.01
Max (%U3O8) 82.38 82.60 19.88 20.14 27.82 27.66 48.32 50.69 10.49 10.87
Sum 70,832 4,357 9,354 608 186.78 215 8,329 390 2,025 113
Count 1,808 125 5,417 344 138 138 324 18 1,506 72
CV 0.40 0.62 1.00 1.52 3.04 2.73 0.41 0.73 1.23 1.68
In some cases the average block grades are higher than the average composite grades,
which RPA attributes to density weighting of the block grades.
CHECK BY DIFFERENT ESTIMATION METHODS RPA has carried out check estimates of the Denison ID2 block models of the Phoenix
deposit using the contour method.
For the contour method (Agnerian and Roscoe, 2002), grade times thickness times density
(GxTxD) values for each drill hole intercept were plotted on plans and contoured. The areas
between the contours were measured and multiplied by the average value in the contour
interval. The GxTxD values are proportional to pounds of U3O8 per square metre and the
sum of these values times area are converted to total pounds of U3O8 for each domain.
www.rpacan.com
Page 14-27 Denison Mines Corp. – Phoenix Deposit, Wheeler River Project, Project #2299 Technical Report NI 43-101 – June 17, 2014
Thickness times density (TxD) values were also plotted on plans and contoured. The areas
between the contours were measured and multiplied by the average value in the contour
interval. The sum of the TxD values multiplied by the area represents tonnage for each of
the domains. For the contour method check on the Phoenix deposit Zone A HG domain, the
tonnes, grade, and contained pounds of U3O8 estimated by the contour method are in the
same general range as the ID2 block model estimate.
MINERAL RESOURCE ESTIMATE Table 14-7 lists the Mineral Resource estimate for the Phoenix deposit by domain and
resource category. The effective date of the resource estimate is May 28, 2014 and the cut-
off grade is 0.8% U3O8.
The cut-off grade of 0.8% U3O8 is based on internal conceptual studies by Denison and a
price of US$50/lb U3O8. The cut-off grade is consistent with the previous Phoenix Mineral
Resource estimate reported in 2012. The HG domains are not sensitive to cut-off grades
less than 5% U3O8 but the LG domains are quite sensitive to cut-off grade.
In RPA’s opinion, the estimation methodology is consistent with standard industry practice
and the Phoenix deposit Mineral Resource estimate is considered to be reasonable and
acceptable.
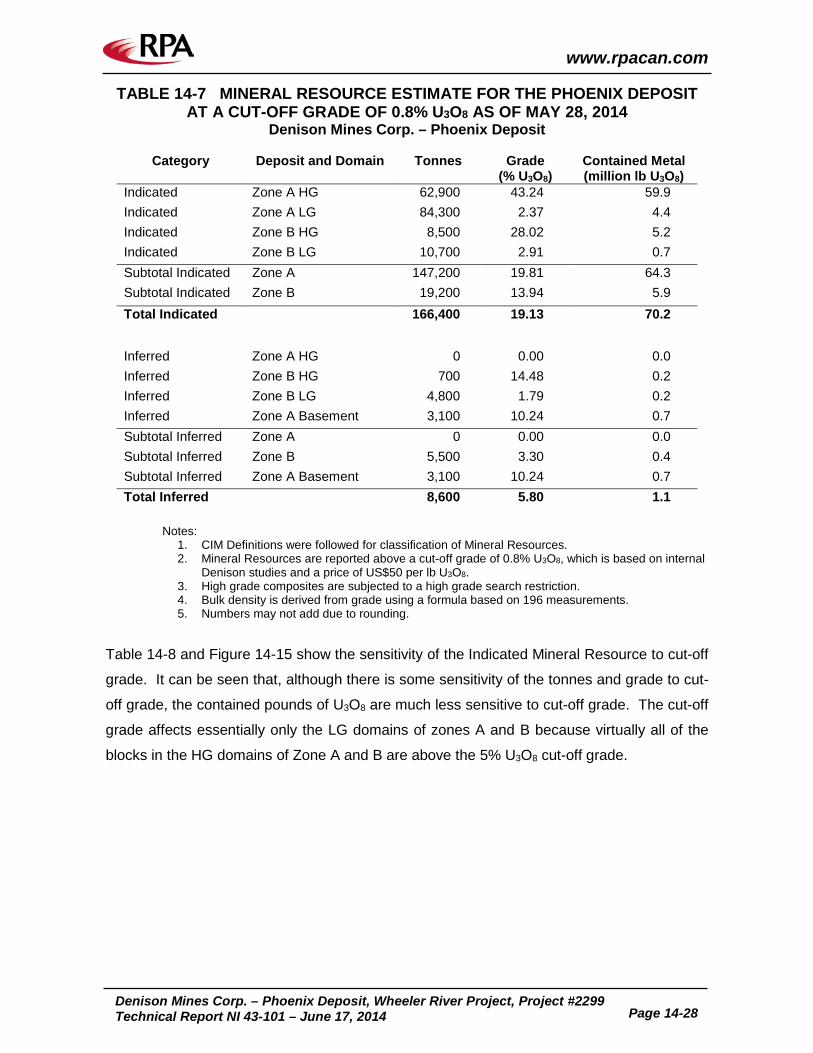
www.rpacan.com
Page 14-28 Denison Mines Corp. – Phoenix Deposit, Wheeler River Project, Project #2299 Technical Report NI 43-101 – June 17, 2014
TABLE 14-7 MINERAL RESOURCE ESTIMATE FOR THE PHOENIX DEPOSIT AT A CUT-OFF GRADE OF 0.8% U3O8 AS OF MAY 28, 2014
Denison Mines Corp. – Phoenix Deposit
Category Deposit and Domain Tonnes Grade (% U3O8)
Contained Metal (million lb U3O8)
Indicated Zone A HG 62,900 43.24 59.9 Indicated Zone A LG 84,300 2.37 4.4 Indicated Zone B HG 8,500 28.02 5.2 Indicated Zone B LG 10,700 2.91 0.7 Subtotal Indicated Zone A 147,200 19.81 64.3 Subtotal Indicated Zone B 19,200 13.94 5.9 Total Indicated 166,400 19.13 70.2 Inferred Zone A HG 0 0.00 0.0 Inferred Zone B HG 700 14.48 0.2 Inferred Zone B LG 4,800 1.79 0.2 Inferred Zone A Basement 3,100 10.24 0.7 Subtotal Inferred Zone A 0 0.00 0.0 Subtotal Inferred Zone B 5,500 3.30 0.4 Subtotal Inferred Zone A Basement 3,100 10.24 0.7 Total Inferred 8,600 5.80 1.1
Notes:
1. CIM Definitions were followed for classification of Mineral Resources. 2. Mineral Resources are reported above a cut-off grade of 0.8% U3O8, which is based on internal
Denison studies and a price of US$50 per lb U3O8. 3. High grade composites are subjected to a high grade search restriction. 4. Bulk density is derived from grade using a formula based on 196 measurements. 5. Numbers may not add due to rounding.
Table 14-8 and Figure 14-15 show the sensitivity of the Indicated Mineral Resource to cut-off
grade. It can be seen that, although there is some sensitivity of the tonnes and grade to cut-
off grade, the contained pounds of U3O8 are much less sensitive to cut-off grade. The cut-off
grade affects essentially only the LG domains of zones A and B because virtually all of the
blocks in the HG domains of Zone A and B are above the 5% U3O8 cut-off grade.
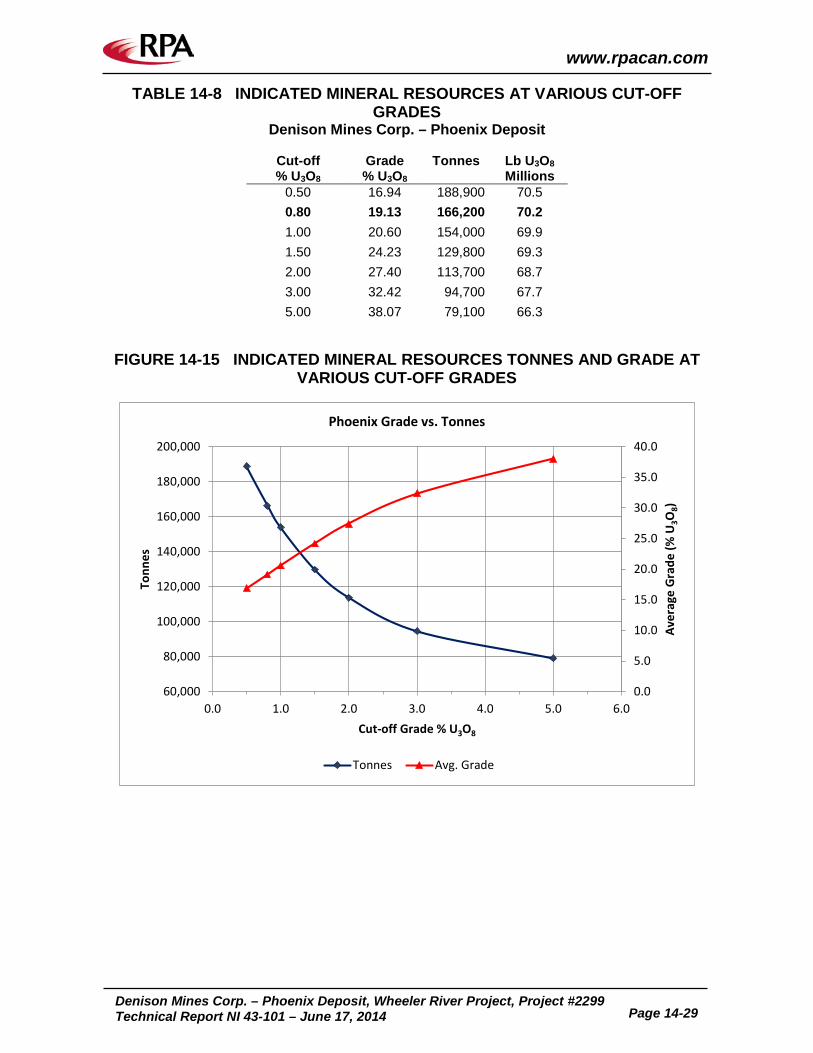
www.rpacan.com
Page 14-29 Denison Mines Corp. – Phoenix Deposit, Wheeler River Project, Project #2299 Technical Report NI 43-101 – June 17, 2014
TABLE 14-8 INDICATED MINERAL RESOURCES AT VARIOUS CUT-OFF GRADES
Denison Mines Corp. – Phoenix Deposit
Cut-off % U3O8
Grade % U3O8
Tonnes Lb U3O8 Millions
0.50 16.94 188,900 70.5 0.80 19.13 166,200 70.2 1.00 20.60 154,000 69.9 1.50 24.23 129,800 69.3 2.00 27.40 113,700 68.7 3.00 32.42 94,700 67.7 5.00 38.07 79,100 66.3
FIGURE 14-15 INDICATED MINERAL RESOURCES TONNES AND GRADE AT VARIOUS CUT-OFF GRADES
0.0
5.0
10.0
15.0
20.0
25.0
30.0
35.0
40.0
60,000
80,000
100,000
120,000
140,000
160,000
180,000
200,000
0.0 1.0 2.0 3.0 4.0 5.0 6.0
Aver
age
Gra
de (%
U3O
8)
Tonn
es
Cut-off Grade % U3O8
Phoenix Grade vs. Tonnes
Tonnes Avg. Grade
www.rpacan.com
Page 15-1 Denison Mines Corp. – Phoenix Deposit, Wheeler River Project, Project #2299 Technical Report NI 43-101 – June 17, 2014
15 MINERAL RESERVE ESTIMATE This section is not applicable.
www.rpacan.com
Page 16-1 Denison Mines Corp. – Phoenix Deposit, Wheeler River Project, Project #2299 Technical Report NI 43-101 – June 17, 2014
16 MINING METHODS This section is not applicable.
www.rpacan.com
Page 17-1 Denison Mines Corp. – Phoenix Deposit, Wheeler River Project, Project #2299 Technical Report NI 43-101 – June 17, 2014
17 RECOVERY METHODS This section is not applicable.

www.rpacan.com
Page 18-1 Denison Mines Corp. – Phoenix Deposit, Wheeler River Project, Project #2299 Technical Report NI 43-101 – June 17, 2014
18 PROJECT INFRASTRUCTURE This section is not applicable.
www.rpacan.com
Page 19-1 Denison Mines Corp. – Phoenix Deposit, Wheeler River Project, Project #2299 Technical Report NI 43-101 – June 17, 2014
19 MARKET STUDIES AND CONTRACTS This section is not applicable.
www.rpacan.com
Page 20-1 Denison Mines Corp. – Phoenix Deposit, Wheeler River Project, Project #2299 Technical Report NI 43-101 – June 17, 2014
20 ENVIRONMENTAL STUDIES, PERMITTING, AND SOCIAL OR COMMUNITY IMPACT This section is not applicable.

www.rpacan.com
Page 21-1 Denison Mines Corp. – Phoenix Deposit, Wheeler River Project, Project #2299 Technical Report NI 43-101 – June 17, 2014
21 CAPITAL AND OPERATING COSTS This section is not applicable.
www.rpacan.com
Page 22-1 Denison Mines Corp. – Phoenix Deposit, Wheeler River Project, Project #2299 Technical Report NI 43-101 – June 17, 2014
22 ECONOMIC ANALYSIS This section is not applicable.
www.rpacan.com
Page 23-1 Denison Mines Corp. – Phoenix Deposit, Wheeler River Project, Project #2299 Technical Report NI 43-101 – June 17, 2014
23 ADJACENT PROPERTIES This section is not applicable.
www.rpacan.com
Page 24-1 Denison Mines Corp. – Phoenix Deposit, Wheeler River Project, Project #2299 Technical Report NI 43-101 – June 17, 2014
24 OTHER RELEVANT DATA AND INFORMATION This section is not applicable.
www.rpacan.com
Page 25-1 Denison Mines Corp. – Phoenix Deposit, Wheeler River Project, Project #2299 Technical Report NI 43-101 – June 17, 2014
25 INTERPRETATION AND CONCLUSIONS Drilling at the Wheeler River Property from 2008 to 2014 has discovered and delineated the
Phoenix uranium deposit at the intersection of the Athabasca sandstone basal unconformity
with a regional fault zone, the WS fault, and graphitic pelite basement rocks.
The Phoenix deposit consists of two separate lenses known as zone A and zone B located
approximately 400 m below surface within a one kilometre long, northeast trending
mineralized corridor. Both lenses contain a higher grade core within a lower grade
mineralized envelope and extend southeastward from the WS fault along the unconformity.
Some mineralization also occurs on the northwest side of the WS fault but commonly at a
slightly lower elevation.
In addition to the zones A and B, a new domain (zone A basement) of uranium mineralization
below and adjacent to zone A has been identified in basement rocks and included in this
report.
Mineral Resources for Phoenix, based on 196 diamond drill holes totalling 89,835 m, were
estimated by Denison and audited by RPA. Indicated Resources total 166,400 t at 19.13%
U3O8 containing 70.2 million lbs U3O8. Inferred Resources total 8,600 t at 5.80% U3O8
containing 1.1 million lbs U3O8.
In RPA’s opinion, a Preliminary Economic Assessment could be carried out on the Phoenix
deposit.
New uranium mineralization has recently been discovered at the Gryphon zone located three
kilometres northwest of the Phoenix deposit. Although intersected by only two drill holes to
date, the Gryphon discovery warrants considerable follow-up drilling in RPA’s view.
www.rpacan.com
Page 26-1 Denison Mines Corp. – Phoenix Deposit, Wheeler River Project, Project #2299 Technical Report NI 43-101 – June 17, 2014
26 RECOMMENDATIONS The Wheeler River Joint Venture is planning a summer 2014 exploration program consisting
of a 14,500 m (20-hole) diamond drill program with two rigs beginning in June 2014. The
budget for this program is $3.6 million. Emphasis will be on following up the newly
discovered Gryphon zone mineralization in the K North target area as well as similar
geological targets along trend of Gryphon. A 3D DC-resistivity survey is also planned for the
area north of the Phoenix deposit. RPA has reviewed and concurs with the Wheeler River
Joint Venture planned 2014 exploration program.
In addition to this work, RPA recommends that a Preliminary Economic Assessment be
considered at an estimated cost of approximately $200,000.
If further drilling is completed at Phoenix, RPA recommends that Denison continue to collect
additional core density data to increase the confidence of estimated densities of the entire
grade range.
www.rpacan.com
Page 27-1 Denison Mines Corp. – Phoenix Deposit, Wheeler River Project, Project #2299 Technical Report NI 43-101 – June 17, 2014
27 REFERENCES Agnerian, H., and W. E. Roscoe. "The Contour Method of Estimating Mineral Resources."
CIM Bulletin, v. 95, 2002: pp. 100-107. Bosman, S.A., and J. Korness. "Building Athabasca Stratigraphy, Revising, redefining, and
Repositioning." in Summary of Investigations, Volume2, Saskatchewan Geological Survey, Saskatchewan Ministry of Energy and Resources, Miscellaneous Report 2007-4.2, CD-ROM, Paper A-8, 2007: 29.
Campbell, J.E. "Quaternary geology of the eastern Athabasca Basin, Saskatchewan." in
Jefferson, C.W. and Delaney, G. eds., EXTECH IV: Geology and Uranium Exploration Technology of the Proterozoic Athabasca Basin, Saskatchewan and Alberta, Geological Survey of Canada Bulletin 588, 2007: 211-228.
Card, C.D., D. Pana, P. Portella, D.J. Thomas, and I.R. Annelsey. "Basement rocks of the
Athabasca Basin, Saskatchewan and Alberta." in Jefferson, C.W. and Delaney, G. eds., EXTECH IV: Geology and Uranium Exploration Technology of the Proterozoic Athabasca Basin, Saskatchewan and Alberta, Geological Survey of Canada Bulletin 588, 2007: 69-87.
Dahlkamp, F.J., and B. Tan. "Geology and mineralogy of the Key Lake U-Ni deposits,
northern Saskatchewan, Canada." in Jones, M.J. eds., Geology, Mining, and Extractive Processing of Uranium: Institute of Mining and Metallurgy, London, 1977: 145-157.
Denison Mines. (2009-2011). Various Internal QA/QC Procedures and Memos outlining core logging, sampling, borehole logging, etc. Denver, Saskatoon: Denison Mines Corp.
Earle, S., and V. Sopuck. "Regional lithogeochemistry of the eastern part of the Athabasca
Basin uranium province." in Uranium Resources and Geology of North America, International Atomic Energy Agency-TecDoc-500, 1989: 263-296.
Gyorfi, I. Seismic constraints on the geological evolution of the McArthur River region in view
of the tectonics of the western Athabasca Basin, northern Saskatchewan. PhD Thesis, Saskatchewan: University of Saskatchewan, 2006, 230.
Hanly, A.J. The Mineralogy, Petrology and Rare Earth Element Geochemistry of the MAW
Zone, Athabasca Basin, Canada. Unpublished M.Sc. Thesis, Rolla, Missouri, USA: University of Missouri-Rolla, 2001, 168.
Jefferson, C.W., D.J. Thomas, S.S. Gandhi, P. Ramaekers, and et al. "Unconformity-
associated uranium deposits of the Athabasca Basin, Saskatchewan and Alberta." in Jefferson, C.W. and Delaney, G. eds., EXTECH IV: Geology and Uranium Exploration Technology of the Proterozoic Athabasca Basin, Saskatchewan and Alberta, Geological Survey of Canada Bulletin 588, 2007: 23-67.
Kerr, W.C. "The Discovery of the Phoenix Deposit: a New High Grade, Athabasca Basin
Unconformity-Type Uranium Deposit, Saskatchewan, Canada." Society of Economic Geologists Special Publications 15, 2010: 703-728.
www.rpacan.com
Page 27-2 Denison Mines Corp. – Phoenix Deposit, Wheeler River Project, Project #2299 Technical Report NI 43-101 – June 17, 2014
Kerr, W.C., C. Gamelin, C. Sorba, R. Basnett, L. Petrie, and R. Wallis. "The Phoenix Deposits: New High-Grade, Athabasca Basin Unconformity-Type Uranium Deposits, Saskatchewan, Canada." Vienna Paper Version #7. 2011. 45.
Liu, Y., K. Bodnarchuk, L. Petrie, and R. Basnett. Wheeler River Project. Denison Mines
Corp, 2011, 87. McGill, D.G., J.L. Marlat, R.G. Matthews, V.J. Supuck, L.A. Homeniuk, and J.J Hubregtse.
"The P2 North uranium deposit, Saskatchewan, Canada." Exploration and Mining Geology, v. 2, 1993: 321-331.
Quirt, D.H. "Athabasca unconformity-type uranium deposits: one deposit type with many
variations." Uranium Geochemistry 2003, International Conference, Nancy, France, April 13-16 2003, Proceedings. 2003. 309-312.
Ramaekers, P., et al. "Revised geological map and stratigraphy of the Athabasca Group,
Saskatchewan and Alberta." in Jefferson, C.W. and Delaney, G. eds., EXTECH IV: Geology and Uranium Exploration Technology of the Proterozoic Athabasca Basin, Saskatchewan and Alberta, Geological Survey of Canada Bulletin 588, 2007: 151-191.
Saracoglu, N., R.H. Wallis, J.J. Brummer, and J.P. Golightly. "The McClean uranium
deposits, northern Saskatchewan discovery." Canadian Mining and Metallurgical Bulletin, V. 76, No. 852, 1983: 63-79.
Sweet, K., and T. McEwan. Discussion of probe quality and grade evaluation Dibwe-Mutanga
Project. KenCo Minerals internal report for Denison Mines Zambia Limited, 2011. Sweet, K.O., and L. Petrie. 2010 Denison Memo on calibration factor for triple gamma probe.
Memorandum, Internal Denison Mines Corp report, 2010. Wallis, R.H., N. Saracoglu, J.J. Brummer, and J.P. Golightly. "The geology of the McClean
uranium deposits, northern Saskatchewan." Canadian Mining and Metallurgical Bulletin, V. 77, No. 864, 1984: 69-96.
Wasyliuk, K. Petrogenesis of the kaolinite-group minerals in the eastern Athabasca basin of
northern Saskatchewan: applications to uranium mineralization. Unpublished M.Sc. Thesis, Saskatoon, Canada: University of Saskatchewan, 2002, 140.
Yeo, G.M., and G. Delaney. "The Wollaston Supergroup, stratigraphy and metallogeny of a
Paleoproterozoic Wilson cycle in the Trans-Hudson Orogeny, Saskatchewan." in Jefferson, C.W. and Delaney, G. eds., EXTECH IV: Geology and Uranium Exploration Technology of the Proterozoic Athabasca Basin, Saskatchewan and Alberta, Geological Survey of Canada Bulletin 588, 2007: 89-117.
www.rpacan.com
Page 28-1 Denison Mines Corp. – Phoenix Deposit, Wheeler River Project, Project #2299 Technical Report NI 43-101 – June 17, 2014
28 DATE AND SIGNATURE PAGE This report titled “Technical Report on a Mineral Resource Estimate Update for the Phoenix
Uranium Deposit, Wheeler River Project, Eastern Athabasca Basin, Northern Saskatchewan,
Canada” and dated June 17, 2014 was prepared and signed by the following author:
(Signed & Sealed) “William E. Roscoe” Dated at Toronto, ON June 17, 2014 William E. Roscoe, Ph.D., P.Eng. Principal Geologist
www.rpacan.com
Page 29-1 Denison Mines Corp. – Phoenix Deposit, Wheeler River Project, Project #2299 Technical Report NI 43-101 – June 17, 2014
29 CERTIFICATE OF QUALIFIED PERSON WILLIAM E. ROSCOE I, William E. Roscoe, Ph.D., P.Eng., as an author of this report entitled “Technical Report on a Mineral Resource Estimate Update for the Phoenix Uranium Deposit, Wheeler River Project, Eastern Athabasca Basin, Northern Saskatchewan, Canada”, prepared for Denison Mines Corp. (the “Issuer”), and dated June 17, 2014, do hereby certify that:
1. I am a Principal Geologist with Roscoe Postle Associates Inc. of Suite 501, 55 University Ave Toronto, ON, M5J 2H7.
2. I am a graduate of Queen’s University, Kingston, Ontario, in 1966 with a Bachelor of
Science degree in Geological Engineering, McGill University, Montreal, Quebec, in 1969 with a Master of Science degree in Geological Sciences and in 1973 a Ph.D. degree in Geological Sciences.
3. I am registered as a Professional Engineer (No. 39633011) and designated as a
Consulting Engineer in the Province of Ontario. I have worked as a geologist for a total of 46 years since my graduation. My relevant experience for the purpose of the Technical Report is: • Thirty-one years of experience as a Consulting Geologist across Canada and in
many other countries • Preparation of numerous reviews and technical reports on exploration and mining
projects around the world for due diligence and regulatory requirements • Senior Geologist in charge of mineral exploration in southern Ontario and
Québec • Exploration Geologist with a major Canadian mining company in charge of
exploration projects in New Brunswick, Nova Scotia, and Newfoundland
4. I have read the definition of "qualified person" set out in National Instrument 43-101 (NI 43-101) and certify that by reason of my education, affiliation with a professional association (as defined in NI 43-101) and past relevant work experience, I fulfill the requirements to be a "qualified person" for the purposes of NI 43-101.
5. I visited the Wheeler River Project on October 30, 2012, and June 16, 2014.
6. I am responsible for all Sections of the Technical Report.
7. I am independent of the Issuer applying the test set out in Section 1.5 of NI 43-101.
8. I have previously authored a NI 43-101 Technical Report on the property that is the subject of the Technical Report.
9. I have read NI 43-101 and this Technical Report, and the Technical Report has been prepared in compliance with NI 43-101 and Form 43-101F1.
www.rpacan.com
Page 29-2 Denison Mines Corp. – Phoenix Deposit, Wheeler River Project, Project #2299 Technical Report NI 43-101 – June 17, 2014
10. At the effective date of the Technical Report, to the best of my knowledge,
information, and belief, the Technical Report contains all scientific and technical information that is required to be disclosed to make the Technical Report not misleading.
Dated this 17th day of June, 2014 (Signed & Sealed) “William E. Roscoe” William E. Roscoe, Ph.D., P.Eng.