Embed Size (px)
Citation preview

Dennis ScanlonThe Pennsylvania State University

AF4Q Program AF4Q Evaluation◦ Purpose & Audiences◦ Logic Model◦ Data Collection
Early Findings Products and Dissemination Questions/Discussion

Goal: Multi-stakeholder collaboratives as catalyst for change in local health systems◦ http://www.rwjf.org/qualityequality/af4q/about.jsp
Interventions: Funding, technical assistance, data
Key Focal Areas/Drivers:◦ Public reporting ◦ Consumer engagement ◦ Quality improvement◦ Disparities reduction

◦ How to improve the program◦ What works under what circumstances ◦ An evidence base for: Social change Practice in the field Foundation grant making

The RWJF Board of Trustees Foundation Staff National Advisory Committee (NAC) National Program Office (NPO) Grantees and their Communities Policymakers, Practitioners, and
Researchers

Time
Longer Term Outcomes
• Quality Improvement
• Cost reductions• Improved Health
Status• Reductions in
Disparities
AF4Q Logic Model
{Performance Data}
Consumer Engagement
Activities
Public ReportingInitiatives
Quality Improvement
Initiatives
AF4QInterventions
AF4QCommunityAlliances
• Employers• Labor• Public purchasers• Insurers • Providers• Hospital leadership• Nurse leaders• Publicly funded
healthcare organizations
• Public health experts• Consumers
representing community population
Alliance Development
Alliance Sustainability
Historical Context and External Environment
Rev 10_9_09
IntermediateOutcomes
• Patient experience• Patient activation• Price & quality
transparency• Provider quality
improvement• Patient safety• Care coordination• Care site transitions• Diffusion of best
practices• Nurse sensitive
outcomes• R/E/L Data Collection

Tracking◦ Systematic tracking of Alliance activities and relevant health
information and activities in the Alliances’ communities e.g., availability of public reports, CE activities and state policy
proposals Key Informant Interviews◦ In person site visit interviews with multiple stakeholders◦ Phone interviews◦ Over 750 to date
Surveys◦ Consumer survey◦ Physician survey◦ Alliance Survey
Secondary Data◦ Dartmouth Atlas◦ H-CAHPS◦ Area Resource File

Key Informant Interviews
Key Informant Interviews
Key Informant Interviews

Qualitative assessment: ◦ Semi-structured interviews (transcribed and coded)
Focus:◦ Vision and logic model◦ Leadership and governance◦ Adequacy of resources◦ Stakeholder representation◦ Barriers◦ Likelihood of success◦ Content specific issues (QI, PM/PR, CE etc.)
Interview settings and participants:◦ Site visits: Participants: Leadership, Steering Committee, Alliance Staff, External
Stakeholders 1st round (2006-2007, 2nd round (Q4 2009 – Q1 2010)
◦ Follow-up calls every 6 months with Alliance leaders (5 rounds)◦ Periodic calls with site specialists (QI, PM/PR, CE etc.)

Alliance SurveyAlliance Survey
Alliance Survey

Web-based survey designed to gather opinions from Alliance stakeholders about key areas of the AF4Q governance and operations
Quantitative feedback to complement key informant interviews
Participants:◦ Leadership, AF4Q Staff, Committee Members
Focus:◦ Leadership◦ Organization and management ◦ Decision making◦ Communication◦ Conflict resolution◦ Cost and benefits of participation
Two rounds of data collection completed; third round about to begin (18 month intervals)

66.7%4.8%
28.6%
Yes No Don't Know
From your organization's perspectivedo the benefits of participation in the Alliance
appear to outweigh the costs (Q21)
81.0%
9.5%
9.5%
Yes No Don't Know
From your professional/personal perspectivedo the benefits of participation in the Alliance
appear to outweigh the costs (Q22)
Benefits of Alliance ParticipationSource: AF4Q Seattle Alliance Web Survey

Consumer Survey

A generalizable sample of the chronically ill population using random-digit-dial techniques◦ Separate samples for each of the 17 AF4Q communities and a
non-AF4Q control sample◦ Oversample for race/ethnicity in 12 of 17 communities
Five minute “screener” survey to determine full survey eligibility based on having one of five chronic illnesses (diabetes, hypertension, heart disease, asthma, depression)
Eligible (and willing) respondents participated in 25 minute survey with questions about:◦ Patient care experience◦ Self-reported receipt of evidence based care◦ Patient engagement in their own care◦ Exposure to and use of public reporting
$20 cash incentive for survey completion

Questions drawn from a variety of existing survey resources with prior validation including:◦ Community Tracking Study ◦ RAND Improving Chronic Illness Care Evaluation
(ICICE)◦ Pew Survey of Latinos◦ Kaiser/AHRQ 2006 Update on Consumer’s View of
Patient safety and Quality Information ◦ RWJF Diabetes wave 2 patient survey◦ Boeing Benefits and Enrollment Survey ◦ Hibbard Patient Activation Measures ◦ Harvard School of Public Health/Robert Wood Johnson
Foundation, Sub-ethnicities Survey
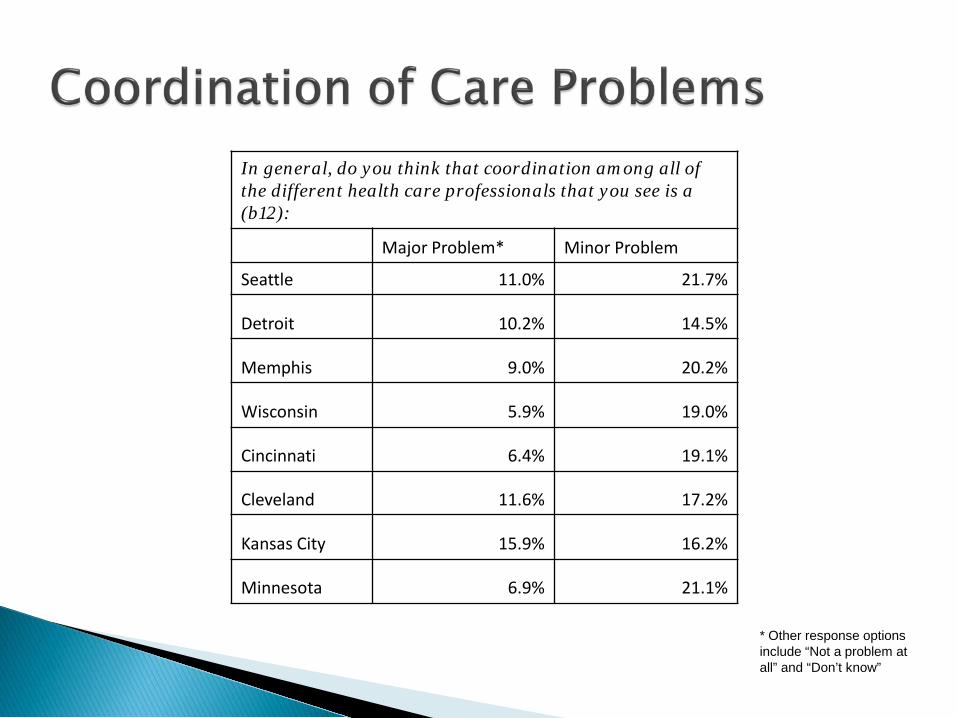
In general, do you think that coordination among all of the different health care professionals that you see is a (b12):
Major Problem* Minor Problem
Seattle 11.0% 21.7%
Detroit 10.2% 14.5%
Memphis 9.0% 20.2%
Wisconsin 5.9% 19.0%
Cincinnati 6.4% 19.1%
Cleveland 11.6% 17.2%
Kansas City 15.9% 16.2%
Minnesota 6.9% 21.1%
* Other response options include “Not a problem at all” and “Don’t know”

Cleveland Kansas City
Satisfied with current doctor (71%)
Could not choose another doctor because of insurance (8%)
Other (8%) Not sure of accuracy of
reports (5%) Did not need to see
physician (3%)
Satisfied with current doctor (60%)
Other (16%) Could not choose another
doctor because of insurance (11%)
Did not need to see physician (2%)
Not sure of accuracy of reports (2%)

Physician Survey

To get a baseline understanding of the use of care management practices and incentives for quality improvement in small and medium sized physician practices in the AF4Q communities (and a non-AF4Q sample)◦ Focus on physicians treating patients with one of four chronic illnesses
(diabetes, asthma, CHF, depression)
To compare small and medium size physician practices to larger practices and IPAs▫ Link to National Survey of Physician Organizations (NSPO) study of
groups/IPAs with 20+ physicians
To measure change over time by re-fielding the physician survey after about three years

35-40 minute computer-assisted telephone survey◦ Respondents include (in order of preference): the physician leader, non-
physician leader, or “rank-and-file” physician working in the practice for at least one year
◦ $175 incentive for each practice
Separate samples for each of the 17 AF4Q sites and a nationally representative sample drawn from non AF4Q communities
Repeat in 3 years to look for change over time

Demographics ◦ Practice size, specialty mix, # of sites, ownership, patient race,
ethnicity, language and insurance Possession/use of clinical information systems Use of care management processes◦ Based on the chronic care model
Exposure to external performance incentives Revenue sources and methods of physician payment
(e.g., exposure to P4P arrangements) Practice culture (e.g., use/views of non-physician
providers)

63.9% overall response rate◦ Range: 54.1%-88.8% across 17 AF4Q sites◦ National sample: 61.7%
1,809 completed interviews◦ 1,256 from AF4Q sites◦ Range of completed interviews across first 14 AF4Q sites:13-
208◦ 553 interviews from the national sample

Practice Type and Size
5%
2% 2%
88%
3%
Distribution by practice type
Cardiology Endocrinology Pulmonology
Primary care Multispecialty
54%34%
9%
3%
Distribution by practice size
1-2 3-7 8-12 13-19

Practice maintains a registry or a list of patients for the following conditions: (% of practices)
Asthma Diabetes CHF Depression
Cincinnati 14.0 20.0 16.0 11.9
Cleveland 0.0 16.3 4.4 2.2
Detroit 17.6 24.3 20.5 12.6
Humboldt Co. 7.7 69.2 15.4 15.4
Kansas City 11.8 17.7 16.4 11.6
Maine 27.2 59.8 35.2 24.0
Memphis 10.9 21.2 13.0 7.6
Minnesota 14.3 38.0 16.3 11.8
Puget Sound 14.0 26.6 12.7 5.7
SCPA 10.3 18.4 10.3 2.6
West Michigan 14.9 25.0 14.9 14.7
Western New York 11.0 16.7 16.0 8.8
Willamette Valley 10.1 26.1 16.5 7.1
Wisconsin 13.7 36.3 16.9 4.0
All AF4Q 14.4 28.6 17.7 10.4

Secondary Data Sources
Secondary Data Sources

Secondary Data Analysis
• We collect, analyze and trend data from multiple secondary sources related to the intermediate and longer term outcomes identified in the logic model
• Examples include:▫ H-CAHPS▫ Dartmouth Atlas▫ HCUPS

Percent of diabetics having blood lipids tested in sites with 20+ hospitals with 500+ patients
20.0
30.0
40.0
50.0
60.0
70.0
Perc
ent o
f dia
betic
s hav
ing
bloo
d lip
ids t
est
Wisconsin Maine Minneapolis/St. Paul
SeattleGreaterCincinnati
WesternMichigan
Detroit
Dartmouth Atlas Data: Diabetic Lipid Testing

Alliance Tracking
Alliance Tracking
Alliance Tracking
Alliance Tracking

• Objective: Annually compile reports available to the general public or health plan members (addressing health plan, hospital, or physician/physician group quality) in AF4Q and comparison communities
– Identified through: (1) general internet search; (2) medical association, hospital association, QIO, health plan association, and top five health plan websites; (3) organization contact including key informant interviews and call observations with AF4Q Alliances, and follow-up with reporting organizations for clarification
– Reports reviewed for:• Data sources and aggregation approach• Distribution methods, recipients• Measure development and specification (e.g., NFQ)• Length of reporting activities• Involvement of provider and payer communities• Use of information for Pay for Performance
• We contact AF4Q Alliances every six months for updates on reporting activities

Community
Tota
l
Sponsor1 Source of Measures2 Type of Data3
Loca
l
Stat
e
Heal
thPl
an
Nat
iona
l
Uni
que
Clai
ms
Patie
nt
Reco
rd
Patie
nt
Surv
ey
Prov
ider
Su
rvey
Cincinnati, OH 6 1 0 5 3 5 3 3 1 0Cleveland, OH 4 1 0 3 2 3 2 3 1 0Detroit, MI 6 1 0 5 2 5 5 2 0 0Humboldt County, CA 9 2 2 5 3 10 6 3 5 1Kansas City, MO 5 1 0 4 3 4 2 3 2 0Maine 5 1 0 4 3 3 4 3 0 0Memphis, TN 6 2 0 4 4 4 3 2 2 1Minnesota 9 4 0 5 5 7 5 5 4 1Puget Sound, WA 4 1 0 3 0 4 4 1 1 0South Central, PA 4 1 1 2 1 4 2 3 0 0West Michigan 4 0 0 4 2 3 3 2 0 0Western New York 3 0 2 1 0 3 1 2 0 0Willamette Valley, OR 1 0 0 1 0 1 1 0 0 0Wisconsin 5 2 0 3 3 4 3 3 0 0
1 Type of organization acting as primary sponsor of provider quality report. Local sponsors include business coalitions, hospital associations, and local health care quality organizations. State reports include Departments of Health or other State funded organizations, such as PHC4 in Pennsylvania and the Office of Statewide Health Planning and Development in California. Health plan reports include local, regional, and national health plans.2 National measure source includes all reports utilizing nationally endorsed measure sets, such as CMS Hospital Compare measures. Locally/Unique measures include measures developed or modified by the reporting entity or a local health care quality organization in consultation with local physician and hospital leaders. Reports may use a combination of national and local/unique measures.3 Type of data used in quality measure construction. Claims data includes health plan billing data and other administrative data such as hospital discharge data provided to CMS. Patient record data includes data obtained directly from medical records; claims data may be used to identify patients for medical record review. Patient survey data are data obtained from a survey provided to patients such as CAHPS or locally/nationally sponsored surveys. Provider survey data are data obtained from surveys completed voluntarily by providers such as Leapfrog or health information technology readiness surveys.

Community
Tota
l
Type of Measures1 Level of Measure Construction2
Care
Pr
oces
s/O
utco
me
Patie
nt
Expe
rienc
e
Cost
Effic
ienc
y
Prac
tice/
Gro
up
Indi
vidu
al
Cincinnati, OH 6 5 1 2 2 4 2Cleveland, OH 4 4 0 1 2 3 1Detroit, MI 6 6 0 3 1 4 2Humboldt County, CA 9 8 4 2 2 7 2Kansas City, MO 5 4 1 2 2 3 2Maine 5 5 0 1 2 4 1Memphis, TN 6 5 1 2 2 3 3Minnesota 9 7 2 3 2 8 1Puget Sound, WA 4 4 1 1 1 3 1South Central, PA 4 4 0 0 2 2 2West Michigan 4 4 0 2 1 1 3Western New York 3 3 0 0 1 0 3
Willamette Valley, OR 1 1 0 0 1 0 1Wisconsin 5 4 0 2 2 3 2
1 Types of measures included in provider quality report. Process and outcome measures include care process or outcomes (i.e. lab results) related to inpatient or ambulatory care whether constructed with claims or medical record data. Patient experience measures include measures related to a patient’s satisfaction with care. Cost measures include measures related to the cost of a procedure. Efficiency measures include measures that take into consideration a weighting of cost based on risk or combine quality and cost measures. Efficiency measures are primarily provided by national health plans and combine cost and quality measures.2 Quality scores for “Physicians” are provided to consumers at the individual physician or group/clinic level. The total can add to more than total number of reports.

We partner with and across sites to evaluate interesting interventions, ideas or programs
Funded out of main evaluation budget Examples of projects we have done/are
doing:◦ Medical home implementation in Michigan◦ Direct data collection in MN, WI and Cincinnati◦ CDSMP assessment in Humboldt◦ Composite measure formation in Puget Sound


Goal: To assess capacity building in the early stages of the AF4Q Alliances
Definition of capacity:
“The activities and structures that leverage existing resources in pursuit of common objectives and which are sustainable over the long term” Similar to Berwick’s “Governing the Commons”
Data Source:◦ Transcripts from key stakeholder interviews conducted in four AF4Q
alliances that were early entrants to the initiative.◦ We interviewed multiple stakeholders per site several months after
initiation of the AF4Q grant


Infrastructure and governance:◦ Ability of the alliance to develop internal support and decision-
making systems that foster effective member participation, develop leadership, acquire resources and avoid overburdening key members.
Stakeholder relations and participation:◦ The relationships between alliance stakeholders that facilitate or
inhibit the ability of the alliance to set goals and undertake activities in pursuit of those goals.
Alliances face common challenges and trade-offs in deciding how to address the issues encompassed in these two components.

Establishing the right organizational/governance structure
Appropriately balancing power and participation Decision-making inclusiveness versus decision-making
efficiency Making collateral leadership work Defining staff versus member roles

◦ Utilize an existing organization Positives: Eliminates startup cost/activities, efficiencies in
resource utilization and the ability to build on organization’s prior reputation
Negatives: Carryover of “baggage” and potential conflicts between goals of existing organization and AF4Q requirements
Or◦ Establish a new independent governance structure Positives: “Fresh start” and avoidance of goal conflicts Negatives: Time and energy requirements to start a new
organization and loss of economies of scale

Building on cultural and historical relations Recruitment of stakeholders Aligning stakeholder goals Developing resource capacity Sustaining participation

Several sites noted concerns about retaining purchaser participation Purchasers want to see change occur quickly, particularly in this
challenging economy Physicians want to move in a more measured “scientific” manner
Alliances need to find a balance between “painting a vision” for long-term success and achieving specific goals to maintain member enthusiasm
Sites with representatives from multiple sectors must devote resources to establishing a common level of understanding about complex healthcare issues

Governance structure will have a significant impact on the development of quality strategies and interventions, and ultimately, on the outcomes of the AF4Q Alliances
While sites have organizational charts, differences in formats and other features make comparisons difficult using these documents alone, so we developed a categorization process to describe different structures using a common framework
Our categorization scheme depicts five dimensions of governance structure in a common format including:◦ General oversight body◦ Policy and strategic oversight body◦ AF4Q Management and oversight body◦ AF4Q work groups◦ Collaborating organizations

BHGC - Better Health Greater Cleveland Board of Directors is comprised of:
- a representative from the Metro Health System
- a representative from the Health Action Council
- a representative from the Center for Community Solutions
9/1/09 Draft

Membership and participation◦ Parent organization vs. AF4Q
Dues structure Committee structure Permanent staff & consultants Budget◦ Overall and % attributable to AF4Q
Authority and decision making rules Agenda setting Internal & external communications

Goal: To assess alignment among internal AF4Q stakeholders (i.e., AF4Q participants) using data from the 2nd round of the alliance survey.
Aspects of alignment assessed:◦ Agreement on purpose for the alliance◦ Agreement on the alliance’s vision◦ Agreement on strategies◦ Perception that alliance members are committed to the vision
and goals and are willing to collaborate to realize them◦ Perceptions that the benefits of participating in the alliance
exceed the costs of participation

Alliance Survey, Round 2◦ Conducted in 2009 via the web◦ 590 respondents across 14 sites◦ Overall response rate 46% (range: 28 to 71%)◦ We conducted a targeted mail-based survey of non-responders; non-response
bias does not appear to be an issue 10 questions relevant to alignment◦ Example: “The members of the Alliance have a clear and shared vision of health in our
community”◦ Response options: “Strongly disagree, disagree, neither agree or disagree,
agree, strongly agree” or “yes, no or don’t know” Measure utilized: “Level of Agreement”◦ % who “agree” or “strongly agree”◦ % who indicated “yes”

Stakeholder Alignment Findings I
Site
The Purpose of the Alliance is
clear
An allianceis essential
for improving
health
The alliance provides better opportunities
to work together
Members have a clear and shared
visionMembers agree
on strategies Cincinnati 96% 83% 88% 73% 66%
Cleveland 94% 58% 88% 73% 53%
Detroit 91% 65% 79% 46% 26%
Humboldt 96% 92% 84% 85% 77%
Kansas City 85% 75% 83% 79% 57%
Maine 93% 64% 79% 71% 58%
Memphis 81% 75% 81% 56% 39%
Minnesota 94% 56% 75% 94% 63%
Puget Sound 94% 71% 90% 63% 39%
Western Michigan 87% 80% 73% 67% 42%
Western New York 85% 68% 77% 66% 35%
Willamette Valley 94% 81% 91% 80% 60%
Wisconsin 92% 47% 78% 56% 32%
York 91% 70% 76% 82% 51%
Total 91% 71% 82% 70% 48%

Stakeholder Alignment Findings II
Site
Alliance leaders
collaborate
Alliance members are committed to
success
The allianceis taking
meaningful action
Personal benefits of
participation outweigh
costs
Organizational benefits of
participation outweigh costs
Cincinnati 91% 74% 89% 86% 72%
Cleveland 81% 73% 77% 73% 69%
Detroit 71% 73% 74% 65% 55%
Humboldt 100% 83% 100% 95% 95%
Kansas City 88% 80% 80% 83% 77%
Maine 93% 73% 74% 93% 74%
Memphis 94% 69% 62% 69% 77%
Minnesota 88% 88% 85% 85% 77%
Puget Sound 86% 56% 94% 83% 69%
Western Michigan 67% 56% 90% 73% 58%
Western New York 83% 56% 67% 67% 71%
Willamette Valley 96% 85% 71% 71% 83%
Wisconsin 81% 57% 74% 74% 68%
York 80% 73% 78% 68% 68%
Total 85% 69% 79% 77% 72%

While there is variation between sites, respondents appear to be aligning around the purpose for the alliance and the alliance’s vision
However, less than half of the respondents think that there is consensus on the best strategies to achieve priorities. This is consistent with findings from our site interviews.
Caveats:◦ Perceptions of alignment are likely to change over time relative to the specific “issues on
the table” and the stage of alliance development.◦ Comparisons between sites should be done with caution given different stages of
development◦ Sample sizes and response rates vary by site (e.g., WNY vs. Minnesota)◦ Changes over time and within respondents over time may be the most insightful
◦ The survey does not cover external stakeholders (individuals that are not actively participating in AF4Q but that could be affected by the Alliance’s activities). While 66% of respondents felt that all necessary organizations or individuals were
participating in the AF4Q process, this does not rule out the possibility that there are key community stakeholders that are not aligned with the activities of the alliance.

“It’s [AF4Q] really provided a platform on which to address a number of issues that are being triggered at the national level because five/ten years ago, anybody, I mean outside of AHRQ or IHI, is anybody serious about quality improvement and primary care, public reporting? No… Now you’ve got an entity in this community that’s forcing them to think about questions I don’t think they would be thinking about, otherwise they would have been way behind what’s starting to come out of Washington, not only in terms of ONC activities, but everything else that’s going to happen with health reform”. [Cincinnati, 5/5/10]

“So health reform has just put us [the AF4Q Alliance] on the front page, our work on the front page”. [WNY, 1/27/10].
“I think there is abundant opportunities for groups like us, and the AF4Q communities, and others around the country to take on even more prominence… I think it’s going to necessitate that we be willing to put on the table, the fact there may have to be some hard decisions made, about who does what, or how do we get this work [HC reform] accomplished in a way that is most efficient and most effective. And that might have some real consequences for us, or for others”. [Wisconsin, 4/15/10]

“So I think it’s just…the word about the [AF4Q] work is getting out number one, and it doesn’t hurt that we’re in the time that we are. You know, healthcare is front and center and health reform legislation and all that, but I think folks are really taking note of the collaborative as really a leader in local health reform and they subscribe to that”. [Cincinnati, 5/4/10]
“For me, the main reason I have stayed [involved] even though my schedule has gotten immensely busy during this period of time, has been the real chance to make some progress and the belief that health reform is really only insurance reform and really health care reform is gonna happen at the local level with things like this [AF4Q] and that fact that we can actually see progress”. [Cincinnati, 5/4/10]

“Of course, the whole thing I think is all in this sort of weird suspended animation with the whole move toward EMR and meaningful use. I often say why even bother with any of this [PR and QI work] when in five years everybody is going to have to be reporting these same clinical measures under meaningful use and somebody’s going to have them all in one place and that’ll be as good as anything, or better”. [Maine, 3/23/10]

“…the most interesting thing I’ve heard associated with this [reform] is that Don Berwick may be the new CMS Director. That would give a totally different spin to CMS for the first time. Now the problem is, as you probably well know, I mean, trying to change the direction of a major governmental bureaucratic agency is going to be like trying to move the Queen Elizabeth through the Panama Locks with a rowboat. And how successful Dr. Berwick will be in trying to espouse some of his quality beliefs into CMS, I think we’re all hoping that can be done, but none of us are sure it can be done.” [Wisconsin, 4/15/10]

Consumer Engagement

“…[Consumer engagement] is the area that most closely aligns with pushing smoke around a room; it’s hard to get your hands around it and define it.”
“At least in the short-run, five to ten years, I don’t have a lot of confidence in consumer engagement as the way to go.”
“We want [consumers] to choose better quality; we want them to better self-manage; but we also want them to change us to help us see [care delivery] through their eyes.”
(*) Quotes taken from 3 physicians at the same AF4Q site early in the program

1. How do alliances define and measure successful consumer engagement over time?
– Consumer Engagement: Term referring to an individual’s emotional involvement and commitment to health, and/or a consumer’s participation in a set or subset of behaviors to manage their health and health care.
2. What are alliances’ initial CE strategies and activities?◦ How and why did alliances select them? How and why do alliances change
their CE strategies and activities over time?
3. Does consumer engagement -- both activation and engaged behaviors -- increase in AF4Q communities overall? Does it result in improved health outcomes?


Characteristics of individuals
Characteristics of Groups
Recognition of role
Information gathering
Weighing the options
Take/maintain action to change behaviors
Change in health status and wellbeing
Characteristics of Communities
Recognition of role
Individuals must recognize that there is room to improve health and that one has an important role in doing so.
Information gathering
An individual may seek out, or be receptive to, information about the actions that must be performed to maintain health and wellbeing.
Weighing the options
This involves synthesizing the information and evaluating the benefits and (direct or indirect) costs of behavioral changes.
Take/maintain action to change behaviors
These include healthy behaviors (exercising, eating right), self-management behaviors (taking medication as directed), health care encounter behaviors (making decisions by asking physician questions), and consumeristic behaviors (reading and understanding public reports).
Change in health status and wellbeing
By choosing to take or not take action to participate in health improving behaviors, the individual’s health status and wellbeing are affected.

Immutable Gender Race/Ethnicity Cognitive ability
Immutable GeographyDemographics
Immutable Demographics
Potentially Mutable (short and long term) Activation: knowledge, skills, confidenceExperience with healthcare systemHealth status IncomePreferences for health over other goodsInsurance statusAttitudes EducationEmploymentBeliefs
Key Characteristics of IndividualsPotentially Mutable (short and long term) Cultural normsTraditionsValues BeliefsSocial structureSupport
Key Characteristics of GroupsPotentially Mutable (short and long term) Resources/assets Social support systemsCultural normsHealth systems structure and normsPrices for health and non-health goodsProvider supply
Key Characteristics of Communities

Mapping the model to AF4Q sites
GENE
RAL
DIAB
ETES
HEAR
T DIS
EASE
DEPR
ESSI
ONHI
GH B
LOOD
PRE
SSUR
EOB
ESIT
YCA
NCER
SEA_1_Rx for Information 1 1 1 1 1 12008_05
2009_03
Ended AF4Q No 1 1
SEA_2_Community Checkup
1 1 1 1 1 1 12008_05
Ongoing AF4Q Yes 1 1
SEA_3_Monthly columns by Dr. Whitaker
1 1 1 1 1 1 12009_02
Ongoing AF4Q No 1 1
SEA_4_King County's Healthy Incentives program
1 1 1 1 12009_03
OngoingAF4Q-
relatedNo 1 1
SEA_5_HRAs and materials identified and developed by CET
1 1 1 1 1 1 1 12009_00
Ongoing AF4Q No 1
HUM_1_CHA Website 1 1 1 1 1 1 12010 _02
Ongoing AF4Q No 1 1 1
HUM_2_"Our Pathways to Health"
1 1 1 1 0000_00
Ongoing AF4Q No 1 1
HUM_3_POET (Peer Outreach and Education 1 1 1 1
0000_00
Ongoing AF4Q No 1
HUM_4_Speakers' Bureau 1 1 1 10000_00
Ongoing AF4Q No 1
HUM_5_Take Charge! 1 1 1 200900
Ongoing AF4Q No 1
HUM_6_A1AA's Senior Resource Guide
1 1 1 12009_00
OngoingAF4Q-
relatedNo 1 1
Scope/ReachStatus/Attribution/ Evaluation
STAT
US
ATTR
IBUT
ION
EVID
ENCE
OF E
VALU
ATIO
N
GENE
RAL
EMPL
OYEE
S OF…
CHILD
REN
SENI
ORS
END
ATTN
TO LI
TERA
CY LE
VELS
ATTN
TO LA
NGUA
GE
INTE
RNET
ACC
ESS
CHAN
GE FO
NT SI
ZE
INFO
GAT
HERT
ING
WEI
GHIN
G OP
TION
STA
KE/M
AINT
AIN
ACTI
ON
STAR
T
Item
Behaviors Model
HEAL
THY
CONS
UMER
ISTI
CHE
ALTH
CAR
E ENC
OUNT
ER
SELF-MANAGEMENT
ROLE
REC
OGNI
TION

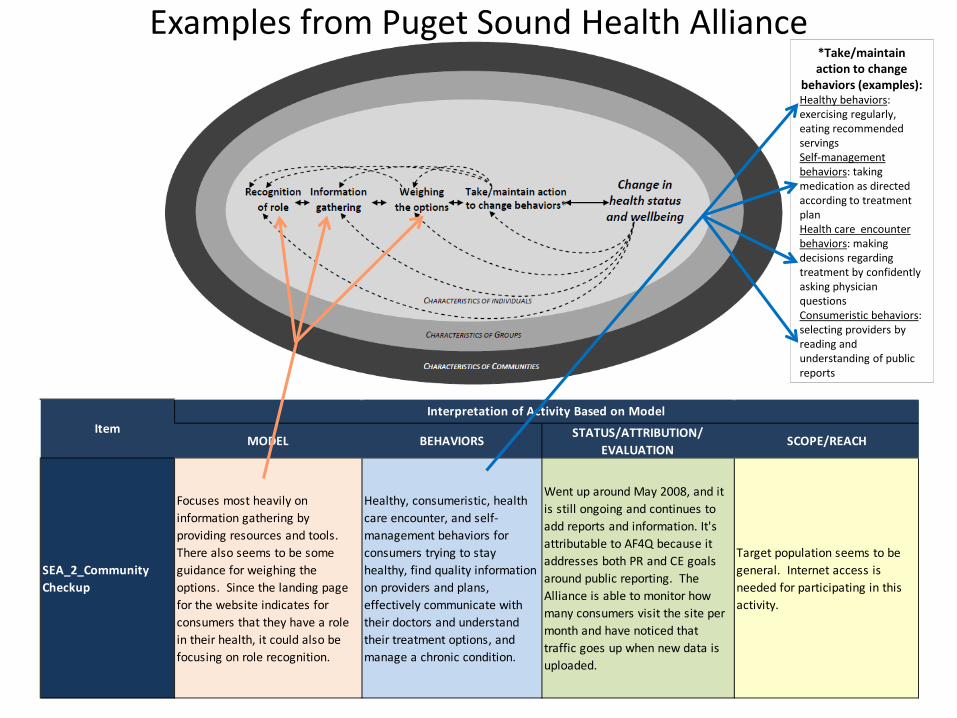
Examples from Puget Sound Health Alliance*Take/maintain action to change
behaviors (examples):Healthy behaviors: exercising regularly, eating recommended servings Self-management behaviors: taking medication as directed according to treatment planHealth care encounter behaviors: making decisions regarding treatment by confidently asking physician questionsConsumeristic behaviors: selecting providers by reading and understanding of public reports
MODEL BEHAVIORS STATUS/ATTRIBUTION/ EVALUATION
SCOPE/REACH
SEA_1_Rx for Information
Focuses most heavily on information gathering yet a physician handing a patient a prescription to do research on a condition could also help one to recognize their role.
Self-management for diabetes, heart disease, and depression. Also consumeristic behavior since it uses Community Checkup.
Started in May 2008 but might have ended around April 2009 when new CE goals were announced. Attributed to AF4Q because the Alliance viewed it as consumer engagement at one time. No formal evaluation in place.
Target population seems to be general since anyone who visits a physician could be the audience. It would also be important that the consumers using this service have some way of accessing the internet since Community Checkup is online.
ItemInterpretation of Activity Based on Model
Examples from Puget Sound Health Alliance*Take/maintain action to change
behaviors (examples):Healthy behaviors: exercising regularly, eating recommended servings Self-management behaviors: taking medication as directed according to treatment planHealth care encounter behaviors: making decisions regarding treatment by confidently asking physician questionsConsumeristic behaviors: selecting providers by reading and understanding of public reports
MODEL BEHAVIORS STATUS/ATTRIBUTION/ EVALUATION
SCOPE/REACH
SEA_2_Community Checkup
Focuses most heavily on information gathering by providing resources and tools. There also seems to be some guidance for weighing the options. Since the landing page for the website indicates for consumers that they have a role in their health, it could also be focusing on role recognition.
Healthy, consumeristic, health care encounter, and self-management behaviors for consumers trying to stay healthy, find quality information on providers and plans, effectively communicate with their doctors and understand their treatment options, and manage a chronic condition.
Went up around May 2008, and it is still ongoing and continues to add reports and information. It's attributable to AF4Q because it addresses both PR and CE goals around public reporting. The Alliance is able to monitor how many consumers visit the site per month and have noticed that traffic goes up when new data is uploaded.
Target population seems to be general. Internet access is needed for participating in this activity.
ItemInterpretation of Activity Based on Model

Quality Improvement

Patient Outcomes
• Health Status• Equity• Cost
reductions
AF4QGovernance
PM/PRActivities
AF4Q Quality Improvement Domain Logic Model
Rev 11_9_09
Diffusion of QI Activities
• To new providers
• Expansion within providers
Consumer Engagement
Activities
AF4Q QI Infrastructure
(Options)
• QI Inventory and referral system
• Collaboration w/ other organizations
• Sponsorship of QI collaboratives
• Provide QI consulting services
• Contracts w/ other organizations to provide QI services
• Financial assistance
• Disparity reduction
Equity
DATA DATA
External Factors• Regulatory and accreditation
requirements• Other QI initiatives• Market factors etc.
Improvements in Patient
Care
ProviderQI Activities
• Inpatient• Outpatient• Care transitions
AlignmentWith OtherDomains
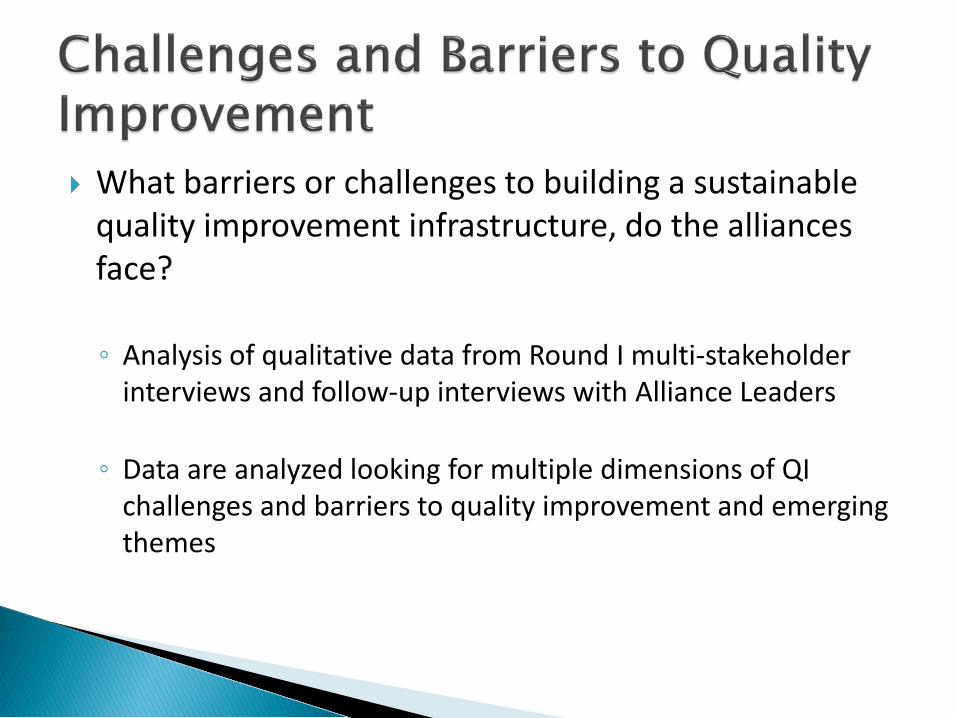
What barriers or challenges to building a sustainable quality improvement infrastructure, do the alliances face?
◦ Analysis of qualitative data from Round I multi-stakeholder interviews and follow-up interviews with Alliance Leaders
◦ Data are analyzed looking for multiple dimensions of QI challenges and barriers to quality improvement and emerging themes

Resources◦ “There’s a learning curve and an appreciation of performance improvement. Some
physicians will say, how am I going to be able to change all of this? What sort of investment am I going to have to make? What is it going to do to my business? My payer mix is of a certain level, so I can’t afford the things that another physician with a better payer mix is providing”
Working with Physician Practices◦ “When you talk about physicians, it is a challenge to figure out how to actually reach
them. You can lead them to water, but how do you get them to read what you printed, or how do you get them to attend the meeting and listen to what you are saying? I think spread is definitely a challenge.”
Alignment◦ “I would say for the most part we have not been able to successfully knit together
the different components of AF4Q. And I think part of it is just the complexity that each of the components represent. And so what we’ve tried to do is make them less complex by taking narrow slices…but that detracts us from bringing the three components back together as a whole.”

Culture◦ “Changing physician behavior is a very difficult undertaking. Largely because of being
trained anywhere from eight to twelve years in a way of thinking, a way of behaving, and you’re trying to counter something that was established a long time ago and was reinforced by the system around it. So I think that people need to undertake this with the understanding that we are not looking at a minor effort to change.”
Geographic Setting◦ “It’s always the difficult [to recruit] small more rural practices… some providers choose to
work in those kinds of environments because they’d rather not be part of a network or learning group. So I think cultural, social, departmental, physical challenges abound.”
Infrastructure, tools, or knowledge◦ “Those [small practices] are frankly just busting their butt trying to get through the day.
Even if they have that inclination [to engage in QI], they don’t have the time, or the expertise, or the skill set to make it happen.”

Performance Measurement & Public Reporting

“At the state level, we’re being approached to talk about new projects and being invited in and consulted...plus the quality of our data is good. But I think the spirit of what we’re doing has really been getting across in the last year.”
“The comparative performance report is really the first thing that will … bring all of this to a head and so we’re trying to tread very carefully and make our processes and our discussions very open and transparent so that people with divergent points of view can come to the table and share them.”
“We have very clear...messages about what we think the data are telling us. Number one, care is good but can be better; number two, performance varies a lot by clinic, that’s our key message that we try to get across. Number three, that it’s better when we measure togetherrather than when the plans measure alone.”
“We struggle with the value of public reporting...We struggled with what was the real value for the broader community as well as physicians…. And now we think we’ve been able to package it in a way that people understand the value.”

Daniel Maeng, Ph.D.Grant Martsolf, R.N. MPH
Dennis Scanlon, Ph.D.

What individual factors are associated with perception of care coordination problem among the chronically ill?
Are there baseline regional differences in terms of care coordination problems among the AF4Q communities compared to the non-AF4Q communities?

Estimated a multivariate logistic regression model Dependent Variable :◦ “In general, do you think that coordination among all of the
different health care professionals that you see is: a major problem, a minor problem, or not a problem at all?”
◦ Collapse “major problem” and “minor problem” into a single category to indicate presence of any coordination problem
◦ 27% in sample reported presence of care coordination problems
Independent Variables◦ Demographics, consumer engagement, complexity of
illness, and healthcare experience◦ 14 AF4Q community fixed effects (the national control
sample is the reference category)

Possible Factors that Affect Care CoordinationDemographic
Gender & AgeRace / Ethnicity Education & Income Employment Status Covered by Private Insurance
Consumer Engagement Patient Activation Measure (PAM 13)
Complexity of IllnessTypes & Number of IllnessLength of Illness Health Status Disabled
Health Care ExperienceProvider Rating Frequency of ER Visits & Hospitalization

More likely to report care coordination problems:◦ Greater number of chronic conditions◦ Worse self-assessed health status ◦ Disabled◦ Those who reside in Humboldt, CA
Less likely to report care coordination problems:◦ Older and more activated◦ Higher provider satisfaction rating◦ Covered by Medicare & Medicaid (relative to private
insurance)◦ Those who reside in Seattle, W. MI, Minnesota (outside of
TC) No significant association:◦ Gender, race, income, education

Disparities & Equity
“I get very dismayed around minority health issues, the huge gap that continues to exist and trying to get our basic leaders to understand that it has to be a clear part of our strategy”
“I think the limitations are really great in number and it’s going to take a significant amount of time and effort to advance a common discussion in the community about…what the direct data collection looks like across all the different organizations …even starting the discussion around what…are going to be the standards around the categories captured.”
“…actually we have had at least one hospital who was aware that the equity collaborative had been rolled out in the other communities and not here…they couldn’t pursue the language collaborative but they wanted to pursue the equity collaborative and really have been kind of chomping at the bit for that to come...”
“I don’t know where you put [the collection of R/E/L] data in the ambulatory practice setting. I mean they’re not set up for it… most of these are small one and two physician practices; very few of them have electronic medical records.”
“…most of the ambulatory practices feel it’s politically incorrect to collect [R/E/L] data.” “I would say in terms of the expanse of Aligning Forces for Quality, the focus on disparities is
probably the trickiest for us because we don’t have a lot of experience in this area…”

• The goal is to track AF4Q race/ethnicity/language data collection and use activities by health plans, hospitals, clinics, and physician practices.
• However, we are also tracking other activities that fall under the overall umbrella of reducing disparities, but are not explicitly related to R/E/L data collection and use. Examples of activities undertaken by AF4Q communities:
– Identifying specific populations (by race/ethnicity/language) and the community based organizations that represent them, or provide services to them, to determine how to link these community resources with the traditional health care system to benefit vulnerable patient populations.
– Focusing activities, such as health fairs, insurance information sessions, interfaith prayer sessions, on the underinsured and uninsured populations.
– Release of public health disparities reports.– Developing a tool for delivering culturally competent care in the state. Elements of the tool
include information about data collection, interpreter services use, culturally competent communication, and engagement of leaders in addressing disparities.
– Partnering with faith-based organizations to address chronic disease management– Obtaining community feedback about health care access issues and the role of race/ethnicity

Alliances have spent considerable time developing their capacity and legitimacy◦ True for both new Alliances and existing
organizations housing the AF4Q projects Most Alliances viewed as a ‘neutral place’ for
assembling the key health care stakeholders Overall vision for the Alliance is clear in most
communities. However, the specific strategies and activities that lead to realizing the vision are still not clear
Performance measurement and reporting has dominated time and resources – quality improvement has received the least attention to date

The value of REL data collection is not fully understood and accepted
AF4Q communities are sharing lessons learned and other key information
A consistent concern is how to take PM/PR, CE and QI activities to ‘scale’ in communities◦ Move beyond pilot programs and initial reports
Significant variation in the breadth and depth of public reports
AF4Q communities seem positioned to impact the local implementation of health reform◦ Though most organizations trying to understand their role
The AF4Q Evaluation team’s website

Research briefs◦ AF4Q Technical Assistance (handout available)◦ Approaches to Data Aggregation◦ Puget Sound’s Community Checkup report◦ Maine’s Blue Ribbon Tiering Program
Peer reviewed journal articles Data reports to sites Presentations in a variety of venues Site snapshots


A project supported by the Robert Wood Johnson Foundation May 12, 2009


Community
Tota
l
Sponsor1 Source of Measures2 Type of Data3
Loca
l
Stat
e
Heal
thPl
an
Nat
iona
l
Uni
que
Clai
ms
Patie
nt
Reco
rd
Patie
nt
Surv
ey
Prov
ider
Su
rvey
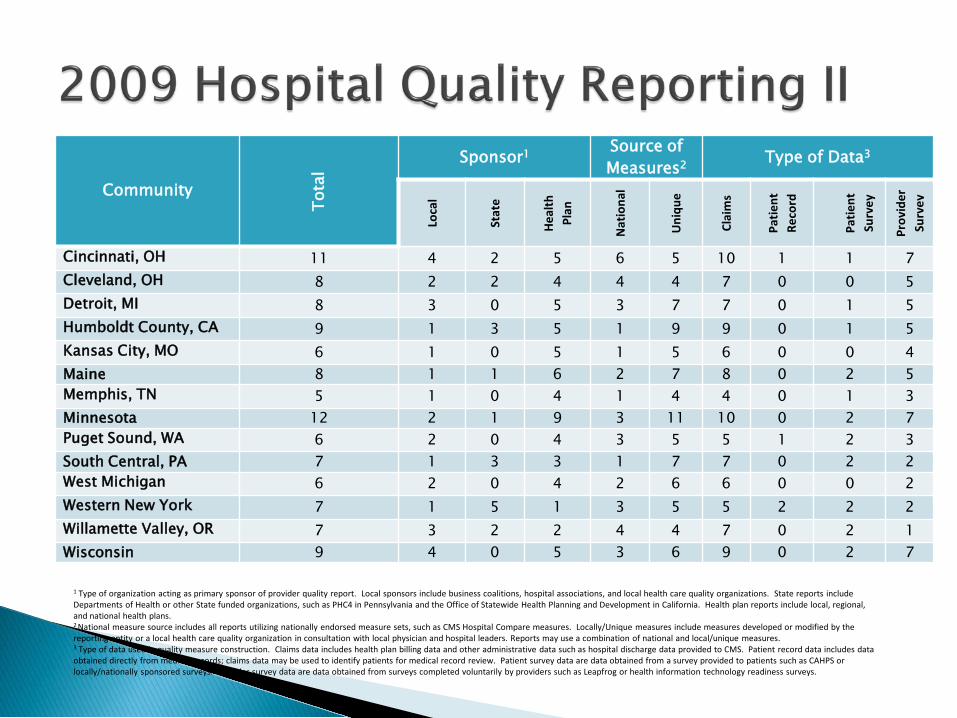
Cincinnati, OH 11 4 2 5 6 5 10 1 1 7Cleveland, OH 8 2 2 4 4 4 7 0 0 5Detroit, MI 8 3 0 5 3 7 7 0 1 5Humboldt County, CA 9 1 3 5 1 9 9 0 1 5Kansas City, MO 6 1 0 5 1 5 6 0 0 4Maine 8 1 1 6 2 7 8 0 2 5Memphis, TN 5 1 0 4 1 4 4 0 1 3Minnesota 12 2 1 9 3 11 10 0 2 7Puget Sound, WA 6 2 0 4 3 5 5 1 2 3South Central, PA 7 1 3 3 1 7 7 0 2 2West Michigan 6 2 0 4 2 6 6 0 0 2Western New York 7 1 5 1 3 5 5 2 2 2Willamette Valley, OR 7 3 2 2 4 4 7 0 2 1Wisconsin 9 4 0 5 3 6 9 0 2 7
1 Type of organization acting as primary sponsor of provider quality report. Local sponsors include business coalitions, hospital associations, and local health care quality organizations. State reports include Departments of Health or other State funded organizations, such as PHC4 in Pennsylvania and the Office of Statewide Health Planning and Development in California. Health plan reports include local, regional, and national health plans.2 National measure source includes all reports utilizing nationally endorsed measure sets, such as CMS Hospital Compare measures. Locally/Unique measures include measures developed or modified by the reporting entity or a local health care quality organization in consultation with local physician and hospital leaders. Reports may use a combination of national and local/unique measures.3 Type of data used in quality measure construction. Claims data includes health plan billing data and other administrative data such as hospital discharge data provided to CMS. Patient record data includes data obtained directly from medical records; claims data may be used to identify patients for medical record review. Patient survey data are data obtained from a survey provided to patients such as CAHPS or locally/nationally sponsored surveys. Provider survey data are data obtained from surveys completed voluntarily by providers such as Leapfrog or health information technology readiness surveys.

Community
Tota
l
Type of Measures1
Care
Pr
oces
s/O
utco
me
Patie
nt
Expe
rienc
e
Cost
Effic
ienc
y
Cincinnati, OH 11 10 0 3 1
Cleveland, OH 8 7 0 3 1Detroit, MI 8 8 1 4 1Humboldt County, CA 9 9 1 3 1Kansas City, MO 6 6 0 2 1Maine 8 8 2 3 1Memphis, TN 5 5 0 1 1Minnesota 12 11 2 5 1Puget Sound, WA 6 5 1 2 1
South Central, PA 7 7 2 2 1
West Michigan 6 6 0 2 1
Western New York 7 7 2 0 1
Willamette Valley, OR 7 5 3 3 1Wisconsin 9 8 3 4 1
1 Types of measures included in provider quality report. Process and outcome measures include care process or outcomes (i.e. lab results) related to inpatient or ambulatory care whether constructed with claims or medical record data. Patient experience measures include measures related to a patient’s satisfaction with care. Cost measures include measures related to the cost of a procedure. Efficiency measures include measures that take into consideration a weighting of cost based on risk or combine quality and cost measures. Efficiency measures are primarily provided by national health plans and combine cost and quality measures.

0%
10%
20%
30%
40%
50%
60%
70%
Percent of practices with EMR

Among practices with an EMR: What proportion of physicians use the following capabilities?
Patient Problems List
Progress Note
DrugInteraction
Alert
Decision Support
Test ResultAlerts
Electronic Rx with
Pharmacy
Cincinnati 88.0 90.4 95.6 86.2 91.3 12.7
Cleveland 88.9 100.0 100.0 100.0 50.0 6.4
Detroit 89.5 88.6 88.9 86.1 81.7 38.7
Humboldt Co. 72.2 76.2 50.0 50.0 66.7 23.1
Kansas City 89.6 89.7 92.9 98.5 100.0 39.4
Maine 94.7 97.1 91.5 90.4 95.7 45.5
Memphis 99.4 100.0 99.2 87.5 100.0 28.1
Minnesota 90.3 91.6 94.2 87.1 100.0 30.4
Puget Sound 95.9 95.6 95.9 92.0 95.9 33.5
SCPA 85.2 92.9 91.4 83.3 90.3 31.7
West Michigan 95.5 95.0 100.0 100.0 90.2 38.4
Western New York 89.8 89.4 87.8 89.3 87.5 31.3
Willamette Valley 96.3 97.0 90.8 85.4 97.4 41.1
Wisconsin 94.6 94.1 95.5 88.8 95.0 27.3
All AF4Q 92.6 93.5 92.5 89.2 92.7 32.8

Patients receiving care coordination from practice-based nurses (% of patients):
Asthma Diabetes CHF Depression
Cincinnati 6.0 9.5 6.8 4.7
Cleveland 6.0 9.3 9.8 6.5
Detroit 5.5 8.9 7.7 4.8
Humboldt Co. 15.4 3.1 7.7 7.7
Kansas City 6.3 10.1 9.9 5.4
Maine 9.2 20.1 11.4 11.2
Memphis 8.2 13.5 9.1 5.9
Minnesota 4.1 9.5 6.6 5.4
Puget Sound 8.6 17.6 8.0 7.4
SCPA 3.2 6.6 7.1 5.1
West Michigan 4.5 12.1 6.3 7.4
Western New York 5.8 9.6 8.0 4.9
Willamette Valley 11.2 6.8 4.6 3.3
Wisconsin 3.3 16.1 5.7 2.2
All AF4Q 5.8 12.3 7.7 5.7

Focus on both ‘intermediate’ and ‘longer term’ program outcomes◦ A realistic assessment of the time dimension is key
Capture the ambition of the AF4Q program as well as its changes over time◦ Recognize the significant temporal changes impacting
the nation and states (e.g., MA) Incorporate comparisons to non-AF4Q communities where
possible◦ No “perfect” controls at the community level, but choices
based on geography, population and health market characteristics, and activity such as CVE status
Include both quantitative and qualitative data to capture the richness of the AF4Q program

Tracking◦ Systematic tracking of Alliance activities and relevant health
information and activities in the Alliances’ communities e.g., availability of public reports, CE activities and state policy
proposals Surveys◦ Consumer survey◦ Physician survey◦ Alliance Survey
Secondary Data◦ Dartmouth Atlas◦ H-CAHPS◦ Area Resource File◦ Others

Albany, NY Colorado Kings County, CA Lehigh County, PA Nashville, TN New Hampshire Pittsburgh, PA