Embed Size (px)
Citation preview

What is Density
It is log of opacity
Densitometry is not for spot colors it is only for
process colors.
For spot colors Dyestrength should be measured in integrated wavelength form

Why Density measurement
Process colors are transparent
Correct amount of ink quantity is
required to print cast free picture.
Picture in halftone form can not be
measure, so measurement is done
on patches
As IFT increases it become opaque
So Density help to control correct
IFT which governs quality of picture

Why logarithmic Scale
Measurement has more linear relationship to IFT
It correlates better with visual perception of lightness difference.
It provides increased measurement sensitivity for small reflectance difference

Type of Densities
Optical Density- Density measurement done by filter technique
Colorimetric Density – Conversion of tristimulus
values in to densities.

Colorimetric Density
It is conversion of tristimulus values in
density
it is used in spot color formulation when new
recipe is calculated
Dominant density is matched with recipe

Type of Densitometry
Reflection- Reflected light from object is
measured for density calculation
Transmission – Transmitted light is measured
for density calculation

Type of Instruments
Filter instruments- Instruments those are
using filter technique for measurement
Spectral instruments – Instruments those are
using diffraction grating technique & obtain
reflectance data

Light Source
For reflection ISO density the relative spectral
power distribution of flux incident on
specimen surface should confirmed to CIE
illuminant A ( corresponding to distribution
temperature of 2856 K) In practice
instruments, used to measure reflection ISO
density, the relative spectral power
distribution of the flux incident on specimen
surface shall confirmed to distribution temp of
2856 K +/- 100 K


Density calculation
Note- same formula for both transition & reflection density but
different efflux spectrum

Spectral weighing functions/status Status T data for Filter & spectral instruments

Sampling condition
The density of some material, changes with
variation in temp. & relative humidity
therefore to avoid ambiguity such materials
should be at 23 +/- 2 0C & 50 +/- 5% relative
humidity

Wet & dry density
The surface of wet & dry ink film reflect light differently.
It is found that after drying density drop down called dryback, so controlling density on press is difficult.
Polarization filter is used to solve this dryback problem.

Polarization Filter

Working of pol. filter
Emitted light passes through first pol. filter and oscillate in one plane
Wet ink is having plane surface & when it dry it takes shape of paper surface.
Polarized light when reflect from upper layer of ink it remains polarized but light which reflects from paper surface looses its polarization
Nonpolarized light passes through 2nd pol filter but polarized light reflected from ink surface remains polarized and stopped by second filter.
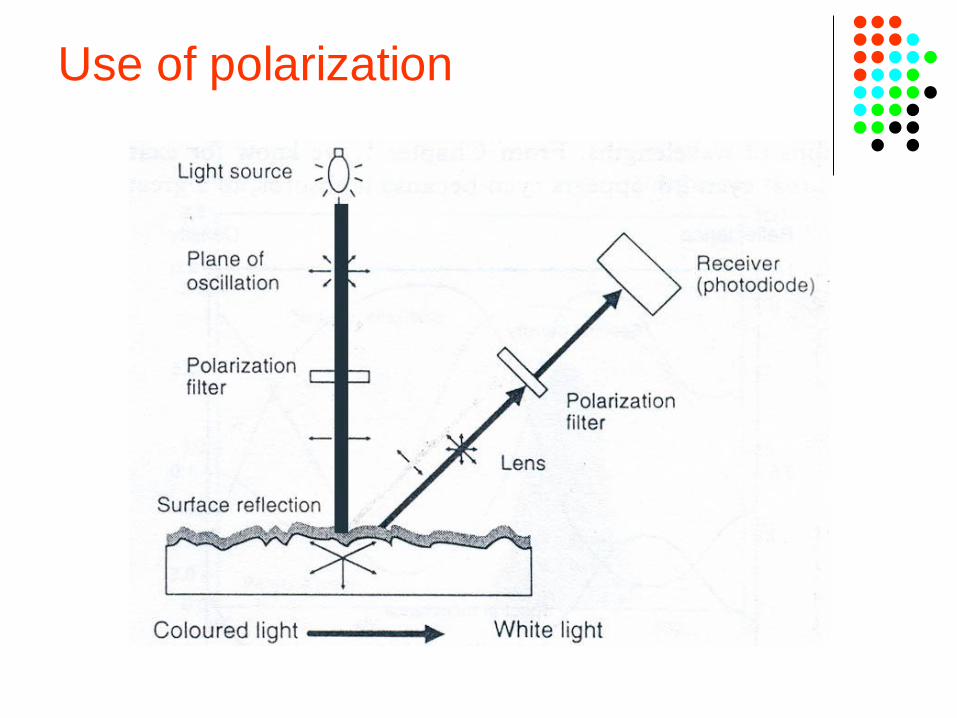
Use of polarization

Substrate Consideration
Relative Density- It is subtracting a paper while measuring density. First instrument is zeroed to paper. By zeroing on paper we more closely match the situation, when we observe a printed reproduction, where base paper is our visible reference.
Status E & polarization filter is used
Absolute Density- Paper density is not subtracted from ink density. If we are printing large area of color, which obliterates the view of paper surface , then it is particularly true if intension is to achieve similar visual appearance on different papers
status T without pol. filter measurement is done.

Reference standards
Absolute reference standard – The reference
std. d\for determining ISO reflection density shall
be an Ideal perfectly reflecting and perfectly
diffusing material. Any working standard used
shall not contain fluorescent additives or be
intrinsically fluorescent as this fluorescence will
corrupt both the scaling of reflectance and the
determination of the absolute zero level of ISO
density
Reference standards
Relative density reference standards- When
instrument is zeroed that time density of
reference should be stated.
Mentioning the density of paper don’t
represent paper completely for that
whiteness, brightness, yellowness, & tint
values must be mentioned along with color
values, gsm & backing material

Effect of OBAs
Optical brightening agents used in paper causes fluorescence effect in measurement, generally the
effect is on cyan color. Which may cause unwanted
blue or yellow cast
Xrite iSis is only profile maker having UV filter
Problem of OBAs can be solved either by choosing
proofing paper with no OBAs or by eliminating UV light during measurement.

Densitometric Status
ISO 5-3 defines various status response This concept is from selecting a set of filters for color selection
T, A, E, Ax, Tx, Ex, I HIFI, DIN, DIN NB, SPI
Status T / ANSI T: wide band color reflection densitometer response, used mainly in United States
Status E / DIN 16536 : wide band color reflection densitometer response, used mainly in Europe, main difference to Status T: higher values for yellow as blue blue filter is having less bandwidth.
Status A / ANSI A: wide band color reflection and transmission
densitometer response, used mainly in the photographic industry to measure positive prints. This response, like the Status T response, is found in both transmission and reflection densitometers.

Status M: wide band color transmission densitometer response, used in the photographic industry for measurements of negatives.
Status I / SPI, DIN NB: Status I density is applicable to the evaluation of graphic arts materials such as process ink on paper. It is a special case of the narrow-band densitometry defined in ISO 5-3 with spectral bandwidth and sideband rejection as defined in that document, and peak wavelengths as follows.
blue: 430 nm (± 5 nm)
green: 535 nm (± 5 nm)
red: 625 nm (± 5 nm
Status Ax, Ex, Tx: Old, classic densitometers use filters made out of glass or gelatin . The new generations of densitometers are spectrally based. This means, that modern devices measure a spectral curve and use exact mathematical filters to calculate the density. Contradictory to this the responses of classic
densitometers have slight deviations compared to the responses defined by ANSI/DIN/ISO, because the accuracy in manufacturing glass or gelatin filters is limited. It is knows about the differences between the old and the new spectrally based . For those users, who have to use both series manufacturer provide the Ax/Ex/Tx response to get density values out of a new Series instrument, which correspond with the densities of the old Series.

Densitometric Functions
Dot area
Dot Gain
Trapping
Hue error & Grayness
Print Contrast
Vivacity or color contrast
Grey balance

Why measure dot
Most of details in halftone picture is carried in tinted area
In process color printing, balance of dot gain
between CMYK is critical for gray balance & for
maintaining critical overprint colors.
Controlling tonal values is important.

Dot Area
Optical dot assessment- Due to scattering of
light around circumference of dot, it appeare to
be increased
Physical dot assessment- Due to mechanical
pressure & porosity of paper ink spreads it
contribute in increase in dot area.

Murray-Davies equation
Apparent dot area is % of dot area, as
measured & calculated
with a graphic art densitometer, using
Murray-Davies equation

Yule-Nielson equation
It is modification of Murray/Davies
equation where an
imperially determined factor “n” is included
to calculate physical dot area

“n” factor
It is not used to measure dot area on printed
paper only used to measure dot area on
plate, but now a days separate plate readers
are available.
50 % Dot is selected from whole scale by
microscopic measurement & n factor is
added in such a way that it shows 50%

Why densitometers don’t work on plate?
Plate surface is rough then random proportion of light get in to sensor which has noise, so it is
effectively impossible to obtained trustworthy
results.

DotMeter
It works on the principle of combination of CCD camera with microscope.
Camera takes a snap shop of area being
measured & counts a black & white pixels in image.
Rather than taking a average of dot density (as
like densitometer) DotMeter measure image area & provide absolute value of dot coverage.

Contraction of DotMeter
25 mm glass disc is used to redirect received light.
Depth of focus is less than 0.2mm for camera.
Exposure level is set on white & black levels.
Can be used between 85 to 215 lpi
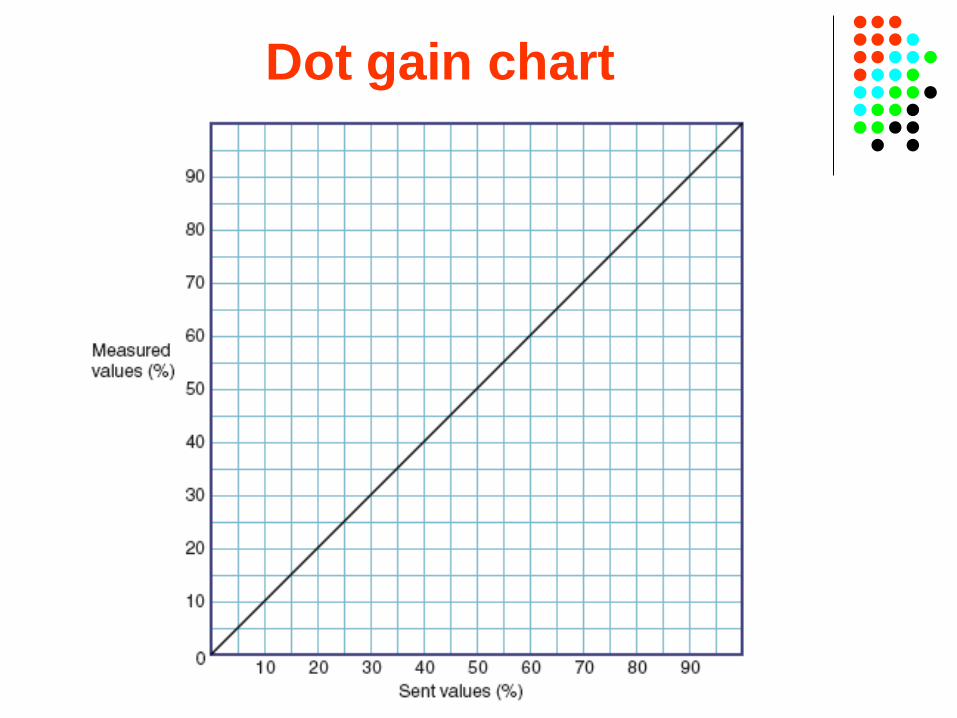
Dot gain chart

Trapping
Trap is an indication of ability or inability of printing ink to accept the next ink printed compared to how well paper accept that ink
Following are main equations –
Preucil Trap- ( Apparent trap)
Bruner trap
Newsprint trap- (Hamilton trap)

Preucil trap
It is ratio of difference between density of overprint and density of
first down ink to density of second
down ink. Where all densities are
measured with complementary color
filter of second down ink

Bruner trap
Calculate trapping as apparent dot area of second color over the first as if second color were printed as
a tint instead of solid

Hamilton trap

Hamilton trap
News print formula accounts for some of missing density arising from additivity failure of densities when overprinted.
Here two factors contribute to additivity failure are : reduced ink trap where second down ink doesn’t transfer as effectively to ink on paper as it does to paper alone, & factors like first surface reflectance & internal scattering properties of printed surface.

Hue error
Hue error doesn't indicate an error or problem but rather the variation from theoretically perfect or ideal
cyan, magenta & yellow colors

Direction of Hue error
Direction of error is determined by
which filter gave the
second lowest density, so direction
is towards that color.

Grayness
Grayness is characteristic of relative achromatic content of colorants used as process colors
Hue doesn't changes by change in grayness indices
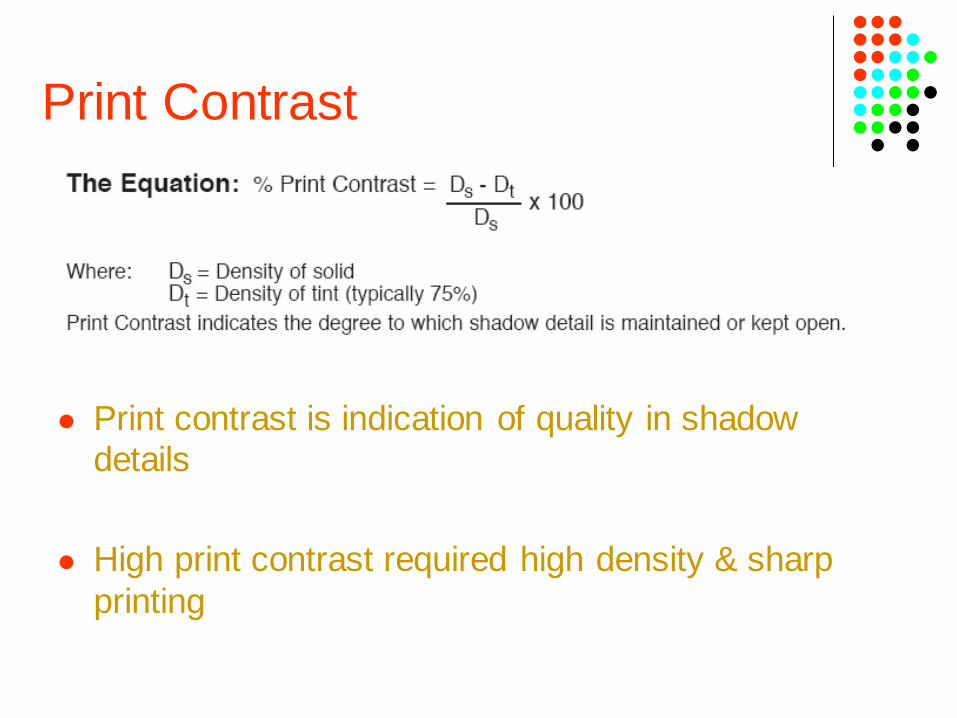
Print Contrast
Print contrast is indication of quality in shadow details
High print contrast required high density & sharp
printing

Vivacity or color contrast
It is property of process colors determined by applying
formula to density measurement
This formula can be used either to compare the relative
characteristics of process color ink as a criteria to
determine IFT for given ink, higher vivacity higher gamut.
Vivacity. is poor at low IFT & increases to reach a peak
before declining as IFT increases.
Vivacity (%) = (10-Dl) –(10-Dh) x 100 Dl – is lowest density value Dh- is highest density value

Use of color contrast
With respect to graph at
higher density vivacity
reduces means gamut
reduces, so to achieve
wider gamut it is
necessary to have higher
vivacity
Maximum vivacity is
giving you correct
density.

Backing material
Paper is not 100% opaque.
Some of light following on it is getting transmitted through paper & get reflected from its back material.
That contaminated light is contributed in
measurement readings.
So readings are taken by light reflected from paper
+ Backing material.

Type of Backing Material
Self Backing- Same substrate is used as
backing material generally done in news paper
White backing- White ceramic tile or plate of
MgO or barium sulphate is used
Black backing- Black matt surface sheet of
density more than 1.5 is used

Aperture Size of instrument

Instruments
Manual densitometers
Auto tracking
Densitometers

On Press
Use only instruments from same model
Use same settings always
While mentioning density, mention settings
Different standards are available from different institute,
but derive your own
Don’t stick to numbers, look at productivity
All densitometric standards will get revise after 2009

Different Standards
FIPP- Federation of Periodical Press
UKONS- UK Offset Newspaper Specifications
SWOP- Spe. For Web Offset Publications
SNAP- Non-Heat Advertising Printing
INCQC- IFRA
PIRA- PIRA consulting
FOGRA- The German Research Association for Printing & Reproduction.
ISO 12647-2/3/4/5