Embed Size (px)
Citation preview
448
STERLING D. MILLERl and WARREN B. BALLARD2
'Alaska Department of Fish and Game, 333 Raspberry Rd., Anchorage, Alaska 995022Alaska Department of Fish and Game, P.O. Box 47, Glennallen, Alaska 99588
Study Area and MethodsThe bear removal area encompassed 3,436 km2 cen'
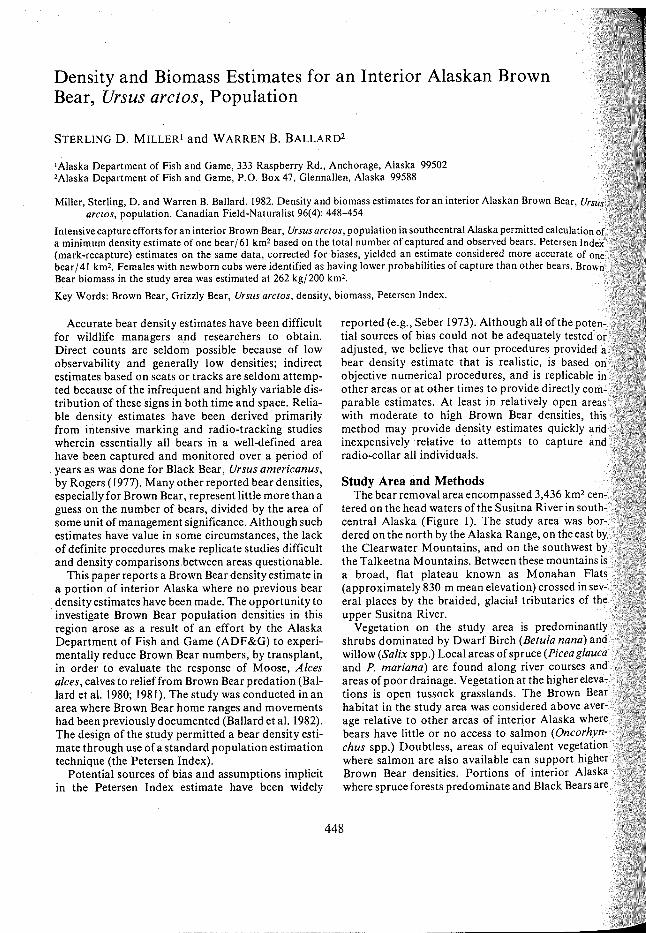
tered on the head waters of the Susitna River in south'central Alaska (Figure I). The study area was bordered on the north by the Alaska Range, on the east bythe Clearwater Mountains, and on the southwest bythe Talkeetna Mountains. Between these mountains isa broad, flat plateau known as Monahan Flats(approximately 830 m mean elevation) crossed in several places by the braided, glacial tributaries of theupper Susitna River.
Vegetation on the study area is predominantlyshrubs dominated by Dwarf Birch (Betula nana) andwillow (Salix spp.) Local areas of spruce (Picea glaucaand P. mariana) are found along river courses andareas of poor drainage. Vegetation at the higher elevations is open tussock grasslands. The Brown Bearhabitat in the study area was considered above average relative to other areas of interior Alaska wherebears have little or no access to salmon (Oncorhynchus spp.) Doubtless, areas of equivalent vegetationwhere salmon are also available can support higherBrown Bear densities. Portions of interior Alaskawhere spruce forests predominate and Black Bears
reported (e.g., Seber 1973). Although all of the poten..tial sources of bias could not be adequately tested Oradjusted, we believe that our procedures provided abear density estimate that is realistic, is based onobjective numerical procedures, and is replicable illother areas or at other times to provide directly comlparable estimates. At least in relatively open areaswith moderate to high Brown Bear densities, thismethod may provide density estimates quickly andinexpensively relative to attempts to capture andradio-collar all individuals.
Density and Biomass Estimates for an Interior Alaskan BrownBear, Ursus arctos, Population
Accurate bear density estimates have been difficultfor wildlife managers and researchers to obtain.Direct counts are seldom possible because of lowobservability and generally low densities; indirectestimates based on scats or tracks are seldom attempted because of the infrequent and highly variable distribution of these signs in both.time and space. Reliable density estimates have been derived primarilyfrom intensive marking and radio-tracking studieswherein essentially all bears in a well-defined areahave been captured and monitored over a period ofyears as was done for Black Bear, Ursus americanus,by Rogers (1977). Many other reported bear densities,especially for Brown Bear, represent little more than aguess on the number of bears, divided by the area ofsome unit of management significance. Although suchestimates have value in some circumstances, the lackof definite procedures make replicate studies difficultand density comparisons.between areas questionable.
This paper reports a Brown Bear density estimate ina portion of interior Alaska where no previous beardensity estimates have been made. The opportunity toinvestigate Brown Bear population densities in thisregion arose as a result of an effort by the AlaskaDepartment of Fish and Game (ADF&G) to experimentally reduce Brown Bear numbers, by transplant,in order to evaluate the response of Moose, Alcesalces, calves to relief from Brown Bear predation (Ballard et al. 1980; 1981). The study was conducted in anarea where Brown Bear home ranges and movementshad been previously documented (Ballard et al. 1982).The design of the study permitted a bear density estimate through use ofa standard population estimationtechnique (the Petersen Index).
Potential sources of bias and assumptions implicitin the Petersen Index estimate have been widely
Miller, Sterling, D. and Warren B. Ballard. 1982. Density and biomass estimates for an interior Alaskan Brown Bear,arc/os, population. Canadian Field-Naturalist 96(4): 448-454
Intensive capture efforts for an interior Brown Bear, Ursus arc/os, population in southcentral Alaska permitted calculation ofa minimum density estimate of one bear/ 61 km2based on the total number of captured and observed bears. Petersen Index(mark-recapture) estimates on the same data, corrected for biases, yielded an estimate considered more accurate of onebear/41 km2. Females with newborn cubs were identified as having lower probabilities of capture than other bears. BrowBear biomass in the study area was estimated at 262 kg/200 km2.
Key Words: Brown Bear, Grizzly Bear, Ursus arc/os, density, biomass, Petersen Index.
MILLER AND BALLARD: DENSITY AND BIOMASS ESTIMATES FOR BROWN BEARS 449
30'"j
I\'11\ ....• ('l
('So.~'.0I~• "t-\.. 'So
(~\.. ~
\. "..l..\ }.-..... -. ·/"·'~pax.on
'-"_.-..J .HIGHWAY I
\.I
"
oHORTH
.I
~I"~~
'010I
RANGE
exited these dens between 9 April and 12 May, andthen moved to the lowland habitats in the center of thestudy area. Because these observations suggested thatmost bears should occur in the central portion of theexperimental area during the capture period andbecause search efforts were most efficient in this portion because of the relatively flat terrain, search effortswere concentrated in the central portion of the studyarea although the mountainous terrain on theperiphery was also searched.
Some bears were located at MOQse kill sites, including kills of radio-collared Moose calves equipped withmortality-sensor radio collars (Ballard et al. 1979;1980; 1981). Of the bears captured the preceding year(1978), only two retained functioning radio collars;both of these animals were radio-tracked and recaptured on the first day of the removal effort.
Twelve Brown Bears marked in 1978 inhabited the1979 study area; these served as the basis for adjustedPetersen Index estimates of population size. Markrecapture calculations were made separately for eachsex and included all bears older than 3.0 y in 1979.This age restriction was used because no yearlingswere marked in 1978, so no marked 2.5 y-old bearscould have been present in 1979. The probability of
10 , 0~
~
\'\
IiI
./Cantwell,,"\. /--._
.,..'
TALKEETNA MOUNTAINS
.rI
-l. •~~/
0'~>/.j!':'
",":J !~/
~'f'/
./
FIGURE I. The study area in southcentral Alaska where density and biomass estimates were made following intensiveexperimental removal, by transplant, of Brown Bears.
also resident, probably support lower Brown Beardensities. The study area is accessible to hunters usinghighway vehicles, boats and aircraft.
Bears were located by two fixed-wing aircraft(Piper Super Cub PA-18), each with a pilot andobserver. Once lo.cated, bears were darted from ahelicopter (Bell 206B) and removed from the area as
.described by Miller and Ballard (1982). Fates oftransplanted. bears were described elsewhere (Millerand Ballard 1982).
Ages of adult bears were estimated based on sections of the first premolar using methods described byMundy and Fuller (1964); ages of cubs and yearlingswere estimated by size and tooth replacement.Weights were obtained using a hand-held spring scalewith a capacity of 91 kg or with a spring scale with acapacity of 680 kg.
Forty-seven bears were captured from 22 May to 7June 1979. Additional efforts on 21-22 June resultedin the capture of one additional bear and the recaptureof one returned bear. All observed bears were captured, except for one unmarked individual. Previousradio-tracking studies (Ballard et al. 1982 and unpublished data) indicated that bears denned in the mountainous terrain on the periphery of the study area,

THE CANADIAN FIELD-NATURALIST450
capture of 2.5 y-old bears in 1978 was assumed equivalent to that of 3.5 y-old bears in 1979, therefore itwas not necessary to correct for recruitment into the1979 sample of bears 3.0 y or older. Search areas wereessentially the same in 1978 and 1979.
The Chi-square test statistic was used to comparesubpopulations on the basis of sex ratio. The equationused in Petersen estimate calculations was (Ricker1975):
N= (M+ I)(C+ I)
(R + I)
In this equation: M = number marked in 1978,C =number captured in 1979, and R =number ofrecaptured bears in 1979.
Results and DiscussionThe number of captures/ day ranged from 0 to 8 (0-4
for adult bears). Daily capture rates for the 17-daycontinuous removal effort were highest in the first 6days (4.5 bears/ day), lowest in the middle 5 days (0.8bears/ day), and intermediate in the last 6 days (2.7bears/ day). This pattern of capture probably resultedfrom normal seasonal movements of Brown Bearsfrom high elevation den sites on the periphery of thestudy area to the relatively flat central portio~ wheresearch efforts were concentrated.
The possibility that this pattern of capture resultedfrom immigration into the study area was rejected onthe basis of analyses of sex and age composition asrelated to time or location of capture. For this purposea periphery zone was defined as the area within oneaverage home range radius inside of the search area,15.7 km for males and 11.5 km for females (Miller andBallard 1982).
Sex ratios of captured bears were not different inthree groupings of consecutive time periods (six 3-dayintervals, three 6-day intervals, and two 9-day intervals) (P > 0.30). The sex ratio in the center of the areathroughout the capture period was skewed in favor ofmales (8:7); this was not different from the sex ratio inperipheral areas during the last half of the removalperiod (3:2 in favor of males) (P > 0.2).
A similar lack of evidence for immigration existed inage ratio data. The seven males captured in the last halfof the capture period were younger (x = 5.8 y) than the12 males captured in the first half (x =7.6 y), however,excluding one exceptionally old bear (21.5 y) no differences in mean male ages were apparent (5.8 y and 6.2 y,respectively). No differences were apparent in the meanage ofeight females captured early (x =7.1 y) relative toseven captured later (x = 7.6 y).
Significant immigration was also consideredunlikely because the surrounding mountains on threesides of the study area would have limited the ability
of bears living in adjacent areas to perceive thevacuum of bears being created in the study area duringthe bear removal period. Moose calves were availablein equivalent densities in adjacent drainages so therewas no reason to suspect that bears living in thesedrainages would be seasonally attracted to the studyarea in order to prey on Moose calves.
These analyses provide no reason to reject theassumption that the bear population in the study areawas "closed" (Seber 1973) with respect to immigrationor emigration. Rigorous examination of this assumption would be less necessary under experimentaldesigns where captured bears were not being removedfrom the population.
Minimum Population EstimateThe number of bears actually captured was 48. In
addition, eight bears were known to have been missedin the removal effort (two of unknown sex which wereobserved in June and July, two others observed inAugust, and four marked bears from 1978 which werenot recaptured in 1979, two males and two females).These bears were individually identified on the basisof pelage, size, and the absence of ear flags or othermarks. Therefore, the study area population contained a minimum of 56 bears. This number appearedto be a reasonable minimum estimate, as some bearswhich were missed in the capture effort were doubtlessalso missed during subsequent monitoring flights.Furthermore, the rate at which bears Were being captured in the last days of the removal effort clearlyindicated that not all bears had been captured.
Mark-Recapture Population EstimatesSeven male bears were captured and marked in the
study area in spring 1978 (Ballard et al. 1982). Ofthese, all were recaptured in spring 1979 except fortwo, both 3.5 y-old in 1978. Both of these bears werelikely in the study areas in 1979, as each was verified inor near the experimental area in 1980. One had afunctioning radio collar in 1978 and was relocated 15times in the center of the removal area that year. Onthis basis it was concluded that both of the previouslymarked males not found in 1979 were present. One ofthe 1978 captured males still had a functioning radiocollar in 1979. This bear was, correspondingly, easilytracked and captured in 1979 and therefore wasexcluded' from Petersen Index calculations ascapture-prone.
Five female bears were captured and marked in thestudy area in spring 1978 (Ballard et al. 1982); three ofthese were recaptured in spring 1979. One of therecaptured females still had a functioning radio collarand was excluded from Petersen estimate calculations. The two females not recaptured in 1979 were10.5 and 4.5 y-old in 1978, both were in estrus when
S1
IbPe
1

MILLER AND BALLARD: DENSITY AND .BIOMASS ESTIMATES FOR BROWN BEARS
TABLE I. A summary of Brown Bear population and density estimates, upper Susitna River, Alaska.
* Includes one capture-prone bear that was excluded from mark-recapture calculations.**The four adult bears of unknown sex not captured were assigned as two males and two females.
451
6041
2433572683
"Corrected"Petersenestimate
70
24 (9-96)25 (8-280)49 (23-136)
UncorrectedPetersen
estimate (95% CI)
21**19**401656
8661
1. In both 1978 and 1979 only one female with newborn cubs was encountered, although females withyearlings were relatively numerous in 1978 (1 withcubs: 5 with yearlings,) 1979 (1 :7), and 1980 (0:2).This suggests that the low capture rates of femaleswith newborn cubs were not likely due to lowreproductive rates.
2. The two females marked in the study area in 1978that were not recaptured in 1979 both likely hadcubs in 1979. Both were in estrus when originallycaptured in 1978 and were subsequently seen eithercopulating with or in the company of another bearin that year.
Females with newborn cubs have been reported toremain in the vicinity of their den sites longer thanother bears (Glenn and Miller 1980; Craighead andCraighead 1972). On the Alaska Peninsula, femaleswith newborn cubs were seldom captured in the springbecause they tended to remain in mountainous terrainand near protective cover (Glenn and Miller 1980).The 1978 female accompanied by three newborn cubs,in an adjacent study area, tended to remain in thicklyvegetated habitats and, consequently, was less frequently observed than other radio-collared bears (Ballard et al. 1982).
In recognition of this apparent capture bias, thePetersen recapture estimate was adjusted upwards forthe female segment to correct for the escape offemaleswith newborn cubs. A conservative adjustment wasderived by assuming that the number of females withnewborn cubs was equal to the number of capturedfemales with yearlings (7). This adjustment increasedthe female estimate to 33 bears older than 3.0 y (Table2), but is still probably conservative because it isunlikely that all females with yearlings were captured.Probable females with newborn cubs were used bothin the Petersen estimate and in the correction to thisestimate.
Sex ratio of captured bears older than 3.0 y was 113
Captured plusknown missed bears
17*15*321648
10772
No. of captures
Corrections to Mark-Recapture EstimatesThe mark-recapture estimates were based on the
assumption that the probabilities of capture wereequal and remained constant through both 1978 and1979 capture efforts. This assumption may be incorrect for females, as there were indications that femaleswith newborn cubs had lower capture probabilities.Only two females with newborn cubs were locatedduring capture efforts conducted during 1978, 1979,and 1980 in the study area and adjacent areas. One ofthese females was capture-prone in 1979 because ofher functioning radio collar. The other, from a nearbystudy area, was captured with three newborn cubs in1978. The following evidence indicates lower probabilities of capture of females with newborn cubs compared to other bears using the capture techniquesemployed in this study:
1982
captured in 1978 and therefore likely had newborncubs in 1979. Both had functioning radio collars in1978 and were well-documented study area residentsin that year. Therefore, they were assumed presentduring the 1979 intensive capture effort. The youngerofthe two missed females was subsequently shot in thestudy area in the fall of 1982.
Excluding the bears with functioning radio-collarsdescribed above, adjusted mark-recapture calculations (Ricker 1975) were made for each sex using thetotal number of bears aged 3.0 years or older capturedin 1979 (16 males and 14 females) and the recapturesof bears marked in 1978 (4 of 6 males and 2 of 4females). This process yielded population estimates of24 males and 25 females older than 3.0 years (Table 1).By lumping sexes, Petersen Index calculations independently provided an estimate of49 bears older than3.0 years (Table I). Because of the low numbers ofmarked individuals, the numerical confidence intervals (Ricker 1975) for these estimates were large(Table 1).
BEAR POPULATIONMales (3.0 y+)Females (3.0 y+)Both Sexes(3.0 y+)Offspring (0.5-2.5 y)All Bears
BEAR DENSITY (km2/bear)Both Sexes (3.0 y+)All Bears
48. Innissedhved inh werenales).e basis: other11 conpeared~ bearsubtlessflights.19 capclearly
I in the~2). Ofept forrs were'ified inhad a
ated 15~ar. OnviouslyOne ()g radir, easilIre waDns a

TABLE 2. Reported brown bear densities in North America.
*Data refer to a 1800 mi2 intensively studied area of thecentral Alaska Peninsula.
**Estimated density, minimum was 1/18 km2•
*** I/ 288 km2 is mean density for the whole of the NationalPetroleum Reserve, Alaska, the range represents valuesfor different habitat types in this reserve where the highest density occurred in an intensively studied experimental area (Reynolds, personal communication).
**** Highest density (1/148 km2) was in an intensivelystudied area of relatively high quality habitat, regionwide density was estimated at 1/260 km2•
1560 km2 (overlaps counted only once). A simple proportional extrapolation to the experimental areayielded an estimate of 15 bears aged 3.0 y or older.This figure must be corrected for the presence ofunmarked bears. Of the 32 adult bears caught in 1979only 8 (25%) were marked. If it is assumed that th~above estimate of 15 bears represents the same proportion of the total population, then by simpleextrapolation the population of bears older than 3.0 ywould be 60. This figure is only slightly larger than the"corrected" Petersen Index estimate (Table I) andadds credence to this estimate.
The "corrected" Petersen Index density estimatewas compared to Brown Bear density estimates elsewhere in North America (Table 2). The estimateddensity fell about where subjectively expected, lowerthan in portions of Alaska where Brown Bears haveaccess to salmon, lower than in more southern areaswith more productive habitats, but higher than in theAlaskan Brooks Range (Table 2).
Biomass EstimationDensity estimates provide a measure of comparison
between different geographic areas within a species'range. Biomass is a more meaningful comparison interms of relative habitat capacities, because it corn-
Reynolds 1980
Source
Reynolds 1976
Mundy and Flook1973Pearson 1975
Troyer and Hensel1964Unpublished data(Glenn, personalcommunication)*Martinka 1974
This study
Kodiak Island, AK
Location
Alaska Peninsula,AK
1.6
km2/bear
16
23-27
21
28**
Glacier NationalPark, MontanaGlacier NationalPark, B.C.SW YukonTerritoryUpper SusitnaRiver, AK
288(42-780)*** Western BrooksRange, AKEastern BrooksRange, AK
148-260****
41
THE CANADIAN FIELD-NATURALIST452
males: 100 females. In exploited bear populationshunters tend to selectively harvest males because: (1)males range greater distances, (2) females accompanied by offspring are legally protected, and (3) hunters
'tend to select large bears. With this hunter biastowards males, a population with a sex ratio skewedtowards females would be expected (Bunnell and Tait1981). Harvest data from Alaska's Game Management Unit 13, which includes the study area, indicatethat males represented 52% of the kill of bears olderthan 3.0 y in the period 1970-1979. The "corrected"mark-recapture estimate has a sex ratio (bears olderthan 3.0 y). of 73 males: 100 females, this sex ratiomore closely corresponds with the model proposed byBunnell and Tait (1981) than does the observed sexratio of captured bears.
Estimates of number of newborn cubs required similar adjustments. Seven females accompanied by 12yearlings were captured in 1979 yielding an averagelitter size of 1.7 yearlings/ females with yearlings. Theassumption that there were at least as many newborncubs present as yearlings captured, provided a conservative correction for newborn cubs (Table I). This wasconservative because a high rate of cub mortalitylikely occurs (Glenn et aI. 1976) and because allfemales with yearlings were probably not captured.
With these adjustments to the female and cubclasses, the "corrected" Petersen Index populationestimate was 83 bears; of these, 57 were bears 3.0 y orolder (Table I).
Population Density EstimatesTo arrive at density estimates using the above popu
lation estimates, the area occupied by the removedbears must be determined. Some of the bears capturedhad portions of their 1978 home ranges outside of thesearch area, suggesting that the total area from whichbears were removed was larger than the area searched.However, it appeared reasonable to assume that foreach such bear captured, another bear which was onlypartially resident in the search area was not captured.Assuming that bears with home ranges that are notcompletely included within the search area have aprobability (P) of being captured (where [P] is equivalent to the proportion of their home ranges which iswithin the search area) and a probability of beingmissed of (1-P), it is reasonable to use just the searchdata area in making density estimates. Making thisassumption, and using the search area (3436 km2)
combined with the above estimates of the bear population gave bear density estimates (Table I) for each ofthe above population estimates.
The accuracy of the "corrected" mark-recapturedensity estimate was supported by 1978 home-rangedata in the study area (Ballard et aI. 1982). The totalarea occupied by seven bears (older than 3.0 y) was

TABLE 3. Measured weights (kg) of spring-captured Brown Bears by sex and age, southcentral Alaska.
Age Males Females Both Sexes
(Years) n x S.D. Range n x S.D. Range n x S.D. Range
0.5 3 5.0 - I 5 - 4 5.01.5 10 38.2 14.4 21-63 4 34.7 11.6 21-45 14 37.2 13.3 21-632.5 6 89.9 30.0 61-140 3 80.0 13.3 70-95 9 86.6 25.1 61-1403.5 5 113.3 19.3 93-139 4 81.5 10.7 74-974.5 7 133.4 25.7 100-181 5 88.6 12.8 72-1015.5 3 181.3 61.1 115-236 4 118.9 19.0 106-1476.0+ 16 255.9 20.4 217-289 12 120.6 23.4 86-1453.0+ 31 198.0 68.0 93-289 25 107.6 25.2 72-147
MILLER AND BALLARD: DENSITY AND BIOMASS ESTIMATES FOR BROWN BEARS1982
bines density estimates with information on the size ofindividuals in the population. This parameter hasbeen infrequently reported in the bear literaturealthough, commonly, data are available to calculatebiomass.
Measured weights were available from 88 BrownBears captured from 1978-1980 in the study area andadjacent areas (Table 3). All bears were captured inthe spring (April-June). For each sex, the densityestimate lumped bears 3.0 y or older. Therefore, it wasnecessary to calculate average weights in the same agecategories (Table 3). Similarly, sexes were lumped inthe calculation of average weights of cubs, yearlings,and 2 y-old bears (Table 3).
Combining these weights with the "corrected"mark-recapture density estimate (Table 2) yielded aBrown Bear biomass estimate of 262 kg/ 100 km2
(1,500 Ibs/ 100 mi2).
AcknowledgmentsFinancial support for this study was provided by
the Game Division, Alaska Department of Fish andGame (ADF&G). Comparison data reported for 1978was supported by Alaska Federal Aid in Wildlife Restorations Project W-17-R while 1980 studies werefinanced by the Alaska Power Authority.
We gratefully acknowledge the assistance of manyemployees of the Game Division (ADF&G) in capturing and transplanting Brown Bears, data reductionand tooth sectioning. K. Schneider, D. McKnight, C.Schwartz and C. Gardner (all ADF&G) and D. E. N.Tait reviewed earlier drafts of the manuscript andoffered constructive comments.
We especially acknowledge the participation of T.Spraker (ADF&G) who assisted in the bear transplant, and provided technical assistance and advicethroughout the project.
Much of the success of the bear capturing phase ofthis project was due to the skills and cooperativeattitudes of our spotter plane pilots: Ken Bunch, AILee, and Rick Halford, and to the skill and cooperative attitude of our helicopter pilot, Vern Lofstedt.
453
Literature CitedBallard, W. B., A. L. Franzmann, T. Spraker, C. Schwartz,
and R. O. Peterson. 1979. Comparison of techniquesutilized to assess moose calf mortality in Alaska. Proceedings 15th North American Moose Conference, Kenai,Alaska 15:362-387.
*Ballard, W. B., S. Miller, and T. Spraker. 1980. Moosecalfmortality study, Game Management Unit 13. AlaskaDepartment of Fish and Game. Federal Aid in WildlifeRestoration Project Final Report W-I7-9 and W-I7-IO.Juneau. 123 pp.
Ballard, W. B., T. H. Spraker, and K. P. Taylor. 1981.Causes of neonatal Moose calf mortality in southcentralAlaska. Journal of Wildlife Management 45:335-342.
Ballard, W. B., S. Miller, and T. Spraker. 1982. Homerange, daily movements and reproductive biology ofBrown Bears in southcentral Alaska. Canadian Field Naturalist 96: (I): 1-5.
Bunnell, F. L., and D. E. N. Tail. 1981. Populationdynamics of bears-implications. In Dynamics of largemammal populations. Edited by C. W. Fowler and T. D.Smith. John Wiley and Sons, New York. pp. 75-128.
Craighead, F. C., Jr., and J. Craighead. 1972. Data ongrizzly bear denning activities and behaviour obtained byusing wildlife telemetry. In Bears - their biology andmanagement. Edited by S. Herrero. IUCN New SeriesPublication 23:84-106.
Glenn, L. P., J. W. Lentfer, J. B. Faro, and L. H. Miller.1976. Reproductive biology of female Brown Bears(Ursus arctos). McNeil River, Alaska. In Bears theirbiology and management. Edited by M. R. Pelton, J. W.Lentfer, and G. E. Folk. WCN New Series Publication 40:381-390.
Glenn, L. P., and L. Miller. 1980. Seasonal movements ofan Alaska Peninsula brown bear population." In Bears their biology and management. Edited by C. Martinkaand K. McArthur. Bear Biology Association ConferenceSeries 3: 307-312.
Martinka, C. J. 1974. Population characteristics of grizzlybears in Glacier National Park, Montana, Journal ofMammalogy 55: 21-29.
Miller, S. D., and W. B. Ballard. 1982. Homing of trans-.planted Alaskan Brown Bears. Journal of Wildlife Management 46(4): in press.
Mundy, K. R. D., and D. R. Flook. 1973. Background formanaging Grizzly Bears in the national parks of Canada.

THE CANADIAN FIELD-NATURALIST454
Canadian Wildlife Service Report Series No. 22. Ottawa.35 pp.
Pearson, A. M. 1975. The northern interior Grizzly BearUrsus arctos L. Canadian Wildlife Service Report SeriesNo. 34. 86 pp.
*Reynolds, H. V. 1976. North slope Grizzly Bear studies.Alaska Federal Aid in Wildlife Restoration Project W-I 76 and W-17-7 Juneau. 14 pp.
*Reynolds, H. V. 1980. North slope Grizzly Bear studies.Alaska Federal Aid in Wildlife Restoration Project WI7I I, Job 4.14R. and 4.15R. Juneau. 65 pp.
Ricker, W. E. 1975. Computation and interpretation ofbiological statistics of fish populations. Department of theEnvironment Fisheries and Marine Service, Ottawa, Bulletin 19 I. 382 pp.
Rogers, L. L. 1977. Social relationships, movements, andpopulation dynamics of Black Bears in northeastern Minnesota. Ph.D. thesis, University of Minnesota, Minneapo_lis. 194 pp.
Seber, G. A. F. 1973. Estimation of animal abundance.Hafner Publishing Company, New York, NY. 506 pp.
Troyer, W. A., and R. J. Hensel. 1964. Structure and distribution of a Kodiak bear population. Journal of WildlifeManagement 28: 769-772.
*Available from Alaska Department of Fish and Game,Division of Game, P.O. Box 3-2000, Juneau, Alaska 99802.
Received 18 November 1981Accepted 30 June 1982