Embed Size (px)
Citation preview
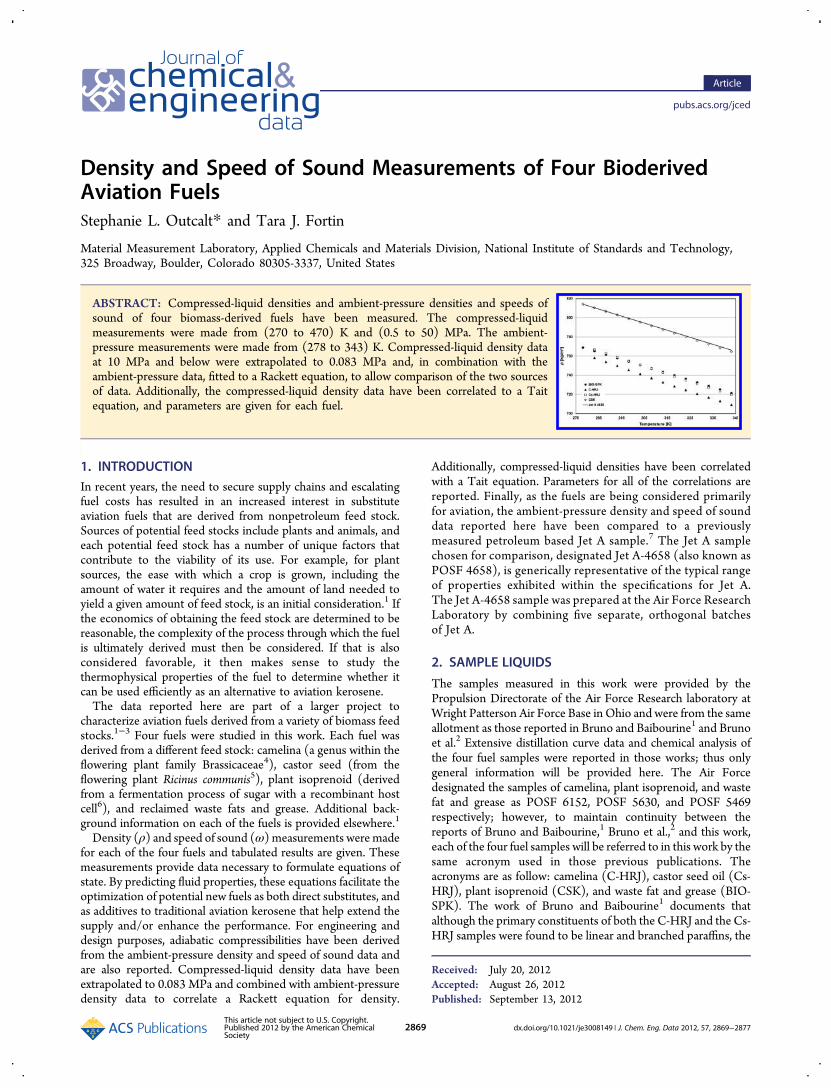
Density and Speed of Sound Measurements of Four BioderivedAviation FuelsStephanie L. Outcalt* and Tara J. Fortin
Material Measurement Laboratory, Applied Chemicals and Materials Division, National Institute of Standards and Technology,325 Broadway, Boulder, Colorado 80305-3337, United States
ABSTRACT: Compressed-liquid densities and ambient-pressure densities and speeds ofsound of four biomass-derived fuels have been measured. The compressed-liquidmeasurements were made from (270 to 470) K and (0.5 to 50) MPa. The ambient-pressure measurements were made from (278 to 343) K. Compressed-liquid density dataat 10 MPa and below were extrapolated to 0.083 MPa and, in combination with theambient-pressure data, fitted to a Rackett equation, to allow comparison of the two sourcesof data. Additionally, the compressed-liquid density data have been correlated to a Taitequation, and parameters are given for each fuel.
1. INTRODUCTIONIn recent years, the need to secure supply chains and escalatingfuel costs has resulted in an increased interest in substituteaviation fuels that are derived from nonpetroleum feed stock.Sources of potential feed stocks include plants and animals, andeach potential feed stock has a number of unique factors thatcontribute to the viability of its use. For example, for plantsources, the ease with which a crop is grown, including theamount of water it requires and the amount of land needed toyield a given amount of feed stock, is an initial consideration.1 Ifthe economics of obtaining the feed stock are determined to bereasonable, the complexity of the process through which the fuelis ultimately derived must then be considered. If that is alsoconsidered favorable, it then makes sense to study thethermophysical properties of the fuel to determine whether itcan be used efficiently as an alternative to aviation kerosene.The data reported here are part of a larger project to
characterize aviation fuels derived from a variety of biomass feedstocks.1−3 Four fuels were studied in this work. Each fuel wasderived from a different feed stock: camelina (a genus within theflowering plant family Brassicaceae4), castor seed (from theflowering plant Ricinus communis5), plant isoprenoid (derivedfrom a fermentation process of sugar with a recombinant hostcell6), and reclaimed waste fats and grease. Additional back-ground information on each of the fuels is provided elsewhere.1
Density (ρ) and speed of sound (ω) measurements were madefor each of the four fuels and tabulated results are given. Thesemeasurements provide data necessary to formulate equations ofstate. By predicting fluid properties, these equations facilitate theoptimization of potential new fuels as both direct substitutes, andas additives to traditional aviation kerosene that help extend thesupply and/or enhance the performance. For engineering anddesign purposes, adiabatic compressibilities have been derivedfrom the ambient-pressure density and speed of sound data andare also reported. Compressed-liquid density data have beenextrapolated to 0.083 MPa and combined with ambient-pressuredensity data to correlate a Rackett equation for density.
Additionally, compressed-liquid densities have been correlatedwith a Tait equation. Parameters for all of the correlations arereported. Finally, as the fuels are being considered primarilyfor aviation, the ambient-pressure density and speed of sounddata reported here have been compared to a previouslymeasured petroleum based Jet A sample.7 The Jet A samplechosen for comparison, designated Jet A-4658 (also known asPOSF 4658), is generically representative of the typical rangeof properties exhibited within the specifications for Jet A.The Jet A-4658 sample was prepared at the Air Force ResearchLaboratory by combining five separate, orthogonal batchesof Jet A.
2. SAMPLE LIQUIDS
The samples measured in this work were provided by thePropulsion Directorate of the Air Force Research laboratory atWright Patterson Air Force Base in Ohio and were from the sameallotment as those reported in Bruno and Baibourine1 and Brunoet al.2 Extensive distillation curve data and chemical analysis ofthe four fuel samples were reported in those works; thus onlygeneral information will be provided here. The Air Forcedesignated the samples of camelina, plant isoprenoid, and wastefat and grease as POSF 6152, POSF 5630, and POSF 5469respectively; however, to maintain continuity between thereports of Bruno and Baibourine,1 Bruno et al.,2 and this work,each of the four fuel samples will be referred to in this work by thesame acronym used in those previous publications. Theacronyms are as follow: camelina (C-HRJ), castor seed oil (Cs-HRJ), plant isoprenoid (CSK), and waste fat and grease (BIO-SPK). The work of Bruno and Baibourine1 documents thatalthough the primary constituents of both the C-HRJ and the Cs-HRJ samples were found to be linear and branched paraffins, the
Received: July 20, 2012Accepted: August 26, 2012Published: September 13, 2012
Article
pubs.acs.org/jced
This article not subject to U.S. Copyright.Published 2012 by the American ChemicalSociety
2869 dx.doi.org/10.1021/je3008149 | J. Chem. Eng. Data 2012, 57, 2869−2877
distillation curve of the Cs-HRJ is approximately 20 °C belowthat of C-HRJ from beginning to end. This indicates thatalthough the two samples have several components in common,their relative contributions to the overall composition are verydifferent, resulting in the observed differences in thedistillation curves. The CSK sample is composed predom-inantly of closely boiling cyclic compounds, resulting in a dis-tillation curve that is essentially flat at approximately 171 °C.The distillation curve of the BIO-SPK has an initial boilingtemperature and an end temperature similar to those of theCs-HRJ sample, but the shape of the curve is more linear thanthat of Cs-HRJ. The composition of the BIO-SPK sample2
includes many constituents similar to the C-HRJ and the Cs-HRJ samples; however, all of the constituents are present atgas chromatographic peak area percentages between 1.5 and3.3. In contrast, the composition analysis of the C-HRJ, Cs-HRJ, and CSK samples1,8,9 had area percent ranges of 2.2 to10.7, 1.0 to 7.9, and 4.3 to 47.1, respectively. The small rangeof area percentages in the BIO-SPK sample indicates thatthere are no clearly dominant components in the fuel, and thisprobably contributes to the linear nature of the distillationcurve.Ambient-pressure density and sound speed measurements
were carried out using the samples as they were received.
However, prior to the compressed-liquid density measurements,the samples were transferred to stainless steel cylinders anddegassed by freezing the sample with liquid nitrogen andevacuating the vapor space. After evacuation, the sample wasthen heated (in the closed stainless steel cylinder) to drive anyremaining dissolved impurities into the vapor space. The coolingand evacuation were then repeated, and the entire cycle (cooling,evacuation, and heating) was repeated a minimum of three timesfor each sample.
3. EXPERIMENTAL SECTIONA commercial density and sound speed analyzer was used tomeasure both properties at ambient-pressure (approximately0.083 MPa). Details of the instrument and experimentalprocedures can be found in Laesecke et al.10 and Fortinet al.;11 thus, only a brief description will be given here. Theinstrument contains two measurement cells in series; a soundspeed cell that measures the propagation time of approximately3 MHz sound waves and a vibrating-tube densimeter con-structed of borosilicate glass. Temperature is measured withan integrated Pt-100 thermometer with an estimateduncertainty of 0.03 K. The instrument was calibrated withdeionized water and toluene over the entire temperature range.During measurements, temperature scans were performed
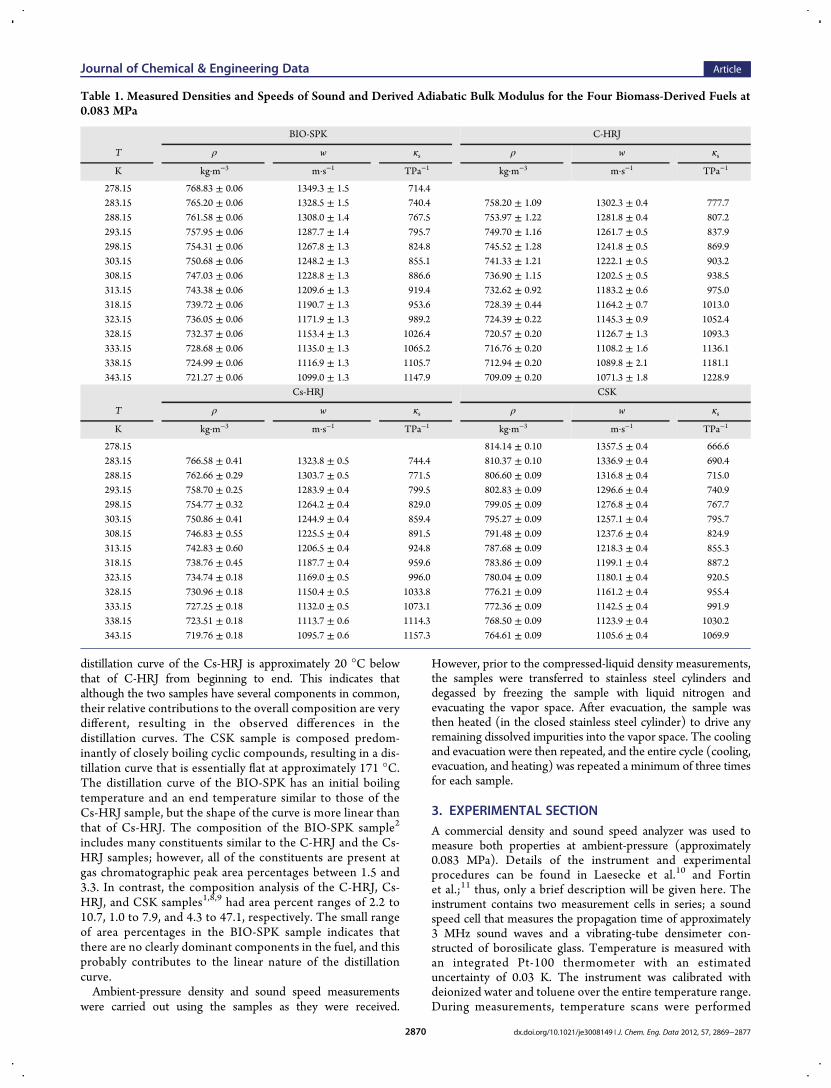
Table 1. Measured Densities and Speeds of Sound and Derived Adiabatic Bulk Modulus for the Four Biomass-Derived Fuels at0.083 MPa
BIO-SPK C-HRJ
T ρ w κs ρ w κs
K kg·m−3 m·s−1 TPa−1 kg·m−3 m·s−1 TPa−1
278.15 768.83 ± 0.06 1349.3 ± 1.5 714.4283.15 765.20 ± 0.06 1328.5 ± 1.5 740.4 758.20 ± 1.09 1302.3 ± 0.4 777.7288.15 761.58 ± 0.06 1308.0 ± 1.4 767.5 753.97 ± 1.22 1281.8 ± 0.4 807.2293.15 757.95 ± 0.06 1287.7 ± 1.4 795.7 749.70 ± 1.16 1261.7 ± 0.5 837.9298.15 754.31 ± 0.06 1267.8 ± 1.3 824.8 745.52 ± 1.28 1241.8 ± 0.5 869.9303.15 750.68 ± 0.06 1248.2 ± 1.3 855.1 741.33 ± 1.21 1222.1 ± 0.5 903.2308.15 747.03 ± 0.06 1228.8 ± 1.3 886.6 736.90 ± 1.15 1202.5 ± 0.5 938.5313.15 743.38 ± 0.06 1209.6 ± 1.3 919.4 732.62 ± 0.92 1183.2 ± 0.6 975.0318.15 739.72 ± 0.06 1190.7 ± 1.3 953.6 728.39 ± 0.44 1164.2 ± 0.7 1013.0323.15 736.05 ± 0.06 1171.9 ± 1.3 989.2 724.39 ± 0.22 1145.3 ± 0.9 1052.4328.15 732.37 ± 0.06 1153.4 ± 1.3 1026.4 720.57 ± 0.20 1126.7 ± 1.3 1093.3333.15 728.68 ± 0.06 1135.0 ± 1.3 1065.2 716.76 ± 0.20 1108.2 ± 1.6 1136.1338.15 724.99 ± 0.06 1116.9 ± 1.3 1105.7 712.94 ± 0.20 1089.8 ± 2.1 1181.1343.15 721.27 ± 0.06 1099.0 ± 1.3 1147.9 709.09 ± 0.20 1071.3 ± 1.8 1228.9
Cs-HRJ CSK
T ρ w κs ρ w κs
K kg·m−3 m·s−1 TPa−1 kg·m−3 m·s−1 TPa−1
278.15 814.14 ± 0.10 1357.5 ± 0.4 666.6283.15 766.58 ± 0.41 1323.8 ± 0.5 744.4 810.37 ± 0.10 1336.9 ± 0.4 690.4288.15 762.66 ± 0.29 1303.7 ± 0.5 771.5 806.60 ± 0.09 1316.8 ± 0.4 715.0293.15 758.70 ± 0.25 1283.9 ± 0.4 799.5 802.83 ± 0.09 1296.6 ± 0.4 740.9298.15 754.77 ± 0.32 1264.2 ± 0.4 829.0 799.05 ± 0.09 1276.8 ± 0.4 767.7303.15 750.86 ± 0.41 1244.9 ± 0.4 859.4 795.27 ± 0.09 1257.1 ± 0.4 795.7308.15 746.83 ± 0.55 1225.5 ± 0.4 891.5 791.48 ± 0.09 1237.6 ± 0.4 824.9313.15 742.83 ± 0.60 1206.5 ± 0.4 924.8 787.68 ± 0.09 1218.3 ± 0.4 855.3318.15 738.76 ± 0.45 1187.7 ± 0.4 959.6 783.86 ± 0.09 1199.1 ± 0.4 887.2323.15 734.74 ± 0.18 1169.0 ± 0.5 996.0 780.04 ± 0.09 1180.1 ± 0.4 920.5328.15 730.96 ± 0.18 1150.4 ± 0.5 1033.8 776.21 ± 0.09 1161.2 ± 0.4 955.4333.15 727.25 ± 0.18 1132.0 ± 0.5 1073.1 772.36 ± 0.09 1142.5 ± 0.4 991.9338.15 723.51 ± 0.18 1113.7 ± 0.6 1114.3 768.50 ± 0.09 1123.9 ± 0.4 1030.2343.15 719.76 ± 0.18 1095.7 ± 0.6 1157.3 764.61 ± 0.09 1105.6 ± 0.4 1069.9
Journal of Chemical & Engineering Data Article
dx.doi.org/10.1021/je3008149 | J. Chem. Eng. Data 2012, 57, 2869−28772870
from (343 to 278) K in decrements of 5 K. A fresh sample of fuelwas injected for each temperature scan rather than perform-ing repetitive measurements on the same sample. At least threetemperature scans were performed for each fuel. For theambient-pressure density and sound speed measurements, theuncertainties (95% confidence level) are listed with the reporteddata (Table 1).The densities of the compressed test liquids were
measured with the automated densimeter of Outcalt andMcLinden.12 Central to the apparatus is a commercialvibrating-tube densimeter. Several physical and proce-dural improvements have been implemented to mini-mize the uncertainty in the measurements. Some of these
improvements include more accurate measurements oftemperature and pressure, better temperature control, andcomplete automation of the instrument control and dataacquisition. The temperature range of the instrument is(270 to 470) K, with pressures up to 50 MPa. The instru-ment was calibrated with propane and toluene over theentire temperature and pressure range. Further details ofthe calibration procedure can be found in Outcalt andMcLinden.12 The overall combined uncertainty (k = 2, 95 %confidence level) in density is 0.81 kg·m−3, corresponding to arelative uncertainty in density of 0.1 % to 0.13 %. In this work, wemeasured eleven isotherms over the range (0.5 to 50) MPa foreach of the fuel samples.
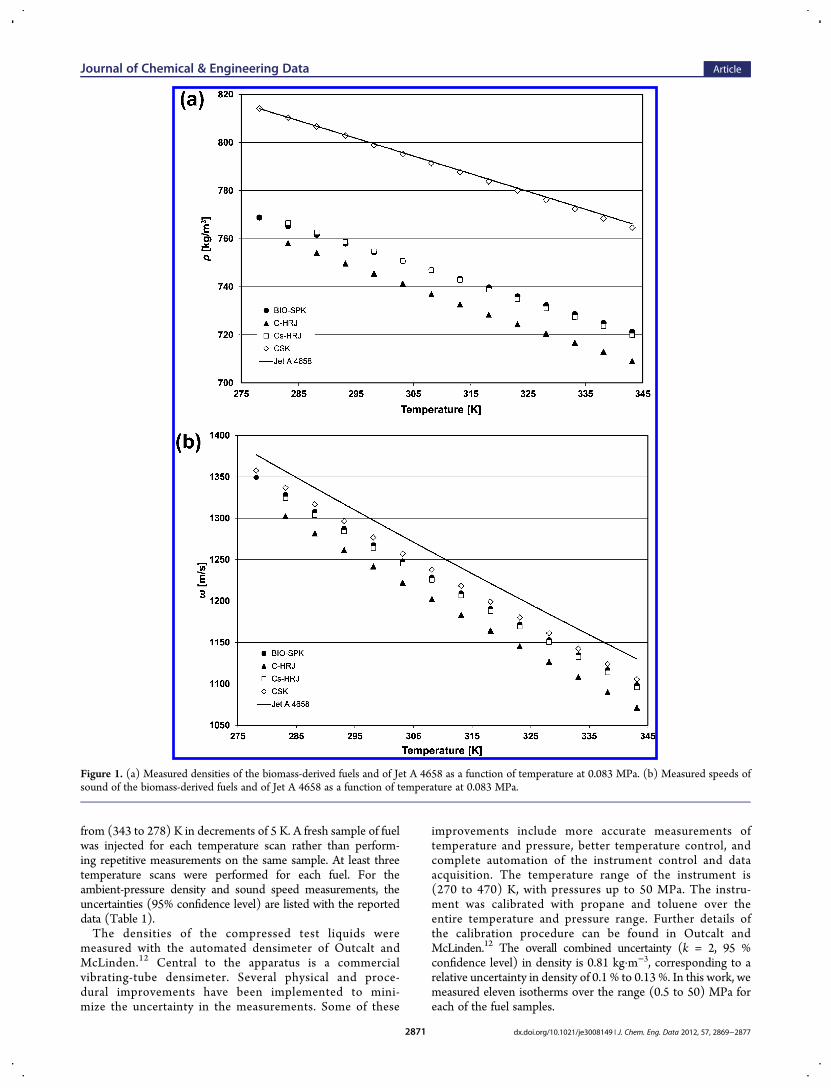
Figure 1. (a) Measured densities of the biomass-derived fuels and of Jet A 4658 as a function of temperature at 0.083 MPa. (b) Measured speeds ofsound of the biomass-derived fuels and of Jet A 4658 as a function of temperature at 0.083 MPa.
Journal of Chemical & Engineering Data Article
dx.doi.org/10.1021/je3008149 | J. Chem. Eng. Data 2012, 57, 2869−28772871
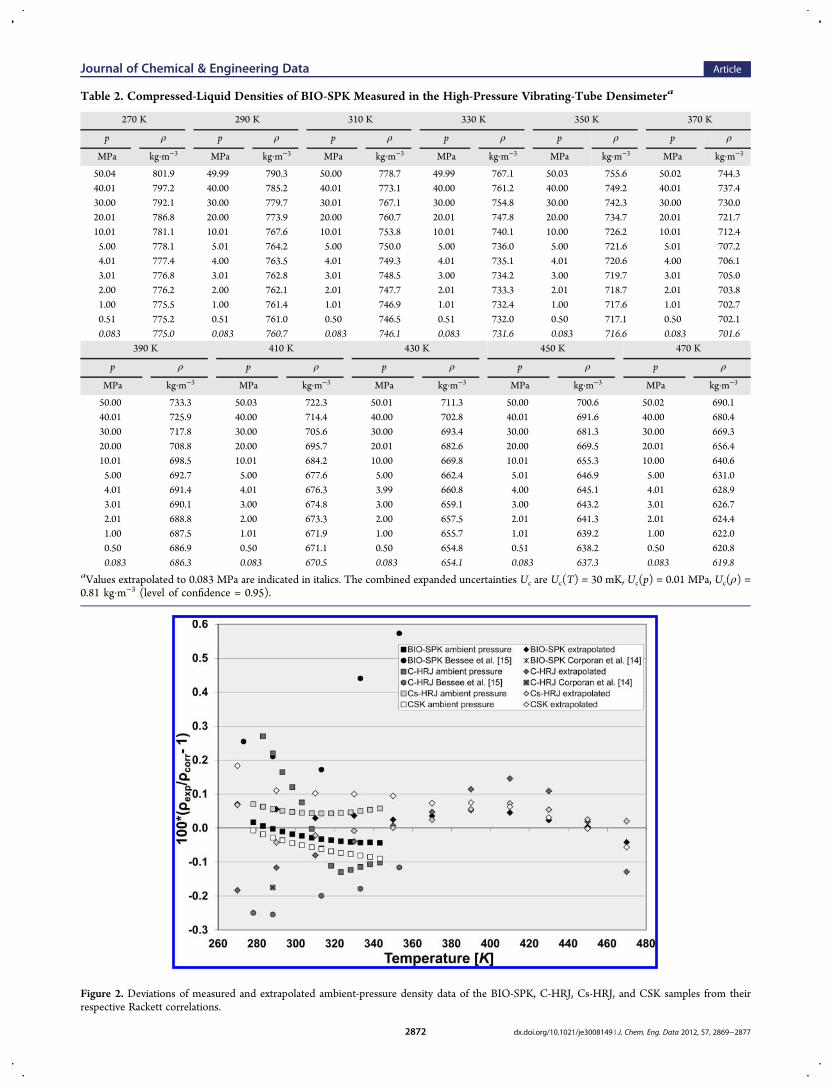
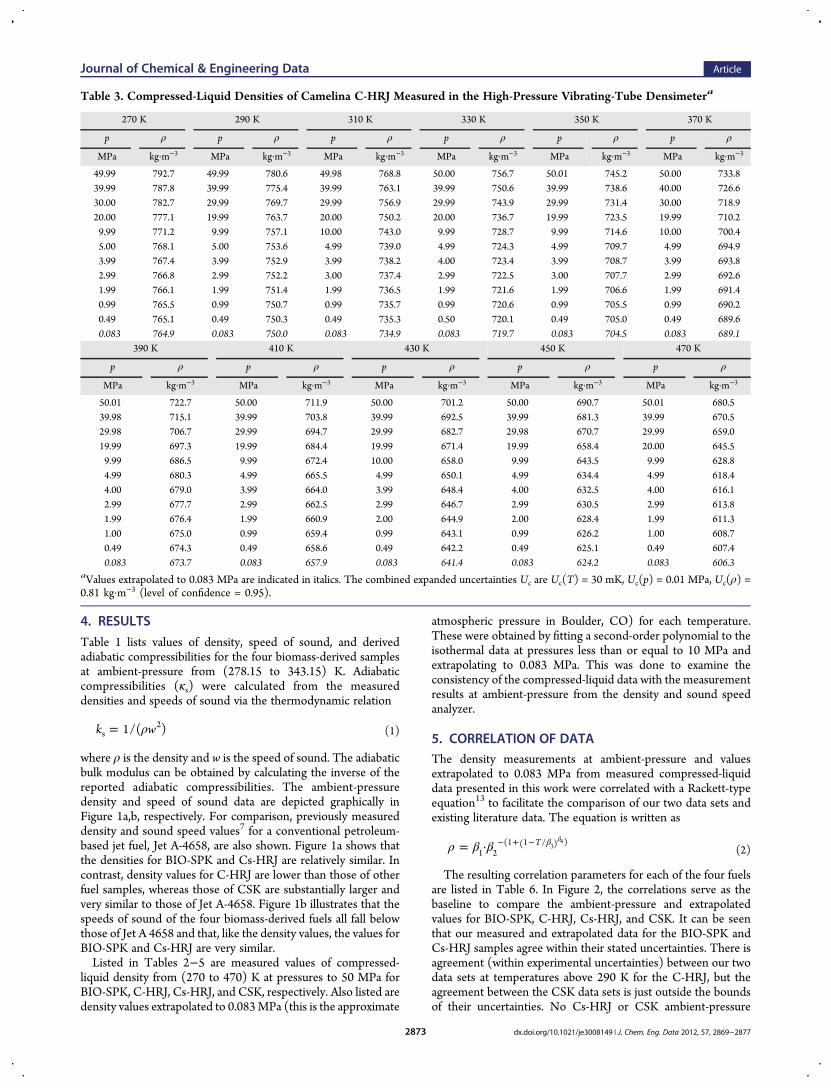
Table 2. Compressed-Liquid Densities of BIO-SPK Measured in the High-Pressure Vibrating-Tube Densimetera
270 K 290 K 310 K 330 K 350 K 370 K
p ρ p ρ p ρ p ρ p ρ p ρ
MPa kg·m−3 MPa kg·m−3 MPa kg·m−3 MPa kg·m−3 MPa kg·m−3 MPa kg·m−3
50.04 801.9 49.99 790.3 50.00 778.7 49.99 767.1 50.03 755.6 50.02 744.340.01 797.2 40.00 785.2 40.01 773.1 40.00 761.2 40.00 749.2 40.01 737.430.00 792.1 30.00 779.7 30.01 767.1 30.00 754.8 30.00 742.3 30.00 730.020.01 786.8 20.00 773.9 20.00 760.7 20.01 747.8 20.00 734.7 20.01 721.710.01 781.1 10.01 767.6 10.01 753.8 10.01 740.1 10.00 726.2 10.01 712.45.00 778.1 5.01 764.2 5.00 750.0 5.00 736.0 5.00 721.6 5.01 707.24.01 777.4 4.00 763.5 4.01 749.3 4.01 735.1 4.01 720.6 4.00 706.13.01 776.8 3.01 762.8 3.01 748.5 3.00 734.2 3.00 719.7 3.01 705.02.00 776.2 2.00 762.1 2.01 747.7 2.01 733.3 2.01 718.7 2.01 703.81.00 775.5 1.00 761.4 1.01 746.9 1.01 732.4 1.00 717.6 1.01 702.70.51 775.2 0.51 761.0 0.50 746.5 0.51 732.0 0.50 717.1 0.50 702.10.083 775.0 0.083 760.7 0.083 746.1 0.083 731.6 0.083 716.6 0.083 701.6
390 K 410 K 430 K 450 K 470 K
p ρ p ρ p ρ p ρ p ρ
MPa kg·m−3 MPa kg·m−3 MPa kg·m−3 MPa kg·m−3 MPa kg·m−3
50.00 733.3 50.03 722.3 50.01 711.3 50.00 700.6 50.02 690.140.01 725.9 40.00 714.4 40.00 702.8 40.01 691.6 40.00 680.430.00 717.8 30.00 705.6 30.00 693.4 30.00 681.3 30.00 669.320.00 708.8 20.00 695.7 20.01 682.6 20.00 669.5 20.01 656.410.01 698.5 10.01 684.2 10.00 669.8 10.01 655.3 10.00 640.65.00 692.7 5.00 677.6 5.00 662.4 5.01 646.9 5.00 631.04.01 691.4 4.01 676.3 3.99 660.8 4.00 645.1 4.01 628.93.01 690.1 3.00 674.8 3.00 659.1 3.00 643.2 3.01 626.72.01 688.8 2.00 673.3 2.00 657.5 2.01 641.3 2.01 624.41.00 687.5 1.01 671.9 1.00 655.7 1.01 639.2 1.00 622.00.50 686.9 0.50 671.1 0.50 654.8 0.51 638.2 0.50 620.80.083 686.3 0.083 670.5 0.083 654.1 0.083 637.3 0.083 619.8
aValues extrapolated to 0.083 MPa are indicated in italics. The combined expanded uncertainties Uc are Uc(T) = 30 mK, Uc(p) = 0.01 MPa, Uc(ρ) =0.81 kg·m−3 (level of confidence = 0.95).
Figure 2. Deviations of measured and extrapolated ambient-pressure density data of the BIO-SPK, C-HRJ, Cs-HRJ, and CSK samples from theirrespective Rackett correlations.
Journal of Chemical & Engineering Data Article
dx.doi.org/10.1021/je3008149 | J. Chem. Eng. Data 2012, 57, 2869−28772872
4. RESULTS
Table 1 lists values of density, speed of sound, and derivedadiabatic compressibilities for the four biomass-derived samplesat ambient-pressure from (278.15 to 343.15) K. Adiabaticcompressibilities (κs) were calculated from the measureddensities and speeds of sound via the thermodynamic relation
ρ=k w1/( )s2
(1)
where ρ is the density and w is the speed of sound. The adiabaticbulk modulus can be obtained by calculating the inverse of thereported adiabatic compressibilities. The ambient-pressuredensity and speed of sound data are depicted graphically inFigure 1a,b, respectively. For comparison, previously measureddensity and sound speed values7 for a conventional petroleum-based jet fuel, Jet A-4658, are also shown. Figure 1a shows thatthe densities for BIO-SPK and Cs-HRJ are relatively similar. Incontrast, density values for C-HRJ are lower than those of otherfuel samples, whereas those of CSK are substantially larger andvery similar to those of Jet A-4658. Figure 1b illustrates that thespeeds of sound of the four biomass-derived fuels all fall belowthose of Jet A 4658 and that, like the density values, the values forBIO-SPK and Cs-HRJ are very similar.Listed in Tables 2−5 are measured values of compressed-
liquid density from (270 to 470) K at pressures to 50 MPa forBIO-SPK, C-HRJ, Cs-HRJ, and CSK, respectively. Also listed aredensity values extrapolated to 0.083MPa (this is the approximate
atmospheric pressure in Boulder, CO) for each temperature.These were obtained by fitting a second-order polynomial to theisothermal data at pressures less than or equal to 10 MPa andextrapolating to 0.083 MPa. This was done to examine theconsistency of the compressed-liquid data with the measurementresults at ambient-pressure from the density and sound speedanalyzer.
5. CORRELATION OF DATAThe density measurements at ambient-pressure and valuesextrapolated to 0.083 MPa from measured compressed-liquiddata presented in this work were correlated with a Rackett-typeequation13 to facilitate the comparison of our two data sets andexisting literature data. The equation is written as
ρ β β= · β− + − βT1 2
(1 (1 / ) )34
(2)
The resulting correlation parameters for each of the four fuelsare listed in Table 6. In Figure 2, the correlations serve as thebaseline to compare the ambient-pressure and extrapolatedvalues for BIO-SPK, C-HRJ, Cs-HRJ, and CSK. It can be seenthat our measured and extrapolated data for the BIO-SPK andCs-HRJ samples agree within their stated uncertainties. There isagreement (within experimental uncertainties) between our twodata sets at temperatures above 290 K for the C-HRJ, but theagreement between the CSK data sets is just outside the boundsof their uncertainties. No Cs-HRJ or CSK ambient-pressure
Table 3. Compressed-Liquid Densities of Camelina C-HRJ Measured in the High-Pressure Vibrating-Tube Densimetera
270 K 290 K 310 K 330 K 350 K 370 K
p ρ p ρ p ρ p ρ p ρ p ρ
MPa kg·m−3 MPa kg·m−3 MPa kg·m−3 MPa kg·m−3 MPa kg·m−3 MPa kg·m−3
49.99 792.7 49.99 780.6 49.98 768.8 50.00 756.7 50.01 745.2 50.00 733.839.99 787.8 39.99 775.4 39.99 763.1 39.99 750.6 39.99 738.6 40.00 726.630.00 782.7 29.99 769.7 29.99 756.9 29.99 743.9 29.99 731.4 30.00 718.920.00 777.1 19.99 763.7 20.00 750.2 20.00 736.7 19.99 723.5 19.99 710.29.99 771.2 9.99 757.1 10.00 743.0 9.99 728.7 9.99 714.6 10.00 700.45.00 768.1 5.00 753.6 4.99 739.0 4.99 724.3 4.99 709.7 4.99 694.93.99 767.4 3.99 752.9 3.99 738.2 4.00 723.4 3.99 708.7 3.99 693.82.99 766.8 2.99 752.2 3.00 737.4 2.99 722.5 3.00 707.7 2.99 692.61.99 766.1 1.99 751.4 1.99 736.5 1.99 721.6 1.99 706.6 1.99 691.40.99 765.5 0.99 750.7 0.99 735.7 0.99 720.6 0.99 705.5 0.99 690.20.49 765.1 0.49 750.3 0.49 735.3 0.50 720.1 0.49 705.0 0.49 689.60.083 764.9 0.083 750.0 0.083 734.9 0.083 719.7 0.083 704.5 0.083 689.1
390 K 410 K 430 K 450 K 470 K
p ρ p ρ p ρ p ρ p ρ
MPa kg·m−3 MPa kg·m−3 MPa kg·m−3 MPa kg·m−3 MPa kg·m−3
50.01 722.7 50.00 711.9 50.00 701.2 50.00 690.7 50.01 680.539.98 715.1 39.99 703.8 39.99 692.5 39.99 681.3 39.99 670.529.98 706.7 29.99 694.7 29.99 682.7 29.98 670.7 29.99 659.019.99 697.3 19.99 684.4 19.99 671.4 19.99 658.4 20.00 645.59.99 686.5 9.99 672.4 10.00 658.0 9.99 643.5 9.99 628.84.99 680.3 4.99 665.5 4.99 650.1 4.99 634.4 4.99 618.44.00 679.0 3.99 664.0 3.99 648.4 4.00 632.5 4.00 616.12.99 677.7 2.99 662.5 2.99 646.7 2.99 630.5 2.99 613.81.99 676.4 1.99 660.9 2.00 644.9 2.00 628.4 1.99 611.31.00 675.0 0.99 659.4 0.99 643.1 0.99 626.2 1.00 608.70.49 674.3 0.49 658.6 0.49 642.2 0.49 625.1 0.49 607.40.083 673.7 0.083 657.9 0.083 641.4 0.083 624.2 0.083 606.3
aValues extrapolated to 0.083 MPa are indicated in italics. The combined expanded uncertainties Uc are Uc(T) = 30 mK, Uc(p) = 0.01 MPa, Uc(ρ) =0.81 kg·m−3 (level of confidence = 0.95).
Journal of Chemical & Engineering Data Article
dx.doi.org/10.1021/je3008149 | J. Chem. Eng. Data 2012, 57, 2869−28772873
density data were found in the literature. Two sources of such datawere found for samples of BIO-SPK and C-HRJ.14,15 The samplesstudied in refs 14 and 15 were from the same batches as samplesused in this work. Those data are included in Figure 2 but were notused in the correlations. The data of Corporan et al.14 (one point at288.15 K for each sample) agree well with our extrapolated data.The C-HRJ ambient-pressure density data of Bessee et al.15 agreewith our extrapolated data within experimental uncertainty, but forBIO-SPK that is not the case. The BIO-SPK data of Bessee et al.15
are consistently higher than either of our data sets.To make the present results immediately usable for engineer-
ing and design purposes, the compressed-liquid density datawere correlated with a Tait equation similar to that of Dymondand Malhotra.16 The temperature dependence of the parameterCwas omitted because it was not needed to fit the majority of thedata within their experimental uncertainty. The equation used tofit the compressed-liquid density data is
ρρ
=− +
+⎜ ⎟⎛⎝
⎞⎠
T pT p
C( , )
( , )
1 ln p B Tp B T
ref ref
( )( )ref (3)
where ρref(T) is the temperature-dependent density at thereference pressure pref (0.083 MPa); pref(T) was calculated witheq 2. The temperature dependence of the Tait parameter B(T)was expressed by a quadratic polynomial,
β β β= + +B T T T( ) 5 6 r 7 r2
(4)
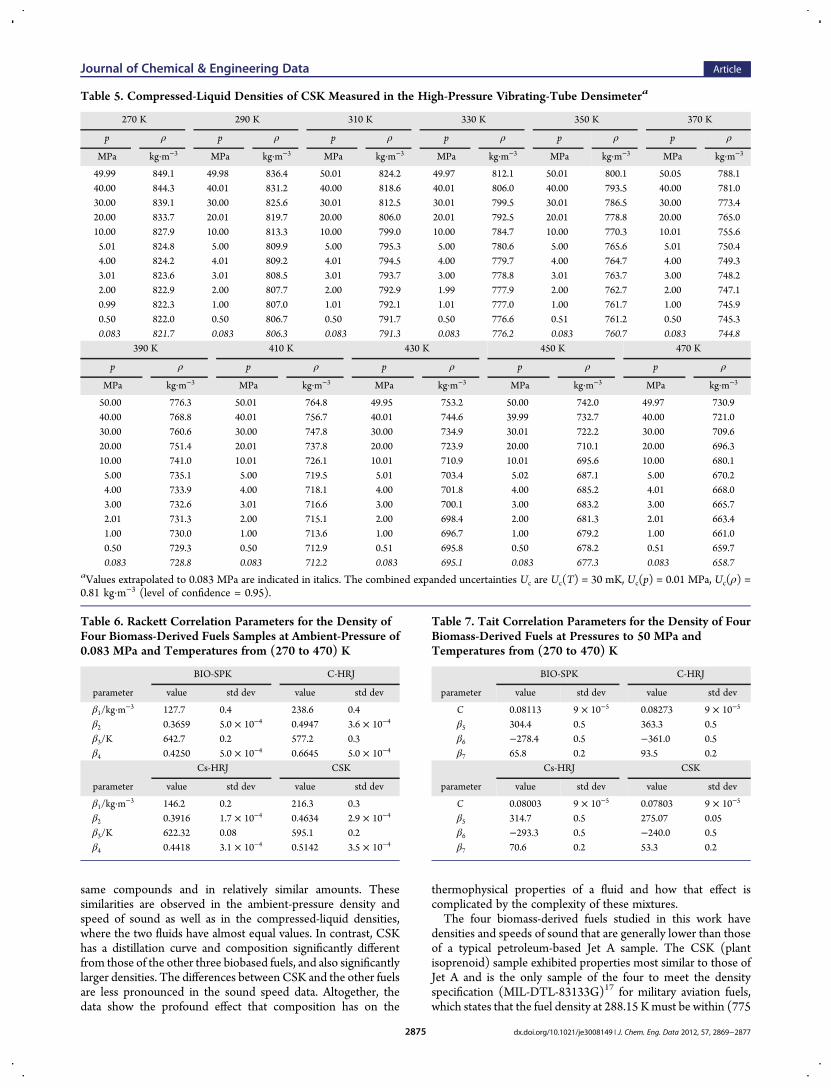
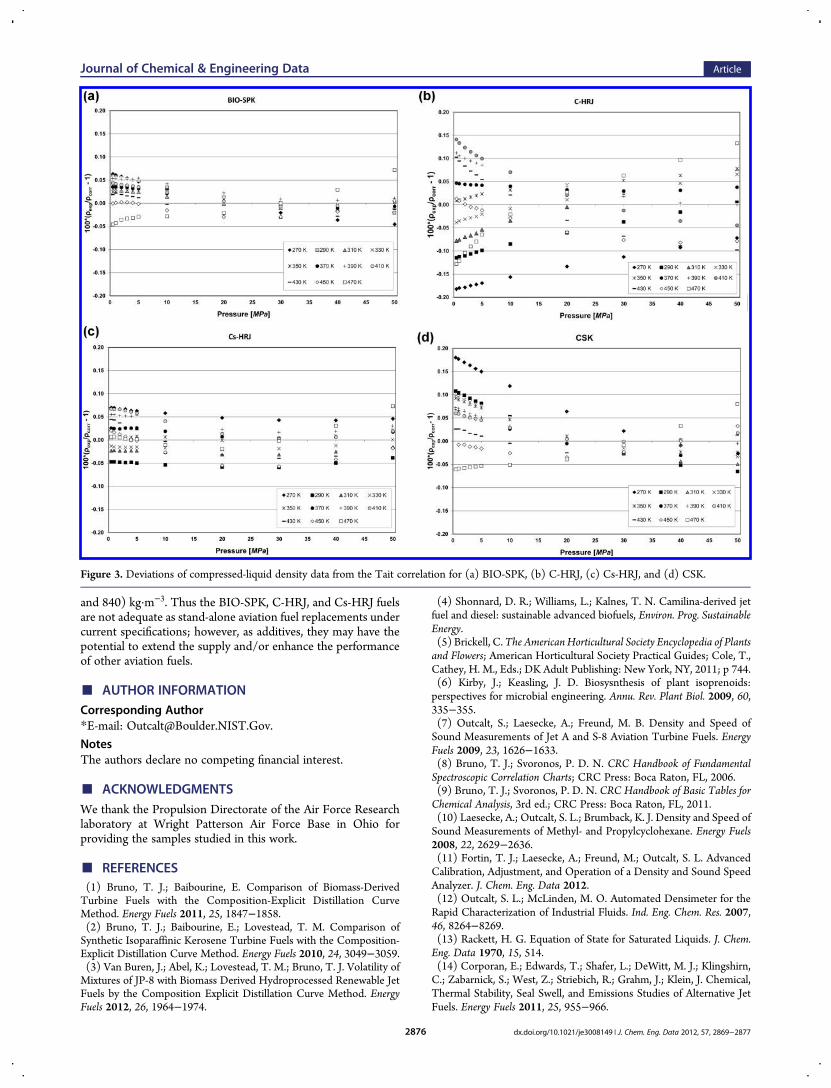
where Tr is the absolute temperature T divided by 273.15 K. Theresulting parameters for the Tait correlations for all four fuels aregiven in Table 7. Panels a−d of Figure 3 show deviations of themeasured compressed-liquid density data from baselines thatrepresent the Tait correlations for BIO-SPK, C-HRJ, Cs-HRJ,and CSK, respectively. As shown in Figure 3a−d, the Taitcorrelations successfully represent the majority of our data withintheir stated uncertainty. The only exceptions are eight points forC-HRJ and six points for CSK along their respective 270 Kisotherms, and a single point for C-HRJ along the 470 Kisotherm.
6. CONCLUSIONSDensity and speed of sound at ambient-pressure and compressed-liquid densities of four biomass-derived fuel samples, BIO-SPK, C-HRJ, Cs-HRJ, and CSK, have been measured cov-ering a combined temperature range of (270 to 470) K withpressures to 50 MPa. The compressed-liquid density datahave been correlated with a modified Tait equation that fitsthe majority of the measured data within their experimentaluncertainty.Knowledge of the composition and distillation curve of each
fuel may aid in understanding and interpreting the data. Forexample, the very similar distillation curves of the BIO-SPK andCs-HRJ may indicate that both samples contain many of the
Table 4. Compressed-Liquid Densities of Cs-HRJ Measured in the High-Pressure Vibrating-Tube Densimetera
270 K 290 K 310 K 330 K 350 K 370 K
p ρ p ρ p ρ p ρ p ρ p ρ
MPa kg·m−3 MPa kg·m−3 MPa kg·m−3 MPa kg·m−3 MPa kg·m−3 MPa kg·m−3
50.02 801.8 49.99 789.3 50.04 777.7 49.97 766.2 50.00 754.9 50.03 743.640.00 797.0 39.99 784.08 40.00 772.2 40.00 760.2 39.99 748.5 39.99 736.729.99 791.9 30.00 778.55 29.99 766.2 29.99 753.8 29.99 741.5 30.00 729.219.99 786.6 19.99 772.67 19.99 759.8 19.99 746.8 19.99 733.9 19.99 720.89.99 780.8 9.99 766.33 10.00 752.9 9.99 739.1 9.99 725.4 9.99 711.44.99 777.7 4.99 762.95 4.99 749.1 4.98 734.9 4.99 720.7 4.98 706.23.99 777.1 4.01 762.27 4.00 748.3 3.99 734.1 4.00 719.7 3.99 705.12.99 776.5 2.99 761.55 2.99 747.5 2.99 733.2 3.00 718.7 2.99 704.02.00 775.8 1.99 760.84 1.99 746.7 1.99 732.3 1.99 717.7 2.00 702.80.99 775.2 0.99 760.12 0.99 745.9 0.99 731.4 0.99 716.7 0.99 701.70.49 774.9 0.49 759.76 0.49 745.5 0.49 730.9 0.49 716.2 0.49 701.10.083 774.6 0.083 759.5 0.083 745.2 0.083 730.6 0.083 715.7 0.083 700.6
390 K 410 K 430 K 450 K 470 K
p ρ p ρ p ρ p ρ p ρ
MPa kg·m−3 MPa kg·m−3 MPa kg·m−3 MPa kg·m−3 MPa kg·m−3
49.98 732.5 50.03 721.5 49.99 710.4 50.01 699.5 50.01 688.840.00 725.1 40.00 713.5 40.00 701.8 40.00 690.3 40.00 679.129.99 717.0 29.99 704.7 29.99 692.3 30.00 680.0 29.99 667.919.99 707.9 19.99 694.8 19.99 681.4 19.99 668.1 20.00 654.910.00 697.5 10.00 683.2 10.00 668.5 9.99 653.8 9.99 638.94.99 691.6 4.99 676.6 4.99 661.0 4.99 645.2 4.99 629.24.00 690.3 3.99 675.2 3.99 659.4 3.99 643.4 3.99 627.02.99 689.1 2.99 673.7 2.99 657.7 2.99 641.4 3.00 624.81.99 687.7 1.99 672.2 1.99 656.0 1.99 639.5 1.99 622.41.00 686.4 1.00 670.7 0.99 654.3 1.00 637.4 0.99 620.00.50 685.8 0.49 669.9 0.49 653.4 0.49 636.3 0.49 618.80.083 685.2 0.083 669.3 0.083 652.7 0.083 635.5 0.083 617.8
aValues extrapolated to 0.083 MPa are indicated in italics. The combined expanded uncertainties Uc are Uc(T) = 30 mK, Uc(p) = 0.01 MPa, Uc(ρ) =0.81 kg·m−3 (level of confidence = 0.95).
Journal of Chemical & Engineering Data Article
dx.doi.org/10.1021/je3008149 | J. Chem. Eng. Data 2012, 57, 2869−28772874
same compounds and in relatively similar amounts. Thesesimilarities are observed in the ambient-pressure density andspeed of sound as well as in the compressed-liquid densities,where the two fluids have almost equal values. In contrast, CSKhas a distillation curve and composition significantly differentfrom those of the other three biobased fuels, and also significantlylarger densities. The differences between CSK and the other fuelsare less pronounced in the sound speed data. Altogether, thedata show the profound effect that composition has on the
thermophysical properties of a fluid and how that effect iscomplicated by the complexity of these mixtures.The four biomass-derived fuels studied in this work have
densities and speeds of sound that are generally lower than thoseof a typical petroleum-based Jet A sample. The CSK (plantisoprenoid) sample exhibited properties most similar to those ofJet A and is the only sample of the four to meet the densityspecification (MIL-DTL-83133G)17 for military aviation fuels,which states that the fuel density at 288.15 Kmust be within (775
Table 5. Compressed-Liquid Densities of CSK Measured in the High-Pressure Vibrating-Tube Densimetera
270 K 290 K 310 K 330 K 350 K 370 K
p ρ p ρ p ρ p ρ p ρ p ρ
MPa kg·m−3 MPa kg·m−3 MPa kg·m−3 MPa kg·m−3 MPa kg·m−3 MPa kg·m−3
49.99 849.1 49.98 836.4 50.01 824.2 49.97 812.1 50.01 800.1 50.05 788.140.00 844.3 40.01 831.2 40.00 818.6 40.01 806.0 40.00 793.5 40.00 781.030.00 839.1 30.00 825.6 30.01 812.5 30.01 799.5 30.01 786.5 30.00 773.420.00 833.7 20.01 819.7 20.00 806.0 20.01 792.5 20.01 778.8 20.00 765.010.00 827.9 10.00 813.3 10.00 799.0 10.00 784.7 10.00 770.3 10.01 755.65.01 824.8 5.00 809.9 5.00 795.3 5.00 780.6 5.00 765.6 5.01 750.44.00 824.2 4.01 809.2 4.01 794.5 4.00 779.7 4.00 764.7 4.00 749.33.01 823.6 3.01 808.5 3.01 793.7 3.00 778.8 3.01 763.7 3.00 748.22.00 822.9 2.00 807.7 2.00 792.9 1.99 777.9 2.00 762.7 2.00 747.10.99 822.3 1.00 807.0 1.01 792.1 1.01 777.0 1.00 761.7 1.00 745.90.50 822.0 0.50 806.7 0.50 791.7 0.50 776.6 0.51 761.2 0.50 745.30.083 821.7 0.083 806.3 0.083 791.3 0.083 776.2 0.083 760.7 0.083 744.8
390 K 410 K 430 K 450 K 470 K
p ρ p ρ p ρ p ρ p ρ
MPa kg·m−3 MPa kg·m−3 MPa kg·m−3 MPa kg·m−3 MPa kg·m−3
50.00 776.3 50.01 764.8 49.95 753.2 50.00 742.0 49.97 730.940.00 768.8 40.01 756.7 40.01 744.6 39.99 732.7 40.00 721.030.00 760.6 30.00 747.8 30.00 734.9 30.01 722.2 30.00 709.620.00 751.4 20.01 737.8 20.00 723.9 20.00 710.1 20.00 696.310.00 741.0 10.01 726.1 10.01 710.9 10.01 695.6 10.00 680.15.00 735.1 5.00 719.5 5.01 703.4 5.02 687.1 5.00 670.24.00 733.9 4.00 718.1 4.00 701.8 4.00 685.2 4.01 668.03.00 732.6 3.01 716.6 3.00 700.1 3.00 683.2 3.00 665.72.01 731.3 2.00 715.1 2.00 698.4 2.00 681.3 2.01 663.41.00 730.0 1.00 713.6 1.00 696.7 1.00 679.2 1.00 661.00.50 729.3 0.50 712.9 0.51 695.8 0.50 678.2 0.51 659.70.083 728.8 0.083 712.2 0.083 695.1 0.083 677.3 0.083 658.7
aValues extrapolated to 0.083 MPa are indicated in italics. The combined expanded uncertainties Uc are Uc(T) = 30 mK, Uc(p) = 0.01 MPa, Uc(ρ) =0.81 kg·m−3 (level of confidence = 0.95).
Table 6. Rackett Correlation Parameters for the Density ofFour Biomass-Derived Fuels Samples at Ambient-Pressure of0.083 MPa and Temperatures from (270 to 470) K
BIO-SPK C-HRJ
parameter value std dev value std dev
β1/kg·m−3 127.7 0.4 238.6 0.4
β2 0.3659 5.0 × 10⁻⁴ 0.4947 3.6 × 10⁻⁴
β3/K 642.7 0.2 577.2 0.3β4 0.4250 5.0 × 10⁻⁴ 0.6645 5.0 × 10⁻⁴
Cs-HRJ CSK
parameter value std dev value std dev
β1/kg·m−3 146.2 0.2 216.3 0.3
β2 0.3916 1.7 × 10⁻⁴ 0.4634 2.9 × 10⁻⁴
β3/K 622.32 0.08 595.1 0.2β4 0.4418 3.1 × 10⁻⁴ 0.5142 3.5 × 10⁻⁴
Table 7. Tait Correlation Parameters for the Density of FourBiomass-Derived Fuels at Pressures to 50 MPa andTemperatures from (270 to 470) K
BIO-SPK C-HRJ
parameter value std dev value std dev
C 0.08113 9 × 10⁻⁵ 0.08273 9 × 10⁻⁵
β5 304.4 0.5 363.3 0.5β6 −278.4 0.5 −361.0 0.5β7 65.8 0.2 93.5 0.2
Cs-HRJ CSK
parameter value std dev value std dev
C 0.08003 9 × 10⁻⁵ 0.07803 9 × 10⁻⁵
β5 314.7 0.5 275.07 0.05β6 −293.3 0.5 −240.0 0.5β7 70.6 0.2 53.3 0.2
Journal of Chemical & Engineering Data Article
dx.doi.org/10.1021/je3008149 | J. Chem. Eng. Data 2012, 57, 2869−28772875
and 840) kg·m−3. Thus the BIO-SPK, C-HRJ, and Cs-HRJ fuelsare not adequate as stand-alone aviation fuel replacements undercurrent specifications; however, as additives, they may have thepotential to extend the supply and/or enhance the performanceof other aviation fuels.
■ AUTHOR INFORMATIONCorresponding Author*E-mail: [email protected].
NotesThe authors declare no competing financial interest.
■ ACKNOWLEDGMENTSWe thank the Propulsion Directorate of the Air Force Researchlaboratory at Wright Patterson Air Force Base in Ohio forproviding the samples studied in this work.
■ REFERENCES(1) Bruno, T. J.; Baibourine, E. Comparison of Biomass-DerivedTurbine Fuels with the Composition-Explicit Distillation CurveMethod. Energy Fuels 2011, 25, 1847−1858.(2) Bruno, T. J.; Baibourine, E.; Lovestead, T. M. Comparison ofSynthetic Isoparaffinic Kerosene Turbine Fuels with the Composition-Explicit Distillation Curve Method. Energy Fuels 2010, 24, 3049−3059.(3) Van Buren, J.; Abel, K.; Lovestead, T. M.; Bruno, T. J. Volatility ofMixtures of JP-8 with Biomass Derived Hydroprocessed Renewable JetFuels by the Composition Explicit Distillation Curve Method. EnergyFuels 2012, 26, 1964−1974.
(4) Shonnard, D. R.; Williams, L.; Kalnes, T. N. Camilina-derived jetfuel and diesel: sustainable advanced biofuels, Environ. Prog. SustainableEnergy.(5) Brickell, C.The American Horticultural Society Encyclopedia of Plantsand Flowers; American Horticultural Society Practical Guides; Cole, T.,Cathey, H. M., Eds.; DK Adult Publishing: New York, NY, 2011; p 744.(6) Kirby, J.; Keasling, J. D. Biosysnthesis of plant isoprenoids:perspectives for microbial engineering. Annu. Rev. Plant Biol. 2009, 60,335−355.(7) Outcalt, S.; Laesecke, A.; Freund, M. B. Density and Speed ofSound Measurements of Jet A and S-8 Aviation Turbine Fuels. EnergyFuels 2009, 23, 1626−1633.(8) Bruno, T. J.; Svoronos, P. D. N. CRC Handbook of FundamentalSpectroscopic Correlation Charts; CRC Press: Boca Raton, FL, 2006.(9) Bruno, T. J.; Svoronos, P. D. N. CRC Handbook of Basic Tables forChemical Analysis, 3rd ed.; CRC Press: Boca Raton, FL, 2011.(10) Laesecke, A.; Outcalt, S. L.; Brumback, K. J. Density and Speed ofSound Measurements of Methyl- and Propylcyclohexane. Energy Fuels2008, 22, 2629−2636.(11) Fortin, T. J.; Laesecke, A.; Freund, M.; Outcalt, S. L. AdvancedCalibration, Adjustment, and Operation of a Density and Sound SpeedAnalyzer. J. Chem. Eng. Data 2012.(12) Outcalt, S. L.; McLinden, M. O. Automated Densimeter for theRapid Characterization of Industrial Fluids. Ind. Eng. Chem. Res. 2007,46, 8264−8269.(13) Rackett, H. G. Equation of State for Saturated Liquids. J. Chem.Eng. Data 1970, 15, 514.(14) Corporan, E.; Edwards, T.; Shafer, L.; DeWitt, M. J.; Klingshirn,C.; Zabarnick, S.; West, Z.; Striebich, R.; Grahm, J.; Klein, J. Chemical,Thermal Stability, Seal Swell, and Emissions Studies of Alternative JetFuels. Energy Fuels 2011, 25, 955−966.
Figure 3. Deviations of compressed-liquid density data from the Tait correlation for (a) BIO-SPK, (b) C-HRJ, (c) Cs-HRJ, and (d) CSK.
Journal of Chemical & Engineering Data Article
dx.doi.org/10.1021/je3008149 | J. Chem. Eng. Data 2012, 57, 2869−28772876

(15) Bessee, G. B.; Hutzler, S. A.; Wilson, G. R. Propulsion and PowerRapid Response Research andDevelopment (R&D) Support, Delivery Order0011: Analysis of Synthetic Aviation Fuels; Southwest Research Institute,USAF AFRL Technical Report, AFRL-RZ-WP-TR-2011−2084, April.(16) Dymond, J. H.; Malhotra, R. The Tait equation: 100 years on. Int.J. Thermophys. 1988, 9, 941−951.(17) NATO, Detail Specification: Turbine Fuel, Aviation, Kerosene Type,JP-8 (NATO F-34), NATO F-35, and JP-8 + 100 (NATO F-37), MIL-DTL-83133G; Department of Defense, 30 April 2010.
Journal of Chemical & Engineering Data Article
dx.doi.org/10.1021/je3008149 | J. Chem. Eng. Data 2012, 57, 2869−28772877


![CLOSING THE CARBON CYCLE FUELS FROM AIR · DENSITY OF ENERGY CARRIERS from Prof Zuttel’s PRESENTATION 1 10 100 1000 10000 100000 0.001 0.01 0.1 1 10 100 Energy density [kWh/kg]](https://img.pdfslide.net/doc/110x75/5fdc7add1851c02f98148b76/closing-the-carbon-cycle-fuels-from-air-density-of-energy-carriers-from-prof-zuttelas.jpg)