Embed Size (px)
Citation preview
Denton ISDEconomic and Housing Analysis4Q12
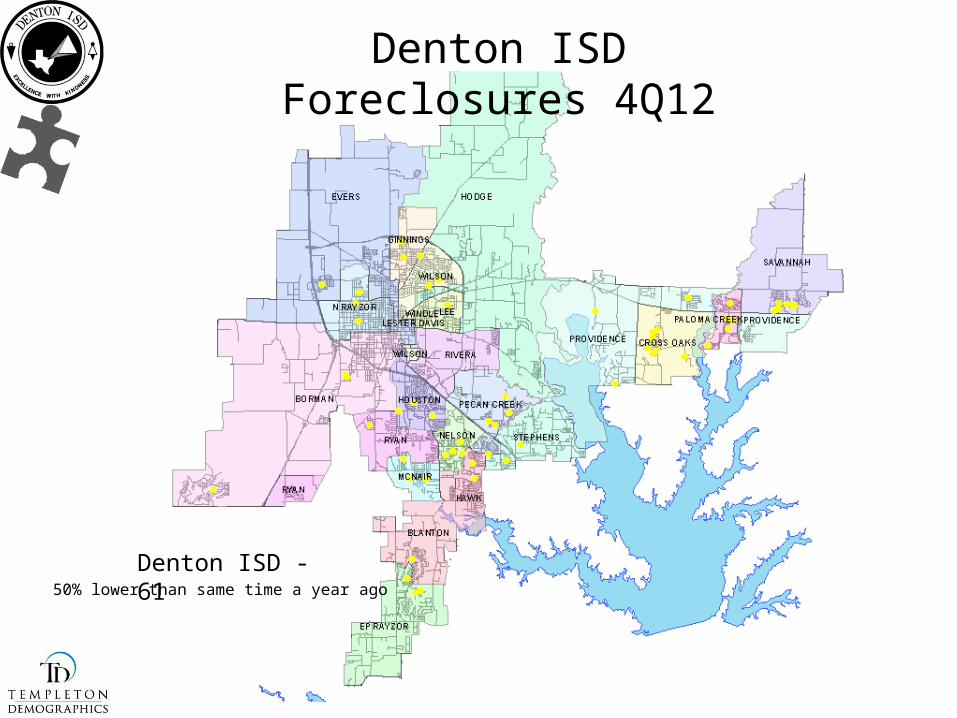
Denton ISD Foreclosures 4Q12
Denton ISD - 6150% lower than same time a year ago
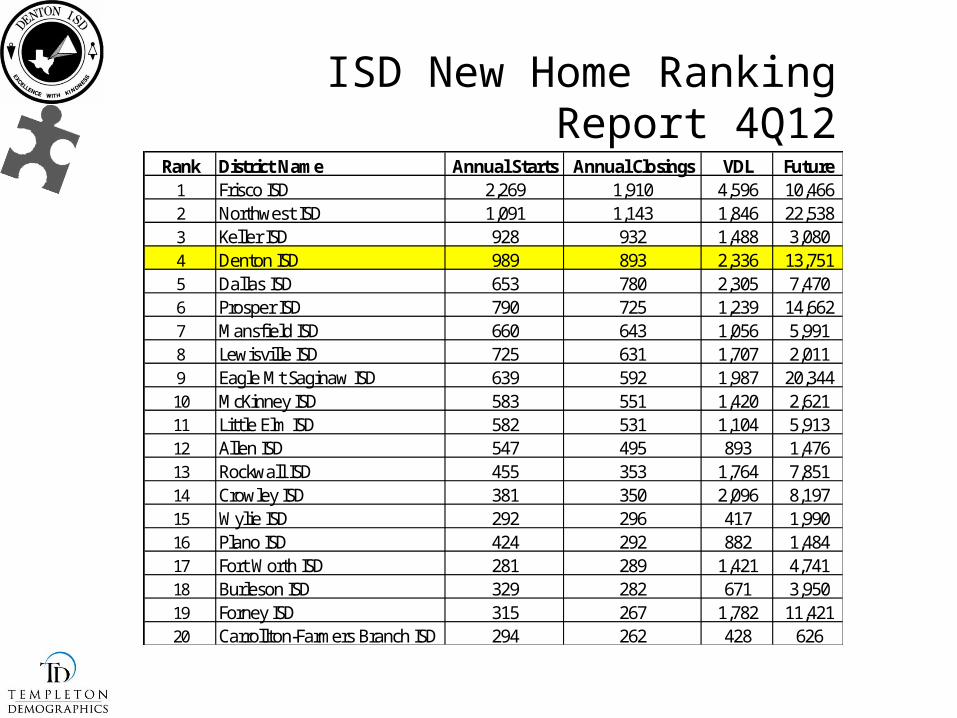
ISD New Home Ranking Report 4Q12
Rank District Name Annual Starts Annual Closings VDL Future1 Frisco ISD 2,269 1,910 4,596 10,4662 Northwest ISD 1,091 1,143 1,846 22,5383 Keller ISD 928 932 1,488 3,0804 Denton ISD 989 893 2,336 13,7515 Dallas ISD 653 780 2,305 7,4706 Prosper ISD 790 725 1,239 14,6627 Mansfield ISD 660 643 1,056 5,9918 Lewisville ISD 725 631 1,707 2,0119 Eagle Mt Saginaw ISD 639 592 1,987 20,34410 McKinney ISD 583 551 1,420 2,62111 Little Elm ISD 582 531 1,104 5,91312 Allen ISD 547 495 893 1,47613 Rockwall ISD 455 353 1,764 7,85114 Crowley ISD 381 350 2,096 8,19715 Wylie ISD 292 296 417 1,99016 Plano ISD 424 292 882 1,48417 Fort Worth ISD 281 289 1,421 4,74118 Burleson ISD 329 282 671 3,95019 Forney ISD 315 267 1,782 11,42120 Carrollton-Farmers Branch ISD 294 262 428 626
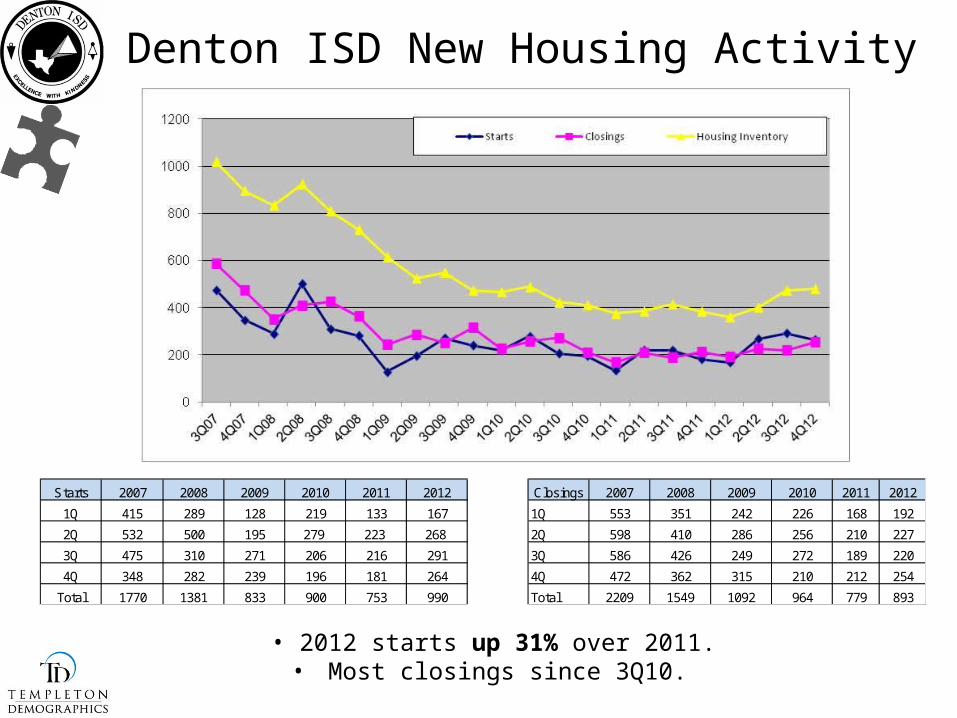
Denton ISD New Housing Activity
• 2012 starts up 31% over 2011.• Most closings since 3Q10.
Starts 2007 2008 2009 2010 2011 2012 Closings 2007 2008 2009 2010 2011 2012
1Q 415 289 128 219 133 167 1Q 553 351 242 226 168 192
2Q 532 500 195 279 223 268 2Q 598 410 286 256 210 227
3Q 475 310 271 206 216 291 3Q 586 426 249 272 189 220
4Q 348 282 239 196 181 264 4Q 472 362 315 210 212 254
Total 1770 1381 833 900 753 990 Total 2209 1549 1092 964 779 893
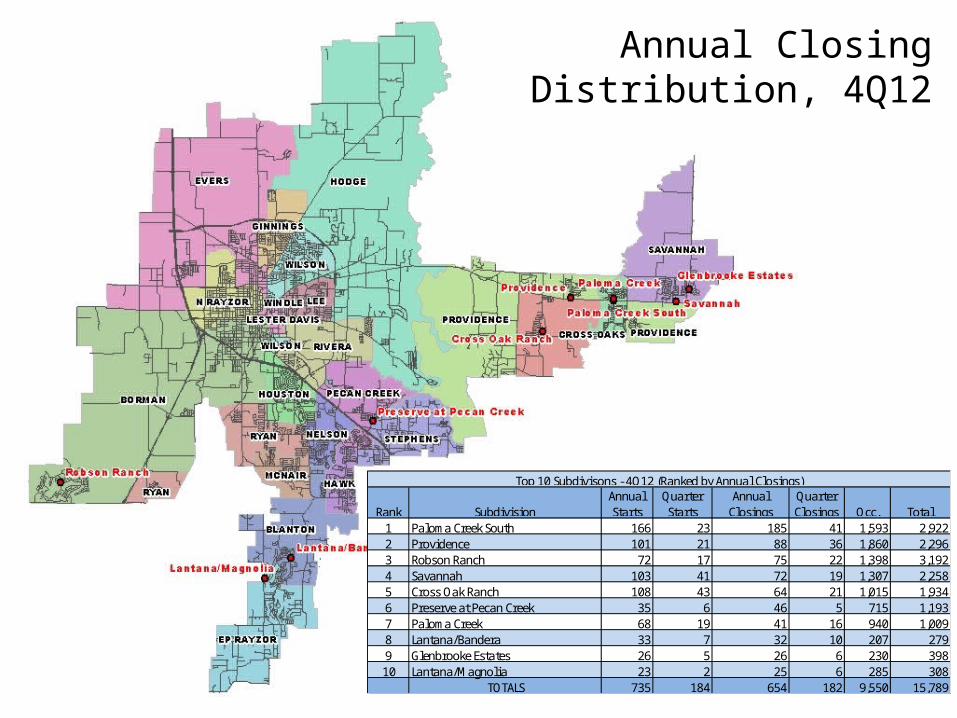
Annual ClosingDistribution, 4Q12
Rank SubdivisionAnnual Starts
Quarter Starts
Annual Closings
Quarter Closings Occ. Total
1 Paloma Creek South 166 23 185 41 1,593 2,9222 Providence 101 21 88 36 1,860 2,2963 Robson Ranch 72 17 75 22 1,398 3,1924 Savannah 103 41 72 19 1,307 2,2585 Cross Oak Ranch 108 43 64 21 1,015 1,9346 Preserve at Pecan Creek 35 6 46 5 715 1,1937 Paloma Creek 68 19 41 16 940 1,0098 Lantana/Bandera 33 7 32 10 207 2799 Glenbrooke Estates 26 5 26 6 230 398
10 Lantana/Magnolia 23 2 25 6 285 308TOTALS 735 184 654 182 9,550 15,789
Top 10 Subdivisons - 4Q12 (Ranked by Annual Closings)
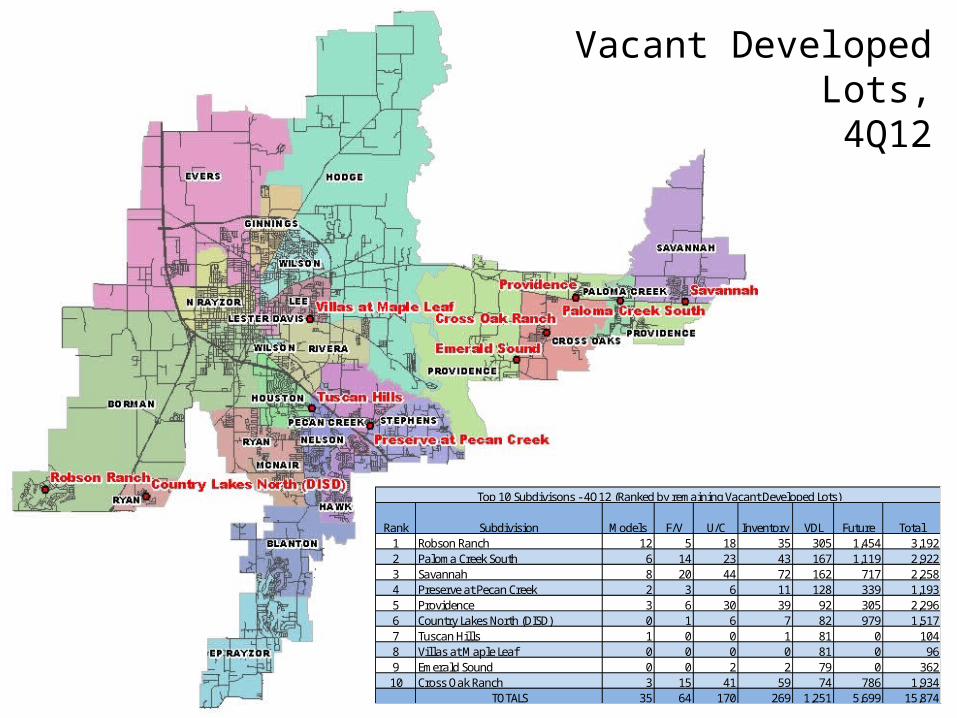
Vacant Developed Lots, 4Q12
Rank Subdivision Models F/V U/C Inventory VDL Future Total1 Robson Ranch 12 5 18 35 305 1,454 3,1922 Paloma Creek South 6 14 23 43 167 1,119 2,9223 Savannah 8 20 44 72 162 717 2,2584 Preserve at Pecan Creek 2 3 6 11 128 339 1,1935 Providence 3 6 30 39 92 305 2,2966 Country Lakes North (DISD) 0 1 6 7 82 979 1,5177 Tuscan Hills 1 0 0 1 81 0 1048 Villas at Maple Leaf 0 0 0 0 81 0 969 Emerald Sound 0 0 2 2 79 0 362
10 Cross Oak Ranch 3 15 41 59 74 786 1,934TOTALS 35 64 170 269 1,251 5,699 15,874
Top 10 Subdivisons - 4Q12 (Ranked by remaining Vacant Developed Lots)
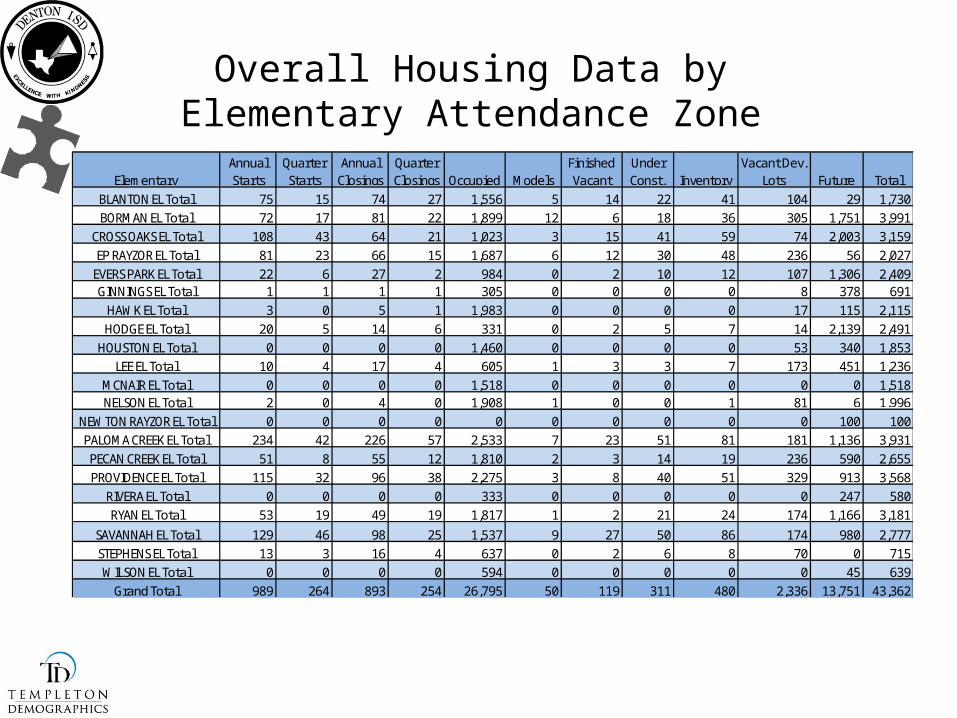
Overall Housing Data by Elementary Attendance Zone
Elementary Annual Starts
Quarter Starts
Annual Closings
Quarter Closings Occupied Models
Finished Vacant
Under Const. Inventory
Vacant Dev. Lots Future Total
BLANTON EL Total 75 15 74 27 1,556 5 14 22 41 104 29 1,730BORMAN EL Total 72 17 81 22 1,899 12 6 18 36 305 1,751 3,991
CROSS OAKS EL Total 108 43 64 21 1,023 3 15 41 59 74 2,003 3,159EP RAYZOR EL Total 81 23 66 15 1,687 6 12 30 48 236 56 2,027
EVERS PARK EL Total 22 6 27 2 984 0 2 10 12 107 1,306 2,409GINNINGS EL Total 1 1 1 1 305 0 0 0 0 8 378 691
HAWK EL Total 3 0 5 1 1,983 0 0 0 0 17 115 2,115HODGE EL Total 20 5 14 6 331 0 2 5 7 14 2,139 2,491
HOUSTON EL Total 0 0 0 0 1,460 0 0 0 0 53 340 1,853LEE EL Total 10 4 17 4 605 1 3 3 7 173 451 1,236
MCNAIR EL Total 0 0 0 0 1,518 0 0 0 0 0 0 1,518NELSON EL Total 2 0 4 0 1,908 1 0 0 1 81 6 1,996
NEWTON RAYZOR EL Total 0 0 0 0 0 0 0 0 0 0 100 100PALOMA CREEK EL Total 234 42 226 57 2,533 7 23 51 81 181 1,136 3,931PECAN CREEK EL Total 51 8 55 12 1,810 2 3 14 19 236 590 2,655PROVIDENCE EL Total 115 32 96 38 2,275 3 8 40 51 329 913 3,568
RIVERA EL Total 0 0 0 0 333 0 0 0 0 0 247 580RYAN EL Total 53 19 49 19 1,817 1 2 21 24 174 1,166 3,181
SAVANNAH EL Total 129 46 98 25 1,537 9 27 50 86 174 980 2,777STEPHENS EL Total 13 3 16 4 637 0 2 6 8 70 0 715WILSON EL Total 0 0 0 0 594 0 0 0 0 0 45 639
Grand Total 989 264 893 254 26,795 50 119 311 480 2,336 13,751 43,362
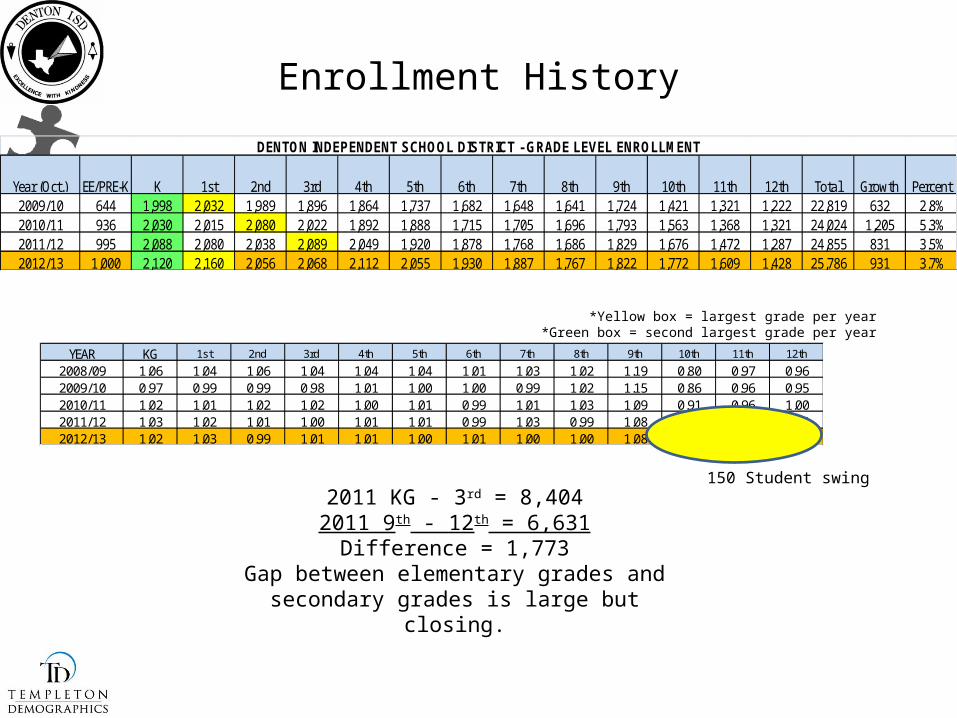
YEAR KG 1st 2nd 3rd 4th 5th 6th 7th 8th 9th 10th 11th 12th
2008/09 1.06 1.04 1.06 1.04 1.04 1.04 1.01 1.03 1.02 1.19 0.80 0.97 0.962009/10 0.97 0.99 0.99 0.98 1.01 1.00 1.00 0.99 1.02 1.15 0.86 0.96 0.952010/11 1.02 1.01 1.02 1.02 1.00 1.01 0.99 1.01 1.03 1.09 0.91 0.96 1.002011/12 1.03 1.02 1.01 1.00 1.01 1.01 0.99 1.03 0.99 1.08 0.93 0.94 0.942012/13 1.02 1.03 0.99 1.01 1.01 1.00 1.01 1.00 1.00 1.08 0.97 0.96 0.97
Enrollment History
*Yellow box = largest grade per year*Green box = second largest grade per year
2011 KG - 3rd = 8,4042011 9th - 12th = 6,631
Difference = 1,773Gap between elementary grades and secondary
grades is large but closing.
Year (Oct.) EE/PRE-K K 1st 2nd 3rd 4th 5th 6th 7th 8th 9th 10th 11th 12th Total Growth Percent2009/10 644 1,998 2,032 1,989 1,896 1,864 1,737 1,682 1,648 1,641 1,724 1,421 1,321 1,222 22,819 632 2.8%2010/11 936 2,030 2,015 2,080 2,022 1,892 1,888 1,715 1,705 1,696 1,793 1,563 1,368 1,321 24,024 1,205 5.3%2011/12 995 2,088 2,080 2,038 2,089 2,049 1,920 1,878 1,768 1,686 1,829 1,676 1,472 1,287 24,855 831 3.5%2012/13 1,000 2,120 2,160 2,056 2,068 2,112 2,055 1,930 1,887 1,767 1,822 1,772 1,609 1,428 25,786 931 3.7%
DENTON INDEPENDENT SCHOOL DISTRICT - GRADE LEVEL ENROLLMENT
150 Student swing
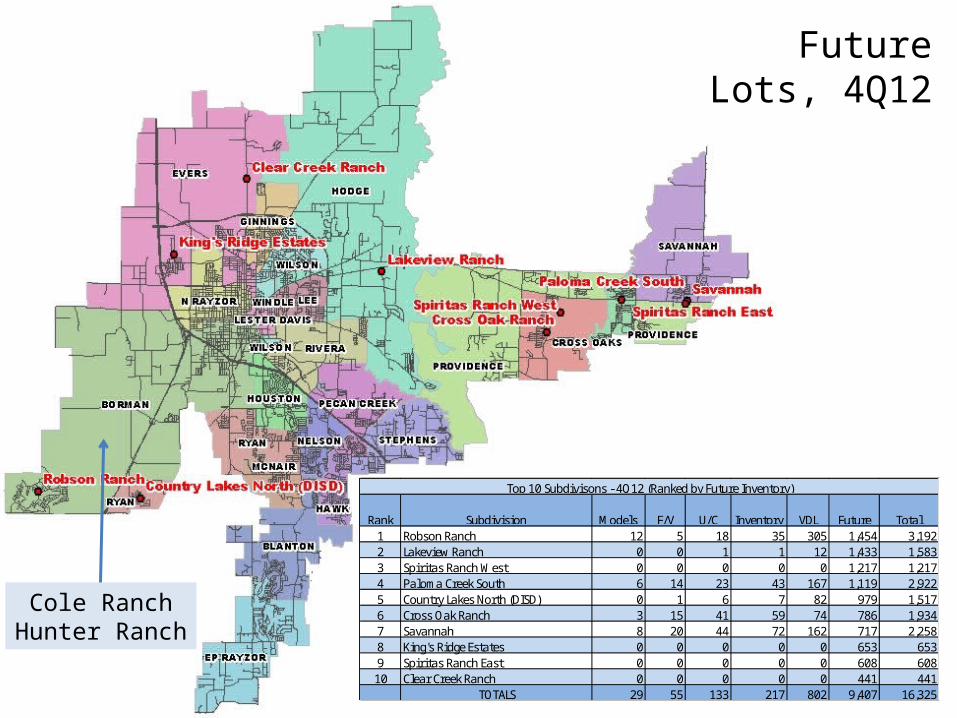
Future Lots, 4Q12
Cole RanchHunter Ranch
Rank Subdivision Models F/V U/C Inventory VDL Future Total1 Robson Ranch 12 5 18 35 305 1,454 3,1922 Lakeview Ranch 0 0 1 1 12 1,433 1,5833 Spiritas Ranch West 0 0 0 0 0 1,217 1,2174 Paloma Creek South 6 14 23 43 167 1,119 2,9225 Country Lakes North (DISD) 0 1 6 7 82 979 1,5176 Cross Oak Ranch 3 15 41 59 74 786 1,9347 Savannah 8 20 44 72 162 717 2,2588 King's Ridge Estates 0 0 0 0 0 653 6539 Spiritas Ranch East 0 0 0 0 0 608 608
10 Clear Creek Ranch 0 0 0 0 0 441 441TOTALS 29 55 133 217 802 9,407 16,325
Top 10 Subdivisons - 4Q12 (Ranked by Future Inventory)
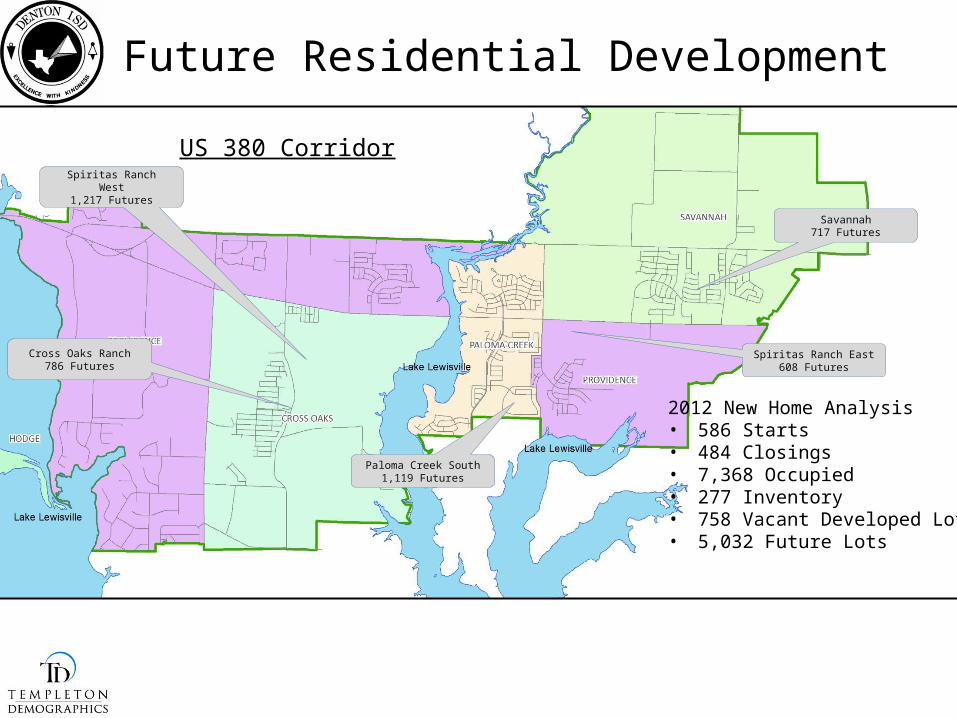
US 380 Corridor
Future Residential Development
2012 New Home Analysis• 586 Starts• 484 Closings• 7,368 Occupied• 277 Inventory• 758 Vacant Developed Lots• 5,032 Future Lots
Spiritas Ranch West1,217 Futures
Cross Oaks Ranch786 Futures
Paloma Creek South1,119 Futures
Spiritas Ranch East608 Futures
Savannah717 Futures
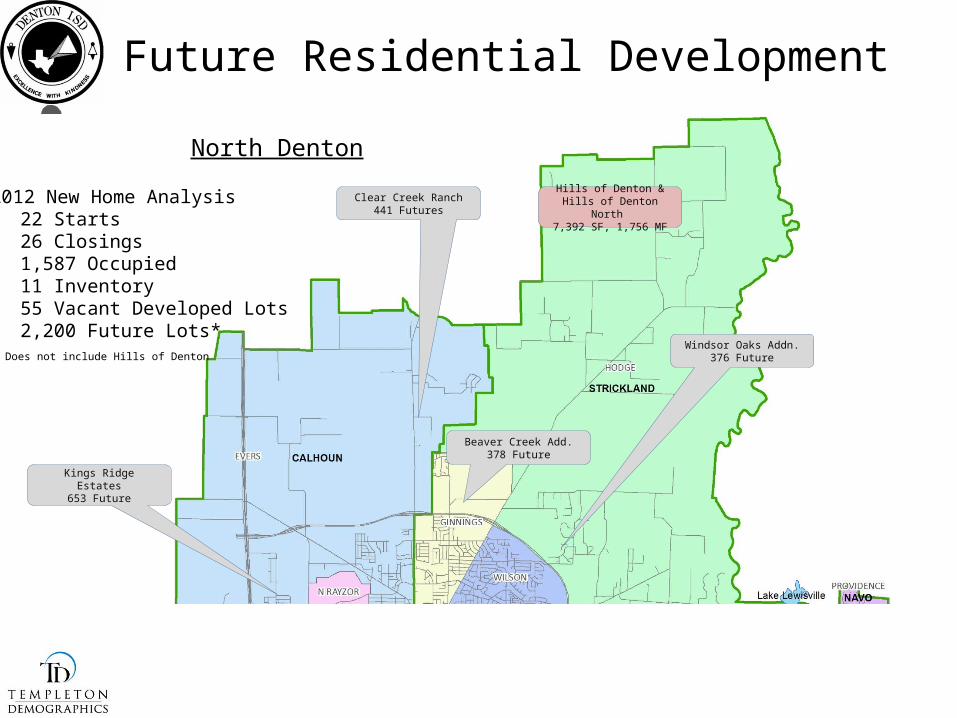
North Denton
Future Residential Development
2012 New Home Analysis• 22 Starts• 26 Closings• 1,587 Occupied• 11 Inventory• 55 Vacant Developed Lots• 2,200 Future Lots*
Kings Ridge Estates653 Future
Clear Creek Ranch441 Futures
Beaver Creek Add.378 Future
Windsor Oaks Addn.376 Future* Does not include Hills of Denton
Hills of Denton & Hills of Denton North
7,392 SF, 1,756 MF
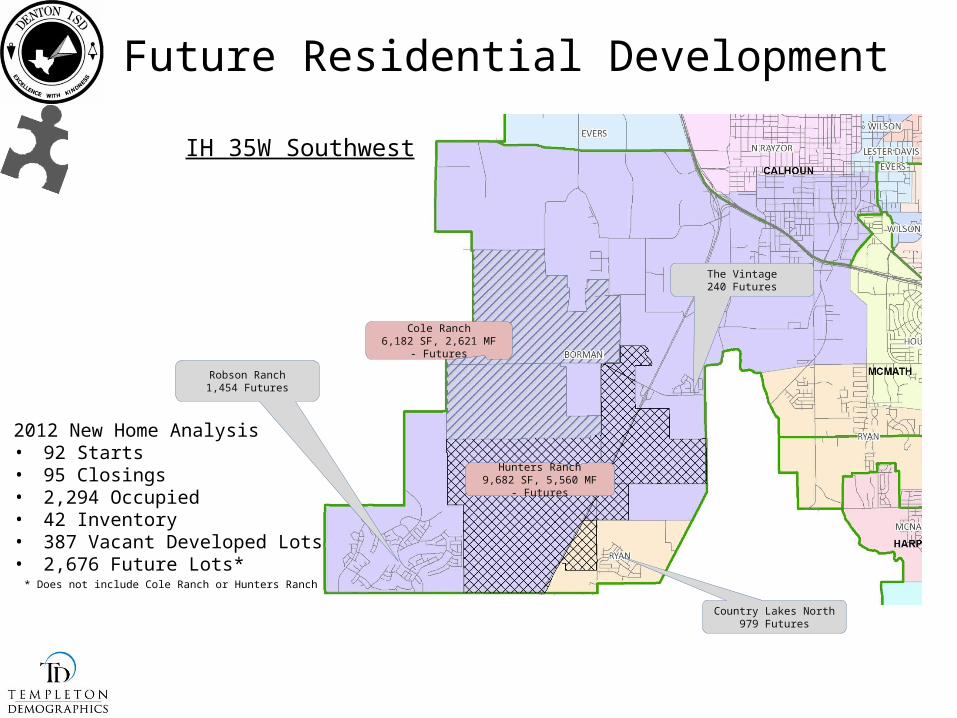
IH 35W Southwest
Future Residential Development
2012 New Home Analysis• 92 Starts• 95 Closings• 2,294 Occupied• 42 Inventory• 387 Vacant Developed Lots• 2,676 Future Lots*
Cole Ranch6,182 SF, 2,621 MF - Futures
Robson Ranch1,454 Futures
Hunters Ranch9,682 SF, 5,560 MF - Futures
Country Lakes North979 Futures
The Vintage240 Futures
* Does not include Cole Ranch or Hunters Ranch
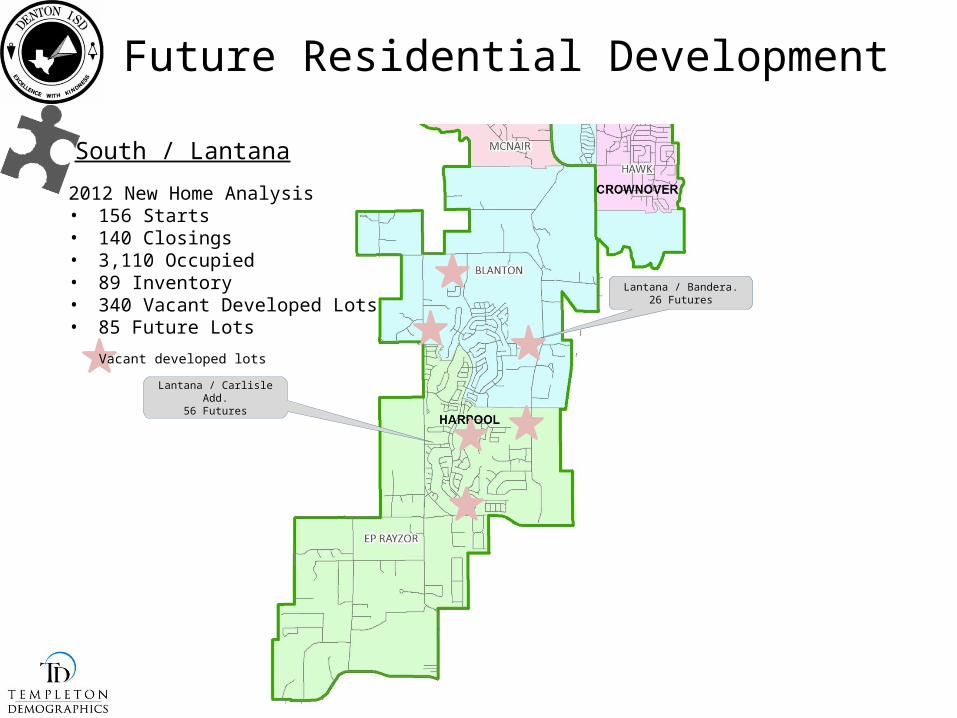
South / Lantana
Future Residential Development
2012 New Home Analysis• 156 Starts• 140 Closings• 3,110 Occupied• 89 Inventory• 340 Vacant Developed Lots• 85 Future Lots
Lantana / Carlisle Add.56 Futures
Lantana / Bandera.26 Futures
Vacant developed lots
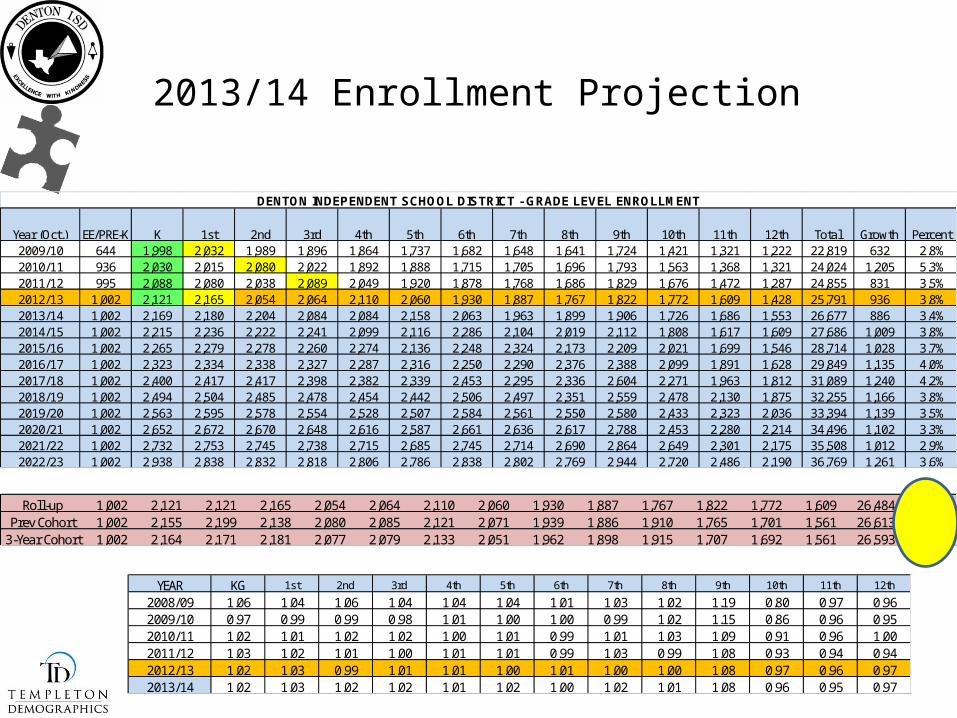
2013/14 Enrollment Projection
Year (Oct.) EE/PRE-K K 1st 2nd 3rd 4th 5th 6th 7th 8th 9th 10th 11th 12th Total Growth Percent2009/10 644 1,998 2,032 1,989 1,896 1,864 1,737 1,682 1,648 1,641 1,724 1,421 1,321 1,222 22,819 632 2.8%2010/11 936 2,030 2,015 2,080 2,022 1,892 1,888 1,715 1,705 1,696 1,793 1,563 1,368 1,321 24,024 1,205 5.3%2011/12 995 2,088 2,080 2,038 2,089 2,049 1,920 1,878 1,768 1,686 1,829 1,676 1,472 1,287 24,855 831 3.5%2012/13 1,002 2,121 2,165 2,054 2,064 2,110 2,060 1,930 1,887 1,767 1,822 1,772 1,609 1,428 25,791 936 3.8%2013/14 1,002 2,169 2,180 2,204 2,084 2,084 2,158 2,063 1,963 1,899 1,906 1,726 1,686 1,553 26,677 886 3.4%2014/15 1,002 2,215 2,236 2,222 2,241 2,099 2,116 2,286 2,104 2,019 2,112 1,808 1,617 1,609 27,686 1,009 3.8%2015/16 1,002 2,265 2,279 2,278 2,260 2,274 2,136 2,248 2,324 2,173 2,209 2,021 1,699 1,546 28,714 1,028 3.7%2016/17 1,002 2,323 2,334 2,338 2,327 2,287 2,316 2,250 2,290 2,376 2,388 2,099 1,891 1,628 29,849 1,135 4.0%2017/18 1,002 2,400 2,417 2,417 2,398 2,382 2,339 2,453 2,295 2,336 2,604 2,271 1,963 1,812 31,089 1,240 4.2%2018/19 1,002 2,494 2,504 2,485 2,478 2,454 2,442 2,506 2,497 2,351 2,559 2,478 2,130 1,875 32,255 1,166 3.8%2019/20 1,002 2,563 2,595 2,578 2,554 2,528 2,507 2,584 2,561 2,550 2,580 2,433 2,323 2,036 33,394 1,139 3.5%2020/21 1,002 2,652 2,672 2,670 2,648 2,616 2,587 2,661 2,636 2,617 2,788 2,453 2,280 2,214 34,496 1,102 3.3%2021/22 1,002 2,732 2,753 2,745 2,738 2,715 2,685 2,745 2,714 2,690 2,864 2,649 2,301 2,175 35,508 1,012 2.9%2022/23 1,002 2,938 2,838 2,832 2,818 2,806 2,786 2,838 2,802 2,769 2,944 2,720 2,486 2,190 36,769 1,261 3.6%
DENTON INDEPENDENT SCHOOL DISTRICT - GRADE LEVEL ENROLLMENT
Roll-up 1,002 2,121 2,121 2,165 2,054 2,064 2,110 2,060 1,930 1,887 1,767 1,822 1,772 1,609 26,484 693Prev Cohort 1,002 2,155 2,199 2,138 2,080 2,085 2,121 2,071 1,939 1,886 1,910 1,765 1,701 1,561 26,613 822
3-Year Cohort 1,002 2,164 2,171 2,181 2,077 2,079 2,133 2,051 1,962 1,898 1,915 1,707 1,692 1,561 26,593 802
YEAR KG 1st 2nd 3rd 4th 5th 6th 7th 8th 9th 10th 11th 12th
2008/09 1.06 1.04 1.06 1.04 1.04 1.04 1.01 1.03 1.02 1.19 0.80 0.97 0.962009/10 0.97 0.99 0.99 0.98 1.01 1.00 1.00 0.99 1.02 1.15 0.86 0.96 0.952010/11 1.02 1.01 1.02 1.02 1.00 1.01 0.99 1.01 1.03 1.09 0.91 0.96 1.002011/12 1.03 1.02 1.01 1.00 1.01 1.01 0.99 1.03 0.99 1.08 0.93 0.94 0.942012/13 1.02 1.03 0.99 1.01 1.01 1.00 1.01 1.00 1.00 1.08 0.97 0.96 0.972013/14 1.02 1.03 1.02 1.02 1.01 1.02 1.00 1.02 1.01 1.08 0.96 0.95 0.97
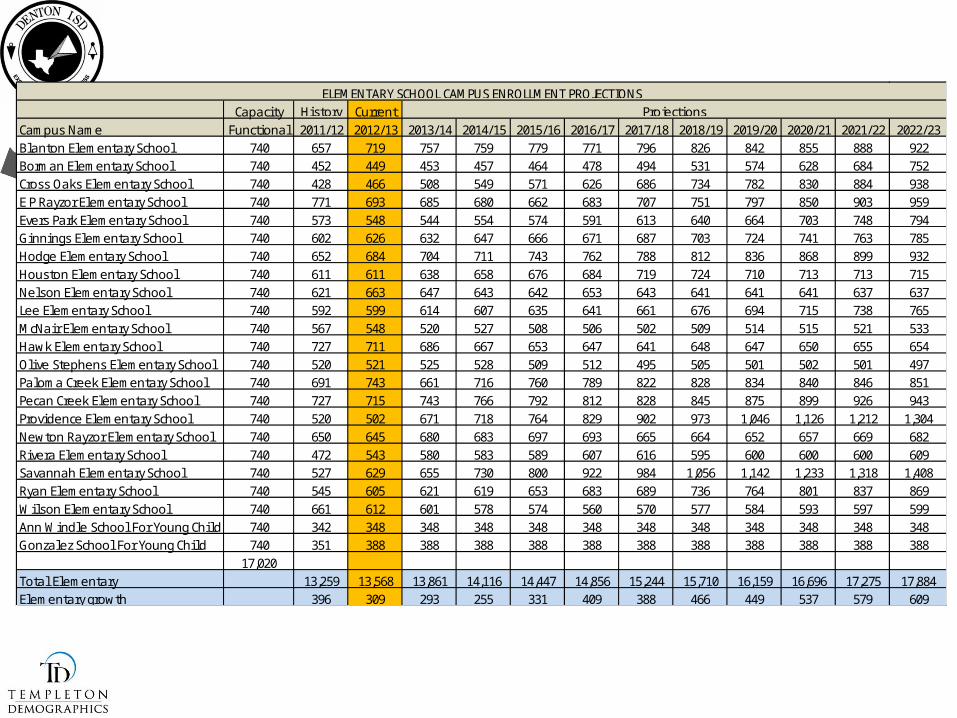
Capaci ty CurrentCampus Name Functional 2011/12 2012/13 2013/14 2014/15 2015/16 2016/17 2017/18 2018/19 2019/20 2020/21 2021/22 2022/23Blanton Elementary School 740 657 719 757 759 779 771 796 826 842 855 888 922Borman Elementary School 740 452 449 453 457 464 478 494 531 574 628 684 752Cross Oaks Elementary School 740 428 466 508 549 571 626 686 734 782 830 884 938E P Rayzor Elementary School 740 771 693 685 680 662 683 707 751 797 850 903 959Evers Park Elementary School 740 573 548 544 554 574 591 613 640 664 703 748 794Ginnings Elementary School 740 602 626 632 647 666 671 687 703 724 741 763 785Hodge Elementary School 740 652 684 704 711 743 762 788 812 836 868 899 932Houston Elementary School 740 611 611 638 658 676 684 719 724 710 713 713 715Nelson Elementary School 740 621 663 647 643 642 653 643 641 641 641 637 637Lee Elementary School 740 592 599 614 607 635 641 661 676 694 715 738 765McNair Elementary School 740 567 548 520 527 508 506 502 509 514 515 521 533Hawk Elementary School 740 727 711 686 667 653 647 641 648 647 650 655 654Ol ive Stephens Elementary School 740 520 521 525 528 509 512 495 505 501 502 501 497Paloma Creek Elementary School 740 691 743 661 716 760 789 822 828 834 840 846 851Pecan Creek Elementary School 740 727 715 743 766 792 812 828 845 875 899 926 943Providence Elementary School 740 520 502 671 718 764 829 902 973 1,046 1,126 1,212 1,304Newton Rayzor Elementary School 740 650 645 680 683 697 693 665 664 652 657 669 682Rivera Elementary School 740 472 543 580 583 589 607 616 595 600 600 600 609Savannah Elementary School 740 527 629 655 730 800 922 984 1,056 1,142 1,233 1,318 1,408Ryan Elementary School 740 545 605 621 619 653 683 689 736 764 801 837 869Wilson Elementary School 740 661 612 601 578 574 560 570 577 584 593 597 599Ann Windle School For Young Chi ld 740 342 348 348 348 348 348 348 348 348 348 348 348Gonzalez School For Young Chi ld 740 351 388 388 388 388 388 388 388 388 388 388 388
17,020Tota l Elementary 13,259 13,568 13,861 14,116 14,447 14,856 15,244 15,710 16,159 16,696 17,275 17,884Elementary growth 396 309 293 255 331 409 388 466 449 537 579 609
ELEMENTARY SCHOOL CAMPUS ENROLLMENT PROJECTIONSProjectionsHistory
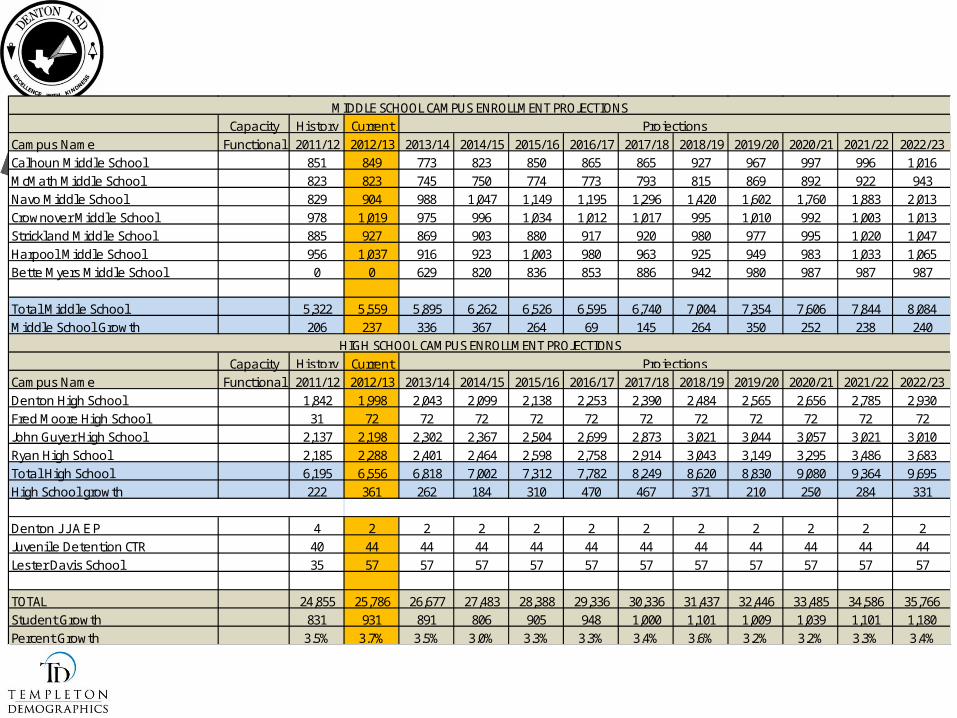
Capaci ty CurrentCampus Name Functional 2011/12 2012/13 2013/14 2014/15 2015/16 2016/17 2017/18 2018/19 2019/20 2020/21 2021/22 2022/23Calhoun Middle School 851 849 773 823 850 865 865 927 967 997 996 1,016McMath Middle School 823 823 745 750 774 773 793 815 869 892 922 943Navo Middle School 829 904 988 1,047 1,149 1,195 1,296 1,420 1,602 1,760 1,883 2,013Crownover Middle School 978 1,019 975 996 1,034 1,012 1,017 995 1,010 992 1,003 1,013Strickland Middle School 885 927 869 903 880 917 920 980 977 995 1,020 1,047Harpool Middle School 956 1,037 916 923 1,003 980 963 925 949 983 1,033 1,065Bette Myers Middle School 0 0 629 820 836 853 886 942 980 987 987 987
Tota l Middle School 5,322 5,559 5,895 6,262 6,526 6,595 6,740 7,004 7,354 7,606 7,844 8,084Middle School Growth 206 237 336 367 264 69 145 264 350 252 238 240
Capaci ty CurrentCampus Name Functional 2011/12 2012/13 2013/14 2014/15 2015/16 2016/17 2017/18 2018/19 2019/20 2020/21 2021/22 2022/23Denton High School 1,842 1,998 2,043 2,099 2,138 2,253 2,390 2,484 2,565 2,656 2,785 2,930Fred Moore High School 31 72 72 72 72 72 72 72 72 72 72 72John Guyer High School 2,137 2,198 2,302 2,367 2,504 2,699 2,873 3,021 3,044 3,057 3,021 3,010Ryan High School 2,185 2,288 2,401 2,464 2,598 2,758 2,914 3,043 3,149 3,295 3,486 3,683Tota l High School 6,195 6,556 6,818 7,002 7,312 7,782 8,249 8,620 8,830 9,080 9,364 9,695High School growth 222 361 262 184 310 470 467 371 210 250 284 331
Denton J J A E P 4 2 2 2 2 2 2 2 2 2 2 2Juveni le Detention CTR 40 44 44 44 44 44 44 44 44 44 44 44Lester Davis School 35 57 57 57 57 57 57 57 57 57 57 57
TOTAL 24,855 25,786 26,677 27,483 28,388 29,336 30,336 31,437 32,446 33,485 34,586 35,766Student Growth 831 931 891 806 905 948 1,000 1,101 1,009 1,039 1,101 1,180Percent Growth 3.5% 3.7% 3.5% 3.0% 3.3% 3.3% 3.4% 3.6% 3.2% 3.2% 3.3% 3.4%
History ProjectionsHIGH SCHOOL CAMPUS ENROLLMENT PROJECTIONS
MIDDLE SCHOOL CAMPUS ENROLLMENT PROJECTIONSHistory Projections
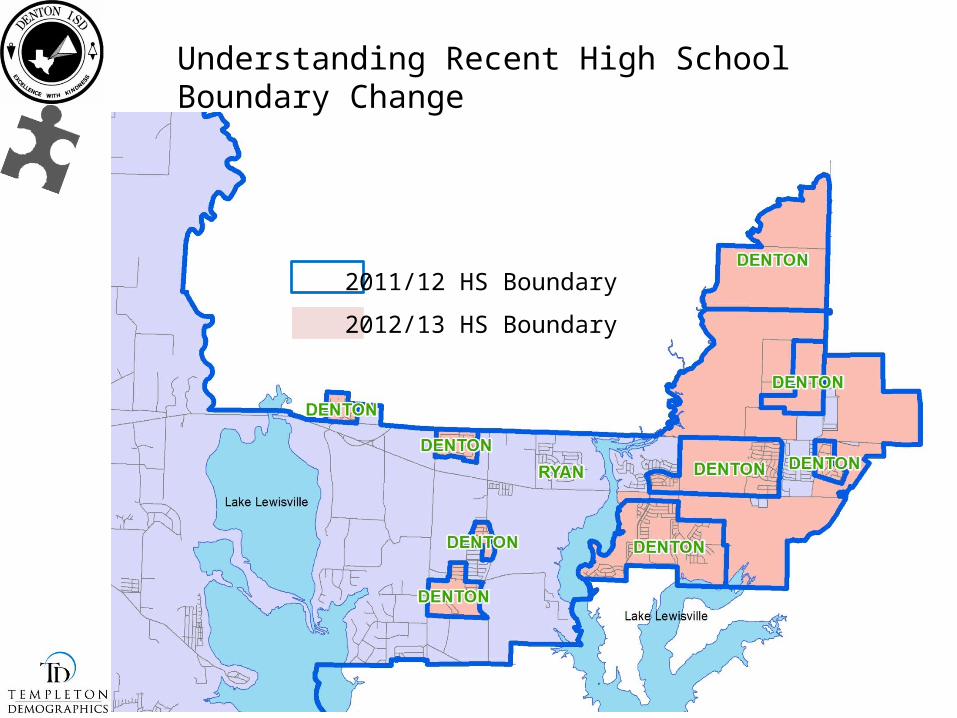
2011/12 HS Boundary
2012/13 HS Boundary
Understanding Recent High School Boundary Change
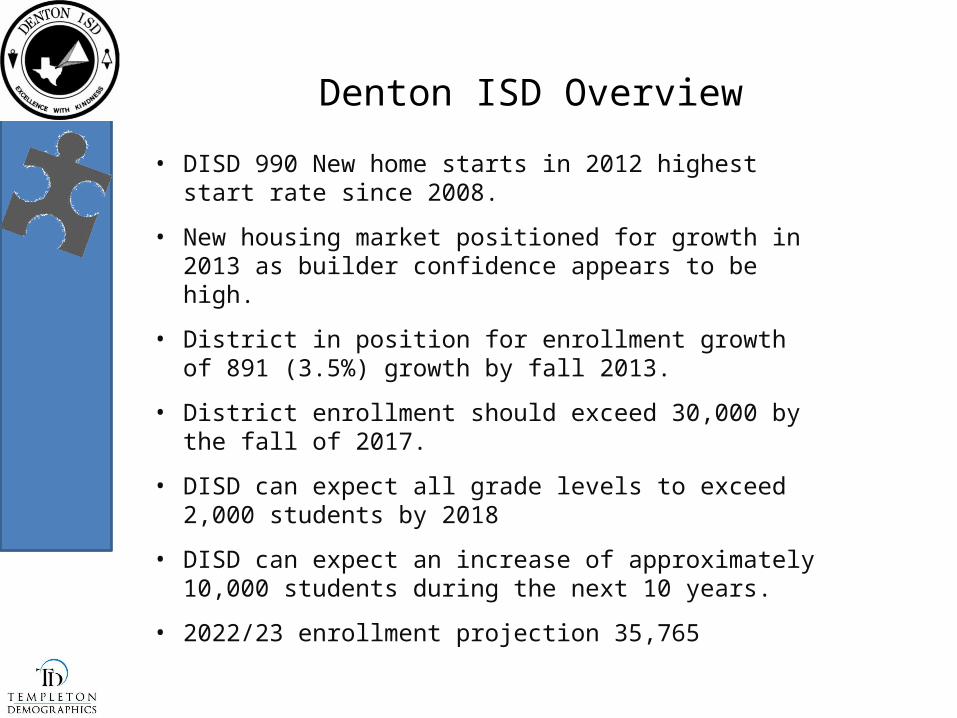
• DISD 990 New home starts in 2012 highest start rate since 2008.
• New housing market positioned for growth in 2013 as builder confidence appears to be high.
• District in position for enrollment growth of 891 (3.5%) growth by fall 2013.
• District enrollment should exceed 30,000 by the fall of 2017.
• DISD can expect all grade levels to exceed 2,000 students by 2018
• DISD can expect an increase of approximately 10,000 students during the next 10 years.
• 2022/23 enrollment projection 35,765
Denton ISD Overview