Embed Size (px)
Citation preview
DEPARTMENT FOR EDUCATION
CONSOLIDATED ANNUAL REPORT AND ACCOUNTS
For the year ended 31 March 2018
3DfE CONSOLIDATED ANNUAL REPORT AND ACCOUNTS 2017-18
DEPARTMENT FOR EDUCATION
CONSOLIDATED ANNUAL REPORT AND ACCOUNTS
For the year ended 31 March 2018
Ordered by the House of Commons to be printed on 23 July 2018Accounts presented to House of Commons pursuant to Section 6(4) of the Government Resources and Accounts Act 2000Annual Report presented to the House of Commons by Command of Her Majesty
HC 1288

4 DfE CONSOLIDATED ANNUAL REPORT AND ACCOUNTS 2017-18
© Crown copyright 2018
This publication is licensed under the terms of the Open Government Licence v3.0 except where otherwise stated. To view this licence, visit nationalarchives.gov.uk/doc/open-government-licence/version/3
Where we have identified any third party copyright information you will need to obtain permission from the copyright holders concerned.
This publication is available at www.gov.uk/government/publications
Any enquiries regarding this publication should be sent to us at Department for Education, Sanctuary Buildings, Great Smith Street, London. SW1P 3BT
ISBN 978-1-5286-0629-5
CCS0618974272
Printed on paper containing 75% recycled fibre content minimum
Printed in the UK by the APS Group on behalf of the Controller of Her Majesty’s Stationery Office
5DfE CONSOLIDATED ANNUAL REPORT AND ACCOUNTS 2017-18
CONTENTS
PERFORMANCE REPORTPermanent Secretary’s overview .............................................................................................................. 8
Lead non-executive’s overview .............................................................................................................. 11
Performance overview ........................................................................................................................... 13
Financial review of the year .................................................................................................................... 45
ACCOUNTABILITY REPORTCorporate governance report ................................................................................................................ 55
Governance statement .......................................................................................................................... 64
Remuneration and staff report ............................................................................................................... 80
Parliamentary accountability and audit report ......................................................................................... 97
FINANCIAL STATEMENTSConsolidated Statement of Comprehensive Net Expenditure ............................................................... 119
Consolidated Statement of Financial Position ...................................................................................... 120
Consolidated Statement of Cash Flows ............................................................................................... 121
Consolidated Statement of Changes in Taxpayers’ Equity .................................................................... 123
Department & Agencies Statement of Changes in Taxpayers’ Equity ................................................... 124
Notes to the Accounts ......................................................................................................................... 125
ANNEXESAnnex A – Departmental statistics ....................................................................................................... 169
Annex B – Data tables ......................................................................................................................... 173
Glossary of key terms .......................................................................................................................... 180


PERFORMANCE REPORT

8 DfE CONSOLIDATED ANNUAL REPORT AND ACCOUNTS 2017-18
PERMANENT SECRETARY’S OVERVIEW
I am pleased to be introducing the 2017-18 Annual Report and Accounts (ARA), which sets out the Department’s key achievements and progress against our strategic and corporate objectives over the past financial year.
As ever it has been another busy year, during which time we welcomed the Rt Hon Damian Hinds MP as our new Secretary of State in January 2018. I would like to take this opportunity to thank the outgoing Secretary of State, Minister for Women and Equalities the Rt Hon Justine Greening MP for her leadership of the Department over the past year, with a strong focus on improving social mobility, as set out in the action plan published in December 2017.
The Department is responsible for children’s services and for education and training in England, including Early Years, schools, Further and Higher Education, apprenticeships and skills. This year the Department brought together the responsibilities of the Education Funding Agency (EFA) and the Skills Funding Agency (SFA) to create the Education & Skills Funding Agency (ESFA). The ESFA is accountable for funding education and training for children, young people and adults.
As well as the formation of the ESFA, the Department reviewed the functions of the National College for Teaching and Leadership (NCTL), and made a decision to repurpose the agency. On 1 April 2018, the majority of NCTL’s operations were transferred over to the Department, creating the opportunity for seamless
policy and delivery work on recruiting, developing and retaining teachers and leaders. NCTL has been renamed the Teaching Regulation Agency (TRA) and continues to lead on the regulation of the teaching profession, including misconduct hearings. In January 2018, following a cabinet reshuffle, all Ministerial posts for the Government Equalities Office (GEO) and the Equality and Human Rights Commission (EHRC) were moved, first to the Home Office and then to the Department for International Development.
In October 2017, the Department also published the first Academy Sector Annual Report and Accounts (SARA)1 for 2015/16. This aligned the reporting of financial results with educational performance, and has provided greater visibility of academies’ funding and spending.
We have a strong Department which is constantly working to deliver excellent results while providing value for money. Achievements over the last year include:
• Introducing a new national funding formulafor schools and high needs, which will besupported by an additional £1.3 billion offunding over 2018-19 and 2019-20. This is themost significant improvement to the schooland high needs funding system for well overa decade, and will ensure that for the first timefunding will be distributed fairly and consistentlyaccording to a formula based on the needs andcharacteristics of every school and local areaacross the country.
• Successfully completing the first securitisationof a portfolio of ICR (income contingentrepayment) student loans, generating£1.7 billion of proceeds for the Exchequer.The loan sale programme aims to generatebetween £9.2 billion and £12 billion in proceedsby 2021-22, supporting the Chancellor’s fiscalmandate to reduce Public Sector Net Debt.
• Publishing ambitious delivery plans for eachof the 12 Opportunity Areas. These followeddetailed analysis of the unique social mobilitychallenges each area faces, looking at a rangeof outcomes, from Early Years to post-19.
1 https://www.gov.uk/government/publications/academies-consolidated-annual-report-and-accounts-2015-to-2016
9DfE CONSOLIDATED ANNUAL REPORT AND ACCOUNTS 2017-18
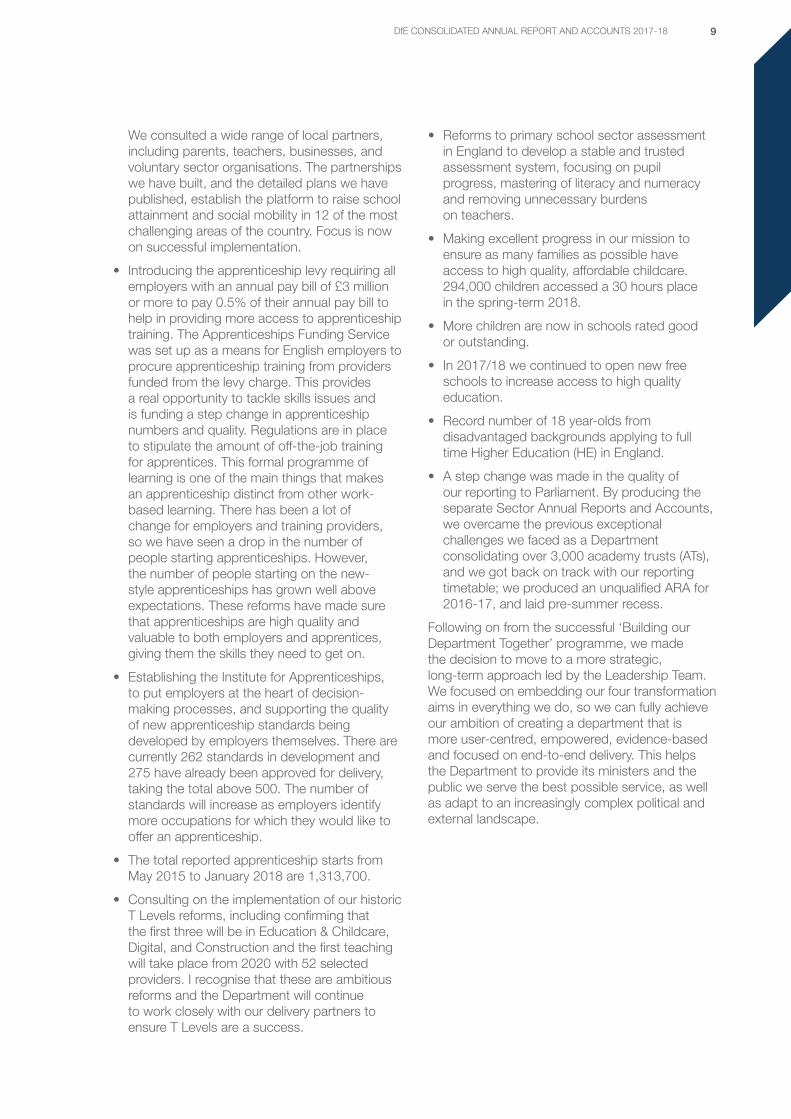
We consulted a wide range of local partners, including parents, teachers, businesses, and voluntary sector organisations. The partnerships we have built, and the detailed plans we have published, establish the platform to raise school attainment and social mobility in 12 of the most challenging areas of the country. Focus is now on successful implementation.
• Introducing the apprenticeship levy requiring all employers with an annual pay bill of £3 million or more to pay 0.5% of their annual pay bill to help in providing more access to apprenticeship training. The Apprenticeships Funding Service was set up as a means for English employers to procure apprenticeship training from providers funded from the levy charge. This provides a real opportunity to tackle skills issues and is funding a step change in apprenticeship numbers and quality. Regulations are in place to stipulate the amount of off-the-job training for apprentices. This formal programme of learning is one of the main things that makes an apprenticeship distinct from other work-based learning. There has been a lot of change for employers and training providers, so we have seen a drop in the number of people starting apprenticeships. However, the number of people starting on the new-style apprenticeships has grown well above expectations. These reforms have made sure that apprenticeships are high quality and valuable to both employers and apprentices, giving them the skills they need to get on.
• Establishing the Institute for Apprenticeships, to put employers at the heart of decision-making processes, and supporting the quality of new apprenticeship standards being developed by employers themselves. There are currently 262 standards in development and 275 have already been approved for delivery, taking the total above 500. The number of standards will increase as employers identify more occupations for which they would like to offer an apprenticeship.
• The total reported apprenticeship starts from May 2015 to January 2018 are 1,313,700.
• Consulting on the implementation of our historic T Levels reforms, including confirming that the first three will be in Education & Childcare, Digital, and Construction and the first teaching will take place from 2020 with 52 selected providers. I recognise that these are ambitious reforms and the Department will continue to work closely with our delivery partners to ensure T Levels are a success.
• Reforms to primary school sector assessment in England to develop a stable and trusted assessment system, focusing on pupil progress, mastering of literacy and numeracy and removing unnecessary burdens on teachers.
• Making excellent progress in our mission to ensure as many families as possible have access to high quality, affordable childcare. 294,000 children accessed a 30 hours place in the spring-term 2018.
• More children are now in schools rated good or outstanding.
• In 2017/18 we continued to open new free schools to increase access to high quality education.
• Record number of 18 year-olds from disadvantaged backgrounds applying to full time Higher Education (HE) in England.
• A step change was made in the quality of our reporting to Parliament. By producing the separate Sector Annual Reports and Accounts, we overcame the previous exceptional challenges we faced as a Department consolidating over 3,000 academy trusts (ATs), and we got back on track with our reporting timetable; we produced an unqualified ARA for 2016-17, and laid pre-summer recess.
Following on from the successful ‘Building our Department Together’ programme, we made the decision to move to a more strategic, long-term approach led by the Leadership Team. We focused on embedding our four transformation aims in everything we do, so we can fully achieve our ambition of creating a department that is more user-centred, empowered, evidence-based and focused on end-to-end delivery. This helps the Department to provide its ministers and the public we serve the best possible service, as well as adapt to an increasingly complex political and external landscape.
10 DfE CONSOLIDATED ANNUAL REPORT AND ACCOUNTS 2017-18
The Department was named by Business in the Community as one of the UK’s best employers for race in 2017 and featured in the Top 100 of Stonewall’s Workplace Equality Index.2 Whilst these are achievements to be celebrated, we remain focused on promoting and attracting an ever more diverse range of talent, ensuring a more inclusive culture, allowing us to effectively deliver the Department’s agenda and contribute to the wider civil service goal of being the UK’s most inclusive employer by 2020.
I am immensely proud of all staff within the Department, its executive agencies (Agencies) and our non-departmental public bodies (NDPBs) who are delivering the Department’s priorities and ambitions through a period of major change for the government and the country. As always, I am confident that the Department will continue to serve ministers, Parliament and the public well in the future.
Jonathan SlaterPermanent Secretary9 July 2018
2 https://www.stonewall.org.uk/full-list-top-100-employers-2018
11DfE CONSOLIDATED ANNUAL REPORT AND ACCOUNTS 2017-18
LEAD NON-EXECUTIVE’S OVERVIEW
I joined the Department as the Lead Non-executive board member in October 2017. It is an honour to have this appointment and I look forward to supporting the Department to achieve its objectives. I am grateful to my fellow non-executive board members, who shared the responsibilities of lead in the first part of the year.
In 2017-18 the Departmental Board and its committees underwent reform in several areas to improve the Department’s governance and organisational structure, so that it can effectively support the Department’s challenging and ambitious programme of delivery.
Full information on membership changes and the roles of committees can be found in the Governance Statement.
DEPARTMENTAL BOARDThe Board met four times in 2017-18 and its agenda over the year included performance and risk, commercial capability, Departmental transformation and business planning.
The Board had a change to its chair with the arrival of a new Secretary of State in January 2018. As part of our governance review, the membership of the Board was also revised with the aim of creating a smaller, more focused body, with a roughly even balance of ministerial, official and non-executive members. I am especially grateful to the Rt Hon Anne Milton MP, who agreed to support the chair as Minister for the Board, and to the continued membership of the Rt Hon Nick Gibb MP.
Two non-executive members left the Board in 2017-18: Marion Plant and David Meller. I am delighted that Marion is continuing to provide a valuable contribution to the Department as an ambassador for the T Level programme and as an advisor on Further Education. Ruby McGregor-Smith and Ian Ferguson continue as board members.
COMMITTEESThe Audit and Risk Committee (ARC) continued under the chairmanship of Ian Ferguson. I have also joined the committee. The ARC has focused on addressing the technical accounting challenges surrounding the Departmental accounts. The ARC welcomed the unqualified audit opinion of the 2016-17 accounts. The ARC also scrutinised the consolidation of all academy trusts into a separate SARA, which was laid before parliament for the first time in October 2017. The ARC continued to be diligent in reviewing the Department’s approach to risk management and financial control.
Ian Ferguson, chair of the Audit and Risk Committee, also set up a network of audit committee chairs from across the Department’s arm’s length bodies (our executive agencies and non-departmental public bodies), which met twice. This network provides line of sight to and from the Department, and allows for sharing of best practice.
We established a Nominations Committee, previously missing from our governance structure. The committee provides assurance on the Department’s public appointments processes, oversees the Department’s own non-executive appointments, and supports the Permanent Secretary in talent management and succession planning for the Department’s most senior officials.
The Performance Committee was wound down in December 2017 and was refreshed as the Implementation Committee, which I chair. The Performance Committee did good work focusing on delivery of the Secretary of State’s priorities. However, as Implementation Committee, the committee will also have a wider remit to consider how the organisation is set up to deliver, in recognition of the Departmental transformation
12 DfE CONSOLIDATED ANNUAL REPORT AND ACCOUNTS 2017-18
initiated by the Permanent Secretary. This will complement the work that the non-executive team do outside of formal committee time to advise on the delivery of major projects.
Leadership Team (formerly Management Committee) and its sub committees continued to meet regularly, with its Finance and Investment Committee broadening its remit to consider a wider range of performance, risk and resourcing issues. I am grateful to the Permanent Secretary and his executive team for maintaining these, and the non-executive team will take a keen interest in making sure that the Department’s management structures function effectively.
LOOKING AHEADI have recently led the Board’s annual review of its effectiveness. The review demonstrated that many of the above reforms are relatively recent and need time to be fully tested, but was supportive of the current structure. It provided valuable feedback on the operation of the Board and I will be working with the Chair and Minister for the Board to consider improvements designed to ensure that the Board is more effective in setting and overseeing the strategic objectives of the Department. I will also be testing how transformation is governed within our structures.
Non-executive board members are a valuable and relatively scarce resource, and their support and challenge is as important outside of formal committee time as it is in Board meetings. To add the most value, we are setting up a programme of work that complements the responsibilities and agenda of the Board and its committees. This will include supporting deep dives and projects on critical areas of delivery, sitting as panel members of significant public appointments, and contributing to the oversight of the Department’s arm’s length bodies (ALBs). Our activities will be planned through a ‘forward look’ which will be published to the Leadership Team.
I am also keen to harness the wider non-executive community across our arm’s length bodies and to this end we are setting up a network of chairs, which will complement the existing networks of CEOs and audit committee chairs.
To ensure the non-executive team has the capacity to undertake this valuable work in 2018-19, we will be recruiting additional members. I look forward to working with my fellow non-executive board members and the wider Department to continue to provide effective support, challenge and guidance, and to build on the excellent progress made to improve our governance system.
Richard PennycookLead Non-executive board member9 July 2018

13DfE CONSOLIDATED ANNUAL REPORT AND ACCOUNTS 2017-18
PERFORMANCE OVERVIEW
This section provides a summary of the Department, its purpose, objectives, risks and how it has performed over the past year.
OUR BUSINESS MODELWe are a government departmental group comprising a core department, executive agencies and non-departmental bodies.
The Group is financed through the annual Supply Estimates process managed by HM Treasury (HMT). The Supply Estimates process breaks down the Group’s budget across its main policy objectives and the two budget classifications (DEL and AME). These budgetary limits are voted on by Parliament and provide the legal authority to consume resources and spend the cash the government needs to finance the Group’s agreed spending programmes for the financial year.
Annual Supply Estimates sit within multi-year Spending Reviews, which seek to quantify the cost of government’s policy objectives for the period of the review. Once agreed, Spending Reviews inform the spending plans for government across the period of the Spending Review.
The Group receives funds, termed Supply, from HMT throughout the year. Supply is profiled to support the Group’s ongoing work without accumulating large cash balances in advance of disbursement to third parties.
The Group also generates a small level of income from levies raised by its industry training boards as well as fees and income from other public bodies and third parties.
Annually the Group publishes its audited ARA to support parliamentary accountability by comparing its actual financial performance (outturn) to its budgets (Estimate). The Statement of Parliamentary Supply, found in the Accountability Report, provides more detail on the Group’s outturn against its Estimate.
OUR VISIONOur purpose is to help create a country where there is social mobility and equality of opportunity by providing excellent education, training and care, and to help everyone reach their potential, regardless of background.
By enabling children, young people and adults to have the best possible education, we can help people in all parts of the country to achieve their full potential, including those that have not felt the benefits of economic growth. We aim to strive for better access to good teachers, better access to good school places, and target efforts to improve school performance in the parts of the country which have fallen behind.
Education must equip people with the knowledge and skills to build a strong economy, which means we will renew our focus on building skills and technical education, so that any education route after school is a viable, valuable and worthwhile option for a young person or adult.
Responsibilities
The Department is responsible for children’s services and education including Early Years, schools, Higher and Further Education policy, apprenticeships and wider skills in England. We work to provide children’s services and education that ensures opportunity is equal for all, no matter what their background, family circumstances or needs.
The Department is also home to the Government Equalities Office (GEO), which is responsible for the equality framework and for promoting equality for women and LGBT individuals. Following a cabinet reshuffle in January 2018, all ministerial posts for the GEO and EHRC moved to sit within the Home Office, but the GEO and EHRC bodies remain within the Department. Following the resignation of the Home Secretary on 29 April 2018, the post for the Minister for Women and Equalities moved to the Secretary of State for International Development, while the posts for the junior ministers remained in the Home Office.

14 DfE CONSOLIDATED ANNUAL REPORT AND ACCOUNTS 2017-18
NON-FINANCIAL MATTERS
Social matters
The Department strongly encourages volunteering in line with the government’s Big Society agenda. Volunteering is actively promoted by the Department as an opportunity to give back to worthwhile causes and the community, whilst also highlighting the personal and skills development that volunteering can deliver.
Our volunteering policy offers a minimum of three days special paid leave for non-statutory volunteering and up to six days special paid leave for statutory volunteering, which includes school governors.
The Department has a Diversity and Inclusion strategy launched in 2014. The plan focuses on attracting, recruiting, managing and supporting a diverse workforce that reflects the community we serve. Our Departmental strategy builds on the Civil Service Diversity and Inclusion Strategy released in October 2017.
We have many active networks who meet together as a group, ensuring a coordinated approach to supporting and delivering the actions from the Department’s Equality, Diversity and Inclusion Plan.
Respect for human rights
Under the Equality Act 2006, the Department encourages and supports the development of society in which:
• people’s ability to achieve their potential is not limited by prejudice or discrimination;
• there is respect for and protection of each individual’s human rights;
• there is respect for the dignity and worth of each individual;
• each individual has an equal opportunity to participate in society; and
• there is mutual respect between groups based on understanding and valuing diversity, and on shared respect for equality and human rights.
Anti-corruption and anti-bribery matters
The Department is committed to conducting its affairs in an ethical and honest manner, and is committed to implementing and enforcing systems that ensure bribery is prevented. The Department has zero-tolerance for bribery and corrupt activities. We are committed to acting professionally, fairly, and with integrity in all business dealings and relationships, wherever in the country we operate.
The Department will constantly uphold all laws relating to anti-bribery and corruption in all the jurisdictions in which we operate. The Department is bound by the laws of the UK, including the Bribery Act 2010.
This year, staff were required to complete mandatory training highlighting their responsibilities in recognising and preventing fraud and bribery. The Department also has a Standards of Behaviour policy, which sets out its expectations from staff in relation to theft and fraud.
15DfE CONSOLIDATED ANNUAL REPORT AND ACCOUNTS 2017-18
OUR AMBITIONSThe Department’s strategic priorities3 for 2017-18 were as follows:
No community left behind: Our overarching ambition is to focus on places and communities across the country that feel they have been ‘left behind’, because they have not yet seen the improvement that other parts of the country have already benefited from.
We have a further four ambitions that cover the key life stages of people’s education:
Closing the word gap: Boosting access to high-quality early language and literacy both in the classroom and at home, ensuring more disadvantaged children leave school having mastered the basics of literacy that many take for granted.
Closing the attainment gap: Raising standards for every pupil, supporting teachers early in their career as well as getting more great teachers in areas where there remain significant challenges.
Real choice at post-16: Creating world-class technical education, backed by a half a billion pounds in investment, and increasing the options for all young people regardless of their background.
Rewarding careers for all: Boosting skills and confidence to make the leap from education into work, raising career aspirations. Building a new type of partnership with businesses to improve advice, information and experiences for young people.
These ambitions build on other vital work to tackle key challenges throughout the life stages:
• investing in support for looked after children e.g. through the pupil premium plus;
• delivering sustainable improvements to the children’s social care system e.g. supporting the social work profession through establishing a ‘What works centre’ to disseminate best practice;
• taking forward the biggest changes to special educational needs and disability (SEND) provision in a generation;
• providing tailored support from 0-25 years; and
• delivering bold new proposals on children’s mental health to ensure all children can develop into confident adults.
No community left behind
Closing the word gap
Closing the attainment gap
Real choice at post-16
Rewarding careers for all
3 https://www.gov.uk/government/publications/department-for-education-single-departmental-plan/department-for-education-single-departmental-plan

16 DfE CONSOLIDATED ANNUAL REPORT AND ACCOUNTS 2017-18
STRUCTURE OF THE DEPARTMENT
The Department is led by the Secretary of State for Education who is responsible to Parliament for the Department as a whole.
Ministers look to the Department’s Accounting Officer, the Permanent Secretary, to delegate within the Department to deliver their decisions and to support them in policy-making and managing public funds.
Public sector bodies are classified based on the level of control the Department has over them. Executive agencies act as an arm of the Department, undertaking executive functions rather than giving policy advice.
The other bodies in the Departmental Group are separate legal entities, but the Department usually sets their strategic framework. The Department also normally appoints the body’s chair and all non-executive members of the Board, and is consulted on the appointment of the CEO.
As well as the Departmental Group covered by this ARA, the Department works with other public sector bodies to achieve our objectives. These bodies have more authority over their own policies and are not consolidated into this Group ARA.
Core Department and AgenciesDepartment for Education (DfE)Education and Skills Funding Agency (ESFA)National College for Teaching and Leadership (NCTL)Standards and Testing Agency (STA)
Executive NDPBsOffice of the Children’s Commissioner (OCC)The Construction Industry Training Board (CITB)Engineering Construction Industry Training Board (ECITB)Equality and Human Rights Commission (EHRC)Film Industry Training Board for England and Wales (FITB)Higher Education Funding Council for England (HEFCE)Institute for Apprenticeships (IFA)Office for Fair Access (OFFA)Office for Students (OfS)Student Loans Company Limited (SLC)
Advisory NDPBsSchool Teachers Review Body (STRB)Social Mobility and Child Poverty Commission (SMC)
OtherAggregator Vehicle PLCLocated Property LimitedOffice of the Schools Adjudicator

17DfE CONSOLIDATED ANNUAL REPORT AND ACCOUNTS 2017-18
The Department separates its strategic responsibilities and priorities into several directorates with the following responsibilities; which are correct as at the year end:
Directorate ResponsibilitiesContributing Agencies and NDPBs
Education Standards Directorate (ESD)
Improving the supply and retention of talented teachers and leaders
Strengthening system leadership
The design, delivery and implementation of reforms including SEND, assessment and accountability, curriculum and qualifications (GCSE and A level) and curriculum tests for primary school children
Ensuring character education and life skills in the curriculum, including Physical, Social and Health Education, mental health and bullying
Delivering the new entitlement to 30 hours free childcare to working parents of 3 and 4 year-olds
NCTL
STA
STRB
Higher and Further Education Directorate (H&FE)
Skills and lifelong learning
Oversight of the Higher and Further Education sectors
Delivery of technical education reform and reform of apprenticeships
Sponsorship of the Office for Students, Student Loans Company Limited and the Institute for Apprenticeships
Careers Strategy and education
Post-18 Funding Review
ESFA
CITB
ECITB
FITB
HEFCE
IFA
OFFA
OfS
SLC
Infrastructure and Funding Directorate (IFD)
Delivery of academies and free schools programmes
Reform of the funding system for pre/post-16 education, and policy on capital funding
Ensure the schools system supports delivery of, and access to, more good and outstanding school places
Improve resilience of the school system to keep children safe, including from extremism
ESFA
Aggregator Vehicle PLC
Located Property Limited
Insight, Resources and Transformation Directorate (IRT)
Leads on the main corporate functions for the Department including: analysis, international education, digital, data and technology functions, human resources, finance, commercial, estates, security, and the governance and relationship standards with the Department’s public bodies
N/A
Social Care, Mobility and Equalities Directorate (SCME)
Children’s Social Care
Strategy and Social Mobility
Government Equalities Office
Private Office, for ministers and the Permanent Secretary
Communications, Ministerial and Public Communications Division
The Policy Profession
EHRC
OCC
SMC
18 DfE CONSOLIDATED ANNUAL REPORT AND ACCOUNTS 2017-18
KEY RISKS
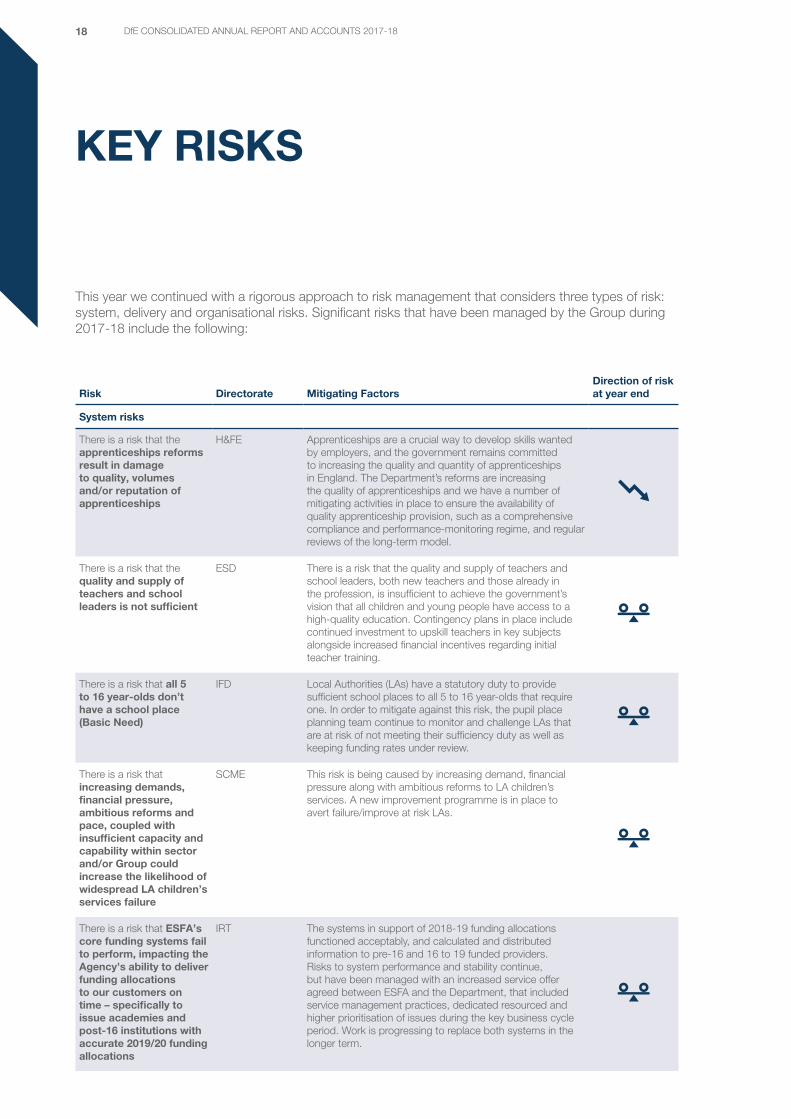
This year we continued with a rigorous approach to risk management that considers three types of risk: system, delivery and organisational risks. Significant risks that have been managed by the Group during 2017-18 include the following:
Risk Directorate Mitigating FactorsDirection of risk at year end
System risks
There is a risk that the apprenticeships reforms result in damage to quality, volumes and/or reputation of apprenticeships
H&FE Apprenticeships are a crucial way to develop skills wanted by employers, and the government remains committed to increasing the quality and quantity of apprenticeships in England. The Department’s reforms are increasing the quality of apprenticeships and we have a number of mitigating activities in place to ensure the availability of quality apprenticeship provision, such as a comprehensive compliance and performance-monitoring regime, and regular reviews of the long-term model.
There is a risk that the quality and supply of teachers and school leaders is not sufficient
ESD There is a risk that the quality and supply of teachers and school leaders, both new teachers and those already in the profession, is insufficient to achieve the government’s vision that all children and young people have access to a high-quality education. Contingency plans in place include continued investment to upskill teachers in key subjects alongside increased financial incentives regarding initial teacher training.
There is a risk that all 5 to 16 year-olds don’t have a school place (Basic Need)
IFD Local Authorities (LAs) have a statutory duty to provide sufficient school places to all 5 to 16 year-olds that require one. In order to mitigate against this risk, the pupil place planning team continue to monitor and challenge LAs that are at risk of not meeting their sufficiency duty as well as keeping funding rates under review.
There is a risk that increasing demands, financial pressure, ambitious reforms and pace, coupled with insufficient capacity and capability within sector and/or Group could increase the likelihood of widespread LA children’s services failure
SCME This risk is being caused by increasing demand, financial pressure along with ambitious reforms to LA children’s services. A new improvement programme is in place to avert failure/improve at risk LAs.
There is a risk that ESFA’s core funding systems fail to perform, impacting the Agency’s ability to deliver funding allocations to our customers on time – specifically to issue academies and post-16 institutions with accurate 2019/20 funding allocations
IRT The systems in support of 2018-19 funding allocations functioned acceptably, and calculated and distributed information to pre-16 and 16 to 19 funded providers. Risks to system performance and stability continue, but have been managed with an increased service offer agreed between ESFA and the Department, that included service management practices, dedicated resourced and higher prioritisation of issues during the key business cycle period. Work is progressing to replace both systems in the longer term.

19DfE CONSOLIDATED ANNUAL REPORT AND ACCOUNTS 2017-18
Risk Directorate Mitigating FactorsDirection of risk at year end
Operational risks
There is a risk the Department will be unable to fulfil its responsibilities due to a sustained cyber attack
IRT A sustained cyber-attack could result in the loss of access to critical Departmental systems and services. The government takes this risk very seriously and mitigates it in the following ways; infrastructure is closely monitored utilising a number of intelligence sources. The risk is currently stable however is always monitored closely due to the fact that a cyber-attack is a constant risk to all government departments.
There is a risk that we exceed our programme, capital or admin control totals for the current financial year or next financial year
IRT The Department’s budget is difficult to forecast and therefore there is a risk of overspending our budget. The Department is determined to protect the public purse and keep its spending within its budget and is mitigating the risk of overspending in a number of ways, including introducing a new approach to in-year budget management along with working closely with HMT to keep them aware of any changes, concerns within the budget. The risk is currently stable.

20 DfE CONSOLIDATED ANNUAL REPORT AND ACCOUNTS 2017-18
OUR HIGHLIGHTS THIS YEAR
The repayment threshold for student loans is now £25,000, previously £21,000, and the tuition fee cap is frozen at £9,250. A major review of post-18 education and funding was launched in February 2018 and aims to ensure the system is giving everyone a genuine choice between high quality technical, vocational and academic routes, students and taxpayers are getting value for money, and employers can access the skilled workforce they need. This review will conclude in early 2019.
The gap between disadvantaged and not disadvantaged pupils is at its lowest. It narrowed by 3.2% for secondary and 1.6% for primary school since 2016, at least a 10% reduction for both since 2011.
47 free schools, 5 University Technical Colleges and 3 studio schools opened in the 2017/18 academic year and, when at full capacity, will provide over 34,000 places.
10%
The introduction of the 30 Hours Free Childcare entitlement
extended the provision of government-funded early education
for three and four year-olds. At 71%, take-up for free childcare for disadvantaged two year-olds
continues to rise.
12 Opportunity Area
Delivery Plans published providing
targeted support for areas identified where social
mobility is lowest.
6.8 million
children are now in schools rated good or outstanding, that is 87% of children compared to 66% in 2010.
21DfE CONSOLIDATED ANNUAL REPORT AND ACCOUNTS 2017-18
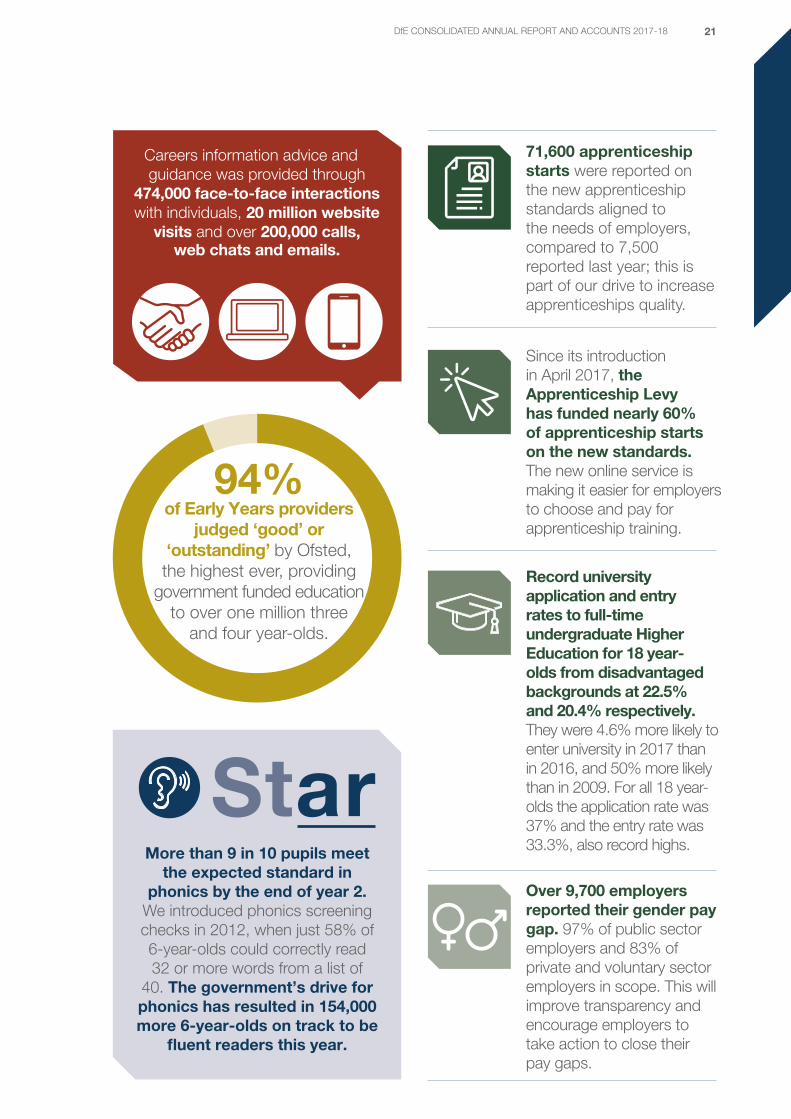
94% of Early Years providers
judged ‘good’ or ‘outstanding’ by Ofsted, the highest ever, providing
government funded education to over one million three
and four year-olds.
Careers information advice and guidance was provided through
474,000 face-to-face interactions with individuals, 20 million website
visits and over 200,000 calls, web chats and emails.
71,600 apprenticeship starts were reported on the new apprenticeship standards aligned to the needs of employers, compared to 7,500 reported last year; this is part of our drive to increase apprenticeships quality.
Record university application and entry rates to full-time undergraduate Higher Education for 18 year-olds from disadvantaged backgrounds at 22.5% and 20.4% respectively. They were 4.6% more likely to enter university in 2017 than in 2016, and 50% more likely than in 2009. For all 18 year-olds the application rate was 37% and the entry rate was 33.3%, also record highs.
Over 9,700 employers reported their gender pay gap. 97% of public sector employers and 83% of private and voluntary sector employers in scope. This will improve transparency and encourage employers to take action to close their pay gaps.
Since its introduction in April 2017, the Apprenticeship Levy has funded nearly 60% of apprenticeship starts on the new standards. The new online service is making it easier for employers to choose and pay for apprenticeship training.
More than 9 in 10 pupils meet the expected standard in
phonics by the end of year 2. We introduced phonics screening checks in 2012, when just 58% of 6-year-olds could correctly read 32 or more words from a list of
40. The government’s drive for phonics has resulted in 154,000 more 6-year-olds on track to be
fluent readers this year.
22 DfE CONSOLIDATED ANNUAL REPORT AND ACCOUNTS 2017-18
PERFORMANCE ANALYSIS
This chapter sets out performance in 2017-18 towards the five strategic objectives as outlined in our Single Departmental Plan, December 2017.4 The datasets used to monitor performance generally relate to the academic year ending 31 August 2017 but more up to date information has been provided where available. Latest performance data will be published after the current academic year has ended. Full details for each dataset are available on GOV.UK through the links provided below.
Our objectives for 2017-18 are presented in ‘Our ambitions’ section on page 15. Here we provide more information about the objectives.
No community left behind
Our overarching ambition focuses on the places and communities across England where social mobility is at its lowest. Through the Opportunity Areas programme, we launched intensive, co-ordinated and targeted support for these areas with complex and entrenched challenges.
12 Opportunity Area Delivery Plans were published by January 2018
We have now published all 12 Opportunity Area Delivery Plans.5 These were developed in partnership with local communities, national organisations and businesses. They represent a wide regional spread and a variety of coastal, urban and rural areas identified through the Opportunity Areas Selection Methodology.6
The areas are West Somerset, Norwich, Blackpool, North Yorkshire Coast, Derby, Oldham, Bradford, Doncaster, Fenland and East Cambridgeshire, Hastings, Ipswich and Stoke-on-Trent.
Each of the 12 areas is receiving a share of £72 million over three years, beginning in 2017-18. The funding is being used to implement bespoke plans, ranging from improving early education for two year-olds to enhancing careers support to support young people in the transition into adulthood. In addition to this, a further £22 million from the Essential Life Skills programme is being spent in the 12 areas to help young people develop life skills in resilience, wellbeing and employability.
The Opportunity Areas will also receive a share of the £75 million Teaching and Leadership Innovation Fund to support high quality professional development for teachers and leaders in challenging areas. They will also receive a share of the £280 million Strategic School Improvement Fund, for schools most in need of support.
Participating ALBs:
The Social Mobility and Child Poverty Commission published the State of the Nation 2017: Social Mobility in Great Britain in November 2017. This assessed the progress that Great Britain has made towards improving social mobility. The Commission’s social mobility index, which ranks all English local authorities in terms of the opportunities young people from poorer backgrounds have to succeed, was the starting point for identifying the Opportunity Areas.
4 https://www.gov.uk/government/publications/department-for-education-single-departmental-plan
5 https://www.gov.uk/government/publications/social-mobility-and-opportunity-areas#history
6 https://www.gov.uk/government/uploads/system/uploads/attachment_data/file/650036/Opportunity_areas_selection_methodology.pdf

23DfE CONSOLIDATED ANNUAL REPORT AND ACCOUNTS 2017-18
Close the word gap in the Early Years
We want to ensure that more disadvantaged children leave school having mastered the basics of literacy that many take for granted, by boosting access to high-quality early language and literacy both in the classroom and at home.
We will improve the quality of Early Years provision (particularly in challenging areas), with a renewed focus on early language and literacy, including ensuring more disadvantaged children are able to experience a language-rich early learning environment. We also aim to improve the take-up of quality Early Years provision.
By delivering reforms to children’s social care and social work, we aim to improve the quality of services, including targeted support and challenge to any local authorities that have been graded inadequate or those ‘at risk’ of being so.
Early Years provision
During the year, we have focused on supporting the improvement in the quality of Early Years provision and its take-up, including ensuring that all eligible parents can access 30 hours of childcare per week which is funded by the Department.
95% take up of free childcare for three and four year-olds
In January 2017, 93% of three year-olds and 96% of four year-olds were benefitting from up to fifteen hours a week of early education provision free to parents.7 The estimated overall take up rate for both has remained steady at 95% since 2012.
The Department introduced 30 hours free childcare in 2017-18. This meant that from September 2017, working parents of three and four year-olds have been entitled to an additional 15 hours of government-funded childcare for 38 weeks of the year. In the second term following national rollout of 30 hours free childcare (from 1 January to 31 March 2018), an estimated 294,000 children were in a 30 hours place according to LA data returns made during February. Parents apply and have their eligibility checked for 30 hours free childcare via the online childcare service, and, if found to be eligible, are given a code which they take to their chosen childcare provider for validation. Once validated, the parent is able to take up their 30 hours place. The number of children in a 30 hours place represents 96% of validated eligibility codes for the spring term.8
In 2017-18, the £100 million Early Years Capital Fund has continued to help providers deliver additional high quality 30 hours places through expansion and development of their sites.
71% take up of free childcare for disadvantaged two year-olds
The percentage of eligible disadvantaged two year-olds taking up government-funded childcare was at 71% in January 2017.9 The number of two year-olds benefitting from some funded early education fell by 2.2% between January 2016 and 2017, reflecting a drop in the birth rate in 2014.
To increase the take up of funded places, the Department provides LAs with lists of parents of children potentially eligible for this entitlement seven times a year. The LAs can then use this to help market the free entitlement.
7 https://www.gov.uk/government/statistics/education-provision-children-under-5-years-of-age-january-2017
8 https://www.gov.uk/government/statistics/30-hours-free-childcare-spring-term-2018
9 https://www.gov.uk/government/statistics/education-provision-children-under-5-years-of-age-january-2017

24 DfE CONSOLIDATED ANNUAL REPORT AND ACCOUNTS 2017-18
Number of 2 year-old children benefitting from funded early education places for all providers from 2014 to 2017*
Number of 2 year-olds 2 year-old take-up rate
Num
ber
of 2
yea
r-ol
ds
2 ye
ar-o
ld ta
ke-u
p ra
te (%
)
Axis Title
020,000
100,000
40,000
60,000
80,000
120,000
140,000
160,000
180,000
2014 2015 2016 2017010
50
20
30
40
60
70
80
90
*In 2014 entitlement was only partially implemented so it is not possible to provide a percentage of the eligible population.
Early Years providers
94% of early education providers rated good or better by Ofsted
Over one million three and four year-olds received government-funded early education in settings judged good and outstanding in January 2017.9 As at December 2017, the percentage of Early Years providers judged good or outstanding was at its highest ever at 94%.10 This has steadily risen from 74% in August 2012, an increase mainly due to the steady rise in the proportion of providers judged as good (see chart below).
0 20 40 60 80 100
As at 31 August 2012
As at 31 August 2013
As at 31 August 2014
As at 31 August 2015
As at 31 August 2016
As at 31 August 2017
As at 31 December 2017
Percentage of inspected providers
Overall effectiveness of active early years registered providers at their most recent inspection, by year
Outstanding Good Requires Improvement Inadequate
The Department contributed to the increased quality of Early Years providers by delivering the commitments in the Early Years Workforce Strategy,11 published in March 2017. This is the government’s plan to support the sector in attracting, developing and retaining Early Years staff. For example, to ensure qualification requirements worked for the sector, we consulted on draft criteria for level 2 Early Years qualifications, and developed these with an expert reference group of stakeholders.
The Department introduced the Early Years National Funding Formula in April 2017. This formula enables us to allocate our record funding for the entitlements for three and four year-olds fairly and transparently, with 93% of this funding being passed on to providers. We also allowed LAs to include a quality supplement in their local formulas to support workforce qualifications and system leadership. The Department continues to monitor delivery costs and have commissioned new research to provide us with robust and detailed cost data of under five year-olds from a representative sample of Early Years providers.
10 https://www.gov.uk/government/statistics/childcare-providers-and-inspections-as-at-31-december-2017
11 https://www.gov.uk/government/publications/early-years-workforce-strategy

25DfE CONSOLIDATED ANNUAL REPORT AND ACCOUNTS 2017-18
Early Years children outcomes
71% of children reaching a good level of development in the Early Years Foundation Stage Profile assessment
The percentage of children achieving a ‘good level of development’ is improving year on year, increasing from 52% in 2013 to 71% in 2017.12 The gap between disadvantaged children and others achieving a good level of development has narrowed rom 19 percentage points in 2013 to 17 percentage points in 2017.12
Children achieving a good level of development are those achieving at least the expected level within the following areas of learning: communication and language; physical development; personal, social and emotional development; literacy; and mathematics.
0
10
20
30
40
50
60
70
80
20172016201520142013
Percentage achieving good level of development
The Department remains committed to the Early Years Foundation Stage Profile (EYSP). This is the assessment which teachers complete for all children at the end of the reception year to assess their development against a set of 17 early learning goals. We published the government’s response to the Primary Assessment Consultation13 in September 2017 which sets out the improvements we are making to the profile.
For example, we are strengthening the early learning goals, including key elements of the ‘good level of development’ measure which focus on communication and language, mathematics, and literacy. This is to ensure that the goals are based on the latest child development evidence and that all descriptors are clear, and focused on the right age-appropriate outcomes and predictors of future attainment so that children are prepared for primary school and beyond.
Attainment gap
The gap between disadvantaged children and others achieving a good level of development has narrowed from 19 percentage points in 2013 to 17 percentage points in 2017
As part of the Early Years National Funding Formula, we required LAs to include a deprivation supplement in their formulas to recognise disadvantage in their areas.
The Department’s national average hourly funding rate to LAs for two year-olds increased from £5.09 to £5.39 and, from April 2017, all LAs saw 7% increases in their rates to deliver the 15 hours free childcare entitlement for disadvantaged two year-olds. We also continued to offer the Early Years Pupil Premium, giving providers additional funding to support disadvantaged three and four year-old pupils.
Also, in April 2017, we introduced a Disability Access Fund worth £615 per eligible child. It requires all LAs to introduce inclusion funds to support children with Special Education Needs.
In September and December 2017, we invited applications for the Strategic School Improvement Fund. This grant targets resources at the schools most in need to improve school performance and pupil attainment. For the first time, these applications included explicit content on the Early Years. The latter also included a new Early Years eligibility criterion and more guidance on what we expect from applications.
12 https://www.gov.uk/government/statistics/early-years-foundation-stage-profile-results-2016-to-2017
13 https://www.gov.uk/government/consultations/primary-assessment-in-england

26 DfE CONSOLIDATED ANNUAL REPORT AND ACCOUNTS 2017-18
Children’s social care and social work
36% of local authority children’s services are rated good or outstanding by Ofsted
We delivered reforms to children’s social care and social work in order to improve the quality of services provided by LAs.
By 31 October 2017, Ofsted had inspected all 152 LAs in England against the Single Inspection Framework, which it introduced in 2013. 36% of LAs were judged good or better, including three authorities who received an outstanding rating, an 8% increase on the 109 inspected LAs by October 2016.14
While some examples of excellence have emerged in the provision of children’s social care services, and we are seeing an increase in good performance, there remain too many examples of failure or of organisations struggling to deliver strong services. Our reforms in this area focus on: supporting the emergence of innovative organisational models for children’s social care; ensuring sharper and more focused accountability; and intervening decisively in cases of failure.
In January 2018, Ofsted began inspecting under its new Inspection of Local Authority Children’s Services framework. This framework allows for more frequent contact between inspections which will help Ofsted identify any issues of concern and support LAs to address them before services deteriorate.
The Department established Social Work England in August 2017 to regulate children, family and adult social workers, and set social work. It will take over this function from the Health and Care Professions Council in September 2018.
We have committed £20 million to work with the sector to build a self-improving system for children’s services – one that identifies where challenges are emerging and quickly puts the right support in place. This includes the expansion of the Partners in Practice programme announced by the Department in March 2018. The programme will create more peer support for LAs, specifically Ealing, Stockport, Hackney, Tyneside Alliance (North Tyneside and South Tyneside in partnership), Essex, Camden, Doncaster and East Riding of Yorkshire. We also began developing Regional Improvement Alliances to better identify those authorities at risk of failing, and those with the capacity to improve. By the end of March 2018, we had established three pilot regions (the West Midlands, East Midlands and East of England).
472 daysbetween a child entering into care and their placement with adoptive parents
The average amount of time a child has to wait between entering care and being placed with adoptive parents fell in 2017-18, from 18 months to 16 months (or 472 days).15
2016-17 2015-16 2014-15
No of children adopted 4,350 4,710 5,350
% change (8%) (19%)
The reduction in adoptions was anticipated as placement orders (when children are placed with adoptive families for a minimum of 10 weeks before an adoption order is granted) had reduced in the previous year.
The Department continued to deliver the commitments from its 2016 adoption strategy Adoption – a vision for change.16 This included the roll-out of Regional Adoption Agencies (RAAs), with 10 live RAAs covering 49 LAs now in operation. We announced 16 new grant-funded projects to encourage innovation and best practice in adoption. We also continued to support adoptive families to access therapeutic support by extending eligibility to the placement period (pre-adoption order).
14 https://www.gov.uk/government/publications/local-authority-and-childrens-homes-in-england-inspection-outcomes-as-at-30-september-2016/local-authority-and-childrens-homes-in-england-inspection-outcomes-as-at-30-september-2016
15 https://www.gov.uk/government/collections/statistics-children-in-need
16 https://www.gov.uk/government/publications/adoption-a-vision-for-change

27DfE CONSOLIDATED ANNUAL REPORT AND ACCOUNTS 2017-18
Other performance indicators for children’s services
2016-17 2015-16
Percentage of children's homes rated good or outstanding by Ofsted
82%(as at 31-Mar-17)
75% (as at 30-Sep-16)
Percentage of care leavers aged 19-21 in education, employment or training17
55% 55%
Percentage of referrals to children's social care within 12 months of previous referral15
22% 22%
Close the attainment gap in school while raising standards for all
We want to ensure that all children get the best quality education. To achieve this, we enabled the creation of a greater number and variety of good and outstanding school places and supported improvements in schools, including in disadvantaged areas. We worked to drive recruitment and retention of high quality teachers, and raised the status of the teaching profession.
School provision
89% of schools judged good or outstanding at their most recent inspection
The number of schools deemed to be good or outstanding overall by Ofsted was 89% as at 31 August 2017.18 Although unchanged since 2016, this is 5% higher than in August 2015.
The Department is driving the creation of additional school places through the conversion of maintained schools to academy status and expansion of free schools. In 2017-18, the number of academies (including free schools, studio schools and university technical colleges) rose from 6,675 to 7,613.19 The vast majority of these schools came together either to lead, or be part of a multi-academy trust. Being part of a multi-academy trust provides the opportunity for these schools to share their expertise, work collaboratively and drive improvements across the academies in the multi-academy trust.
Free schools are amongst some of the highest performing schools in the country: 84% of all free schools with inspection reports published by the end of December 2017 were rated good or outstanding, with 29% rated outstanding.20 End of Key Stage 4 pupils in secondary free schools made more progress on average than pupils in other types of schools in 2016/17; 21 and 21.5% of disadvantaged pupils at free schools achieved a strong pass in the English Baccalaureate (EBacc), which is higher than all other school types.21
Over six million pupils are now in schools rated good or outstanding as at December 2017; 87% of children compared to 66% in 2010
17 Excludes young people for whom information is not known. Children looked after in England including adoption: 2016 to 2017 – GOV.UK https://www.gov.uk/government/statistics/children-looked-after-in-england-including-adoption-2016-to-2017
18 https://www.gov.uk/government/statistics/maintained-schools-and-academies-inspections-and-outcomes-as-at-31-august-2017
19 https://www.get-information-schools.service.gov.uk/
20 https://www.gov.uk/government/statistics/maintained-schools-and-academies-inspections-and-outcomes-as-at-31-december-2017
21 https://www.gov.uk/government/statistics/revised-gcse-and-equivalent-results-in-england-2016-to-2017
28 DfE CONSOLIDATED ANNUAL REPORT AND ACCOUNTS 2017-18
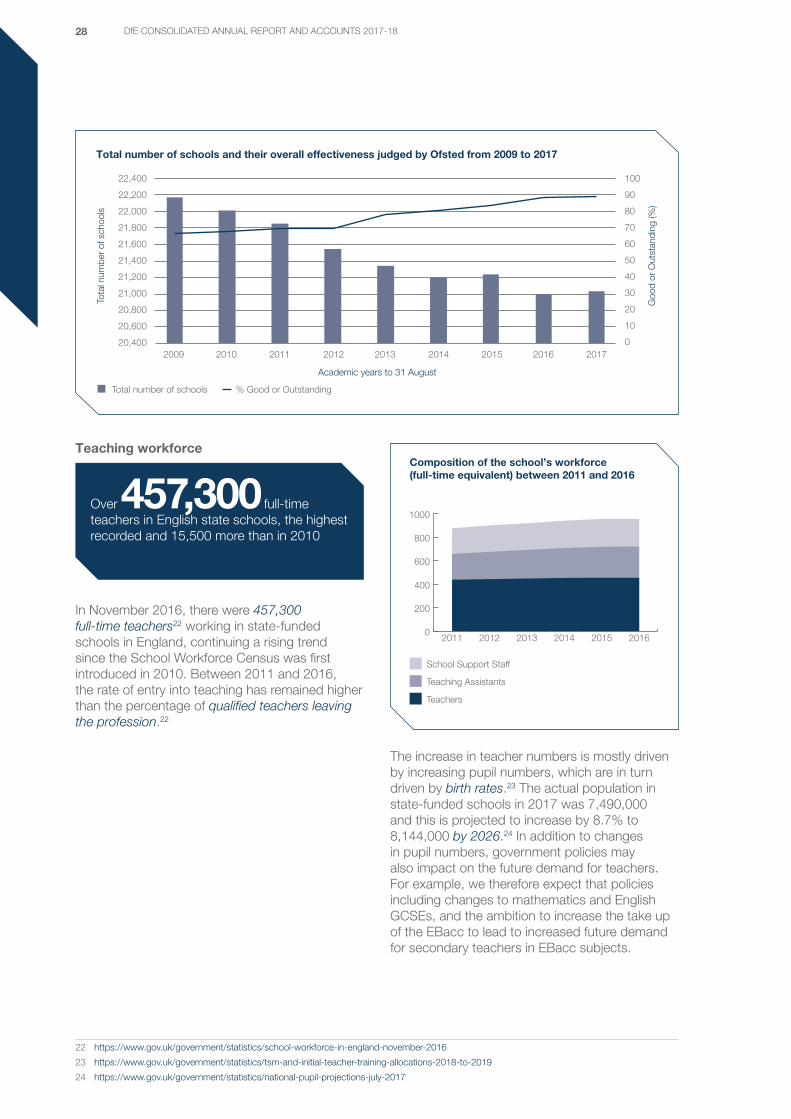
Total number of schools and their overall effectiveness judged by Ofsted from 2009 to 2017
Total number of schools % Good or Outstanding
Tota
l num
ber
of s
choo
ls
Goo
d or
Out
stan
ding
(%)
20
60
30
40
50
70
80
90
100
2009
10
0
20,800
21,600
21,000
21,200
21,400
21,800
22,000
22,200
22,400
20,600
20,4002010 2011 2012 2013 2014 2015 2016 2017
Academic years to 31 August
Teaching workforce
Over 457,300 full-time teachers in English state schools, the highest recorded and 15,500 more than in 2010
In November 2016, there were 457,300 full-time teachers22 working in state-funded schools in England, continuing a rising trend since the School Workforce Census was first introduced in 2010. Between 2011 and 2016, the rate of entry into teaching has remained higher than the percentage of qualified teachers leaving the profession.22
Composition of the school’s workforce(full-time equivalent) between 2011 and 2016
0
200
400
600
800
1000
School Support Staff
Teaching Assistants
Teachers
201620152014201320122011
The increase in teacher numbers is mostly driven by increasing pupil numbers, which are in turn driven by birth rates.23 The actual population in state-funded schools in 2017 was 7,490,000 and this is projected to increase by 8.7% to 8,144,000 by 2026.24 In addition to changes in pupil numbers, government policies may also impact on the future demand for teachers. For example, we therefore expect that policies including changes to mathematics and English GCSEs, and the ambition to increase the take up of the EBacc to lead to increased future demand for secondary teachers in EBacc subjects.
22 https://www.gov.uk/government/statistics/school-workforce-in-england-november-2016
23 https://www.gov.uk/government/statistics/tsm-and-initial-teacher-training-allocations-2018-to-2019
24 https://www.gov.uk/government/statistics/national-pupil-projections-july-2017

29DfE CONSOLIDATED ANNUAL REPORT AND ACCOUNTS 2017-18
In December 2017 we launched the Strengthening Qualified Teacher Status and Improving Career Progression for teachers’ consultation. We held regional events and extensively consulted with teachers and other stakeholders on how to improve the support available for career development, especially for new teachers. We plan to develop a new Early Career Framework of support and mentoring that will help to improve the quality of teaching, as well as make the profession even more attractive. Focusing on the schools and areas facing the most disadvantage, we started delivering a £75 million investment in teachers’ professional development. Since 2016, the Department has also continued to support initial set-up of the Chartered College of Teaching, with a £5 million commitment over four years. This will enable the College, as an independent professional body, to build capability and establish itself as the voice of the profession, promoting the use of evidence-based practice across the teaching profession.
Curriculum and assessment
In 2016, we reformed accountability to move away from threshold measures (e.g. 5A*-C GCSE including English and mathematics) and instead focus on the progress that pupils make compared to others nationally with similar starting points. As these changes have only just been introduced and adopted by schools, there is no trend analysis available.
61% of pupils reaching the expected standard in reading, writing and mathematics at the end of Key Stage 2
We are now seeing the benefits of the work we started back in 2010 to reform the primary curriculum and the assessment and accountability arrangements. In 2017, the percentage of pupils achieving the expected standard in reading, writing and mathematics is 61%, compared to 53% in 2016, an increase of 8 percentage points.25
Additionally, 9% reached a higher standard compared to 5% in 2016, an increase of 4%. This increase may be due to pupils and teachers becoming more familiar with the higher levels of demand of the new assessments, aligned with the new, more challenging National Curriculum, in their second year of operation.
To help improve mathematics teaching in primary schools and complement the primary National Curriculum for mathematics, introduced in 2014, we introduced a new style of teaching to primary schools. This is based on approaches in high-performing Asian jurisdictions – teaching for mastery. Since 2016, we have committed £74 million to reach 11,000 primary and secondary schools by 2023; including £27 million committed in the November 2017 Budget.
We also created a national network of 35 school-led Maths Hubs to help local schools improve the quality of their mathematics teaching, based on best practice from 2014.
44.6 national average Attainment 8 score per pupil in all schools
In secondary schools the new, more challenging main national indicator of pupil performance is the Attainment 8 score per pupil. This measures the achievement of a pupil across eight qualifications including: mathematics (double weighted); English (double weighted, if both English language and literature are entered); three further qualifications that count in the EBacc measure; and three further qualifications that can be GCSE qualifications (including EBacc subjects) or technical awards from the Department’s approved list.25
The average Attainment 8 score per pupil in 2016/17 was 44.6 in all schools, and 46.3 in state-funded schools,26 down from 48.5 and 49.9 in 2015/16. These decreases are as expected following the move to the new point score scales following the introduction of reformed GCSEs (graded on the 9-1 scale).
25 https://www.gov.uk/government/collections/performance-tables-technical-and-vocational-qualifications
26 https://www.gov.uk/government/statistics/revised-gcse-and-equivalent-results-in-england-2016-to-2017

30 DfE CONSOLIDATED ANNUAL REPORT AND ACCOUNTS 2017-18
A review carried out in 2016 and published in July 201727 found that, overall, schools were positive about Progress 8 (the new accountability measure for secondary schools, calculated from the Attainment 8 figures of its pupils). They thought it was achieving its aim of focusing on progress rather than attainment and had encouraged schools to consider progress across whole school cohorts, rather than focusing disproportionately on pupils close to a grade C/D boundary.28
Over 38% of pupils in state-funded schools entered the EBacc
The EBacc is made up of English, mathematics, science, a language, and history or geography. To achieve the EBacc, a pupil must achieve a grade 5 or above in English and mathematics GCSEs and grades C or above in unreformed subject areas. This figure is most comparable to 2016 data because the bottom of a grade 4 in reformed GCSEs maps onto the bottom of a grade C in unreformed GCSEs. Comparison of the grade 4 or above figure to 2016 shows a small decrease in EBacc achievement of 1 percentage point. Further information on the reasons behind the decrease can be found in the GCSE and equivalents in England, 2016 to 2017 statistical first release.26
Percentage of pupils entering and achieving the EBacc from 2010 and 2017
15
20
25
30
35
40
Pupils achieving grades 9-4 in English and maths element
Achieving
Entering
20172016201520142013201220112010
This year, the government published a response to the EBacc consultation,29 which is that we expect to increase demand for the EBacc combination of subjects. The Department worked closely with Ofsted on guidance for inspectors, as they will be inspecting schools on their EBacc provision starting in September 2018. We also launched a communications campaign targeted at parents and carers with the aim of increasing awareness of the EBacc and the benefits for children of studying the core academic subjects, with particular emphasis on modern foreign languages.
Disadvantaged pupils
The gap between disadvantaged and not disadvantaged pupils narrowed by
3.2% for secondary school and
1.6% for primary schools since 2016
The government recognises that children from poorer backgrounds may face additional challenges to realising their potential. We have spent almost £2.5 billion last year alone – almost £13 billion since 2011 – through the pupil premium to provide schools with extra resources to overcome barriers to learning.
27 https://assets.publishing.service.gov.uk/government/uploads/system/uploads/attachment_data/file/629517/School_response_to_Progress_8_Re-port.pdf
28 https://www.gov.uk/government/uploads/system/uploads/attachment_data/file/629517/School_response_to_Progress_8_Report.pdf
29 https://www.gov.uk/government/uploads/system/uploads/attachment_data/file/630713/Implementing_the_English_Baccalaureate_-_Govern ment_consultation_response.pdf
31DfE CONSOLIDATED ANNUAL REPORT AND ACCOUNTS 2017-18
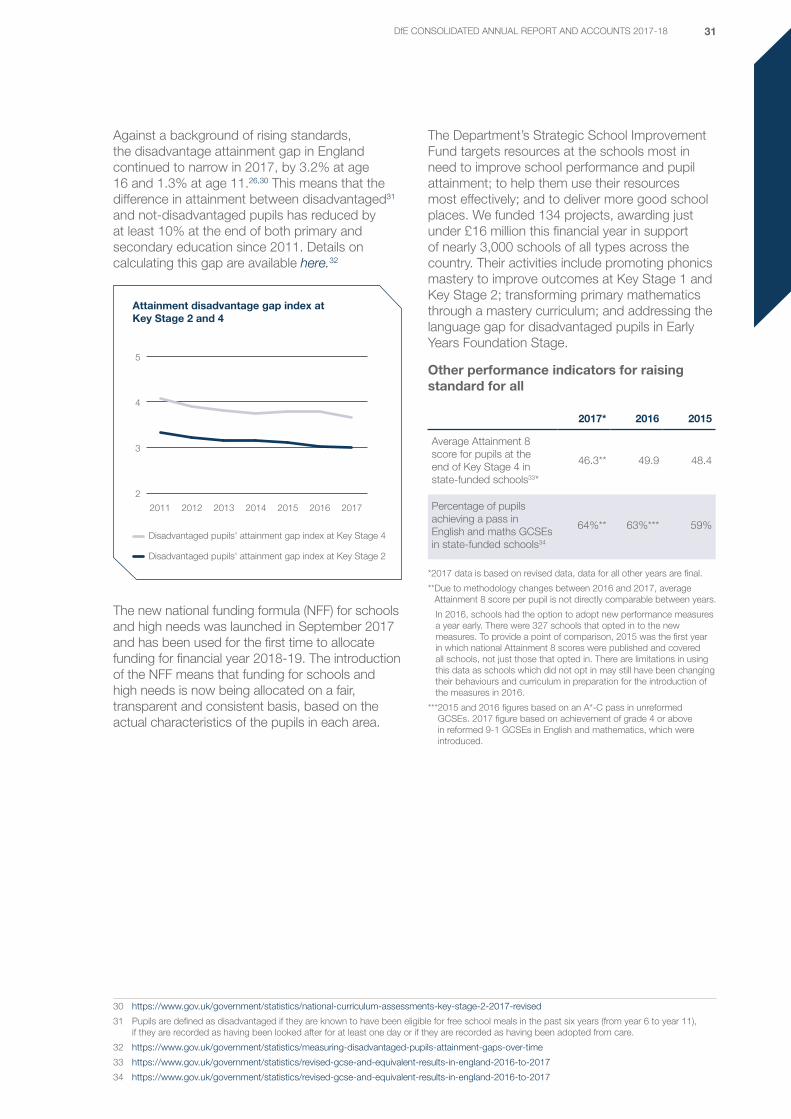
Against a background of rising standards, the disadvantage attainment gap in England continued to narrow in 2017, by 3.2% at age 16 and 1.3% at age 11.26,30 This means that the difference in attainment between disadvantaged31 and not-disadvantaged pupils has reduced by at least 10% at the end of both primary and secondary education since 2011. Details on calculating this gap are available here.32
Attainment disadvantage gap index atKey Stage 2 and 4
2
3
4
5
Disadvantaged pupils' attainment gap index at Key Stage 4
Disadvantaged pupils' attainment gap index at Key Stage 2
2017201620152014201320122011
The new national funding formula (NFF) for schools and high needs was launched in September 2017 and has been used for the first time to allocate funding for financial year 2018-19. The introduction of the NFF means that funding for schools and high needs is now being allocated on a fair, transparent and consistent basis, based on the actual characteristics of the pupils in each area.
The Department’s Strategic School Improvement Fund targets resources at the schools most in need to improve school performance and pupil attainment; to help them use their resources most effectively; and to deliver more good school places. We funded 134 projects, awarding just under £16 million this financial year in support of nearly 3,000 schools of all types across the country. Their activities include promoting phonics mastery to improve outcomes at Key Stage 1 and Key Stage 2; transforming primary mathematics through a mastery curriculum; and addressing the language gap for disadvantaged pupils in Early Years Foundation Stage.
Other performance indicators for raising standard for all
2017* 2016 2015
Average Attainment 8 score for pupils at the end of Key Stage 4 in state-funded schools33*
46.3** 49.9 48.4
Percentage of pupils achieving a pass in English and maths GCSEs in state-funded schools34
64%** 63%*** 59%
* 2017 data is based on revised data, data for all other years are final.
** Due to methodology changes between 2016 and 2017, average Attainment 8 score per pupil is not directly comparable between years.
In 2016, schools had the option to adopt new performance measures a year early. There were 327 schools that opted in to the new measures. To provide a point of comparison, 2015 was the first year in which national Attainment 8 scores were published and covered all schools, not just those that opted in. There are limitations in using this data as schools which did not opt in may still have been changing their behaviours and curriculum in preparation for the introduction of the measures in 2016.
*** 2015 and 2016 figures based on an A*-C pass in unreformed GCSEs. 2017 figure based on achievement of grade 4 or above in reformed 9-1 GCSEs in English and mathematics, which were introduced.
30 https://www.gov.uk/government/statistics/national-curriculum-assessments-key-stage-2-2017-revised
31 Pupils are defined as disadvantaged if they are known to have been eligible for free school meals in the past six years (from year 6 to year 11), if they are recorded as having been looked after for at least one day or if they are recorded as having been adopted from care.
32 https://www.gov.uk/government/statistics/measuring-disadvantaged-pupils-attainment-gaps-over-time
33 https://www.gov.uk/government/statistics/revised-gcse-and-equivalent-results-in-england-2016-to-2017
34 https://www.gov.uk/government/statistics/revised-gcse-and-equivalent-results-in-england-2016-to-2017
32 DfE CONSOLIDATED ANNUAL REPORT AND ACCOUNTS 2017-18
High quality post-16 education choices for all young people
We are working to create a new technical education option, T Levels. We increased the quality of apprenticeships and focused on widening participation in Higher Education, especially from minority and disadvantaged groups. We supported improvements to further education colleges and worked with them to ensure their ongoing financial security.
In October 2017, the Department published the T Level Action Plan.35 This sets out the implementation timetable for a new high quality, two year technical study programme, ‘T Levels’. Co-designed with education providers and employers, T Levels will become one of three major options when a student reaches Level 3 (equivalent to the achievement of two or more A Levels or equivalent qualifications), alongside apprenticeships and A Levels. The Department held a public consultation on the implementation of T Levels from 30 November 2017 to 8 February 2018.
Apprenticeships
1.3 million people of all ages started apprenticeships between May 2015 and January 2018
Apprenticeship starts are tracked on an academic year basis and in 2016/17, 494,900 people began apprenticeships in England. An additional 194,100 people began apprenticeships between August 2017 and January 2018.
The Department delivered apprenticeship reforms in order to ensure that apprenticeships are of the highest quality – delivering the skills valued by employers that will increase productivity and help stimulate growth. The reforms are underpinned by statute to improve the quality of training for all, including ensuring all apprenticeships last a minimum of 12 months, involve sustained training
and clear skills gain with a substantial amount of time based on off-the-job training.
This year, the Department established the Institute for Apprenticeships (IFA), a new non-departmental public body. The institute’s core function is to ensure the quality of apprenticeships and provide advice to government on future funding provision for apprenticeship training.
We are also replacing frameworks with standards. Standards are designed by employers themselves and focus not on qualifications but on the skills, knowledge and behaviours needed to be fully competent in the relevant occupation. As at April 2018, there were over 200 approved standards, with over 250 more in development,36 and 37% of all starts recorded in 2017/18 were on apprenticeship standards.
In April 2017, the government introduced the Apprenticeship Levy on UK employers to fund apprenticeships. We also launched the digital apprenticeship service, an online service that allows employers to choose and pay for apprenticeship training more easily. There have been 103,300 levy-supported starts since the introduction of the levy.37
11% increase in Black, Asian and Minority Ethnic (BAME) apprenticeship starts
The Department has a target to increase the proportion of apprenticeships started by people of BAME backgrounds by 20% by 2020. The final figure from the academic year 2016/17 was 11.2%.38
The Department officially launched the five cities Diversity Hub project in February 2018. These cities (Greater Manchester, London, Bristol, Birmingham and Leicester) have identified a series of actions that will have positive impacts and, working with the Department and local partners, will develop approaches to increase diversity in apprenticeship starts, making them more representative of the local population.
35 https://www.gov.uk/government/uploads/system/uploads/attachment_data/file/650969/T_level_Action_Plan.pdf
36 https://www.instituteforapprenticeships.org/apprenticeship-standards/
37 https://www.gov.uk/government/uploads/system/uploads/attachment_data/file/693581/SFR23_2018_Further_Education_and_Skills_SFR_ main_text.pdf
38 https://www.gov.uk/government/uploads/system/uploads/attachment_data/file/660580/SFR62_Nov_2017.pdf
33DfE CONSOLIDATED ANNUAL REPORT AND ACCOUNTS 2017-18
Other performance indicators for starts in apprenticeships39
2016/17 2015/16 2014/15
% of young people (16 to 18 year-olds) beginning apprenticeships
25% 26% 25%
% of advanced or higher level apprenticeship starts among young people
36% 34% 32%
Number of advanced level under-19 Science, Technology, Engineering & Maths apprenticeships39
16,840 18,210 17,040
68% of young people have an A*-C/9-4 in English and mathematics GCSE at 19
The latest data shows GCSE English and mathematics attainment for 19 year-olds has continued to rise. The proportion of 19 year-olds with an A*-C/9-4 in English and mathematics at GCSE rose from 67% in 2016 to 68% in 2017.40 A further 3% of 19 year-olds have equivalent qualifications. In addition, the proportion of young people who fail to reach this level at 16, but have done so by 19, rose from 22% in 2015 to 24% in 2016 and 26% in 2017.
Further Education
79% of FE and skills providers were rated ‘good’ or ‘outstanding’ overall
As at 31 August 2017, 79% of FE and skills providers were rated good or outstanding at their most recent inspection, a slight decrease from 81% in August 2016. Overall, 69% of General Further Education Colleges (GFECs), 80% of independent learning providers (including employer providers), and 81% of Sixth Form Colleges (SFCs) were good or outstanding.41 Data is not comparable before 2016 when a new framework was introduced, so no trend analysis has been provided.
The number of SFCs judged good or outstanding has reduced by a fifth. At 81%, this is the first decline in three years which can be partly attributed to mergers of good or outstanding colleges with poorly performing colleges to help drive up performance.
In autumn 2017, we launched a £15 million Strategic College Improvement Fund and a National Leaders for Further Education programme to support improvement in colleges. The FE Commissioner’s (FEC’s) role has also been extended to include support for colleges in raising standards.42
44 colleges subject to formal intervention due to poor financial health
As at 31 August 2017, there were 35 colleges in intervention due to poor financial health43 (31 August 2016: 40). Colleges that are in inadequate financial health can be referred to the FEC, who will conduct an intervention assessment. The FEC makes recommendations for improvement, including changes to leadership and governance. Where there are concerns about the long-term viability of a college, the FEC conducts an intervention structure and prospects appraisal, to consider whether structural change is needed to provide financial stability and meet the educational needs of the area.
The area reviews of post-16 education and training institutions focused on GFECs and SFCs. The aim was to help institutions become more financially sustainable and meet local educational and economic needs. Implementation of the 376 agreed recommendations from 37 published area reviews is underway. Recommendations included structural change such as mergers of colleges and conversion of SFCs to academies, and non-structural such as inter-college curriculum planning. The government provided support to colleges implementing the recommendations through transition grants and a Restructuring Facility. By January 2018, over half of the proposed 58 mergers and 31 SFC conversions to academies had been implemented.
39 https://www.gov.uk/government/uploads/system/uploads/attachment_data/file/601882/apprenticeships-level-SSA-framework-data-tool-starts -v1.xlsm
40 https://www.gov.uk/government/statistics/level-2-and-3-attainment-by-young-people-aged-19-in-2017
41 https://www.gov.uk/government/statistics/further-education-and-skills-inspections-and-outcomes-as-at-31-august-2017
42 https://www.gov.uk/government/statistical-data-sets/monthly-management-information-ofsteds-school-inspections-outcomes#history
43 https://www.gov.uk/government/publications/esfa-current-notices-of-concern

34 DfE CONSOLIDATED ANNUAL REPORT AND ACCOUNTS 2017-18
Higher Education
In September 2017, the Prime Minister announced that the repayment threshold for post-2012 student loans would increase to £25,000 from April 2018. This means that students only begin to repay their loans when their income exceeds £25,000 – the previous threshold was £21,000. This was followed by the government announcement in October 2017 freezing the tuition fee cap at £9,250. A major review of post-18 education and funding was launched in February 2018 and aims to ensure the system is giving everyone a genuine choice between high quality technical, vocational and academic routes, students and taxpayers are getting value for money, and employers can access the skilled workforce they need. This review will conclude in early 2019.
The Department successfully completed the first sale from the pre-2012 English student loan book in December 2017, raising £1.7 billion in sales proceeds. This is part of a programme of sales which aims to raise between £9.2 billion and £12 billion proceeds in total by 2021-22.
20% of 18 year-olds from the lowest participation quintile entered full-time undergraduate HE in December 2017
The government has a goal of doubling the proportion of 18 year-olds from disadvantaged backgrounds progressing to HE in 2020 compared to 2009. 20.4% of 18 year-olds from disadvantaged areas entered full-time undergraduate HE, per the latest data published in December 2017.44 This is up from 13.6% in 2009. The goal is measured by data from Universities and Colleges Admissions Service (UCAS). For all 18 year-olds, the application rate was 37% and the entry rate was 33%.45,46
The Higher Education Funding Council for England’s (HEFCE’s) £120 million National Collaborative Outreach Programme continued to run throughout the year. It targeted areas where progression to HE by those from disadvantaged backgrounds is low overall and lower than expected. As at March 2018, over 1,200 schools were actively engaged.
305,315 full-time undergraduate BAME enrolments in HE
The government also aims to increase BAME participation in HE by 20% between 2014 and 2020, measured using full-time undergraduate enrolments at UK HE providers. In 2016/17 there were 305,315 full-time undergraduate BAME enrolments at UK HE institutions.47 This has increased by 14% from 268,300 in 2014/15 and 6% from 287,270 in 2015/16.
The Department supported wider participation in HE through the Higher Education and Research Act, and other reforms. The OfS was established on 1 January 2018 and on 1 April 2018, the regulatory, funding and teaching quality functions of HEFCE and the widening participation and access functions of the Office for Fair Access (OFFA) were transferred to the OfS. The OfS has a statutory duty to consider the need to promote equality of opportunity for students as it relates to access and participation in HE. Responsibility for widening access to HE is now in one organisation, with more sanctions available where there are concerns about performance.
44 https://www.ucas.com/file/140396/download?token=TC7eMH9W
45 https://www.ucas.com/file/147891/download?token=sjxwG1wA
46 https://www.ucas.com/corporate/data-and-analysis/ucas-undergraduate-releases/ucas-undergraduate-analysis-reports/2017-end-cycle-report
47 https://www.hesa.ac.uk/news/11-01-2018/sfr247-higher-education-student-statistics/numbers
35DfE CONSOLIDATED ANNUAL REPORT AND ACCOUNTS 2017-18
In our guidance to the OfS in February 2018 we continued to set out our expectations that HE providers focus on these goals as part of their activity to widen participation through their access and participation plans (previously access agreements). Providers expect to spend over £860 million on measures to widen access and success in HE through agreements in place for 2018-19.
Teaching Excellence and Student Outcomes Framework
The Department’s Teaching Excellence and Student Outcomes Framework (TEF) was developed in 2016 to assess HE providers on the quality of their teaching. It is intended to drive up the standard of their teaching and provide clear information to students about where they are likely to achieve the best teaching and outcomes. Assessment is based on key metrics including student feedback, non-continuation rates and progression to highly skilled employment and further study, as well as additional contextual information submitted by the provider.
The results of year 3 of the TEF were published in June 2018. There are now 296 providers with TEF ratings: 93 Gold, 134 Silver, 62 Bronze and 27 Provisional. The Group is working to extend the TEF to subject level and the second year of pilots will begin in autumn 2018. The Group expects the independent review of the TEF, as required by the Higher Education and Research Act 2017, to take place in 2018/19.
Other indicators for preparedness for adult life
2016/17 2015/16
Percentage of 18 year-olds in employment, education or training48
90% 89%
Percentage of young people achieving a technical level by age 1949 14% 13%
Number of pupils achieving the Technical Baccalaureate50
246 241
Level 3 attainment of students aged 16 to 18 in state-funded schools and colleges50
Academic students – average points score
31.3 30.6
Tech level students – average points score
32.3 30.8
Applied general students – average points score
35.7 34.7
Everyone achieving their full potential in rewarding careers
We want people of all ages to have the opportunities to build a rewarding career, boosting skills and confidence to make the leap from education into work. We also enforced the legal requirement for all employers to report their gender pay gap.
Career and lifelong learning
In December 2017, the government published its plan for raising the quality of careers provision in England, Careers strategy: making the most of everyone’s skills and talents.51
The strategy is based on eight Gatsby Benchmarks, which define excellence in careers provision. Schools and colleges are expected to use the Gatsby Benchmarks to develop and improve their careers provision, meeting them all by the end of 2020. The Department will support The Careers & Enterprise Company in achieving this ambition, including by creating 20 Careers Hubs and training Careers Leaders in 500 schools and colleges.
The publicly funded National Careers Service provides free, up to date, impartial information, advice and guidance on careers, skills and the labour market in England. In the past year, the service provided 474,000 face-to-face interactions with individuals, 20 million website visits and over 200,000 calls, web chats and emails to adults and young people.
These important steps will give people the best possible preparation to move into a job, or training that enables them – whatever their background or wherever they live – to have a fulfilling life.
The government is committed to exploring ambitious new approaches to encouraging lifelong learning. We announced in the Autumn Budget 2017 a National Retraining Scheme which is due to launch by the end of this parliament. The scheme will include a phased series of interventions, starting with a focus on digital and construction sectors – areas where we know there is a very strong case for action. The scheme will be driven by a partnership between business,
48 https://www.gov.uk/government/statistics/participation-in-education-training-and-employment-2016
49 https://www.gov.uk/government/statistics/level-2-and-3-attainment-by-young-people-aged-19-in-2017
50 https://www.gov.uk/government/statistics/a-level-and-other-16-to-18-results-2016-to-2017-revised
51 https://www.gov.uk/government/publications/careers-strategy-making-the-most-of-everyones-skills-and-talents
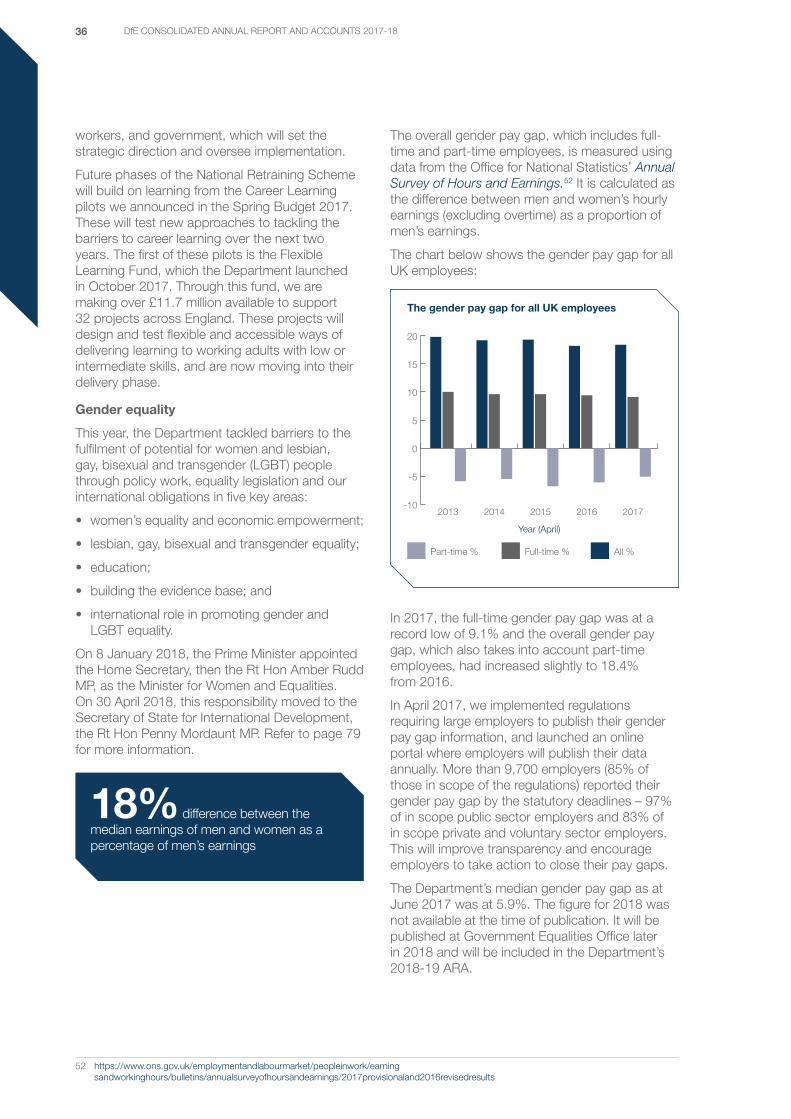
36 DfE CONSOLIDATED ANNUAL REPORT AND ACCOUNTS 2017-18
workers, and government, which will set the strategic direction and oversee implementation.
Future phases of the National Retraining Scheme will build on learning from the Career Learning pilots we announced in the Spring Budget 2017. These will test new approaches to tackling the barriers to career learning over the next two years. The first of these pilots is the Flexible Learning Fund, which the Department launched in October 2017. Through this fund, we are making over £11.7 million available to support 32 projects across England. These projects will design and test flexible and accessible ways of delivering learning to working adults with low or intermediate skills, and are now moving into their delivery phase.
Gender equality
This year, the Department tackled barriers to the fulfilment of potential for women and lesbian, gay, bisexual and transgender (LGBT) people through policy work, equality legislation and our international obligations in five key areas:
• women’s equality and economic empowerment;
• lesbian, gay, bisexual and transgender equality;
• education;
• building the evidence base; and
• international role in promoting gender and LGBT equality.
On 8 January 2018, the Prime Minister appointed the Home Secretary, then the Rt Hon Amber Rudd MP, as the Minister for Women and Equalities. On 30 April 2018, this responsibility moved to the Secretary of State for International Development, the Rt Hon Penny Mordaunt MP. Refer to page 79 for more information.
18% difference between the median earnings of men and women as a percentage of men’s earnings
The overall gender pay gap, which includes full-time and part-time employees, is measured using data from the Office for National Statistics’ Annual Survey of Hours and Earnings.52 It is calculated as the difference between men and women’s hourly earnings (excluding overtime) as a proportion of men’s earnings.
The chart below shows the gender pay gap for all UK employees:
-10
-5
0
5
10
15
20
Part-time % Full-time % All %
20172016201520142013
The gender pay gap for all UK employees
Year (April)
In 2017, the full-time gender pay gap was at a record low of 9.1% and the overall gender pay gap, which also takes into account part-time employees, had increased slightly to 18.4% from 2016.
In April 2017, we implemented regulations requiring large employers to publish their gender pay gap information, and launched an online portal where employers will publish their data annually. More than 9,700 employers (85% of those in scope of the regulations) reported their gender pay gap by the statutory deadlines – 97% of in scope public sector employers and 83% of in scope private and voluntary sector employers. This will improve transparency and encourage employers to take action to close their pay gaps.
The Department’s median gender pay gap as at June 2017 was at 5.9%. The figure for 2018 was not available at the time of publication. It will be published at Government Equalities Office later in 2018 and will be included in the Department’s 2018-19 ARA.
52 https://www.ons.gov.uk/employmentandlabourmarket/peopleinwork/earning sandworkinghours/bulletins/annualsurveyofhoursandearnings/2017provisionaland2016revisedresults
37DfE CONSOLIDATED ANNUAL REPORT AND ACCOUNTS 2017-18
We have also taken action to address the causes of the gender pay gap related to education, participation in work, policies to support family life, and women in managerial and board roles.
25% of FTSE 350 board positions held by women
The Department also made progress in the representation of women on company boards; 24.5% of FTSE 350 board positions were held by women in October 2017,53 up from 23% in 2016. Following the success of the Davies Review, the Hampton-Alexander Review53 was published in November 2016 with support from the government. It set out recommendations to further increase representation.
Other indicators for the Government Equalities Office are set out below:
Government Equalities Office 2017 2016
Percentage of FTSE 100 senior executive leadership positions held by women
25% 25%
Percentage of FTSE 250 senior executive leadership positions held by women
24% N/A
53 https://ftsewomenleaders.com/wp-content/uploads/2017/11/Hampton_Alexander_Review_Report_FINAL_8.11.17.pdf

38 DfE CONSOLIDATED ANNUAL REPORT AND ACCOUNTS 2017-18
FORWARD LOOK
Going forward, our vision is to provide world-class education, training and care for everyone, whatever their background. This will make sure that everyone has the chance to reach their potential, and live a more fulfilled life. It will also create a more productive economy, so that our country is fit for the future.
As we strive to achieve our vision of a world-class education, training and care system, seven principles will guide our work. These principles will help guide our reforms and plans. The principles are cross-cutting and will shape everything we do as a department, from strategy development through to delivery.
World-class means:
• ensuring our academic standards match and keep pace with key comparator nations;
• striving to bring our technical education standards in line with leading international systems; and
• ensuring that education builds character, resilience and well-being.
To achieve this we will:
• remember that in education and care, by far the most important factor is the people delivering it – so we will strive to recruit, develop and retain the best;
• prioritise in all we do, the people and places left behind – the most disadvantaged;
• protect the autonomy of institutions by intervening only where clear boundaries are crossed; and
• make every pound of our funding count.

39DfE CONSOLIDATED ANNUAL REPORT AND ACCOUNTS 2017-18
SUSTAINABILITY PERFORMANCE
BETTER REGULATIONThe Small Business, Enterprise and Employment Act 201554 and the Enterprise Act 201655 strengthen the government’s focus on reducing the overall burden of regulation on the business, voluntary and community sectors. The Department’s stakeholders are: privately funded nurseries; childminders; privately funded independent schools; residential holiday schemes for disabled children; Higher Education Institutes (HEIs); and FE colleges.
Much of our regulation aims to safeguard children and ensure they have a good education, and that there are enforceable standards.
Business Impact Target (BIT)
The 2015-17 Parliament committed to reduce the impact of regulatory burdens on business by £10 billion between 2015 and 2020. The revised commitment between 2017-2022 is £9 billion.
The second BIT reporting period became the final reporting period of the 2015-17 Parliament. The BIT: Second Report 2016-2017,56 which replaced the second annual report, reported that the Department introduced nine regulatory provisions between 27 May 2016 and 8 June 2017 that contributed towards the BIT.
The BIT: First Annual Report 2017-2018 will report that the Department did not introduce any regulatory provisions between 9 June 2017 and 20 June 2018 that contributed to the BIT.
Regulatory provisions introduced
During 2017-18, the Department introduced the following regulations affecting business:
• Changes to the statutory framework for the Early Years Foundation Stage;57
• Paediatric First Aid and Childcare Staff GCSE requirements;58
• The Equality Act 2010 (Gender Pay Gap Information) Regulations 2017;59
• The Equality Act 2010 (General Qualifications Bodies) (Appropriate Regulator and Relevant Qualifications) (Amendment) (England) Regulations 2017;60
• The Apprenticeships (Miscellaneous Provisions) Regulations 2017;61 and
• Children’s Services and Skills (Fees and Frequency of Inspections) (Children’s Homes etc.) (Amendment) Regulations 2017.62
Impact assessments
Regulatory impact assessments are required before the Department makes changes to regulatory measures and additionally, in some cases, before it consults on making the proposed changes. The Department asked the Regulatory Policy Committee to give opinions on four impact assessments during the year. Of these, three were rated as ‘fit for purpose’ at first submission. The impact assessment which the committee opinion rated as not fit for purpose was resubmitted and later given a fit-for-purpose rating.
54 https://www.legislation.gov.uk/ukpga/2015/26/contents/enacted
55 https://www.legislation.gov.uk/ukpga/2016/12/contents/enacted
56 https://www.gov.uk/government/publications/business-impact-target-bit-annual-report-2016-to-2017
57 https://www.gov.uk/government/publications/early-years-foundation-stage-framework--2
58 https://www.gov.uk/guidance/early-years-qualifications-finder#paediatric-first-aid-pfa
59 https://www.legislation.gov.uk/ukdsi/2017/9780111152010
60 https://www.legislation.gov.uk/uksi/2017/705/contents/made
61 https://www.legislation.gov.uk/uksi/2017/1310/contents/made
62 https://www.legislation.gov.uk/uksi/2017/245/contents/made

40 DfE CONSOLIDATED ANNUAL REPORT AND ACCOUNTS 2017-18
Post implementation reviews
All new regulations that have a significant impact on the business sector must include a clause allowing for their review at five years and/or removal at seven years after coming into force, unless a case is made for their retention. The Department had no regulations in scope in this reporting period.
Alternatives to regulation
Following the 2012 Analytical Review commissioned by the Secretary of State, the Department developed five policy tests as a framework for improving policymaking, and later introduced five delivery tests designed to flesh out the key delivery issues that should be considered. By questioning the purpose of the policy, the role of government, the evidence base, the creativity and deliverability of the policy, these jargon free and challenging tests help teams to consider alternative approaches, tools and methods.
The Department has established a Behavioural Insights Unit to embed behavioural science into the Department’s policy-making process. Its aims are to: support the Department to use behavioural insights to tackle policy challenges; help commission high quality behavioural research; and build the Department’s knowledge and ability to apply behavioural insights.
SUSTAINABILITYIn 2017-18 the Department met or exceeded the Greening Government Commitments (GGC)63 targets for greenhouse gas (GHG) reduction, water, paper use, waste arising and recycling as well as reducing associated financial costs. We are negotiating with BEIS a stretching, new, GHG reduction target for 2019-20. This new target is expected to be a 56% reduction by 2019-20. It will replace the current 45% target from 2018-19 and builds on our previous success in this area.
Strategy
Sustainability is about applying economic, social and environmental thinking to an issue and paying particular attention to the long-term consequences. It can be thought of as a long-term, integrated approach to achieving quality of life improvements while respecting the need to live within environmental limits.
We subscribe to a number of targets including the mandatory GGC for reducing energy, water, paper and other resource use, reducing travel and managing waste.
Scope
The data below shows our present position for 2017-18 against a 2009-10 baseline (unless otherwise stated). Environmental data is for a 12 month period from January 2017 to December 2017.
The Department reports on all its Agencies, and NDPBs including HEFCE, SFA, and SLC.
We are unable to report data from locations where landlords do not provide data.
Governance and data validation
The Ministry of Justice (MoJ) Estates Directorate provides a management service for the majority of the Department’s property portfolio. However, overall responsibility for Sustainable Operations remains with the Department’s executive team.
Internal data validation checks are carried out by the MoJ’s Sustainable Operations Team and its data contractors and external validation audits of GGC data are carried out on Department for Environment, Food and Rural Affairs’ (Defra) behalf by the Building Research Establishment.
GHG conversion factors used in this report can be found in the Government environmental impact reporting requirements for business.64
63 https://www.gov.uk/government/publications/greeninggovernment-commitments-2016-to-2020
64 https://www.gov.uk/government/collections/government-conversion-factors-for-company-reporting
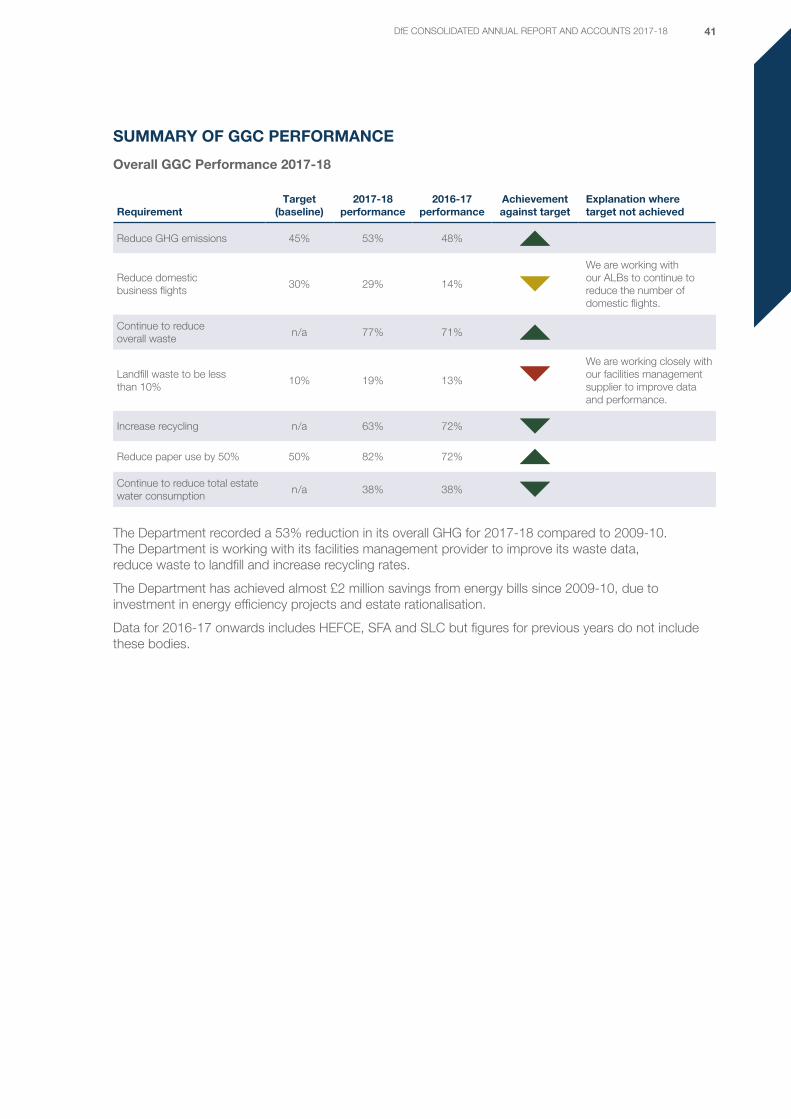
41DfE CONSOLIDATED ANNUAL REPORT AND ACCOUNTS 2017-18
SUMMARY OF GGC PERFORMANCE
Overall GGC Performance 2017-18
RequirementTarget
(baseline)2017-18
performance2016-17
performanceAchievement against target
Explanation where target not achieved
Reduce GHG emissions 45% 53% 48%
Reduce domestic business flights
30% 29% 14%
We are working with our ALBs to continue to reduce the number of domestic flights.
Continue to reduce overall waste
n/a 77% 71%
Landfill waste to be less than 10%
10% 19% 13%
We are working closely with our facilities management supplier to improve data and performance.
Increase recycling n/a 63% 72%
Reduce paper use by 50% 50% 82% 72%
Continue to reduce total estate water consumption
n/a 38% 38%
The Department recorded a 53% reduction in its overall GHG for 2017-18 compared to 2009-10. The Department is working with its facilities management provider to improve its waste data, reduce waste to landfill and increase recycling rates.
The Department has achieved almost £2 million savings from energy bills since 2009-10, due to investment in energy efficiency projects and estate rationalisation.
Data for 2016-17 onwards includes HEFCE, SFA and SLC but figures for previous years do not include these bodies.

42 DfE CONSOLIDATED ANNUAL REPORT AND ACCOUNTS 2017-18
GHG AND FINANCIAL COSTS 2017-18
2017-18 2016-17 2015-162009-10baseline
Non-financial indicators (tCO2e)
Total Gross Scope 1 (Direct) GHG emissions
2,021 2,443 2,279 3,971
Total Gross Scope 2 (Energy indirect) emissions
6,806 8,216 9,755 17,465
Total Gross Scope 3 (Official business travel) emissions
3,520 3,112 4,881 5,099
Total emissions – Scope 1, 2 and 3 12,347 13,771 16,915 26,535
Non-financial indicators (MWh)
Electricity: non-renewable 17,803 16,710 20,957 34,270
Electricity: renewable 283 2,865 13 -
Gas 7,644 8,643 11,724 21,511
Gas oil 2,047 2,884 - -
Steam 749 737 308 2,334
Total energy 28,526 31,839 33,002 58,115
Financial indicators (£000)
Expenditure on energy 1,665 2,391 1,584 3,594
CRC Expenditure 73 109 151 N/A
Expenditure on official business travel 15,081 11,588 9,042 10,163
Expenditure on domestic air travel 24 149 40 21
Total expenditure on energy and business travel
16,843 14,237 10,817 13,778
TRAVEL 2017-18
2017-18 2016-17 2015-162009-10baseline
Domestic air travel
Number of flights 1,270 1,550 1,027 1,794
Non-financial indicators (tCO2e)
Flights 185 299 350 184
Rail 0.2 0.4 0.3 0.4
Total 185 300 350 184
The number of domestic flights has reduced by 29% against the Department’s 2009-10 baseline and improved from 2016-17 performance. SLC, included in our reporting from 2016-17, flies domestically for operational reasons and to save overall costs.
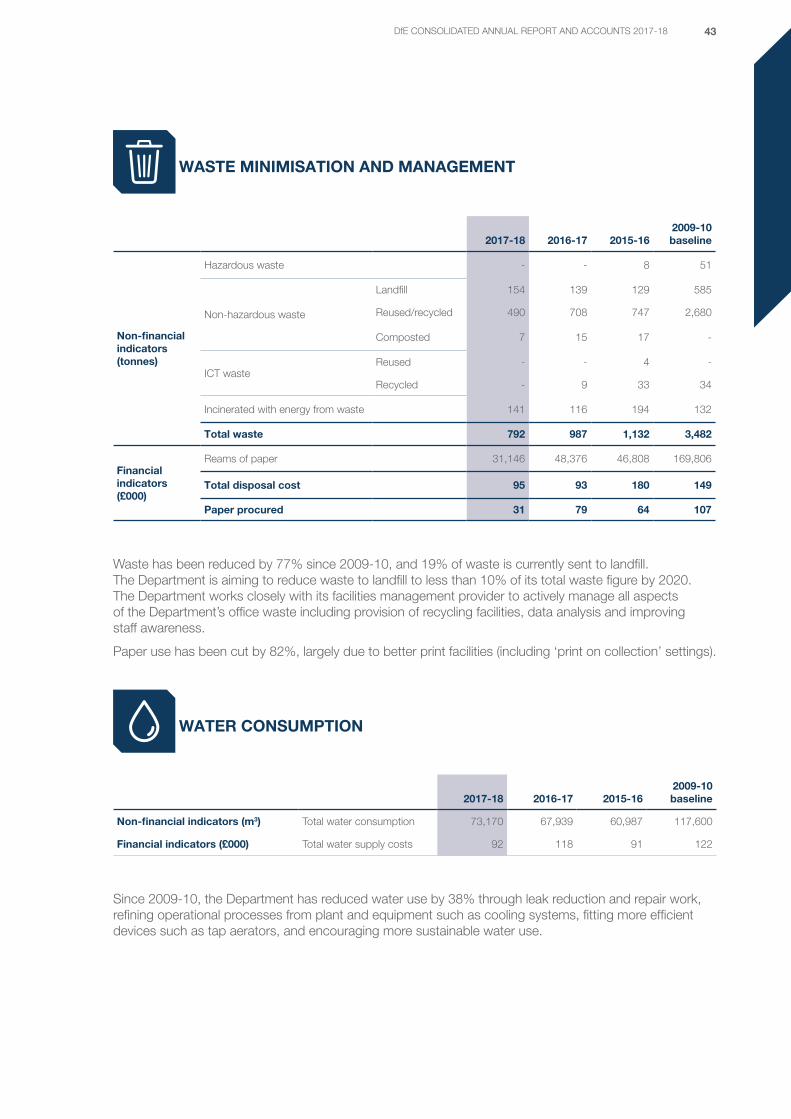
43DfE CONSOLIDATED ANNUAL REPORT AND ACCOUNTS 2017-18
WASTE MINIMISATION AND MANAGEMENT
2017-18 2016-17 2015-162009-10baseline
Non-financial indicators (tonnes)
Hazardous waste - - 8 51
Non-hazardous waste
Landfill 154 139 129 585
Reused/recycled 490 708 747 2,680
Composted 7 15 17 -
ICT wasteReused - - 4 -
Recycled - 9 33 34
Incinerated with energy from waste 141 116 194 132
Total waste 792 987 1,132 3,482
Financial indicators (£000)
Reams of paper 31,146 48,376 46,808 169,806
Total disposal cost 95 93 180 149
Paper procured 31 79 64 107
Waste has been reduced by 77% since 2009-10, and 19% of waste is currently sent to landfill. The Department is aiming to reduce waste to landfill to less than 10% of its total waste figure by 2020. The Department works closely with its facilities management provider to actively manage all aspects of the Department’s office waste including provision of recycling facilities, data analysis and improving staff awareness.
Paper use has been cut by 82%, largely due to better print facilities (including ‘print on collection’ settings).
WATER CONSUMPTION
2017-18 2016-17 2015-162009-10baseline
Non-financial indicators (m3) Total water consumption 73,170 67,939 60,987 117,600
Financial indicators (£000) Total water supply costs 92 118 91 122
Since 2009-10, the Department has reduced water use by 38% through leak reduction and repair work, refining operational processes from plant and equipment such as cooling systems, fitting more efficient devices such as tap aerators, and encouraging more sustainable water use.
44 DfE CONSOLIDATED ANNUAL REPORT AND ACCOUNTS 2017-18
Other sustainability commitments
The Department is committed to procuring sustainably and reports against a number of transparency commitments as part of the GGC framework. Progress is summarised below.
Biodiversity action planning
The MoJ provides support and assistance to the Department on ecology. Our staff participate within the MoJ ecology network and supported Bio Blitzes, to record biodiversity on our estate.
Sustainable procurement
We have an in-house procurement team who ensure sustainability clauses are embedded within the Department’s facilities management and ICT contracts. New contracts require that suppliers meet the Government Buying Standards. New procurement staff are provided with training on sustainable procurement.
Procurement of food and catering services
All food supplied is produced to UK or equivalent standards. Menus are designed to reflect in-season produce and purchased locally where feasible to do so to reduce food miles and to assist in supporting our local suppliers. The Government Buying Standard for Food and Defra’s Food Balanced Scorecard are requirements in the Department’s Future Facilities Management contract specification.
Climate change adaptation
Where required, climate resilient designs are incorporated in retrofit projects and new builds.
Sustainable construction
All new build/major refurbishments are required to achieve Building Research Establishment Environmental Assessment Method excellent/very good rating, in line with Government Buying Standards.
Rural proofing
Defra’s rural proofing impact assessment is an integral part of the Department’s approach to developing regulation.
When developing a policy staff are required to consider sustainable development, environmental impacts, and social impacts such as rural
proofing. These issues are built into the impact assessments, ensuring that they are fully evaluated as part of any new policy. For example, the national funding formula includes a sparsity factor that targets funding to small and remote schools, which we know often play a crucial role in the communities they serve.
Governance
The Department undertakes a stringent monitoring regime in relation to GGC performance management. Monthly data reports are produced which feed in to quarterly dashboards. The dashboards are a mechanism for highlighting achievements, reporting on overall progress, identifying risks and outlining proposed mitigation measures.
To ensure the data submitted and used for internal and external reporting is both accurate and consistent, an internal governance and assurance process requires thorough checks, and validation audits of all data and reports are also undertaken. This is supplemented by periodic audits conducted by the Government Internal Audit Agency (GIAA), reported to the Accounting Officer via the Departmental finance function.
In addition to the internal governance process, external audits are also undertaken to assure processes and systems, including methodologies for recording, analysing and verifying data, as well as the calculations for quarterly GGC returns. These external validation audits are carried out on Defra’s behalf by Carbon Smart, who has praised the Department’s good practice in data management.
The vast majority of this report has been compiled using accurately measured data, verified through internal controls. This includes checking samples of automatically generated meter-reading data with manual meter reads. Where complete data sets have not been available, (for example through lack of detail, or due to landlord service charges), internal benchmark figures have been applied based on known parameters and data sets.
When developing a policy, staff are required to consider sustainable development, environmental impacts, and social impacts such as rural proofing. These issues are built into the impact assessments, ensuring that they are fully evaluated as part of any new policy.

45DfE CONSOLIDATED ANNUAL REPORT AND ACCOUNTS 2017-18
FINANCIAL REVIEW OF THE YEAR
INTRODUCTIONFrom a financial perspective, 2017-18 was a year with many significant events, decisions and announcements that have materially shaped spending across a variety of budgets and policy areas for this financial year and for years to come, including:
• implementing a new apprenticeship programme, via the introduction of the Apprenticeship Levy;
• announcing the delivery of an additional £1.3 billion of funding – via the introduction of the NationalFunding Formula – in the schools budget over 2018-19 and 2019-20;
• introducing the 30 Hour Free Childcare entitlement;
• announcing implementation of T Level courses, from September 2022, in construction, digital andeducation & childcare;
• increasing the repayment threshold for post-2012 student loans from £21,000 to £25,000, freezing thetuition fee cap at £9,250; and
• selling the first tranche of pre-2012 student loans.
The following diagram and table explain the different budgets managed by the Department and their purpose. The balances provided below are the actual outturn for the year with figures in brackets representing income. Summary explanations of the budget types are provided below, for more detailed explanations see HMT’s Managing Public Money.65
Total Managed Expenditure
£92.4bn
Teachers’ Pension Scheme
£15.7bn
Annually Managed
Expenditure (AME) £14.2bn
Resource AME (RAME)(£1.6bn)
Capital AME (CAME)£15.8bn
Departmental Expenditure Limit
(DEL)£78.2bn
Capital DEL (CDEL)£4.9bn
Resource DEL (RDEL)£73.3bn
Administration£0.5bn
Programme£72.8bn
65 https://www.gov.uk/government/publications/managing-public-money
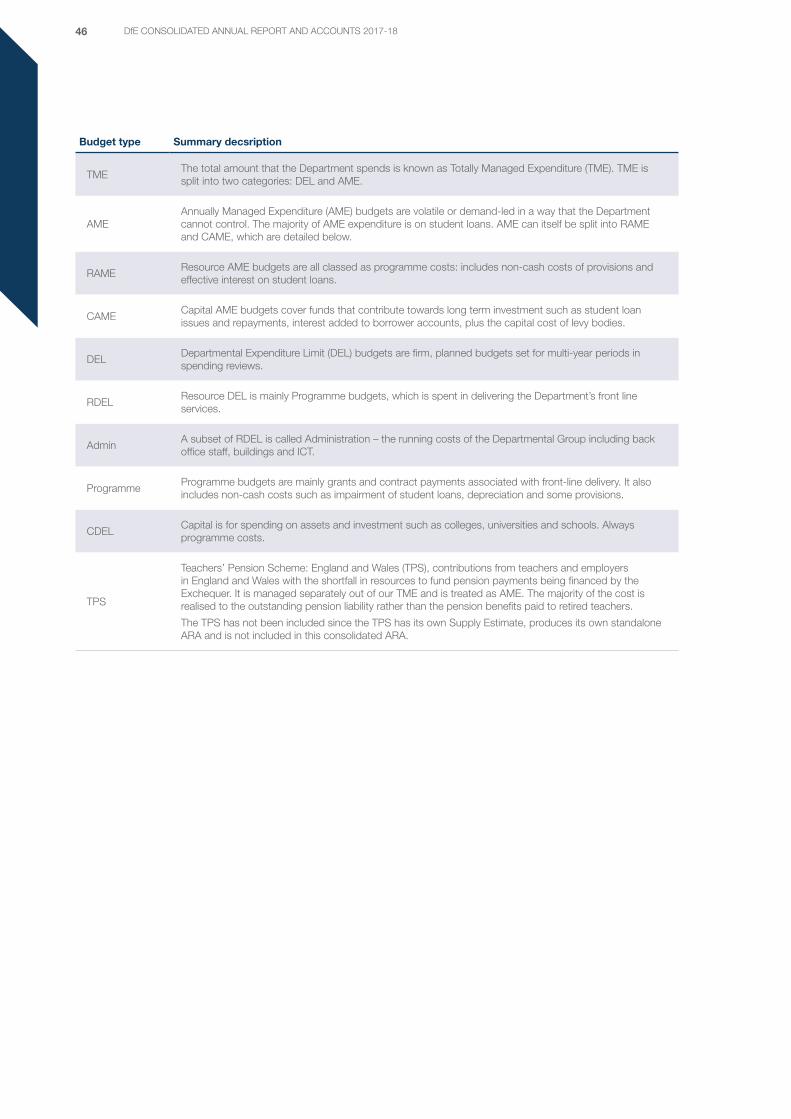
46 DfE CONSOLIDATED ANNUAL REPORT AND ACCOUNTS 2017-18
Budget type Summary decsription
TMEThe total amount that the Department spends is known as Totally Managed Expenditure (TME). TME is split into two categories: DEL and AME.
AMEAnnually Managed Expenditure (AME) budgets are volatile or demand-led in a way that the Department cannot control. The majority of AME expenditure is on student loans. AME can itself be split into RAME and CAME, which are detailed below.
RAMEResource AME budgets are all classed as programme costs: includes non-cash costs of provisions and effective interest on student loans.
CAMECapital AME budgets cover funds that contribute towards long term investment such as student loan issues and repayments, interest added to borrower accounts, plus the capital cost of levy bodies.
DELDepartmental Expenditure Limit (DEL) budgets are firm, planned budgets set for multi-year periods in spending reviews.
RDELResource DEL is mainly Programme budgets, which is spent in delivering the Department’s front line services.
AdminA subset of RDEL is called Administration – the running costs of the Departmental Group including back office staff, buildings and ICT.
ProgrammeProgramme budgets are mainly grants and contract payments associated with front-line delivery. It also includes non-cash costs such as impairment of student loans, depreciation and some provisions.
CDELCapital is for spending on assets and investment such as colleges, universities and schools. Always programme costs.
TPS
Teachers’ Pension Scheme: England and Wales (TPS), contributions from teachers and employers in England and Wales with the shortfall in resources to fund pension payments being financed by the Exchequer. It is managed separately out of our TME and is treated as AME. The majority of the cost is realised to the outstanding pension liability rather than the pension benefits paid to retired teachers.
The TPS has not been included since the TPS has its own Supply Estimate, produces its own standalone ARA and is not included in this consolidated ARA.
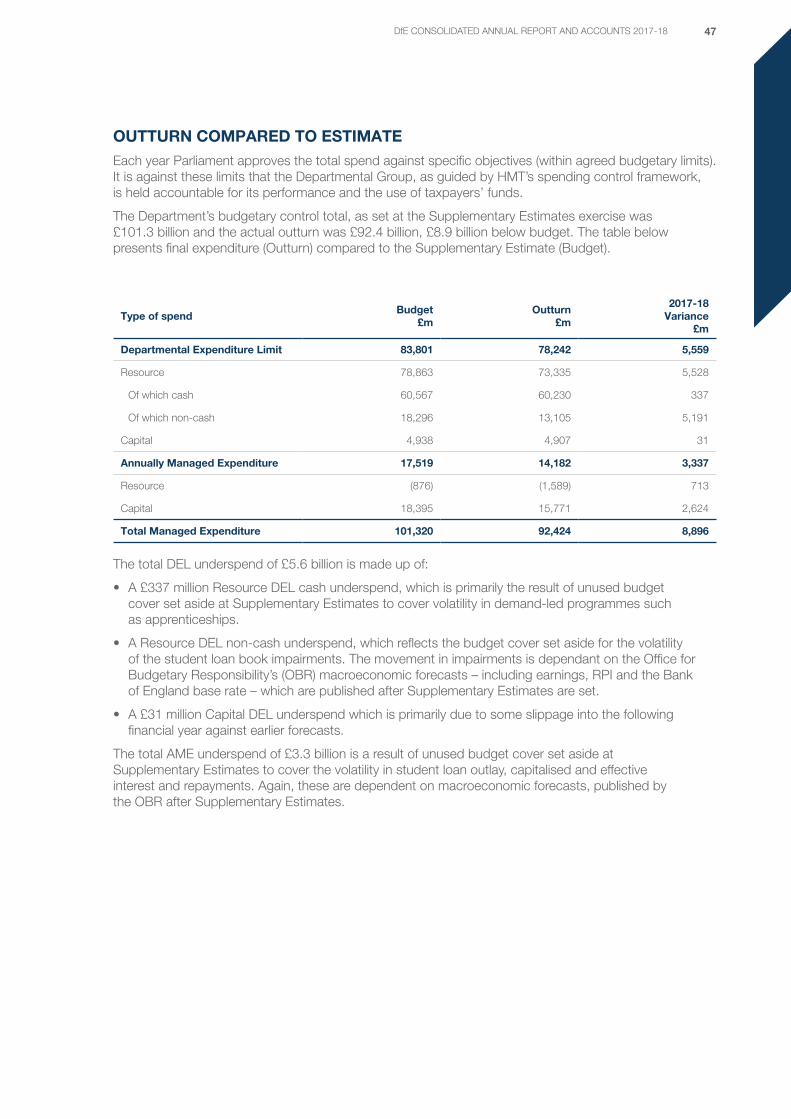
47DfE CONSOLIDATED ANNUAL REPORT AND ACCOUNTS 2017-18
OUTTURN COMPARED TO ESTIMATEEach year Parliament approves the total spend against specific objectives (within agreed budgetary limits). It is against these limits that the Departmental Group, as guided by HMT’s spending control framework, is held accountable for its performance and the use of taxpayers’ funds.
The Department’s budgetary control total, as set at the Supplementary Estimates exercise was £101.3 billion and the actual outturn was £92.4 billion, £8.9 billion below budget. The table below presents final expenditure (Outturn) compared to the Supplementary Estimate (Budget).
Type of spendBudget
£mOutturn
£m
2017-18Variance
£m
Departmental Expenditure Limit 83,801 78,242 5,559
Resource 78,863 73,335 5,528
Of which cash 60,567 60,230 337
Of which non-cash 18,296 13,105 5,191
Capital 4,938 4,907 31
Annually Managed Expenditure 17,519 14,182 3,337
Resource (876) (1,589) 713
Capital 18,395 15,771 2,624
Total Managed Expenditure 101,320 92,424 8,896
The total DEL underspend of £5.6 billion is made up of:
• A £337 million Resource DEL cash underspend, which is primarily the result of unused budget cover set aside at Supplementary Estimates to cover volatility in demand-led programmes such as apprenticeships.
• A Resource DEL non-cash underspend, which reflects the budget cover set aside for the volatility of the student loan book impairments. The movement in impairments is dependant on the Office for Budgetary Responsibility’s (OBR) macroeconomic forecasts – including earnings, RPI and the Bank of England base rate – which are published after Supplementary Estimates are set.
• A £31 million Capital DEL underspend which is primarily due to some slippage into the following financial year against earlier forecasts.
The total AME underspend of £3.3 billion is a result of unused budget cover set aside at Supplementary Estimates to cover the volatility in student loan outlay, capitalised and effective interest and repayments. Again, these are dependent on macroeconomic forecasts, published by the OBR after Supplementary Estimates.
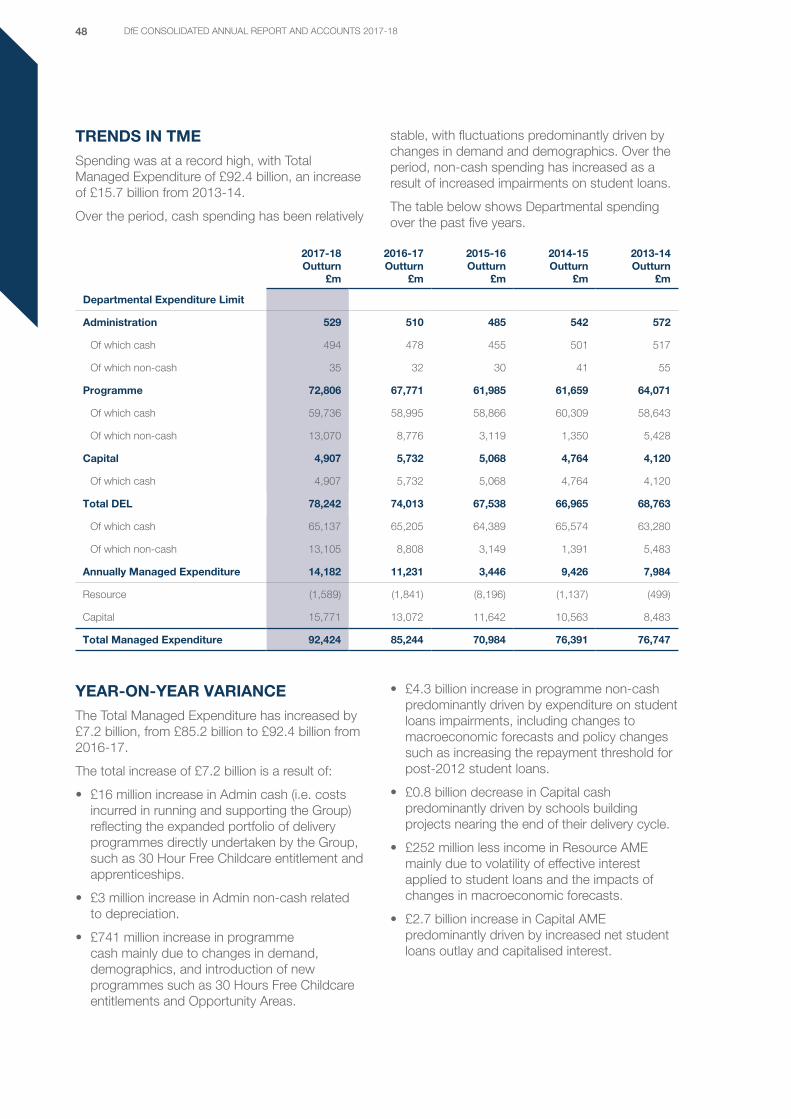
48 DfE CONSOLIDATED ANNUAL REPORT AND ACCOUNTS 2017-18
TRENDS IN TMESpending was at a record high, with Total Managed Expenditure of £92.4 billion, an increase of £15.7 billion from 2013-14.
Over the period, cash spending has been relatively
stable, with fluctuations predominantly driven by changes in demand and demographics. Over the period, non-cash spending has increased as a result of increased impairments on student loans.
The table below shows Departmental spending over the past five years.
2017-18 Outturn
£m
2016-17 Outturn
£m
2015-16 Outturn
£m
2014-15 Outturn
£m
2013-14 Outturn
£m
Departmental Expenditure Limit
Administration 529 510 485 542 572
Of which cash 494 478 455 501 517
Of which non-cash 35 32 30 41 55
Programme 72,806 67,771 61,985 61,659 64,071
Of which cash 59,736 58,995 58,866 60,309 58,643
Of which non-cash 13,070 8,776 3,119 1,350 5,428
Capital 4,907 5,732 5,068 4,764 4,120
Of which cash 4,907 5,732 5,068 4,764 4,120
Total DEL 78,242 74,013 67,538 66,965 68,763
Of which cash 65,137 65,205 64,389 65,574 63,280
Of which non-cash 13,105 8,808 3,149 1,391 5,483
Annually Managed Expenditure 14,182 11,231 3,446 9,426 7,984
Resource (1,589) (1,841) (8,196) (1,137) (499)
Capital 15,771 13,072 11,642 10,563 8,483
Total Managed Expenditure 92,424 85,244 70,984 76,391 76,747
YEAR-ON-YEAR VARIANCEThe Total Managed Expenditure has increased by £7.2 billion, from £85.2 billion to £92.4 billion from 2016-17.
The total increase of £7.2 billion is a result of:
• £16 million increase in Admin cash (i.e. costs incurred in running and supporting the Group) reflecting the expanded portfolio of delivery programmes directly undertaken by the Group, such as 30 Hour Free Childcare entitlement and apprenticeships.
• £3 million increase in Admin non-cash related to depreciation.
• £741 million increase in programme cash mainly due to changes in demand, demographics, and introduction of new programmes such as 30 Hours Free Childcare entitlements and Opportunity Areas.
• £4.3 billion increase in programme non-cash predominantly driven by expenditure on student loans impairments, including changes to macroeconomic forecasts and policy changes such as increasing the repayment threshold for post-2012 student loans.
• £0.8 billion decrease in Capital cash predominantly driven by schools building projects nearing the end of their delivery cycle.
• £252 million less income in Resource AME mainly due to volatility of effective interest applied to student loans and the impacts of changes in macroeconomic forecasts.
• £2.7 billion increase in Capital AME predominantly driven by increased net student loans outlay and capitalised interest.

49DfE CONSOLIDATED ANNUAL REPORT AND ACCOUNTS 2017-18
CASH OUTTURNThe Department spent £77.9 billion cash on funding its programmes and administration costs. Statement of Parliamentary Supply (SoPS) Note 3 (Reconciliation of Net Resource to Cash Outturn) provides more detail on the adjustments made to explain the difference between the £92.4 billion total net outturn in SoPS and the £77.9 billion cash outlay.
The cash outlay was £3.3 billion lower than the Net Cash Requirement Limit in the Supplementary Estimate due to the underspends on both administration and programme cash expenditure (see table under the heading Outturn compared to Estimate). The key reason is that student loan expenditure in Capital AME was £2.6 billion lower than forecast due to unused budget cover set aside at Supplementary Estimates to cover volatility in student loan outlay, capitalised interest and repayments.
SALE OF STUDENT LOAN BOOKIn December 2017, the government completed the sale of part of the Group’s pre-2012 English student loan book, as announced by Ministers. The sale included loans issued by English LAs under the previous (pre-2012) system, specifically those with a statutory repayment due date that falls between 2002 and 2006.
The carrying value of loans sold was £2.6 billion, leading to a loss on disposal of £0.9 billion, this loss has been recorded in the Statement of Comprehensive Net Expenditure (SoCNE).
The loss on the sale recorded in the accounts primarily arises because HMT requires a discount rate of 0.7% to be applied to financial instruments held by government. In comparison investors are exposed to greater risks holding the loans and this is priced into the sale price and proceeds resulting in a significant accounting loss on sale. Investors have also forecasted different cashflows to those used by the Department for our accounts. These arise because the sold loans are not typical of the whole book, primarily in terms of the length of time the loans have been held, and the specific modelling to support the sale was able to draw on different data. However we are content that the model used for valuing the loan book in the departmental accounts remains the most appropriate for valuing the whole book.
Further details on how student loans are valued, including assumptions, can be found in Note 11.3 of the Accounts.
Throughout the process, government’s decision on whether to proceed remained subject to market conditions and a final value for money assessment. The transaction achieved a net sale proceeds value of £1.7 billion, which was above the retention value calculated by government.
Ministers laid before Parliament a report on the sale in accordance with Section 4 of the Sale of Student Loans Act 2008. This provides more detail on the sale arrangements and the extent to which they give value according to HMT’s Green Book rules.
The position of all borrowers, including those whose loans have been sold, will not change as a result of the sale. The sale does not and cannot in any way alter the mechanisms and terms of repayment: sold loans will continue to be serviced by HMRC and SLC on the same basis as equivalent unsold loans. Purchasers have no right to change any of the current loan arrangements or to contact borrowers directly. Those whose loans were sold were notified in writing by SLC within 3 months of the sale, for information only. No action will be required. Government has no plans to change, or to consider changing, the terms of pre-2012 loans.
For details on other major programmes, please see the Performance Analysis section.

50 DfE CONSOLIDATED ANNUAL REPORT AND ACCOUNTS 2017-18
FORWARD LOOKThe Department’s finance function plays a critical role in supporting ministers and the Department to allocate resources effectively to deliver its strategic objectives. Looking ahead to 2018-19 the key areas of focus for the Department’s finance function are:
• Continuing to work with other government departments to support the Brexit negotiations and understand the financial implications from exiting the EU.
• Implementing IFRS 9 Financial Instruments (IFRS 9) which replaces IAS 39. The greatest potential impact relates to the valuation of student loans. Student loans are currently accounted for at amortised cost though we expect that, following the implementation of IFRS 9, these loans will instead be accounted for at fair value through profit and loss.
• Leading and negotiating the Department’s budget for years beyond 2020, as part of Spending Review 2019.
• Supporting the ongoing 4-year programme of sales of pre-2012 English student loans, as announced by the government in November 2013. The student loan book sale in 2017-18 represents the first of this programme of sales. Each sale in this programme will be subject to an assessment of market conditions and value for money before proceeding.
• Supporting the implementation of new programmes and reforms such as T Levels, National Retraining Scheme and replacing apprenticeship frameworks with standards.
• Maintaining focus and discipline in delivering our financial strategy, improving financial capability, governance, control and a cost conscious culture to put us in a good position to deliver our priorities.
THE GROUP’S STATUS AS A GOING CONCERNThe Group is expected to continue as a going concern for the foreseeable future and is not aware of any information or events, either during 2017-18 or following the year-end, that may affect this status. The 2015 Spending Review confirmed this assumption, with funding allocated to the Group for the next four financial years.
Jonathan Slater Accounting Officer 9 July 2018

51DfE CONSOLIDATED ANNUAL REPORT AND ACCOUNTS 2017-18

52 DfE CONSOLIDATED ANNUAL REPORT AND ACCOUNTS 2017-18
53DfE CONSOLIDATED ANNUAL REPORT AND ACCOUNTS 2017-18
ACCOUNTABILITY REPORT

54 DfE CONSOLIDATED ANNUAL REPORT AND ACCOUNTS 2017-18

55DfE CONSOLIDATED ANNUAL REPORT AND ACCOUNTS 2017-18
CORPORATE GOVERNANCE REPORT
OVERVIEWThe purpose of the corporate governance report is to explain the composition and organisation of the Department’s governance structures and show they support the achievement of the Department’s objectives.
DIRECTORS’ REPORT
Ministers and the Management Board
Ministers at 31 March 2018
The Rt Hon Damian Hinds MP Secretary of State for Education
(from 9 January 2018)
Overall responsibility for the Department for Education.
The Rt Hon Nick Gibb MP Minister of State for School Standards
Responsible for the recruitment and retention of teachers, supporting a high quality teaching profession, admissions, national funding formula for schools, curriculum, assessment, school accountability, personal, social health and economic education, alternative provision, preventing bullying in schools, behaviour and attendance, exclusions and alternative provision policy.
ALB responsibility: STRB

56 DfE CONSOLIDATED ANNUAL REPORT AND ACCOUNTS 2017-18
The Rt Hon Anne Milton MP Minister of State for Apprenticeships and Skills
The Minister for Women role transferred out of the Department on 9 January 2018. Penny Mordaunt, the Secretary of State for DfID currently holds the post.
Responsible for apprenticeships including the apprenticeship levy, technical education and skills, T Levels, careers education, post-16 funding, further education colleges, sixth form colleges, adult education (including the National Retraining Scheme, reducing the number of young people who are not in education, employment or training), and the Department’s non-executive board.
ALB responsibility: IFA, CITB, ECITB, FITB
Lord Theodore Agnew Parliamentary Under Secretary of State for the School System
(from 28 September 2017)
Responsible for free schools, university technical colleges and studio schools, academies, faith schools, independent schools, home education and supplementary schools, interventions, school improvement, school governance, school capital investment and counter extremism and integration in schools, further education colleges and sixth form colleges.
ALB responsibility: Aggregator Vehicle PLC, Located Property Limited
Sam Gyimah MP Joint Minister of State for Universities, Science, Research and Innovation with BEIS
(from 9 January 2018)
Responsible for universities and higher education reform, higher education student finance, widening participation and social mobility in higher education, education exports (including international students, international research), review of post-18 education and funding, and tackling extremism in higher education.
ALB responsibility: SLC, HEFCE, OFFA, OfS
Nadhim Zahawi MP Parliamentary Under Secretary of State for Children and Families
(from 9 January 2018)
Responsible for children’s social care, special educational needs, education policy in response to the race disparity audit, safeguarding in schools, disadvantaged pupils, healthy pupils, Early Years policy, childcare policy, inspection and regulation, delivery of 30 hours free childcare offer, and social mobility.
ALB responsibility: OCC, SMC

57DfE CONSOLIDATED ANNUAL REPORT AND ACCOUNTS 2017-18
OUR MANAGEMENTWe are committed to ensuring our Board has the right skills and experience to enable challenge and breadth in our strategic thinking.
Key:
Departmental Board
I Implementation Committee
L Leadership Team
Audit and Risk Committee
Nomination Committee
Implementation Committee Chair
Leadership Team Chair
Audit and Risk Committee Chair
Nomination Committee Chair
Jonathan SlaterPermanent Secretary Accounting Officer
Skills and experienceJonathan’s previous roles in government include being Director General at Cabinet Office, Ministry of Defence and Ministry of Justice.
AppointmentMay 2016
Indra MorrisDirector General Social Care, Mobility and Equalities
Skills and experienceIndra was previously Director General at both HM Treasury and Ministry of Justice.
AppointmentJanuary 2017

58 DfE CONSOLIDATED ANNUAL REPORT AND ACCOUNTS 2017-18
Andrew McCullyDirector General Infrastructure and Funding
Skills and experienceAndrew has had a 25-year career in the civil service and has held a wide range of senior posts. He was made an OBE in 2000.
AppointmentSeptember 2010
Philippa LloydDirector General Higher and Further Education
Skills and experiencePhilippa has been Director General in the Department for Business, Innovation and Skills and the Principal Private Secretary to three different Secretaries of State.
AppointmentJuly 2016
Paul KettDirector General, Education Standards
Skills and experiencePaul has experience in strategy, policy and project delivery. Previous roles include Director of Army Reform for the British Army.
AppointmentFebruary 2017
Howard OrmeChief Financial and Operating Officer Insight, Resources and Transformation
Skills and experienceHoward’s experience ranged across Blue Chip companies and private sector finance. He was previously Director General at the Department for Business, Innovation and Skills.
AppointmentOctober 2016

59DfE CONSOLIDATED ANNUAL REPORT AND ACCOUNTS 2017-18
Richard PennycookLead Non-executive board member
Skills and experienceRichard is chair of Howdens Joinery, Fenwick and the Hut Group, and chair elect of the British Retail Consortium.
AppointmentOctober 2017
Ian Ferguson CBENon-executive board member
Skills and experienceIn 1981, Ian founded Metaswitch Networks, a company that develops telecommunications software. Ian received a CBE for services to education and training in 2005.
AppointmentJanuary 2016
Baroness Ruby McGregor-Smith CBENon-executive board member
Skills and experienceRuby was formerly the Chief Executive of the Mitie Group, a strategic outsourcing company, and was the first Asian woman to be appointed to such a role in the FTSE 250 or FTSE 100. Ruby received a CBE in 2012.
AppointmentDecember 2015
Eileen MilnerChief Executive Education and Skills Funding Agency
Skills and experienceEileen has held a number of senior roles in the technology and public services advisory space. She began her career in local government, specialising in education services, later moving into higher education.
AppointmentNovember 2017

60 DfE CONSOLIDATED ANNUAL REPORT AND ACCOUNTS 2017-18
Mike GreenActing Chief Operating Officer and Director General Insight, Resources and Transformation
Skills and experienceMike was formerly the Director of Capital for ESFA and Director of Commercial in the Department. Before joining the civil service Mike was a civil engineer and spent his career in the private sector in construction and retail.
AppointmentOctober 2017 – Refer to page 73 for further details
Jonathan ClearActing Chief Financial Officer (joint role with Iain King) Insight, Resources and Transformation
Skills and experienceJonathan is a qualified accountant with previous senior finance roles at Department for Work and Pensions and Ministry of Justice.
AppointmentOctober 2017 – Refer to page 73 for further details
Iain KingActing Chief Financial Officer (joint role with Jonathan Clear) Insight, Resources and Transformation
Skills and experienceIain is a qualified accountant with previous senior finance roles at Department for Business, Energy and Industrial Strategy and Department for Business, Innovation and Skills.
AppointmentOctober 2017 – Refer to page 73 for further details
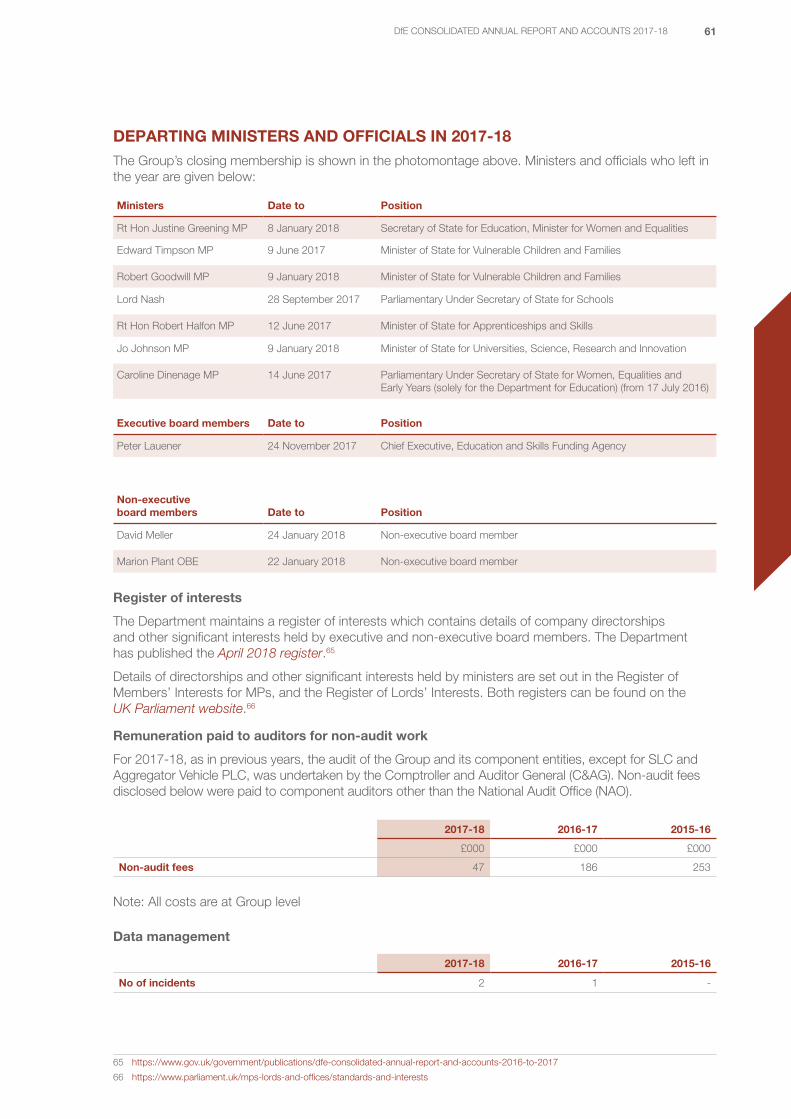
61DfE CONSOLIDATED ANNUAL REPORT AND ACCOUNTS 2017-18
DEPARTING MINISTERS AND OFFICIALS IN 2017-18The Group’s closing membership is shown in the photomontage above. Ministers and officials who left in the year are given below:
Ministers Date to Position
Rt Hon Justine Greening MP 8 January 2018 Secretary of State for Education, Minister for Women and Equalities
Edward Timpson MP 9 June 2017 Minister of State for Vulnerable Children and Families
Robert Goodwill MP 9 January 2018 Minister of State for Vulnerable Children and Families
Lord Nash 28 September 2017 Parliamentary Under Secretary of State for Schools
Rt Hon Robert Halfon MP 12 June 2017 Minister of State for Apprenticeships and Skills
Jo Johnson MP 9 January 2018 Minister of State for Universities, Science, Research and Innovation
Caroline Dinenage MP 14 June 2017 Parliamentary Under Secretary of State for Women, Equalities and Early Years (solely for the Department for Education) (from 17 July 2016)
Executive board members Date to Position
Peter Lauener 24 November 2017 Chief Executive, Education and Skills Funding Agency
Non-executive board members Date to Position
David Meller 24 January 2018 Non-executive board member
Marion Plant OBE 22 January 2018 Non-executive board member
Register of interests
The Department maintains a register of interests which contains details of company directorships and other significant interests held by executive and non-executive board members. The Department has published the April 2018 register.65
Details of directorships and other significant interests held by ministers are set out in the Register of Members’ Interests for MPs, and the Register of Lords’ Interests. Both registers can be found on the UK Parliament website.66
Remuneration paid to auditors for non-audit work
For 2017-18, as in previous years, the audit of the Group and its component entities, except for SLC and Aggregator Vehicle PLC, was undertaken by the Comptroller and Auditor General (C&AG). Non-audit fees disclosed below were paid to component auditors other than the National Audit Office (NAO).
2017-18 2016-17 2015-16
£000 £000 £000
Non-audit fees 47 186 253
Note: All costs are at Group level
Data management
2017-18 2016-17 2015-16
No of incidents 2 1 -
65 https://www.gov.uk/government/publications/dfe-consolidated-annual-report-and-accounts-2016-to-2017
66 https://www.parliament.uk/mps-lords-and-offices/standards-and-interests

62 DfE CONSOLIDATED ANNUAL REPORT AND ACCOUNTS 2017-18
There were two protected personal data related incidents in 2017-18 which were reported to the Information Commissioner’s Office. On subsequent investigation, evidence to suggest that personal data was compromised on one of the personal data related incidents; further detail on data security and compliance is held within Annex A.
Political donations and expenditure
The Department has not made any political donations during 2017-18 (2016-17: £nil).
Financial instruments and exposure to risk
As the cash requirements of the Group are met from the Consolidated Fund, through the Parliamentary Supply process, financial instruments play a more limited role in creating and managing risk than would apply to a non-public sector body of a similar size. However, the Group is exposed to some level of risk generated by the Department’s student loan portfolio, which is classified as a financial instrument.
Further information on the risks associated with financial instruments are set out at Note 9 to the Accounts.
Research spending
2017-18£m
2016-17£m
2015-16£m
Department 19.6 14.2 8.1
Agencies 1.0 0.8 0.6
NDPBs 2.0 1.7 2.4
22.6 16.7 11.1
Of which:
Central research 5.1 6.3 6.6
Policy units/policy evaluation research
17.5 10.4 4.5
Key research strands during the year were International Evidence including Trends in International Mathematics and Science Study (TIMSS), Programme of International Student Assessment (PISA), Study of Early Education and Development (SEED), the Longitudinal Study of Young People in England: Cohort 2 and approximately 190 other research projects. Further details of these research strands are available online.67
Board’s declaration
So far as I am aware, there is no relevant audit information of which the external auditors are unaware. The Board members and I have taken all appropriate steps to become aware of any relevant audit information, and to establish that the external auditors are suitably informed.
67 https://www.gov.uk/government/organisations/department-for-education/about/research
63DfE CONSOLIDATED ANNUAL REPORT AND ACCOUNTS 2017-18
STATEMENT OF ACCOUNTING OFFICER’S RESPONSIBILITIES
Under the Government Resources and Accounts Act 2000 (GRAA), HMT has directed the Department for Education to prepare, for each financial year, consolidated resource accounts detailing the resources acquired, held or disposed of, and the use of resources during the year by the Department (inclusive of its executive agencies) and its sponsored non-departmental public bodies designated by order made under the GRAA by Statutory Instrument 2018/313 (together known as the ‘Departmental Group’, consisting of the Department and sponsored bodies listed at Note 23 to the Accounts). The accounts are prepared on an accruals basis and must give a true and fair view of the state of affairs of the Department and the Departmental Group and of the net resource outturn, application of resources, changes in taxpayers’ equity and cash flows of the Departmental Group for the financial year.
In preparing the accounts, the Accounting Officer of the Department is required to comply with the requirements of the Government’s Financial Reporting Manual (FReM)68 and in particular to:
• observe the Accounts Direction issued by the HMT, including the relevant accounting and disclosure requirements, and apply suitable accounting policies on a consistent basis;
• ensure that the Department has in place appropriate and reliable systems and procedures to carry out the consolidation process;
• make judgements and estimates on a reasonable basis, including those judgements involved in consolidating the accounting information provided by non-departmental and other arm’s length public bodies;
• state whether applicable accounting standards as set out in the FReM have been followed, and disclose and explain any material departures in the accounts; and
• prepare the accounts on a going concern basis.
HMT has appointed the Permanent Secretary as Accounting Officer for the Department for Education.
The Accounting Officer of the Department has also appointed the Chief Executives (or equivalents) of its sponsored NDPBs as Accounting Officers of those bodies. The Accounting Officer of the Department is responsible for ensuring that appropriate systems and controls are in place to ensure that any grants that the Department makes to its sponsored bodies are applied for the purposes intended and that such expenditure and the other income and expenditure of the sponsored bodies are properly accounted for, for the purposes of consolidation within the resource accounts.
Under their terms of appointment, the Accounting Officers of the sponsored bodies are accountable for the use, including the regularity and propriety, of the grants received and the other income and expenditure of the sponsored bodies.
The responsibilities of an Accounting Officer, including responsibility for the propriety and regularity of the public finances for which the Accounting Officer is answerable, for keeping proper records and for safeguarding the assets of the Department and its NDPBs are set out in Managing Public Money published by HMT. The Permanent Secretary can confirm that these responsibilities have been discharged properly.
The Accounting Officer System Statement69 for the Department was published on 31 August 2017. An updated Accounting Officer System Statement is due to be published later in summer 2018.
As Accounting Officer, as far as I am aware, there is no relevant audit information of which the Department’s auditors are unaware. I have taken all of the steps that I ought to have taken to make myself aware of any relevant audit information and to establish that the Department’s auditors are aware of that information.
I also confirm that this annual report as a whole is fair, balanced and understandable, and take personal responsibility for the ARA and the judgments required for determining that it is fair, balanced and understandable.
68 https://www.gov.uk/government/publications/government-financial-reporting-manual-2017-to-2018
69 https://www.gov.uk/government/publications/department-for-education-accounting-officer-system-statement
64 DfE CONSOLIDATED ANNUAL REPORT AND ACCOUNTS 2017-18
GOVERNANCE STATEMENT
SCOPE OF RESPONSIBILITYThe Department for Education is a ministerial department that is supported by and works with 18 Agencies and public bodies, as listed in Note 23 to the Accounts, who assist the Department implementing its policies and achieving its aims and objectives. The agencies and public bodies consist of Executive Agencies, Executive Non-departmental Public Bodies, Advisory Non-departmental Public Bodies and other organisations.
The Agencies are part of the Department and are well-defined business units which carry out executive functions within government. They have a clear focus on delivering specific outputs within a framework of accountability to ministers.
The executive or advisory NDPBs have a role in the processes of national government, but are not a government department or part of one, and which accordingly operate to a greater or lesser extent at arm’s length from ministers. NDPBs have different roles, including those that advise ministers and others, which carry out executive or regulatory functions, and they work within a strategic framework set by ministers.
As the Permanent Secretary and Accounting Officer, I have certain responsibilities which are set out in the Statement of Accounting Officer’s responsibilities on page 63. The responsibilities of the Chief Executives of those NDPBs sponsored by the Department, and of the Department’s Agencies are also covered in this statement.

65DfE CONSOLIDATED ANNUAL REPORT AND ACCOUNTS 2017-18
THE DEPARTMENT’S GOVERNANCE STRUCTURES
Departmental Board
Nominations Committee
Audit and Risk Committee
Implementation Committee
Leadership Team
Performance, Risk and
Resourcing Committee
People Committee
Digital, Data and Technology
Committee
In the reporting year 2017-18, the Department and the lead non-executive board member reviewed the Department’s governance structures as well as the non-executive role in governance. Following these reviews, the Department’s governance structures were altered in the following way:
• The Departmental Board revised its composition to be smaller, retaining a balance of ministers, officials, and non-executive board members.
• The Management Committee was renamed the Leadership Team and membership of the Leadership Team’s sub-committees was strengthened so that, in addition to sub-committees being chaired by a Director General, each had at least one further Director General as a member. The rest of the membership was drawn from Directors across the Department.
• The remit of the Finance and Investment Committee was broadened to consider the breadth of the Department’s performance and risks, and met as the Performance, Risk and Resourcing Committee (PRRC) from January 2018.
• The remit of the Performance Committee was revised as the Implementation Committee, which considered the most significant performance issues in depth, as well as the Departmental transformation. Issues were referred from a variety of sources including discussions at PRRC and Leadership Team. The Implementation Committee met from February 2018.
• The Nominations Committee was established to provide advice and scrutiny on the Department’s board level and public appointments.
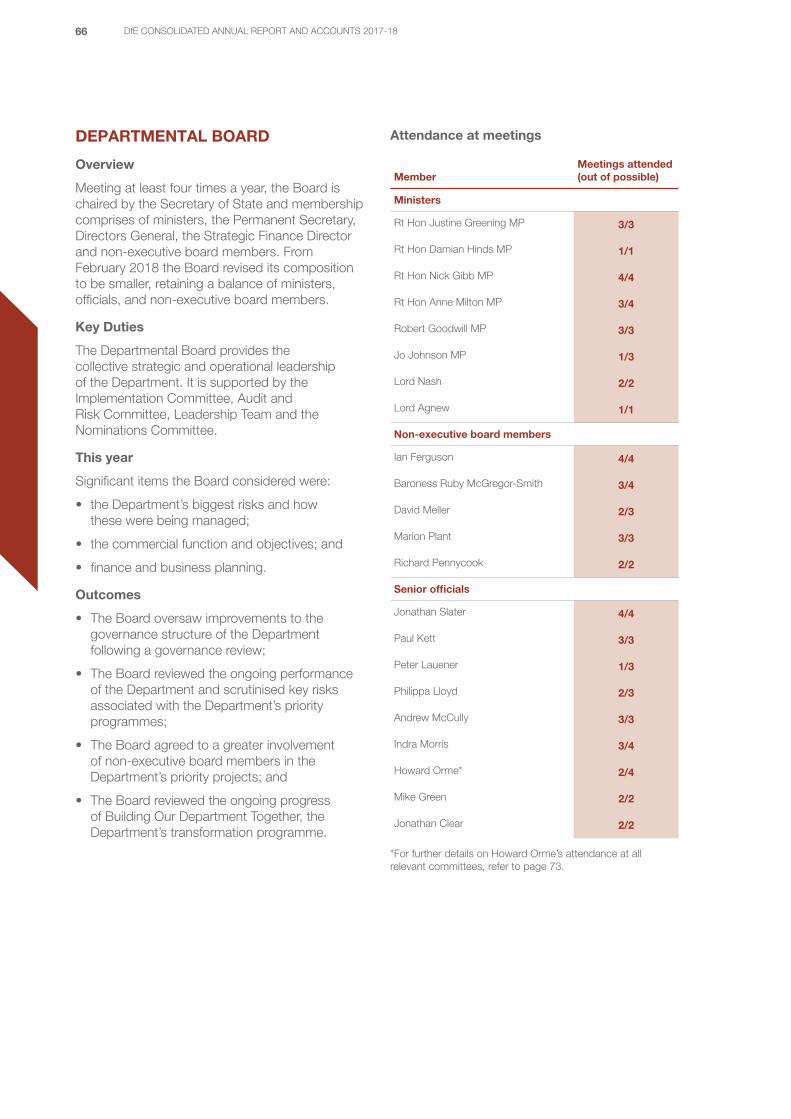
66 DfE CONSOLIDATED ANNUAL REPORT AND ACCOUNTS 2017-18
DEPARTMENTAL BOARD
Overview
Meeting at least four times a year, the Board is chaired by the Secretary of State and membership comprises of ministers, the Permanent Secretary, Directors General, the Strategic Finance Director and non-executive board members. From February 2018 the Board revised its composition to be smaller, retaining a balance of ministers, officials, and non-executive board members.
Key Duties
The Departmental Board provides the collective strategic and operational leadership of the Department. It is supported by the Implementation Committee, Audit and Risk Committee, Leadership Team and the Nominations Committee.
This year
Significant items the Board considered were:
• the Department’s biggest risks and how these were being managed;
• the commercial function and objectives; and
• finance and business planning.
Outcomes
• The Board oversaw improvements to the governance structure of the Department following a governance review;
• The Board reviewed the ongoing performance of the Department and scrutinised key risks associated with the Department’s priority programmes;
• The Board agreed to a greater involvement of non-executive board members in the Department’s priority projects; and
• The Board reviewed the ongoing progress of Building Our Department Together, the Department’s transformation programme.
Attendance at meetings
MemberMeetings attended (out of possible)
Ministers
Rt Hon Justine Greening MP 3/3
Rt Hon Damian Hinds MP 1/1
Rt Hon Nick Gibb MP 4/4
Rt Hon Anne Milton MP 3/4
Robert Goodwill MP 3/3
Jo Johnson MP 1/3
Lord Nash 2/2
Lord Agnew 1/1
Non-executive board members
Ian Ferguson 4/4
Baroness Ruby McGregor-Smith 3/4
David Meller 2/3
Marion Plant 3/3
Richard Pennycook 2/2
Senior officials
Jonathan Slater 4/4
Paul Kett 3/3
Peter Lauener 1/3
Philippa Lloyd 2/3
Andrew McCully 3/3
Indra Morris 3/4
Howard Orme* 2/4
Mike Green 2/2
Jonathan Clear 2/2
*For further details on Howard Orme’s attendance at all relevant committees, refer to page 73.

67DfE CONSOLIDATED ANNUAL REPORT AND ACCOUNTS 2017-18
IMPLEMENTATION COMMITTEE
Overview
Meeting at least five times a year, the Implementation Committee (the remit of which was revised from the former Performance Committee) supports the Board by scrutinising the Department’s performance and delivery, both in the wider sense and in the context of particular projects and issues. It is chaired by the lead non-executive board member and consists of the Permanent Secretary, Directors General, the non-executive board members, the Chief Analyst and the Head of Delivery Unit.
Key duties
The Implementation Committee has an overview of the Department’s overall performance, taking into account the wider agenda and the Secretary of State’s priorities. It advises the Board on the delivery of the Department’s strategy, providing independent assurance that the Department has in place the necessary conditions for success, and the capability and capacity to deliver.
This year
Significant items discussed by the committee were:
• recruitment and retaining of teachers;
• equalities and the gender pay gap; and
• the Department’s use of analysis.
Outcomes
• The committee reviewed plans to increase teacher supply, and reviewed findings of a deep dive into how better data could help address teacher supply.
• The committee reviewed plans and risks associated with the implementation of a 100% target for gender pay gap reporting, and the committee agreed the wider Department could support the gender pay gap and wider equalities agenda in the education sector.
• The committee agreed that analysis needed to be used consistently in planning and business cases, and the committee asked for detailed data requirements the Department has of the education sector.
Attendance at meetings
MemberMeetings attended (out of possible)
Non-executive board members
Richard Pennycook 3/3
Ian Ferguson 6/6
Ruby McGregor-Smith 3/6
David Meller 4/5
Marion Plant 4/5
Senior officials
Jonathan Slater 6/6
Paul Kett 5/6
Peter Lauener 4/4
Philippa Lloyd 3/6
Andrew McCully 6/6
Eileen Milner 2/2
Indra Morris 4/6
Howard Orme* 3/6
Mike Green 2/2
David Brown 5/6
Tim Leunig/Donna Ward 2/3
Jonathan Clear -/2
*For further details on Howard Orme’s attendance at all relevant committees, refer to page 73.
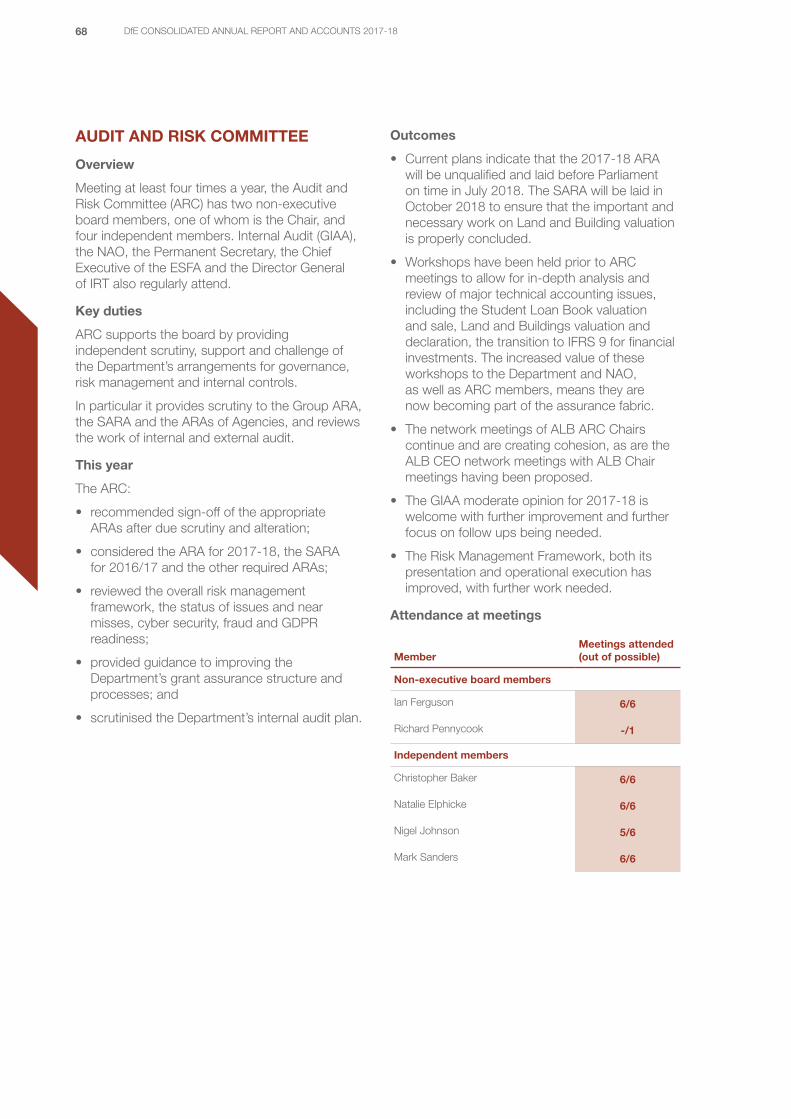
68 DfE CONSOLIDATED ANNUAL REPORT AND ACCOUNTS 2017-18
AUDIT AND RISK COMMITTEE
Overview
Meeting at least four times a year, the Audit and Risk Committee (ARC) has two non-executive board members, one of whom is the Chair, and four independent members. Internal Audit (GIAA), the NAO, the Permanent Secretary, the Chief Executive of the ESFA and the Director General of IRT also regularly attend.
Key duties
ARC supports the board by providing independent scrutiny, support and challenge of the Department’s arrangements for governance, risk management and internal controls.
In particular it provides scrutiny to the Group ARA, the SARA and the ARAs of Agencies, and reviews the work of internal and external audit.
This year
The ARC:
• recommended sign-off of the appropriate ARAs after due scrutiny and alteration;
• considered the ARA for 2017-18, the SARA for 2016/17 and the other required ARAs;
• reviewed the overall risk management framework, the status of issues and near misses, cyber security, fraud and GDPR readiness;
• provided guidance to improving the Department’s grant assurance structure and processes; and
• scrutinised the Department’s internal audit plan.
Outcomes
• Current plans indicate that the 2017-18 ARA will be unqualified and laid before Parliament on time in July 2018. The SARA will be laid in October 2018 to ensure that the important and necessary work on Land and Building valuation is properly concluded.
• Workshops have been held prior to ARC meetings to allow for in-depth analysis and review of major technical accounting issues, including the Student Loan Book valuation and sale, Land and Buildings valuation and declaration, the transition to IFRS 9 for financial investments. The increased value of these workshops to the Department and NAO, as well as ARC members, means they are now becoming part of the assurance fabric.
• The network meetings of ALB ARC Chairs continue and are creating cohesion, as are the ALB CEO network meetings with ALB Chair meetings having been proposed.
• The GIAA moderate opinion for 2017-18 is welcome with further improvement and further focus on follow ups being needed.
• The Risk Management Framework, both its presentation and operational execution has improved, with further work needed.
Attendance at meetings
MemberMeetings attended (out of possible)
Non-executive board members
Ian Ferguson 6/6
Richard Pennycook -/1
Independent members
Christopher Baker 6/6
Natalie Elphicke 6/6
Nigel Johnson 5/6
Mark Sanders 6/6

69DfE CONSOLIDATED ANNUAL REPORT AND ACCOUNTS 2017-18
LEADERSHIP TEAM
Overview
Meeting at least 10 times a year, the Leadership Team (formerly Management Committee) provides day-to-day executive leadership and management on behalf of the Board. It is chaired by the Permanent Secretary and it consists of the Directors General and the Chief Executive of the ESFA. The Director of Transformation routinely attends.
The Leadership Team is supported by three sub-committees:
• the Performance, Risk and Resourcing Committee (formerly the Finance and Investment Committee) which provides oversight of the breadth of the Department’s performance and risks;
• the People Committee which provides oversight of the Department’s people and workforce strategy; and
• the Digital, Data and Technology Committee, which provides oversight of the Department’s digital capacity, capability and prioritisation.
Key duties
The Leadership Team is responsible for oversight of the Department’s operations, including the Department’s financial position, HR and workforce issues, performance and risk, and communications and staff engagement.
This year
Significant items discussed by the Leadership Team were:
• a refresh of Departmental transformation;
• budget planning for 2018-19;
• the Department’s diversity and inclusion strategy; and
• oversight and partnership arrangements of the Department’s ALBs.
Outcomes
• Agreed consistent business planning definitions, and approved admin and programme budgets at a department and directorate level. The Team also considered how to manage the directorate level budgets in aggregate.
• Agreed the Diversity and Inclusion Strategy, and reviewed diversity and inclusion at Senior Civil Service (SCS) grades.
• Planned and approved a refresh of Building Our Department Together, the Department’s transformation programme.
Attendance at meetings
MemberMeetings attended (out of possible)
Senior officials
Jonathan Slater 11/11
Paul Kett 9/11
Peter Lauener 5/6
Philippa Lloyd 9/11
Andrew McCully 9/11
Eileen Milner 5/5
Indra Morris 7/11
Howard Orme* 4/11
Mike Green 6/6
Jonathan Clear 5/6
*For further details on Howard Orme’s attendance at all relevant committees, refer to page 73.

70 DfE CONSOLIDATED ANNUAL REPORT AND ACCOUNTS 2017-18
NOMINATIONS COMMITTEEMeeting from February 2018, the Nominations Committee is chaired by the lead non-executive board member and consists of non-executive board members, the Permanent Secretary and the HR Director. The committee will meet at least four times a year.
Key duties
The Nominations Committee supports the Board by: scrutinising and advising on the Department’s arrangements for senior talent management; pay and reward; succession planning; and public appointments processes.
This year
The Nominations Committee met for the first time in February 2018 and discussed:
• the committee’s scope in providing assurance to the Department’s public appointment process;
• senior talent; and
• non-executive board member recruitment.
Outcomes
• Agreed the scope and focus of the committee in providing assurance of the public appointments process for the coming year.
• Discussed senior talent assessments and noted the cross-government processes that this feeds into.
• Agreed the role requirements of non-executive board members ahead of recruitment.
Attendance at meetings
MemberMeetings attended (out of possible)
Non-executive board members
Richard Pennycook 1/1
Ian Ferguson 1/1
Ruby McGregor-Smith 1/1
Senior officials
Jonathan Slater 1/1
Simon Fryer 1/1
THE RISK MANAGEMENT FRAMEWORKSuccessful management of the children’s services and education system is vital to the long-term future of the country. Our risk management approach seeks to devolve accountability to those best placed to manage them, with overall strategic direction on the approach to risks and their management set centrally. A corporate risk team acts as the central point for advice and guidance on effective risk management. The team is responsible for the effective implementation of the Department’s risk management framework and co-ordinates the Department’s Top Tier Risk Register, which is the route by which the most significant risks are escalated to the Department’s boards and committees.
The central team is also responsible for monitoring and reporting near misses and unexpected issues, ensuring measures are introduced to reduce the likelihood of issues reoccurring.
For all risks, whether they report to the top-tier of departmental governance or not, we adopt the ‘three lines of defence’ approach to managing these effectively. We have recently updated our governance arrangements to better manage risks in our boards and committees, as outlined on page 65.
The first line of defence for each type of risk is an effective system of Senior Responsible Owners (SROs), programme governance and budget managers that monitor and manage risks relating to their specific area of responsibility. The central risk team works with individual SROs and project teams to help build capability and consistency in the management of their risks. This year this has been achieved by revising and republishing the Department’s risk framework to be more user focused with more specific definitions to help promote greater consistency. The team also facilitated a number of training and dedicated workshops within each directorate and teams from around the Department. A network of risk professionals in both the Department and NDPBs has been established to share approaches to risk management and build risk professionalism.

71DfE CONSOLIDATED ANNUAL REPORT AND ACCOUNTS 2017-18
Senior civil servants participate in a formal process to complete their assurance framework record to demonstrate what they are doing to fulfil their responsibility for:
• appropriately managing the resources they oversee;
• having effective governance arrangements, systems and internal controls in place, to support decision making and budget management; and
• effectively identifying and managing risks and conflicts of interest in their area.
The second line of defence is fulfilled by a cross-Department monitoring and reporting framework. The Leadership Team continued to receive a quarterly update of risks that need on-going top-tier oversight. This pack includes a greater emphasis on action required by the committee to reduce either risk likelihood or impact. If required, more detailed interrogation of the risks could be undertaken by the Leadership Team or the former Performance Committee.
This year, following a review of the Department’s governance structure, steps were taken to improve the way in which performance, risk and resource management is overseen and managed. This included the restructure of the Finance and Investment Committee as the Performance, Risk and Resourcing Committee, and providing it with the responsibility to oversee the implementation of the risk framework and oversee the top-tier risk register in the first instance. This has allowed the Leadership Team more scope to focus on longer term strategic risks.
The third line of defence constitutes the oversight of the Board, the government’s Internal Audit function that operates a comprehensive audit and assurance programme, and ARC, which oversees it.
ARC
Non-executive board members sit on the Department’s Leadership Team, the former Performance Committee and the ARC.
Independent members of the ARC provide challenge and scrutiny to risks being reported from the first line of defence. The ARC remains the forum that provides assurance on the effectiveness of the arrangements in place.
The ARC now receives the same risk reports used by the executive committees which will allow the ARC greater visibility into the actions being taken by the executive and therefore improved opportunity to provide assurance and challenge if necessary.
Oversight of the Board
Acting as part of the third line of defence, the Implementation Committee can have any significant risk referred to it, helping to consider risks in greater detail together with the expertise of our non-executive board members.
Government’s Internal Audit function
The internal audit plan is set at the beginning of the financial year, informed by a number of considerations including the Department’s business plan, organisational changes and key identified areas of risk. It is reviewed by ARC, and revisited as appropriate during the year to reflect changing circumstances.
The ARC reviews at each meeting all Limited and Unsatisfactory rated internal audit reports for that period. It also receives quarterly progress reports, including updates on completed and outstanding actions arising from recommendations (refer to pages 74-75 for more detail on the outcome of the internal audit review).
Finally, ARC and the Permanent Secretary review the internal audit annual report each year, and the Department also takes assurance from the internal audit functions of those NDPBs not covered by GIAA.
The Department benefits from other independent assurance processes such as Major Project Reviews and NAO studies targeting areas of high risk or interest.
72 DfE CONSOLIDATED ANNUAL REPORT AND ACCOUNTS 2017-18
COUNTER FRAUD, ERROR AND DEBTThe Department continues to work with Cabinet Office and across government to leverage the experience and strength of other government expertise and reduce fraud within the public sector.
A central team provides strategic guidance and co-ordination of activity, overseen by a nominated Board member. This includes adherence to cross-government requirements: for example, the Department, ESFA, NCTL, HEFCE and SLC have been required to meet the Cabinet Office functional standards for counter-fraud activity and to complete an annual capacity assessment.
Centralised reporting of identified instances of fraud and error is provided via the Consolidated Data Return submitted to Cabinet Office, and regular updates to ARC. The central Fraud, Error and Debt Team has increased resources this year to meet these reporting requirements.
At any time, a numbe f potential instances of fraud may be under investigation, either by the Department, GIAA or by the police.
Where an allegation of fraud is made, both the central team and the business area team are alerted. Where fraud, bribery or corruption is suspected, the case is pursued by trained investigators appointed by the central team, involving the courts if necessary and seeking to recover lost funds. A written report is provided detailing both the case and any recommendations for improvement.
Each of the Department’s bodies has its own counter-fraud team, to co-ordinate local efforts. The Department and its bodies take a risk-based approach in this area, to ensure that available resources and time are focused on the highest-risk areas. Fraud Risk Assessments have taken place in each business area this year.
The Department carries out a rolling programme of review of controls designed to ensure fraud, error and debt are minimised. This year’s focus on debt improved controls around the availability and issuance of credit notes, the handover process of aged debt from our service provider and resolution of historic issues that is reducing our exposure to issues over one year old.
KNOWLEDGE, INFORMATION AND ASSET MANAGEMENTThe Knowledge and Information Management (KIM) Team have appointed a new Head of Profession and the work this year has focused on: making improvements to the Information Asset Register; meeting statutory obligations
in reviewing departmental records within a 20 year period; and migrating the Information Management Workplaces platform to an online system. This year has also seen the setting up of a KIM Governance Board.
Due to a Machinery of Government change which has taken place, as well as some organisational re-structure, there has been a need to migrate information and records (both in paper and digital form) into the Department. In order to prepare for the General Data Protection Regulation (GDPR) which came into force in May 2018, the Department’s Chief Data Officer was appointed the SRO to deliver Department-wide GDPR compliance. The SRO setup a central delivery function to own, oversee and coordinate compliance efforts across different directorates. Additionally, the GDPR programme Board is collectively accountable to report (through its Chair) the progress, escalate risks, any kind of issues and provide overall assurance to the SLT (like DDaT committee and any other boards/committees) on departmental compliance posture regularly.
No significant issues arose in year. Details of personal data issues reported to the Information Commissioner in 2017-18 are set out in Annex A.
COMPLIANCE WITH HMT’S CORPORATE GOVERNANCE IN CENTRAL GOVERNMENT DEPARTMENTS: CODE OF GOOD PRACTICEWith the exception of the departures explained below, the Department has complied with the Corporate governance in central government departments: code of good practice.70
The Department appointed Richard Pennycook as lead non-executive board member in October 2017, which had been vacant since Sir Paul Marshall left the Board in June 2016. Prior to that point, the non-executive team shared the responsibilities of the lead non-executive.
Richard Pennycook joined ARC, fulfilling the requirement that at a non-executive board member sits on the committee in addition to the chair. Before Richard joined, it had not been possible to appoint a second non-executive board member to the committee, which was strengthened by two independent members with financial expertise, and chairs of the ESFA and SLC Audit Committees.
The Board established a Nominations Committee in February 2018 to consider senior talent and pay,
70 https://www.gov.uk/government/publications/corporate-governance-code-for-central-government-departments-2017

73DfE CONSOLIDATED ANNUAL REPORT AND ACCOUNTS 2017-18
and public appointed processes. This complimented executive forums that consider talent and pay, such as the Talent Board and Remuneration Committee, which continued to meet.
While the Board considered Departmental risk overall, the risk management processes were primarily addressed by the ARC. Any risks relevant to their remit were considered by all three sub-committees of the Board. The PRRC also had oversight of the breadth of the organisational, system and delivery risks, escalating specific risks to the Leadership Team or to the Implementation Committee.
In October 2017, Howard Orme, Chief Financial and Operating Officer and Director General, Information, Resources and Transformation, went on long-term absence from work. During this time the following arrangements were in place:
• Mike Green, Director of Commercial and ESFA Capital, was appointed as acting Chief Operating Officer and Director General of Insight, Resources and Transformation on 30 October 2017 and appointed an interim member of the Board.
• Jonathan Clear, Strategic Finance Director, and Iain King, Operational Finance Director, jointly fulfilled the role of Finance Director as set out in Managing Public Money.
• Jonathan Clear was appointed as an interim member of the Board, and also attended the Implementation Committee, the Leadership Team and PRRC meetings.
• Iain King represented the Department’s finance function at ARC meetings, and attended People Committee and Digital, Data and Technology Committee meetings.
In order to manage any conflicts of interest, the Department maintains a register of the interests of Board members that is updated regularly. Board members are required to declare potential conflicts of interest that arise. Where a potential conflict of interest is identified, Board members are not involved in discussions or decisions on the matter in question.
An assessment of the Board’s effectiveness is set out in the report from the lead non-executive board member on page 11.
The strategy for partnership and sponsorship of the Department’s NDPBs was agreed with the Leadership Team the Performance Risk and Resourcing Committee who are committed to reviewing overall NDPB performance bi-annually. This took into account the principles set out in
Partnerships with arm’s length bodies: code of good practice.71
The Board and its committees receive management information covering a variety of disciplines to enable them to monitor the performance of the Department. This includes financial and workforce data, indicators of progress against the Department’s priorities, and information on risk. The senior executive team, with challenge from other Board members, continually monitor the quality of the information supplied to ensure that it is of the right quality to enable decisions to be based on evidence.
ANALYTICAL QUALITY ASSURANCEThe Macpherson Review made a number of recommendations to help ensure that an appropriate environment and processes are in place for the quality assurance of analytical models. The Department established a framework for quality assurance based on these recommendations, including internal guidance and a training programme for analysts and SROs. In summer 2017, we appointed a Director of Modelling Strategy and Quality Assurance to consider the effectiveness of this existing framework and to enhance and further embed quality assurance across the Department.
The Department imposes specific quality assurance requirements on its business critical modelling. We have recently carried out an exercise to identify and register all business critical models. Over 2018-19, we will assess the strength of quality assurance of these models.
REVIEW OF EFFECTIVENESSAs Accounting Officer for the whole Group, I have responsibility for reviewing the effectiveness of the system of internal control. My review was informed by my senior management team (including Accounting Officers for Agencies and NDPBs, who have responsibility for the development and maintenance of the internal control framework), Internal Audit, and comments made by the NAO in their management letter and other reports.
For 2017-18, the Department has used the updating of the Accounting Officer System Statement (AOSS) as the vehicle for reviewing the assurance provided to me. This has meant that directorates have been involved in a review of process and control regimes; this has naturally included the flagging any assurance issues that have given concern over the financial year. Additionally, we are liaising with the Department’s corporate governance team as they undertake a wholesale review of the assurance mechanisms in
71 https://www.gov.uk/government/publications/partnerships-with-arms-length-bodies-code-of-good-practice
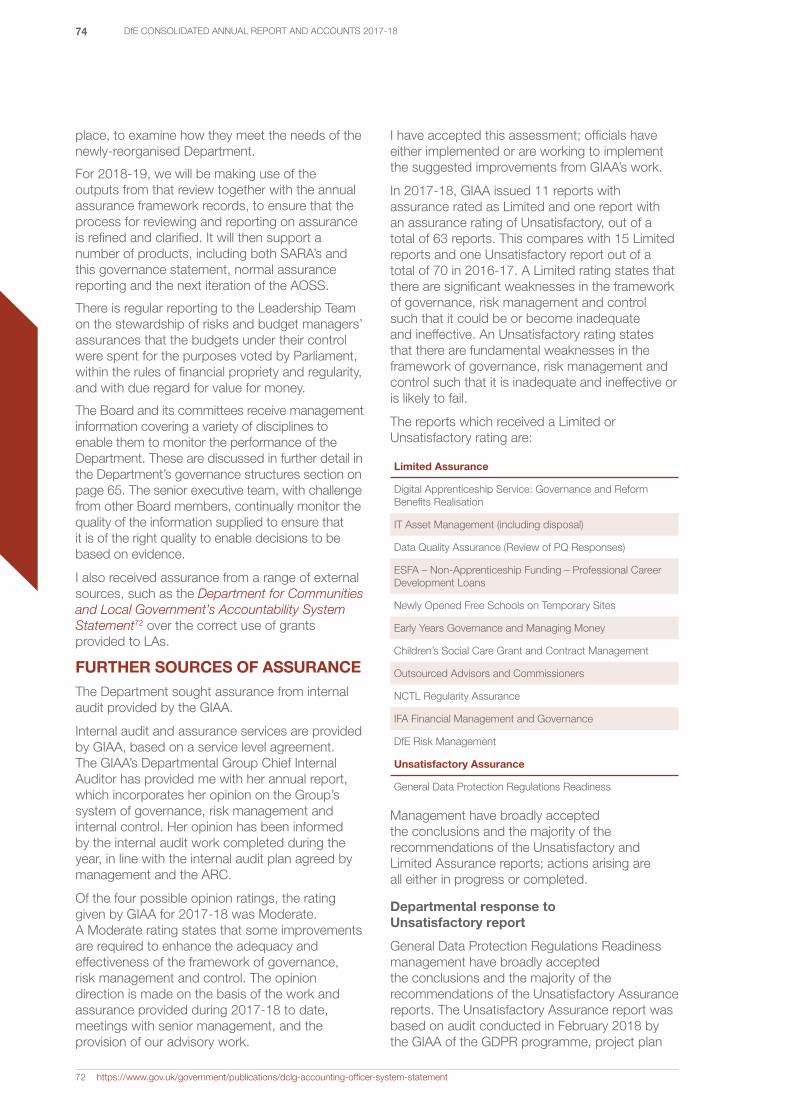
74 DfE CONSOLIDATED ANNUAL REPORT AND ACCOUNTS 2017-18
place, to examine how they meet the needs of the newly-reorganised Department.
For 2018-19, we will be making use of the outputs from that review together with the annual assurance framework records, to ensure that the process for reviewing and reporting on assurance is refined and clarified. It will then support a number of products, including both SARA’s and this governance statement, normal assurance reporting and the next iteration of the AOSS.
There is regular reporting to the Leadership Team on the stewardship of risks and budget managers’ assurances that the budgets under their control were spent for the purposes voted by Parliament, within the rules of financial propriety and regularity, and with due regard for value for money.
The Board and its committees receive management information covering a variety of disciplines to enable them to monitor the performance of the Department. These are discussed in further detail in the Department’s governance structures section on page 65. The senior executive team, with challenge from other Board members, continually monitor the quality of the information supplied to ensure that it is of the right quality to enable decisions to be based on evidence.
I also received assurance from a range of external sources, such as the Department for Communities and Local Government’s Accountability System Statement72 over the correct use of grants provided to LAs.
FURTHER SOURCES OF ASSURANCEThe Department sought assurance from internal audit provided by the GIAA.
Internal audit and assurance services are provided by GIAA, based on a service level agreement. The GIAA’s Departmental Group Chief Internal Auditor has provided me with her annual report, which incorporates her opinion on the Group’s system of governance, risk management and internal control. Her opinion has been informed by the internal audit work completed during the year, in line with the internal audit plan agreed by management and the ARC.
Of the four possible opinion ratings, the rating given by GIAA for 2017-18 was Moderate. A Moderate rating states that some improvements are required to enhance the adequacy and effectiveness of the framework of governance, risk management and control. The opinion direction is made on the basis of the work and assurance provided during 2017-18 to date, meetings with senior management, and the provision of our advisory work.
72 https://www.gov.uk/government/publications/dclg-accounting-officer-system-statement
I have accepted this assessment; officials have either implemented or are working to implement the suggested improvements from GIAA’s work.
In 2017-18, GIAA issued 11 reports with assurance rated as Limited and one report with an assurance rating of Unsatisfactory, out of a total of 63 reports. This compares with 15 Limited reports and one Unsatisfactory report out of a total of 70 in 2016-17. A Limited rating states that there are significant weaknesses in the framework of governance, risk management and control such that it could be or become inadequate and ineffective. An Unsatisfactory rating states that there are fundamental weaknesses in the framework of governance, risk management and control such that it is inadequate and ineffective or is likely to fail.
The reports which received a Limited or Unsatisfactory rating are:
Limited Assurance
Digital Apprenticeship Service: Governance and Reform Benefits Realisation
IT Asset Management (including disposal)
Data Quality Assurance (Review of PQ Responses)
ESFA – Non-Apprenticeship Funding – Professional Career Development Loans
Newly Opened Free Schools on Temporary Sites
Early Years Governance and Managing Money
Children’s Social Care Grant and Contract Management
Outsourced Advisors and Commissioners
NCTL Regularity Assurance
IFA Financial Management and Governance
DfE Risk Management
Unsatisfactory Assurance
General Data Protection Regulations Readiness
Management have broadly accepted the conclusions and the majority of the recommendations of the Unsatisfactory and Limited Assurance reports; actions arising are all either in progress or completed.
Departmental response to Unsatisfactory report
General Data Protection Regulations Readiness management have broadly accepted the conclusions and the majority of the recommendations of the Unsatisfactory Assurance reports. The Unsatisfactory Assurance report was based on audit conducted in February 2018 by the GIAA of the GDPR programme, project plan

75DfE CONSOLIDATED ANNUAL REPORT AND ACCOUNTS 2017-18
and its governance structure. This audit highlighted 6 high risks and 3 medium risks along with a series of recommendations.
The Leadership Team assigned high priority to the audit findings, allocated required resources and put in place a dedicated team to deliver the Department-wide GDPR compliance by working collaboratively with different directorates. The GIAA team has since conducted a desktop review (on 7 June 2018) to evaluate the evidence to support the implementation of the actions and have agreed to close 8 of the 9 risks from the audit findings of February 2018. The remaining risk is due at end of July 2018.
MINISTERIAL DIRECTION
The Permanent Secretary sought a Ministerial direction on 17 May 2018 on the implementation of T Levels. The Permanent Secretary drew attention to the ambitious timetable and the challenge in ensuring that the first three T Levels would be ready to be taught from 2020 and beyond to a consistently high standard. Having considered the advice in detail, and the need for progress in sectors such as Construction and Digital, the Secretary of State was convinced of the case to press ahead with first delivery from 2020. The direction demonstrated the government’s strong commitment to the future success of the T Level programme.
AUDIT QUALIFICATIONS
NCTL 2016-17During their most recent NCTL audit, NAO identified issues with the regularity of NCTL’s grant expenditure. The majority of these issues were associated with grants paid to Initial Teacher Training providers for bursaries for trainee teachers. As such, the Comptroller & Auditor General limited the scope of his regularity opinion on the NCTL 2016-17 ARA. Work has been underway for some time to address these significant issues prior to NAO’s audit of NCTL’s grant expenditure for 2017-18.
SLC 2016-17SLC’s external auditors gave a qualified opinion on regularity grounds in SLC’s 2016-17 ARA. SLC failed to obtain the required approvals in two broad areas:
• Did not obtain approvals for confidentiality clauses that deviated from the standard wording provided in Cabinet Office guidance, as well as making a payment in lieu of notice within one settlement agreement without HMT approval.
• Awarded two call-off contracts, for which it did not obtain the required approvals from the Department or Cabinet Office. For other expenditure procured through the contract framework, auditors could not obtain sufficient, appropriate audit evidence to demonstrate the regularity of the expenditure.
To address these issues, SLC has strengthened its controls around the approval processes and content of settlement agreements as well as the preparation and maintenance of the audit trail of the use of the contract framework to remove the identified weaknesses in internal control and governance.
SARA 2015/16The SARA was qualified over the recognition and valuation of academy land and buildings. The Department was unable to demonstrate that the value of the buildings disclosed in SARA was materially accurate as it had not gathered the underlying data to support ownership in line with IAS 16 Property, Plant and Equipment (IAS 16) and IAS 17 Leases. There was a further concern raised that the valuation methodology did not demonstrate obsolescence within buildings adequately. The Department has engaged in a significant exercise to gather the data from over 35,000 occupation routes used by the academy sector, and has developed a more robust valuation process, to address this issue. The outcome of this work will be reported in the 2016/17 SARA.
NAO REPORTS
Value for money studies
The NAO undertakes around 60 value for money studies each year, which Parliament use to hold the government to account for how it spends public money. Each study examines an area of government expenditure, and their objective is to form a judgement on whether value for money has been achieved.
The NAO define good value for money as the optimal use of resources to achieve the intended outcomes. Their role is not to question government policy objectives, but to provide independent and rigorous analysis to Parliament on the way in which public money has been spent to achieve those policy objectives. As well as reaching an overall conclusion on value for money, the NAO make recommendation on how to achieve better value for money and to improve the services under examination. More information regarding the value for money studies can be found online.
76 DfE CONSOLIDATED ANNUAL REPORT AND ACCOUNTS 2017-18
The NAO published the following value for money reports relating to the Group in 2017-18:
• Retaining and developing the teaching workforce73 examined the Department’s efforts to improve the quality of teaching and schools ability to retain its teaching workforce. Improvement of these areas supports the Department achieving its objective ‘Educational excellence everywhere’. This objective’s aim is to ensure every child and young person can access high quality provision and achieve the best of their ability regardless of location, attainment and background.
• Follow-up of alternative higher education providers74 examined the Department’s progress in addressing weaknesses in its oversight of alternative Higher Education providers.
• The Higher Education Market75 examined the extent to which market dynamics in HE support the government’s objectives and whether the Department intervenes to correct market failures.
• Delivering STEM (science, technology, engineering and mathematics) skills for the economy76 was a joint examination across both the Department and BEIS examining the government’s understanding of: the need for enhanced STEM skills; the effectiveness of previous initiatives in delivering STEM skills; and opportunities and risks of the latest initiatives to enhance the development of STEM skills.
• Converting maintained schools to academies77 examined the Department’s approach to the extent of conversion; the robustness, speed and cost of the conversion process; and the availability of sponsors and multi-academy trusts to support the conversion of schools.
Investigations
The NAO conducts investigations to establish the underlying facts in circumstances where concerns have been raised with them, or in response to intelligence that NAO gathered through their wider work across government.
• Investigation into the circumstances surrounding the monitoring inspection and funding of Learndirect Ltd78 examined the monitoring of the company by ESFA, inspection by Ofsted and funding of the company by various departments.
• Investigation into oversight of the Student Loans Company’s governance, and management of its former chief executive,79 examined the events described on page 77.
The Department is considering the NAO’s findings to identify corrective measures where suitable.
I, along with my senior leadership team, provided evidence on each report to the Public Accounts Committee, which are published on their website.80
PUBLIC ACCOUNTS COMMITTEEDuring the year, the Permanent Secretary, on behalf of the Department, attended the following Public Accounts Committee (PAC) meetings:
PAC Hearing date
Department for Education Accounts
12 October 2017
Retaining and developing the teaching workforce
20 November 2017
Alternative HE Providers 15 January 2018
Learndirect 15 January 2018
Academy School Sector Consolidated Accounts 2015/16
29 January 2018
The HE market 12 March 2018
28 March 2018
More details on the above meetings can be found on the PAC website.80
73 https://www.nao.org.uk/report/supporting-and-improving-the-teaching-workforce/
74 https://www.nao.org.uk/report/follow-up-on-alternative-higher-education-providers/
75 https://www.nao.org.uk/report/the-higher-education-market/
76 https://www.nao.org.uk/report/delivering-stem-science-technology-engineering-and-mathematics-skills-for-the-economy/
77 https://www.nao.org.uk/report/converting-maintained-schools-to-academies/
78 https://www.nao.org.uk/report/investigation-into-the-circumstances-surrounding-the-monitoring-inspection-and-funding-of-learndirect-ltd/
79 https://www.nao.org.uk/report/investigation-into-oversight-of-the-student-loans-companys-governance-and-management-of-its-former-chief- executive/
80 https://www.parliament.uk/business/committees/committees-a-z/commons-select/public-accounts-committee/

77DfE CONSOLIDATED ANNUAL REPORT AND ACCOUNTS 2017-18
APPOINTMENT ISSUES
Departmental Board
The Department accepted David Meller’s resignation from the Board on 24 January 2018, following media interest in the Presidents Club. David was co-chair of the Presidents Club, and had previously declared this as an interest, which was published as part of the Board’s register of interests. When the Department recruits non-executive members of the Board it follows guidance of the Corporate governance in central government departments: code of good practice. Whilst not public appointments, when appointing non-executive board members it also draws on best practice in the Department for public appointments. Non-executives are required to adhere to the seven principles of public life.81
OfS
On 1 January 2018, the Department announced six new board appointments to the OfS, forming a board of 15 members. The appointment of Toby Young received widespread criticism, focusing on offensive comments he had made on social media. Toby Young subsequently resigned from the OfS board on 8 January 2018.
The Commissioner for Public Appointments held an investigation into the OfS board appointments competitions, reporting his findings on 26 February 2018. The Commissioner’s report recognised the good intentions of the Department’s Ministers, officials and the leadership of the OfS and concluded that the Advisory Assessment Panel judged candidates on a fair and impartial basis.
The Commissioner found that the appointment of an interim student experience board member from outside of the competition without securing formal prior approval from the Commissioner constituted a breach of Section 3.3 of the Governance Code on Public Appointments. His report also found that due diligence was inadequate in the case of Toby Young’s appointment. With regard to the student experience board member competition, he concluded that due diligence was not conducted in respect of all candidates on an equal basis which led to serious shortcomings with regard to the fairness and transparency required by the Code.
In response to the Commissioner’s findings, the Department has already made improvements to our due diligence process across the Department and established a Nominations Committee to oversee the public appointments process. A competition to appoint a substantive
student experience board member has been launched and a further competition will take place later this year to appoint to the board vacancies left by the resignations of Toby Young and Carl Lygo. We are in dialogue with the Commissioner for Public Appointments about these competitions to ensure they operate in a manner consistent with his recommendations.
SLC
Following the dismissal by the SLC of its former chief executive, Steve Lamey, in November 2017, the NAO commenced an investigation focusing on the circumstances leading up to that dismissal, the oversight of SLC by the Department and the actions planned to improve future oversight. The NAO published this review on the 11 May 2018.
Mr Lamey was appointed by the SLC board, with approval by the Secretary of State for Business, Innovation and Skills (its previous departmental sponsor prior to the transfer to the Department in July 2016). In May and July of 2017, two SLC employees made formal allegations about Mr Lamey. The Department and SLC acted swiftly and decisively as soon as these allegations were raised. Two investigations were jointly commissioned by the Department and SLC to look into the allegations made by the whistleblowers. These investigations led to a disciplinary hearing, an appeal hearing and ultimately to Mr Lamey’s dismissal for gross misconduct on the 7 November 2017. The Department believes strongly that senior public sector employees should abide by the highest standards of management and leadership, as set out by the Nolan principles, which were not upheld by Mr Lamey.
The Department and SLC moved quickly following the dismissal of Mr Lamey to appoint an experienced interim CEO (Peter Lauener) and to strengthen the SLC’s executive leadership team. The SLC is also currently recruiting for a permanent CEO. Throughout this period, the SLC has continued to deliver high quality student finance services for the UK and has maintained a steady rise in customer satisfaction, up from 70.5% in 2010-11 to 84% today. The Department has also worked with UK Government Investments on a review of governance arrangement for the SLC and recommendations from this will be implemented over the coming months.
81 https://www.gov.uk/government/publications/the-7-principles-of-public-life/the-7-principles-of-public-life--2
78 DfE CONSOLIDATED ANNUAL REPORT AND ACCOUNTS 2017-18
GRENFELL TOWER FIREIn the immediate aftermath of the tragic Grenfell fire, the Department acted quickly to undertake online fire safety arrangement surveys of Group-funded education institutions, including all 22,000 schools in England. The Group also delivered one of the fastest school building projects ever, in designing and constructing the temporary building for the school at the foot of the Tower – Kensington Aldridge Academy. By 18 September 2017, all pupils at the academy were able to start the new school year in their new school, which was an astounding achievement. The school has continued to thrive in the meantime and was judged Outstanding by Ofsted at its first inspection in December 2017.
We also engaged directly with other local schools after the fire, and the Department contributed £450,000 to the Tudor Trust to distribute via the Children and Young People’s fund. This was to support schools, voluntary and community organisations working in North Kensington to help children, young people and families affected by the fire. In addition, we allocated £336,000 to the Royal Borough of Kensington and Chelsea council to reflect the fact that a number of local schools lost pupil-place funding for children temporarily displaced by the fire who did not appear on school rolls on census day in January 2018.
The Department has, throughout the year, been very closely involved in the cross-government response to the tragedy. That will continue as we focus in particular on the response to Dame Judith Hackitt’s Independent Review of Building Regulations and Fire Safety – to ensure that schools and the wider education estate continue to be safe environments for students and staff.
CARILLIONIn January 2018, Carillion Plc, a major construction and support services company that has contracts with the public sector, was placed into compulsory liquidation. The Official Receiver was appointed as liquidator of Carillion Plc and is now responsible for the day-to-day control and management of the liquidated companies of the Carillion group. The government’s priority is to make sure all public services Carillion provided continue to run smoothly.
In the education context, Carillion provided facilities management and catering services to a relatively small number of schools. They were also involved in education building projects in the school and FE/HE sectors, and provided employment and training for 1,200 apprentices. Further information about support for apprentices can be found online.82
The Department continues to closely monitor the situation, working with LAs and academy trusts to put their contingency plans in place. We are pleased to confirm that no major disruptions have been reported and the Department is offering advice and support.
We have also taken steps to protect learners by transferring the training of Carillion apprentices to CITB, to ensure learners can continue to gain the skills they need. We will continue to work closely with the CITB to support apprenticeships to remain in existing placements or to find new employment with alternative employers so they can complete their apprenticeship.
Further information about the situation is on the Cabinet Office website.83
82 https://www.citb.co.uk/news-events/uk/2018/citb-statement-on-carillion/
83 https://www.gov.uk/government/news/carillion-whats-happening-now

79DfE CONSOLIDATED ANNUAL REPORT AND ACCOUNTS 2017-18
TRANSFER OF THE GOVERNMENT EQUALITIES OFFICE (GEO)On 8 January 2018, the Prime Minister appointed the Home Secretary, Amber Rudd, as Minister for Women and Equalities, and Victoria Atkins and Baroness Williams were appointed Minister for Women and Minister for Equalities respectively. On 1 April 2018, the Home Office Permanent Secretary became the Principal Accounting Officer for the Women and Equalities portfolio, and delegated the administration of the GEO to the Department, where the GEO has been based for more than two years.
On 30 April 2018, the Secretary of State for International Development became the Minister for Women and Equalities, and Victoria Atkins and Baroness Williams retained their ministerial responsibilities. The GEO is working with officials across government to determine new arrangements to provide the best service to the new ministers.
The GEO has an ambitious agenda to champion equality and help make Britain a place where everyone can succeed without facing discrimination, and this work will continue under the leadership of the SoS for International Development.
SHARED SERVICE PROVISIONThe Department and its Agencies have an outsourced shared service arrangement for provision of certain areas of its internal finance, HR and procurement transactional processes. This arrangement has been in place since 2013.
There have been no significant failures of service during the year. However, the Department is keen to see an improvement in the service and process quality experienced by staff, and in the Department’s ability to use transactional service data to generate better quality management information.
The Department has experienced historic challenges in creating smooth end-to-end transactional processes, incorporating both the shared service and departmental processes. The Department has built a substantial suite of controls to protect data and transaction fulfilment, and these controls are regularly assessed by internal auditors. However, there has not been a full audit of the end-to-end process across the entire transaction in the case of the shared service provision. The Department is keen to carry out such a review in 2018-19.
During the year, the service provider’s external assessment of the design and operation of controls (undertaken in accordance with International Standard on Assurance Engagements (ISAE 3402)) received a qualified opinion from its ISAE 3402 auditors, as a number of the controls in place at the service provider had not operated as expected. No impact on financial accounts was identified by the auditors and further progress on addressing them is expected in 2018-19.
The shared service provider moved the Department onto the standard Oracle solution used across government in May 2017. That system was then upgraded for all 196,000 government users, to the latest version of Oracle software in February 2018. Lessons from those major technical changes have been captured and plans for improvement are being developed by the provider.
Given the combination of service and control challenges, the Department will be reviewing its transactional service arrangements to ensure it operates processes that are fit for purpose, flexible, and offer the best possible support to the Department.
CONCLUSIONI have considered the evidence provided regarding the production of the Annual Report and Governance Statement and the independent advice and assurance provided by the ARC. I conclude that the Department has satisfactory governance and risk management systems in place with effective plans to ensure continuous improvement.
Jonathan Slater Accounting Officer 9 July 2018
80 DfE CONSOLIDATED ANNUAL REPORT AND ACCOUNTS 2017-18
REMUNERATION AND STAFF REPORT
OVERVIEWThe remuneration and staff report sets out the Department’s remuneration policy for board members, reports on how that policy has been implemented and sets out the amounts awarded to directors and where relevant the link between performance and remuneration.
In addition, the report provides details on remuneration and staff that Parliament and other users see as key to accountability.
There is a presumption that information about named individuals will be given in all circumstances and all disclosures in the remuneration report will be consistent with identifiable information of those individuals in the financial statements. Non-disclosure is acceptable only where publication would:
• be in breach of any confidentiality agreement;
• prejudice the rights, freedom or legitimate interest of the individual;
• cause or be likely to cause substantial damage or substantial distress to the individual or another, and that damage or distress would be unwarranted; or
• affect national security or where an individual may be at risk if his or her name is disclosed.
In other cases, it would be for the staff member to make a case for non-disclosure, which should be considered by the employer on a case-by-case basis. Where non-disclosure is agreed, the fact that certain disclosure has been omitted should be disclosed.
Westminster departments are also required to follow guidance contained in the annual Employer Pension Notice issued by the Cabinet Office.
REMUNERATION PART A: UNAUDITED
Ministers’ and other board members’ remuneration policy
Ministers’ remuneration is set by the Ministerial and Other Salaries Act 197584 (as amended by the Ministerial and Other Salaries Order 1996) and the Ministerial and Other Pensions and Salaries Act 1991.85
Performance management and reward policy for members of the SCS is managed within a central framework set by the Cabinet Office. It allows for annual performance related base pay and non-consolidated performance awards, agreed centrally each year following the Senior Salaries Review Body (SSRB) recommendations.
SCS pay is decided by the SCS Remuneration Committee, chaired by the Permanent Secretary, and comprising members of the Leadership Team. The SCS Remuneration Committee makes decisions within the limits and delegated authorities set by the government in response to the annual report of the SSRB, who publish additional information.86 The Permanent Secretary meets separately with a non-executive board member to determine the pay of Leadership Team members.
84 https://www.legislation.gov.uk/ukpga/1975/27
85 https://www.legislation.gov.uk/ukpga/1991/5/contents
86 https://www.gov.uk/government/organisations/review-body-on-senior-salaries
81DfE CONSOLIDATED ANNUAL REPORT AND ACCOUNTS 2017-18
Summary and explanation of policy on duration of contracts, notice periods and termination payments
The Permanent Secretary is appointed by the Prime Minister on the recommendation of the Head of the Home Civil Service and with the agreement of the Ministerial head of the Department. The Permanent Secretary’s pay is set by the Prime Minister on the recommendation of the Permanent Secretaries Remuneration Committee, a sub-committee of the SSRB.
Members of the Leadership Team are appointed by the Permanent Secretary with the agreement of the Prime Minister and the Senior Leadership Committee where appropriate.
All Board members’ contractual terms comply with the requirements set centrally for the SCS by Cabinet Office, and the exact terms offered reflect the requirement of the post. The principles governing recruitment to, and departure from the Civil Service, including details of compensation for early termination, are set out in the Civil Service Management Code.87
SERVICE CONTRACTSThe Constitutional Reform and Governance Act 201088 requires Civil Service appointments to be made on merit on the basis of fair and open competition. The Recruitment Principles published by the Civil Service Commission specify the circumstances when appointments may be made on a different basis.
Unless otherwise stated below, the officials covered by this report hold appointments which are open-ended. Early termination, other than for misconduct, would result in the individual receiving compensation as set out in the Civil Service Compensation Scheme. Further information about the work of the Civil Service Commission is available.89
87 https://www.gov.uk/government/publications/civil-servants-terms-and-conditions
88 https://www.legislation.gov.uk/ukpga/2010/25/contents
89 https:/www.civilservicecommission.org.uk

82 DfE CONSOLIDATED ANNUAL REPORT AND ACCOUNTS 2017-18
PART B: AUDITED
Remuneration (including salary) and pension entitlements
The following sections provide details of the remuneration and pension interests of the ministers and most senior management (i.e. board members) of the Department. Where board members joined or left in the year annualised remuneration values have been presented in italics.
Ministers
SalarySeverance payments
Pension benefits (to nearest £000)
Total (to nearest £000)
2017-18 2016-17 2017-18 2016-17 2017-18 2016-17 2017-18 2016-17
£ £ £ £ £ £ £ £
Secretary of State
Rt Hon Damian Hinds MP (from 9 January 2018)
15,425
(67,505)
- - - 4,000 - 19,000 -
Rt Hon Justine Greening MP (to 8 January 2018)
52,081
(67,505)
45,003
(67,505)
16,876 - 11,000 13,000 80,000 58,000
Ministers of State
Rt Hon Nick Gibb MP 31,680 31,680 - - 8,000 9,000 40,000 41,000
Edward Timpson MP (to 9 June 2017)
6,072
(31,680)
31,680 - - 1,000 8,000 7,000 40,000
Rt Hon Robert Halfon MP (to 12 June 2017)
6,336
(31,680)
22,653
(31,680)
- - 1,000 6,000 7,000 29,000
Jo Johnson MP (to 9 January 2018)
- - - - - - - -
Rt Hon Anne Milton MP (from 12 June 2017)
25,432
(31,680)
- - - 6,000 - 32,000 -
Sam Gyimah MP (from 9 January 2018)
- - - - - - - -
Rt Hon Robert Goodwill MP (from 13 June 2017 to 9 January 2018)
16,606
(31,680)
- - - 3,000 - 20,000 -
Parliamentary Under Secretaries of State
Caroline Dinenage MP (to 14 June 2017)
5,594
(22,375)
14,917
(22,375)
- - 1,000 4,000 7,000 19,000
Lord Nash (to 28 September 2017)
- - - - - - - -
Lord Agnew (from 28 September 2017)
- - - - - - - -
Nadhim Zahawi MP (from 9 January 2018)
- - - - - - - -
Salary costs reported for ministers above reflect the pay received for their period of appointment as a Department minister. Where ministers move departments in month, the originating department will pay the full month’s salary.
No benefits-in-kind were paid to Ministers during 2017-18 (2016-17: £nil).
Sam Gyimah MP (and previously Jo Johnson MP) served in a joint post as Minister of State for Universities, Science, Research and Innovation with BEIS. His ministerial salary and pension is paid by BEIS and disclosed in their ARA.
No remuneration was taken by either Lord Nash, Lord Agnew or Nadhim Zahawi in either year presented in this report.

83DfE CONSOLIDATED ANNUAL REPORT AND ACCOUNTS 2017-18
Officials
Salary Bonus payment Benefits-in-kindPension benefits(to nearest £000)
Total
2017-18 2016-17 2017-18 2016-17 2017-18 2016-17 2017-18 2016-17 2017-18 2016-17
£000 £000 £000 £000 £ £ £000 £000 £000 £000
Permanent Secretary
Jonathan Slater 160-165 130-135
(155-160)
- - - - 24 27 185-190 160-165
Directors General
Paul Kett (from 23 January 2017 to 30 January 2018)
95-100
(115-120)
20-25
(115-120)
5-10 - - - 117 25 220-225 45-50
Peter Lauener (to 24 November 2017)
95-100
(140-145)
140-145 20-25 - - - - 8 120-125 145-150
Philippa Lloyd (to 30 January 2018)
100-105
(120-125)
80-85
(120-125)
- - - - 5 49 105-110 130-135
Andrew McCully (to 30 January 2018)
105-110
(125-130)
125-130 10-15 - - - 1 33 120-125 160-165
Indra Morris 135-140 20-25
(130-135)
- - - - - - 135-140 20-25
Howard Orme 155-160 65-70
(155-160)
- - - - 25 17 180-185 80-85
Mike Green (from 31 October 2017)
65-70
(155-160)
- - - - - 25 - 90-95 -
Eileen Milner (from 20 November 2017 to 30 January 2018)
25-30 (140-145)
- - - - - 11 - 35-40 -
Director
Jonathan Clear (from 31 October 2017)
40-45
(100-105)
- - - - - 56 - 95-100 -
The disclosures above include, where relevant, the effect of the Board streamlining at 30 January 2018 described in the lead non-executive board member’s report.
No severance payments were paid to Officials during 2017-18 (2016-17: £nil).
The pension benefits total for Howard Orme include £11,800 of employer’s contributions paid into a Paternership Scheme.

84 DfE CONSOLIDATED ANNUAL REPORT AND ACCOUNTS 2017-18
The value of pension benefits accrued during the year is calculated as the real increase in pension multiplied by 20, plus the real increase in any lump sum, less the contributions made by the individual. The real increases exclude increases due to inflation or any increase or decreases due to a transfer of pension rights. Pensions benefits movements are affected by duration of membership and earnings during this time and contain an actuarial calculation.
Salary
‘Salary’ includes gross salary, overtime, reserved rights to London weighting or London allowances, recruitment and retention allowances, private office allowances and any other allowance to the extent that it is subject to UK taxation. This report is based on accrued payments made by the Department and thus recorded in this ARA. In respect of ministers in the House of Commons, departments bear only the cost of the additional ministerial remuneration; the salary for their services as an MP and various allowances to which they are entitled are borne centrally. However, the arrangement for ministers in the House of Lords is different in that they do not receive a salary but rather an additional remuneration, which cannot be quantified separately from their ministerial salaries. This total remuneration, as well as the allowances to which they are entitled, is paid by the Department and is therefore shown in full in the figures above.
Three of the non-executive board members received remuneration from the Department:
2017-18 2016-17
Marion Plant 12,500 15,000
David Meller 12,500 15,000
Baroness Ruby McGregor Smith
15,000 17,500
Benefits-in-kind
The monetary value of benefits-in-kind covers any benefits provided by the Department and treated by HM Revenue and Customs as a taxable emolument.
During the year 2017-18 no Board members received benefits-in-kind (2016-17: one).
Bonuses
The Department awards bonuses as part of the performance management process. The Department sees effective performance management as key to driving up individual and organisational performance and providing greater value for money to deliver high quality public services. The Department follows the arrangements for the SCS as set out in the Performance Management arrangements for the Senior Civil Service, and the Department’s performance management framework for managing and rewarding performance throughout the year.
The timing of awards has changed in 2017-18, formerly being wholly retrospective (awarded in 2016-17 but paid in 2017-18) to being partially paid in the current year (in part awarded in 2017-18 and paid in 2017-18). Therefore, the performance awards disclosed in the remuneration report in 2017-18 cover both 2016-17 and an element of 2017-18 performance. In the Accounts bonuses are accrued in the year to which they relate.
Pay multiples
Reporting bodies are required to disclose the relationship between the remuneration of the highest-paid director in their organisation and the median remuneration of the organisation’s workforce.
The banded remuneration of the highest-paid director in the Department in 2017-18 was £160,000-165,000 (2016-17: £160,000-165,000). This was 4.2 times (2016-17: 4.3) the median remuneration of the workforce, which was £38,755 (2016-17: £37,795).
The increase in median remuneration is largely due to changes in the distribution of staff across the Department’s grade structure, with more staff in higher grades compared to 2016-17.
In 2017-18, nil (2016-17: nil) employees received remuneration in excess of the highest-paid director. Remuneration ranged from £18,500 to £165,000 (2016-17: £9,000 to £165,000).
Total remuneration includes salary, non-consolidated performance-related pay and benefits-in-kind. It does not include severance payments, employer pension contributions and the cash equivalent transfer value of pensions.
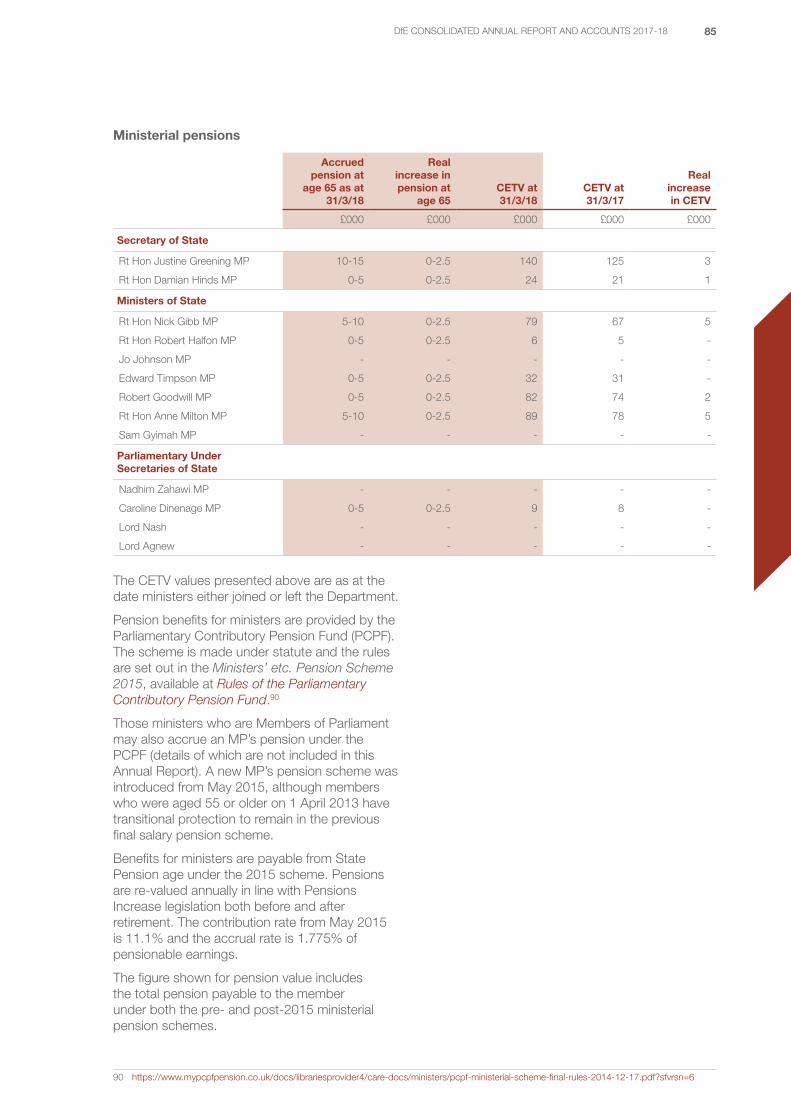
85DfE CONSOLIDATED ANNUAL REPORT AND ACCOUNTS 2017-18
Ministerial pensions
Accrued pension at
age 65 as at 31/3/18
Real increase in pension at
age 65CETV at 31/3/18
CETV at 31/3/17
Real increase in CETV
£000 £000 £000 £000 £000
Secretary of State
Rt Hon Justine Greening MP 10-15 0-2.5 140 125 3
Rt Hon Damian Hinds MP 0-5 0-2.5 24 21 1
Ministers of State
Rt Hon Nick Gibb MP 5-10 0-2.5 79 67 5
Rt Hon Robert Halfon MP 0-5 0-2.5 6 5 -
Jo Johnson MP - - - - -
Edward Timpson MP 0-5 0-2.5 32 31 -
Robert Goodwill MP 0-5 0-2.5 82 74 2
Rt Hon Anne Milton MP 5-10 0-2.5 89 78 5
Sam Gyimah MP - - - - -
Parliamentary Under Secretaries of State
Nadhim Zahawi MP - - - - -
Caroline Dinenage MP 0-5 0-2.5 9 8 -
Lord Nash - - - - -
Lord Agnew - - - - -
The CETV values presented above are as at the date ministers either joined or left the Department.
Pension benefits for ministers are provided by the Parliamentary Contributory Pension Fund (PCPF). The scheme is made under statute and the rules are set out in the Ministers’ etc. Pension Scheme 2015, available at Rules of the Parliamentary Contributory Pension Fund.90
Those ministers who are Members of Parliament may also accrue an MP’s pension under the PCPF (details of which are not included in this Annual Report). A new MP’s pension scheme was introduced from May 2015, although members who were aged 55 or older on 1 April 2013 have transitional protection to remain in the previous final salary pension scheme.
Benefits for ministers are payable from State Pension age under the 2015 scheme. Pensions are re-valued annually in line with Pensions Increase legislation both before and after retirement. The contribution rate from May 2015 is 11.1% and the accrual rate is 1.775% of pensionable earnings.
The figure shown for pension value includes the total pension payable to the member under both the pre- and post-2015 ministerial pension schemes.
90 https://www.mypcpfpension.co.uk/docs/librariesprovider4/care-docs/ministers/pcpf-ministerial-scheme-final-rules-2014-12-17.pdf?sfvrsn=6

86 DfE CONSOLIDATED ANNUAL REPORT AND ACCOUNTS 2017-18
Officials
Accrued pension at pension age
as at 31/3/18 and related lump
sum
Real increase in pension and
related lump sum at pension
ageCETV at 31/3/18
CETV at 31/3/17
Real increase in CETV
£000 £000 £000 £000 £000
Permanent Secretary
Jonathan Slater 55-60 plus a lump sum of 175-180
0-2.5 plus a lump sum of 2.5-5
1,248 1,148 21
Directors General
Andrew McCully (to 30 January 2018)
55-60 plus a lump sum of
75-80
0-2.5 1,093 1,032 -
Peter Lauener (to 24 November 2017)
- - - 1,626 -
Paul Kett (to 30 January 2018)
30-35 5-7.5 321 256 53
Philippa Lloyd (to 30 January 2018)
45-50 plus a lump sum of
50-55
0-2.5 915 859 4
Indra Morris - - - - -
Howard Orme 25-30 0-2.5 564 527 23
Mike Green (from 31 October 2017)
15-20 0-2.5 240 214 13
Director
Jonathan Clear (from 31 October 2017)
20-25 2.5-5 226 195 25
Civil Service pensions
Pension benefits are provided through the Civil Service pension arrangements. From 1 April 2015 a new pension scheme for civil servants was introduced – the Civil Servants and Others Pension Scheme or alpha, which provides benefits on a career average basis with a normal pension age equal to the member’s State Pension Age (or 65 if higher). From that date, all newly appointed civil servants and the majority of those already in service joined alpha. Prior to that date, civil servants participated in the Principal Civil Service Pension Scheme (PCSPS). The PCSPS has four sections: three providing benefits on a final salary basis (classic, premium or classic plus) with a normal pension age of 60; and one providing benefits on a whole career basis (nuvos) with a normal pension age of 65.
These statutory arrangements are unfunded with the cost of benefits met by monies voted by Parliament each year. Pensions payable under classic, premium, classic plus, nuvos and alpha are increased annually in line with Pensions Increase legislation. Existing members of the PCSPS who were within 10 years of their normal pension age on 1 April 2012 remained in the PCSPS after 1 April 2015. Those who were between 10 years and 13 years and 5 months
from their normal pension age on 1 April 2012 will switch into alpha sometime between 1 June 2015 and 1 February 2022. All members who switch to alpha have their PCSPS benefits ‘banked’, with those with earlier benefits in one of the final salary sections of the PCSPS having those benefits based on their final salary when they leave alpha. (The pension figures quoted for officials show pension earned in PCSPS or alpha – as appropriate. Where the official has benefits in both the PCSPS and alpha the figure quoted is the combined value of their benefits in the two schemes). Members joining from October 2002 may opt for either the appropriate defined benefit arrangement or a ‘money purchase’ stakeholder pension with an employer contribution (partnership pension account).
Employee contributions are salary-related and range between 3% and 8.05% of pensionable earnings for members of classic (and members of alpha who were members of classic immediately before joining alpha) and between 4.6% and 8.05% for members of premium, classic plus, nuvos and all other members of alpha. Benefits in classic accrue at the rate of 1/80 of final pensionable earnings for each year of service. In addition, a lump sum equivalent to three years’ initial pension is payable on retirement.
87DfE CONSOLIDATED ANNUAL REPORT AND ACCOUNTS 2017-18
For premium, benefits accrue at the rate of 1/60th of final pensionable earnings for each year of service. Unlike classic, there is no automatic lump sum. Classic plus is essentially a hybrid with benefits for service before 1 October 2002 calculated broadly as per classic and benefits for service from October 2002 worked out as in premium. In nuvos, a member builds up a pension based on his pensionable earnings during their period of scheme membership. At the end of the scheme year (31 March) the member’s earned pension account is credited with 2.3% of their pensionable earnings in that scheme year and the accrued pension is uprated in line with Pensions Increase legislation. Benefits in alpha build up in a similar way to nuvos, except that the accrual rate in 2.32%. In all cases members may opt to give up (commute) pension for a lump sum up to the limits set by the Finance Act 2004.
The partnership pension account is a stakeholder pension arrangement. The employer makes a basic contribution of between 3% and 12.5% up to 30 September 2015 and 8% and 14.75% from 1 October 2015 (depending on the age of the member) into a stakeholder pension product chosen by the employee from a panel of providers. The employee does not have to contribute, but where they do make contributions, the employer will match these up to a limit of 3% of pensionable salary (in addition to the employer’s basic contribution). Employers also contribute a further 0.8% of pensionable salary up to 30 September 2015 and 0.5% of pensionable salary from 1 October 2015 to cover the cost of centrally-provided risk benefit cover (death in service and ill health retirement).
The accrued pension quoted is the pension the member is entitled to receive when they reach pension age, or immediately on ceasing to be an active member of the scheme if they are already at or over pension age. Pension age is 60 for members of classic, premium and classic plus, 65 for members of nuvos, and the higher of 65 or State Pension Age for members of alpha. (The pension figures quoted for officials show pension earned in PCSPS or alpha – as appropriate. Where the official has benefits in both the PCSPS and alpha the figure quoted is the combined value of their benefits in the two schemes, but note that part of that pension may be payable from different ages). Further details about the Civil Service pension arrangements91 can be found online.
Cash Equivalent Transfer Values – ministers and officials
A CETV is the actuarially assessed capitalised value of the pension scheme benefits accrued by a member at a particular point in time. The benefits valued are the member’s accrued benefits and any contingent spouse’s pension payable from the scheme.
A CETV is a payment made by a pension scheme or arrangement to secure pension benefits in another pension scheme or arrangement when the member leaves a scheme and chooses to transfer the benefits accrued in their former scheme.
The pension figures shown relate to the benefits that the individual has accrued as a consequence of their total membership of the pension scheme, not just their service in a senior capacity to which disclosure applies.
The figures include the value of any pension benefit in another scheme or arrangement which the member has transferred to the Civil Service pension arrangements. They also include any additional pension benefit accrued to the member as a result of their buying additional pension benefits at their own cost.
CETVs are worked out in accordance with The Occupational Pension Schemes (Transfer Values) (Amendment) Regulations 200892 and do not take account of any actual or potential reduction to benefits resulting from Lifetime Allowance Tax which may be due when pension benefits are taken.
Real increase in CETV
This reflects the increase in CETV that is funded by the employer. It does not include the increase in accrued pension due to inflation, contributions paid by the employee (including the value of any benefits transferred from another pension scheme or arrangement) and uses common market valuation factors for the start and end of the period.
The real increase in the value of the CETV
This is the element of the increase in accrued pension funded by the Exchequer. It excludes increases due to inflation and contributions paid by the minister. It is worked out using common market valuation factors for the start and end of the period.
Compensation and payments to past directors
No payments have been made to former directors of the Department in 2017-18 (2016-17: £nil).
91 https:/www.civilservicepensionscheme.org.uk
92 https://www.legislation.gov.uk/uksi/2008/1050/contents/made
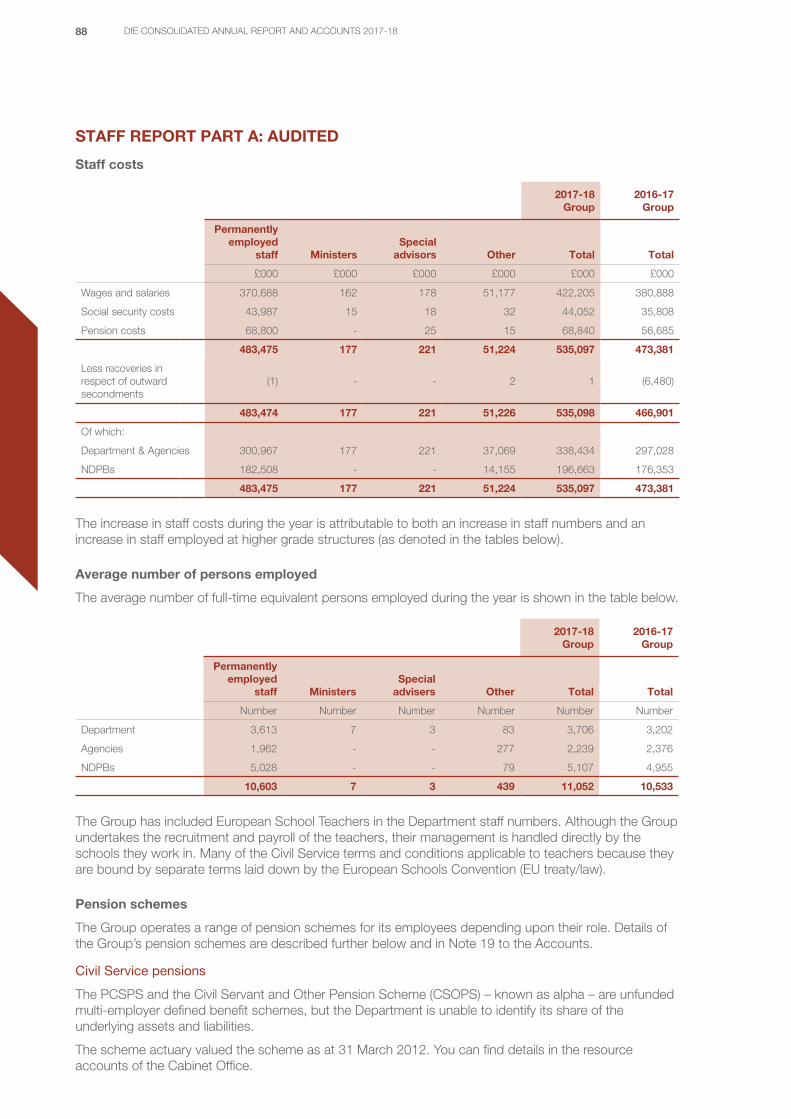
88 DfE CONSOLIDATED ANNUAL REPORT AND ACCOUNTS 2017-18
STAFF REPORT PART A: AUDITED
Staff costs
2017-18Group
2016-17Group
Permanently employed
staff MinistersSpecial
advisors Other Total Total
£000 £000 £000 £000 £000 £000
Wages and salaries 370,688 162 178 51,177 422,205 380,888
Social security costs 43,987 15 18 32 44,052 35,808
Pension costs 68,800 - 25 15 68,840 56,685
483,475 177 221 51,224 535,097 473,381
Less recoveries in respect of outward secondments
(1) - - 2 1 (6,480)
483,474 177 221 51,226 535,098 466,901
Of which:
Department & Agencies 300,967 177 221 37,069 338,434 297,028
NDPBs 182,508 - - 14,155 196,663 176,353
483,475 177 221 51,224 535,097 473,381
The increase in staff costs during the year is attributable to both an increase in staff numbers and an increase in staff employed at higher grade structures (as denoted in the tables below).
Average number of persons employed
The average number of full-time equivalent persons employed during the year is shown in the table below.
2017-18Group
2016-17Group
Permanently employed
staff MinistersSpecial
advisers Other Total Total
Number Number Number Number Number Number
Department 3,613 7 3 83 3,706 3,202
Agencies 1,962 - - 277 2,239 2,376
NDPBs 5,028 - - 79 5,107 4,955
10,603 7 3 439 11,052 10,533
The Group has included European School Teachers in the Department staff numbers. Although the Group undertakes the recruitment and payroll of the teachers, their management is handled directly by the schools they work in. Many of the Civil Service terms and conditions applicable to teachers because they are bound by separate terms laid down by the European Schools Convention (EU treaty/law).
Pension schemes
The Group operates a range of pension schemes for its employees depending upon their role. Details of the Group’s pension schemes are described further below and in Note 19 to the Accounts.
Civil Service pensions
The PCSPS and the Civil Servant and Other Pension Scheme (CSOPS) – known as alpha – are unfunded multi-employer defined benefit schemes, but the Department is unable to identify its share of the underlying assets and liabilities.
The scheme actuary valued the scheme as at 31 March 2012. You can find details in the resource accounts of the Cabinet Office.
89DfE CONSOLIDATED ANNUAL REPORT AND ACCOUNTS 2017-18
For 2017-18, employers’ contributions of £32.4 million were payable to the PCSPS and CSOPS (2016-17: £21.9 million) at one of four rates in the range 20.0% to 24.5% of pensionable earnings, based on salary bands.
The scheme actuary reviews employer contributions usually every four years following a full scheme valuation. The contribution rates are set to meet the cost of the benefits accruing during 2017-18 to be paid when the member retires and not the benefits paid during this period to existing pensioners.
Partnership pension accounts
Group employees can opt to open a partnership pension account, a stakeholder pension with an employer contribution. Employers’ contributions of £233,000 (2016-17: £148,000) were paid to one or more of the panel of three appointed stakeholder pension providers. Employer contributions are age-related and range from 3% to 12.5% of pensionable earnings up to 30 September 2015, and from 8% to 14.75% of pensionable earning from 1 October 2015. The Group also match employee contributions up to 3% of pensionable earnings. In addition, employer contributions of £9,000 (2016-17: £5,000), 0.8% of pensionable pay up to 30 September 2015 and 0.5% of pensionable pay from 1 October 2015, were payable to the PCSPS and CSOPS to cover the cost of the future provision of lump sum benefits on death in service or ill health retirement of these employees.
Contributions due to the partnership pension providers at the year end were £23,000 (2016-17: £14,000). Contributions prepaid at that date were nil (2016-17: £nil).
Reporting of civil service and other compensation schemes
The disclosure of agreed departures during the year comprises two categories:
• employees who agreed to leave during the year and left by 31 March 2018; and
• employees who have committed to leave by 31 March 2018 for whom the exit packages have been accrued.
Numbers and costs are based on estimated value of exit packages, and expected number of agreed departures are based on the best information available to management at the time of preparing the accounts.
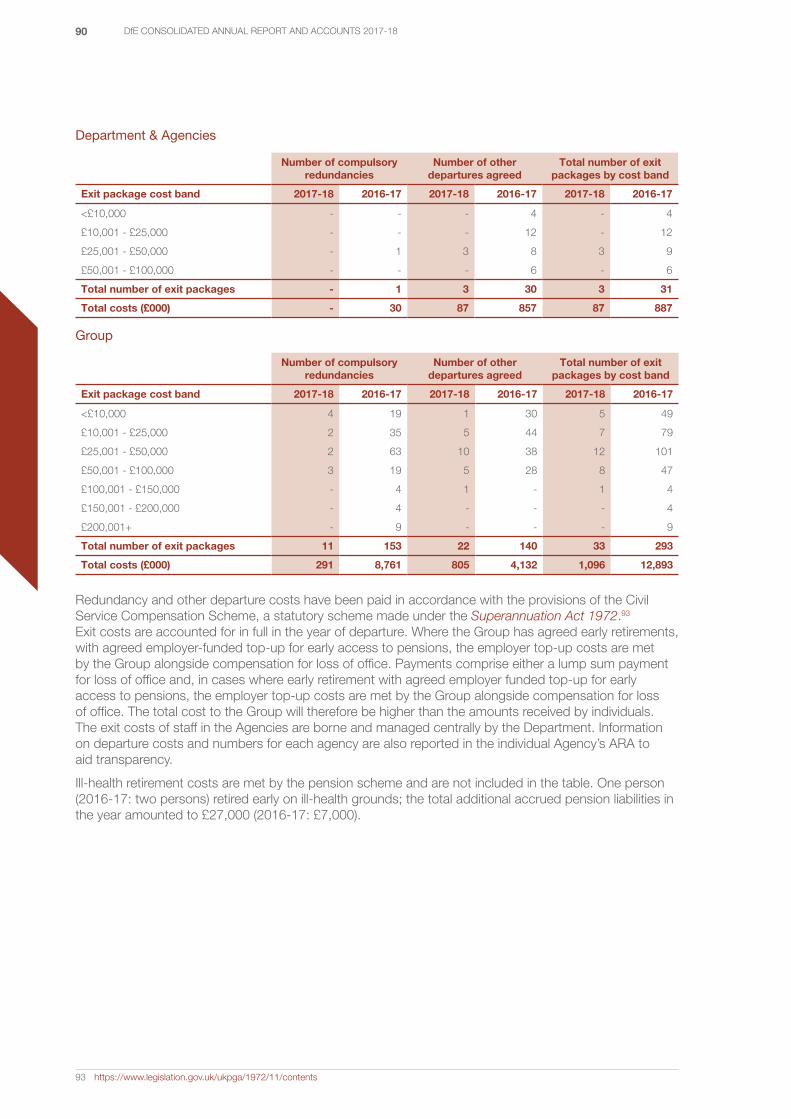
90 DfE CONSOLIDATED ANNUAL REPORT AND ACCOUNTS 2017-18
Department & Agencies
Number of compulsory redundancies
Number of other departures agreed
Total number of exit packages by cost band
Exit package cost band 2017-18 2016-17 2017-18 2016-17 2017-18 2016-17
<£10,000 - - - 4 - 4
£10,001 - £25,000 - - - 12 - 12
£25,001 - £50,000 - 1 3 8 3 9
£50,001 - £100,000 - - - 6 - 6
Total number of exit packages - 1 3 30 3 31
Total costs (£000) - 30 87 857 87 887
Group
Number of compulsory redundancies
Number of other departures agreed
Total number of exit packages by cost band
Exit package cost band 2017-18 2016-17 2017-18 2016-17 2017-18 2016-17
<£10,000 4 19 1 30 5 49
£10,001 - £25,000 2 35 5 44 7 79
£25,001 - £50,000 2 63 10 38 12 101
£50,001 - £100,000 3 19 5 28 8 47
£100,001 - £150,000 - 4 1 - 1 4
£150,001 - £200,000 - 4 - - - 4
£200,001+ - 9 - - - 9
Total number of exit packages 11 153 22 140 33 293
Total costs (£000) 291 8,761 805 4,132 1,096 12,893
Redundancy and other departure costs have been paid in accordance with the provisions of the Civil Service Compensation Scheme, a statutory scheme made under the Superannuation Act 1972.93 Exit costs are accounted for in full in the year of departure. Where the Group has agreed early retirements, with agreed employer-funded top-up for early access to pensions, the employer top-up costs are met by the Group alongside compensation for loss of office. Payments comprise either a lump sum payment for loss of office and, in cases where early retirement with agreed employer funded top-up for early access to pensions, the employer top-up costs are met by the Group alongside compensation for loss of office. The total cost to the Group will therefore be higher than the amounts received by individuals. The exit costs of staff in the Agencies are borne and managed centrally by the Department. Information on departure costs and numbers for each agency are also reported in the individual Agency’s ARA to aid transparency.
Ill-health retirement costs are met by the pension scheme and are not included in the table. One person (2016-17: two persons) retired early on ill-health grounds; the total additional accrued pension liabilities in the year amounted to £27,000 (2016-17: £7,000).
93 https://www.legislation.gov.uk/ukpga/1972/11/contents

91DfE CONSOLIDATED ANNUAL REPORT AND ACCOUNTS 2017-18
PART B: UNAUDITED
Staff by grade and gender
The figures in the table below cover permanent staff at 31 March 2018, based on headcount. The disclosures have been calculated using data received from the Department (including European School Teachers), Agencies and NDPBs.
2018 2017
Grade Male Female Total Male Female Total
Permanent Secretary 1 - 1 1 - 1
Director General 4 6 10 6 4 10
Director 44 36 80 44 32 76
Deputy Director 119 145 264 91 117 208
Grade 6 402 380 782 349 337 686
Grade 7 789 1,038 1,827 612 802 1,414
Senior Executive Officer 977 1,117 2,094 705 815 1,520
Higher Executive Officer 1,013 1,264 2,277 752 972 1,724
Executive Officer 646 1,074 1,720 925 1,417 2,342
Executive Assistant 929 1,354 2,283 976 1,387 2,363
4,924 6,414 11,338 4,461 5,883 10,344
Analysis of staff policies and statistics
Our people
Recruitment practice
The Department has a duty to ensure it is fully compliant with the Civil Service Commissioners’ recruitment principles. The Department’s approach to recruitment reflects its commitment to equal and fair opportunity for all. All recruitment processes comply with the Equality Act 2010.
Sickness absence
Figures below show the average number of working days lost through sickness absence across the Department & Agencies.
2017-18 2016-17 2015-16
Days per FTE 3.9 4.0 4.7
The figure above compares well with figures across the Civil Service, which were 6.8 average working days lost per full time equivalents (FTE) in the year ending 30 June 2017.94
Commitment to improving diversity
The Department launched a new five year diversity and inclusion strategy in January 2018. It sets out action the Department will take in five areas: leadership; recruitment and attraction; talent and progression; collection, sharing and use of data; and inclusive culture and behaviours. The strategy is underpinned by four key principles:
• everyone has a role to play in creating an inclusive culture and making the Department a truly great place to work;
• we are all able to ‘be ourselves’ at work – to be different from each other in many ways and feel supported, empowered, valued, respected and fairly treated;
• all of us are able to build successful careers and achieve our potential; and
• we put openness, honesty, challenge and innovation at the core of what we do.
94 https://www.gov.uk/government/publications/civil-service-sickness-absence

92 DfE CONSOLIDATED ANNUAL REPORT AND ACCOUNTS 2017-18
The Department has measured itself against a number of external benchmarks. It reached the top 100 of the Stonewall employer index for the first time, being ranked 78 of 434 employers. The Department was also ranked 49 in the Social Mobility Foundation’s employer index in 2017, and achieved Disability Confident Leader status. The Department has 10 active staff diversity networks, including a BAME network, a LGBT+ network, a disability group and a neurodivergence network. Unconscious bias training has been made mandatory for all staff, whilst other diversity and inclusion training includes leading inclusive teams workshops and disability confident line manager focus groups. A network of over 60 mental health first aiders provide first line support and advice to managers and staff to help them manage their mental health. Recruitment practices
have been strengthened to make greater use of social media, using inclusive language in job adverts and highlighting the progress the Department is making on diversity and inclusion in our job adverts. We continue to use our Board level diversity champions to highlight the work we are doing, and we have now added a champion for faith and beliefs.
Addressing under-representation
The diversity and inclusion strategy introduced specific targets for the representation of BAME and disabled staff in the senior civil service for the first time. The targets, which have been agreed with Cabinet Office, are 8.3% and 9% for disabled and BAME staff respectively by 2020, and 12% and 13% by 2023.
2018 2017 2016 2015 2014
% No: % No: % No: % No: % No:
Women in SCS 58 128 56 105 46 65 45 60 44 59
Women in Top Management Positions 53 28 50 23 46 20 43 20 41 14
Black and Minority Ethnic (BME) in SCS 6 10 3 4 4 5 4 <5 6 5
Disabled in SCS 10 13 5 5 - <5 3 <5 6 <5
Lesbian, Gay, Bisexual and Transgender in SCS (LGBT)
7 10 8 9 7 10 9 5 7 5
Women in feeder grades 56 1,113 55 839 54 575 53 600 53 590
BME in feeder grades 12 152 12 124 9 100 11 95 12 95
Disabled staff in feeder grades 10 107 7 67 6 60 10 65 9 55
LGBT in feeder grades 6 57 5 38 2 25 4 25 4 25
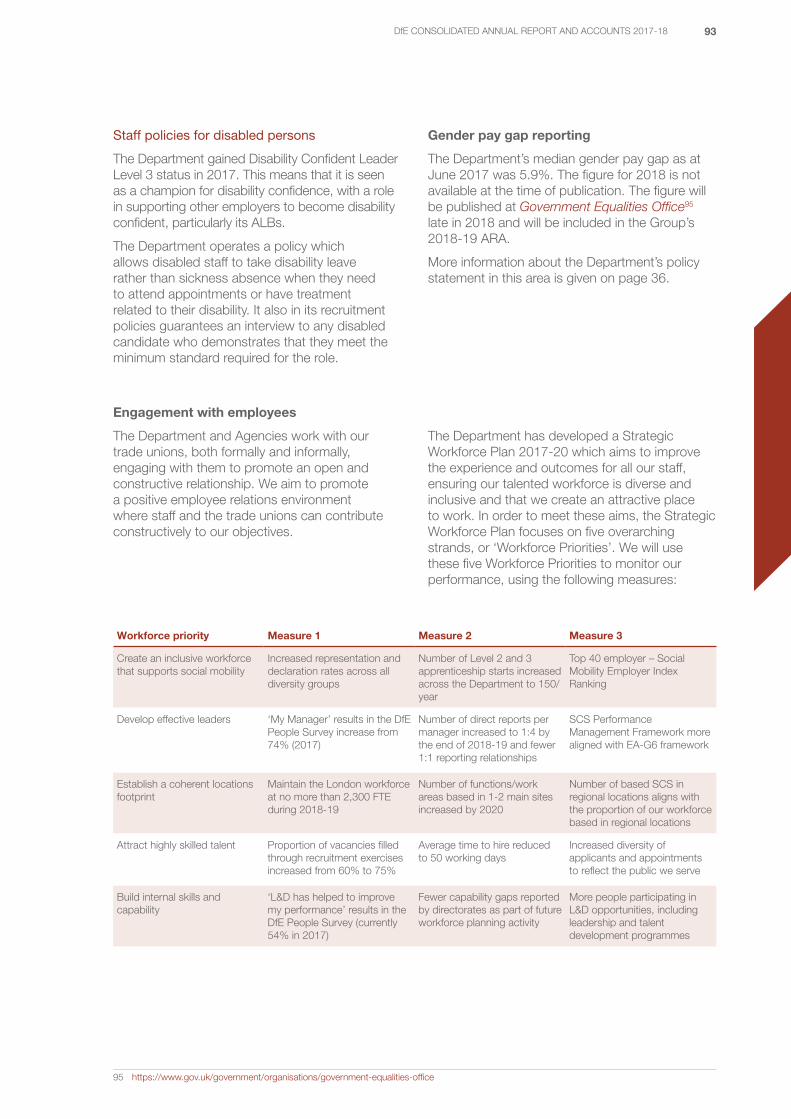
93DfE CONSOLIDATED ANNUAL REPORT AND ACCOUNTS 2017-18
Staff policies for disabled persons
The Department gained Disability Confident Leader Level 3 status in 2017. This means that it is seen as a champion for disability confidence, with a role in supporting other employers to become disability confident, particularly its ALBs.
The Department operates a policy which allows disabled staff to take disability leave rather than sickness absence when they need to attend appointments or have treatment related to their disability. It also in its recruitment policies guarantees an interview to any disabled candidate who demonstrates that they meet the minimum standard required for the role.
Gender pay gap reporting
The Department’s median gender pay gap as at June 2017 was 5.9%. The figure for 2018 is not available at the time of publication. The figure will be published at Government Equalities Office95 late in 2018 and will be included in the Group’s 2018-19 ARA.
More information about the Department’s policy statement in this area is given on page 36.
Engagement with employees
The Department and Agencies work with our trade unions, both formally and informally, engaging with them to promote an open and constructive relationship. We aim to promote a positive employee relations environment where staff and the trade unions can contribute constructively to our objectives.
The Department has developed a Strategic Workforce Plan 2017-20 which aims to improve the experience and outcomes for all our staff, ensuring our talented workforce is diverse and inclusive and that we create an attractive place to work. In order to meet these aims, the Strategic Workforce Plan focuses on five overarching strands, or ‘Workforce Priorities’. We will use these five Workforce Priorities to monitor our performance, using the following measures:
Workforce priority Measure 1 Measure 2 Measure 3
Create an inclusive workforce that supports social mobility
Increased representation and declaration rates across all diversity groups
Number of Level 2 and 3 apprenticeship starts increased across the Department to 150/year
Top 40 employer – Social Mobility Employer Index Ranking
Develop effective leaders ‘My Manager’ results in the DfE People Survey increase from 74% (2017)
Number of direct reports per manager increased to 1:4 by the end of 2018-19 and fewer 1:1 reporting relationships
SCS Performance Management Framework more aligned with EA-G6 framework
Establish a coherent locations footprint
Maintain the London workforce at no more than 2,300 FTE during 2018-19
Number of functions/work areas based in 1-2 main sites increased by 2020
Number of based SCS in regional locations aligns with the proportion of our workforce based in regional locations
Attract highly skilled talent Proportion of vacancies filled through recruitment exercises increased from 60% to 75%
Average time to hire reduced to 50 working days
Increased diversity of applicants and appointments to reflect the public we serve
Build internal skills and capability
‘L&D has helped to improve my performance’ results in the DfE People Survey (currently 54% in 2017)
Fewer capability gaps reported by directorates as part of future workforce planning activity
More people participating in L&D opportunities, including leadership and talent development programmes
95 https://www.gov.uk/government/organisations/government-equalities-office

94 DfE CONSOLIDATED ANNUAL REPORT AND ACCOUNTS 2017-18
The Department conducts a full people survey annually, with the results published each December.
2017-18 2016-17 2015-16
Response rate 88% 92% 88%
Engagement index 63% 62% 60%
The information from the survey is being used to support development of the Department’s strategies and continually improve our levels of employee engagement.
Consultancy and temporary staff
Consultants are hired to work on projects in a number of specific situations: where the Group does not have the skills set required, where the particular requirement falls outside the core business of civil servants, or where an external, independent perspective is required. When used appropriately, consultancy can be a cost effective and efficient way of getting the temporary and skilled external input that the Group needs. We are committed to the consistent application of the Cabinet Office’s 2010 controls on consultancy and other spending.96
For the Department and its Agencies, spend on consultancy requires completion of a business case which is signed off by a senior civil servant. Consultancy engagements below £10,000 are cleared by the deputy director with budget/delivery responsibility. Engagements between £10,000 and £20,000 are scrutinised and cleared by the Head of Procurement. For engagements over £20,000, the implications for Finance and HR must also be considered and approved, then signed off by the lead Efficiency Controls Minister. If these cases are also expected to last in excess of nine months, or are for procurement related consultancy, they are subject to Cabinet Office controls.
The Group’s consultancy expenditure was as follows:
2017-18 2016-17 2015-16
£m £m £m
Department 9.0 6.0 3.5
Agencies 0.4 0.1 -
NDPBs 5.2 6.0 5.1
14.6 12.1 8.6
This expertise was mainly used to support change programmes across the Group and specialist research contracted out to third parties.
The Group has contracts for the engagement of staff and specialist contractors to cover short-term requirements such as covering unexpected absences, short-term peaks in workload, short-term projects or a permanent vacancy until the vacancy can be filled. Use of contingent labour is also subject to the efficiency controls process and requires ministerial approval for recruitment to SCS equivalent grades, and Director General approval for grades below this. Contingent labour expenditure was as follows:
2017-18 2016-17 2015-16
£m £m £m
Department 27.2 22.5 9.1
Agencies 9.1 13.9 7.0
NDPBs 14.0 14.5 15.3
50.3 50.9 31.4
96 https://www.gov.uk/government/publications/cabinet-office-controls

95DfE CONSOLIDATED ANNUAL REPORT AND ACCOUNTS 2017-18
Review of tax arrangements of public sector appointees
As part of the Review of Tax Arrangements of Public Sector Appointees published by the Chief Secretary to the Treasury on 23 May 2012, departments were directed to publish: information pertaining to the number of off-payroll engagements, at a cost of over £58,200 that were in place on, or after, 31 January 2012; and
any off-payroll engagements of Board members, and/or senior officials with significant financial responsibility, between 1 April 2017 and 31 March 2018.
The tables on the following pages set out this information. Where Agencies and NDPBs are not named in the tables below, that body does not have any discloseable engagements.
For all off-payroll engagements as of 31 March 2018, for more than £245 per day and that last for longer than six months
Dept ESFA STA EHRC SLC ECITB Group
Number of existing engagements as at 31 March 2018:
32 54 21 5 14 1 127
Of which:
less than one year at time of reporting 10 2 4 - 10 1 27
between one and two years at time of reporting 13 9 17 3 4 - 46
between two and three years at time of reporting 8 11 - 1 - - 20
between three and four years at time of reporting - 8 - 1 - - 9
four or more years at time of reporting 1 24 - - - - 25
All new off-payroll engagements, or those that reached six months in duration, between 1 April 2017 and 31 March 2018, for more than £245 per day and that last for longer than six months
Dept ESFA STA SLC ECITB Group
Number of new engagements, or those that reached six months in duration, between 1 April 2017 and 31 March 2018
10 2 4 10 1 27
Of which:
Number assessed as caught by IR35 6 - - 3 - 9
Number assessed as not caught by IR35 4 2 4 7 1 18
Number engaged directly (via PSC contracted to Department) and are on the departmental payroll
- - - - - -
Number of engagements reassessed for consistency/assurance purposes during the year
9 - - - - 9
Number of engagements that saw a change to IR35 status following the consistency review
- - - - - -
Off-payroll engagements of Board members and/or senior officials with significant financial responsibility, between 1 April 2017 and 31 March 2018
SLC Dept Other Group
Number of off-payroll engagements of board members, and/or, senior officials with significant financial responsibility, during the financial year
3 - - 3
Total number of individuals on- and off-payroll that have been deemed ‘Board members, and/or, senior officials with significant financial responsibility’, during the financial year. This figure should include both on- and off-payroll engagements
15 47 15 77
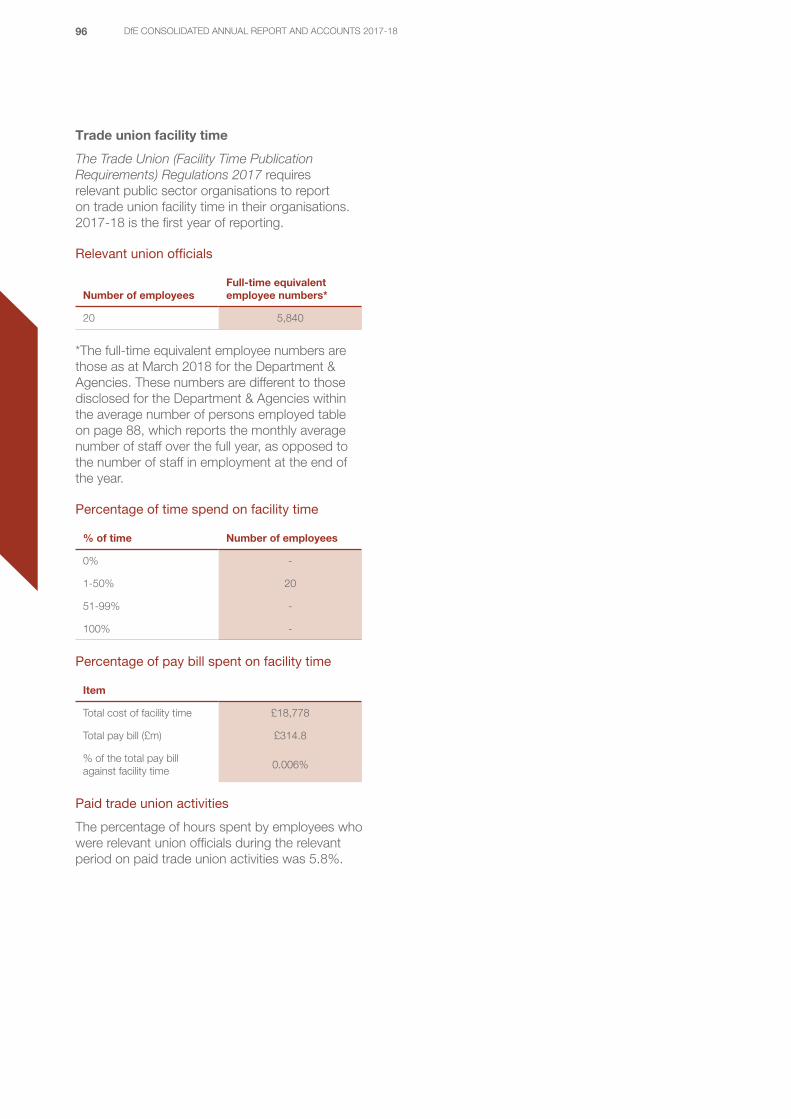
96 DfE CONSOLIDATED ANNUAL REPORT AND ACCOUNTS 2017-18
Trade union facility time
The Trade Union (Facility Time Publication Requirements) Regulations 2017 requires relevant public sector organisations to report on trade union facility time in their organisations. 2017-18 is the first year of reporting.
Relevant union officials
Number of employeesFull-time equivalent employee numbers*
20 5,840
*The full-time equivalent employee numbers are those as at March 2018 for the Department & Agencies. These numbers are different to those disclosed for the Department & Agencies within the average number of persons employed table on page 88, which reports the monthly average number of staff over the full year, as opposed to the number of staff in employment at the end of the year.
Percentage of time spend on facility time
% of time Number of employees
0% -
1-50% 20
51-99% -
100% -
Percentage of pay bill spent on facility time
Item
Total cost of facility time £18,778
Total pay bill (£m) £314.8
% of the total pay bill against facility time
0.006%
Paid trade union activities
The percentage of hours spent by employees who were relevant union officials during the relevant period on paid trade union activities was 5.8%.
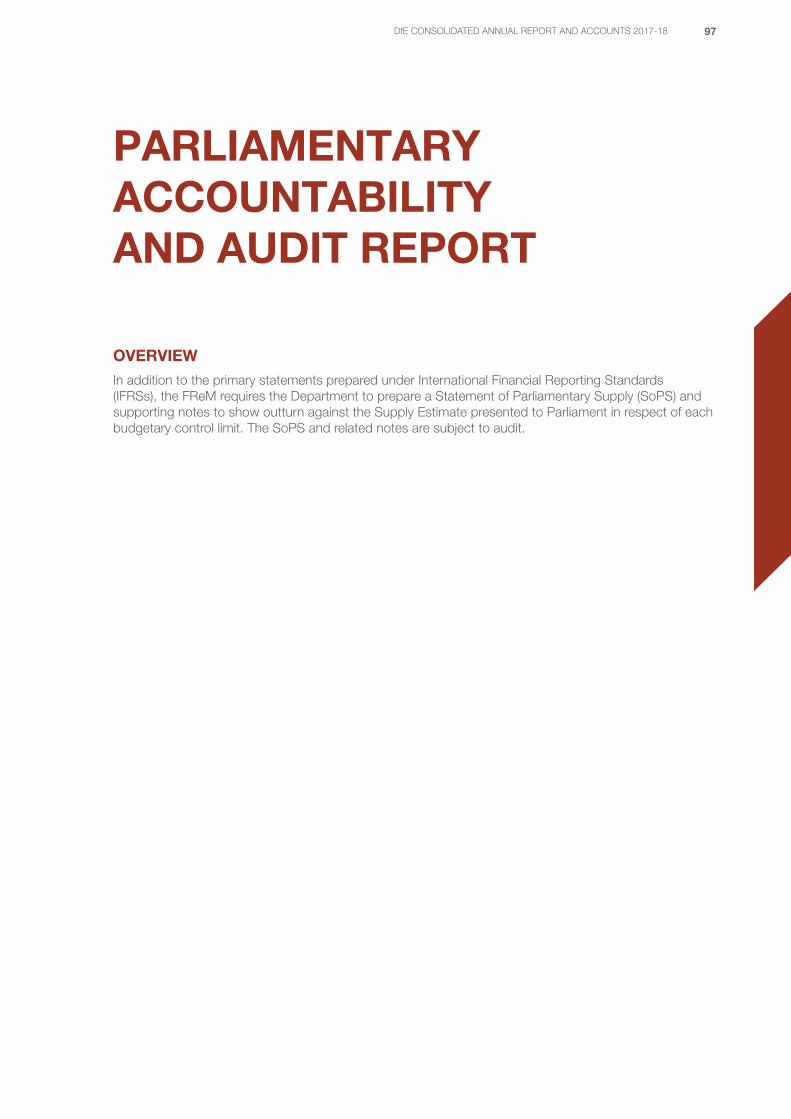
97DfE CONSOLIDATED ANNUAL REPORT AND ACCOUNTS 2017-18
PARLIAMENTARY ACCOUNTABILITY AND AUDIT REPORT
OVERVIEWIn addition to the primary statements prepared under International Financial Reporting Standards (IFRSs), the FReM requires the Department to prepare a Statement of Parliamentary Supply (SoPS) and supporting notes to show outturn against the Supply Estimate presented to Parliament in respect of each budgetary control limit. The SoPS and related notes are subject to audit.
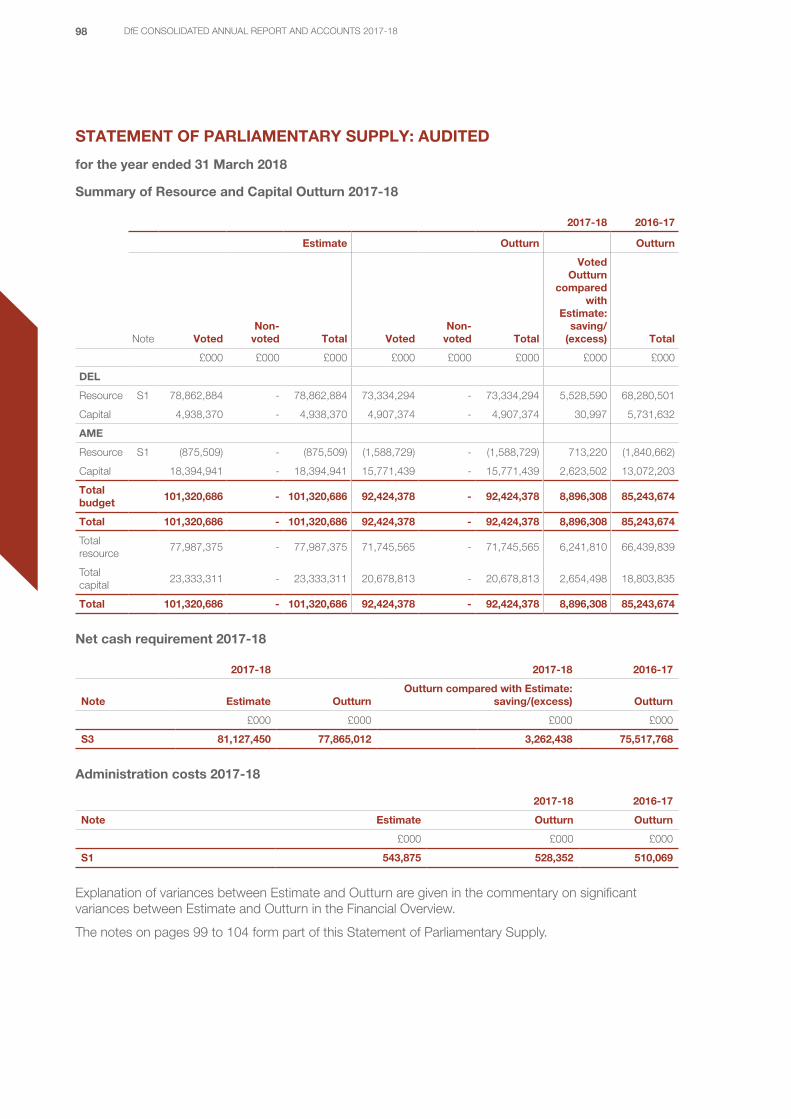
98 DfE CONSOLIDATED ANNUAL REPORT AND ACCOUNTS 2017-18
STATEMENT OF PARLIAMENTARY SUPPLY: AUDITED
for the year ended 31 March 2018
Summary of Resource and Capital Outturn 2017-18
2017-18 2016-17
Estimate Outturn Outturn
Note VotedNon-
voted Total VotedNon-
voted Total
Voted Outturn
compared with
Estimate: saving/
(excess) Total
£000 £000 £000 £000 £000 £000 £000 £000
DEL
Resource S1 78,862,884 - 78,862,884 73,334,294 - 73,334,294 5,528,590 68,280,501
Capital 4,938,370 - 4,938,370 4,907,374 - 4,907,374 30,997 5,731,632
AME
Resource S1 (875,509) - (875,509) (1,588,729) - (1,588,729) 713,220 (1,840,662)
Capital 18,394,941 - 18,394,941 15,771,439 - 15,771,439 2,623,502 13,072,203
Total budget
101,320,686 - 101,320,686 92,424,378 - 92,424,378 8,896,308 85,243,674
Total 101,320,686 - 101,320,686 92,424,378 - 92,424,378 8,896,308 85,243,674
Total resource
77,987,375 - 77,987,375 71,745,565 - 71,745,565 6,241,810 66,439,839
Total capital
23,333,311 - 23,333,311 20,678,813 - 20,678,813 2,654,498 18,803,835
Total 101,320,686 - 101,320,686 92,424,378 - 92,424,378 8,896,308 85,243,674
Net cash requirement 2017-18
2017-18 2017-18 2016-17
Note Estimate OutturnOutturn compared with Estimate:
saving/(excess) Outturn
£000 £000 £000 £000
S3 81,127,450 77,865,012 3,262,438 75,517,768
Administration costs 2017-18
2017-18 2016-17
Note Estimate Outturn Outturn
£000 £000 £000
S1 543,875 528,352 510,069
Explanation of variances between Estimate and Outturn are given in the commentary on significant variances between Estimate and Outturn in the Financial Overview.
The notes on pages 99 to 104 form part of this Statement of Parliamentary Supply.
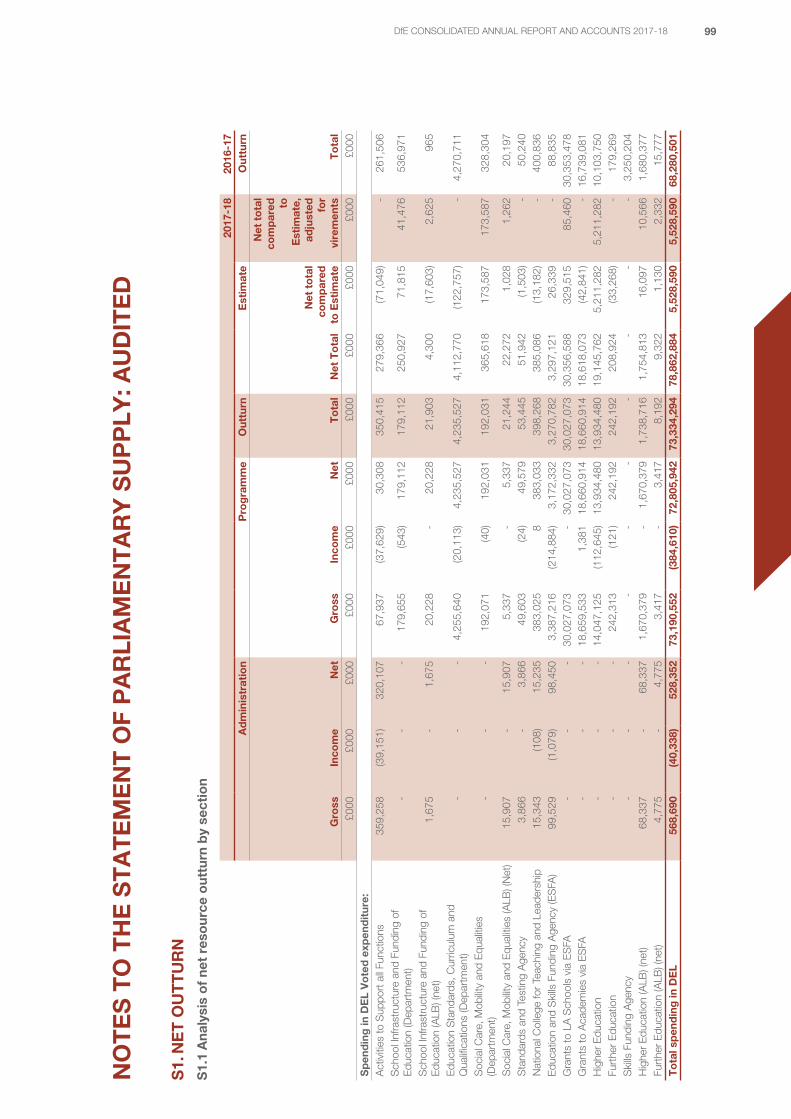
99DfE CONSOLIDATED ANNUAL REPORT AND ACCOUNTS 2017-18
NO
TE
S T
O T
HE
ST
AT
EM
EN
T O
F P
AR
LIA
ME
NT
AR
Y S
UP
PLY
: AU
DIT
ED
S1.
NE
T O
UT
TU
RN
S1.
1 A
naly
sis
of
net
reso
urce
out
turn
by
sect
ion
2017
-18
2016
-17
Ad
min
istr
atio
nP
rog
ram
me
Out
turn
Est
imat
eO
uttu
rn
Gro
ssIn
com
eN
etG
ross
Inco
me
Net
To
tal
Net
To
tal
Net
to
tal
com
par
ed
to E
stim
ate
Net
to
tal
com
par
ed
to
Est
imat
e,
adju
sted
fo
r vi
rem
ents
To
tal
£000
£000
£000
£000
£000
£000
£000
£000
£000
£000
£000
Sp
end
ing
in D
EL
Vo
ted
exp
end
itur
e:A
ctiv
ities
to S
uppo
rt a
ll Fu
nctio
ns35
9,25
8(3
9,15
1)32
0,10
767
,937
(37,
629)
30,3
0835
0,41
527
9,36
6(7
1,04
9)-
261,
506
Sch
ool I
nfra
stru
ctur
e an
d Fu
ndin
g of
E
duca
tion
(Dep
artm
ent)
--
-17
9,65
5(5
43)
179,
112
179,
112
250,
927
71,8
1541
,476
536,
971
Sch
ool I
nfra
stru
ctur
e an
d Fu
ndin
g of
E
duca
tion
(ALB
) (ne
t)1,
675
- 1,
675
20,2
28-
20,2
2821
,903
4,30
0(1
7,60
3)2,
625
965
Edu
catio
n S
tand
ards
, Cur
ricul
um a
nd
Qua
lifica
tions
(Dep
artm
ent)
--
-4,
255,
640
(20,
113)
4,23
5,52
74,
235,
527
4,11
2,77
0(1
22,7
57)
-4,
270,
711
Soc
ial C
are,
Mob
ility
and
Equ
aliti
es
(Dep
artm
ent)
--
-19
2,07
1(4
0)19
2,03
119
2,03
136
5,61
817
3,58
717
3,58
732
8,30
4
Soc
ial C
are,
Mob
ility
and
Equ
aliti
es (A
LB) (
Net
)15
,907
-15
,907
5,33
7-
5,33
721
,244
22,2
721,
028
1,26
220
,197
Sta
ndar
ds a
nd T
estin
g A
genc
y3,
866
-3,
866
49,6
03(2
4)49
,579
53,4
4551
,942
(1,5
03)
-50
,240
N
atio
nal C
olle
ge fo
r Te
achi
ng a
nd L
eade
rshi
p15
,343
(108
)15
,235
383,
025
838
3,03
339
8,26
838
5,08
6(1
3,18
2)-
400,
836
Edu
catio
n an
d S
kills
Fun
ding
Age
ncy
(ES
FA)
99,5
29(1
,079
)98
,450
3,38
7,21
6(2
14,8
84)
3,17
2,33
23,
270,
782
3,29
7,12
126
,339
-88
,835
Gra
nts
to L
A S
choo
ls v
ia E
SFA
--
-30
,027
,073
-30
,027
,073
30,0
27,0
7330
,356
,588
329,
515
85,4
6030
,353
,478
Gra
nts
to A
cade
mie
s vi
a E
SFA
--
-18
,659
,533
1,38
118
,660
,914
18,6
60,9
1418
,618
,073
(42,
841)
-16
,739
,081
Hig
her
Edu
catio
n-
--
14,0
47,1
25(1
12,6
45)
13,9
34,4
8013
,934
,480
19,1
45,7
625,
211,
282
5,21
1,28
210
,103
,750
Furt
her
Edu
catio
n-
--
242,
313
(121
)24
2,19
224
2,19
220
8,92
4(3
3,26
8)-
179,
269
Ski
lls F
undi
ng A
genc
y-
--
--
--
--
-3,
250,
204
Hig
her
Edu
catio
n (A
LB) (
net)
68,3
37-
68,3
371,
670,
379
-1,
670,
379
1,73
8,71
61,
754,
813
16,0
9710
,566
1,68
0,37
7Fu
rthe
r E
duca
tion
(ALB
) (ne
t)4,
775
- 4,
775
3,41
7-
3,41
78,
192
9,32
21,
130
2,33
215
,777
To
tal s
pen
din
g in
DE
L56
8,69
0(4
0,33
8)52
8,35
273
,190
,552
(384
,610
)72
,805
,942
73,3
34,2
9478
,862
,884
5,52
8,59
05,
528,
590
68,2
80,5
01
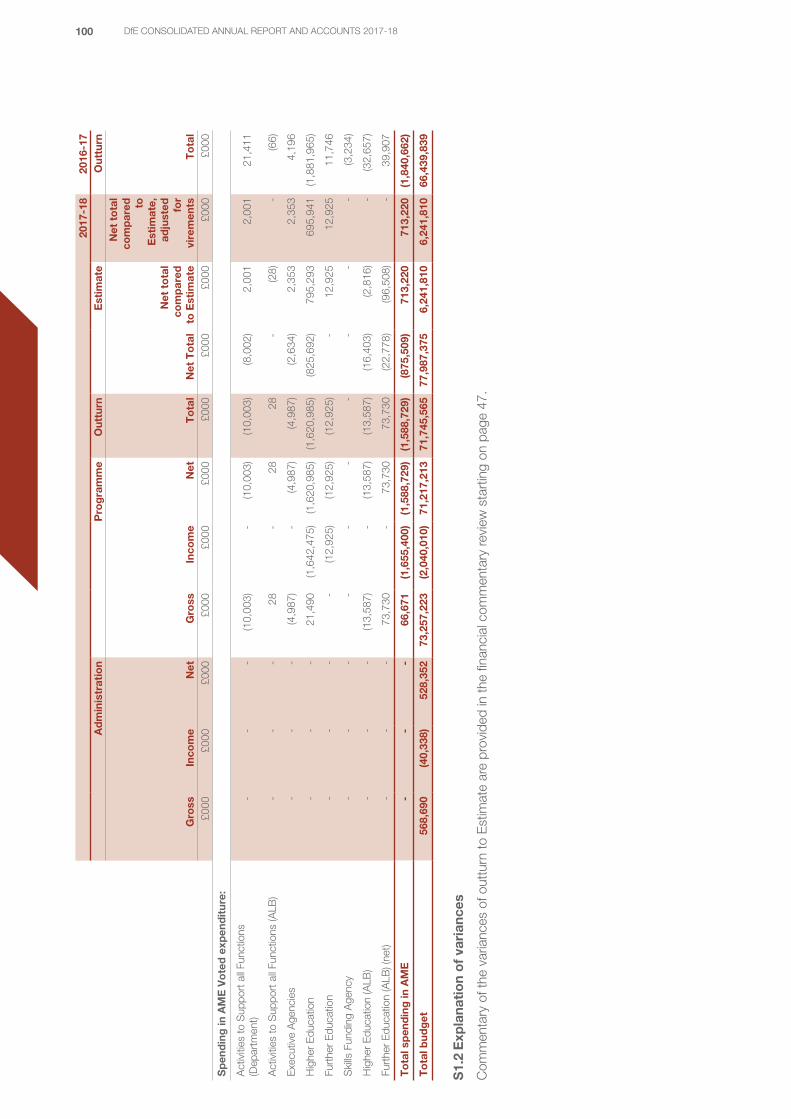
100 DfE CONSOLIDATED ANNUAL REPORT AND ACCOUNTS 2017-18
2017
-18
2016
-17
Ad
min
istr
atio
nP
rog
ram
me
Out
turn
Est
imat
eO
uttu
rn
Gro
ssIn
com
eN
etG
ross
Inco
me
Net
To
tal
Net
To
tal
Net
to
tal
com
par
ed
to E
stim
ate
Net
to
tal
com
par
ed
to
Est
imat
e,
adju
sted
fo
r vi
rem
ents
To
tal
£000
£000
£000
£000
£000
£000
£000
£000
£000
£000
£000
Sp
end
ing
in A
ME
Vo
ted
exp
end
itur
e:
Act
iviti
es to
Sup
port
all
Func
tions
(D
epar
tmen
t)-
--
(10,
003)
-(1
0,00
3)(1
0,00
3)(8
,002
)2,
001
2,00
121
,411
Act
iviti
es to
Sup
port
all
Func
tions
(ALB
)-
--
28-
2828
-(2
8)-
(66)
Exe
cutiv
e A
genc
ies
--
-(4
,987
)-
(4,9
87)
(4,9
87)
(2,6
34)
2,35
32,
353
4,19
6
Hig
her
Edu
catio
n-
--
21,4
90(1
,642
,475
)(1
,620
,985
)(1
,620
,985
)(8
25,6
92)
795,
293
695,
941
(1,8
81,9
65)
Furt
her
Edu
catio
n-
--
-(1
2,92
5)(1
2,92
5)(1
2,92
5)-
12,9
2512
,925
11,7
46
Ski
lls F
undi
ng A
genc
y-
--
--
--
--
-(3
,234
)
Hig
her
Edu
catio
n (A
LB)
--
-(1
3,58
7)-
(13,
587)
(13,
587)
(16,
403)
(2,8
16)
-(3
2,65
7)
Furt
her
Edu
catio
n (A
LB) (
net)
--
-73
,730
-73
,730
73,7
30(2
2,77
8)(9
6,50
8)-
39,9
07
To
tal s
pen
din
g in
AM
E-
--
66,6
71(1
,655
,400
)(1
,588
,729
)(1
,588
,729
)(8
75,5
09)
713,
220
713,
220
(1,8
40,6
62)
To
tal b
udg
et56
8,69
0(4
0,33
8)52
8,35
273
,257
,223
(2,0
40,0
10)
71,2
17,2
1371
,745
,565
77,9
87,3
756,
241,
810
6,24
1,81
066
,439
,839
S1.
2 E
xpla
nati
on
of
vari
ance
s
Com
men
tary
of t
he v
aria
nces
of o
uttu
rn to
Est
imat
e ar
e pr
ovid
ed in
the
finan
cial
com
men
tary
revi
ew s
tart
ing
on p
age
47.
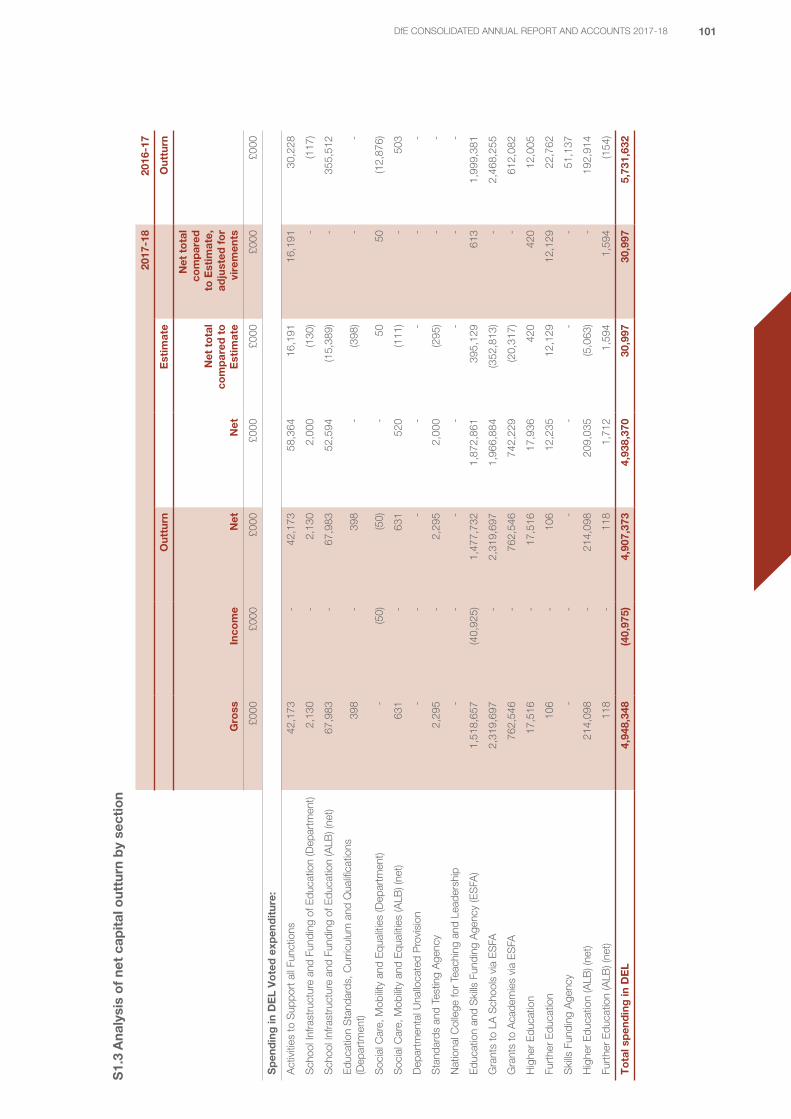
101DfE CONSOLIDATED ANNUAL REPORT AND ACCOUNTS 2017-18
S1.
3 A
naly
sis
of
net
cap
ital
out
turn
by
sect
ion
2017
-18
2016
-17
Out
turn
Est
imat
eO
uttu
rn
Gro
ssIn
com
eN
etN
et
Net
to
tal
com
par
ed t
o
Est
imat
e
Net
to
tal
com
par
ed
to E
stim
ate,
ad
just
ed f
or
vire
men
ts
£000
£000
£000
£000
£000
£000
£000
Sp
end
ing
in D
EL
Vo
ted
exp
end
itur
e:
Act
iviti
es to
Sup
port
all
Func
tions
42,1
73-
42,1
7358
,364
16,1
9116
,191
30,2
28
Sch
ool I
nfra
stru
ctur
e an
d Fu
ndin
g of
Edu
catio
n (D
epar
tmen
t)2,
130
-2,
130
2,00
0(1
30)
-(1
17)
Sch
ool I
nfra
stru
ctur
e an
d Fu
ndin
g of
Edu
catio
n (A
LB) (
net)
67,9
83-
67,9
8352
,594
(15,
389)
-35
5,51
2
Edu
catio
n S
tand
ards
, Cur
ricul
um a
nd Q
ualifi
catio
ns
(Dep
artm
ent)
398
-39
8-
(398
)-
-
Soc
ial C
are,
Mob
ility
and
Equ
aliti
es (D
epar
tmen
t)-
(50)
(50)
-50
50(1
2,87
6)
Soc
ial C
are,
Mob
ility
and
Equ
aliti
es (A
LB) (
net)
631
-63
152
0(1
11)
-50
3
Dep
artm
enta
l Una
lloca
ted
Pro
visi
on-
--
--
--
Sta
ndar
ds a
nd T
estin
g A
genc
y2,
295
-2,
295
2,00
0(2
95)
--
Nat
iona
l Col
lege
for
Teac
hing
and
Lea
ders
hip
--
--
--
-
Edu
catio
n an
d S
kills
Fun
ding
Age
ncy
(ES
FA)
1,51
8,65
7(4
0,92
5)1,
477,
732
1,87
2,86
139
5,12
961
31,
999,
381
Gra
nts
to L
A S
choo
ls v
ia E
SFA
2,31
9,69
7-
2,31
9,69
71,
966,
884
(352
,813
)-
2,46
8,25
5
Gra
nts
to A
cade
mie
s vi
a E
SFA
762,
546
-76
2,54
674
2,22
9(2
0,31
7)-
612,
082
Hig
her
Edu
catio
n17
,516
-17
,516
17,9
3642
042
012
,005
Furt
her
Edu
catio
n10
6-
106
12,2
3512
,129
12,1
2922
,762
Ski
lls F
undi
ng A
genc
y-
--
--
-51
,137
Hig
her
Edu
catio
n (A
LB) (
net)
214,
098
-21
4,09
820
9,03
5(5
,063
)-
192,
914
Furt
her
Edu
catio
n (A
LB) (
net)
118
-11
81,
712
1,59
41,
594
(154
)
To
tal s
pen
din
g in
DE
L4,
948,
348
(40,
975)
4,90
7,37
34,
938,
370
30,9
9730
,997
5,73
1,63
2
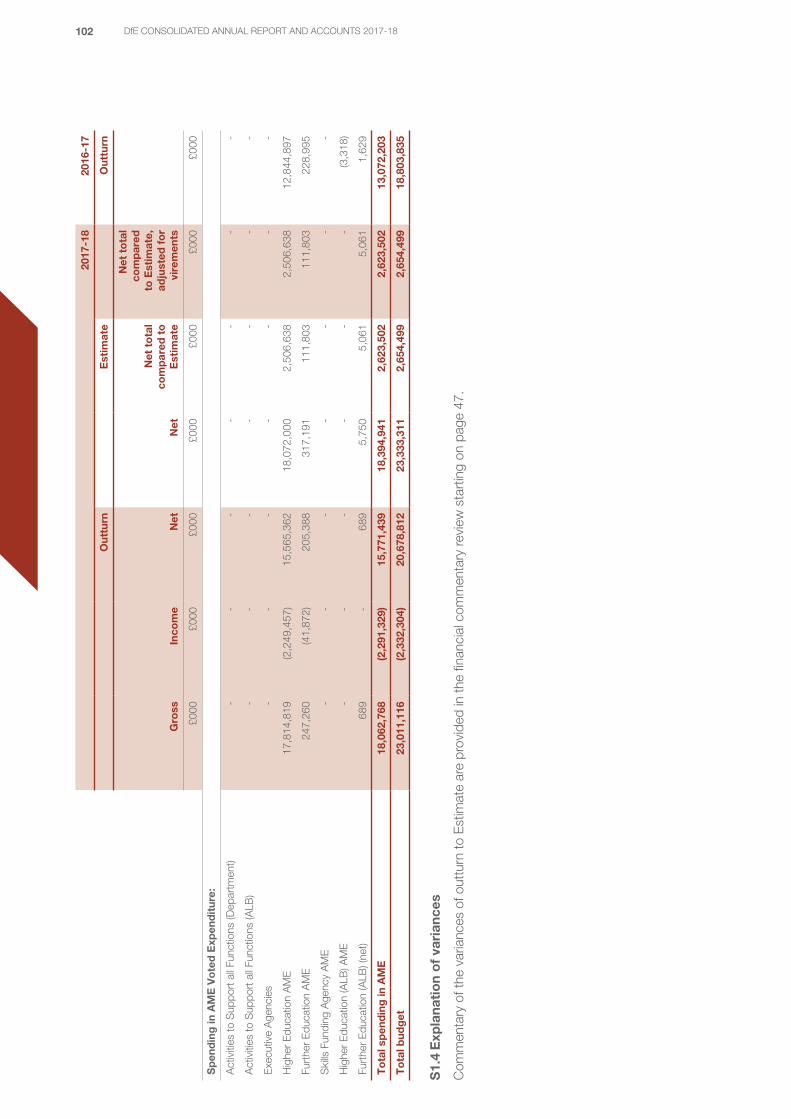
102 DfE CONSOLIDATED ANNUAL REPORT AND ACCOUNTS 2017-18
2017
-18
2016
-17
Out
turn
Est
imat
eO
uttu
rn
Gro
ssIn
com
eN
etN
et
Net
to
tal
com
par
ed t
o
Est
imat
e
Net
to
tal
com
par
ed
to E
stim
ate,
ad
just
ed f
or
vire
men
ts
£000
£000
£000
£000
£000
£000
£000
Sp
end
ing
in A
ME
Vo
ted
Exp
end
itur
e:
Act
iviti
es to
Sup
port
all
Func
tions
(Dep
artm
ent)
--
--
--
-
Act
iviti
es to
Sup
port
all
Func
tions
(ALB
)-
--
--
--
Exe
cutiv
e A
genc
ies
--
--
--
-
Hig
her
Edu
catio
n A
ME
17,8
14,8
19(2
,249
,457
)15
,565
,362
18,0
72,0
002,
506,
638
2,50
6,63
812
,844
,897
Furt
her
Edu
catio
n A
ME
247,
260
(41,
872)
205,
388
317,
191
111,
803
111,
803
228,
995
Ski
lls F
undi
ng A
genc
y A
ME
--
--
--
-
Hig
her
Edu
catio
n (A
LB) A
ME
--
--
--
(3,3
18)
Furt
her
Edu
catio
n (A
LB) (
net)
689
-68
95,
750
5,06
15,
061
1,62
9
To
tal s
pen
din
g in
AM
E18
,062
,768
(2,2
91,3
29)
15,7
71,4
3918
,394
,941
2,62
3,50
22,
623,
502
13,0
72,2
03
To
tal b
udg
et23
,011
,116
(2,3
32,3
04)
20,6
78,8
1223
,333
,311
2,65
4,49
92,
654,
499
18,8
03,8
35
S1.
4 E
xpla
nati
on
of
vari
ance
s
Com
men
tary
of t
he v
aria
nces
of o
uttu
rn to
Est
imat
e ar
e pr
ovid
ed in
the
finan
cial
com
men
tary
revi
ew s
tart
ing
on p
age
47.
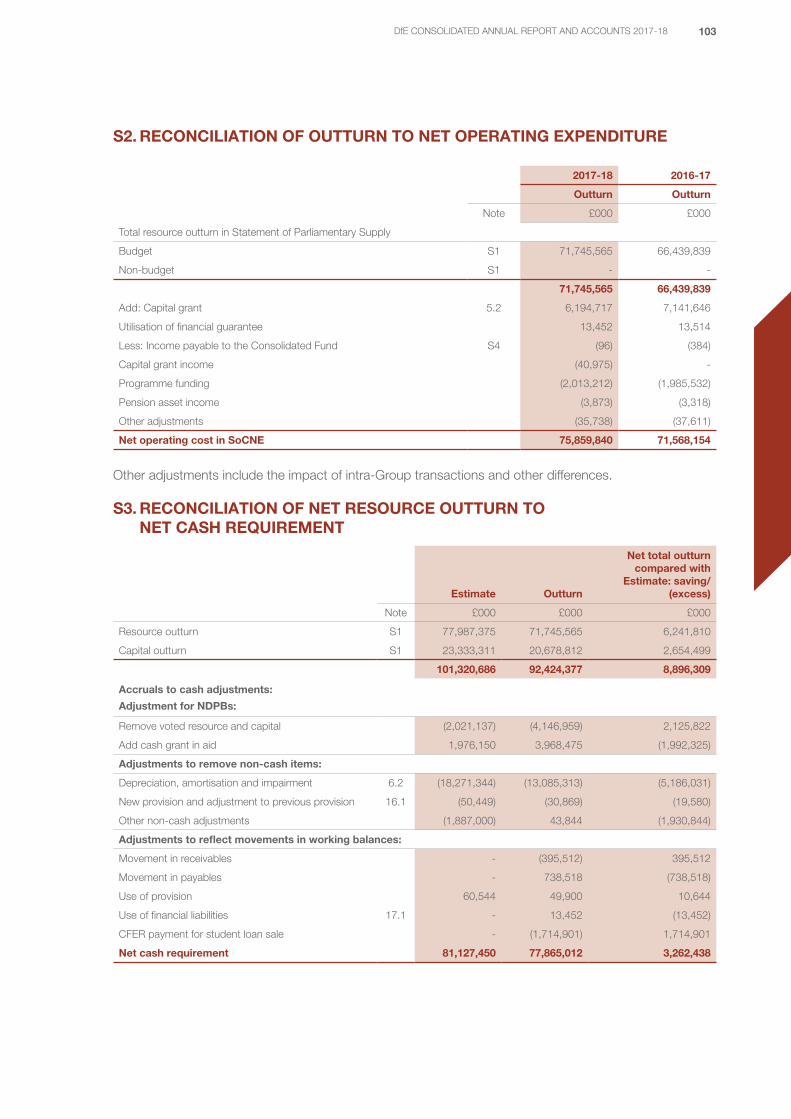
103DfE CONSOLIDATED ANNUAL REPORT AND ACCOUNTS 2017-18
S2. RECONCILIATION OF OUTTURN TO NET OPERATING EXPENDITURE
2017-18 2016-17
Outturn Outturn
Note £000 £000
Total resource outturn in Statement of Parliamentary Supply
Budget S1 71,745,565 66,439,839
Non-budget S1 - -
71,745,565 66,439,839
Add: Capital grant 5.2 6,194,717 7,141,646
Utilisation of financial guarantee 13,452 13,514
Less: Income payable to the Consolidated Fund S4 (96) (384)
Capital grant income (40,975) -
Programme funding (2,013,212) (1,985,532)
Pension asset income (3,873) (3,318)
Other adjustments (35,738) (37,611)
Net operating cost in SoCNE 75,859,840 71,568,154
Other adjustments include the impact of intra-Group transactions and other differences.
S3. RECONCILIATION OF NET RESOURCE OUTTURN TO NET CASH REQUIREMENT
Estimate Outturn
Net total outturn compared with
Estimate: saving/(excess)
Note £000 £000 £000
Resource outturn S1 77,987,375 71,745,565 6,241,810
Capital outturn S1 23,333,311 20,678,812 2,654,499
101,320,686 92,424,377 8,896,309
Accruals to cash adjustments:
Adjustment for NDPBs:
Remove voted resource and capital (2,021,137) (4,146,959) 2,125,822
Add cash grant in aid 1,976,150 3,968,475 (1,992,325)
Adjustments to remove non-cash items:
Depreciation, amortisation and impairment 6.2 (18,271,344) (13,085,313) (5,186,031)
New provision and adjustment to previous provision 16.1 (50,449) (30,869) (19,580)
Other non-cash adjustments (1,887,000) 43,844 (1,930,844)
Adjustments to reflect movements in working balances:
Movement in receivables - (395,512) 395,512
Movement in payables - 738,518 (738,518)
Use of provision 60,544 49,900 10,644
Use of financial liabilities 17.1 - 13,452 (13,452)
CFER payment for student loan sale - (1,714,901) 1,714,901
Net cash requirement 81,127,450 77,865,012 3,262,438
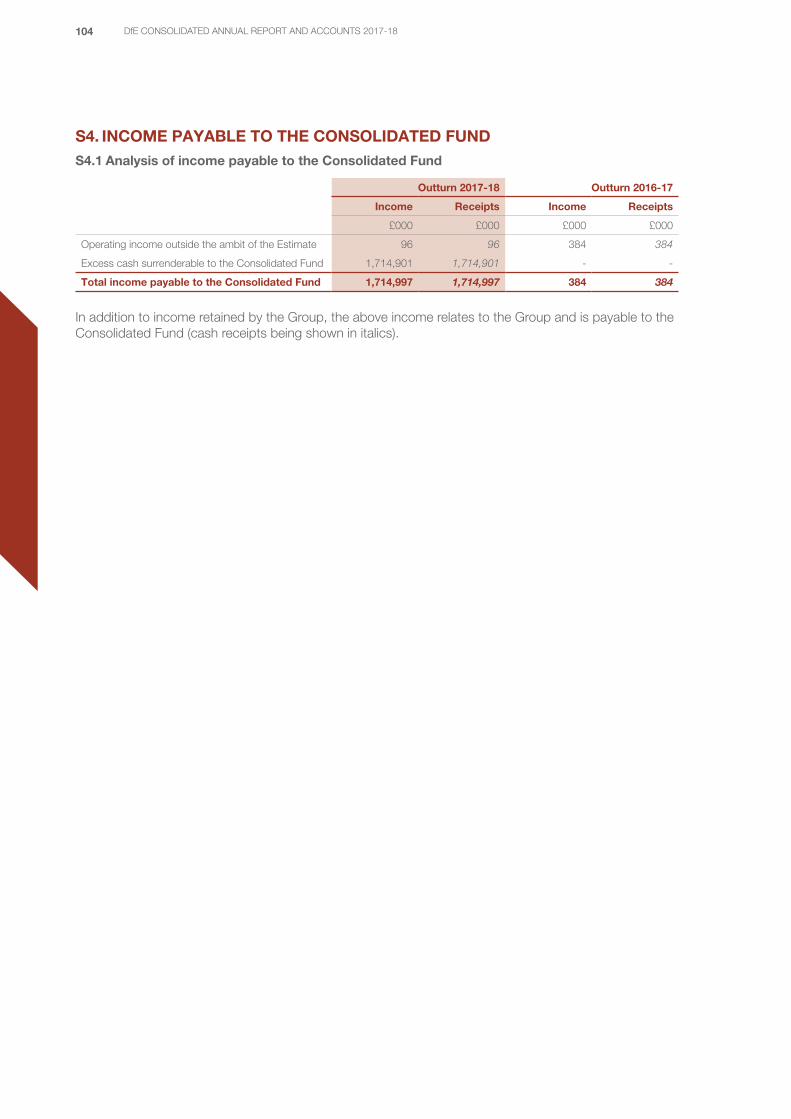
104 DfE CONSOLIDATED ANNUAL REPORT AND ACCOUNTS 2017-18
S4. INCOME PAYABLE TO THE CONSOLIDATED FUNDS4.1 Analysis of income payable to the Consolidated Fund
Outturn 2017-18 Outturn 2016-17
Income Receipts Income Receipts
£000 £000 £000 £000
Operating income outside the ambit of the Estimate 96 96 384 384
Excess cash surrenderable to the Consolidated Fund 1,714,901 1,714,901 - -
Total income payable to the Consolidated Fund 1,714,997 1,714,997 384 384
In addition to income retained by the Group, the above income relates to the Group and is payable to the Consolidated Fund (cash receipts being shown in italics).
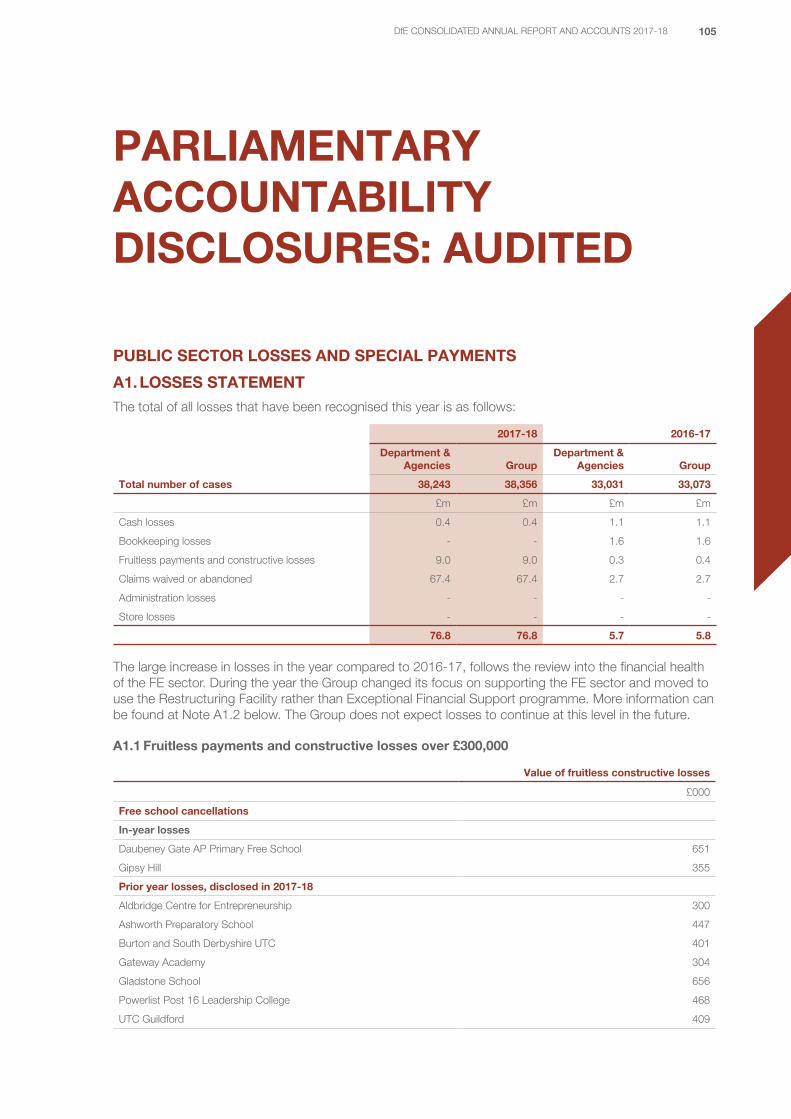
105DfE CONSOLIDATED ANNUAL REPORT AND ACCOUNTS 2017-18
PARLIAMENTARY ACCOUNTABILITY DISCLOSURES: AUDITED
PUBLIC SECTOR LOSSES AND SPECIAL PAYMENTS
A1. LOSSES STATEMENTThe total of all losses that have been recognised this year is as follows:
2017-18 2016-17
Department & Agencies Group
Department & Agencies Group
Total number of cases 38,243 38,356 33,031 33,073
£m £m £m £m
Cash losses 0.4 0.4 1.1 1.1
Bookkeeping losses - - 1.6 1.6
Fruitless payments and constructive losses 9.0 9.0 0.3 0.4
Claims waived or abandoned 67.4 67.4 2.7 2.7
Administration losses - - - -
Store losses - - - -
76.8 76.8 5.7 5.8
The large increase in losses in the year compared to 2016-17, follows the review into the financial health of the FE sector. During the year the Group changed its focus on supporting the FE sector and moved to use the Restructuring Facility rather than Exceptional Financial Support programme. More information can be found at Note A1.2 below. The Group does not expect losses to continue at this level in the future.
A1.1 Fruitless payments and constructive losses over £300,000
Value of fruitless constructive losses
£000
Free school cancellations
In-year losses
Daubeney Gate AP Primary Free School 651
Gipsy Hill 355
Prior year losses, disclosed in 2017-18
Aldbridge Centre for Entrepreneurship 300
Ashworth Preparatory School 447
Burton and South Derbyshire UTC 401
Gateway Academy 304
Gladstone School 656
Powerlist Post 16 Leadership College 468
UTC Guildford 409
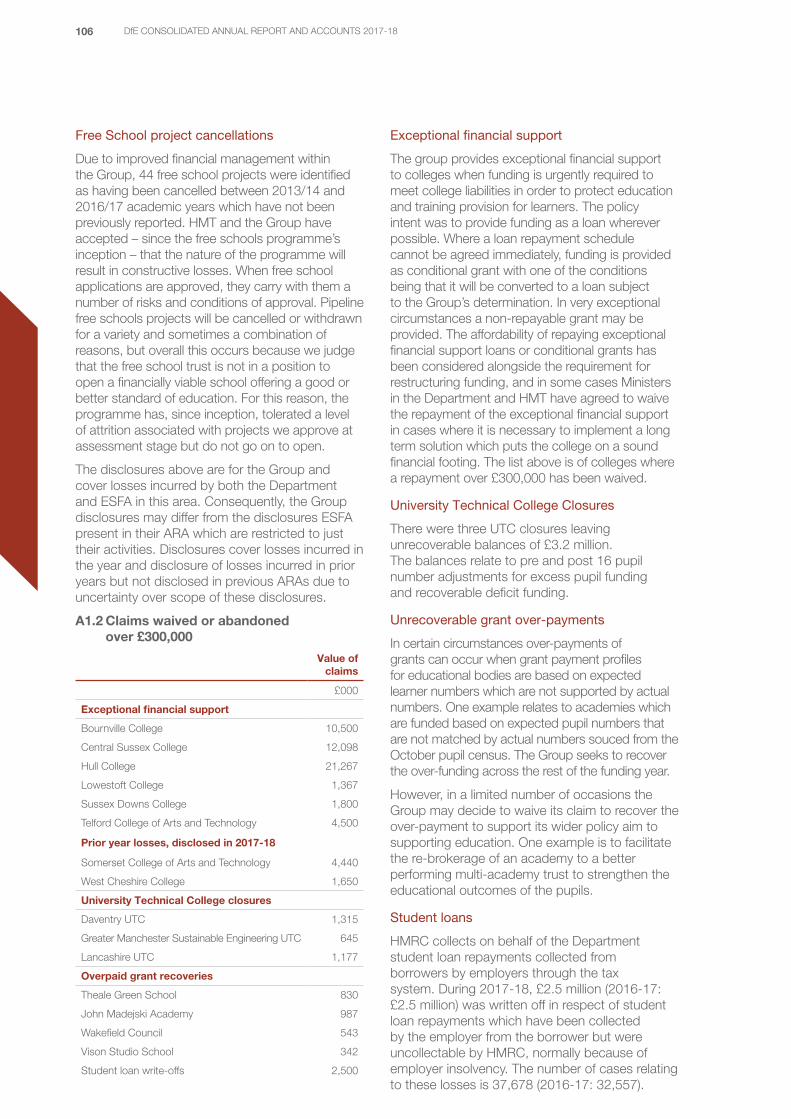
106 DfE CONSOLIDATED ANNUAL REPORT AND ACCOUNTS 2017-18
Free School project cancellations
Due to improved financial management within the Group, 44 free school projects were identified as having been cancelled between 2013/14 and 2016/17 academic years which have not been previously reported. HMT and the Group have accepted – since the free schools programme’s inception – that the nature of the programme will result in constructive losses. When free school applications are approved, they carry with them a number of risks and conditions of approval. Pipeline free schools projects will be cancelled or withdrawn for a variety and sometimes a combination of reasons, but overall this occurs because we judge that the free school trust is not in a position to open a financially viable school offering a good or better standard of education. For this reason, the programme has, since inception, tolerated a level of attrition associated with projects we approve at assessment stage but do not go on to open.
The disclosures above are for the Group and cover losses incurred by both the Department and ESFA in this area. Consequently, the Group disclosures may differ from the disclosures ESFA present in their ARA which are restricted to just their activities. Disclosures cover losses incurred in the year and disclosure of losses incurred in prior years but not disclosed in previous ARAs due to uncertainty over scope of these disclosures.
A1.2 Claims waived or abandoned over £300,000
Value of claims
£000
Exceptional financial support
Bournville College 10,500
Central Sussex College 12,098
Hull College 21,267
Lowestoft College 1,367
Sussex Downs College 1,800
Telford College of Arts and Technology 4,500
Prior year losses, disclosed in 2017-18
Somerset College of Arts and Technology 4,440
West Cheshire College 1,650
University Technical College closures
Daventry UTC 1,315
Greater Manchester Sustainable Engineering UTC 645
Lancashire UTC 1,177
Overpaid grant recoveries
Theale Green School 830
John Madejski Academy 987
Wakefield Council 543
Vison Studio School 342
Student loan write-offs 2,500
Exceptional financial support
The group provides exceptional financial support to colleges when funding is urgently required to meet college liabilities in order to protect education and training provision for learners. The policy intent was to provide funding as a loan wherever possible. Where a loan repayment schedule cannot be agreed immediately, funding is provided as conditional grant with one of the conditions being that it will be converted to a loan subject to the Group’s determination. In very exceptional circumstances a non-repayable grant may be provided. The affordability of repaying exceptional financial support loans or conditional grants has been considered alongside the requirement for restructuring funding, and in some cases Ministers in the Department and HMT have agreed to waive the repayment of the exceptional financial support in cases where it is necessary to implement a long term solution which puts the college on a sound financial footing. The list above is of colleges where a repayment over £300,000 has been waived.
University Technical College Closures
There were three UTC closures leaving unrecoverable balances of £3.2 million. The balances relate to pre and post 16 pupil number adjustments for excess pupil funding and recoverable deficit funding.
Unrecoverable grant over-payments
In certain circumstances over-payments of grants can occur when grant payment profiles for educational bodies are based on expected learner numbers which are not supported by actual numbers. One example relates to academies which are funded based on expected pupil numbers that are not matched by actual numbers souced from the October pupil census. The Group seeks to recover the over-funding across the rest of the funding year.
However, in a limited number of occasions the Group may decide to waive its claim to recover the over-payment to support its wider policy aim to supporting education. One example is to facilitate the re-brokerage of an academy to a better performing multi-academy trust to strengthen the educational outcomes of the pupils.
Student loans
HMRC collects on behalf of the Department student loan repayments collected from borrowers by employers through the tax system. During 2017-18, £2.5 million (2016-17: £2.5 million) was written off in respect of student loan repayments which have been collected by the employer from the borrower but were uncollectable by HMRC, normally because of employer insolvency. The number of cases relating to these losses is 37,678 (2016-17: 32,557).
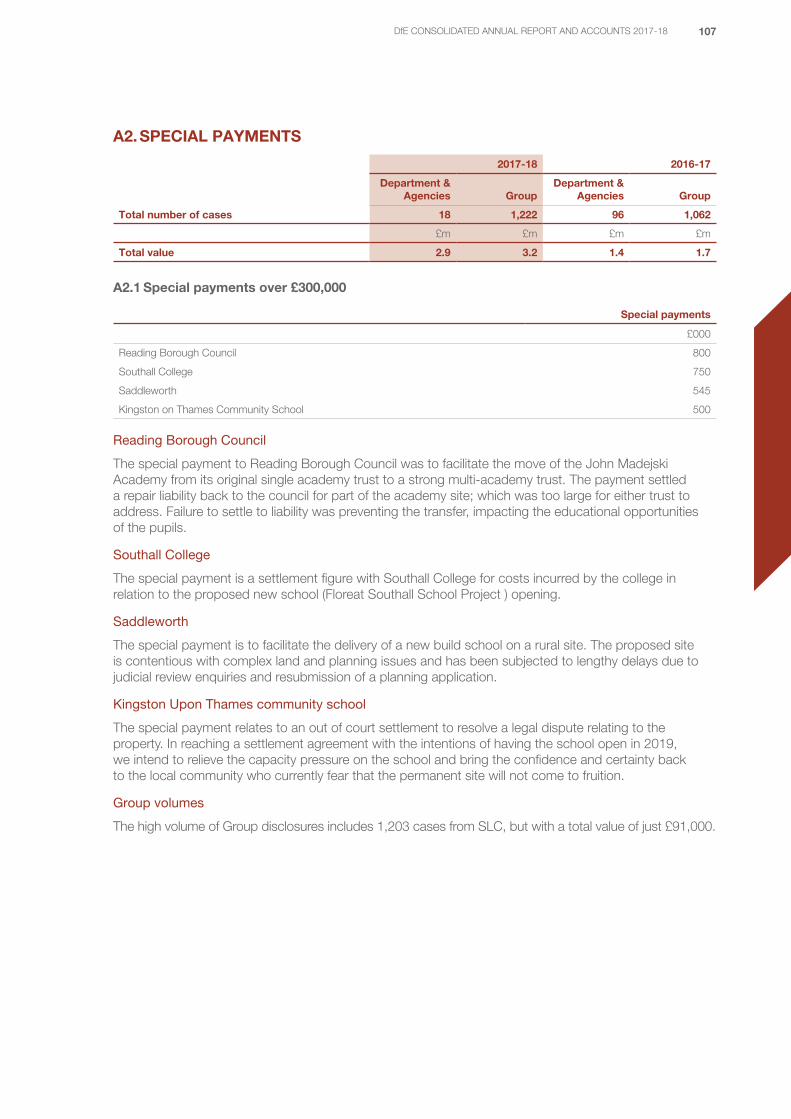
107DfE CONSOLIDATED ANNUAL REPORT AND ACCOUNTS 2017-18
A2. SPECIAL PAYMENTS
2017-18 2016-17
Department & Agencies Group
Department & Agencies Group
Total number of cases 18 1,222 96 1,062
£m £m £m £m
Total value 2.9 3.2 1.4 1.7
A2.1 Special payments over £300,000
Special payments
£000
Reading Borough Council 800
Southall College 750
Saddleworth 545
Kingston on Thames Community School 500
Reading Borough Council
The special payment to Reading Borough Council was to facilitate the move of the John Madejski Academy from its original single academy trust to a strong multi-academy trust. The payment settled a repair liability back to the council for part of the academy site; which was too large for either trust to address. Failure to settle to liability was preventing the transfer, impacting the educational opportunities of the pupils.
Southall College
The special payment is a settlement figure with Southall College for costs incurred by the college in relation to the proposed new school (Floreat Southall School Project ) opening.
Saddleworth
The special payment is to facilitate the delivery of a new build school on a rural site. The proposed site is contentious with complex land and planning issues and has been subjected to lengthy delays due to judicial review enquiries and resubmission of a planning application.
Kingston Upon Thames community school
The special payment relates to an out of court settlement to resolve a legal dispute relating to the property. In reaching a settlement agreement with the intentions of having the school open in 2019, we intend to relieve the capacity pressure on the school and bring the confidence and certainty back to the local community who currently fear that the permanent site will not come to fruition.
Group volumes
The high volume of Group disclosures includes 1,203 cases from SLC, but with a total value of just £91,000.
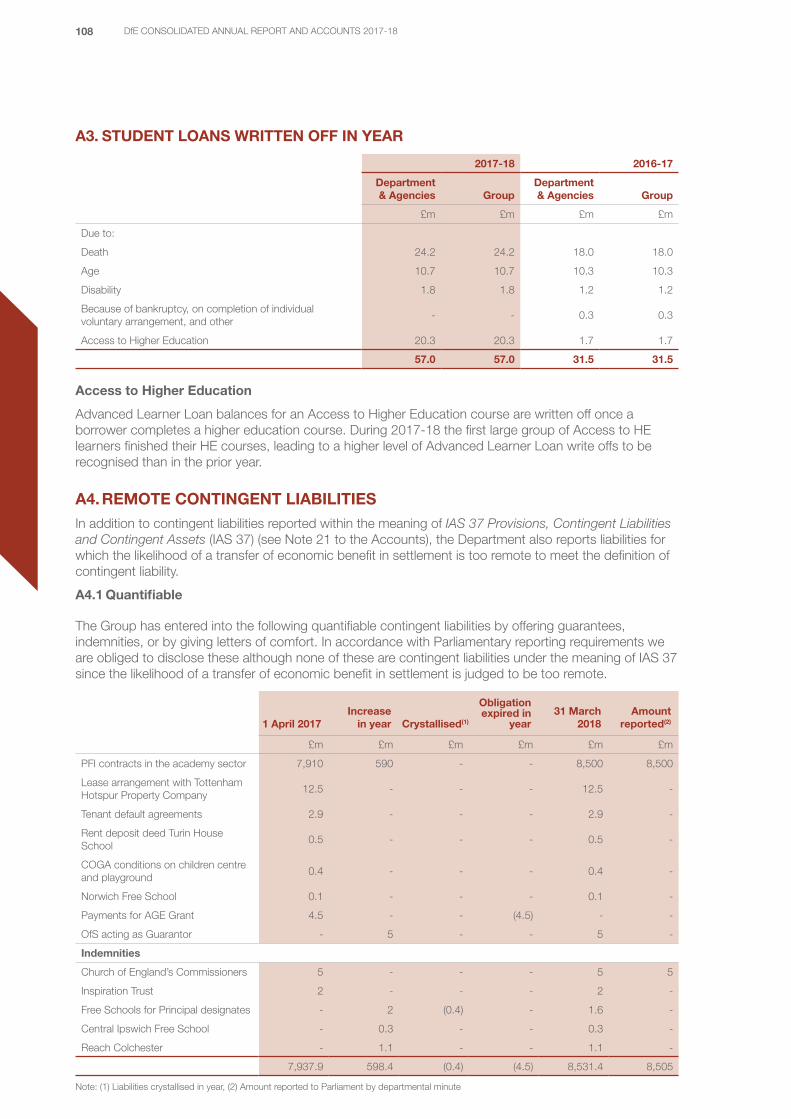
108 DfE CONSOLIDATED ANNUAL REPORT AND ACCOUNTS 2017-18
A3. STUDENT LOANS WRITTEN OFF IN YEAR
2017-18 2016-17
Department & Agencies Group
Department & Agencies Group
£m £m £m £m
Due to:
Death 24.2 24.2 18.0 18.0
Age 10.7 10.7 10.3 10.3
Disability 1.8 1.8 1.2 1.2
Because of bankruptcy, on completion of individual voluntary arrangement, and other
- - 0.3 0.3
Access to Higher Education 20.3 20.3 1.7 1.7
57.0 57.0 31.5 31.5
Access to Higher Education
Advanced Learner Loan balances for an Access to Higher Education course are written off once a borrower completes a higher education course. During 2017-18 the first large group of Access to HE learners finished their HE courses, leading to a higher level of Advanced Learner Loan write offs to be recognised than in the prior year.
A4. REMOTE CONTINGENT LIABILITIESIn addition to contingent liabilities reported within the meaning of IAS 37 Provisions, Contingent Liabilities and Contingent Assets (IAS 37) (see Note 21 to the Accounts), the Department also reports liabilities for which the likelihood of a transfer of economic benefit in settlement is too remote to meet the definition of contingent liability.
A4.1 Quantifiable
The Group has entered into the following quantifiable contingent liabilities by offering guarantees, indemnities, or by giving letters of comfort. In accordance with Parliamentary reporting requirements we are obliged to disclose these although none of these are contingent liabilities under the meaning of IAS 37 since the likelihood of a transfer of economic benefit in settlement is judged to be too remote.
1 April 2017Increase
in year Crystallised(1)
Obligation expired in
year31 March
2018Amount
reported(2)
£m £m £m £m £m £m
PFI contracts in the academy sector 7,910 590 - - 8,500 8,500
Lease arrangement with Tottenham Hotspur Property Company
12.5 - - - 12.5 -
Tenant default agreements 2.9 - - - 2.9 -
Rent deposit deed Turin House School
0.5 - - - 0.5 -
COGA conditions on children centre and playground
0.4 - - - 0.4 -
Norwich Free School 0.1 - - - 0.1 -
Payments for AGE Grant 4.5 - - (4.5) - -
OfS acting as Guarantor - 5 - - 5 -
Indemnities
Church of England’s Commissioners 5 - - - 5 5
Inspiration Trust 2 - - - 2 -
Free Schools for Principal designates - 2 (0.4) - 1.6 -
Central Ipswich Free School - 0.3 - - 0.3 -
Reach Colchester - 1.1 - - 1.1 -
7,937.9 598.4 (0.4) (4.5) 8,531.4 8,505
Note: (1) Liabilities crystallised in year, (2) Amount reported to Parliament by departmental minute

109DfE CONSOLIDATED ANNUAL REPORT AND ACCOUNTS 2017-18
PFI contracts
The contingent liability relating to school buildings arose in connection to the Private Finance Initiative (PFI). These contingent liabilities are the result of the Group, acting as an agent to the Secretary of State, agreeing to provide an indemnity to the LA for potential costs on buildings they own, with existing PFI arrangements, which will be used by academies.
This type of indemnity is considered low risk and is only a feature of the academy programme in very specific circumstances. The contingent liabilities only arise where the academy is using a LA building with an existing PFI contract.
In respect of lease arrangement with Tottenham Hotspur Property Company
This contingent liability is in relation to an indemnity in respect of 35-year lease arrangement with Tottenham Hotspur Property Company for an academy site.
Tenant default agreements
The ESFA has entered into a number of tenant default agreements that give rise to a contractual obligation to pay monies to the landlord up to a fixed cap in certain circumstances where the free school tenant is in breach of its lease.
Turing House School
This contingent liability is in relation to a rent deposit. It can be withdrawn by the landlord if there is a default on rental payments. The money will be released in May 2020.
Conditions of grant aid (COGA) conditions on a children’s centre and playground
ESFA will require the Deanery Church of England Primary School academy trust to repay two grants received from Birmingham City Council for a children’s centre and playground if the academy trust breaches the conditions of the grant aid agreement attached to the grants.
Apprentice Grant for Employers (AGE) grant
The contingent liabilities relating to payments for the AGE grant was due up to June 2017, as apprentices complete 3 months of employment. This has now fully expired in 2017-18 (2016-17: £4.5 million).
Acting as guarantor for Universities Superannuation Scheme (USS)
Following this closure of HEFCE and the creation of OfS the Department is acting as guarantor for the Universities Superannuation Scheme (USS), which has transferred from HEFCE to OfS as
part of the property and staff transfer. This was a condition of OfS’ admission to the USS, and allows staff transferring from HEFCE to continue to participate as employees of OfS.
In the event of a transfer or winding up of OfS, the Department will guarantee that pension liabilities will continue to be met either by a successor body, or by the Department in the event that no other body assumes the OfS’s functions. The Department will act as guarantor following the OfS’s admissions to the USS, for the handful of staff transferring in from HEFCE/OFFA who are currently on the USS scheme.
Free School Norwich
This balance covers the Free School Norwich lease, and relate to the school operations. This was provided by the Secretary of State to assist the conversion from the maintained sector to the academy sector.
Indemnities
Church Commissioners for England
The contingent liability is in relation to a lease arrangement for an academy site.
Inspiration Trust
To provide an indemnity of up to £2 million to protect Inspiration Trust (regarding Great Yarmouth High School) against potential closure costs of the academy in the event that the foundation withdrew consent for the academy to operate from the current site.
Free Schools for principal designates
A contingent liability to underwrite the salaries of principle designates or other key essential teaching staff of new free schools, UTCs or Studio Schools before they open.
Central Ipswich Free School
In order to progress the deal it was necessary to agree a capped figure in respect of the asset management indemnity. ESFA property experts’ advice is that £250,000 is an acceptable budget figure for managing a town centre site in this part of the country and has been agreed. It is anticipated that the school will be built and this contingent figure will not need further consideration, but it is a commercial risk for the ESFA, hence the cap.

110 DfE CONSOLIDATED ANNUAL REPORT AND ACCOUNTS 2017-18
REAch2 Colchester Project
A £1.1 million indemnity for REAch2 Colchester project for costs dependent on the planning permission decision by the local authority.
If satisfactory planning permission for the school is not granted and the £1.1 million ‘top up’ is therefore not paid, then the overage clause will take effect. This provides that on the grant of planning permission for an alternative higher value use, 50% of the net increase in value (if any) from the purchase price will be due on either a sale of the property or commencement of development. The purchase price is to be index linked using RPI from completion of purchase to the date of the overage payment to establish the overage due.
A4.2 Unquantifiable
Junior ISA Account (JISA)
In November 2012, the then Chancellor agreed with the then Secretary of State for Education Rt Hon Michael Gove MP to the setting up of a Junior ISA account for all children in care in the UK, with an initial payment of £200 each (from Department budgets). The JISA accounts are managed by a party independent from the Department and the funds are not accessible by the Department.
To be eligible for the JISA, a child must be looked after for at least one year. Since the launch of the scheme 97,224 accounts have been set up. The contingent liability will only arise if an individual makes a future claim when they turn 18 and no JISA has been set up. In such circumstances, the Department will be required to settle the value of a JISA calculated on the individual’s timings.
Sale of student loans
The sale of student loans necessitiated warranties and indemnities to secure interest and obtain value for money from investors into the securitisation transaction.
These contingent liabilities are in respect of:
• A warranty to provide investors compensation for policy changes which reduce cash flows to investors. This is because the terms of the loans remain within Government control, and there is nothing investors can do to influence this. The liability will exist for the life of the securitisation transaction, and it will expect to expire by 2036. The likelihood of crystallisation is low.
• The need to repurchase all of the student loans as a remedy for investors if:
− collection of repayments for the sold loans through the UK tax system by HMRC ceased;
− RPI used to calculate the interest rate of the loans was abolished without a substitute being put in place;
− there was a problem with the collection of loan repayments that could not be remedied for three consecutive annual payment dates; or
− there is government policy that is implemented relating to forgiveness of student loan repayments for borrowers who are, or become, teachers pursuant to which any securitised student loan is (in whole or in part) cancelled, reduced in balance or written-off.
The likelihood of any of these scenarios materialising is very low.
• The indemnity given to investors to cover potential losses if a ‘servicing event’ is triggered and is incurable, or cannot be cured within a reasonable time. Investors are not able to change the servicer (unlike for a typical commercial transaction) and therefore an indemnity is their only recourse in the event that the servicing is not in line with the contractually agreed standard. The liability is expected to be live for the life of the securitisation transaction, i.e. up to around 30 years, and will reduce over time.
• Indemnities given to the Joint Lead Managers if they (or their employees, directors or affiliates) suffer any loss as a result of misrepresentation, misleading statement or omissions or breach of duty by government. All of the liabilities are expected to be live for the life of the securitisation transaction, i.e. up to around 30 years.
• Indemnities have also been provided to certain other parties connected to the securitisation transaction to cover any loss from the Department (acting as Master Servicer) failing in its performance of certain duties. This includes acting with negligence, fraud, wilful default, infringement of intellectual property rights, failing to provide a remedial plan or a cure within a certain timeframe.
Cost allocation and charges
As a public sector information holder, the Group was compliant with HMT’s issued guidance on cost allocation and charging for information services in 2017-18.

111DfE CONSOLIDATED ANNUAL REPORT AND ACCOUNTS 2017-18
A5. GIFTSThe total of all gifts and hospitality that have been paid out this year are as follows:
2017-18 2016-17
Department & Agencies Group
Department & Agencies Group
Total number of cases 3 3 - -
£m £m £m £m
Total value 15.5 15.5 - -
A5.1 Gifts over £300,000
UTC Lancashire
UTC Lancashire closed at the end of 2016/17 at which point the site reverted to the Group who recognised the asset on their Statement of Financial Position (SoFP).
The Group completed a review to assess the best use of the site and identified the University of Central Lancashire (UCLan), as the most suitable occupier. The transfer of the UTC site to UCLan resulted in a gift of £10.3 million being recognised as the asset was removed from the SoFP.
Devon Studio School
Devon Studio School closed at the end of 2016/17. The Group doesn’t own the site it is leased from a third party, so no asset came back to the Group on closure.
The total capital refurbishment and equipment costs paid by the Group for Devon Studio School were £3.6 million. This capital investment has been tapered in line with a clawback agreement with the academy trust. The amount payable to the Group under the clawback agreement in 2017/18, if the lease is surrendered to the landlord, is £2.1 million. This is the value of the gift.
Future Tech Studio School
Following the closure of the studio school on 31 August 2017 the Group took over the lease of the site from the academy trust that operated the studio school. The site was recognised as a land and building asset on our SoFP valued at £3.2 million.
The Group does not intend to occupy the site for its own operations and has assessed appropriate exit strategies for the site in an educational context. The site has been leased to another educational provider, Warrington Vale Royal College, for their use.
Consequently, the Group has de-recognised the asset and recognised a gift valued at the asset’s carrying value.
Jonathan Slater Accounting Officer 9 July 2018

112 DfE CONSOLIDATED ANNUAL REPORT AND ACCOUNTS 2017-18
THE CERTIFICATE OF THE COMPTROLLER AND AUDITOR GENERAL TO THE HOUSE OF COMMONS
Opinion on financial statements
I certify that I have audited the financial statements of the Department for Education and of its Departmental Group for the year ended 31 March 2018 under the Government Resources and Accounts Act 2000. The Department comprises the Core Department and its agencies. The Departmental Group consists of the Department and the bodies designated for inclusion under the Government Resources and Accounts Act 2000 (Estimates and Accounts) Order 2017. The financial statements comprise: the Department’s and Departmental Group’s Statements of Comprehensive Net Expenditure, Financial Position, Cash Flows, Changes in Taxpayers’ Equity; and the related notes, including the significant accounting policies. These financial statements have been prepared under the accounting policies set out within them.
I have also audited the Statement of Parliamentary Supply and the related notes, and the information in the Accountability Report that is described in that report as having been audited.
In my opinion:
• the financial statements give a true and fair view of the state of the Department’s and the Departmental Group’s affairs as at 31 March 2018 and of the Department’s net expenditure and Departmental Group’s net expenditure for the year then ended; and
• the financial statements have been properly prepared in accordance with the Government Resources and Accounts Act 2000 and HM Treasury directions issued thereunder.
Emphasis of matter – Uncertainties inherent in the valuation of student loans
Without qualifying my opinion, I draw attention to the disclosures made in notes 1.3.4, 1.3.5 and 11.3 to the financial statements concerning the uncertainties inherent in the valuation of student loans. As set out in these notes, given the long-term nature for the recovery of loans, and the number and volatility of the assumptions underpinning their valuation, a considerable degree of uncertainty remains over the recoverable amounts of the loans issued. Significant changes to the valuation could occur as a result of subsequent information and events which are different from the current assumptions adopted by the Department.
Opinion on regularity
In my opinion, in all material respects:
• the Statement of Parliamentary Supply properly presents the outturn against voted Parliamentary control totals for the year ended 31 March 2018 and shows that those totals have not been exceeded; and
• the income and expenditure recorded in the financial statements have been applied to the purposes intended by Parliament and the financial transactions recorded in the financial statements conform to the authorities which govern them.
Basis of opinions
I conducted my audit in accordance with International Standards on Auditing (ISAs) (UK) and Practice Note 10 ‘Audit of Financial Statements of Public Sector Entities in the United Kingdom’. My responsibilities under those standards are further described in the Auditor’s responsibilities for the audit of the financial statements section of my certificate. Those standards require me and my staff to comply with the Financial Reporting Council’s Revised Ethical Standard 2016. I am independent of the Department for Education in accordance with the ethical requirements that are relevant to my audit and the financial statements in the UK. My staff and I have fulfilled our other ethical responsibilities in accordance with these requirements. I believe that the audit evidence I have obtained is sufficient and appropriate to provide a basis for my opinion.
Responsibilities of the Accounting Officer for the financial statements
As explained more fully in the Statement of Accounting Officer’s Responsibilities, the Accounting Officer is responsible for the preparation of the financial statements and for being satisfied that they give a true and fair view.
Auditor’s responsibilities for the audit of the financial statements
My responsibility is to audit, certify and report on the financial statements in accordance with the Government Resources and Accounts Act 2000.
An audit involves obtaining evidence about the amounts and disclosures in the financial statements sufficient to give reasonable assurance that the financial statements are free from material misstatement, whether caused by fraud or error.
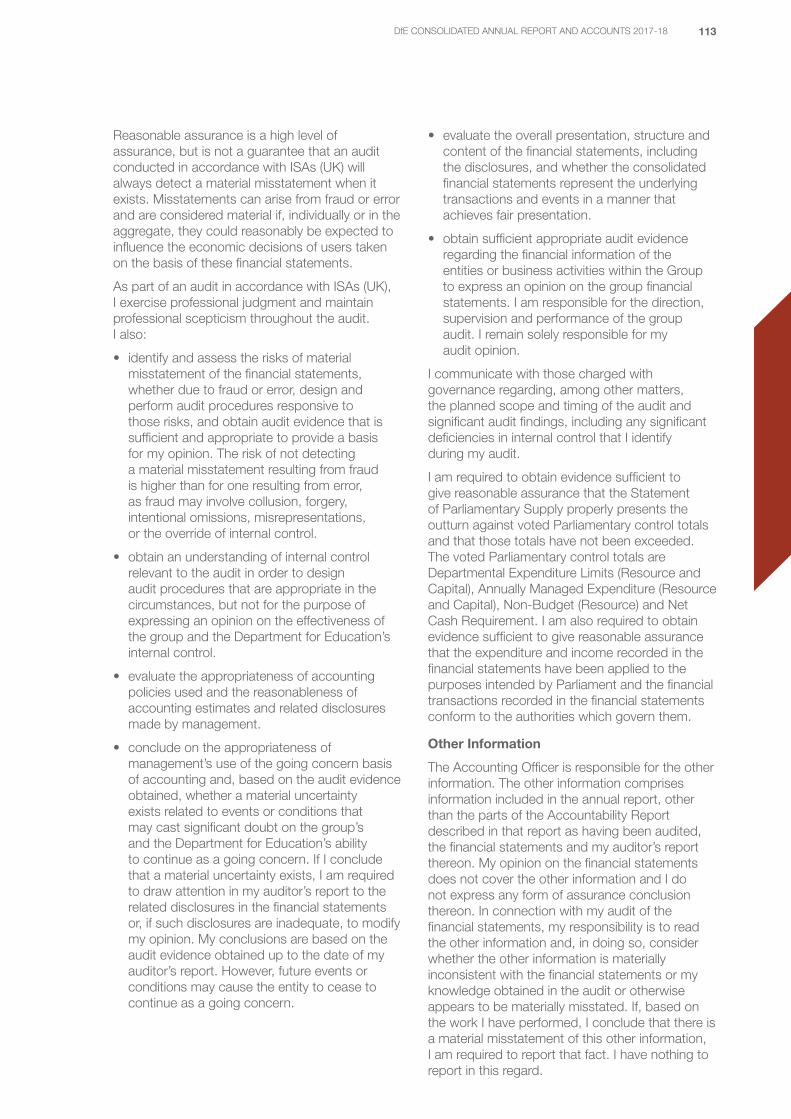
113DfE CONSOLIDATED ANNUAL REPORT AND ACCOUNTS 2017-18
Reasonable assurance is a high level of assurance, but is not a guarantee that an audit conducted in accordance with ISAs (UK) will always detect a material misstatement when it exists. Misstatements can arise from fraud or error and are considered material if, individually or in the aggregate, they could reasonably be expected to influence the economic decisions of users taken on the basis of these financial statements.
As part of an audit in accordance with ISAs (UK), I exercise professional judgment and maintain professional scepticism throughout the audit. I also:
• identify and assess the risks of material misstatement of the financial statements, whether due to fraud or error, design and perform audit procedures responsive to those risks, and obtain audit evidence that is sufficient and appropriate to provide a basis for my opinion. The risk of not detecting a material misstatement resulting from fraud is higher than for one resulting from error, as fraud may involve collusion, forgery, intentional omissions, misrepresentations, or the override of internal control.
• obtain an understanding of internal control relevant to the audit in order to design audit procedures that are appropriate in the circumstances, but not for the purpose of expressing an opinion on the effectiveness of the group and the Department for Education’s internal control.
• evaluate the appropriateness of accounting policies used and the reasonableness of accounting estimates and related disclosures made by management.
• conclude on the appropriateness of management’s use of the going concern basis of accounting and, based on the audit evidence obtained, whether a material uncertainty exists related to events or conditions that may cast significant doubt on the group’s and the Department for Education’s ability to continue as a going concern. If I conclude that a material uncertainty exists, I am required to draw attention in my auditor’s report to the related disclosures in the financial statements or, if such disclosures are inadequate, to modify my opinion. My conclusions are based on the audit evidence obtained up to the date of my auditor’s report. However, future events or conditions may cause the entity to cease to continue as a going concern.
• evaluate the overall presentation, structure and content of the financial statements, including the disclosures, and whether the consolidated financial statements represent the underlying transactions and events in a manner that achieves fair presentation.
• obtain sufficient appropriate audit evidence regarding the financial information of the entities or business activities within the Group to express an opinion on the group financial statements. I am responsible for the direction, supervision and performance of the group audit. I remain solely responsible for my audit opinion.
I communicate with those charged with governance regarding, among other matters, the planned scope and timing of the audit and significant audit findings, including any significant deficiencies in internal control that I identify during my audit.
I am required to obtain evidence sufficient to give reasonable assurance that the Statement of Parliamentary Supply properly presents the outturn against voted Parliamentary control totals and that those totals have not been exceeded. The voted Parliamentary control totals are Departmental Expenditure Limits (Resource and Capital), Annually Managed Expenditure (Resource and Capital), Non-Budget (Resource) and Net Cash Requirement. I am also required to obtain evidence sufficient to give reasonable assurance that the expenditure and income recorded in the financial statements have been applied to the purposes intended by Parliament and the financial transactions recorded in the financial statements conform to the authorities which govern them.
Other Information
The Accounting Officer is responsible for the other information. The other information comprises information included in the annual report, other than the parts of the Accountability Report described in that report as having been audited, the financial statements and my auditor’s report thereon. My opinion on the financial statements does not cover the other information and I do not express any form of assurance conclusion thereon. In connection with my audit of the financial statements, my responsibility is to read the other information and, in doing so, consider whether the other information is materially inconsistent with the financial statements or my knowledge obtained in the audit or otherwise appears to be materially misstated. If, based on the work I have performed, I conclude that there is a material misstatement of this other information, I am required to report that fact. I have nothing to report in this regard.
114 DfE CONSOLIDATED ANNUAL REPORT AND ACCOUNTS 2017-18
Opinion on other matters
In my opinion:
• the parts of the Accountability Report to be audited have been properly prepared in accordance with HM Treasury directions made under the Government Resources and Accounts Act 2000;
• in the light of the knowledge and understanding of the group and the parent and its environment obtained in the course of the audit, I have not identified any material misstatements in the Performance Report or the Accountability Report; and
• the information given in the Performance and Accountability Reports for the financial year for which the financial statements are prepared is consistent with the financial statements.
Matters on which I report by exception
I have nothing to report in respect of the following matters which I report to you if, in my opinion:
• adequate accounting records have not been kept or returns adequate for my audit have not been received from branches not visited by my staff; or
• the financial statements and the parts of the Accountability Report to be audited are not in agreement with the accounting records and returns; or
• I have not received all of the information and explanations I require for my audit; or
• the Governance Statement does not reflect compliance with HM Treasury’s guidance.
Report
I have no observations to make on these financial statements.
Sir Amyas C E Morse Comptroller and Auditor General 17 July 2018
National Audit Office 157-197 Buckingham Palace Road Victoria London SW1W 9SP

115DfE CONSOLIDATED ANNUAL REPORT AND ACCOUNTS 2017-18

116 DfE DEPARTMENTAL ANNUAL REPORT AND ACCOUNTS

117DfE ANNUAL REPORT AND ACCOUNTS 2017-18
FINANCIAL STATEMENTS

118 DFE CONSOLIDATED ANNUAL REPORT AND ACCOUNTS 2017-18
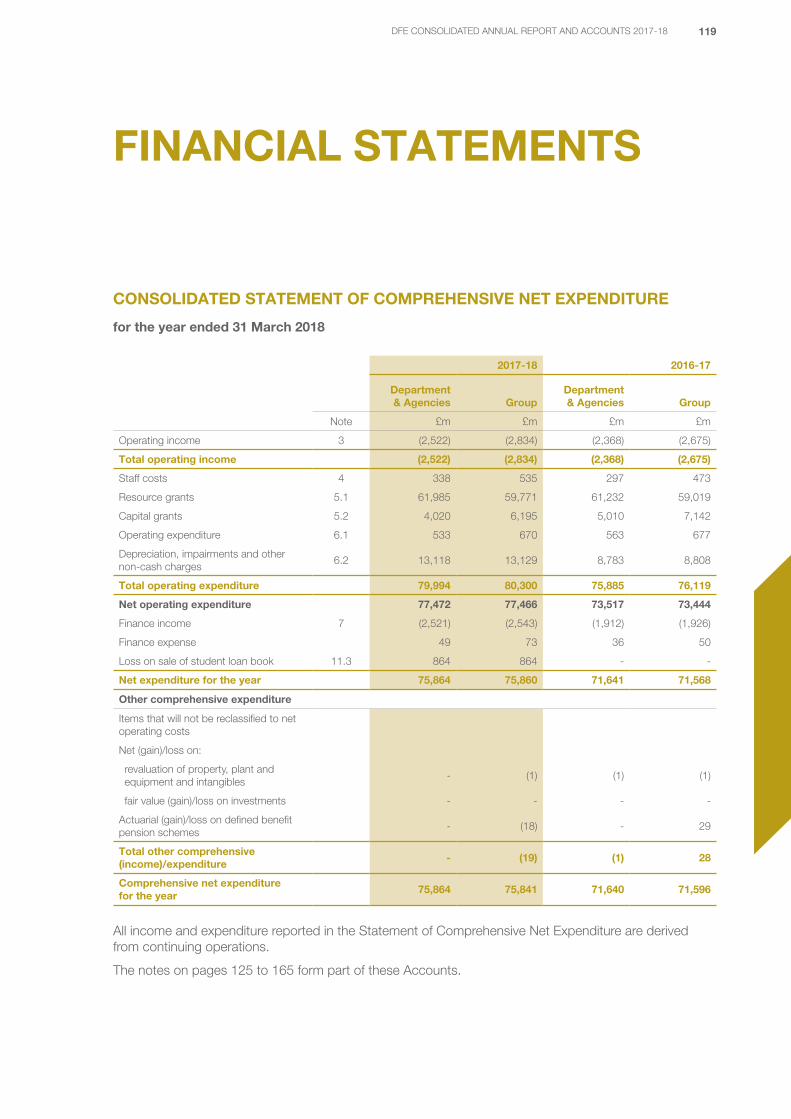
119DFE CONSOLIDATED ANNUAL REPORT AND ACCOUNTS 2017-18
FINANCIAL STATEMENTS
CONSOLIDATED STATEMENT OF COMPREHENSIVE NET EXPENDITURE
for the year ended 31 March 2018
2017-18 2016-17
Department & Agencies Group
Department & Agencies Group
Note £m £m £m £m
Operating income 3 (2,522) (2,834) (2,368) (2,675)
Total operating income (2,522) (2,834) (2,368) (2,675)
Staff costs 4 338 535 297 473
Resource grants 5.1 61,985 59,771 61,232 59,019
Capital grants 5.2 4,020 6,195 5,010 7,142
Operating expenditure 6.1 533 670 563 677
Depreciation, impairments and other non-cash charges
6.2 13,118 13,129 8,783 8,808
Total operating expenditure 79,994 80,300 75,885 76,119
Net operating expenditure 77,472 77,466 73,517 73,444
Finance income 7 (2,521) (2,543) (1,912) (1,926)
Finance expense 49 73 36 50
Loss on sale of student loan book 11.3 864 864 - -
Net expenditure for the year 75,864 75,860 71,641 71,568
Other comprehensive expenditure
Items that will not be reclassified to net operating costs
Net (gain)/loss on:
revaluation of property, plant and equipment and intangibles
- (1) (1) (1)
fair value (gain)/loss on investments - - - -
Actuarial (gain)/loss on defined benefit pension schemes
- (18) - 29
Total other comprehensive (income)/expenditure
- (19) (1) 28
Comprehensive net expenditure for the year
75,864 75,841 71,640 71,596
All income and expenditure reported in the Statement of Comprehensive Net Expenditure are derived from continuing operations.
The notes on pages 125 to 165 form part of these Accounts.
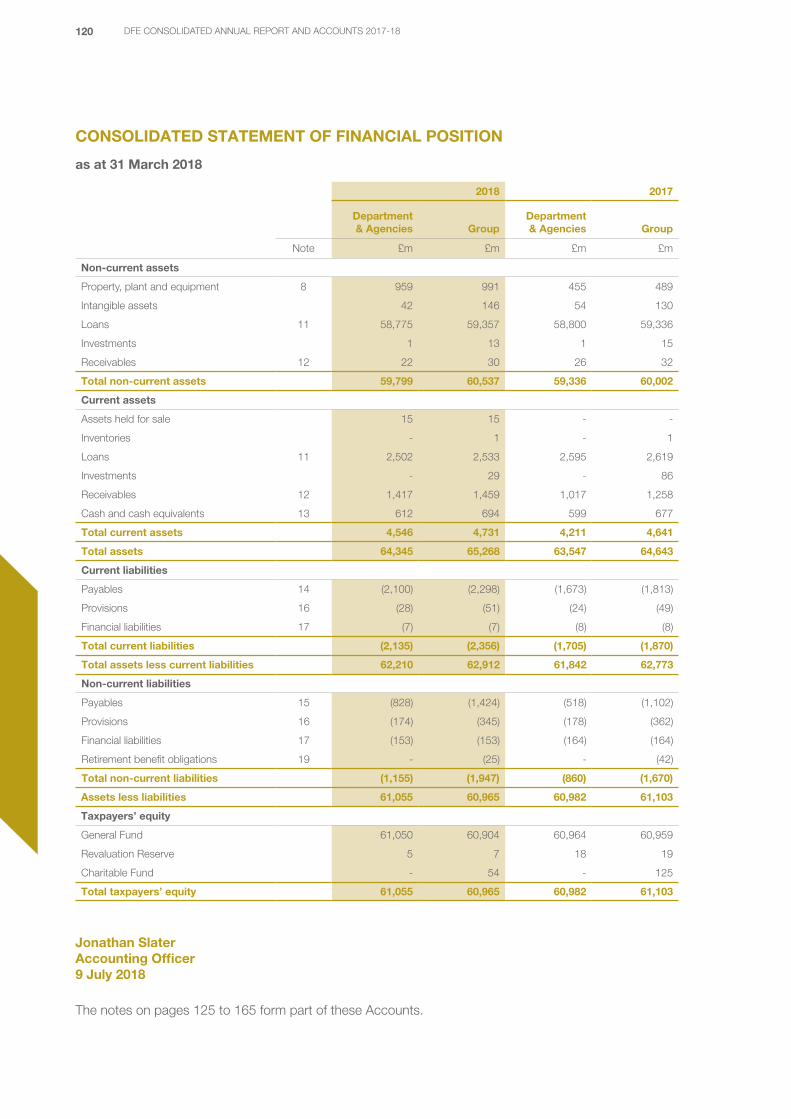
120 DFE CONSOLIDATED ANNUAL REPORT AND ACCOUNTS 2017-18
CONSOLIDATED STATEMENT OF FINANCIAL POSITION
as at 31 March 2018
2018 2017
Department & Agencies Group
Department & Agencies Group
Note £m £m £m £m
Non-current assets
Property, plant and equipment 8 959 991 455 489
Intangible assets 42 146 54 130
Loans 11 58,775 59,357 58,800 59,336
Investments 1 13 1 15
Receivables 12 22 30 26 32
Total non-current assets 59,799 60,537 59,336 60,002
Current assets
Assets held for sale 15 15 - -
Inventories - 1 - 1
Loans 11 2,502 2,533 2,595 2,619
Investments - 29 - 86
Receivables 12 1,417 1,459 1,017 1,258
Cash and cash equivalents 13 612 694 599 677
Total current assets 4,546 4,731 4,211 4,641
Total assets 64,345 65,268 63,547 64,643
Current liabilities
Payables 14 (2,100) (2,298) (1,673) (1,813)
Provisions 16 (28) (51) (24) (49)
Financial liabilities 17 (7) (7) (8) (8)
Total current liabilities (2,135) (2,356) (1,705) (1,870)
Total assets less current liabilities 62,210 62,912 61,842 62,773
Non-current liabilities
Payables 15 (828) (1,424) (518) (1,102)
Provisions 16 (174) (345) (178) (362)
Financial liabilities 17 (153) (153) (164) (164)
Retirement benefit obligations 19 - (25) - (42)
Total non-current liabilities (1,155) (1,947) (860) (1,670)
Assets less liabilities 61,055 60,965 60,982 61,103
Taxpayers’ equity
General Fund 61,050 60,904 60,964 60,959
Revaluation Reserve 5 7 18 19
Charitable Fund - 54 - 125
Total taxpayers’ equity 61,055 60,965 60,982 61,103
Jonathan Slater Accounting Officer 9 July 2018
The notes on pages 125 to 165 form part of these Accounts.

121DFE CONSOLIDATED ANNUAL REPORT AND ACCOUNTS 2017-18
CONSOLIDATED STATEMENT OF CASH FLOWS
for the year ended 31 March 2018
2017-18 2016-17
Department & Agencies Group
Department & Agencies Group
Note £m £m £m £m
Cash flows from operating activities
Net operating cost (75,864) (75,860) (71,641) (71,568)
Adjustments for non-cash transactions 11,465 11,304 6,876 7,002
Transfers of AuC to ATs 8 (195) (195) 19 19
(Increase)/decrease in receivables 12 (396) (199) 346 203
Increase in payables 14, 15 737 807 486 855
less movements in payables relating to items not passing through net operating costs 15 (294) (374) (140) (476)
Use of provisions 16 (50) (75) (44) (71)
Utilisation of other financial liabilities 17 (13) (13) (14) (14)
Finance income 7 - (22) - (14)
Finance expense 49 73 36 50
Net cash outflow from operating activities
(64,561) (64,554) (64,076) (64,014)
Cash flows from investing activities
Finance income 7 - 22 - 14
Purchase of:
property, plant and equipment 8 (317) (320) (200) (210)
intangible assets (9) (58) (20) (60)
investments - (42) (1) (27)
assets held for sale (14) (14) - -
Proceeds on disposal of:
property, plant and equipment 1 1 1 1
intangible assets - - 3 3
investments - 102 - 24
assets held for sale - - 29 29
student loan book 1,715 1,715 - -
Loans:
PF2 loans onward - (68) - (356)
student loans (12,922) (12,922) (11,195) (11,195)
academy trusts (1) (1) 1 1
colleges (76) (76) (16) (16)
Net cash outflow from investing activities (11,623) (11,661) (11,398) (11,792)

122 DFE CONSOLIDATED ANNUAL REPORT AND ACCOUNTS 2017-18
2017-18 2016-17
Department & Agencies Group
Department & Agencies Group
Note £m £m £m £m
Cash flows from financing activities
Finance expense (49) (73) (36) (50)
Consolidated Fund supply 77,887 77,887 75,657 75,657
(Decrease)/increase in receipts due to the Consolidated Fund
15 (1) (1) 1 1
Draw down from the Contingency Fund - - - -
Repaid to the Contingency Fund - - - -
PF2 loans drawn down 15 - 59 - 337
Capital element of finance lease 75 75 - -
Net cash inflow from financing activities
77,912 77,947 75,622 75,945
Net increase in cash and cash equivalents before adjustment for receipts and payments to the Consolidated Fund
1,728 1,732 148 139
Payments of amounts due to the consolidated fund
(1,715) (1,715) - -
Net increase in cash and cash equivalents after adjustment for receipts and payments to the Consolidated Fund
13 17 148 139
Cash and cash equivalents at the beginning of the year net of overdrafts
13 599 677 451 538
Cash and cash equivalents at the end of the year net of overdrafts
13 612 694 599 677
The notes on pages 125 to 165 form part of these Accounts.
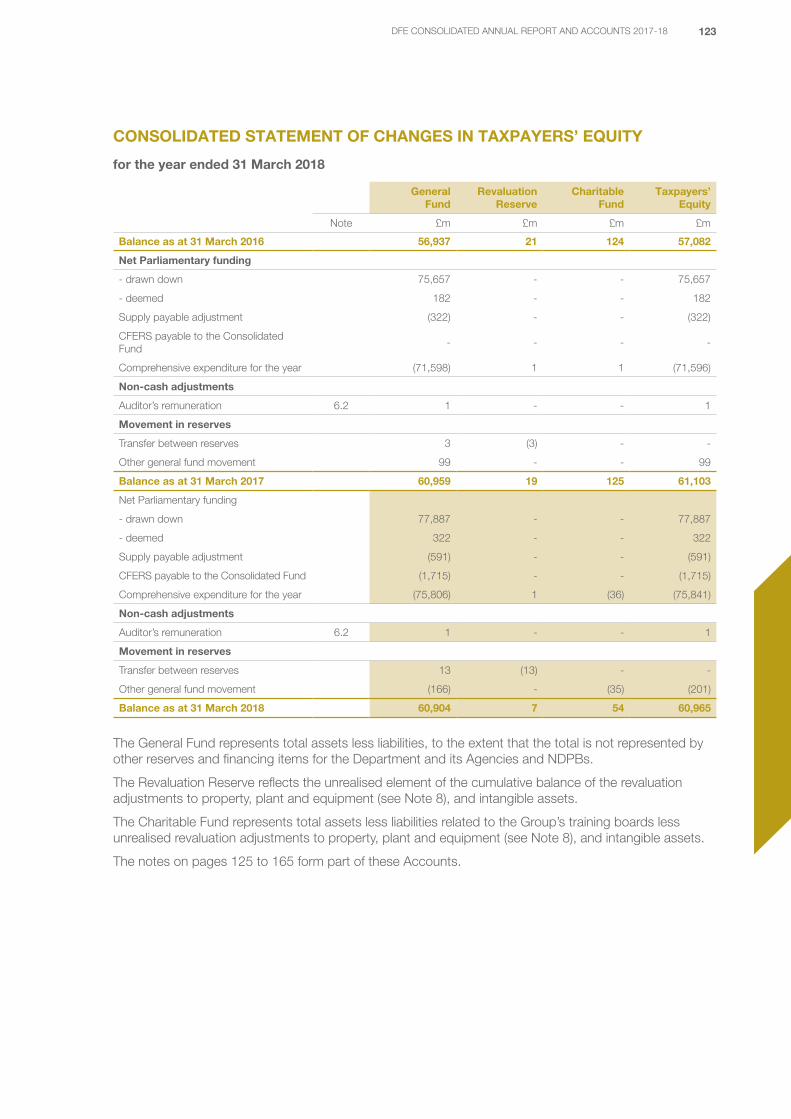
123DFE CONSOLIDATED ANNUAL REPORT AND ACCOUNTS 2017-18
CONSOLIDATED STATEMENT OF CHANGES IN TAXPAYERS’ EQUITY
for the year ended 31 March 2018
General Fund
Revaluation Reserve
CharitableFund
Taxpayers’ Equity
Note £m £m £m £m
Balance as at 31 March 2016 56,937 21 124 57,082
Net Parliamentary funding
- drawn down 75,657 - - 75,657
- deemed 182 - - 182
Supply payable adjustment (322) - - (322)
CFERS payable to the Consolidated Fund
- - - -
Comprehensive expenditure for the year (71,598) 1 1 (71,596)
Non-cash adjustments
Auditor’s remuneration 6.2 1 - - 1
Movement in reserves
Transfer between reserves 3 (3) - -
Other general fund movement 99 - - 99
Balance as at 31 March 2017 60,959 19 125 61,103
Net Parliamentary funding
- drawn down 77,887 - - 77,887
- deemed 322 - - 322
Supply payable adjustment (591) - - (591)
CFERS payable to the Consolidated Fund (1,715) - - (1,715)
Comprehensive expenditure for the year (75,806) 1 (36) (75,841)
Non-cash adjustments
Auditor’s remuneration 6.2 1 - - 1
Movement in reserves
Transfer between reserves 13 (13) - -
Other general fund movement (166) - (35) (201)
Balance as at 31 March 2018 60,904 7 54 60,965
The General Fund represents total assets less liabilities, to the extent that the total is not represented by other reserves and financing items for the Department and its Agencies and NDPBs.
The Revaluation Reserve reflects the unrealised element of the cumulative balance of the revaluation adjustments to property, plant and equipment (see Note 8), and intangible assets.
The Charitable Fund represents total assets less liabilities related to the Group’s training boards less unrealised revaluation adjustments to property, plant and equipment (see Note 8), and intangible assets.
The notes on pages 125 to 165 form part of these Accounts.
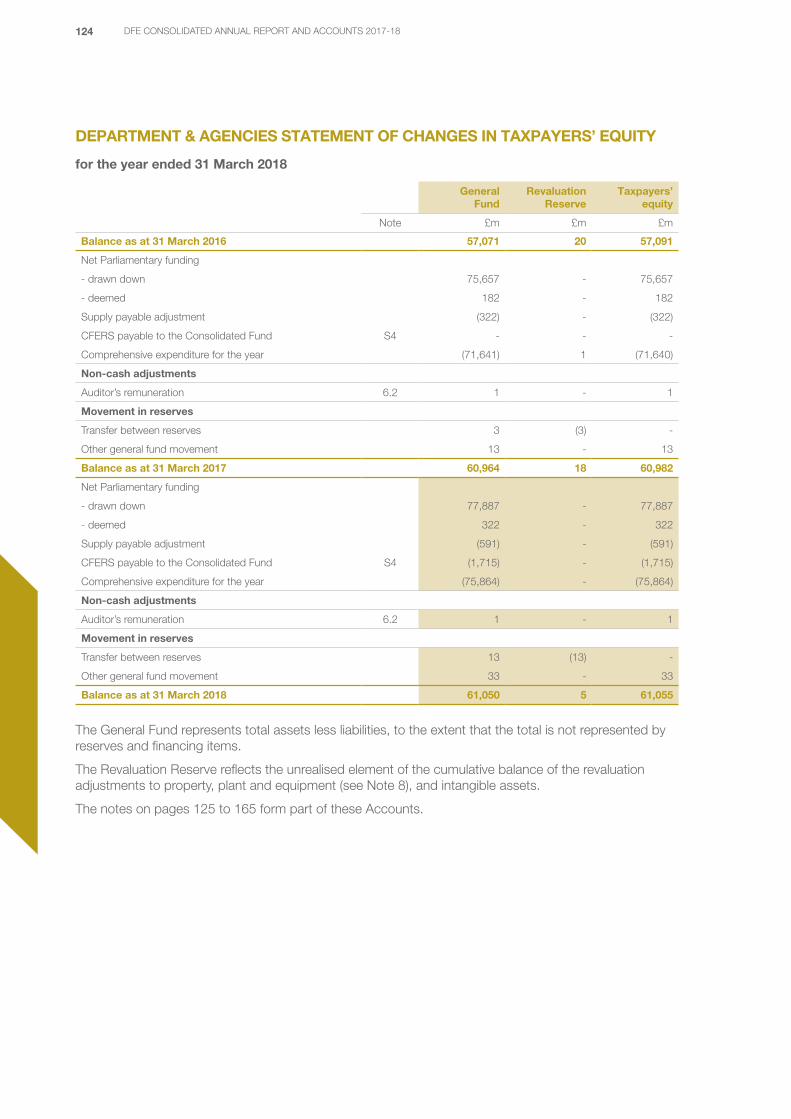
124 DFE CONSOLIDATED ANNUAL REPORT AND ACCOUNTS 2017-18
DEPARTMENT & AGENCIES STATEMENT OF CHANGES IN TAXPAYERS’ EQUITY
for the year ended 31 March 2018
General Fund
Revaluation Reserve
Taxpayers’ equity
Note £m £m £m
Balance as at 31 March 2016 57,071 20 57,091
Net Parliamentary funding
- drawn down 75,657 - 75,657
- deemed 182 - 182
Supply payable adjustment (322) - (322)
CFERS payable to the Consolidated Fund S4 - - -
Comprehensive expenditure for the year (71,641) 1 (71,640)
Non-cash adjustments
Auditor’s remuneration 6.2 1 - 1
Movement in reserves
Transfer between reserves 3 (3) -
Other general fund movement 13 - 13
Balance as at 31 March 2017 60,964 18 60,982
Net Parliamentary funding
- drawn down 77,887 - 77,887
- deemed 322 - 322
Supply payable adjustment (591) - (591)
CFERS payable to the Consolidated Fund S4 (1,715) - (1,715)
Comprehensive expenditure for the year (75,864) - (75,864)
Non-cash adjustments
Auditor’s remuneration 6.2 1 - 1
Movement in reserves
Transfer between reserves 13 (13) -
Other general fund movement 33 - 33
Balance as at 31 March 2018 61,050 5 61,055
The General Fund represents total assets less liabilities, to the extent that the total is not represented by reserves and financing items.
The Revaluation Reserve reflects the unrealised element of the cumulative balance of the revaluation adjustments to property, plant and equipment (see Note 8), and intangible assets.
The notes on pages 125 to 165 form part of these Accounts.

125DFE CONSOLIDATED ANNUAL REPORT AND ACCOUNTS 2017-18
NOTES TO THE ACCOUNTS
1. ACCOUNTING POLICIES
These accounts have been prepared in accordance with the 2017-18 Government Financial Reporting Manual (FReM) issued by HMT, as set out in a statutory Accounts Direction issued pursuant to section 5(2) of the Government Resources and Accounts Act 2000 (Estimates and Accounts) (Amendment) Order 2017. The accounting policies contained in the FReM apply International Financial Reporting Standards (IFRSs) as adapted or interpreted for the public sector context. Where the FReM permits a choice of accounting policy, the accounting policy which is judged to be most appropriate to the particular circumstances of the Group for the purpose of giving a true and fair view has been selected. The particular policies adopted by the Group for 2017-18 are described below. They have been applied consistently in dealing with items considered material in relation to the accounts.
In addition to the primary statements prepared under IFRS, FReM also requires the Group to prepare an additional primary statement. The SoPS, and supporting notes, show outturn against Supply Estimate in terms of the Group’s net resource requirement and the net cash requirement.
1.1 Accounting convention
These accounts have been prepared under the historical cost convention modified to account for the revaluation of property, plant and equipment, intangible assets, investments and certain financial instruments.
1.2 Going concern
The Department’s ARA is produced on a going concern basis. The Department is Supply financed and thus draws the majority of its funding from the Consolidated Fund. Parliament has demonstrated its commitment to fund the Department for the foreseeable future.
1.3 Critical accounting judgements and key sources of estimation uncertainty
The preparation of these accounts requires management to make judgements, estimates and assumptions that affect the application of policies and reported amounts of assets and liabilities, income and expenditure. These assessments are based on historic and other factors that are believed to be reasonable, the results of which form the basis for making judgements. The estimates and underlying assumptions are reviewed on an on-going basis.
Management has specifically made such judgements on:
1.3.1 Valuation of land and buildings
The Group holds land and buildings at cost or valuation, which requires the application of estimates and judgements. See Note 1.15 for more details about the property, plant and equipment accounting policy.
The Group re-values land and buildings at least every five years from the anniversary of their initial recognition in accordance with the Group’s accounting policy and the requirements of the FReM. Between quinquennial revaluations, the Group updates asset values using indices. The selection of the indices used represents an accounting judgement. Buildings have been indexed using the Office for National Statistics (ONS) Interim construction output prices: New work. The Group has indexed land values, using the HPI residential land index issued by LSL Acadata. The Group considers that a residential price index is the most appropriate index to use across its small portfolio of school assets remaining after separation of the academy sector into SARA from 2015/16, as a large majority of schools and of potential new sites for schools, are in residential areas. However, this represents a key judgement and uncertainty in valuation of assets.
1.3.2 Accounting for capital expenditure and assets under construction
The structure of the Group and the scale of its capital programme means that accounting for capital expenditure is inherently complex for the Group and involves judgement over the identification of costs to be capitalised as PPE assets.

126 DFE CONSOLIDATED ANNUAL REPORT AND ACCOUNTS 2017-18
Capitalisation of expenditure is reviewed as part of regular monthly controls and the year-end process in determining the appropriate direct costs to capitalise for each project in accordance with the requirements of IAS 16. Assets are initially recognised at cost.
1.3.3 Inherited staff liabilities
There is uncertainty surrounding HEFCE’s inherited staff liabilities as the value of the provision is derived from an actuarial valuation of the underlying population, and is updated periodically to include movements in mortality and discount rates (see Note 16 for further details).
1.3.4 Student loans measurement
In accordance with IAS 39, student loans are classified as Loans and Receivables and are carried at amortised cost, with the gross value of loans issued discounted to net present value using the effective interest rate method. The effective interest rate used is the higher of the rate intrinsic to the instrument, and the real long term discount rate as set by HMT.
HMT’s discount rate of RPI+0.7% has been used to discount the student loan repayment model and to calculate the fair value of student loans issued in 2017-18, due to the FReM interpretation of IAS 39. The FReM requires that where future cash flows are discounted to measure fair value, i.e. on initial recognition of a financial asset, the Group should use the higher of the rate intrinsic to the financial instrument or HMT’s current discount rate. The discount rate provided by HMT is based on an analysis of real yields on UK index linked Gilts and is specifically appropriate to central government. The rate intrinsic to the student loans is taken to be lower than RPI+0.7%: policy decisions affecting repayment levels are not linked to the student’s credit worthiness, and this results in an expected return of less than RPI+0.7%.
The net present value calculation also takes into account an estimate of the value of student loans issued which will not be repaid because of policy reasons due to death, disability, age of the student or loan or other policies. The carrying value is also considered to be a reasonable approximation of the fair value of student loans, in the absence of an active market, readily observable market trends or similar arm’s length transactions. A valuation technique is used to estimate the present value of future cash flows and an estimate of irrecoverable amounts because of policy decisions.
More information about the measurement techniques used to determine the carrying value of student loans is provided in Note 11.3.
1.3.5 Student loans modelling risk
The value of loans issued is calculated using a forecasting model which uses data on the demographics of higher education students in order to predict their likely repayments of loans. There are also models adapted for borrowers taking different loan types – pre-2012 and post-2012 loans (Undergraduate, Advanced Learner Loans and Master’s Loans). The models depend on a complex set of assumptions, and particularly on borrowers’ earnings. The models are long term in nature, but use the latest OBR short and long term forecasts for RPI, base rates and earnings growth. The valuation of the student loan books is uncertain as they are highly dependent on macroeconomic circumstances and graduate earnings over the next 30 years, as well as a number of other complex assumptions, for around five million borrowers. There is little historic repayment data available for post-2012 loans.
The assumptions used in the repayment models are formally reviewed each year and the amounts provided reflect the estimate as at 31 March 2018. Note 11.3 provides quantitative disclosures on the impact of assumption variations and more detailed narrative over the different assumptions used.
1.4 Basis of consolidation
These accounts present the consolidation of the Department, Agencies and other bodies which fall within the departmental boundary as defined by FReM and make up the Group. Transactions between entities included in the consolidation are eliminated, to present the financial performance and financial position of the Group as a single economic entity.
The Department receives the authority to consolidate its Agencies and NDPBs under the Government Resources and Accounts Act 2000 (Estimates and Accounts) (Amendment) Order 2017. A department’s Designation Order sets out those bodies that are required to be included within a department’s consolidated accounts, since all such bodies are judged to be public bodies.
As permitted by IFRS 10 Consolidated Financial Statements, the results and the financial position of the following NDPBs have been consolidated as at 31 December 2017, which is within three months of the Group’s year-end:
• Aggregator Vehicle PLC; and
• Engineering Construction Industry Training Board.
Academies have been excluded from the consolidation since 2016-17 following their removal from the Department’s accounting boundary into their own standalone ARA.

127DFE CONSOLIDATED ANNUAL REPORT AND ACCOUNTS 2017-18
1.5 Adoption of FReM amendments
There have been no significant FReM changes in 2017-18.
1.6 Early adoption
The Group has not early adopted any accounting standards in 2017-18.
1.7 IFRSs in issue but not yet effective
In order to comply with the requirements of IAS 8 Accounting Policies, Changes in Accounting Estimates and Errors, the Group must disclose where it has not applied a new IFRS that has been issued but is not yet effective. The Group has carried out a review of the IFRSs in issue but not yet effective, to assess their impact on its accounting policies and treatment. The full impact of the IFRSs in issue but not yet effective is not known and could be material to the accounts: the Group has therefore, chosen not to early adopt requirements of the following accounting standards and interpretations, which have an effective date after the start of these accounts:
Standard Effective FReM Application Change & Impact
IFRS 9 Financial Instruments
Annual periods beginning on or after 1 January 2018
2018-19 Change:This change simplifies the classification and measurement of financial assets, as well as amending when and how impairments are calculated and reported, moving from an incurred loss to an expected loss model. This will result in impairments being recognised earlier than under IAS 39 Financial Instruments: Recognition and Measurement.
Impact on Group:
The Department expects the focus of IFRS 9 implementation to fall on the Group’s student loans. More detail has been given below in Note 1.7.1.
The Department does not anticipate material changes arising from adopting IFRS 9 regarding other financial instruments, including non-student loans.
IFRS 15 Revenue from Contracts with Customers
Annual periods beginning on or after 1 January 2018
2018-19 Change:
The changes set out steps for revenue recognition along with requirements for accounting for contract costs. The aim of the change is to report information that is more useful about the nature, amount, timing and uncertainty of revenue and cash flows from contracts with customers. The initial adoption of IFRS 15 will be retrospective but as an opening balance adjustment as at 1 April 2018.
Impact on Group:
The Group does not recognise significant levels of contract revenue; the majority of income is grant income for joint programmes. Consequently, the Group does not anticipate material changes following adoption of the standard.
IFRS 16 Leases Annual periods beginning on or after 1 January 2019
2019-20 (Subject to EU adoption and consultation)
Change:
The proposed changes simplify the classification and measurement of leases by introducing a single lessee accounting model, removing the distinction between recognising an operating lease (off-balance sheet financing) and a finance lease (on-balance sheet financing). The new standard requires recognition of all leases which last over 12 months to be recognised as a finance lease (on-balance sheet). This will result in the recognition of a right-to-use asset, measured at the present value of future lease payments, with a matching liability. The pattern of recognition of the expenditure will result in depreciation of the right-to-use asset and an associated finance cost being recognised.
Impact on Group:
The main effect of the adoption of IFRS 16 will be for lessees; which will result in a number of former operating leases being brought on-balance sheet, however the Group does not anticipate that this change will have a material impact.
The effect on lessor accounting for the new standard is limited in scale, and remains largely unchanged. In addition, the Group does not have significant lessor activities.

128 DFE CONSOLIDATED ANNUAL REPORT AND ACCOUNTS 2017-18
Standard Effective FReM Application Change & Impact
IAS 12 Recognition of Deferred Tax Assets for Unrealised Losses
Annual periods beginning on or after 1 January 2017
2018-19 (Subject to EU adoption)
Change:
The proposed changes amend how to account for deferred tax assets related to debt instruments measured at fair value.
Impact on Group:
The Group does not pay material amounts of corporation tax and does not therefore recognise material levels of deferred tax. No material impact is expected.
1.7.1 Adoption of IFRS 9 and student loans
IFRS 9
IFRS 9 Financial Instruments (IFRS 9) was issued in July 2014 to replace IAS 39 Financial Instruments: Recognition and Measurement and has been endorsed by the EU. The standard has been incorporated into the FReM and is effective for accounting periods commencing on or after 1 January 2018 with adaptations and interpretations for the public sector. It will be adopted by the Group on 1 April 2018.
IFRS 9 changes how financial instruments are classified and measured, and amends how impairment provisions are calculated for certain types of financial assets, moving to an expected credit loss model from an incurred loss model. As required by FReM, the Group will apply the change retrospectively but will not restate prior periods. We will recognise the difference between the previous carrying amount of the financial instrument and the revised carrying amount of 1 April 2018 in opening retained earnings.
Student loans
The main impact of the transition to IFRS 9 will be on the accounting for loans issued to students studying on higher and further education courses. In determining the basis for the classification and measurement of the loans, the Group is now required to consider, amongst other things, whether the contractual cash flows represent solely payments of principal and interest. The key terms of student loans are set out in Note 11.3. The loans’ contractual cash flows do not meet the standard’s definition of being solely payments of principal and interest (SPPI), and therefore the loans cannot continue to be measured on an amortised cost basis. The Department considers the SPPI test to be failed because the terms of student loans do not generate cash flows designed to fully recover interest and principle. Student loans are issued to support students and the Higher and Further Education sectors without credit checks, and the loans are forgiven after an agreed period and under other circumstances. Therefore, the Group is required to hold student loans at fair value through profit and loss under the new standard. The fair value will be calculated in accordance with the requirements of IFRS 9, IFRS 13 Fair Value Measurement (IFRS 13) and the FReM.
Other financial assets/liabilities
The Group holds or issues financial instruments other than student loans, such as listed investments, loans to other educational sectors, receivables, payables and financial guarantees. However, the scale of non-student loan financial instruments are immaterial on their own classification. In addition, the terms of these financial instruments are such as to limit valuation changes through moving to IFRS 9. The Group considers any impact away from student loans to be immaterial and so additional disclosures are not required.
Impact
In light of the student loan sale of December 2017, the Group is taking this opportunity to review its valuation approach (across both FE and HE sectors) for suitability in an IFRS 9 fair value context as opposed to an amortised cost basis. The Group has completed its preliminary assessment of the impact of the adoption of IFRS 9 on the student loan balance, our current expectation is that the student loans’ carrying value will reduce. This impact will be reflected as a reduction in the carrying value of the loans at 1 April 2018, and will be recognised as a reduction in taxpayer’s equity at 1 April 2018 (to be included in the Statement of Changes in Taxpayers’ Equity).
The transition work is ongoing, therefore the final impact of adopting the standard as at 1 April 2018 will be disclosed in the financial statements for the year ending 31 March 2019. It should be noted that a significant difference in the presentation of the loan book, when compared to the presentation under IAS 39, is that loan additions will be shown net of any fair value adjustment, rather than showing separately the additions and RAB charge as per the current treatment. This in turn will result in a lower figure being presented going forward for both additions and in year revaluation; the revaluation was previously recognised as impairment under IAS 39.
129DFE CONSOLIDATED ANNUAL REPORT AND ACCOUNTS 2017-18
Fair values are calculated from a market participant’s perspective, not the reporting entity’s. The Group continues to assess the implications on the carrying value of student loans following the successful student loan securitisation in December 2017.
The Group has focused its efforts to assess the impact of IFRS 9 on its student loan assets, owing to the relative small size and contractual simplicity of its non-student loan financial assets and liabilities. Unlike student loans, the Group has not yet identified any existing financial assets that may be re-categorised under IFRS 9 from an amortised cost valuation approach to a fair value approach. The Group expects the largest impact to carrying values from adopting IFRS 9 to arise from switching between an amortised cost valuation approach to fair value. The Group’s other loans are expected to pass an SPPI test since these assets have firmer contractual cash flows and do not share the repayment and commutation terms of student loans.
As well as valuation approaches, IFRS 9 also changes how poor performance impairment provisions are calculated. However, financial assets to which poor performance provisions are attributed are immaterial and so are not disclosed here.
1.8 Segmental reporting
In accordance with IFRS 8: Operating Segments (IFRS 8), the Group has considered the need to analyse its income and expenditure relating to operating segments. The Group has assessed that all lines of operation fall within the same geographical location and regulatory environment as envisaged by IFRS 8. Since segmental information for total assets and liabilities is not regularly reported to the chief operating decision-maker and in compliance with the FReM, it has not been produced in the accounts.
See Note 2 for operational disclosures.
1.9 Income
The Group receives the following income streams and accounts for it as follows:
1.9.1 Levy income
Levy income is collected under statute by CITB and ECITB. The Chief Secretary to the Treasury has approved both bodies to retain this levy income to offset against their expenditure. Therefore, the Exchequer has no right of access to these funds.
Levy income is recognised in the year in which it is raised. Where doubts arise over its collectability either through ageing, past experience, or other known factors, a provision for doubtful debts is recognised in the accounts.
1.9.2 Operating income
Operating income is income, which relates directly to the operating activities of the Group.
Departmental income as authorised in the Supply Estimate (such as general administration receipts and income from other departments), and income to the Consolidated Fund that HMT has agreed should be treated as operating income.
Income is stated net of recoverable VAT where applicable.
1.9.3 Grant income
The Group receives grant income from other government bodies which are accounted for under IAS 20 Government Grants through the non-deferral option. The income relates to programmes jointly funded by the Group and other departments.
1.9.4 Investment income
Income from investments is included in the SoCNE on an accruals basis.

130 DFE CONSOLIDATED ANNUAL REPORT AND ACCOUNTS 2017-18
1.9.5 Other income
European Social Fund
The European Commission provides funding for certain projects. This income is matched to the expenditure profile for each project concerned. Income not matched to expenditure at the end of the financial year is transferred to deferred income. If expenditure exceeds income, an accrual may be made for the balance of the income.
1.10 Research and development
Research expenditure is reported in the SoCNE in the year in which it is incurred. Development expenditure is also recognised in the SoCNE when incurred unless it meets the specific criteria for capitalisation within IAS 38 Intangible Assets. Property, plant and equipment acquired for use in research and development are depreciated over the life of the associated research project or according to the asset category if the asset is to be used for subsequent production work.
1.11 Grant expenditure
1.11.1 Grant financing and Grant-in-Aid
Funding to the Department’s Agencies and NDPBs through financing and Grant-in-Aid payments is reported on a cash basis in the period in which payments are made. Grant financing and Grant-in-Aid as well as any intra-Group grants between the consolidated bodies are eliminated within the Group.
1.11.2 Grants payable
The majority of grants made by the Group are recorded as expenditure in the period in which the claim is paid, as the grant funding cannot be directly related to activity in a specific period. The claims are deemed the only appropriate and measurable activity that truly creates an entitlement for the recipient. However, recognition of the entitlement of grant varies according to the individual programme. Where entitlement to the grant has arisen during the period, it is accrued in the SoCNE and shown as a liability on the SoFP.
1.11.3 Grant recoveries
Grants paid to end users that are unspent at the year-end may be retained to fund future activity. The Group does not recognise a prepayment if the end user has not spent the grant due to timing or delays.
Some grants will result in recognition of a receivable at the year end if there has been over-funding or un-spent amounts:
• Where the Group pays end users according to a grant payment profile established before the final grant obligation is known, and the actual spend shows over-funding.
• Un-spent amounts will arise where time bound grants have been provided and not spent within the stipulated timescale.
The accounts will only recognise a receivable when either of the above instances crosses the year end.
1.12 Leases
Leases are classified as finance leases whenever the terms of the leases transfer substantially all the risks and rewards of ownership of the leased assets to the lessee. All other leases are classified as operating leases. Operating leases are charged to the SoCNE as expenditure is incurred.
1.13 Pensions
The Group has adopted IAS 19 Employee Benefits (IAS 19) to account for its pension schemes.
Accordingly, for funded defined benefit schemes the Group recognises a liability in respect of any deficit, being the excess of the present value of the scheme’s liabilities over the value of the assets in the scheme, to the extent that the Group has a legal or constructive obligation to make good the deficit in the scheme. The Group’s share of the pension scheme surplus (to the extent that it is considered recoverable) or deficit is recognised in full on the face of the SoFP. Actuarial gains/losses from the scheme are recognised in reserves.
Where the Group makes contributions to defined contribution and unfunded defined benefit pension schemes (which do not have underlying assets and liabilities), the Group recognises contributions payable in the SoCNE.
Further details of the pension schemes are available in Note 19.
1.14 Early departure costs
The Department is required to meet the additional cost of benefits beyond the normal pension scheme benefits in respect of some employees who retire early, and for compensation payments payable to some employees who take early severance. The Department provides for the costs when the early departure programme has been announced and is binding on the Department.
The exit costs of staff in the Agencies are borne and managed centrally by the Department whilst the NDPBs are responsible for managing the costs of their staff exit programmes.
1.15 Property, plant and equipment
The minimum level of capitalisation for expenditure on property, plant and equipment ranges between £500 and £10,000 across the Group. In the case of IT equipment and furniture, all items recorded as capital expenditure are capitalised and if they fall
131DFE CONSOLIDATED ANNUAL REPORT AND ACCOUNTS 2017-18
below the capitalisation threshold they are grouped together and recorded as bulk assets. The asset value on capitalisation is measured at cost plus all direct costs, such as installation, attributable to bringing them into working condition.
Land and buildings are measured initially at cost and are restated to current value (depreciated replacement cost) using external professional valuations in accordance with IAS 16 every five years, and in the intervening years by use of appropriate indices supplied by the Valuation Office. The Group has stated other property, plant and equipment at existing use value using appropriate indices published by the Valuation Office. Some assets are of short life and of low value and have used depreciated historical cost as a proxy for fair value.
One of the Group’s purposes is to, as appropriate, fund the acquisition of premises or sites that, ultimately, academy trusts will use. The Group will also fund all the required construction works and associated professional services needed to bring the premises or sites into use.
The Group measures the value of AuC at cost plus direct costs directly attributable to bringing the assets into working condition in line with IAS 16. Direct costs include all costs associated with purchasing the land and property and bringing the assets into use, and a fair proportion of the Group’s internal costs. The Group recognises AuC assets where it has control over the asset, and the right to the future economic benefit from that asset. At the time at which either or both is no longer the case, the asset is removed from the Group’s SoFP.
In the atypical situation where circumstances existing prior to the year-end indicate that assets cannot be opened as a Group school, and will have to be sold to the open market, then an asset will be recognised and treated under IFRS 5 Assets held for Sale and Discontinued Operations. In that case, any difference between carrying value and fair value would be recognised as an in-year impairment and the asset presented separately.
If a project ceased, or an asset became surplus through circumstances not yet existing at the year-end, the changes in asset treatment would not take effect until the following financial year.
1.16 Depreciation
Depreciation is provided at rates calculated to write off the valuation of buildings and other property, plant and equipment by equal instalments over their estimated useful lives. Land and assets under construction are not depreciated.
Asset lives are in the following ranges:
PropertyUp to 60 years, or the lease term (whichever is shorter)
Other PPE 3 – 20 years
1.17 Intangible assets
Assets are capitalised as intangible assets where expenditure of £2,500 or more is incurred. Intangible assets are initially valued at cost, then carried at fair value that is determined by reference to an active market where possible. Where there is no active market, we use depreciated replacement cost as a proxy fair value. Assets are amortised over their estimated useful economic lives. Assets under construction are not amortised but are assessed for impairment annually.
Asset lives are in the following ranges:
Software licenses2 - 5 years or the licence period, whichever is shorter
Developed software 3 - 5 years
Non-software licences
3 years
Other 3 - 5 years
1.18 Revaluation and impairment of non-current assets
Increases in value are credited to the Revaluation Reserve, unless it is a reversal of a previous impairment, which is credited to the SoCNE to the extent of the previous impairment and then to the Revaluation Reserve, in accordance with IAS 36 Impairment of Assets (IAS 36).
Impairments of revalued assets that do not result from a clear consumption of economic benefits are debited to the Revaluation Reserve up to the level of depreciated historical cost. Any excess devaluation is charged to the SoCNE. Each year, the realised element of the reserve (i.e. an amount equal to the excess of the actual depreciation over depreciation based on historical cost) is transferred from the reserve to the General Fund.
Impairment losses that result from a clear consumption of economic benefit are taken directly to the SoCNE. Where the impairment relates to a revalued asset, the balance on the Revaluation Reserve to which the impairment would have been charged is transferred to the General Fund to ensure consistency with IAS 36.
On disposal of a revalued asset, the balance on the Revaluation Reserve in respect of that asset becomes fully realised and is transferred to the General Fund. Gains and losses on disposals are determined by comparing the disposal proceeds with the carrying amount and are recognised in the SoCNE. All non-current assets are reviewed for impairment if circumstances indicate the
132 DFE CONSOLIDATED ANNUAL REPORT AND ACCOUNTS 2017-18
carrying amount may not be recoverable. An impairment loss is recognised for the amount by which the asset’s carrying amount exceeds its recoverable amount. The recoverable amount is the higher of an asset’s fair value less costs to sell and value in use.
1.19 Deferred capital receipts
Funding received for the purpose of acquisition of property, plant and equipment and intangible assets, excluding the element relating to any capitalised dilapidation provision, is credited to the deferred capital receipts account and is released to the SoCNE by amounts equal to the associated depreciation and amortisation charge.
1.20 Non-current assets held for sale
Non-current assets held for sale are measured at the lower of carrying amount and fair value less costs to sell and not depreciated. They are also presented separately on the face of the SoFP.
1.21 Financial instruments
The Group applies IFRS 7 Financial Instruments: Disclosures, IAS 32 Financial Instruments: Presentation and IAS 39 Financial Instruments: Recognition and Measurement. Financial assets and financial liabilities are recognised when the Group becomes party to the contractual provisions of the instrument. Embedded derivatives are recognised if separable from the host contract.
1.21.1 Financial assets
Financial assets are classified where appropriate as: loans and receivables; available-for-sale; and financial assets at fair value through profit and loss. Financial assets include cash and cash equivalents, trade and other receivables and loans. The Group determines the classification of its financial assets at initial recognition. Financial assets are recognised initially at fair value, normally being the transaction price plus, in the case of financial assets not at fair value through profit or loss, directly attributable costs. Presently, the Group does not have any financial assets that need to be classified as financial assets at fair value through profit or loss, neither does it have cash equivalents or derivative financial instruments.
The subsequent measurement of financial assets depends on their classification, as follows:
Available-for-sale assets
The Group holds investments, which are classified as available for sale and are carried at fair value. Fair value is calculated as the closing bid price as at the year end. Movements in the fair value are recognised in the SoCNE.
Trade and other receivables
Trade and other receivables have fixed or determinable payments that are not quoted on an active market. They do not carry any interest and are initially recognised at their face value. They are then carried at amortised cost using the effective interest method. Appropriate allowances (provisions/write-offs) for estimated irrecoverable amounts (bad debts) are recognised in the SoCNE when there is objective evidence that the asset is impaired. The allowance recognised is measured as the difference between the asset’s carrying amount and the estimated future recoverable amount.
Loan and receivable assets
Loans comprise loans within the Group and external to the Group. The loans are not traded on any active market and are carried at amortised cost using the effective interest method. Appropriate allowances (provisions/write-offs) for estimated irrecoverable amounts (bad debts) are recognised in the SoCNE when there is objective evidence that the asset is impaired. The allowance recognised is measured as the difference between the asset’s carrying amount and the estimated future recoverable amount.
Student loans
An addition to the student loan book is recognised once the SLC has issued the loan to the student. Student loan repayments are collected by the SLC and HMRC. For repayments received via the SLC, the Department recognises the repayment when the SLC has received the cash. For repayments collected via the tax system (HMRC), the Department recognises annual amounts based on receipts to HMRC from Pay As You Earn (PAYE) and self-assessed borrowers. More information about the measurement techniques used to determine the carrying value of student loans is provided in Note 11.3.
Cash and cash equivalents
Cash and cash equivalents comprise cash in hand and on demand deposits.
Where there are restrictions upon the Group’s ability to access cash, for example through being held in escrow with a solicitor pending a transaction, the Group discloses these restrictions separately in the notes to the financial statements. However, in accordance with IAS 7 Statement of Cash Flows the Group continues to present balances as cash in the SoFP and Statement of Cash Flows.
133DFE CONSOLIDATED ANNUAL REPORT AND ACCOUNTS 2017-18
1.21.2 Financial liabilities
Financial liabilities are measured at amortised cost. Financial liabilities include: trade and other payables and loans. The Group does not currently have financial liabilities measured at fair value through profit or loss and neither does it have derivative financial instruments. The Group determines the classification of its financial liabilities at initial recognition.
The measurement of financial liabilities depends on their classification, as follows:
Trade and other payables
Trade and other payables including accruals are generally not interest bearing and are stated at their face value on initial recognition. Subsequently, they are measured at amortised cost using the effective interest method.
Loan liabilities
The Group holds both interest bearing and non-interest bearing loans. The Group states such loans at their face value on initial recognition. Subsequently, the Group measures interest bearing loans at amortised cost using the effective interest method, which includes all direct costs associated with the loans.
Financial guarantees
Financial guarantees are initially recognised at fair value on the date that the guarantee was given in accordance with IAS 39. At each year end, they are subsequently re-measured at the higher of the amount determined in accordance with IAS 37, and the amount initially recognised, less when appropriate, cumulative amortisation.
1.22 Provisions
The Group makes provision in the accounts where the following criteria are met in accordance with IAS 37. The criteria are as follows:
• a legal or constructive obligation exists that will result in the transfer of economic benefit;
• the transfer is probable; and
• a reliable estimate can be made.
The provision’s value is discounted when the time value of money is considered material. Changes in the discount rate applied will be recognised in the year in which the change occurred. Comparative figures are not adjusted as this constitutes a change in accounting estimate.
The Group applies HMT’s discount rate to discount its provisions and the rates are as follows:
• the real discount rate applied to cash flows of short term (0-5 years) general provisions is (2.42%);
• (1.85%) for medium-term general provisions (between 5 and 10 years);
• (1.56%) for long-term general provisions (more than 10 years); and
• early departure costs provisions are discounted at 0.10%.
1.23 Risk protection arrangement
Academy trusts that join the Department’s risk protection arrangement (RPA) pay an annual per pupil fee to the Department and are covered for risks in four broad categories:
• property damage and business interruption;
• employers’ liability;
• third party liability; and
• UK travel.
The risks covered arise from activities external to the Group and therefore remain after the Group’s consolidation.
The Group has adopted IFRS 4: Insurance Contracts (IFRS 4) to account for the transfer of risk between the academy trusts and the Group. IFRS 4 provides that any entity that issues an insurance contract is an insurer (whether or not the issuer is regarded as an insurer for legal, supervisory or taxation purposes) and that an insurance contract is a contract under which one party accepts significant insurance risk from another party. Accordingly, provisions for losses have been recognised calculated on an expected loss basis (total losses expected to be incurred during a cover period) rather than on an IAS 37 basis (losses reported during the period).
Based on the number of schools that are members of the scheme, the Group provides for expected losses in respect of a claim year (which runs from 1 September to 31 August). The full expected value of valid claims leads to a transfer from the loss provision to RPA payables, prior to settlement. Loss provisions will be held for the full claim year plus four subsequent years, as claims incurred in that claim year are expected to be made within that time period.
Claims from individual academies are handled by a third party administrator, under contract to the Department.
An annual liability adequacy test is completed in accordance with IFRS 4.

134 DFE CONSOLIDATED ANNUAL REPORT AND ACCOUNTS 2017-18
1.24 Contingent liabilities
Where the time value of money is material, contingent liabilities, which are required to be disclosed under IAS 37, are stated at discounted amounts and the amount reported to Parliament separately noted. Remote contingent liabilities that are not required to be disclosed by IAS 37 are disclosed in the Parliamentary Accountability Report and stated at the amounts reported to Parliament.
1.25 Value added tax
Most of the activities of the Group are outside the scope of VAT. In general output tax does not apply, or where it does, input tax on purchases is not recoverable. Irrecoverable VAT is charged to the relevant expenditure category or included in the capitalised purchase cost of property and equipment and intangible assets. Where output tax is charged or input tax is recoverable, the amounts are stated net of VAT.
1.26 Corporation tax
The Department, its Agencies and most of its NDPBs are exempt from corporation tax. Three of the Group’s NDPBs (SLC, Aggregator Vehicle PLC and LocatED), are subject to corporation tax on their reported profits.
1.27 Deferred tax
Deferred tax is the tax expected to be payable or recoverable on differences between the carrying amounts of assets and liabilities in the financial statements and the corresponding tax bases used in the computation of taxable profit, and is accounted for using the balance sheet liability method. Deferred tax liabilities are generally recognised for all taxable temporary differences and deferred tax assets are recognised to the extent that it is probable that taxable profits will be available against which deductible temporary differences can be utilised. Such assets and liabilities are not recognised if the temporary difference arises from the initial recognition of goodwill or from the initial recognition (other than in a business combination) of other assets and liabilities in a transaction that affects neither the taxable profit nor the accounting profit.
The carrying amount of deferred tax assets is reviewed at each balance sheet date and reduced to the extent that it is no longer probable that sufficient taxable profits will be available to allow all or part of the asset to be recovered.
Deferred tax is calculated at the tax rates that are expected to apply in the period when the liability is settled or the asset is realised based on tax laws and rates that have been enacted or substantively enacted at the balance sheet date. Deferred tax is charged or credited in the income statement, except when it relates to items charged or credited in other comprehensive income, in which case the deferred tax is also dealt with in other comprehensive income.
The measurement of deferred tax liabilities and assets reflects the tax consequences that would follow from the manner in which the Group expects, at the end of the reporting period, to recover or settle the carrying amount of its assets and liabilities.
1.28 Service concession arrangements
Under a service concession arrangement, a government entity contracts with the private sector to construct, operate and maintain public sector infrastructure; allowing the private sector to deliver services directly or indirectly to the public. However, the government entity retains control, or regulates, the services provided (including access fees) and controls significant residual interest in the infrastructure at the completion of the arrangement.
The Group has adopted IFRIC 12 Service Concession Arrangements (IFRIC 12) as interpreted by the FReM for the grantor to account for the 46 schools the private sector will construct and then operate for the Group under the Private Finance 2 (PF2) scheme over a 25 year period. The transaction is part of the wider Priority Schools Building Programme (PSBP) programme sponsored by the Department that is addressing condition issues across the school estate. Within these Accounts the transaction is referred to as PF2.
The assets being constructed under the terms of PF2 are not recognised by the Group. In accordance with the Group’s existing asset recognition approach for PSBP assets, the Group does not recognise school assets being constructed under PSBP (including PF2). The Group does not judge any economic benefit to flow to the Group from the PSBP assets during and after construction other than where the assets are, or will be, operated by academy trusts involved in the consolidation. The Group instead recognises the value of the assets during construction for schools outside the Group as capital grants-in-kind.

135DFE CONSOLIDATED ANNUAL REPORT AND ACCOUNTS 2017-18
As well as potential asset recognition, IFRIC 12 application also results in the Group recognising the financing liability arising from constructing the assets originally. The financing liability is repaid over the term of the service concession arrangement through the unitary charges settled by ESFA.
Interest on the financing liability and expenditure on services provided under the service concession arrangement are recognised in the SoCNE as they accrue. Unitary charges are apportioned between three elements: an element to pay for services; an element to pay interest on the liability and an element to repay the financing liability.

136 DFE CONSOLIDATED ANNUAL REPORT AND ACCOUNTS 2017-18
2. STATEMENT OF OPERATING COSTS BY OPERATING SEGMENT
The Group is structured to clearly align activity and expenditure against the government’s Structural Reform Priorities for education. Information on operating activities, financial results, forecasts and plans is presented to and reviewed by the Leadership Team on this basis and the Group’s Supply Estimates are also structured in this way.
The vast majority of the lines of operation fall within the same geographical location and regulatory environment. Segmental analysis of the Group’s assets and liabilities are not reviewed by management and consequently are not provided here.
The segmental report shown below links expenditure within the Group structure to Note S1 and covers the Group’s total resource and capital outturn for the year.
2.1 Segmental analysis
2017-18 2016-17
Gross expenditure Income
Net expenditure
Gross expenditure Income
Net expenditure
£m £m £m £m £m £m
Education Standards 4,750 (35) 4,715 9,800 (79) 9,721
Higher & Further Education 37,933 (4,288) 33,645 31,202 (4,479) 26,723
Infrastructure & Funding 53,595 (40) 53,555 48,285 (69) 48,216
Insight, Resources &Transformation
295 (48) 247 321 (108) 213
Social Care, Mobility & Equalities
264 (1) 263 372 (1) 371
96,837 (4,412) 92,425 89,980 (4,736) 85,244
2.2 Reconciliation between operating segments and SoCNE
2017-18
Net expenditure per segmental
analysis
Reconciling items
Net costs per SoCNEIncome & gains Expenditure
£m £m £m £m
Education Standards (ESD) 4,715 - (3) 4,712
Higher & Further Education (H&FE) 33,645 2,291 (18,225) 17,711
Infrastructure & Funding (IFD) 53,555 - (585) 52,970
Insight, Resources & Transformation (IRT) 247 - (43) 204
Social Care, Mobility & Equalities (SCME) 263 - - 263
92,425 2,291 (18,856) 75,860
The reconciling expenditure items are primarily movements in loans. Infrastructure and funding includes loans in respect of PF2 (see Note 11) with an increase in these at the year end. The Higher & Further Education segment includes the student loan book, with new loans issued and repayments during the year being a reconciling item (see Note 11.3).

137DFE CONSOLIDATED ANNUAL REPORT AND ACCOUNTS 2017-18
2.3 SoCNE analysis by segment
ESD H&FE IFD IRT SCME Total
£m £m £m £m £m £m
Operating income (74) (2,668) (41) (50) (1) (2,834)
Staff costs 55 232 116 82 50 535
Resource grants 4,496 6,321 48,783 3 167 59,770
Capital grants - 2,222 3,974 - - 6,196
Operating expenditure 223 174 90 137 46 670
Depreciation, impairment, amortisation and other non-cash charges
12 13,084 - 32 1 13,129
Finance income - (2,522) (21) - - (2,543)
Finance expense - 4 69 - - 73
Loss on sale of student loan book - 864 - - - 864
Net expenditure for the year 4,712 17,711 52,970 204 263 75,860
A summary of the responsibilities of the reporting entities used for management reporting purposes are explained in the Structure of the Board section of the Performance Report. Further details concerning outturn by directorate for the year are provided in the financial overview section.
3. OPERATING INCOME
2017-18 2016-17
Department & Agencies Group
Department & Agencies Group
£m £m £m £m
Levy income
Training body levy income - 229 - 225
Operating income
RPA income 40 40 32 32
Student grant recoveries 43 43 57 57
Fees, charges and recharges to other government departments
96 96 41 41
Shared service income - - - -
Grant income
Joint programme income 2,097 2,097 2,077 2,081
Other income
European Union funding 202 202 31 31
Rental income 3 3 10 8
Sale of goods and services - 72 - 71
Other income 41 52 120 129
2,522 2,834 2,368 2,675
Joint programme income relates to income from Department of Health & Social Care (previously Department of Health), Department for Business, Energy and Industrial Strategy and the Ministry of Justice for jointly managed projects where the Group had recharged some of the expenditure for those programmes, specifically funding for HEFCE of £2.0 billion (2016-17: £1.9 billion) to support research grants to third parties.
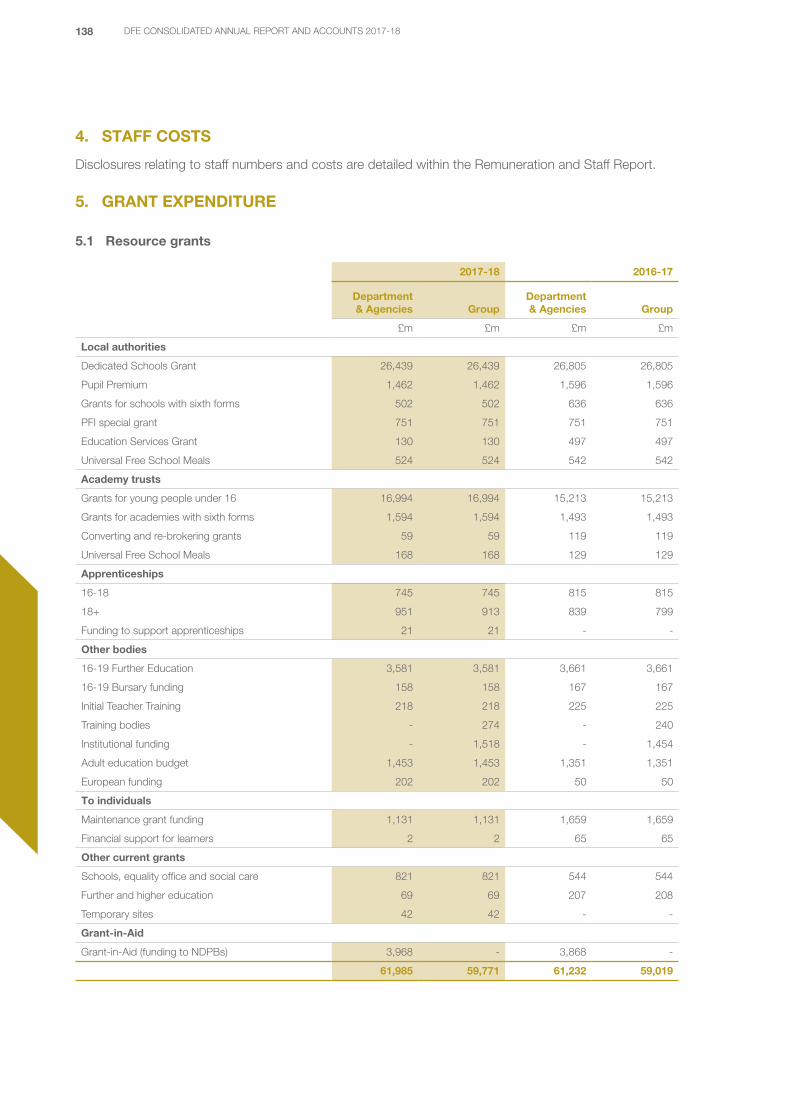
138 DFE CONSOLIDATED ANNUAL REPORT AND ACCOUNTS 2017-18
4. STAFF COSTS
Disclosures relating to staff numbers and costs are detailed within the Remuneration and Staff Report.
5. GRANT EXPENDITURE
5.1 Resource grants
2017-18 2016-17
Department & Agencies Group
Department & Agencies Group
£m £m £m £m
Local authorities
Dedicated Schools Grant 26,439 26,439 26,805 26,805
Pupil Premium 1,462 1,462 1,596 1,596
Grants for schools with sixth forms 502 502 636 636
PFI special grant 751 751 751 751
Education Services Grant 130 130 497 497
Universal Free School Meals 524 524 542 542
Academy trusts
Grants for young people under 16 16,994 16,994 15,213 15,213
Grants for academies with sixth forms 1,594 1,594 1,493 1,493
Converting and re-brokering grants 59 59 119 119
Universal Free School Meals 168 168 129 129
Apprenticeships
16-18 745 745 815 815
18+ 951 913 839 799
Funding to support apprenticeships 21 21 - -
Other bodies
16-19 Further Education 3,581 3,581 3,661 3,661
16-19 Bursary funding 158 158 167 167
Initial Teacher Training 218 218 225 225
Training bodies - 274 - 240
Institutional funding - 1,518 - 1,454
Adult education budget 1,453 1,453 1,351 1,351
European funding 202 202 50 50
To individuals
Maintenance grant funding 1,131 1,131 1,659 1,659
Financial support for learners 2 2 65 65
Other current grants
Schools, equality office and social care 821 821 544 544
Further and higher education 69 69 207 208
Temporary sites 42 42 - -
Grant-in-Aid
Grant-in-Aid (funding to NDPBs) 3,968 - 3,868 -
61,985 59,771 61,232 59,019

139DFE CONSOLIDATED ANNUAL REPORT AND ACCOUNTS 2017-18
5.2 Capital grants
2017-18 2016-17
Department & Agencies Group
Department & Agencies Group
£m £m £m £m
Basic Need schools capital grant 1,501 1,501 1,574 1,574
Maintenance capital grants to LAs and VA schools 761 761 904 904
Academy capital grants and free school programme 1,240 1,240 1,430 1,430
Priority Schools Building Programme 471 471 1,056 1,056
Higher & Further education 18 2,193 37 2,165
Other capital grants 29 29 9 13
4,020 6,195 5,010 7,142
6. OPERATING EXPENDITURE
6.1 Operating expenditure
2017-18 2016-17
Department & Agencies Group
Department & Agencies Group
£m £m £m £m
Staff related costs 15 21 9 15
Consultancy and other professional fees 64 84 32 46
Building maintenance and repair cost 12 13 27 35
Premises costs including rates and service charges 12 56 23 31
IT and telecommunications costs 75 123 29 59
PFI charge - - 36 36
Rentals under operating leases:
land and buildings 11 16 65 80
other operating leases - 2 1 2
Travel and subsistence 12 19 10 16
PF2 service costs 3 3 2 2
Research and development costs 21 23 12 14
Programme expenditure 210 229 115 119
Advertising and publicity 21 25 68 74
Other expenditure 77 56 134 148
533 670 563 677
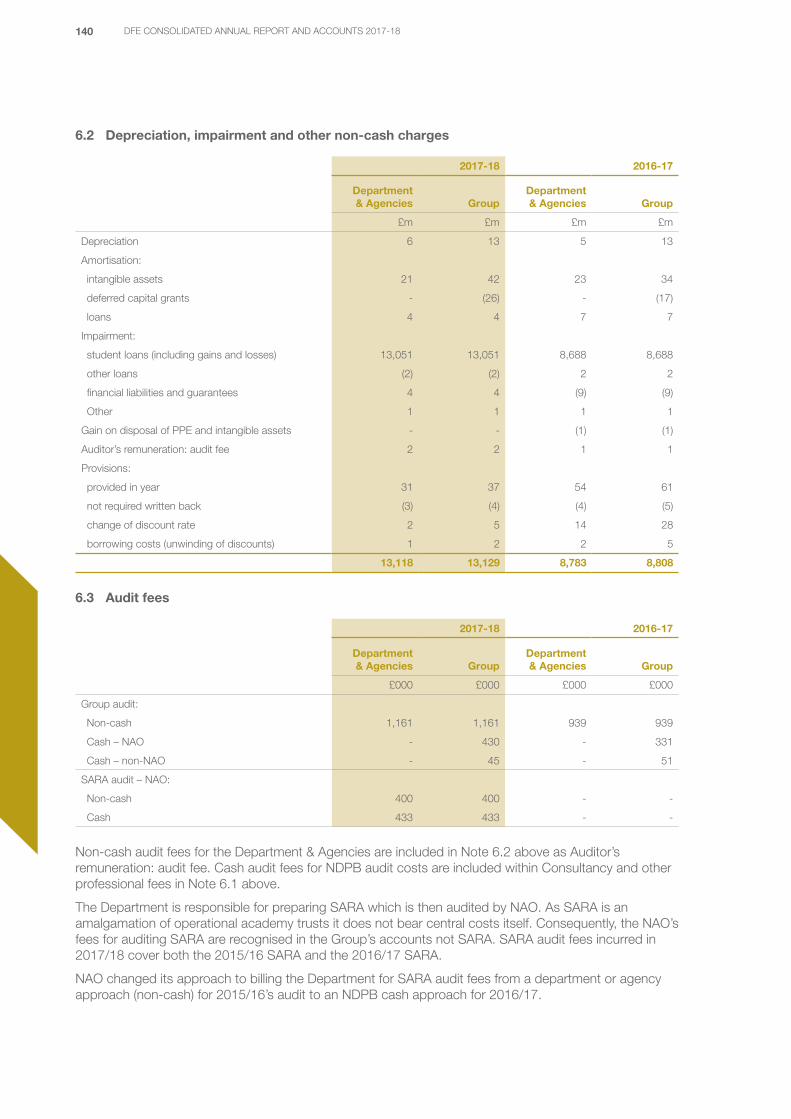
140 DFE CONSOLIDATED ANNUAL REPORT AND ACCOUNTS 2017-18
6.2 Depreciation, impairment and other non-cash charges
2017-18 2016-17
Department & Agencies Group
Department & Agencies Group
£m £m £m £m
Depreciation 6 13 5 13
Amortisation:
intangible assets 21 42 23 34
deferred capital grants - (26) - (17)
loans 4 4 7 7
Impairment:
student loans (including gains and losses) 13,051 13,051 8,688 8,688
other loans (2) (2) 2 2
financial liabilities and guarantees 4 4 (9) (9)
Other 1 1 1 1
Gain on disposal of PPE and intangible assets - - (1) (1)
Auditor’s remuneration: audit fee 2 2 1 1
Provisions:
provided in year 31 37 54 61
not required written back (3) (4) (4) (5)
change of discount rate 2 5 14 28
borrowing costs (unwinding of discounts) 1 2 2 5
13,118 13,129 8,783 8,808
6.3 Audit fees
2017-18 2016-17
Department & Agencies Group
Department & Agencies Group
£000 £000 £000 £000
Group audit:
Non-cash 1,161 1,161 939 939
Cash – NAO - 430 - 331
Cash – non-NAO - 45 - 51
SARA audit – NAO:
Non-cash 400 400 - -
Cash 433 433 - -
Non-cash audit fees for the Department & Agencies are included in Note 6.2 above as Auditor’s remuneration: audit fee. Cash audit fees for NDPB audit costs are included within Consultancy and other professional fees in Note 6.1 above.
The Department is responsible for preparing SARA which is then audited by NAO. As SARA is an amalgamation of operational academy trusts it does not bear central costs itself. Consequently, the NAO’s fees for auditing SARA are recognised in the Group’s accounts not SARA. SARA audit fees incurred in 2017/18 cover both the 2015/16 SARA and the 2016/17 SARA.
NAO changed its approach to billing the Department for SARA audit fees from a department or agency approach (non-cash) for 2015/16’s audit to an NDPB cash approach for 2016/17.

141DFE CONSOLIDATED ANNUAL REPORT AND ACCOUNTS 2017-18
7. FINANCE INCOME
2017-18 2016-17
Department & Agencies Group
Department & Agencies Group
£m £m £m £m
Student loans:
capitalised interest 2,849 2,849 1,878 1,878
effective interest (329) (329) 32 32
EFS loans effective interest 1 1 2 1
Investment income - 1 - 2
PF2 loan interest income - 21 - 13
2,521 2,543 1,912 1,926
8. PROPERTY, PLANT AND EQUIPMENT
2018 2017
PropertyOther
PPE AuC Total PropertyOther
PPE AuC Total
£m £m £m £m £m £m £m £m
Cost or valuation
1 April 86 113 389 588 86 149 216 451
Additions 13 4 303 320 5 5 199 209
Impairment - (1) - (1) - (1) - (1)
Disposals - (2) (1) (3) (5) (49) - (54)
Reclassifications (1) 4 (3) - 1 7 (7) 1
Revaluations - 1 - 1 (1) 2 - 1
Transfers regarding ATs:
transfer in 32 - 212 244 - - - -
transfer out - - (49) (49) - - (19) (19)
At 31 March 130 119 851 1,100 86 113 389 588
Depreciation
1 April (14) (85) - (99) (18) (123) - (141)
Charged in year (2) (11) - (13) (2) (11) - (13)
Disposals 1 2 - 3 5 49 - 54
Impairment - 1 - 1 - 1 - 1
Revaluations - (1) - (1) 1 (1) - -
At 31 March (15) (94) - (109) (14) (85) - (99)
Carrying value as at 31 March
115 25 851 991 72 28 389 489
Of the total:
Department & Agencies 97 13 849 959 53 14 388 455
NDPBs 18 12 2 32 19 14 1 34
115 25 851 991 72 28 389 489
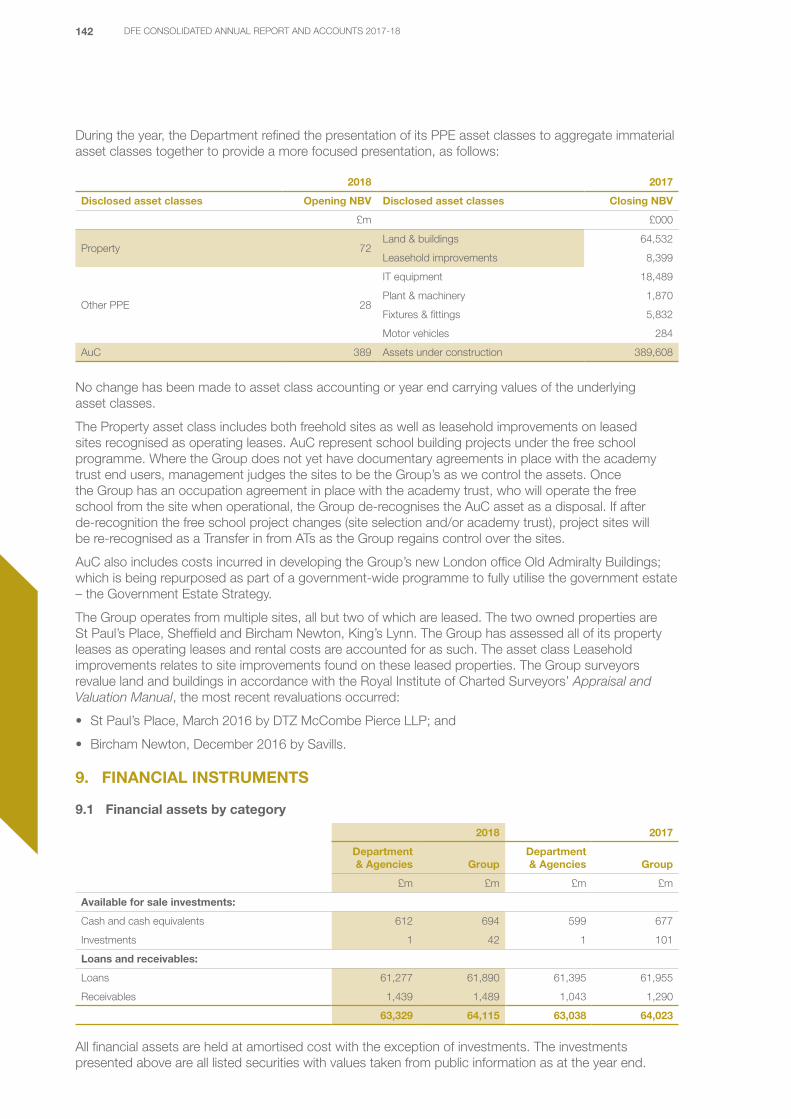
142 DFE CONSOLIDATED ANNUAL REPORT AND ACCOUNTS 2017-18
During the year, the Department refined the presentation of its PPE asset classes to aggregate immaterial asset classes together to provide a more focused presentation, as follows:
2018 2017
Disclosed asset classes Opening NBV Disclosed asset classes Closing NBV
£m £000
Property 72Land & buildings 64,532
Leasehold improvements 8,399
Other PPE 28
IT equipment 18,489
Plant & machinery 1,870
Fixtures & fittings 5,832
Motor vehicles 284
AuC 389 Assets under construction 389,608
No change has been made to asset class accounting or year end carrying values of the underlying asset classes.
The Property asset class includes both freehold sites as well as leasehold improvements on leased sites recognised as operating leases. AuC represent school building projects under the free school programme. Where the Group does not yet have documentary agreements in place with the academy trust end users, management judges the sites to be the Group’s as we control the assets. Once the Group has an occupation agreement in place with the academy trust, who will operate the free school from the site when operational, the Group de-recognises the AuC asset as a disposal. If after de-recognition the free school project changes (site selection and/or academy trust), project sites will be re-recognised as a Transfer in from ATs as the Group regains control over the sites.
AuC also includes costs incurred in developing the Group’s new London office Old Admiralty Buildings; which is being repurposed as part of a government-wide programme to fully utilise the government estate – the Government Estate Strategy.
The Group operates from multiple sites, all but two of which are leased. The two owned properties are St Paul’s Place, Sheffield and Bircham Newton, King’s Lynn. The Group has assessed all of its property leases as operating leases and rental costs are accounted for as such. The asset class Leasehold improvements relates to site improvements found on these leased properties. The Group surveyors revalue land and buildings in accordance with the Royal Institute of Charted Surveyors’ Appraisal and Valuation Manual, the most recent revaluations occurred:
• St Paul’s Place, March 2016 by DTZ McCombe Pierce LLP; and
• Bircham Newton, December 2016 by Savills.
9. FINANCIAL INSTRUMENTS
9.1 Financial assets by category
2018 2017
Department & Agencies Group
Department & Agencies Group
£m £m £m £m
Available for sale investments:
Cash and cash equivalents 612 694 599 677
Investments 1 42 1 101
Loans and receivables:
Loans 61,277 61,890 61,395 61,955
Receivables 1,439 1,489 1,043 1,290
63,329 64,115 63,038 64,023
All financial assets are held at amortised cost with the exception of investments. The investments presented above are all listed securities with values taken from public information as at the year end.

143DFE CONSOLIDATED ANNUAL REPORT AND ACCOUNTS 2017-18
Therefore, we consider them to be Level 1 fair values as required by IFRS 13.
9.2 Financial liabilities by category
2018 2017
Department & Agencies Group
Department & Agencies Group
£m £m £m £m
Measured at amortised cost:
Payables – excluding loans 2,281 2,484 1,619 1,812
PFI imputed lease liability 647 647 572 572
PF2 loan liabilities - 591 - 531
2,928 3,722 2,191 2,915
10. FINANCIAL RISK
10.1 Financial risk management
As the cash requirements of the Group are met through the Estimate process, the Group is not exposed to the degree of financial risk faced by similar sized business entities. Consequently, financial instruments play a more limited role in creating and managing risk than would apply to a non-public sector body.
The Group has limited powers to borrow or invest surplus funds and, except for the Group’s PF2 transaction, financial assets and liabilities are generated by day-to-day operational activities and are not held to change the risks facing the Group in undertaking its activities. To support the PF2 transaction, the Group both took out and issued loans to allow funds to flow down to the construction firms building the PF2 schools.
Liquidity risk
The Group’s net revenue resource and capital requirements are financed by resources voted annually by Parliament. The funding requirements of the Group’s PF2 transaction required to support the school construction are aligned to the planned drawdowns from the external investors to manage liquidity risk.
The Group is therefore not exposed to significant residual liquidity risk.
Interest-rate risk
The Group’s financial instruments carry nil, variable or fixed rates of interest.
The Group’s variable rate financial assets are predominantly its student loans which have an interest rate cap set at RPI or the Bank of England base rate plus 1%.
The interest rate on pre-2012 loans is the lower of RPI and the Bank of England base rate plus 1%. The amount of interest repayable is therefore
subject to fluctuations in the base rate and RPI. The probability of the Department recovering the face value of loans issued is increased when the Bank of England base rate is low and the rate of inflation is comparatively high, because the base rate cap comes into operation for these loans. The impact of the interest rate risk for student loans issued under the pre-2012 scheme is factored into the carrying value as the student loan repayment model calculates the impact of interest rate on expected future cash flows. There is inherent risk in forecasting the amount of interest payable and if England experiences base rates that are lower than RPI the future cash flows will be impaired further. Additional information about student loans is provided in Note 11.3.
The Group’s inbound and outbound PF2 financial instruments have fixed interest rates that are broadly aligned and were set within the context of the PF2 transaction as a whole.
Consequently, the Department does not consider it is exposed to significant residual interest-rate risk.
Credit risk
Credit risk is the risk that a service user or counterparty to a financial instrument will fail to pay amounts due causing financial loss to the Group and arises principally from cash and outstanding debt. The Group’s exposure to credit risk can be split into two broad sources: arising from loans originated by the Group (predominantly PF2 and student loans) and the funding of education providers.
The Group addresses the credit risks arising from its PF2 loans through careful planning at the origination stages (planned drawdown and repayment schedules) and continuing review of monthly reporting within the wider PF2 transaction. In addition, the PF2 loans have been structured so that repayment starts once

144 DFE CONSOLIDATED ANNUAL REPORT AND ACCOUNTS 2017-18
the school buildings are operational; and the borrowers are receiving rental income streams.
The Group’s student loans retain credit risk since, as per government policy, no mitigating checks on potential borrowers are performed prior to loan origination. More information pertaining to student loan risk profile is provided in Note 11.3.
The Group has a credit (receivables) policy for education providers that ensures consistent processes are in place throughout the Group to measure and control credit risk. Commercial and charitable education providers for the Group are subjected to quality and financial status reviews to mitigate the risk of non-payment of debts as a result of insolvency.
For non-student loan assets, there is no active market and there is no intention to sell. Therefore, the Group does not disclose fair value comparatives.
Market risk
The Group is exposed to market risk through its market valued investment portfolio. The majority of the Group’s investment portfolio comprises investment funds and/or unit trusts managed by professional money managers.
The Department considers that the use of third party professional managers mitigates against significant residual market risk.
Other market risk
The other main risks resulting from a downward movement in the economy relate to the potential increase in borrowers’ unemployment impacting on their ability to repay student loans. Student loans are also impacted due to the potential resultant negative impact on graduate earnings growth, which lengthens the time period before loans are in repayment and extends the repayment period. This may impact the carrying value in the accounts. It can also lead to an increase in write offs as it increases the likelihood that some graduates may not repay their loans in full by the end of the loan period.
10.2 PF2 risk
The Group has entered into agreements for five regional batches of schools with construction consortia. These schemes are PFI arrangements, with the financing for each of the batches raised by Aggregator Vehicle PLC.
In summary, the transactions involved are:
• investor debt is raised (liability of the Group);
• a loan is made onward to the relevant regional batch consortium (asset of the Group);
• the consortium undertakes construction projects with assets controlled by the local authority or AT as relevant;
• adopting the Group’s AuC accounting policy the school assets are not recognised as assets, the value of construction is recognised as a capital grant-in-kind; and
• the Group recognises a PFI imputed lease liability in respect of unitary charges payable to the consortia to cover the construction value of the schools.
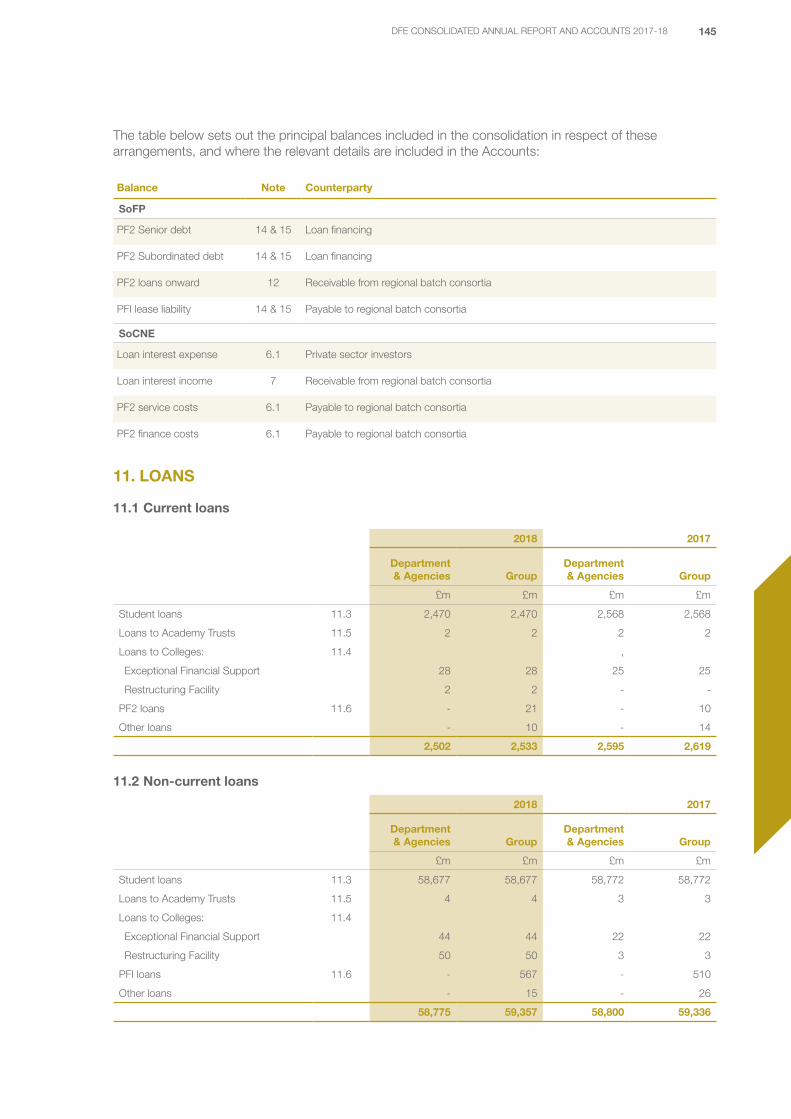
145DFE CONSOLIDATED ANNUAL REPORT AND ACCOUNTS 2017-18
The table below sets out the principal balances included in the consolidation in respect of these arrangements, and where the relevant details are included in the Accounts:
Balance Note Counterparty
SoFP
PF2 Senior debt 14 & 15 Loan financing
PF2 Subordinated debt 14 & 15 Loan financing
PF2 loans onward 12 Receivable from regional batch consortia
PFI lease liability 14 & 15 Payable to regional batch consortia
SoCNE
Loan interest expense 6.1 Private sector investors
Loan interest income 7 Receivable from regional batch consortia
PF2 service costs 6.1 Payable to regional batch consortia
PF2 finance costs 6.1 Payable to regional batch consortia
11. LOANS
11.1 Current loans
2018 2017
Department & Agencies Group
Department & Agencies Group
£m £m £m £m
Student loans 11.3 2,470 2,470 2,568 2,568
Loans to Academy Trusts 11.5 2 2 2 2
Loans to Colleges: 11.4 ,
Exceptional Financial Support 28 28 25 25
Restructuring Facility 2 2 - -
PF2 loans 11.6 - 21 - 10
Other loans - 10 - 14
2,502 2,533 2,595 2,619
11.2 Non-current loans
2018 2017
Department & Agencies Group
Department & Agencies Group
£m £m £m £m
Student loans 11.3 58,677 58,677 58,772 58,772
Loans to Academy Trusts 11.5 4 4 3 3
Loans to Colleges: 11.4
Exceptional Financial Support 44 44 22 22
Restructuring Facility 50 50 3 3
PFI loans 11.6 - 567 - 510
Other loans - 15 - 26
58,775 59,357 58,800 59,336

146 DFE CONSOLIDATED ANNUAL REPORT AND ACCOUNTS 2017-18
11.3 Student Loans in Higher and Further Education
Loans for students in Higher and Further Education are originated and recognised by the Department.
11.3.1 Features of student loans
There are two student loan schemes with different features – the pre-2012 and post-2012 scheme. We have shown these two schemes separately because of key differences in the loan characteristics – for details please see the table below. Post-2012 loans are available to students at different levels of study – further education (Advanced Learner Loans) and higher education (Undergraduate and Master’s) courses.
Pre-2012 loans scheme Post-2012 loans scheme
Nature of repayments Income contingent and generally through the tax system
Students Starters in higher education between academic years 1998/99 and 2011/12
Undergraduate Loans – starters on higher education courses from 2012/13 onwards
Advanced Learner Loans – starters on eligible Level 3 and 4 courses aged 24 or over from academic year 2013/14 onwards. From 2016/17 this has been extended to cover Level 3 to Level 6 for those aged 19 or over
Master’s Loans – starters on masters courses from 2016/17
Value of tuition fee loan (2017/18 rates)
£3,465 (full-time starters from academic year 2006/07)
Undergraduate Loans – up to £9,250 (full-time)
Advanced Learner Loans – set at various levels, capped in regulations, subject to size of qualification and sector subject area
Master’s Loans – up to £10,280 as a contribution to course and living costs
Interest rate applicable for 2017/18
Borrowers are charged the lower of RPI or Bank of England base rate plus 1%. If the latter applies, then the base rate cap is in operation.
Undergraduate Loans and Advanced Learner Loans – borrowers in study and until the April after leaving their course are charged RPI plus 3%.
The interest rate is currently 6.1% (2016-17: 4.6%).
The interest rate is currently 1.5% (2016/17: 1.25%)
From the April after leaving their course, borrowers are charged a variable rate of interest between RPI and RPI plus 3%, depending on their income
Master’s Loans – RPI plus 3% throughout the period of the loan. Rate is currently 6.1%. (2016/17: 4.6%)
Repayment threshold 2017-18: £17,775
2018-19: £18,330
Undergraduate Loans and Advanced Learner Loans – £21,000 frozen until March 2018
£25,000 from April 2018, increasing annually in line with average earnings
Master’s Loans – frozen at £21,000
Repayment rate 9% above repayment threshold Undergraduate Loans and Advanced Learner Loans – 9% above repayment threshold
Master’s Loans – 6% above repayment threshold (in addition to 9% for any Advanced Learner Loans and Undergraduate Loans)
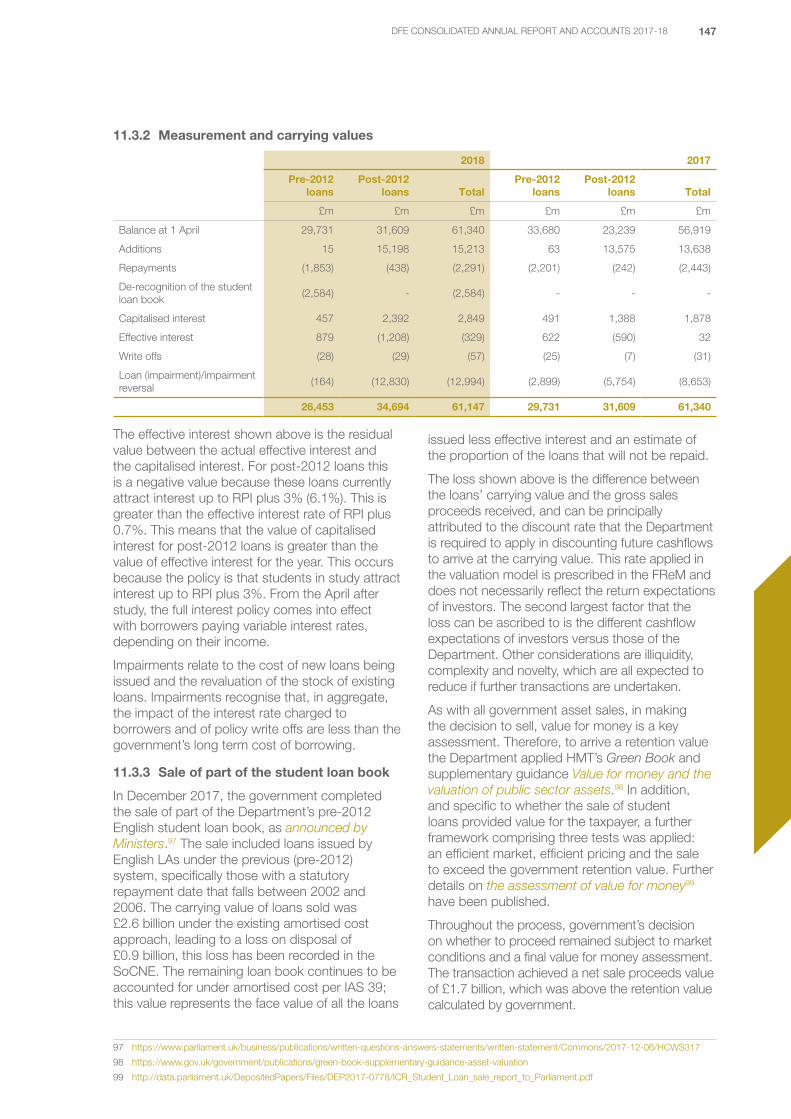
147DFE CONSOLIDATED ANNUAL REPORT AND ACCOUNTS 2017-18
11.3.2 Measurement and carrying values
2018 2017
Pre-2012 loans
Post-2012 loans Total
Pre-2012 loans
Post-2012 loans Total
£m £m £m £m £m £m
Balance at 1 April 29,731 31,609 61,340 33,680 23,239 56,919
Additions 15 15,198 15,213 63 13,575 13,638
Repayments (1,853) (438) (2,291) (2,201) (242) (2,443)
De-recognition of the student loan book
(2,584) - (2,584) - - -
Capitalised interest 457 2,392 2,849 491 1,388 1,878
Effective interest 879 (1,208) (329) 622 (590) 32
Write offs (28) (29) (57) (25) (7) (31)
Loan (impairment)/impairment reversal
(164) (12,830) (12,994) (2,899) (5,754) (8,653)
26,453 34,694 61,147 29,731 31,609 61,340
The effective interest shown above is the residual value between the actual effective interest and the capitalised interest. For post-2012 loans this is a negative value because these loans currently attract interest up to RPI plus 3% (6.1%). This is greater than the effective interest rate of RPI plus 0.7%. This means that the value of capitalised interest for post-2012 loans is greater than the value of effective interest for the year. This occurs because the policy is that students in study attract interest up to RPI plus 3%. From the April after study, the full interest policy comes into effect with borrowers paying variable interest rates, depending on their income.
Impairments relate to the cost of new loans being issued and the revaluation of the stock of existing loans. Impairments recognise that, in aggregate, the impact of the interest rate charged to borrowers and of policy write offs are less than the government’s long term cost of borrowing.
11.3.3 Sale of part of the student loan book
In December 2017, the government completed the sale of part of the Department’s pre-2012 English student loan book, as announced by Ministers.97 The sale included loans issued by English LAs under the previous (pre-2012) system, specifically those with a statutory repayment date that falls between 2002 and 2006. The carrying value of loans sold was £2.6 billion under the existing amortised cost approach, leading to a loss on disposal of £0.9 billion, this loss has been recorded in the SoCNE. The remaining loan book continues to be accounted for under amortised cost per IAS 39; this value represents the face value of all the loans
issued less effective interest and an estimate of the proportion of the loans that will not be repaid.
The loss shown above is the difference between the loans’ carrying value and the gross sales proceeds received, and can be principally attributed to the discount rate that the Department is required to apply in discounting future cashflows to arrive at the carrying value. This rate applied in the valuation model is prescribed in the FReM and does not necessarily reflect the return expectations of investors. The second largest factor that the loss can be ascribed to is the different cashflow expectations of investors versus those of the Department. Other considerations are illiquidity, complexity and novelty, which are all expected to reduce if further transactions are undertaken.
As with all government asset sales, in making the decision to sell, value for money is a key assessment. Therefore, to arrive a retention value the Department applied HMT’s Green Book and supplementary guidance Value for money and the valuation of public sector assets.98 In addition, and specific to whether the sale of student loans provided value for the taxpayer, a further framework comprising three tests was applied: an efficient market, efficient pricing and the sale to exceed the government retention value. Further details on the assessment of value for money99 have been published.
Throughout the process, government’s decision on whether to proceed remained subject to market conditions and a final value for money assessment. The transaction achieved a net sale proceeds value of £1.7 billion, which was above the retention value calculated by government.
97 https://www.parliament.uk/business/publications/written-questions-answers-statements/written-statement/Commons/2017-12-06/HCWS317
98 https://www.gov.uk/government/publications/green-book-supplementary-guidance-asset-valuation
99 http://data.parliament.uk/DepositedPapers/Files/DEP2017-0778/ICR_Student_Loan_sale_report_to_Parliament.pdf

148 DFE CONSOLIDATED ANNUAL REPORT AND ACCOUNTS 2017-18
The position of all borrowers, including those whose loans have been sold, will not change as a result of the sale. The sale does not and cannot in any way alter the mechanisms and terms of repayment: sold loans will continue to be serviced by HMRC and SLC on the same basis as equivalent unsold loans. Purchasers have no right to change any of the current loan arrangements or to contact borrowers directly. Those whose loans were sold were notified in writing by SLC within three months of the sale, for information only. No action will be required. Government has no plans to change, or to consider changing, the terms of pre-2012 loans.
11.3.4 Face value of student loans
The face value is made up of the opening face value, plus additions and capitalised interest, and less write offs and repayments. Face value excludes impairments of loans and effective interest.
The table below provides a reconciliation between the carrying value and the face value of student loans issued:
Pre-2012 loans Post-2012 loans Total
£m £m £m £m £m
Opening face value of loan book as at 1 April 2017 42,823 45,976 88,799
Less: opening value of loan impairments (13,092) (14,367) (27,459)
Opening carrying value of loan book as at 1 April 2017 29,731 31,609 61,340
New loans issued 15 15,198
Less: Impairment of loans issued (5) (6,576)
Fair value of new loans issued 10 8,622 8,632
Impairment adjustment to opening loan book (159) (6,254) (6,413)
Disposal (2,584) - (2,584)
Capitalised interest 457 2,392 2,849
Effective interest 879 (1,208) (329)
Write-offs (28) (29) (57)
Repayments (1,853) (438) (2,291)
(3,288) (5,537) (8,825)
Carrying value of loan book as at 31 March 2018 26,453 34,694 61,147
Add back: closing value of loan impairments 12,377 28,405 40,782
Face value of loan book as at 31 March 2018 38,830 63,099 101,929
11.3.5 Risk
Forecasting models
The value of new loans issued is calculated using a forecasting model, which uses data on the demographics of higher education students in order to predict their likely repayments of loans. There are also models adapted for borrowers taking different loan types – pre-2012 and post-2012 loans (Undergraduate, Advanced Learner Loans and Master’s Loans). The models depend on a complex set of assumptions, and particularly on borrowers’ earnings. The models are long term in nature, but use the latest OBR short and long term forecasts for RPI, base rates and earnings growth. The valuation of the student loan books is uncertain as they are highly dependent on macroeconomic circumstances and graduate earnings over the next 30 years, as well as a number of other complex assumptions, for around five million borrowers. There is little historic repayment data available for post-2012 loans. Further information on the undergraduate model assumptions100 is provided on the Department’s website.
The assumptions used in the repayment models are formally reviewed each year and the amounts provided reflect the estimate as at 31 March 2018.
100 https://www.gov.uk/government/statistics/student-loan-forecasts-england-2017-to-2018

149DFE CONSOLIDATED ANNUAL REPORT AND ACCOUNTS 2017-18
Assurance over the carrying value
Each year the carrying value of undergraduate loans is compared with the latest outputs from the student loan repayment model, which is re-run using current assumptions. If there is a significant difference, a review is undertaken to determine the reasons for the variance. The carrying value would only be adjusted if there was sufficient evidence to suggest that the divergence constituted a permanent reduction in the carrying value.
Changes in assumptions and modelling
During 2017-18, changes in assumptions and modelling led to the following revisions to the opening carrying value for student loans:
• Revised short term forecasts for base rates, RPI and earnings growth were published in the OBR’s Economic and Fiscal Outlooks in November 2017 and March 2018. Together these led to a decrease in the value of pre-2012 loans of £0.3 billion and a decrease in the value of post-2012 loans of £0.7 billion.
• Modelling improvements led to a decrease in the value of pre-2012 loans of £0.1 billion and a decrease in the value of the post-2012 loans of £0.5 billion. Modelling improvements included refreshing the model for the current year and incorporating improved forecast data, along with new SLC data, which led to an increase across the pre 2012 and post 2012 loan books of £0.3 billion.
• Policy changes announced in 2017, freezing the tuition fee cap at the 2016/17 academic year rate and increasing the student loan repayment threshold from £21,000 to £25,000 for post-2012 loans led to a decrease in the value of post-2012 loans of £5.3 billion and an increase in the value of pre-2012 loans of £0.3 billion.
• The impact of removing the sold student loans led to a decrease in the impairment recognised on the pre-2012 loans of £0.1 billion.
Impact of changes in assumptions and modelling on loan impairments
Pre-2012 loans£m
Post-2012 loans£m
Total£m
Impairments to existing loans arising from changes to:
Modelling improvements (109) (471) (580)
Revised OBR forecasts (331) (657) (988)
New SLC data/unwinding 68 191 259
Policy changes 280 (5,346) (5,066)
Loan sale (95) - (95)
Write offs: utilisation of impairment 28 29 57
(159) (6,254) (6,413)
Impairments to loans issued during the year (5) (6,576) (6,581)
Total loan impairment (164) (12,830) (12,994)
Assumptions used to calculate the student loan balance at 31 March 2018
Key macro-economic assumptions that affect the value of the student loan books are earnings growth, RPI inflation and, for pre-2012 loans, the Bank of England base rate. The tables below indicate the sensitivity of the valuation of future cash flows to these assumptions. Other assumptions, for example, that future graduate earnings will mimic the available data on historical graduate earnings, cannot be easily varied.
The sections below show the changes required in earnings growth, RPI inflation and Bank of England base rate assumptions to create an increase/decrease in the carrying value of each loan book of 1%.
A 1% shift in the carrying value is a relevant deviation to consider as it is larger than the magnitude of the inherent random variation present in the forecasting model. The assumptions could change by a larger amount, causing the carrying value to change by more than 1%. There are no earnings growth forecasts specifically for graduates, so the macro-economic assumptions include both graduates and non-graduates.
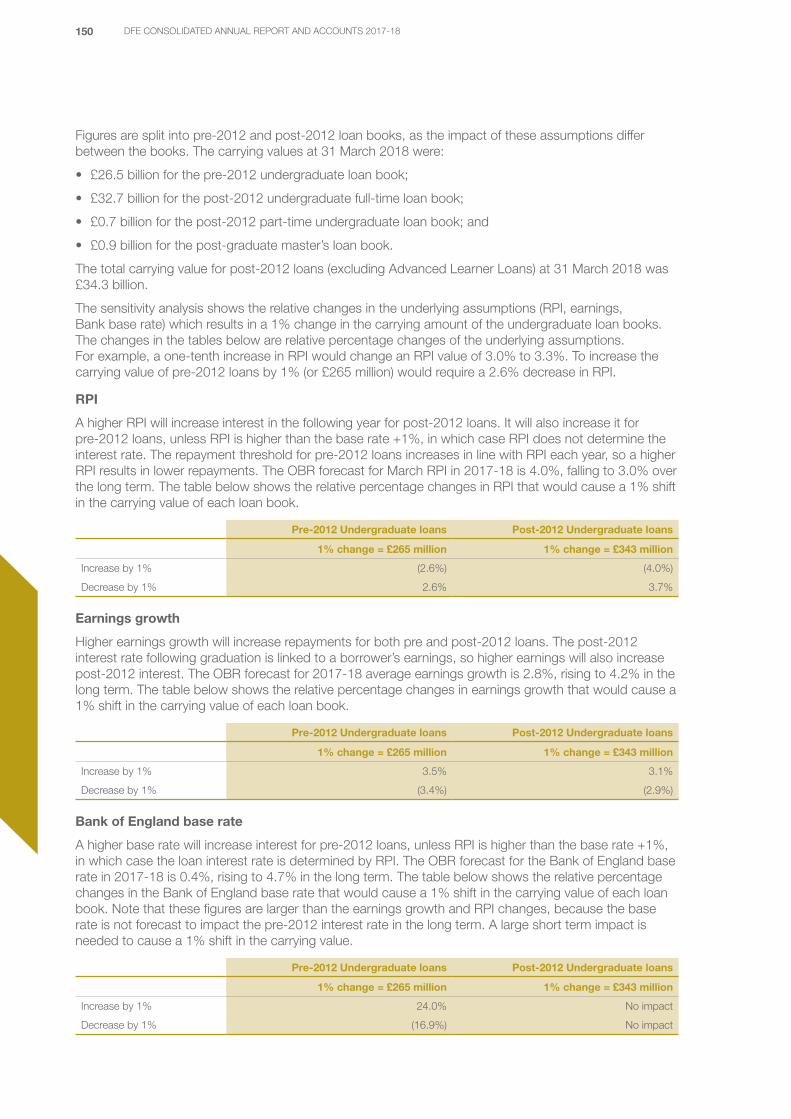
150 DFE CONSOLIDATED ANNUAL REPORT AND ACCOUNTS 2017-18
Figures are split into pre-2012 and post-2012 loan books, as the impact of these assumptions differ between the books. The carrying values at 31 March 2018 were:
• £26.5 billion for the pre-2012 undergraduate loan book;
• £32.7 billion for the post-2012 undergraduate full-time loan book;
• £0.7 billion for the post-2012 part-time undergraduate loan book; and
• £0.9 billion for the post-graduate master’s loan book.
The total carrying value for post-2012 loans (excluding Advanced Learner Loans) at 31 March 2018 was £34.3 billion.
The sensitivity analysis shows the relative changes in the underlying assumptions (RPI, earnings, Bank base rate) which results in a 1% change in the carrying amount of the undergraduate loan books. The changes in the tables below are relative percentage changes of the underlying assumptions. For example, a one-tenth increase in RPI would change an RPI value of 3.0% to 3.3%. To increase the carrying value of pre-2012 loans by 1% (or £265 million) would require a 2.6% decrease in RPI.
RPI
A higher RPI will increase interest in the following year for post-2012 loans. It will also increase it for pre-2012 loans, unless RPI is higher than the base rate +1%, in which case RPI does not determine the interest rate. The repayment threshold for pre-2012 loans increases in line with RPI each year, so a higher RPI results in lower repayments. The OBR forecast for March RPI in 2017-18 is 4.0%, falling to 3.0% over the long term. The table below shows the relative percentage changes in RPI that would cause a 1% shift in the carrying value of each loan book.
Pre-2012 Undergraduate loans Post-2012 Undergraduate loans
1% change = £265 million 1% change = £343 million
Increase by 1% (2.6%) (4.0%)
Decrease by 1% 2.6% 3.7%
Earnings growth
Higher earnings growth will increase repayments for both pre and post-2012 loans. The post-2012 interest rate following graduation is linked to a borrower’s earnings, so higher earnings will also increase post-2012 interest. The OBR forecast for 2017-18 average earnings growth is 2.8%, rising to 4.2% in the long term. The table below shows the relative percentage changes in earnings growth that would cause a 1% shift in the carrying value of each loan book.
Pre-2012 Undergraduate loans Post-2012 Undergraduate loans
1% change = £265 million 1% change = £343 million
Increase by 1% 3.5% 3.1%
Decrease by 1% (3.4%) (2.9%)
Bank of England base rate
A higher base rate will increase interest for pre-2012 loans, unless RPI is higher than the base rate +1%, in which case the loan interest rate is determined by RPI. The OBR forecast for the Bank of England base rate in 2017-18 is 0.4%, rising to 4.7% in the long term. The table below shows the relative percentage changes in the Bank of England base rate that would cause a 1% shift in the carrying value of each loan book. Note that these figures are larger than the earnings growth and RPI changes, because the base rate is not forecast to impact the pre-2012 interest rate in the long term. A large short term impact is needed to cause a 1% shift in the carrying value.
Pre-2012 Undergraduate loans Post-2012 Undergraduate loans
1% change = £265 million 1% change = £343 million
Increase by 1% 24.0% No impact
Decrease by 1% (16.9%) No impact
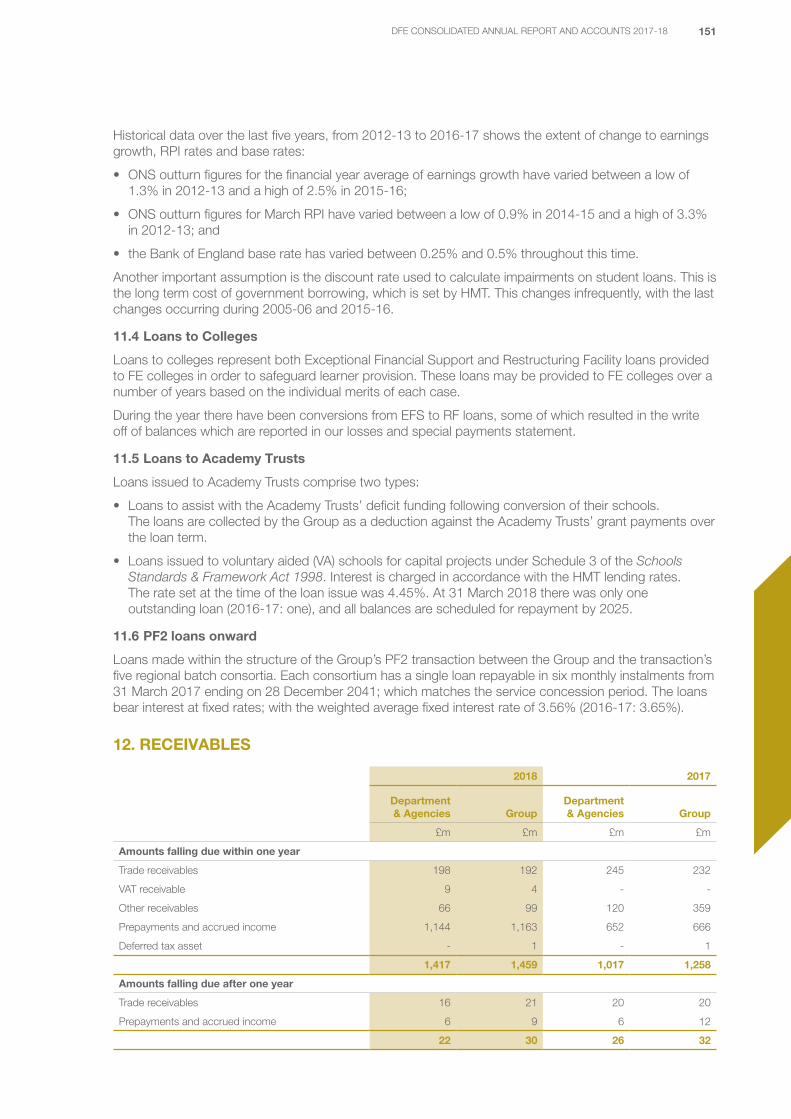
151DFE CONSOLIDATED ANNUAL REPORT AND ACCOUNTS 2017-18
Historical data over the last five years, from 2012-13 to 2016-17 shows the extent of change to earnings growth, RPI rates and base rates:
• ONS outturn figures for the financial year average of earnings growth have varied between a low of 1.3% in 2012-13 and a high of 2.5% in 2015-16;
• ONS outturn figures for March RPI have varied between a low of 0.9% in 2014-15 and a high of 3.3% in 2012-13; and
• the Bank of England base rate has varied between 0.25% and 0.5% throughout this time.
Another important assumption is the discount rate used to calculate impairments on student loans. This is the long term cost of government borrowing, which is set by HMT. This changes infrequently, with the last changes occurring during 2005-06 and 2015-16.
11.4 Loans to Colleges
Loans to colleges represent both Exceptional Financial Support and Restructuring Facility loans provided to FE colleges in order to safeguard learner provision. These loans may be provided to FE colleges over a number of years based on the individual merits of each case.
During the year there have been conversions from EFS to RF loans, some of which resulted in the write off of balances which are reported in our losses and special payments statement.
11.5 Loans to Academy Trusts
Loans issued to Academy Trusts comprise two types:
• Loans to assist with the Academy Trusts’ deficit funding following conversion of their schools. The loans are collected by the Group as a deduction against the Academy Trusts’ grant payments over the loan term.
• Loans issued to voluntary aided (VA) schools for capital projects under Schedule 3 of the Schools Standards & Framework Act 1998. Interest is charged in accordance with the HMT lending rates. The rate set at the time of the loan issue was 4.45%. At 31 March 2018 there was only one outstanding loan (2016-17: one), and all balances are scheduled for repayment by 2025.
11.6 PF2 loans onward
Loans made within the structure of the Group’s PF2 transaction between the Group and the transaction’s five regional batch consortia. Each consortium has a single loan repayable in six monthly instalments from 31 March 2017 ending on 28 December 2041; which matches the service concession period. The loans bear interest at fixed rates; with the weighted average fixed interest rate of 3.56% (2016-17: 3.65%).
12. RECEIVABLES
2018 2017
Department & Agencies Group
Department & Agencies Group
£m £m £m £m
Amounts falling due within one year
Trade receivables 198 192 245 232
VAT receivable 9 4 - -
Other receivables 66 99 120 359
Prepayments and accrued income 1,144 1,163 652 666
Deferred tax asset - 1 - 1
1,417 1,459 1,017 1,258
Amounts falling due after one year
Trade receivables 16 21 20 20
Prepayments and accrued income 6 9 6 12
22 30 26 32

152 DFE CONSOLIDATED ANNUAL REPORT AND ACCOUNTS 2017-18
13. CASH AND CASH EQUIVALENTS
2018 2017
Department & Agencies Group
Department & Agencies Group
£m £m £m £m
Balance at 1 April 599 677 451 538
Net change in cash and cash equivalent balances 13 17 148 139
Balance at 31 March 612 694 599 677
The following balances are held as cash at bank and in hand:
Government Banking Service 583 607 558 621
Commercial banks - 58 2 17
Cash held by solicitors on behalf of Group 29 29 39 39
Balance at 31 March 612 694 599 677
14. CURRENT PAYABLES
2018 2017
Department & Agencies Group
Department & Agencies Group
£m £m £m £m
Tax and social security payables 7 12 6 9
VAT payables - - 11 13
Trade payables 93 110 25 36
Other payables 419 448 218 254
Accruals and deferred income 924 1,050 1,036 1,109
Amounts issued from the Consolidation Fund for Supply but not spent at year end
591 591 322 322
PF2 imputed lease liability 66 66 54 54
PF2 loan liabilities - 21 - 15
Consolidated Fund extra receipts due to be paid to the Consolidated Fund:
Received - - 1 1
2,100 2,298 1,673 1,813
15. NON-CURRENT PAYABLES
2018 2017
Department & Agencies Group
Department & Agencies Group
£m £m £m £m
PF2 imputed lease liability 581 581 518 518
PF2 loan liabilities - 570 - 517
Other payables 247 273 - 67
828 1,424 518 1,102
PF2 senior debt relates to five bank notes and five bond subscriptions. The borrowing facilities are for a total value of £563.3 million (2016-17: £563.3 million) and as at 31 December 2017 £549.6 million (2016-17: £494.2 million) has been drawn. Loan issue costs related to the bank borrowings have been deducted from the gross proceeds and an effective interest is used to calculate finance costs. There was £2.7 million (2016-17: £1.6 million) of accrued interest and an unamortised effective interest adjustment of £7.2 million (2016-17: £7.5 million) as at the year end.
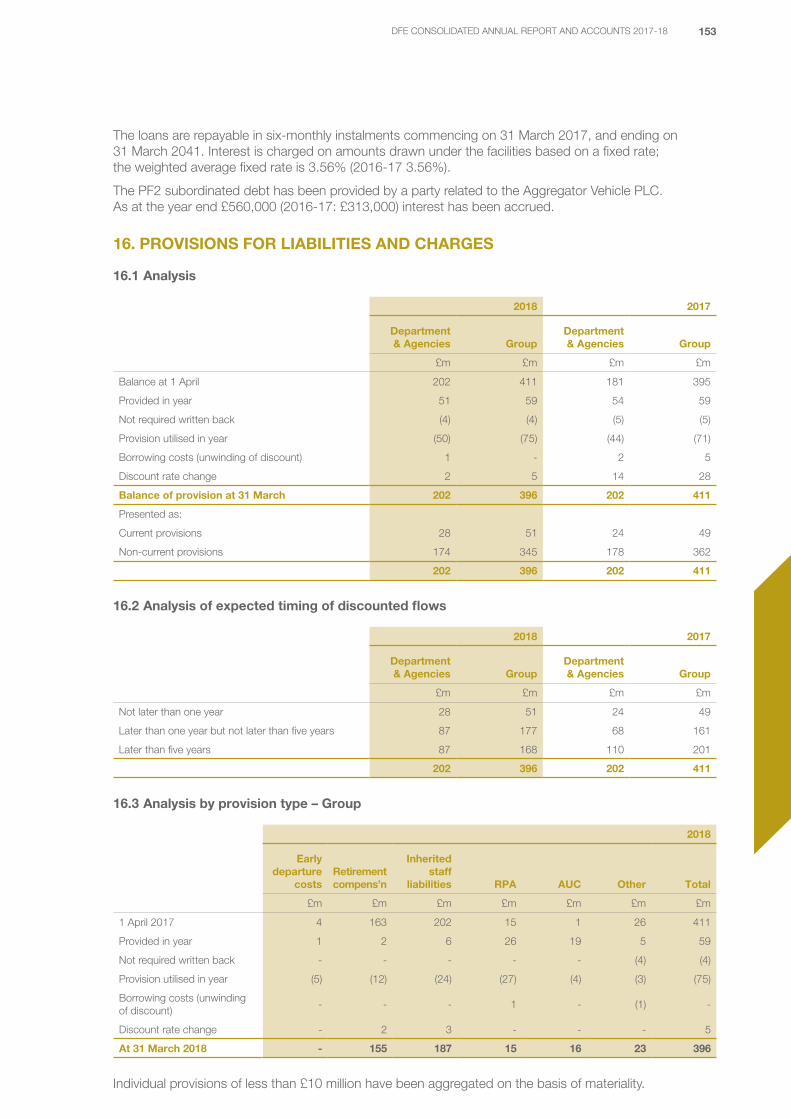
153DFE CONSOLIDATED ANNUAL REPORT AND ACCOUNTS 2017-18
The loans are repayable in six-monthly instalments commencing on 31 March 2017, and ending on 31 March 2041. Interest is charged on amounts drawn under the facilities based on a fixed rate; the weighted average fixed rate is 3.56% (2016-17 3.56%).
The PF2 subordinated debt has been provided by a party related to the Aggregator Vehicle PLC. As at the year end £560,000 (2016-17: £313,000) interest has been accrued.
16. PROVISIONS FOR LIABILITIES AND CHARGES
16.1 Analysis
2018 2017
Department & Agencies Group
Department & Agencies Group
£m £m £m £m
Balance at 1 April 202 411 181 395
Provided in year 51 59 54 59
Not required written back (4) (4) (5) (5)
Provision utilised in year (50) (75) (44) (71)
Borrowing costs (unwinding of discount) 1 - 2 5
Discount rate change 2 5 14 28
Balance of provision at 31 March 202 396 202 411
Presented as:
Current provisions 28 51 24 49
Non-current provisions 174 345 178 362
202 396 202 411
16.2 Analysis of expected timing of discounted flows
2018 2017
Department & Agencies Group
Department & Agencies Group
£m £m £m £m
Not later than one year 28 51 24 49
Later than one year but not later than five years 87 177 68 161
Later than five years 87 168 110 201
202 396 202 411
16.3 Analysis by provision type – Group
2018
Early departure
costsRetirement compens’n
Inherited staff
liabilities RPA AUC Other Total
£m £m £m £m £m £m £m
1 April 2017 4 163 202 15 1 26 411
Provided in year 1 2 6 26 19 5 59
Not required written back - - - - - (4) (4)
Provision utilised in year (5) (12) (24) (27) (4) (3) (75)
Borrowing costs (unwinding of discount)
- - - 1 - (1) -
Discount rate change - 2 3 - - - 5
At 31 March 2018 - 155 187 15 16 23 396
Individual provisions of less than £10 million have been aggregated on the basis of materiality.

154 DFE CONSOLIDATED ANNUAL REPORT AND ACCOUNTS 2017-18
Early departure costs
The Group meets the additional costs of benefits beyond normal PCSPS benefits in respect of employees who retire early, and compensation payments payable to employees who take early severance. The Group provides for this in full when the early retirement programme becomes binding on the Group by establishing a provision for the estimated payments.
Retirement compensation
This long term provision relates to premature retirement compensation of teaching staff of ex-Grant Maintained Schools and Colleges and pension payments relating to the staff of former Departmental bodies (Schools Council, Training Commission and NDPBs). The provision was calculated using data supplied by both Capita Business Services Limited for teachers’ pensions and Equiniti Paymaster for former Departmental bodies and NDPBs. The calculation was based on the average life expectancy for men and women as detailed by ONS.
Inherited staff liabilities
These are certain staff related commitments of HEIs that were previously LA maintained. These liabilities were transferred from LAs to HEIs on incorporation and the Education Reform Act 1988 gave powers to the Polytechnics and Colleges Funding Council (PCFC) to reimburse institutions and LAs for such liabilities. Upon its formation HEFCE assumed the PCFC’s main responsibilities and now provides funding for reimbursements as follows:
• early retirement or redundancy compensation payments;
• protection of salary; and
• pension increases under the Local Government Superannuation Scheme for former non-teaching staff of institutions formerly funded by the PCFC.
HEFCE has provided for these ongoing reimbursements. As the provision estimate is based on data of all pension scheme members and uses various assumptions, the valuation obtained may vary from that which would be obtained if the data of all pension scheme members was made available to allow a full actuarial valuation. An analytical review is undertaken annually in order to verify the reasonableness of the provision. The provision value is an estimate based upon projected payments, mortality rates and other actuarial assumptions. Current assumptions mean that payments are expected to continue until at least 2041. The provision is discounted using HMT’s pension discount rate of 2.55% (2017: 0.24%).
Risk Protection Arrangement
The RPA for ATs is a scheme that provides an alternative to insurance where losses that arise are covered by government funds. The provision is based on an actuarial model of expected claims. See Note 18 for further details.
Other provisions
Provisions of less than £10 million are presented as other provisions.
Other provisions include:
• a potential breach of warranties made to investors for student loans sold that would not have been, had all information been available at the sale date. These loans will be repurchased by the Department from the SPV in July each year;
• provisions for costs of properties occupied by the Group;
• provisions for additional costs on contracts for the construction of new free schools; and
• provisions for the cost of academy closures.
Details of other provisions held by the Agencies and NDPBs can be found in their individual ARAs.

155DFE CONSOLIDATED ANNUAL REPORT AND ACCOUNTS 2017-18
17. FINANCIAL LIABILITIES AND OTHER GUARANTEES
17.1 Analysis
2018 2017
Department & Agencies Group
Department & Agencies Group
£m £m £m £m
Balance at 1 April 172 172 195 195
Movement in year (6) (6) (15) (15)
Utilisation in year (13) (13) (14) (14)
Amortisation 7 7 6 6
Balance at 31 March 160 160 172 172
Presented as:
Current liabilities 7 7 8 8
Non-current liabilities 153 153 164 164
160 160 172 172
17.2 Analysis by type – Group
2018 2017
PCDL financial
guarantee
Student loan debt sale
subsidy Total
PCDL financial
guarantee
Student loan debt sale
subsidy Total
£m £m £m £m £m £m
Balance at 1 April 29 143 172 32 163 195
Movement in year (4) (2) (6) - (15) (15)
Utilisation in year (2) (11) (13) (3) (11) (14)
Borrowing costs (unwinding of discounts)
- 7 7 - 6 6
Balance at 31 March 23 137 160 29 143 172
PCDL financial guarantee
The Professional and Career Development Loans programme operates by providing loans to learners to enable them to complete a course of study. High street banks provide the loans to learners at a rate of interest below what might ordinarily be offered to them in such circumstances. The ESFA has a liability for the cost of default on such loans and for the interest costs of the loans while the learners are in learning. Most of the liability is for the default on the loans that is classified as a financial guarantee.
Student loan debt sale subsidy
The student loan debt sale subsidy is classified within other financial liabilities and is measured at amortised cost.
The student debt sale subsidy is the additional cost to the Department arising from the government subsidising the purchaser of the debts beyond the cost that the government would have incurred had the debts remained in the public sector. This liability arose from loan sales
in 1998 and 1999. The subsidy will continue until all the loans are extinguished which is expected to be no earlier than 2028, which is the 30-year duration of the first debt sale agreement.
The annual debt sale subsidy payments are calculated according to a formula set out in the debt sale contracts signed in 1998 and 1999. The subsidy consists of two elements. The interest subsidy element of the payment is calculated as LIBOR plus margin less RPI. Margin is calculated as a percentage of the portfolio with different rates for each contract. The key risk is therefore that the gap between LIBOR and RPI increases. The other key element relates to compensation payable for loan repayments which are deferred or written off, under the terms of the original loan contracts with borrowers.

156 DFE CONSOLIDATED ANNUAL REPORT AND ACCOUNTS 2017-18
18. RISK PROTECTION ARRANGEMENT
The RPA (a replacement for commercial insurance for the academy trusts) allows the Group to comply better with Managing Public Money’s expectation that central government bodies do not purchase commercial insurance; risks should be borne internally across government.
A flat fee per pupil provides cover in four broad risk types and for two types of claimant:
• AT losses:
− Property damage and business interruption; and − UK travel.
• Non-AT claimants:
− Employers’ liability; and − Third party liability.
Claim costs are borne by the Department from existing resources; no reserves fund or portfolio of investment assets is built up to cover future claims. RPA membership is restricted to ATs and covers losses incurred at the academy site on academy business. Consequently, the risks associated with the RPA are limited to the academy schools sector within England.
No risk is ceded to re-insurance parties.
18.1 Reported balances
2018 2017
Department & Agencies Group
Department & Agencies Group
£m £m £m £m
Statement of Comprehensive Net Expenditure
Membership income (presented in Note 3) 40 40 32 32
Expected losses for the year (presented in Note 16, as provisions, provided in year)
26 26 27 27
Operational costs (presented in Note 6.1, in professional fees)
1 1 1 1
Statement of Financial Position
Unsettled claims (presented in Note 14, in other payables)
28 28 18 18
Closing RPA provision (presented in Note 16) 15 15 15 15
The table above discloses all RPA balances recognised in these accounts at all reporting levels. Membership income is collected monthly by the Group, at source from grant payments payable to ATs.
18.2 Assumptions
The Group nevertheless has insufficient internal data upon which to model realistically the Department’s expected losses, because of the relative immaturity of RPA. To resolve this, the Group has relied on the Government Actuary’s Department (GAD) to perform two formal provision reviews101 of RPA at August 2017 and as at March 2018.
The claim provisions for each class, provided by GAD, are calculated on a ‘best estimate basis’ which means that they do not contain any explicit margins for either prudence or optimism.
As the RPA has become more established, the claims activity to date has become more statistically credible for estimating future claims experience. It has therefore been reasonable to begin taking more account of actual experience and placing less reliance on the initial sector claims history survey conducted by Willis Towers Watson in 2015 and Gallagher Bassett benchmarks.
101 https://www.gov.uk/government/publications/risk-protection-arrangement-rpa-actuarial-analysis

157DFE CONSOLIDATED ANNUAL REPORT AND ACCOUNTS 2017-18
18.3 Risks
Insurance risk
Insurance risk is defined in IFRS 4 as the non-financial risk transferred to an entity in relation to insurance contracts; the risk arising from the unknown outcomes from future loss events. The Department takes on the insurance risk from ATs.
The Group mitigates insurance risk by improving risk management practice in its academies through risk management audits and reviews. The Group has retained the services of a third party insurance specialist to perform the risk management audits and drive best practice adoption.
Market risk
The Group is not exposed to market risk in relation to the RPA.
The RPA is similar to a group-wide scheme whereby insurance risk is retained within a reporting group. However, the 2016/17 separation of financial reporting of the Group and the academy sector into their own ARA has removed RPA members from this reporting group. Notwithstanding the separation, the Department is still responsible to Parliament for the academy sector and so management still consider the RPA to be in effect a ‘group-scheme’. RPA claims are settled from existing funds of the Group and no asset portfolio designed to support future payments is being created. The absence of an asset portfolio, including fair valued listed assets, and the specific nature of the cover provided removes any market risk exposure – there are no life products.
Credit risk
The Group does not consider itself to be exposed to significant credit risk.
The Group recovers membership fees from grant payments made to member ATs. In addition, the Group does not cede insurance risk to a re-insurance provider.
Liquidity risk
The Group is exposed to liquidity risk.
The absence of an underlying investment portfolio whose maturity is matched to the expected profile of claim settlements generates the Group’s liquidity risk. The Group will provide for claims expected in cover years. The settlement of claims related to past cover years will be made from resources set aside through the provisioning process.
19. RETIREMENT BENEFIT OBLIGATIONS
19.1 Equality & Human Rights Commission
EHRC pension liabilities are under a scheme broadly by analogy with the PCSPS. The broadly by analogy pension scheme is unfunded, with benefits being paid as they fall due and guaranteed by the Commission. The liabilities associated at 31 March 2018 were £1.5 million (2017: £1.5 million). Further details of the pension scheme can be found in EHRC’s ARA.102
19.2 Student Loans Company Limited
SLC operates the SLC Limited Retirement and Death Benefits Scheme for all permanent staff, which is a defined benefits scheme that provides benefits based on final pensionable salary. The scheme deficit as at 31 March 2018 was £23.2 million (2017: deficit of £40.9 million). Further details of the pension scheme can be found in SLC’s ARA.103
102 https://www.equalityhumanrights.com/en/adrodd-corfforaethol/annual-reports
103 https://www.slc.co.uk/about-us/remit/annual-report.aspx

158 DFE CONSOLIDATED ANNUAL REPORT AND ACCOUNTS 2017-18
20. CAPITAL AND OTHER COMMITMENTS
20.1 Capital commitments
Contracted and approved commitments at 31 March not otherwise included in these financial statements:
2018 2017
Department & Agencies Group
Department & Agencies Group
£m £m £m £m
Programmes:
Free schools 2,631 2,631 2,417 2,417
PSPB 195 195 335 335
National Colleges 8 8 30 30
Property, plant and equipment 81 83 66 67
Loans and Investments - - 4 4
Intangible assets - 2 - -
2,915 2,919 2,852 2,853
The majority of capital commitments relate to school projects managed by the Group. These capital commitments do not include the cost of contract workers engaged in the delivery of the programmes.
The £81 million (2016-17: £66 million) presented within the Department & Agencies column relates to the project to reconfigure the Old Admiralty Building; which will provide a new modern workplace for London based staff following relocation from Sanctuary Building.
20.2 Commitments under operating leases
Total future minimum lease payments under operating leases are given in the table below for each of the following periods.
2018 2017
Department & Agencies Group
Department & Agencies Group
£m £m £m £m
Land and buildings
Not later than one year 20 27 18 24
Later than one year and not later than five years 39 60 29 39
Later than five years 14 16 18 20
73 103 65 83
Expected receipts from sub-leases (7) (8) (8) (8)
66 95 57 75
Other
Not later than one year - - - -
Later than one year and not later than five years - 1 - 2
Later than five years - - - -
- 1 - 2

159DFE CONSOLIDATED ANNUAL REPORT AND ACCOUNTS 2017-18
20.3 Obligations under PFI contracts (on balance sheet)
Total future minimum payments under on-balance sheet PFI and other service concession arrangements are given in the table below for each of the following periods:
2018 2017
Department & Agencies Group
Department & Agencies Group
£m £m £m £m
Not later than one year 66 66 56 56
Later than one year and not later than five years 270 270 268 268
Later than five years 1,404 1,404 1,473 1,473
1,740 1,740 1,797 1,797
Under the terms of the PF2 agreement, the Group is committed to pay unitary service charges regarding each batch for the twenty-five-year operational period of the schools constructed under the financing transaction.
20.4 Other financial commitments
The Group has entered into non-cancellable contracts (which are not leases, PFI contracts or other service concession arrangements), for the previous student loan debt sale and marking key stage tests. The payments to which the Group are committed are as follows.
2018 2017
Department & Agencies Group
Department & Agencies Group
£m £m £m £m
Non-cancellable contracts
Not later than one year 40 40 29 29
Later than one year and not later than five years 49 49 55 55
Later than five years 80 80 99 99
169 169 183 183
No commitments are included here in respect of student loans, as loan repayments only become due when student attendance is confirmed at the start of each term.
20.5 Education grant funding commitments
Education grant funding commitments include: those held by ESFA for private finance initiative grants to local authorities and voluntary-aided schools; HEFCE with higher education institutions; and ESFA and ECITB with training providers.
2018 2017
Department & Agencies Group
Department & Agencies Group
£m £m £m £m
Not later than one year 1,182 1,659 1,340 4,803
Later than one year and not later than five years 3,008 3,011 3,007 4,183
Later than five years 8,250 8,250 9,002 9,002
12,440 12,920 13,349 17,988
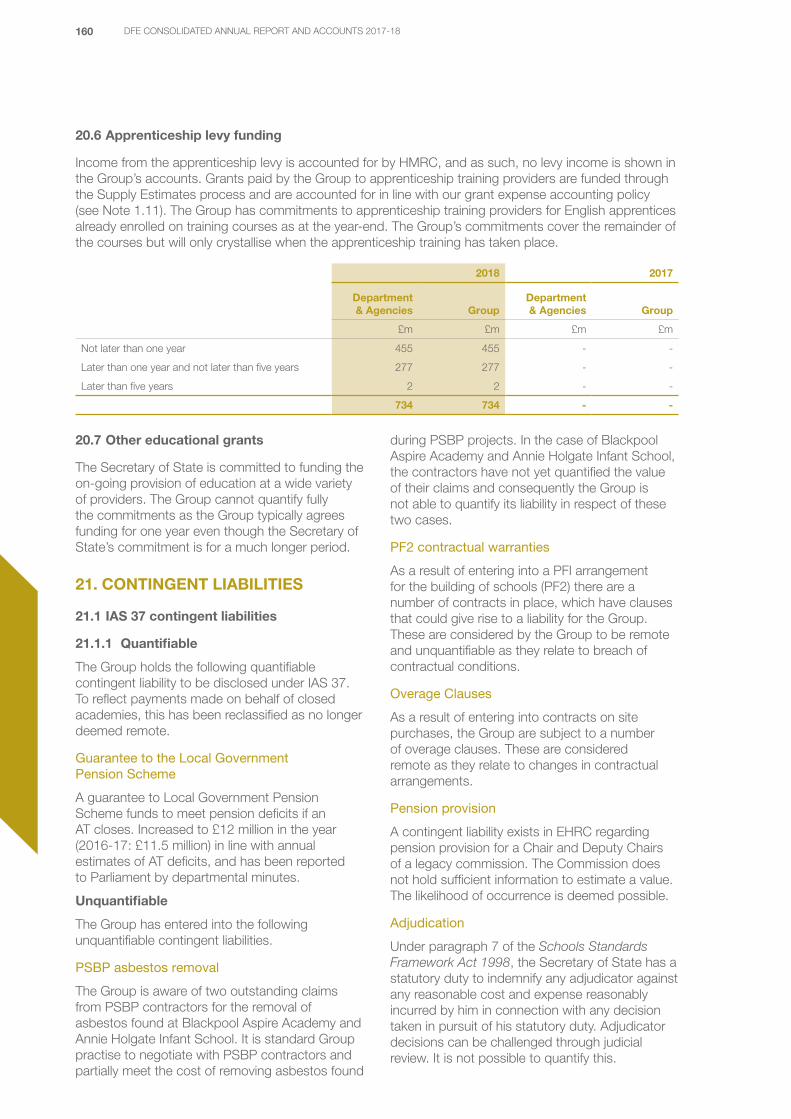
160 DFE CONSOLIDATED ANNUAL REPORT AND ACCOUNTS 2017-18
20.6 Apprenticeship levy funding
Income from the apprenticeship levy is accounted for by HMRC, and as such, no levy income is shown in the Group’s accounts. Grants paid by the Group to apprenticeship training providers are funded through the Supply Estimates process and are accounted for in line with our grant expense accounting policy (see Note 1.11). The Group has commitments to apprenticeship training providers for English apprentices already enrolled on training courses as at the year-end. The Group’s commitments cover the remainder of the courses but will only crystallise when the apprenticeship training has taken place.
2018 2017
Department & Agencies Group
Department & Agencies Group
£m £m £m £m
Not later than one year 455 455 - -
Later than one year and not later than five years 277 277 - -
Later than five years 2 2 - -
734 734 - -
20.7 Other educational grants
The Secretary of State is committed to funding the on-going provision of education at a wide variety of providers. The Group cannot quantify fully the commitments as the Group typically agrees funding for one year even though the Secretary of State’s commitment is for a much longer period.
21. CONTINGENT LIABILITIES
21.1 IAS 37 contingent liabilities
21.1.1 Quantifiable
The Group holds the following quantifiable contingent liability to be disclosed under IAS 37. To reflect payments made on behalf of closed academies, this has been reclassified as no longer deemed remote.
Guarantee to the Local Government Pension Scheme
A guarantee to Local Government Pension Scheme funds to meet pension deficits if an AT closes. Increased to £12 million in the year (2016-17: £11.5 million) in line with annual estimates of AT deficits, and has been reported to Parliament by departmental minutes.
Unquantifiable
The Group has entered into the following unquantifiable contingent liabilities.
PSBP asbestos removal
The Group is aware of two outstanding claims from PSBP contractors for the removal of asbestos found at Blackpool Aspire Academy and Annie Holgate Infant School. It is standard Group practise to negotiate with PSBP contractors and partially meet the cost of removing asbestos found
during PSBP projects. In the case of Blackpool Aspire Academy and Annie Holgate Infant School, the contractors have not yet quantified the value of their claims and consequently the Group is not able to quantify its liability in respect of these two cases.
PF2 contractual warranties
As a result of entering into a PFI arrangement for the building of schools (PF2) there are a number of contracts in place, which have clauses that could give rise to a liability for the Group. These are considered by the Group to be remote and unquantifiable as they relate to breach of contractual conditions.
Overage Clauses
As a result of entering into contracts on site purchases, the Group are subject to a number of overage clauses. These are considered remote as they relate to changes in contractual arrangements.
Pension provision
A contingent liability exists in EHRC regarding pension provision for a Chair and Deputy Chairs of a legacy commission. The Commission does not hold sufficient information to estimate a value. The likelihood of occurrence is deemed possible.
Adjudication
Under paragraph 7 of the Schools Standards Framework Act 1998, the Secretary of State has a statutory duty to indemnify any adjudicator against any reasonable cost and expense reasonably incurred by him in connection with any decision taken in pursuit of his statutory duty. Adjudicator decisions can be challenged through judicial review. It is not possible to quantify this.

161DFE CONSOLIDATED ANNUAL REPORT AND ACCOUNTS 2017-18
.21.2 Contingent assets
Legal and General PLC
Legal and General Group PLC is currently holding funds relating to the winding up of the Commission for Racial Equality Pension and Life Assurance Scheme. The trustees are in the process of winding up the scheme, which has a surplus. As the scheme was not funded by the Commission, the surplus funds will be returned to the Department. The amount and date of this are uncertain but is currently estimated to be £4.5 million.
22. RELATED PARTY TRANSACTIONS
The Department is the parent of the Agencies and sponsor of the NDPBs shown in Note 23. These bodies are regarded as related parties with which the Department has had various material transactions during the year. These are mainly financing to the Agencies and payments for grants-in-aid to the NDPBs. All such transactions have been eliminated during the preparation of these consolidated accounts.
Relationships with academy trusts, and their academies, are classified as related parties only at the AT Level which is the corporate body. Therefore, only Departmental board members who are trustees of ATs are classified as being a related party. The Department considers governors of local governing bodies for individual academies are insufficiently influential at the AT-level, not being trustees, to be classified as related parties.
In addition, the Group has had a number of transactions with other government departments, other central government bodies, local authorities and some charitable organisations. Most of these transactions have been with the BEIS and local authorities. The Department also makes pension contributions into public sector pension schemes.
As well as the disclosures in the Remuneration and Staff Report, the following relationships are also considered as related parties and have therefore been disclosed in line with IAS 24. Transactions are classified as related party transactions if they occurred during the period the board member named held office.
Disclosures are split between those individuals who were board members as at the year-end below, and those whose term as a board member ended during the year.
The following are related party disclosures for those board members in post at year end.
• Nick Gibb’s husband is a non-executive governor at CityLit, and the Chief Executive Officer of Populus Limited.
• Sam Gyimah is a minister with responsibilities in the BEIS.
• Lord Agnew is a trustee of Inspiration Trust, an academy trust that operates Charles Darwin Primary School, Cobholm Primary Academy, Cromer Academy, East Point Academy, Great Yarmouth Charter Academy, Great Yarmouth Primary Academy, Hethersett Academy, The Hewett Academy, Jane Austen College, Norwich Primary Academy, Sir Isaac Newton Sixth Form, Stradbroke Primary Academy, The Thetford Academy and Trafalgar College.
• Richard Pennycook is:
− director of The Hut Group, Fenwick, Howdens Joinery and the British Retail Consortium.
• Jonathan Slater’s wife is Chair of the education governing body for The National Centre for Young People with Epilepsy, and a member of the Committee on Standards in Public Life.
• Howard Orme was a non-executive director of Integrated Debt Services Limited.
• Ian Ferguson:
− is a director Metaswitch Networks Limited; and
− his partner is both a trustee of Edmonton Academy Trust and head teacher of the trust’s academy, Edmonton County School, which converted to academy status on 1 September 2016.
• Baroness Ruby McGregor-Smith is:
− director of Page Group PLC, which operates as Michael Page;
− trustee of Cumberland Lodge; and
− council member of the University of Bath.

162 DFE CONSOLIDATED ANNUAL REPORT AND ACCOUNTS 2017-18
Related party disclosures for those board members who were no longer board members as at the year-end are given below. The date individuals ceased to be a board member, and so cease to be included in related party disclosures, is also given below.
• Caroline Dinenage (to 14 June 2017) is a Minister with responsibilities in the Ministry of Justice.
• Joseph Johnson (to 9 January 2018) has the following related parties:
− the Foreign and Commonwealth Office as his brother is Boris Johnson, the Foreign Secretary; and
− he is a member of the Council of Management of the Ditchley Foundation.
• Lord Nash (to 28 September 2017) and his wife are trustees of Future Academies, an academy trust that operates Pimlico Academy, Pimlico Primary, Millbank Academy, Phoenix Academy and Churchill Gardens Primary Academy.
• Robert Goodwill (to 9 January 2018) is a director and 100% shareholder of Mowthorpe (UK) Limited.
• David Meller (to 24 January 2018) is:
− director and majority shareholder of Mount Street Investments;
− trustee of TBAP Foundation;
− trustee of Hertswood Academy Trust (which operates an academy of the same name);
− trustee of Harefield Academy Trust (which operates an academy of the same name);
− trustee of The Meller Educational Trust (two academies: Francis Coombe Academy and The Bushey Academy);
− trustee of The Elstree UTC, until resigning on 29 March 2017, (which operates an academy of the same name); and
− trustee of The Watford UTC, until resigning on 29 March 2017, (which operates an academy of the same name).
• Marion Plant OBE (to 22 January 2018) is:
− Chief Executive Officer and accounting officer of The Midland Academies Trust (who operate seven academies);
− trustee of both North Warwickshire and Hinckley College;
− Council member of Coventry University;
− governor at Stephenson College;
− trustee of Find a Future trading as UK World Skills; and
− trustee of the Church of England National Society.

163DFE CONSOLIDATED ANNUAL REPORT AND ACCOUNTS 2017-18
The following table shows the value of material related party transactions entered into during the year:
2017-18 2016-17
Net payments/(receipts)
Receivable/(payable)
Net payments/(receipts)
Receivable/(payable)
£000 £000 £000 £000
Government bodies
Department for Business, Energy and Industrial Strategy, (prior year restated) (3,334,138) - (2,870,780) 3,146
Ministry of Justice (766) (497) 830 43
Foreign and Commonwealth Office (89) - - -
Academy trusts
Inspiration Trust 37,957 (36) - -
Mountfields Lodge School - - 2,169 -
The Midland Academies Trust 16,592 - 14,681 43
Future Academies 20,476 - 18,533 57
Hertswood Academy 7,531 - 7,707 -
Harefield Academy Trust 4,760 - - -
The Mellor Educational Trust 12,536 - 12,771 (100)
Edmonton Academy Trust 10,653 - - -
Other education sector bodies
University of Bath 33,294 (7) 33,916 (1)
University of Hertfordshire - - 19,364 11
Coventry University 26,975 (12) 22,858 (56)
North Warwickshire and Hinckley College 14,125 - 23,946 -
TBAP Foundation 187 - 213 (379)
Non-government bodies
Page Group Plc 303 - 975 (38)
Integrated Debt Services Ltd 1,546 211 1,254 (108)
Populus Limited 284 (108) - -
Find a Future trading as UK World Skills 346 - - -
Prior year related parties
ARK Schools - - 144,986 58
Theale Green - - 5,324 170
Harpenden Academy Limited - - 1,134 -
The Elstree UTC - - 2,247 4
The Watford UTC - - 2,181 -
The Greenwich Free School - - 3,268 -
Loughborough College - - 18,566 -
Education Policy Institute (previously Centreforum) - - (19) -
Whitehall and Industry Group - - 8 -
Mitie Group Plc - - 44 -
Church of England national Society - - 700 -
The 2016-17 BEIS disclosure above has been restated to include the joint programme income received.
164 DFE CONSOLIDATED ANNUAL REPORT AND ACCOUNTS 2017-18
Apart from the above related party disclosures, no Minister, board member, key manager or other related parties have undertaken any material transactions with the Group during the year.
Transactions disclosed above for academy trusts include all transactions which occurred with their relevant academies.
23. ENTITIES WITHIN THE GROUP BOUNDARY
23.1 Closing position
The entities within the boundary during 2017-18 comprise Supply financed Agencies and those entities listed in the Designation and Amendment Orders presented to Parliament.
They are:
Executive Agency:
• Education and Skills Funding Agency (ESFA)
• National College of Teaching and Leadership (NCTL) repurposed as Teaching Regulation Agency (TRA) at 1 April 2018
• Standards and Testing Agency (STA)
Executive NDPB:
• The Construction Industry Training Board (CITB)
• Engineering Construction Industry Training Board (ECITB)
• Equalities and Human Rights Commission (EHRC)
• Film Industry Training Board (FITB)
• Higher Education Funding Council for England (HEFCE)
• Institute for Apprenticeships (IFA)
• Located Property Limited (LocatED)
• Office of the Children’s Commissioner (OCC)
• Office for Fair Access (operating name of Director of Fair Access to Higher Education) (OFFA)
• Office for Students (OfS)
• Student Loans Company Limited (SLC)
Advisory NDPB:
• School Teachers’ Review Body (STRB)
• Social Mobility Commission
Other:
• Aggregator Vehicle PLC
• Office of the Schools Adjudicator
The ARAs of all of the above can be found on GOV.UK website104 other than Student Loans Company Limited, Aggregator Vehicle PLC and Located Property Limited, which are available on Companies House.105
24. EVENTS AFTER THE REPORTING PERIOD
24.1 Movement of bodies in the Group
On 1 April 2018, the OfS took over the responsibilities that were previously held by HEFCE and OFFA.
On the same day, NCTL was repurposed into the Teaching Regulation Authority (TRA). The majority of NCTL’s operations were transferred to the Department, with only one division, the Teacher Services Division, remaining within TRA.
24.2 Authorisation
These accounts were authorised for issue by Jonathan Slater (Accounting Officer) on the date they were certified by the Comptroller and Auditor General. With the exception of the above, there have not been any other significant post year end events that have required disclosure in the accounts.
104 https://www.gov.uk/government/publications
105 https://beta.companieshouse.gov.uk/

165DFE CONSOLIDATED ANNUAL REPORT AND ACCOUNTS 2017-18

166 DFE CONSOLIDATED ANNUAL REPORT AND ACCOUNTS 2017-18

167DFE CONSOLIDATED ANNUAL REPORT AND ACCOUNTS 2017-18
ANNEXES

168 DFE CONSOLIDATED ANNUAL REPORT AND ACCOUNTS 2017-18
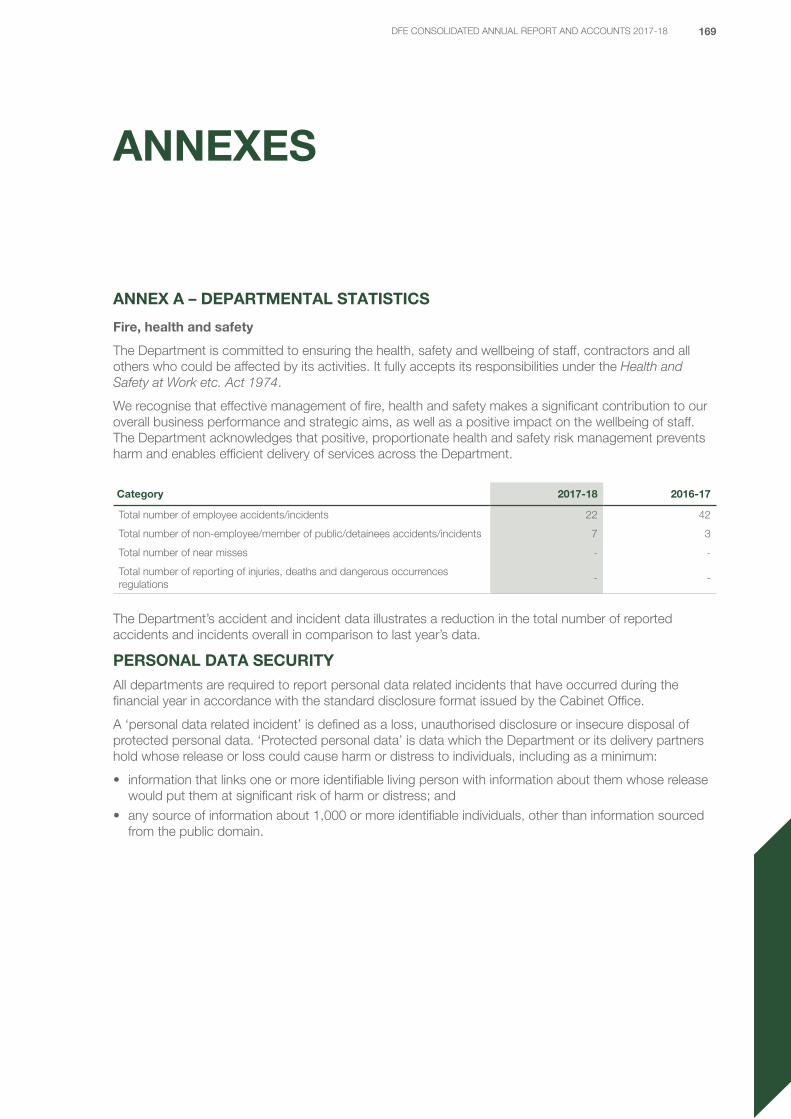
169DFE CONSOLIDATED ANNUAL REPORT AND ACCOUNTS 2017-18
ANNEXES
ANNEX A – DEPARTMENTAL STATISTICS
Fire, health and safety
The Department is committed to ensuring the health, safety and wellbeing of staff, contractors and all others who could be affected by its activities. It fully accepts its responsibilities under the Health and Safety at Work etc. Act 1974.
We recognise that effective management of fire, health and safety makes a significant contribution to our overall business performance and strategic aims, as well as a positive impact on the wellbeing of staff. The Department acknowledges that positive, proportionate health and safety risk management prevents harm and enables efficient delivery of services across the Department.
Category 2017-18 2016-17
Total number of employee accidents/incidents 22 42
Total number of non-employee/member of public/detainees accidents/incidents 7 3
Total number of near misses - -
Total number of reporting of injuries, deaths and dangerous occurrences regulations
- -
The Department’s accident and incident data illustrates a reduction in the total number of reported accidents and incidents overall in comparison to last year’s data.
PERSONAL DATA SECURITYAll departments are required to report personal data related incidents that have occurred during the financial year in accordance with the standard disclosure format issued by the Cabinet Office.
A ‘personal data related incident’ is defined as a loss, unauthorised disclosure or insecure disposal of protected personal data. ‘Protected personal data’ is data which the Department or its delivery partners hold whose release or loss could cause harm or distress to individuals, including as a minimum:
• information that links one or more identifiable living person with information about them whose release would put them at significant risk of harm or distress; and
• any source of information about 1,000 or more identifiable individuals, other than information sourced from the public domain.
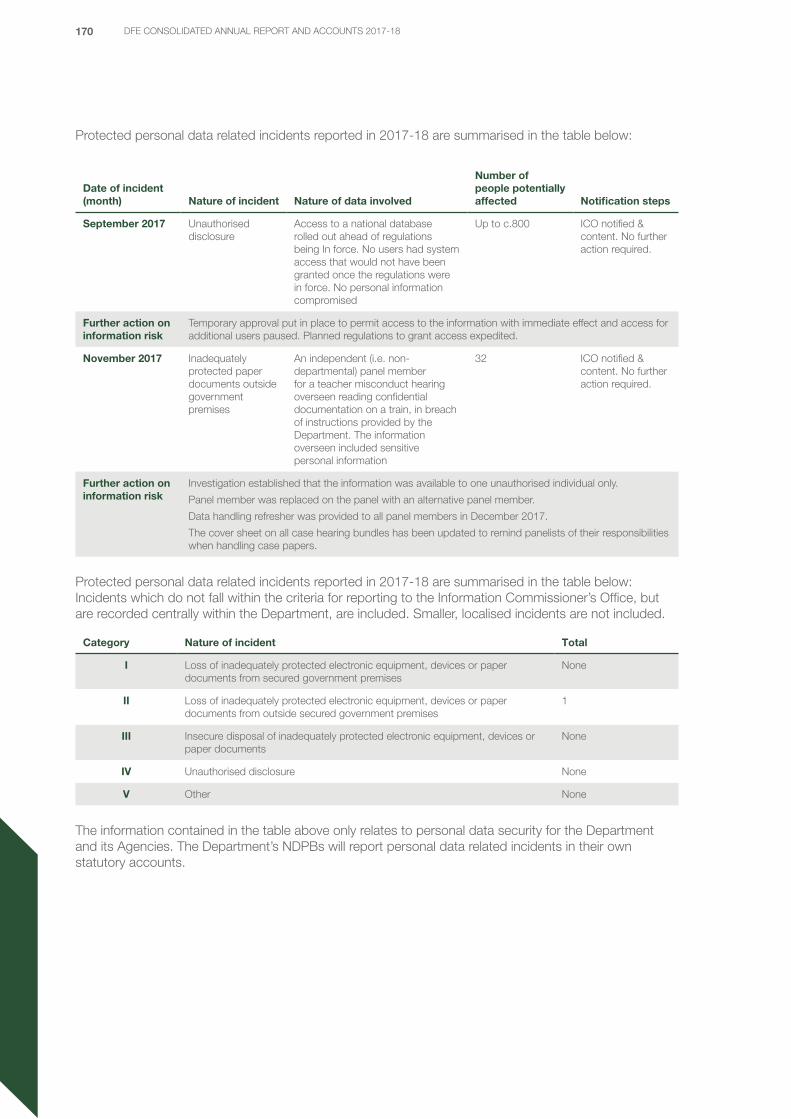
170 DFE CONSOLIDATED ANNUAL REPORT AND ACCOUNTS 2017-18
Protected personal data related incidents reported in 2017-18 are summarised in the table below:
Date of incident (month) Nature of incident Nature of data involved
Number of people potentially affected Notification steps
September 2017 Unauthorised disclosure
Access to a national database rolled out ahead of regulations being In force. No users had system access that would not have been granted once the regulations were in force. No personal information compromised
Up to c.800 ICO notified & content. No further action required.
Further action on information risk
Temporary approval put in place to permit access to the information with immediate effect and access for additional users paused. Planned regulations to grant access expedited.
November 2017 Inadequately protected paper documents outside government premises
An independent (i.e. non-departmental) panel member for a teacher misconduct hearing overseen reading confidential documentation on a train, in breach of instructions provided by the Department. The information overseen included sensitive personal information
32 ICO notified & content. No further action required.
Further action on information risk
Investigation established that the information was available to one unauthorised individual only.
Panel member was replaced on the panel with an alternative panel member.
Data handling refresher was provided to all panel members in December 2017.
The cover sheet on all case hearing bundles has been updated to remind panelists of their responsibilities when handling case papers.
Protected personal data related incidents reported in 2017-18 are summarised in the table below: Incidents which do not fall within the criteria for reporting to the Information Commissioner’s Office, but are recorded centrally within the Department, are included. Smaller, localised incidents are not included.
Category Nature of incident Total
I Loss of inadequately protected electronic equipment, devices or paper documents from secured government premises
None
II Loss of inadequately protected electronic equipment, devices or paper documents from outside secured government premises
1
III Insecure disposal of inadequately protected electronic equipment, devices or paper documents
None
IV Unauthorised disclosure None
V Other None
The information contained in the table above only relates to personal data security for the Department and its Agencies. The Department’s NDPBs will report personal data related incidents in their own statutory accounts.
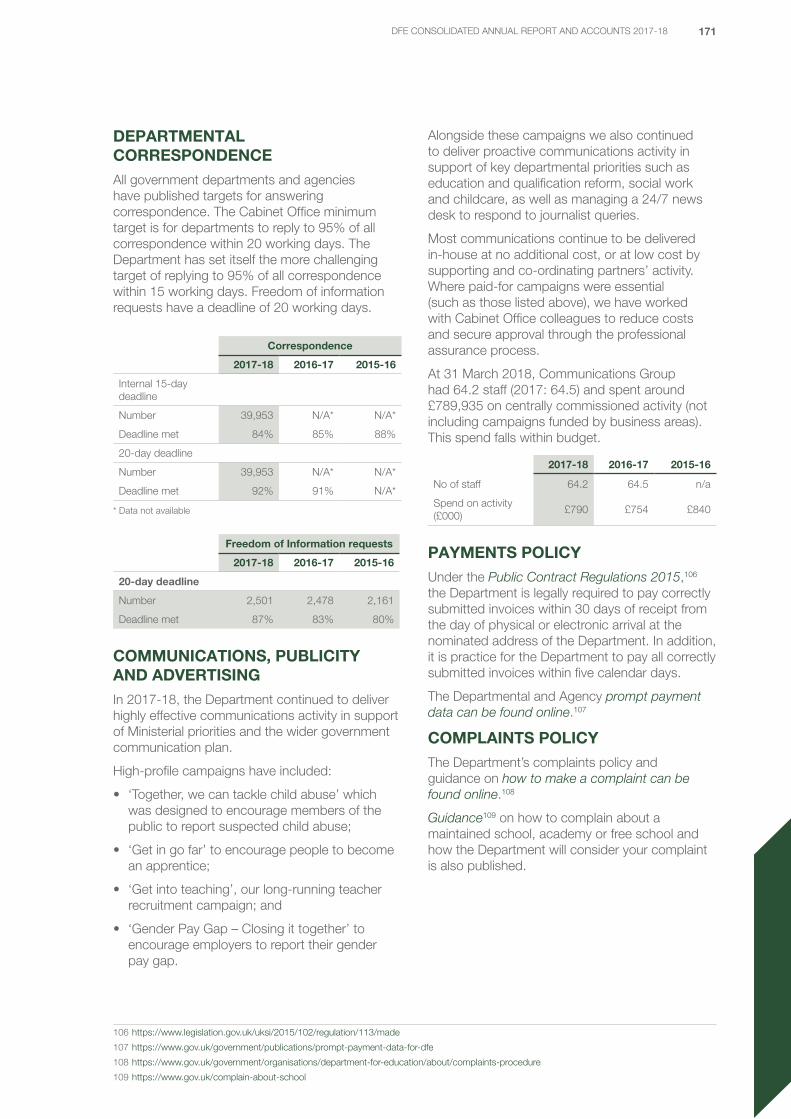
171DFE CONSOLIDATED ANNUAL REPORT AND ACCOUNTS 2017-18
DEPARTMENTAL CORRESPONDENCEAll government departments and agencies have published targets for answering correspondence. The Cabinet Office minimum target is for departments to reply to 95% of all correspondence within 20 working days. The Department has set itself the more challenging target of replying to 95% of all correspondence within 15 working days. Freedom of information requests have a deadline of 20 working days.
Correspondence
2017-18 2016-17 2015-16
Internal 15-day deadline
Number 39,953 N/A* N/A*
Deadline met 84% 85% 88%
20-day deadline
Number 39,953 N/A* N/A*
Deadline met 92% 91% N/A*
* Data not available
Freedom of Information requests
2017-18 2016-17 2015-16
20-day deadline
Number 2,501 2,478 2,161
Deadline met 87% 83% 80%
COMMUNICATIONS, PUBLICITY AND ADVERTISINGIn 2017-18, the Department continued to deliver highly effective communications activity in support of Ministerial priorities and the wider government communication plan.
High-profile campaigns have included:
• ‘Together, we can tackle child abuse’ which was designed to encourage members of the public to report suspected child abuse;
• ‘Get in go far’ to encourage people to become an apprentice;
• ‘Get into teaching’, our long-running teacher recruitment campaign; and
• ‘Gender Pay Gap – Closing it together’ to encourage employers to report their gender pay gap.
Alongside these campaigns we also continued to deliver proactive communications activity in support of key departmental priorities such as education and qualification reform, social work and childcare, as well as managing a 24/7 news desk to respond to journalist queries.
Most communications continue to be delivered in-house at no additional cost, or at low cost by supporting and co-ordinating partners’ activity. Where paid-for campaigns were essential (such as those listed above), we have worked with Cabinet Office colleagues to reduce costs and secure approval through the professional assurance process.
At 31 March 2018, Communications Group had 64.2 staff (2017: 64.5) and spent around £789,935 on centrally commissioned activity (not including campaigns funded by business areas). This spend falls within budget.
2017-18 2016-17 2015-16
No of staff 64.2 64.5 n/a
Spend on activity (£000)
£790 £754 £840
PAYMENTS POLICYUnder the Public Contract Regulations 2015,106 the Department is legally required to pay correctly submitted invoices within 30 days of receipt from the day of physical or electronic arrival at the nominated address of the Department. In addition, it is practice for the Department to pay all correctly submitted invoices within five calendar days.
The Departmental and Agency prompt payment data can be found online.107
COMPLAINTS POLICYThe Department’s complaints policy and guidance on how to make a complaint can be found online.108
Guidance109 on how to complain about a maintained school, academy or free school and how the Department will consider your complaint is also published.
106 https://www.legislation.gov.uk/uksi/2015/102/regulation/113/made
107 https://www.gov.uk/government/publications/prompt-payment-data-for-dfe
108 https://www.gov.uk/government/organisations/department-for-education/about/complaints-procedure
109 https://www.gov.uk/complain-about-school
172 DFE CONSOLIDATED ANNUAL REPORT AND ACCOUNTS 2017-18
COMPLAINTS TO THE PARLIAMENTARY OMBUDSMAN
Depart ESFA NCTL OCC
Enquiries received 19 3 1 -
Complaints assessed 10 2 - 1
Complaints resolved through intervention
- - - -
Complaints accepted for investigation
8 - - -
Investigations upheld or partly upheld
- 1 - -
Investigations not upheld
4 - - -
Investigations resolved without a finding
- - - -
Investigations discontinued
1 - - -
Number of recommendations
unk - - -
Number of recommendations complied with
unk - - -
The Parliamentary and Health Service Ombudsman can look into complaints about a service provided by the NHS or a government department, agency or other organisation acting on their behalf providing that the body falls within its jurisdiction and that it has been referred to the Ombudsman by an MP.
The table above shows the complaints about the Group in 2017-18. This is the most up-to-date information at the time of reporting. Cases which relate to LAs and schools (where most of the services are delivered to the public) are outside the jurisdiction of the Parliamentary and Health Service Ombudsman.
Investigations resolved without a finding are complaints where the Parliamentary Ombudsman starts an investigation but are able to resolve the complaint without having to formally complete the investigation.
Investigations discontinued are complaints where the Parliamentary Ombudsman ends the investigation for a variety of reasons, for example, because the complainant asked them to.
EFFECTIVENESS OF WHISTLEBLOWING ARRANGEMENTSManagement Committee discussed the effectiveness of the Department’s whistleblowing arrangements in September’s Management Committee meeting. Since April 2014, the Department has recorded 16 cases of whistleblowing. All cases have been investigated and brought to a conclusion. The outcome of
the discussion was that the Department has adopted some good practices in terms of the whistleblowing arrangements and it is evident there is ongoing commitment to whistleblowing:
• the Department has implemented the full suite of Civil Service Employee Policy (CS Employee Policy) Whistleblowing and Raising a Concern Policy and procedures, following the report into whistleblowing by the PAC on the recommendations made by the NAO on whistleblowing and raising and concern within the public sector;
• an independent, external and confidential whistleblowing helpline service was launched on 1 February 2016;
• members of the Department’s SCS act as Nominated Officers to support whistle-blowers and act as a central point of contact for any investigation; and
• the CS Employee Policy Whistleblowing Gateway was published on the Department’s intranet in October 2016 as an additional tool to support employees and managers to navigate the policy.
There is still a tendency for individuals to report cases anonymously which does not allow for a full investigation. We have reviewed all the activities we have undertaken in the last 12 months to fully assess whether we have an effective process in place for raising whistleblowing concerns as well as a strong culture in place where employees feel comfortable to speak up. The Department therefore continues to promote the policy and the protection afforded to whistle-blowers in a number of ways:
• the scripts used by our confidential whistleblowing helpline have been reviewed to encourage individuals to disclose their names when raising a concern;
• we have taken part in a cross Civil Service campaign to raise awareness of whistleblowing which included news articles and posters; and
• the CS Commissioner delivered a session to HR policy colleagues and Nominated Officers to provide further understanding of the raising a concern under the Civil Service Code and investigations.
SPONSORSHIP AGREEMENTS OVER £5,000 There were no sponsorship agreements in the year (2016-17: none).

173DFE CONSOLIDATED ANNUAL REPORT AND ACCOUNTS 2017-18
AN
NE
X B
– D
AT
A T
AB
LES
TA
BLE
1: T
OT
AL
DE
PA
RT
ME
NT
AL
SP
EN
DIN
G
Sum
mar
y
2013
-14
2014
-15
2015
-16
2016
-17
2017
-18
2018
-19
2019
-20
Out
turn
Out
turn
Out
turn
Out
turn
Out
turn
Pla
nsP
lans
£m£m
£m£m
£m£m
£m
Res
ourc
e D
EL
64,6
4262
,202
62,4
7168
,280
73,3
3366
,469
67,7
21
Res
ourc
e A
ME
(499
)(1
,137
)(8
,197
)(1
,841
)(1
,589
)(3
,222
)(3
,586
)
To
tal r
eso
urce
64,1
4361
,065
54,2
7466
,439
71,7
4463
,247
64,1
35
Cap
ital D
EL
4,11
94,
763
5,06
95,
732
4,90
85,
183
5,09
7
Cap
ital A
ME
8,48
310
,563
11,6
4213
,073
15,7
7118
,635
21,5
38
To
tal c
apit
al12
,602
15,3
2616
,711
18,8
0520
,679
23,8
1826
,635
76,7
4576
,391
70,9
8585
,244
92,4
2387
,065
90,7
70
Less
dep
reci
atio
n(6
,246
)(1
,994
)3,
551
(8,7
35)
(11,
386)
(3,9
51)
(4,2
91)
To
tal D
epar
tmen
tal s
pen
din
g70
,499
74,3
9774
,536
76,5
0981
,037
83,1
1486
,479
Of w
hich
:
Tota
l DE
L63
,282
65,5
7763
,948
65,2
7766
,856
67,7
0468
,530
Tota
l AM
E7,
217
8,82
010
,588
11,2
3214
,181
15,4
1017
,949
Tota
l Dep
artm
enta
l spe
ndin
g is
the
sum
of t
he re
sour
ce b
udge
t and
the
capi
tal b
udge
t les
s de
prec
iatio
n. S
imila
rly, t
otal
DE
L is
the
sum
of t
he re
sour
ce b
udge
t DE
L an
d ca
pita
l bud
get D
EL
less
dep
reci
atio
n, a
nd to
tal A
ME
is th
e su
m o
f res
ourc
e bu
dget
AM
E a
nd c
apita
l bud
get A
ME
less
dep
reci
atio
n in
AM
E.
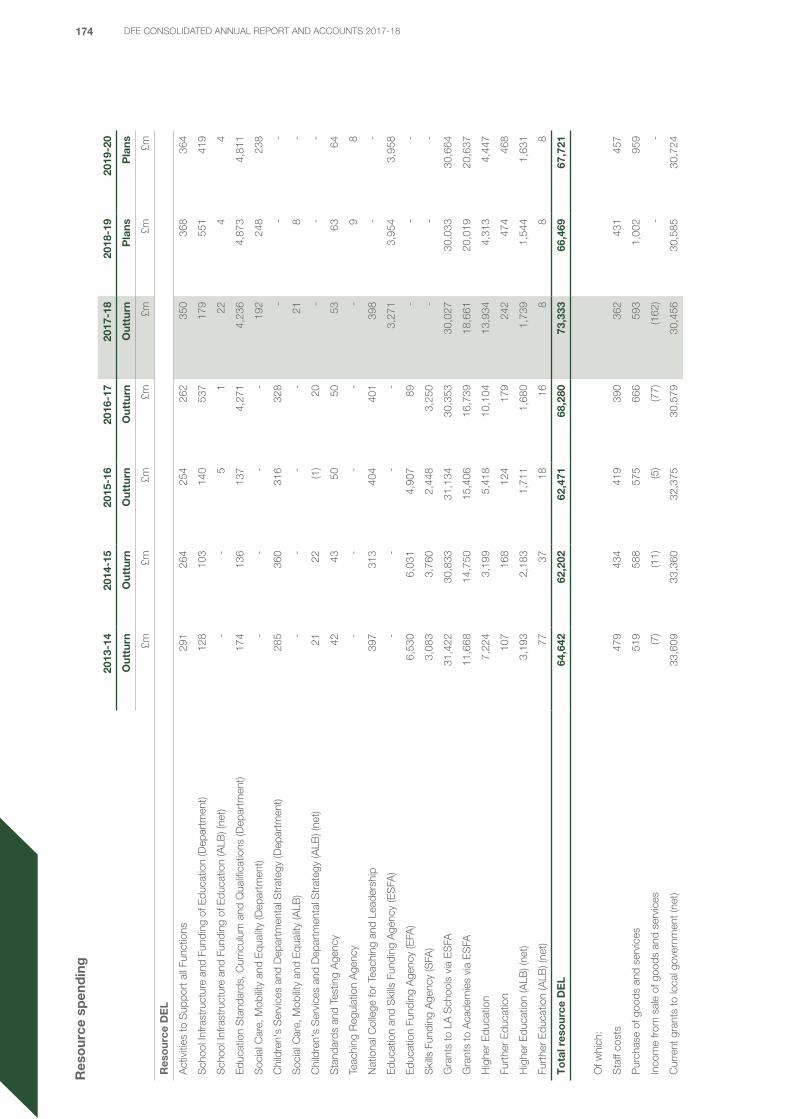
174 DFE CONSOLIDATED ANNUAL REPORT AND ACCOUNTS 2017-18
Res
our
ce s
pen
din
g
2013
-14
2014
-15
2015
-16
2016
-17
2017
-18
2018
-19
2019
-20
Out
turn
Out
turn
Out
turn
Out
turn
Out
turn
Pla
nsP
lans
£m£m
£m£m
£m£m
£m
Res
our
ce D
EL
Act
iviti
es to
Sup
port
all
Func
tions
291
264
254
262
350
368
364
Sch
ool I
nfra
stru
ctur
e an
d Fu
ndin
g of
Edu
catio
n (D
epar
tmen
t)12
810
314
053
717
955
141
9
Sch
ool I
nfra
stru
ctur
e an
d Fu
ndin
g of
Edu
catio
n (A
LB) (
net)
--
51
224
4
Edu
catio
n S
tand
ards
, Cur
ricul
um a
nd Q
ualifi
catio
ns (D
epar
tmen
t)17
413
613
74,
271
4,23
64,
873
4,81
1
Soc
ial C
are,
Mob
ility
and
Equ
ality
(Dep
artm
ent)
--
--
192
248
238
Chi
ldre
n's
Ser
vice
s an
d D
epar
tmen
tal S
trat
egy
(Dep
artm
ent)
285
360
316
328
--
-
Soc
ial C
are,
Mob
ility
and
Equ
ality
(ALB
)-
--
-21
8-
Chi
ldre
n's
Ser
vice
s an
d D
epar
tmen
tal S
trat
egy
(ALB
) (ne
t)21
22(1
)20
--
-
Sta
ndar
ds a
nd T
estin
g A
genc
y42
4350
5053
6364
Teac
hing
Reg
ulat
ion
Age
ncy
--
--
-9
8
Nat
iona
l Col
lege
for
Teac
hing
and
Lea
ders
hip
397
313
404
401
398
--
Edu
catio
n an
d S
kills
Fun
ding
Age
ncy
(ES
FA)
--
--
3,27
13,
954
3,95
8
Edu
catio
n Fu
ndin
g A
genc
y (E
FA)
6,53
06,
031
4,90
789
--
-
Ski
lls F
undi
ng A
genc
y (S
FA)
3,08
33,
760
2,44
83,
250
--
-
Gra
nts
to L
A S
choo
ls v
ia E
SFA
31,4
2230
,833
31,1
3430
,353
30,0
2730
,033
30,6
64
Gra
nts
to A
cade
mie
s vi
a E
SFA
11,6
6814
,750
15,4
0616
,739
18,6
6120
,019
20,6
37
Hig
her
Edu
catio
n7,
224
3,19
95,
418
10,1
0413
,934
4,31
34,
447
Furt
her
Edu
catio
n10
716
812
417
924
247
446
8
Hig
her
Edu
catio
n (A
LB) (
net)
3,19
32,
183
1,71
11,
680
1,73
91,
544
1,63
1
Furt
her
Edu
catio
n (A
LB) (
net)
7737
1816
88
8
To
tal r
eso
urce
DE
L64
,642
62,2
0262
,471
68,2
8073
,333
66,4
6967
,721
Of w
hich
:
Sta
ff co
sts
479
434
419
390
362
431
457
Pur
chas
e of
goo
ds a
nd s
ervi
ces
519
588
575
666
593
1,00
295
9
Inco
me
from
sal
e of
goo
ds a
nd s
ervi
ces
(7)
(11)
(5)
(77)
(162
)-
-
Cur
rent
gra
nts
to lo
cal g
over
nmen
t (ne
t)33
,609
33,3
6032
,375
30,5
7930
,456
30,5
8530
,724

175DFE CONSOLIDATED ANNUAL REPORT AND ACCOUNTS 2017-18
2013
-14
2014
-15
2015
-16
2016
-17
2017
-18
2018
-19
2019
-20
Out
turn
Out
turn
Out
turn
Out
turn
Out
turn
Pla
nsP
lans
£m£m
£m£m
£m£m
£m
Cur
rent
gra
nts
to p
erso
ns a
nd n
on-p
rofit
bod
ies
(net
)13
,104
12,0
629,
849
10,6
9411
,982
10,7
4110
,935
Cur
rent
gra
nts
abro
ad (n
et)
(159
)(2
48)
(204
)(3
1)(2
02)
(250
)(2
50)
Sub
sidi
es to
priv
ate
sect
or c
ompa
nies
810
12-
--
11
Sub
sidi
es to
pub
lic c
orpo
ratio
ns-
3-
6-
--
Ren
tals
2420
1617
222
3323
Dep
reci
atio
n5,
479
1,38
83,
592
8,73
511
,385
3,94
84,
288
Take
up
of p
rovi
sion
s-
--
--
-11
Cha
nges
in p
ensi
on s
chem
e lia
bilit
ies
--
--
--
-
Oth
er re
sour
ce11
,586
14,5
9615
,842
17,1
4618
,897
19,9
7920
,563
Res
our
ce A
ME
Act
iviti
es to
Sup
port
all
Func
tions
(Dep
artm
ent)
(10)
(5)
-21
(10)
(9)
(86)
Act
iviti
es to
Sup
port
all
Func
tions
(ALB
)(1
)-
--
--
-
Exe
cutiv
e A
genc
ies
(exc
. SFA
)11
(6)
(7)
4(5
)-
-
Ski
lls F
undi
ng A
genc
y-
-4
(3)
--
-
Hig
her
Edu
catio
n(5
35)
(1,1
00)
(8,1
40)
(1,8
82)
(1,6
21)
(3,1
95)
(3,4
89)
Furt
her
Edu
catio
n(1
)(8
)(2
6)12
(13)
--
Hig
her
Edu
catio
n (A
LB) (
net)
33(2
9)(3
0)(3
3)(1
4)(1
8)(1
1)
Furt
her
Edu
catio
n (A
LB) (
net)
411
240
74-
-
To
tal R
eso
urce
AM
E(4
99)
(1,1
37)
(8,1
97)
(1,8
41)
(1,5
89)
(3,2
22)
(3,5
86)
Of w
hich
:
Sta
ff co
sts
6559
75-
6450
45
Pur
chas
e of
goo
ds a
nd s
ervi
ces
9894
198
104
7422
823
8
Inco
me
from
sal
es o
f goo
ds a
nd s
ervi
ces
(105
)(1
01)
(119
)-
(110
)(8
9)(8
5)
Cur
rent
gra
nts
to p
erso
ns a
nd n
on-p
rofit
bod
ies
(net
)19
25-
-28
424
25

176 DFE CONSOLIDATED ANNUAL REPORT AND ACCOUNTS 2017-18
2013
-14
2014
-15
2015
-16
2016
-17
2017
-18
2018
-19
2019
-20
Out
turn
Out
turn
Out
turn
Out
turn
Out
turn
Pla
nsP
lans
£m£m
£m£m
£m£m
£m
Sub
sidi
es to
priv
ate
sect
or c
ompa
nies
-13
715
7-
--
-
Ren
tals
11
1-
2-
-
Dep
reci
atio
n76
760
6(7
,143
)-
13
3
Take
up
of p
rovi
sion
s12
7(1
8)79
3925
59
Rel
ease
of p
rovi
sion
s(8
3)(7
1)(7
6)(5
8)(4
4)(9
0)(1
03)
Cha
nge
in p
ensi
on s
chem
e lia
bilit
ies
45
--
(15)
55
Unw
indi
ng o
f the
dis
coun
t rat
e on
pen
sion
sch
eme
liabi
litie
s1
16
--
44
Oth
er re
sour
ce(1
,393
)(1
,875
)(1
,375
)(1
,926
)(1
,870
)(3
,362
)(3
,727
)
To
tal r
eso
urce
bud
get
64,1
4361
,065
54,2
7466
,439
71,7
4463
,247
64,1
35
Of w
hich
:
Dep
reci
atio
n6,
246
1,99
4(3
,551
)8,
735
11,3
863,
951
4,29
1
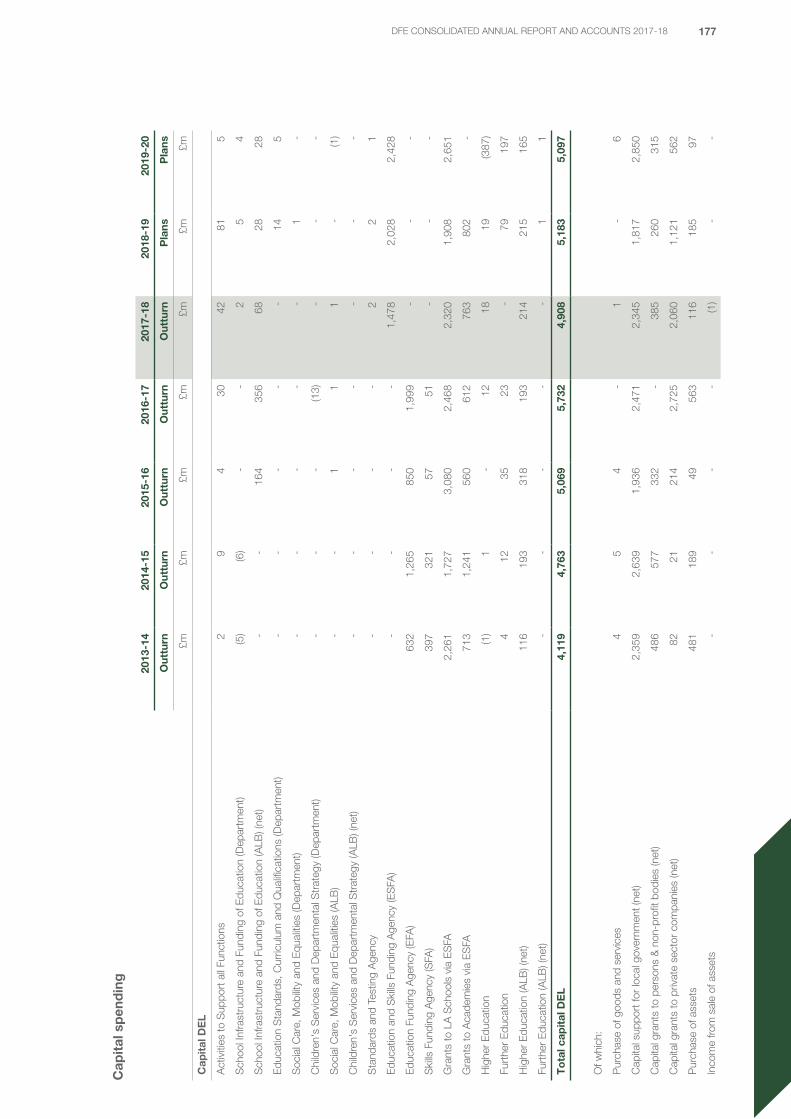
177DFE CONSOLIDATED ANNUAL REPORT AND ACCOUNTS 2017-18
Cap
ital
sp
end
ing
2013
-14
2014
-15
2015
-16
2016
-17
2017
-18
2018
-19
2019
-20
Out
turn
Out
turn
Out
turn
Out
turn
Out
turn
Pla
nsP
lans
£m£m
£m£m
£m£m
£m
Cap
ital
DE
L
Act
iviti
es to
Sup
port
all
Func
tions
29
430
4281
5
Sch
ool I
nfra
stru
ctur
e an
d Fu
ndin
g of
Edu
catio
n (D
epar
tmen
t)(5
)(6
)-
-2
54
Sch
ool I
nfra
stru
ctur
e an
d Fu
ndin
g of
Edu
catio
n (A
LB) (
net)
--
164
356
6828
28
Edu
catio
n S
tand
ards
, Cur
ricul
um a
nd Q
ualifi
catio
ns (D
epar
tmen
t)-
--
--
145
Soc
ial C
are,
Mob
ility
and
Equ
aliti
es (D
epar
tmen
t)-
--
--
1-
Chi
ldre
n's
Ser
vice
s an
d D
epar
tmen
tal S
trat
egy
(Dep
artm
ent)
--
-(1
3)-
--
Soc
ial C
are,
Mob
ility
and
Equ
aliti
es (A
LB)
--
11
1-
(1)
Chi
ldre
n's
Ser
vice
s an
d D
epar
tmen
tal S
trat
egy
(ALB
) (ne
t)-
--
--
--
Sta
ndar
ds a
nd T
estin
g A
genc
y-
--
-2
21
Edu
catio
n an
d S
kills
Fun
ding
Age
ncy
(ES
FA)
--
--
1,47
82,
028
2,42
8
Edu
catio
n Fu
ndin
g A
genc
y (E
FA)
632
1,26
585
01,
999
--
-
Ski
lls F
undi
ng A
genc
y (S
FA)
397
321
5751
--
-
Gra
nts
to L
A S
choo
ls v
ia E
SFA
2,26
11,
727
3,08
02,
468
2,32
01,
908
2,65
1
Gra
nts
to A
cade
mie
s vi
a E
SFA
713
1,24
156
061
276
380
2-
Hig
her
Edu
catio
n(1
)1
-12
1819
(387
)
Furt
her
Edu
catio
n4
1235
23-
7919
7
Hig
her
Edu
catio
n (A
LB) (
net)
116
193
318
193
214
215
165
Furt
her
Edu
catio
n (A
LB) (
net)
--
--
-1
1
To
tal c
apit
al D
EL
4,11
94,
763
5,06
95,
732
4,90
85,
183
5,09
7
Of w
hich
:
Pur
chas
e of
goo
ds a
nd s
ervi
ces
45
4-
1-
6
Cap
ital s
uppo
rt fo
r lo
cal g
over
nmen
t (ne
t)2,
359
2,63
91,
936
2,47
12,
345
1,81
72,
850
Cap
ital g
rant
s to
per
sons
& n
on-p
rofit
bod
ies
(net
)48
657
733
2-
385
260
315
Cap
ital g
rant
s to
priv
ate
sect
or c
ompa
nies
(net
)82
2121
42,
725
2,06
01,
121
562
Pur
chas
e of
ass
ets
481
189
4956
311
618
597
Inco
me
from
sal
e of
ass
ets
--
--
(1)
--
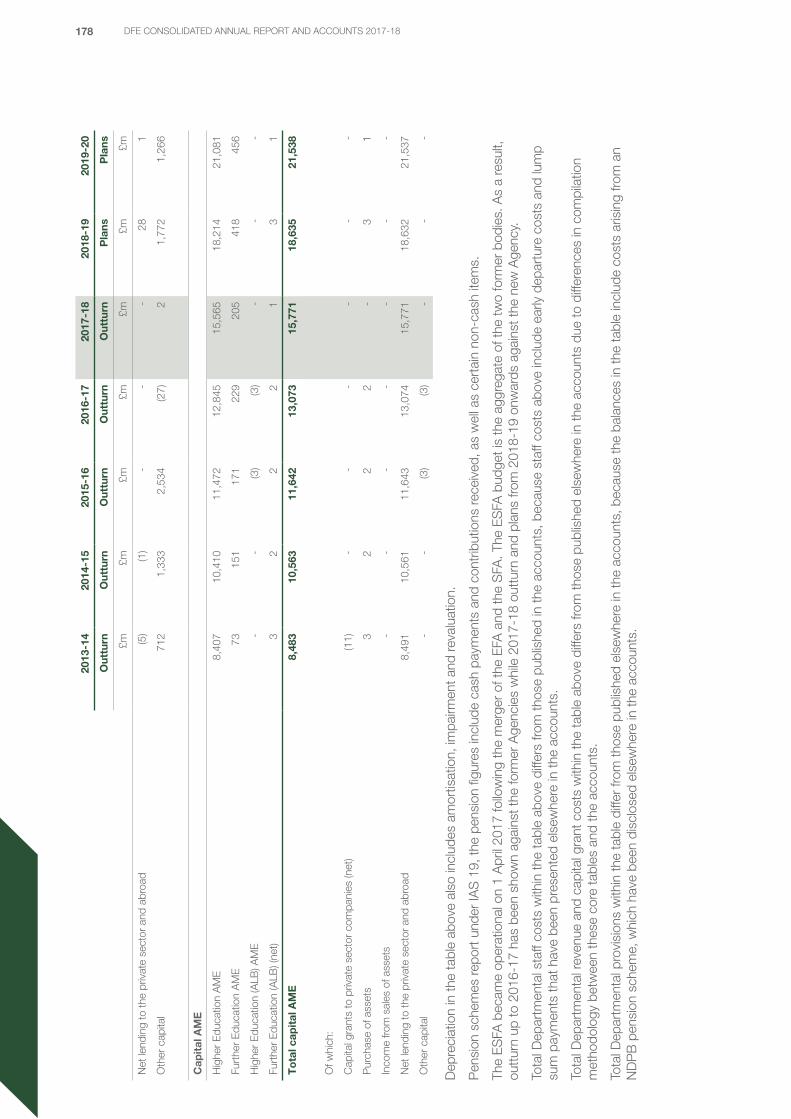
178 DFE CONSOLIDATED ANNUAL REPORT AND ACCOUNTS 2017-18
2013
-14
2014
-15
2015
-16
2016
-17
2017
-18
2018
-19
2019
-20
Out
turn
Out
turn
Out
turn
Out
turn
Out
turn
Pla
nsP
lans
£m£m
£m£m
£m£m
£m
Net
lend
ing
to th
e pr
ivat
e se
ctor
and
abr
oad
(5)
(1)
--
-28
1
Oth
er c
apita
l71
21,
333
2,53
4(2
7)2
1,77
21,
266
Cap
ital
AM
E
Hig
her
Edu
catio
n A
ME
8,40
710
,410
11,4
7212
,845
15,5
6518
,214
21,0
81
Furt
her
Edu
catio
n A
ME
7315
117
122
920
541
845
6
Hig
her
Edu
catio
n (A
LB) A
ME
--
(3)
(3)
--
-
Furt
her
Edu
catio
n (A
LB) (
net)
32
22
13
1
To
tal c
apit
al A
ME
8,48
310
,563
11,6
4213
,073
15,7
7118
,635
21,5
38
Of w
hich
:
Cap
ital g
rant
s to
priv
ate
sect
or c
ompa
nies
(net
)(1
1)-
--
--
-
Pur
chas
e of
ass
ets
32
22
-3
1
Inco
me
from
sal
es o
f ass
ets
--
--
--
-
Net
lend
ing
to th
e pr
ivat
e se
ctor
and
abr
oad
8,49
110
,561
11,6
4313
,074
15,7
7118
,632
21,5
37
Oth
er c
apita
l-
-(3
)(3
)-
--
Dep
reci
atio
n in
the
tabl
e ab
ove
also
incl
udes
am
ortis
atio
n, im
pairm
ent a
nd re
valu
atio
n.
Pen
sion
sch
emes
repo
rt u
nder
IAS
19,
the
pens
ion
figur
es in
clud
e ca
sh p
aym
ents
and
con
trib
utio
ns re
ceiv
ed, a
s w
ell a
s ce
rtai
n no
n-ca
sh it
ems.
The
ES
FA b
ecam
e op
erat
iona
l on
1 A
pril
2017
follo
win
g th
e m
erge
r of
the
EFA
and
the
SFA
. The
ES
FA b
udge
t is
the
aggr
egat
e of
the
two
form
er b
odie
s. A
s a
resu
lt,
outt
urn
up to
201
6-17
has
bee
n sh
own
agai
nst t
he fo
rmer
Age
ncie
s w
hile
201
7-18
out
turn
and
pla
ns fr
om 2
018-
19 o
nwar
ds a
gain
st th
e ne
w A
genc
y.
Tota
l Dep
artm
enta
l sta
ff co
sts
with
in th
e ta
ble
abov
e di
ffers
from
thos
e pu
blis
hed
in th
e ac
coun
ts, b
ecau
se s
taff
cost
s ab
ove
incl
ude
early
dep
artu
re c
osts
and
lum
p su
m p
aym
ents
that
hav
e be
en p
rese
nted
els
ewhe
re in
the
acco
unts
.
Tota
l Dep
artm
enta
l rev
enue
and
cap
ital g
rant
cos
ts w
ithin
the
tabl
e ab
ove
diffe
rs fr
om th
ose
publ
ishe
d el
sew
here
in th
e ac
coun
ts d
ue to
diff
eren
ces
in c
ompi
latio
n m
etho
dolo
gy b
etw
een
thes
e co
re ta
bles
and
the
acco
unts
.
Tota
l Dep
artm
enta
l pro
visi
ons
with
in th
e ta
ble
diffe
r fro
m th
ose
publ
ishe
d el
sew
here
in th
e ac
coun
ts, b
ecau
se th
e ba
lanc
es in
the
tabl
e in
clud
e co
sts
aris
ing
from
an
ND
PB
pen
sion
sch
eme,
whi
ch h
ave
been
dis
clos
ed e
lsew
here
in th
e ac
coun
ts.
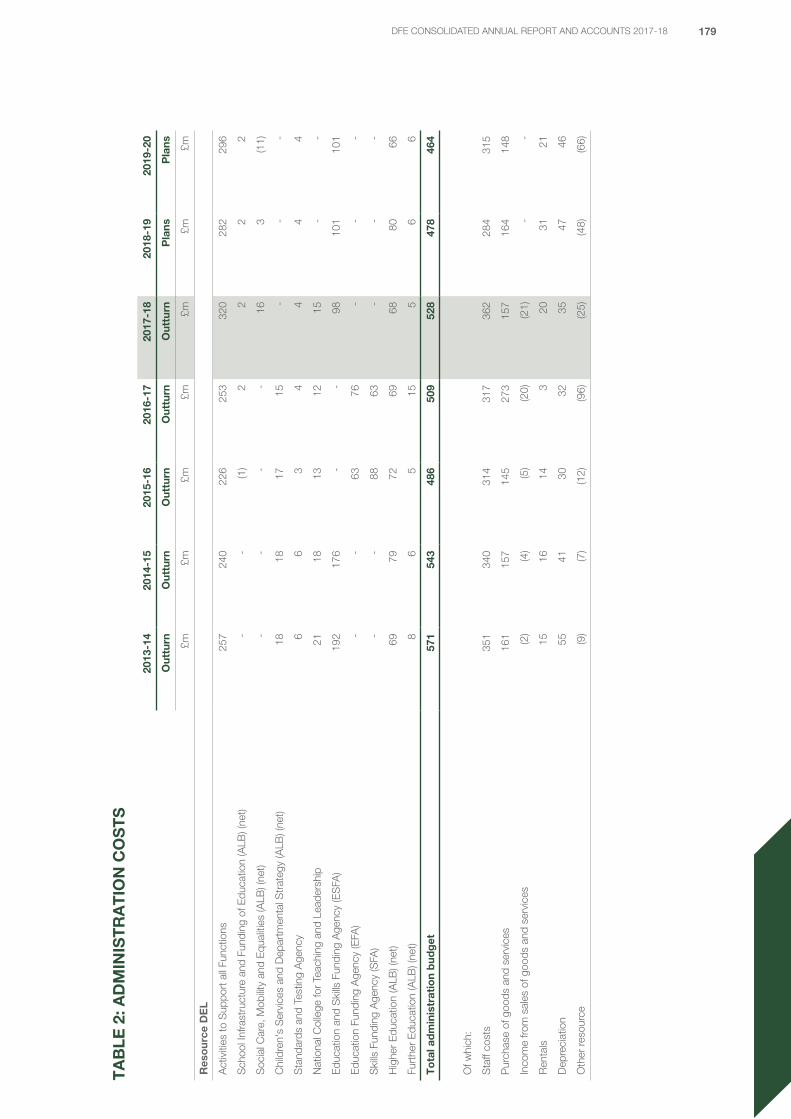
179DFE CONSOLIDATED ANNUAL REPORT AND ACCOUNTS 2017-18
TA
BLE
2: A
DM
INIS
TR
AT
ION
CO
ST
S
2013
-14
2014
-15
2015
-16
2016
-17
2017
-18
2018
-19
2019
-20
Out
turn
Out
turn
Out
turn
Out
turn
Out
turn
Pla
nsP
lans
£m£m
£m£m
£m£m
£m
Res
our
ce D
EL
Act
iviti
es to
Sup
port
all
Func
tions
257
240
226
253
320
282
296
Sch
ool I
nfra
stru
ctur
e an
d Fu
ndin
g of
Edu
catio
n (A
LB) (
net)
--
(1)
22
22
Soc
ial C
are,
Mob
ility
and
Equ
aliti
es (A
LB) (
net)
--
--
163
(11)
Chi
ldre
n's
Ser
vice
s an
d D
epar
tmen
tal S
trat
egy
(ALB
) (ne
t)18
1817
15-
--
Sta
ndar
ds a
nd T
estin
g A
genc
y6
63
44
44
Nat
iona
l Col
lege
for
Teac
hing
and
Lea
ders
hip
2118
1312
15-
-
Edu
catio
n an
d S
kills
Fun
ding
Age
ncy
(ES
FA)
192
176
--
9810
110
1
Edu
catio
n Fu
ndin
g A
genc
y (E
FA)
--
6376
--
-
Ski
lls F
undi
ng A
genc
y (S
FA)
--
8863
--
-
Hig
her
Edu
catio
n (A
LB) (
net)
6979
7269
6880
66
Furt
her
Edu
catio
n (A
LB) (
net)
86
515
56
6
To
tal a
dm
inis
trat
ion
bud
get
571
543
486
509
528
478
464
Of w
hich
:
Sta
ff co
sts
351
340
314
317
362
284
315
Pur
chas
e of
goo
ds a
nd s
ervi
ces
161
157
145
273
157
164
148
Inco
me
from
sal
es o
f goo
ds a
nd s
ervi
ces
(2)
(4)
(5)
(20)
(21)
--
Ren
tals
1516
143
2031
21
Dep
reci
atio
n55
4130
3235
4746
Oth
er re
sour
ce(9
)(7
)(1
2)(9
6)(2
5)(4
8)(6
6)

180 DFE CONSOLIDATED ANNUAL REPORT AND ACCOUNTS 2017-18
GLOSSARY OF KEY TERMS
Abbreviation or term Description
Academies All schools operated by Academy Trusts encompassing academies, free schools, university technical colleges and studio schools
Agency Executive Agency
ALB Arm’s length body
AME Annually Managed Expenditure
ARA Annual report and accounts
ATs Academy Trusts: the charitable companies that operate all types of academy schools
BAME Black, Asian and Minority Ethnic
CITB Construction Industry Training Board
DEL/CDEL/RDEL Departmental Expenditure Limit (Capital/Resource)
Department The core Department for Education, excluding Executive Agencies, Non-departmental Public Bodies and Academy Trusts.
Department & Agencies The core Department for Education, plus its Executive Agencies but excluding Non-departmental Public Bodies.
Departmental Group, the Group The Departmental Group (the Group) encompassing the core Department, Executive Agencies, Non-departmental Public Bodies.
ECITB Engineering Construction Industry Training Board
EFA Education Funding Agency
ESD Education Standards Directorate, a directorate of the Department
ESFA Education and Skills Funding Agency
EHRC Equalities and Human Rights Commission
Estimate Group funding, as approved by HM Treasury and subject to specific limits by category of spending.
FE Further education
FITB Film Industry Training Board
FReM Financial Reporting Manual, issued by HM Treasury
GAD Government Actuary’s Department
GGC Greening Government Commitments
GHG Greenhouse gas
GIAA Government Internal Audit Agency
H&FE Higher and Further Education Directorate, a directorate of the Department
HE Higher education
HEFCE Higher Education Funding Council for England
HEI Higher education institution
HMT HM Treasury
IFA Institute for Apprenticeships
IFD Infrastructure & Funding Directorate, a directorate of the Department
IRT Insight, Resources and Transformation, a directorate of the Department
LIBOR London Interbank Offered Rate
NAO National Audit Office
NCTL National College for Teaching and Leadership
NDPB Non-departmental Public Body

181DFE CONSOLIDATED ANNUAL REPORT AND ACCOUNTS 2017-18
Abbreviation or term Description
OCC Office of the Children’s Commissioner
OFFA Office for Fair Access (operating name of Director of Fair Access to Higher Education)
OfS Office for Students
ONS Office for National Statistics
PAC Public Accounts Committee
PSBP Priority School Building Programme, a programme to address the needs of the schools most in need of urgent repair
RPA Risk Protection Arrangement
RPI Retail Price Index
SARA Sector Annual Report and Accounts, the standalone annual report and accounts for the academy sector
SCME Social Care, Mobility and Equality, a directorate of the Department
SCS Senior Civil Servant
SEND Special Educational Needs and Disability
SFA Skills Funding Agency
SoCTE Statement of Changes in Taxpayers’ Equity
SoCF Statement of Cash Flows
SoCNE Statement of Comprehensive Net Expenditure
SoFP Statement of Financial Position
SoPS Statement of Parliamentary Supply
SLC Student Loans Company Limited
STA Standards and Testing Agency
STEM Science, Technology, Engineering & Mathematics
UCAS Universities and Colleges Admissions Service
2016-17 & 2017-18 Financial years, ending on 31 March
2016/17 & 2017/18 Academic years, ending on 31 August

182 DFE CONSOLIDATED ANNUAL REPORT AND ACCOUNTS 2017-18
Page intentionally left blank

184DfE ANNUAL REPORT AND ACCOUNTS 2017-18
CCS0618974272978-1-5286-0629-5