Embed Size (px)
Citation preview

DEPARTMENT OF CIVIL ENGINEERING
Subject- Environmental Engineering Lab
S.No. Experiments Name 1 Study of sampling and preservation methods and significance of characterization of
water and waste water
2 Determination of pH 3 Optimum Coagulant Dosage by Jar Test 4 Determination of Residual Chlorine 5 Determination of hardness 6 Determination of chloride 7 Turbidity 8 Determination of Available Chlorine in Bleaching Powder
9 Total, Fixed and Volatile Solids 10 Suspended and Dissolved Solids 11 Total Settleable solids 12 Determination of Dissolved Oxygen 13 Estimation of Sulphate 14 Determination of Fluorides 15 Determination of Ammoniacal Nitrogen 16 Determination of COD 17 Determination of Iron 18 Biochemical Oxygen Demand 19 Introduction to Bacteriological Analysis
Ex No: 1 Study of sampling and preservation methods anti Date: Significance of characterisation of water and waste water
Aim To study the sampling and preservation methods in water and waste water
characterization and to learn the significance of characterisation of water and waste
water Sampling Programme and Procedures
The collection of a representative sample is the most important function of an environmentalist. The interpretation of results and recommendation for
prevention and corrective treatment are all based on the analysis report. Scrupulous
care in the collection of samples is therefore necessary to ensure that the sample is
representative of the body of water under examination and to avoid spoilage and
accidental contamination of the sample during collection and transport. Methods of sampling
Three types of samples are often collected depending on situations a. Grab Samples
Grab samples are samples collected at a designated place at a particular time.
They represent the composition at the time and space. When a source is known to
vary in time, as in the case of waste effluents, grab samples collected at various time
intervals and analysed separately can be of greater value. b. Composite samples
Composite samples are a mixture of grab samples collected at one sampling
point at different times. Individual samples are collected in wide mouth bottles
every hour and mixed in volume proportional to the flow. The composite values are
useful for observing average values. c. Integrated samples
Integrated samples are a mixture of grab samples collected from different
points simultaneously and mixed in equal volumes. Individual samples are collected
from both banks of a river and at varying depths to represent available situations.
Sampling and preservation Requirements: 1. Physical and Chemical Requirements:
For general physical and chenica1 examination, the sample should be
collected in a chemically clean bottle made of good quality glass fitted with a ground
glass stopper or a chemically inert polyethylene container. The volume of sample to
be collected would depend on the selection of tests; however, for general examination 3.0 litre sample would be sufficient,
The following precautions must be taken while collecting the sample
i) The sampling location is representative of the water body
ii) The place is devoid of floating material
Where ever possible the sample should be collected 15cm, below the surface
or as the situation warrants
No physical activity is permitted upstream of sampling point Shorter the time
between collection and examination, the reliable will be the analytical results. For
certain constituents and physical values, immediate analysis in the field is required, because, the composition of water may change before it arrives at the laboratory.
The maximum limits of storage are:
Unpolluted water: 72 hours
Slightly polluted. : 48 hours
Grossly polluted: 1 2hours
Some determinations are more likely to be affected by storage than others. Temperature may change, pH may change significantly, and dissolved gases may be
evolved and lost (O2, CO2. and H2S) Frequency of sampling:
Frequency depends on objectives. Yet, collection of samples of both raw and
treated waters should be carried out as frequently as possible and at least once in
every three months. Some waters undergo more pronounced seasonal variation and
therefore require more frequent testing. Samples from treatment units should be
collected and analyses frequently, at least one from each unit daily.
2. Bacteriological requirements: The samples for bacteriological examination are collected in sterilized.
neutral glass, glass-stopper 80z, and 300 ml bottles. The stopper and the neck
should be protected by paper or parchment cover. If the sample is likely to contain
traces of residual chlorine, an amount equal to 3.0 mg of sodium thiosul1ite
(Na2s203, 51120) to neutralize chlorine is added to the bottle before sterilization. The sterilization is done at 15 psi (121°C) for 20-30 minutes in an autoclave.
The sterilized sample bottle should be kept unopened until the time of
collection. The stopper should be removed with care to eliminate chances of spoiling
and contamination and should never the rinsed. After filling, the stopper should be
replaced immediately. The place of collection should be predetermined and
procedure of collection conditioned depending on the source. The standard procedure in sampling from a water faucet or tap is as follows:
a) Flame the tap briefly to kill clinging bacteria. This can be done with a piece of burning paper.
b) Turn on the water and allow it to run for 1 mm.
c) Remove the stopper from the bottle, being careful not to touch the inner
portions o the stopper or bottle neck. d) Fill bottle carefully, allowing no water to enter that has come in contact with
hands. It is sometimes necessary to collect a sample from a reservoir or basin. If the
water can be reached, remove the stopper, plunge the bottle below the surface and
move the bottle while it is filling, so that no water will enter that has been in contact with hand. If the water is out of reach, as in a dug well, the bottle can be lowered
with a cord.
The sample after collection should be examined immediately, preferably
within one hour. If the conditions do not permit immediate examination, the sample
should be stored at low temperatures. This period should in case be more than 24
hours. If storage or transportation is necessary, they should be got at a temperature
between 0°C and 10°C.

Frequency of sampling: The frequency of sampling should be fixed depending on the magnitude of
the problem involved. The number of samples to be examined from drinking water
supply distribution system is normally decided on the basis of population served as
given in the tabulation:
Population
Treated / untreated water entering distribution
system
Max.interval between
successive sampling Max.no.of samples to be
examined.
Upto 20,000 1 month
One sample for every
5000 population 20,001 – 50000 15 days
50,001 – 1,00,000 4 days
More than 100,000 1 day One sample for every
10,000 population
The raw water should be examined as frequently as the situation demands. The
frequency is also determined based on objectives of study.
3. Biological Requirements: In general the samples for biological examination are collected in wide
mouth, clean glass bottles of 2.0 litre capacity. They are never filled completely. This
method is employed when total microscopic count is the aim. In some specific cases
the concentrate of a sample may be collected through plankton nets made of bolting
silk cloth, or the. sample filtered through Sedge wick Rafter funnels.
In general the sample must be examined microscopically within one hour of collections. If the facilities do not permit an immediate examination, it should be
preserved after collection by addition of 2 ml neutralized (pH 7.0) formaline to each
100 ml of the sample.
There is no practice about the frequency of sampling but the examination
should be made regularly, or else as the situation demands. Benthos study is
complex, Collection through cages placed at proper preselected sites for a defined
period of time is recommended.
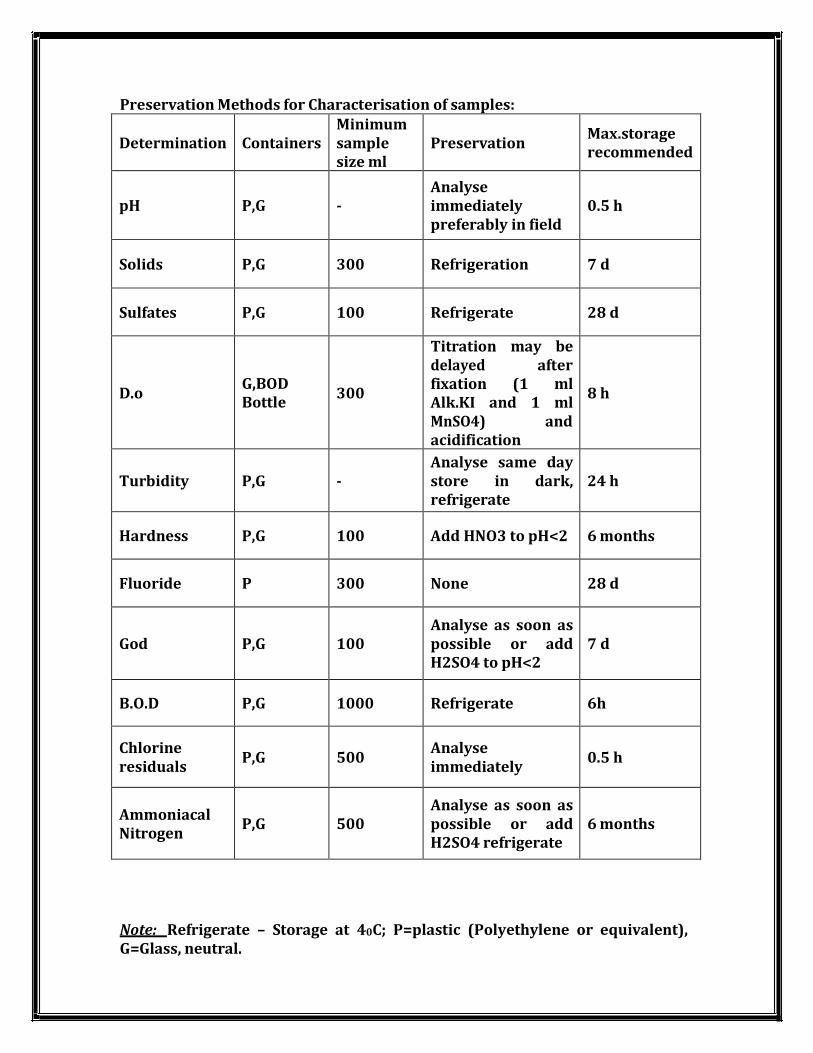
Preservation Methods for Characterisation of samples: Determination
Containers
Minimum
sample
size ml
Preservation
Max.storage
recommended
pH
P,G
-
Analyse
immediately
preferably in field
0.5 h
Solids
P,G
300
Refrigeration
7 d
Sulfates P,G 100 Refrigerate 28 d
D.o
G,BOD Bottle
300
Titration may be
delayed after
fixation (1 ml Alk.KI and 1 ml MnSO4) and
acidification
8 h
Turbidity
P,G
-
Analyse same day
store in dark, refrigerate
24 h
Hardness P,G 100 Add HNO3 to pH<2 6 months
Fluoride P 300 None 28 d
God
P,G
100
Analyse as soon as
possible or add
H2SO4 to pH<2
7 d
B.O.D P,G 1000 Refrigerate 6h
Chlorine
residuals
P,G
500
Analyse
immediately
0.5 h
Ammoniacal Nitrogen
P,G
500
Analyse as soon as
possible or add
H2SO4 refrigerate
6 months
Note: Refrigerate – Storage at 40C; P=plastic (Polyethylene or equivalent), G=Glass, neutral.

Significance of Characterisation of various parameters: Natural waters are never completely pure. During their precipitation and
passage over or through ground they require a wide variety of dissolved and
suspended impurities. The concentrations of these impurities are seldom large in
ordinary chemical sense but they modify the chemical behaviour of water or its
usefulness.
The waste waters generally have values far higher than in waters.
Some of these impurities are toxic, some may affect health, and some affect the
portability while others indicate pollution. A list of such impurities is given below:
Toxic substances Max. allowable limit (W.H.O. Standards) mg/L
Lead 0.05
Arsenic 0.05
Selenium 0.01
Chromium 0.05
Cyanide 0.2
Cadmium 0.01
Radio active compounds (gross beta
activity) 1000c/L
Components hazardous to health
Fluorides 1.5
Nitrates as NO3 45
Compounds affecting the portability
TDS 1500
Iron 5.0
Managese 5.0

Copper 1.5
Zinc 1.5
Magnesium plus – sodium sulfate 1000
Surfactants (ABS) 0.5
Chemical indicators of population
BOD 60
COD 10.0
Total Nitrogen exclusive of NO3 1.0
Ammonia cal Nitrogen as NH3 0.5
Carbon chloroform extract (CCE) 0.5
Oil and Grease 1.0
D.O 40% saturation
Hardness The study of hardness is important from the point of view of industrial
utilization of water especially in boilers, where scales are formed. Hardness in
municipal supplies increases the consumption of soap, fuel, tea leaves etc. in the
household and renders it unsuitable for use in air-conditioning.
Turbidity It is a measure of degree of opaqueness of water and interference presented
by suspended matter to the passage of light. The turbidity is due to clay, silt, finely
divided organic matter and microscopic organisms. Turbidity tests are important from aesthetic consideration and from the point of economics of treatment. The
most important health significance of turbidity is that may, harbour pathogenic
organisms.
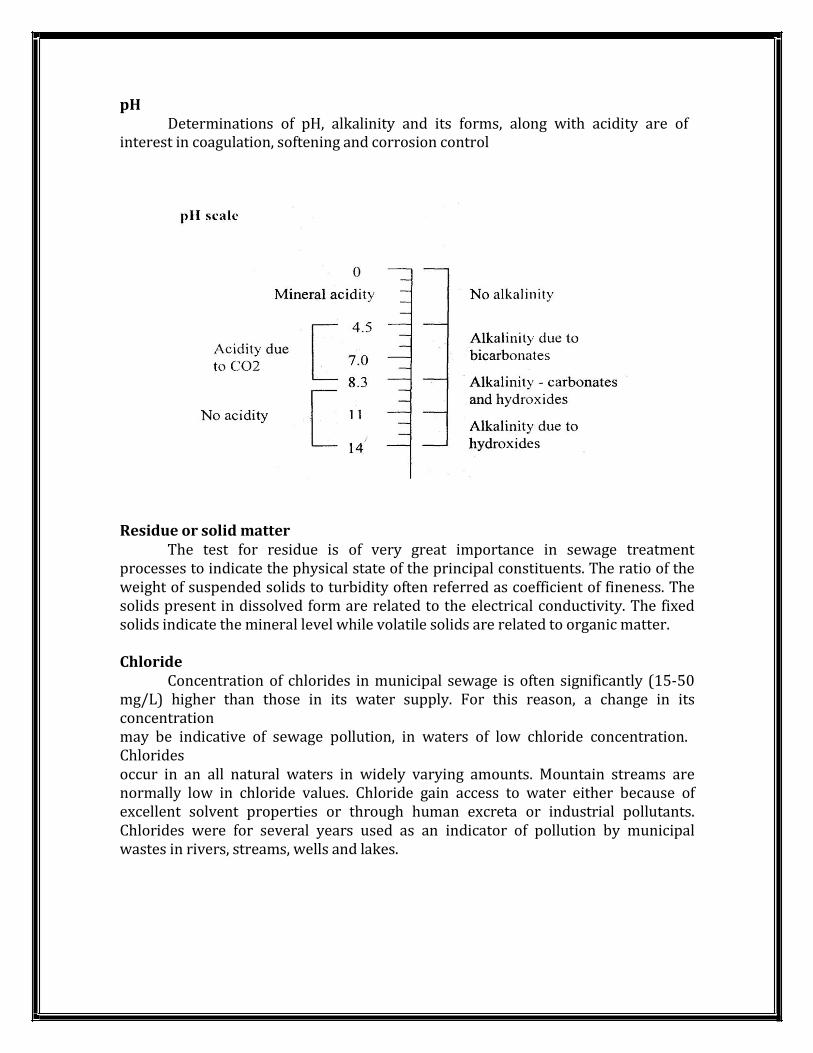
pH Determinations of pH, alkalinity and its forms, along with acidity are of
interest in coagulation, softening and corrosion control
Residue or solid matter The test for residue is of very great importance in sewage treatment
processes to indicate the physical state of the principal constituents. The ratio of the
weight of suspended solids to turbidity often referred as coefficient of fineness. The
solids present in dissolved form are related to the electrical conductivity. The fixed
solids indicate the mineral level while volatile solids are related to organic matter. Chloride
Concentration of chlorides in municipal sewage is often significantly (15-50
mg/L) higher than those in its water supply. For this reason, a change in its
concentration may be indicative of sewage pollution, in waters of low chloride concentration. Chlorides occur in an all natural waters in widely varying amounts. Mountain streams are
normally low in chloride values. Chloride gain access to water either because of excellent solvent properties or through human excreta or industrial pollutants. Chlorides were for several years used as an indicator of pollution by municipal wastes in rivers, streams, wells and lakes.
Dissolved Oxygen In raw water and domestic wastes, dissolved oxygen is a factor which
determines whether the biological processes undergoing a change are aerobic or anaerobic. It is
very desirable that aerobic conditions are maintained. It is a Single test which will immediately indicate the sanitary status of a stream. Low values of dissolved oxygen
adversely affect the portability of water and may cause fish kill. Organic matter
The tests of organic matter indicate type and extent of pollution, which has
its origin in plant or animal matter. Tests are mostly restricted to the study of nitrogen in various forms and oxygen requirements in biodegradation of puterscible
carbonaceous organic matter (BOD). A measure of the demand is also indicated in
terms of demand through strong chemical oxidants (COD)
BOD. The BOD is the amount of oxygen required by bacteria while stabilizing
decomposable organic matter under aerobic conditions. Polluted water does not contain sufficient oxygen in solution to maintain aerobic condition during
decomposition. The quantity of oxygen required for complete stabilization is taken
as a measure of its organic content.
CODP The COD test is based on the concept that a large majority of organic
compounds can be completely oxidized by the action of strong oxidizing agents in
acidic medium. The quantity of oxygen required is proportional to organic matter, regardless of the biological assimilability of the substance.
Nitrogen
Nitrogen is estimated as organic nitrogen, ammonical nitrogen, nitrite
nitrogen and nitrate nitrogen throw light on the pollutional history of the carrying
water. Bacteriological tests
The routine bacteriological tests are aimed at enumerating the members of coliform group, which are considered indicators of pollution. The natural habitat of these bacteria is the intestinal tract of man and other warm blooded animals. They
are present wherever the pathogens are present and by their absence exclude the
probability of the presence of pathogens. They share the fate of the most significant pathogenic enteric bacteria outside the human and animal body both in the rate of death and in the rate of removal when water is purified.
Another test of bacteria is aimed at detecting chemo-synthetic heterotrophic
heterogeneous group developing under conditions of cultivation and is referred as

Total Plate Count. This test is not differential and indicates a total picture of bacteria
associated with organic matter.
Biological Examination The biological examination (microscopic) provides useful information for the
control of water quality and treatment. It serves for one or several of the following
purposes:
i) To explain the cause of color or an odor in water ii) To aid in the interpretation of various chemical analysis reports iii) Permitting identification of specific water when it is mixed with another iv) To explain clogging of pipes/screens/filters v) Rapidly detect organic pollution and contamination with toxic substances vi) To indicate the progress of self purification streams.
Observation
Source of sample : Date of collection: Time : Temperature:
Tabulation
Sample Calibration
with Temperature pH value Remark
Result
Thus the sampling and preservation methods in water and waste water
characterization and to learn the significance of characterisation of water and waste
water are studies.

Ex No :2 Determination of pH
Date :
Aim: To determine the pH value of the given sample by electrometric method.
Apparatus Required pH meter with combined electrode, beakers
Chemicals Required Buffer tablet of pH values 4 and 9.2
Reagents preparation Buffer solution of pH value 4
Buffer tablet of pH value 4 is dissolved in 100 ml of distilled water. This solution
should preferably be stored in a plastic bottle in cool place. Buffer solution of pH value 9.2
Buffer tablet of pH value 9.2 is dissolved in 100 ml of distilled water. This solution
should preferably be stored in a plastic bottle in cool place. Procedure: Electrometric method:
1. Wash the combined electrode of pH meter with distilled water and clean the same
with distilled water. 2. Dip the combined electrode in the buffer solution of pH value 4. 3. Adjust the temperature by the adjustment knob to an ambient (room)
temperature. 4. If the instrument shows the reading as 4 then it is in order if not, adjust the
reading to 4.0 by calibration adjustment knob. 5. Wash the electrode of pH meter with distilled water and clean the same with
distilled water and dip it to the buffer solution of pH value 9.2. 6. Note the reading if the instrument shows the reading as 9.2 then it is in order
otherwise use the calibration adjustment knob and bring the reading to 9.2. 7. Repeat the above procedure until the meter shows reading as 4 when electrode is
dip in buffer solution of pH 4 and shows reading as 9.2 when electrode is dip in
buffer solution of pH value 9.2. 8. Now the instrument is calibrated.
9. After cleaning the electrode dip in the sample for which p1! value is to be found
out. 10. Directly record the reading from the meter without doing any adjustments.
Environmental significance
pH (6.5 to 8.5) has no direct effect on health however a lower value below 4
will produce sour taste and higher value above 8.5 a bitter taste. Higher values of p1-I have scale formation in water heating operators and also reduce the germicidal potential of chlorine. High pH induces the formation of trihalomethanes which are
causing cancer in human beings.
pH below 6.5 starts corrosion in pipes, thereby releasing toxic metals such as
zinc, lead, cadmium & copper etc., According to BIS water for domestic consumption
should have pH between 6.5 to 8.5 Application of pH data in environmental engineering practice 1. Determination of pH is one of the important objective in biological treatment, if the pH goes below 5 due to excess accumulation of acids, the process is severely
affected. Shifting of pH beyond 5 to 10 upsets the aerobic treatment of the waste
waters. In these circumstances, the pH can be adjusted by addition of suitable acid
or alkali to optimize the treatment of waste water. 2. Its range is of immense value for any chemical reaction. A chemical value shall be
highly effective at particular pH. Chemical coagulation; disinfection, water softening
and corrosion control are governed by pH adjustment. 3. Dewatering of sludges, oxidation of cyanides and reduction of hexa covalent chromium in to trivalent chromium also need a favorable range 4. It is used in the
calculation of carbonate, bicarbonate, C02 calculation, stability index and acid- base
equilibrium.
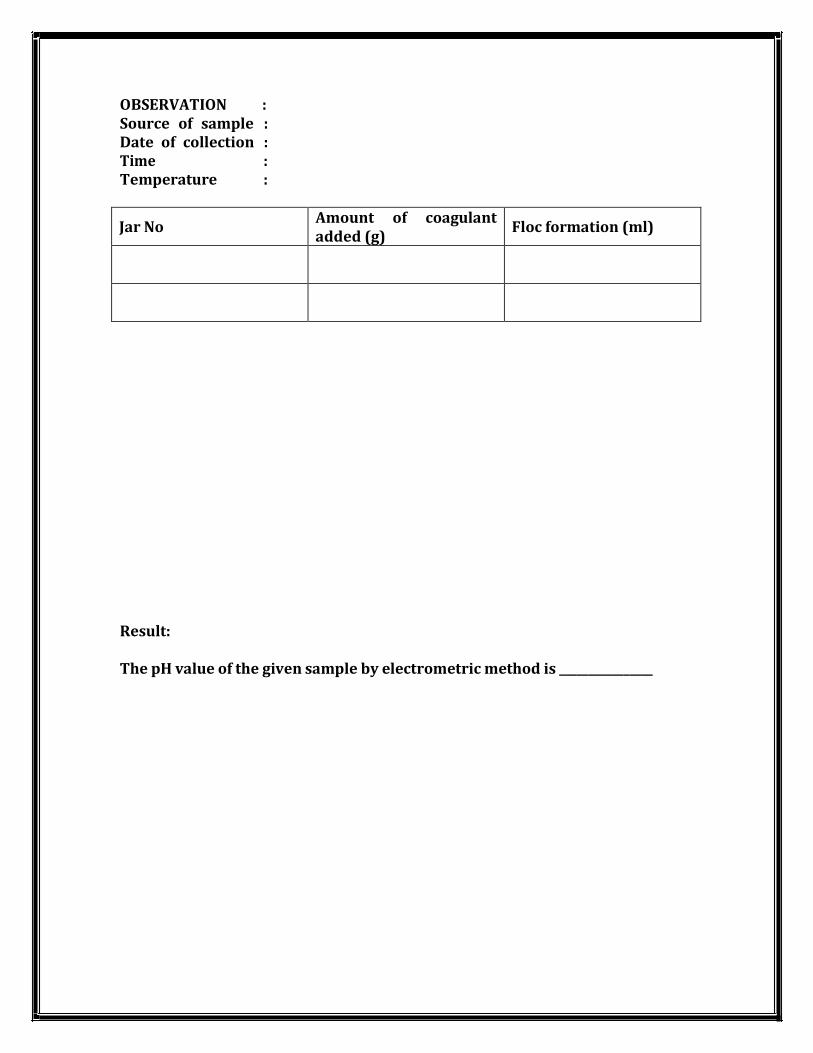
OBSERVATION : Source of sample : Date of collection : Time : Temperature :
Jar No Amount of coagulant added (g)
Floc formation (ml)
Result:
The pH value of the given sample by electrometric method is ________________
Ex No: 3 Optimum Coagulant Dosage by Jar Test
Date :
Aim: To determine the optimum dosage of coagulant required for a given sample
of waste water. Apparatus Required:
1 .Laboratory flocculator with stirring paddles 2. Glass Jars 3. Analytical balance
Reagents Required: Alum Theory:
The amount of coagulant required for coagulation depends on the turbidity
of the waste water. The use of optimum amount of coagulant is indicated by the
formation of the large feathery flakes. This can be approximately determined in the
laboratory by Jar test. The test involves rapid mixing to disperse the chemicals
(coagulants) in the sample and slow mixing for the floc formation. PROCEDURE: 1. Fill 1 litre waste water sample in each of the six jars 2. Attach the sample jars to the stirring device by lifting he paddles in the right upward direction. 3. Add coagulant (Alum) in progressive dosages into the series of the six sample jars. 4. The coagulant dosage can be selected randomly depending on the characteristics
of waste water. 5. Mix the sample rapidly for about 10 mm with mechanically operated paddles at 180rpm followed by gentle stirring about 10 mm. at 30—40 rpm 6. Remove the jars from the stirring device after stirring is completed 7. Let the sample in the jars stand for 30 mm. for settling of floc. 8. The dose of coagulant versus floc formation is plotted as graph. 9. The dose of coagulant which gives the best floc is the optimum dose of coagulants.
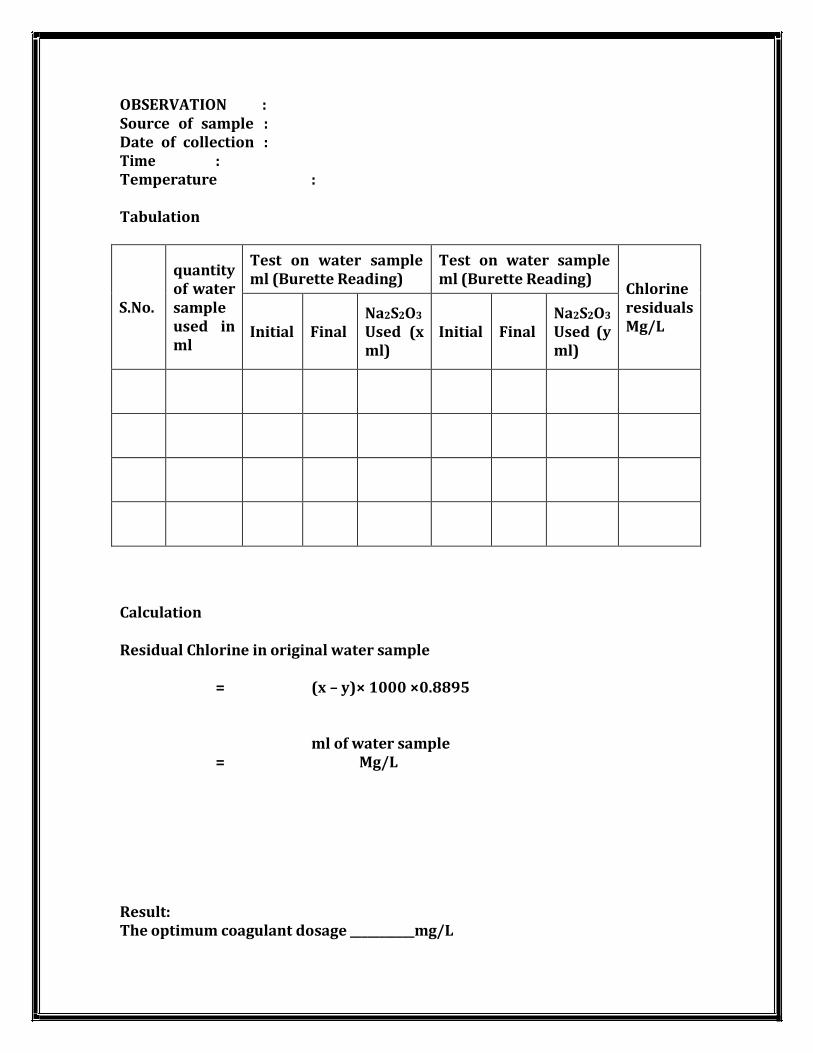
OBSERVATION : Source of sample : Date of collection : Time : Temperature :
Tabulation
S.No.
quantity
of water
sample
used in
ml
Test on water sample
ml (Burette Reading) Test on water sample
ml (Burette Reading)
Chlorine
residuals
Mg/L
Initial
Final Na2S2O3
Used (x
ml)
Initial
Final Na2S2O3
Used (y
ml)
Calculation
Residual Chlorine in original water sample
= (x – y)× 1000 ×0.8895
ml of water sample = Mg/L
Result: The optimum coagulant dosage ___________mg/L
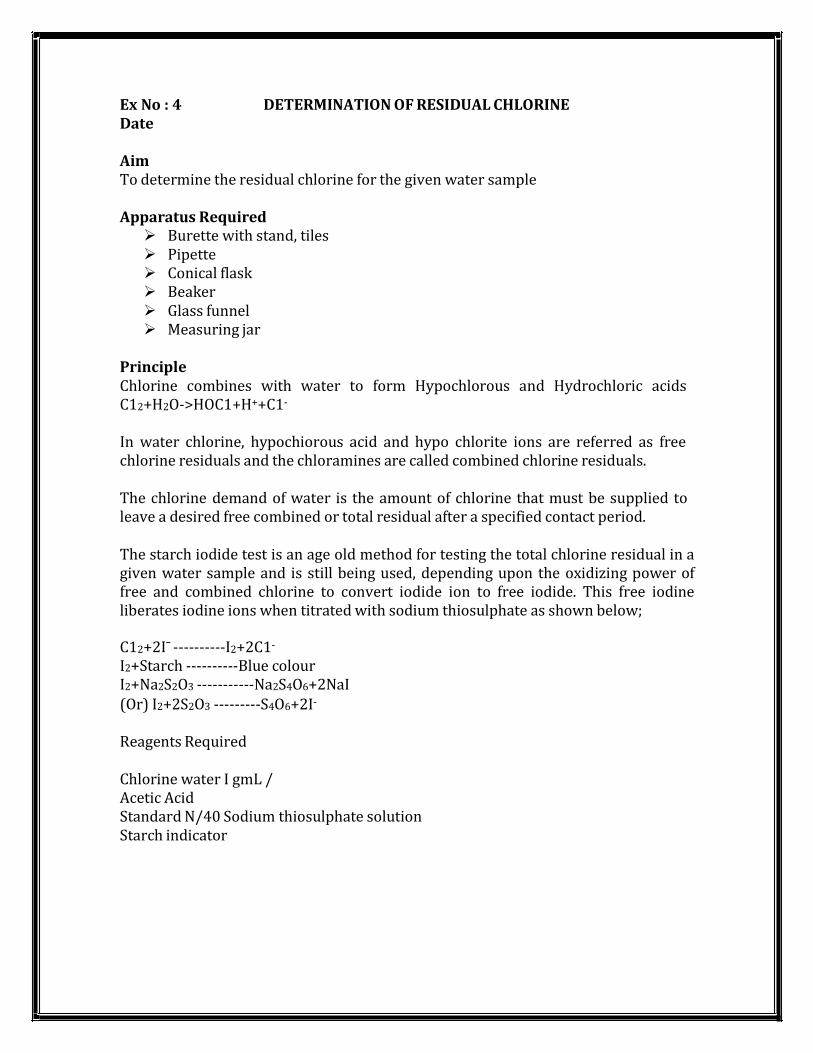
Ex No : 4 DETERMINATION OF RESIDUAL CHLORINE Date
Aim To determine the residual chlorine for the given water sample
Apparatus Required Burette with stand, tiles Pipette Conical flask Beaker Glass funnel Measuring jar
Principle Chlorine combines with water to form Hypochlorous and Hydrochloric acids
C12+H2O->HOC1+H++C1-
In water chlorine, hypochiorous acid and hypo chlorite ions are referred as free
chlorine residuals and the chloramines are called combined chlorine residuals. The chlorine demand of water is the amount of chlorine that must be supplied to
leave a desired free combined or total residual after a specified contact period. The starch iodide test is an age old method for testing the total chlorine residual in a
given water sample and is still being used, depending upon the oxidizing power of free and combined chlorine to convert iodide ion to free iodide. This free iodine
liberates iodine ions when titrated with sodium thiosulphate as shown below; C12+2I¯ ----------I2+2C1-
I2+Starch ----------Blue colour I2+Na2S2O3 -----------Na2S4O6+2NaI (Or) I2+2S2O3 ---------S4O6+2I-
Reagents Required
Chlorine water I gmL /
Acetic Acid Standard N/40 Sodium thiosulphate solution
Starch indicator
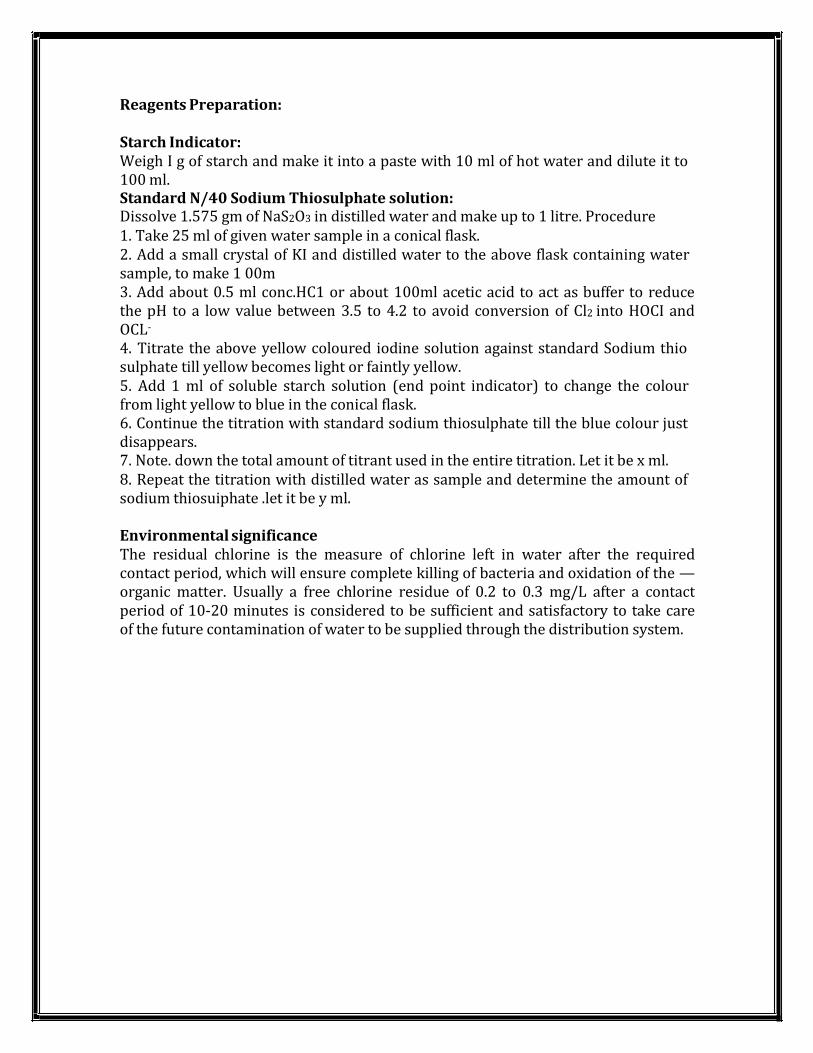
Reagents Preparation: Starch Indicator: Weigh I g of starch and make it into a paste with 10 ml of hot water and dilute it to
100 ml. Standard N/40 Sodium Thiosulphate solution: Dissolve 1.575 gm of NaS2O3 in distilled water and make up to 1 litre. Procedure 1. Take 25 ml of given water sample in a conical flask. 2. Add a small crystal of KI and distilled water to the above flask containing water
sample, to make 1 00m 3. Add about 0.5 ml conc.HC1 or about 100ml acetic acid to act as buffer to reduce
the pH to a low value between 3.5 to 4.2 to avoid conversion of Cl2 into HOCI and
OCL-
4. Titrate the above yellow coloured iodine solution against standard Sodium thio
sulphate till yellow becomes light or faintly yellow. 5. Add 1 ml of soluble starch solution (end point indicator) to change the colour
from light yellow to blue in the conical flask. 6. Continue the titration with standard sodium thiosulphate till the blue colour just disappears. 7. Note. down the total amount of titrant used in the entire titration. Let it be x ml. 8. Repeat the titration with distilled water as sample and determine the amount of sodium thiosuiphate .let it be y ml.
Environmental significance The residual chlorine is the measure of chlorine left in water after the required
contact period, which will ensure complete killing of bacteria and oxidation of the — organic matter. Usually a free chlorine residue of 0.2 to 0.3 mg/L after a contact period of 10-20 minutes is considered to be sufficient and satisfactory to take care
of the future contamination of water to be supplied through the distribution system.

OBSERVATION : Source of sample : Date of collection : Time : Temperature :
Tabulation
S.No.
Volume of water
sample
(ml)
Burette Reading (ml)
EDTA Consumed
(ml)
Hardness
(mg/L)
Initial Final
Calculation
ml of EDTA used Hardness in mg/1 of CaCO3 = x 1000 ml of water sample
Result
Residual Chlorine residuals for given water sample by Starch Iodide Test is = ____________________mg/L.

Ex. No: 5 DETERMINATION OF HARDNESS Date :
Aim To determine the total hardness present in the given sample
Apparatus Required Burette, Pipette, Conical flask, measuring jar
Chemicals Required Eriochrome Black-T (EBT) indicator, Ammonium chloride, Ammonium solution, EDTA
Reagents Preparation EBT indicator Dissolve 0.2 g of pure solid in 15 ml of distilled water
Standard EDTA Titrant Take 0.5 g of EDTA. Heat it to 80oC for half an hour and cool it. Take 0.37 g of the
dissolve and add to get distilled water to make 100ml. 1 ml of exactly 0.02 N EDTA1mg of CaCO3
Ammonia Buffer solution Dissolve 0.7 g of ammonium chloride (NH4C1) in 5.7ml concentrate ammonia
solution and dilute to 100 ml. Procedure
1. Take 20 ml of the sample in a conical flask. 2. Add 2ml of ammonia buffer to the flask. 3. Add 5 — 6 drops of EBT indicator to the flask wine red colour will be developed. 4. Titrate it with standard EDTA solution which is filled in the burette till the colour
changes from wine red to blue. 5. Repeat steps I to 4 for different samples with varying hardness and also for
distilled water (blank) 6. For determination of non-carbonate hardness the sample is to be boiled for 30
minutes. The procedure is the same as above.
Sanitary Significance Hard water has adverse action with soap since it allows less formation of leather. If hard water is used in boilers, scaling problem occurs leading to the bursting of boilers, It makes food tasteless. It affects the working of dyeing process. It is also
precipitate protein of meat and make tasteless. Application of Hardness data in Environmental Engineering Practice 1. Hardness of water is important in determining the suitability of water for
domestic and industrial uses. 2. The relative amounts of calcium and magnesium hardness, carbonate and non- carbonate hardness present in water are the factors while determining the most economical type of softening process.
3. Determination of hardness serve as a basis for routine control of softening
process. OBSERVATION : Source of sample : Date of collection : Time : Temperature :
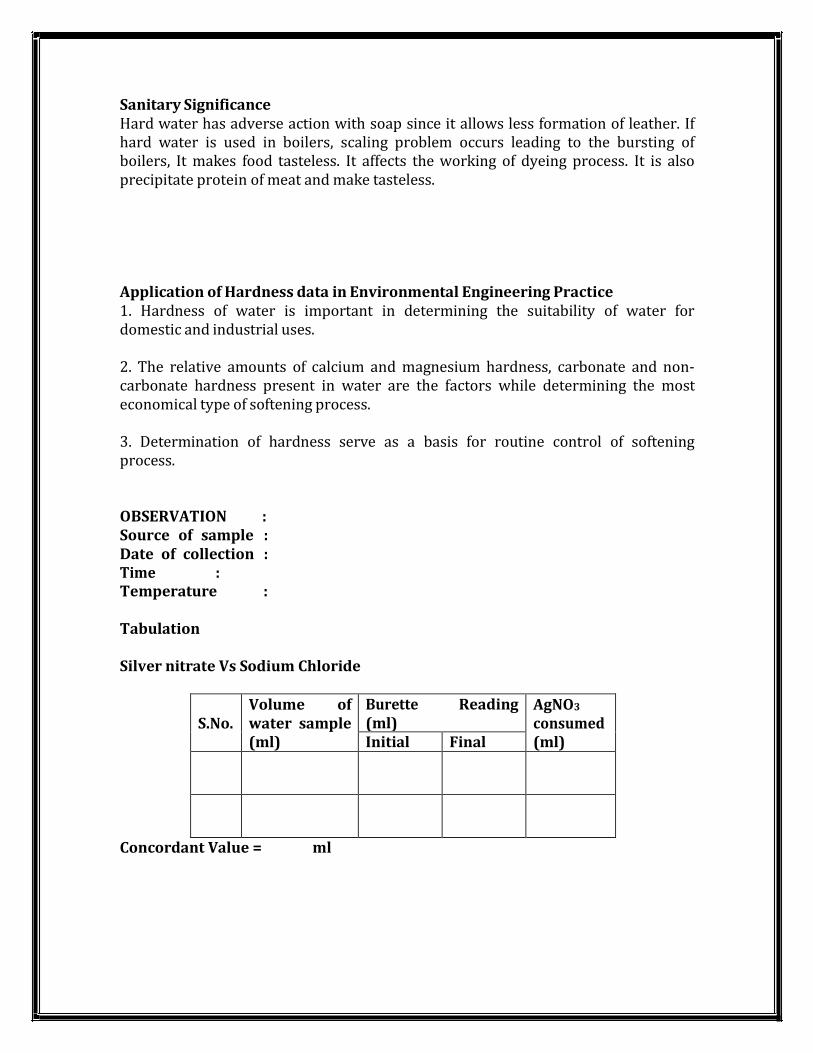
Tabulation
Silver nitrate Vs Sodium Chloride
S.No.
Volume of water sample
(ml)
Burette Reading
(ml) AgNO3
consumed
(ml) Initial Final
Concordant Value = ml

Silver Nitrate Vs sample
S.No.
Volume of water
sample (ml)
Burette Reading (ml) AgNO3
consumed
(ml)
Chlorides
(mg/L) Initial Final
Concordant Value = ml
Calculation
Normality of silver Nitrate N =
Vol.of AgNO3
Volume Noramlity of NaCI
Chloride mg/L =
Vol.of sample taken
Result:
Volume of AgNO3×35.45×N×1000
Total Hardness in mg of CaCO3= ---------------mg/L
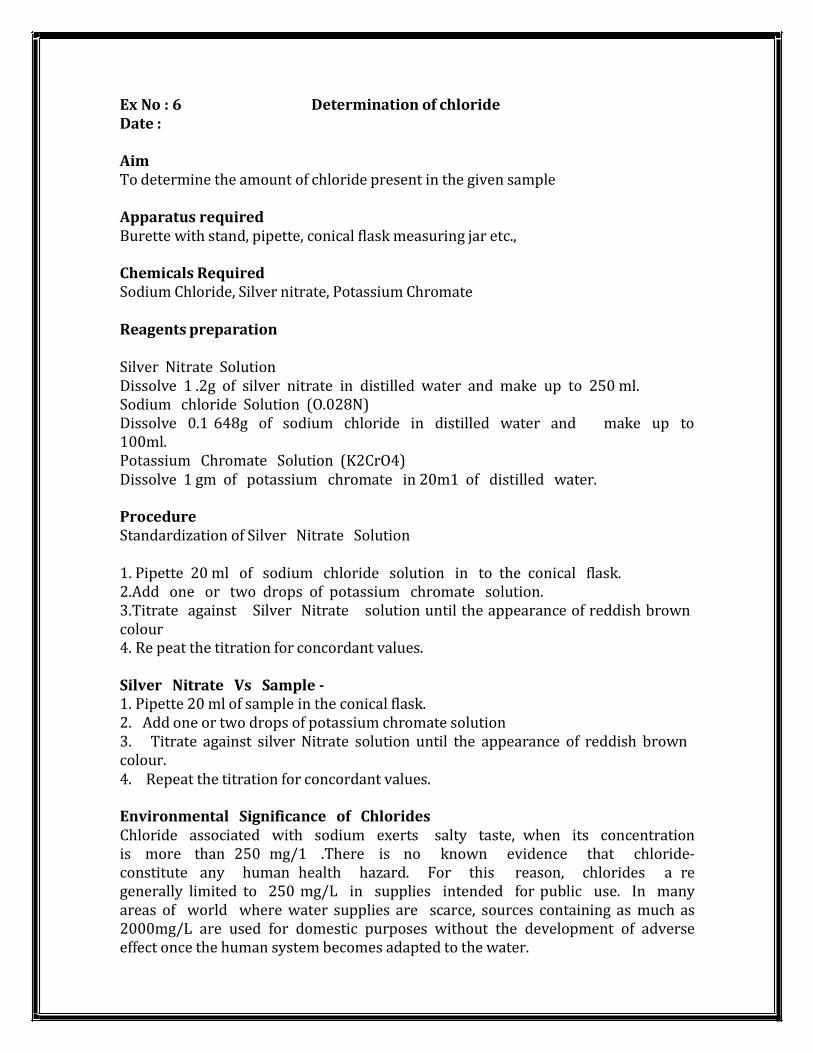
Ex No : 6 Determination of chloride
Date : Aim To determine the amount of chloride present in the given sample
Apparatus required Burette with stand, pipette, conical flask measuring jar etc.,
Chemicals Required Sodium Chloride, Silver nitrate, Potassium Chromate
Reagents preparation
Silver Nitrate Solution Dissolve 1 .2g of silver nitrate in distilled water and make up to 250 ml. Sodium chloride Solution (O.028N) Dissolve 0.1 648g of sodium chloride in distilled water and make up to
100ml. Potassium Chromate Solution (K2CrO4) Dissolve 1 gm of potassium chromate in 20m1 of distilled water.
Procedure Standardization of Silver Nitrate Solution
1. Pipette 20 ml of sodium chloride solution in to the conical flask. 2.Add one or two drops of potassium chromate solution. 3. Titrate against Silver Nitrate solution until the appearance of reddish brown
colour 4. Re peat the titration for concordant values.
Silver Nitrate Vs Sample - 1. Pipette 20 ml of sample in the conical flask. 2. Add one or two drops of potassium chromate solution 3. Titrate against silver Nitrate solution until the appearance of reddish brown
colour. 4. Repeat the titration for concordant values.
Environmental Significance of Chlorides Chloride associated with sodium exerts salty taste, when its concentration
is more than 250 mg/1 .There is no known evidence that chloride- constitute any human health hazard. For this reason, chlorides a re
generally limited to 250 mg/L in supplies intended for public use. In many
areas of world where water supplies are scarce, sources containing as much as
2000mg/L are used for domestic purposes without the development of adverse
effect once the human system becomes adapted to the water.
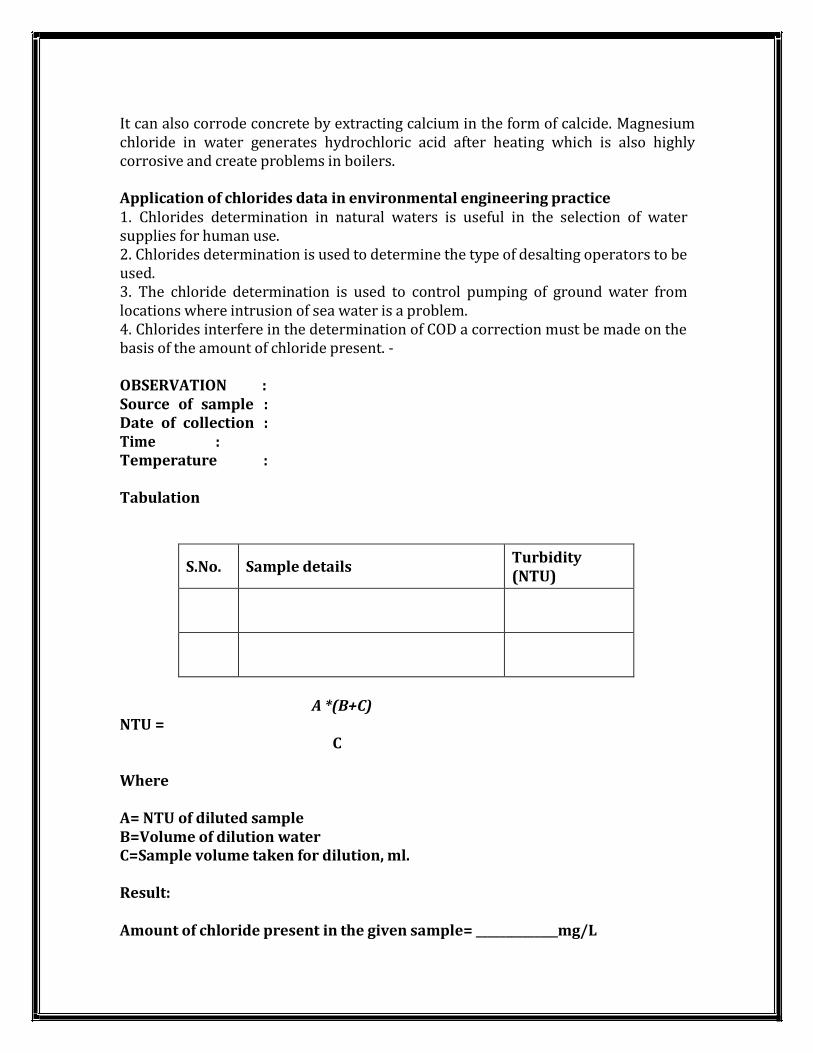
It can also corrode concrete by extracting calcium in the form of calcide. Magnesium
chloride in water generates hydrochloric acid after heating which is also highly
corrosive and create problems in boilers. Application of chlorides data in environmental engineering practice 1. Chlorides determination in natural waters is useful in the selection of water
supplies for human use. 2. Chlorides determination is used to determine the type of desalting operators to be
used. 3. The chloride determination is used to control pumping of ground water from
locations where intrusion of sea water is a problem. 4. Chlorides interfere in the determination of COD a correction must be made on the
basis of the amount of chloride present. - OBSERVATION : Source of sample : Date of collection : Time : Temperature :
Tabulation
S.No. Sample details Turbidity
(NTU)
NTU =
A *(B+C)
C
Where A= NTU of diluted sample
B=Volume of dilution water C=Sample volume taken for dilution, ml.
Result:
Amount of chloride present in the given sample= ______________mg/L
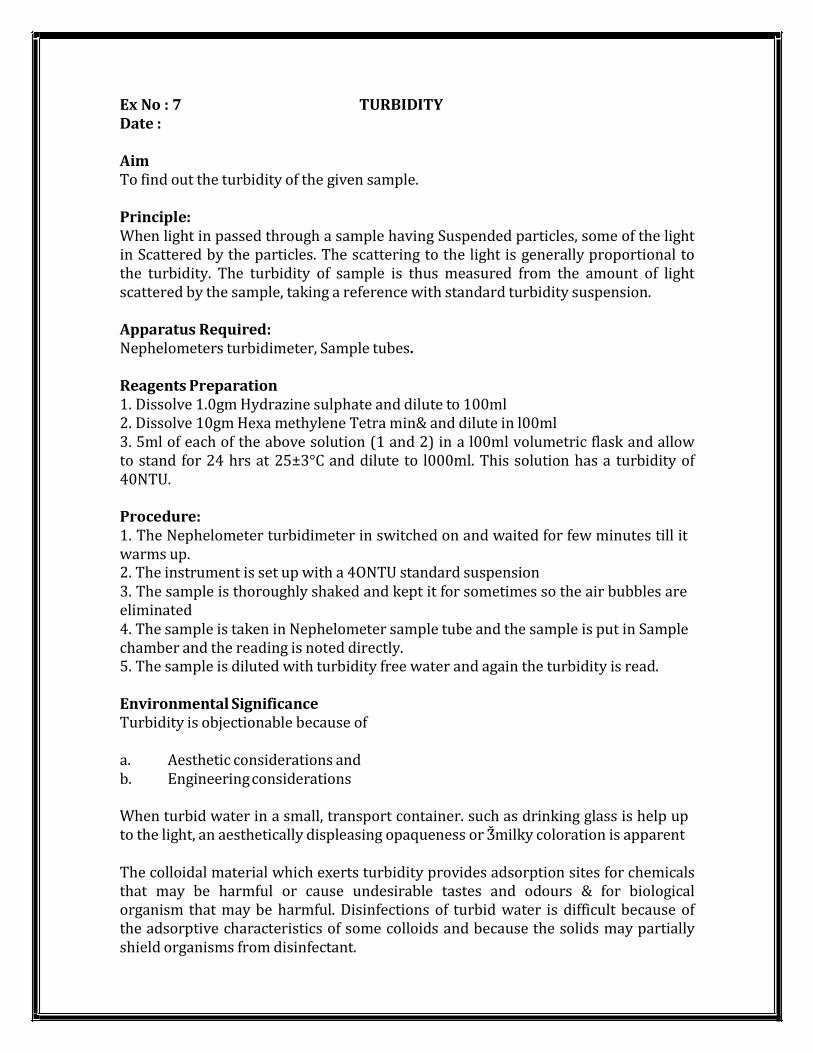
Ex No : 7 TURBIDITY Date :
Aim To find out the turbidity of the given sample.
Principle: When light in passed through a sample having Suspended particles, some of the light in Scattered by the particles. The scattering to the light is generally proportional to
the turbidity. The turbidity of sample is thus measured from the amount of light scattered by the sample, taking a reference with standard turbidity suspension.
Apparatus Required: Nephelometers turbidimeter, Sample tubes.
Reagents Preparation 1. Dissolve 1.0gm Hydrazine sulphate and dilute to 100ml 2. Dissolve 10gm Hexa methylene Tetra min& and dilute in l00ml 3. 5ml of each of the above solution (1 and 2) in a l00ml volumetric flask and allow
to stand for 24 hrs at 25±3°C and dilute to l000ml. This solution has a turbidity of 40NTU.
Procedure: 1. The Nephelometer turbidimeter in switched on and waited for few minutes till it warms up. 2. The instrument is set up with a 4ONTU standard suspension 3. The sample is thoroughly shaked and kept it for sometimes so the air bubbles are
eliminated 4. The sample is taken in Nephelometer sample tube and the sample is put in Sample
chamber and the reading is noted directly. 5. The sample is diluted with turbidity free water and again the turbidity is read.
Environmental Significance Turbidity is objectionable because of
a. Aesthetic considerations and b. Engineering considerations
When turbid water in a small, transport container. such as drinking glass is help up to the light, an aesthetically displeasing opaqueness or Ǯmilky coloration is apparent
The colloidal material which exerts turbidity provides adsorption sites for chemicals
that may be harmful or cause undesirable tastes and odours & for biological organism that may be harmful. Disinfections of turbid water is difficult because of the adsorptive characteristics of some colloids and because the solids may partially
shield organisms from disinfectant.
In natural water bodies, turbidity may impart a brown or other colour to water and
may interfere with light penetration and photosynthetic reaction in streams and
lakes. Turbidity increases the load on slow sand filters. The filter may go out of operation, if excess turbidity exists.
Application of Turbidity Data in Environmental Engineering Practice: Turbidity measurements of particular importance in the field of water supply. They
have limited use in the field of domestic and Industrial waste treatment. 1. Knowledge of the turbidity variation in raw water supplies along with other
information is useful to determine whether a supply repairs Special treatment by
chemical coagulation and filtration before it may be used for a public water supply. 2. Turbidity measurements are used to determine the effectivness of the treatment produced with different chemicals and the dosages needed. 3. Turbidity measurements help to gauge the amount of chemicals needed from day- today in the operation of water treatment works. 4. Measurement of turbidity is settled water prior to filtration is useful in controlling
chemical dosages so as to parent excessive loading or rapid sand filters. 5. Turbidity measurements of the filtered water are needed to check o faculty filter
operation. 6. Turbidity measurements are useful to determine the optimum dosage of coagulants to treat the domestic and Industrial wastes. 7. Turbidity determination is used to evaluate the performance of waste treatment plants.
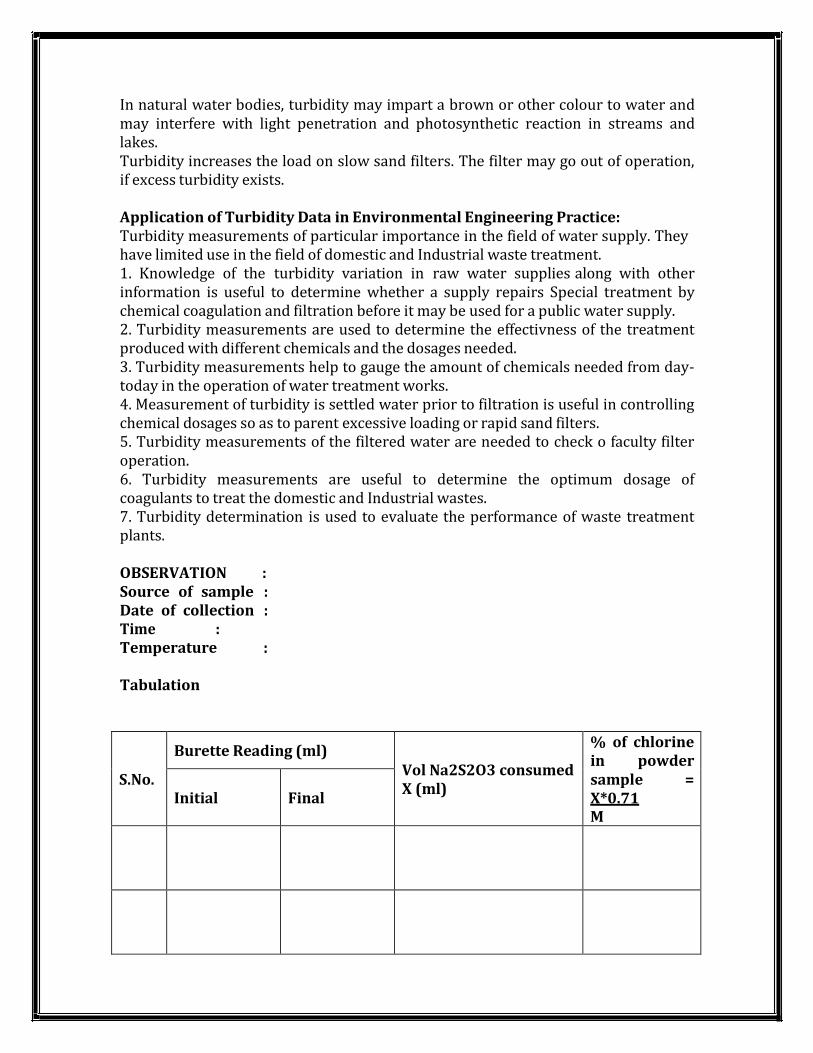
OBSERVATION : Source of sample : Date of collection : Time : Temperature :
Tabulation
S.No.
Burette Reading (ml) Vol Na2S2O3 consumed
X (ml)
% of chlorine
in powder
sample = X*0.71 M
Initial
Final
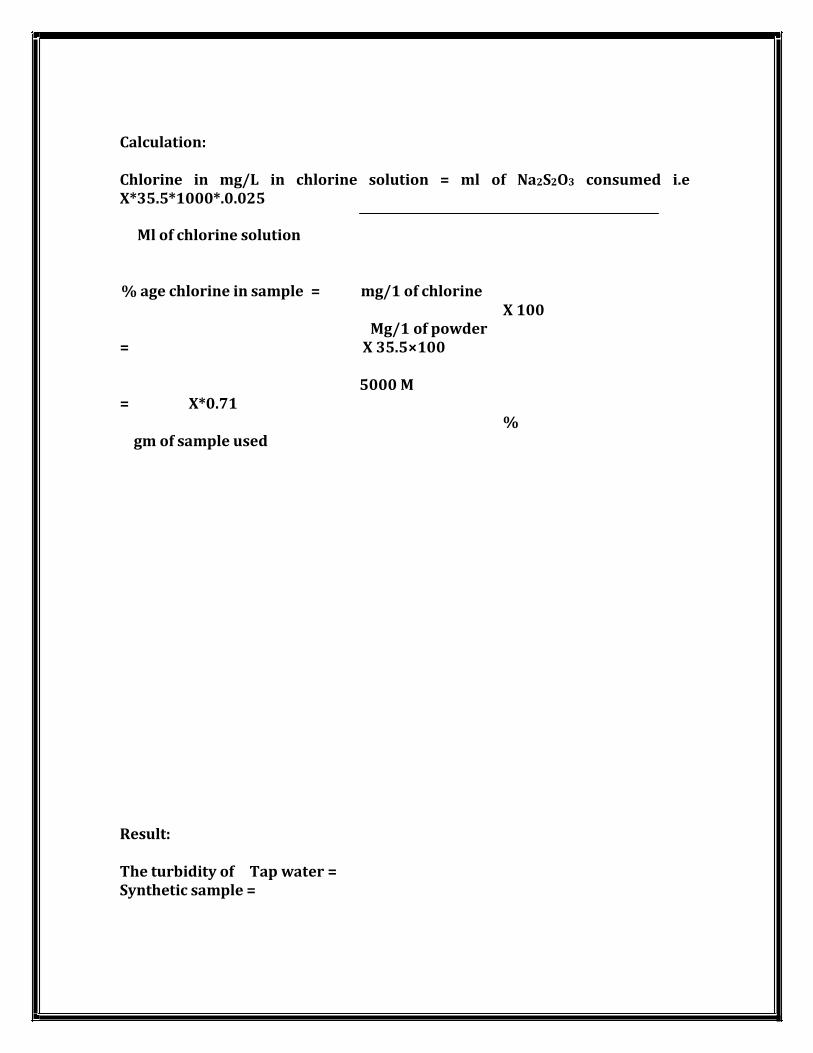
Calculation: Chlorine in mg/L in chlorine solution = ml of Na2S2O3 consumed i.e
X*35.5*1000*.0.025
Ml of chlorine solution
% age chlorine in sample = mg/1 of chlorine
Mg/1 of powder = X 35.5×100
X 100
= X*0.71
gm of sample used
Result:
The turbidity of Tap water =
Synthetic sample =
5000 M
%
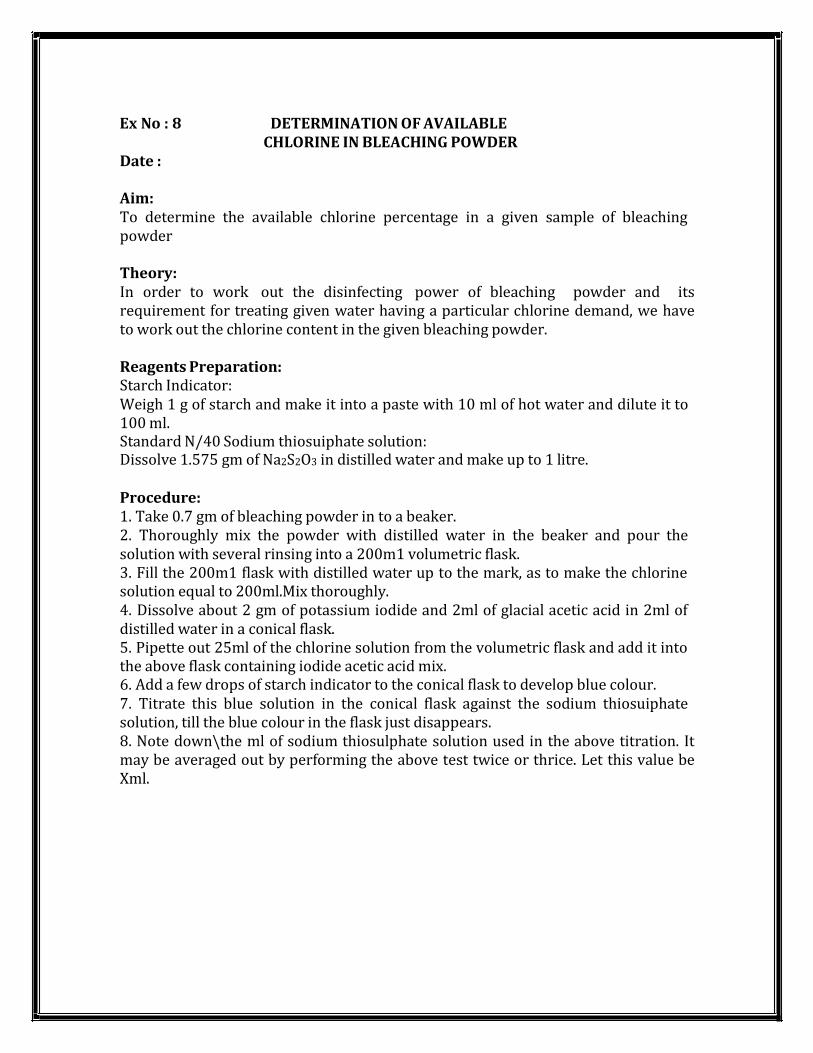
Ex No : 8 DETERMINATION OF AVAILABLE
CHLORINE IN BLEACHING POWDER Date :
Aim: To determine the available chlorine percentage in a given sample of bleaching
powder Theory: In order to work out the disinfecting power of bleaching powder and its
requirement for treating given water having a particular chlorine demand, we have
to work out the chlorine content in the given bleaching powder. Reagents Preparation: Starch Indicator: Weigh 1 g of starch and make it into a paste with 10 ml of hot water and dilute it to
100 ml. Standard N/40 Sodium thiosuiphate solution: Dissolve 1.575 gm of Na2S2O3 in distilled water and make up to 1 litre.
Procedure: 1. Take 0.7 gm of bleaching powder in to a beaker. 2. Thoroughly mix the powder with distilled water in the beaker and pour the
solution with several rinsing into a 200m1 volumetric flask. 3. Fill the 200m1 flask with distilled water up to the mark, as to make the chlorine
solution equal to 200ml.Mix thoroughly. 4. Dissolve about 2 gm of potassium iodide and 2ml of glacial acetic acid in 2ml of distilled water in a conical flask. 5. Pipette out 25ml of the chlorine solution from the volumetric flask and add it into
the above flask containing iodide acetic acid mix. 6. Add a few drops of starch indicator to the conical flask to develop blue colour. 7. Titrate this blue solution in the conical flask against the sodium thiosuiphate
solution, till the blue colour in the flask just disappears. 8. Note down\the ml of sodium thiosulphate solution used in the above titration. It may be averaged out by performing the above test twice or thrice. Let this value be
Xml.

OBSERVATION : Source of sample : Date of collection : Time : Temperature :
Tabulation
S.No.
Vol. of given sample
ml
Weight of empty
crucible
W1gm
Weight after
one
heatingW2gm
Weight after
two heating
W3gm
W2 – W1
Total solids in mg/1 =
Volume of sample
Result:
The percentage chlorine content of the given bleaching powder works out to
be __________________________________
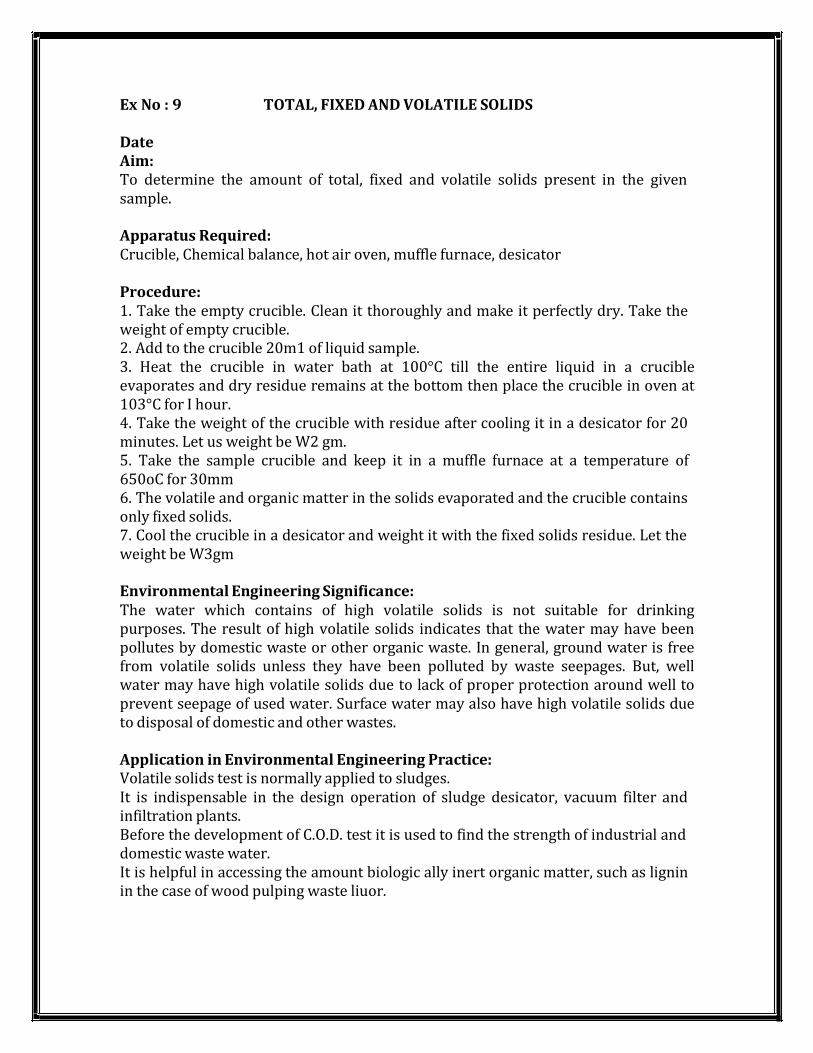
Ex No : 9 TOTAL, FIXED AND VOLATILE SOLIDS Date
Aim: To determine the amount of total, fixed and volatile solids present in the given
sample. Apparatus Required: Crucible, Chemical balance, hot air oven, muffle furnace, desicator
Procedure: 1. Take the empty crucible. Clean it thoroughly and make it perfectly dry. Take the
weight of empty crucible. 2. Add to the crucible 20m1 of liquid sample. 3. Heat the crucible in water bath at 100°C till the entire liquid in a crucible
evaporates and dry residue remains at the bottom then place the crucible in oven at 103°C for I hour. 4. Take the weight of the crucible with residue after cooling it in a desicator for 20
minutes. Let us weight be W2 gm. 5. Take the sample crucible and keep it in a muffle furnace at a temperature of 650oC for 30mm 6. The volatile and organic matter in the solids evaporated and the crucible contains
only fixed solids. 7. Cool the crucible in a desicator and weight it with the fixed solids residue. Let the
weight be W3gm Environmental Engineering Significance: The water which contains of high volatile solids is not suitable for drinking
purposes. The result of high volatile solids indicates that the water may have been
pollutes by domestic waste or other organic waste. In general, ground water is free
from volatile solids unless they have been polluted by waste seepages. But, well water may have high volatile solids due to lack of proper protection around well to
prevent seepage of used water. Surface water may also have high volatile solids due
to disposal of domestic and other wastes. Application in Environmental Engineering Practice: Volatile solids test is normally applied to sludges. It is indispensable in the design operation of sludge desicator, vacuum filter and
infiltration plants. Before the development of C.O.D. test it is used to find the strength of industrial and
domestic waste water. It is helpful in accessing the amount biologic ally inert organic matter, such as lignin
in the case of wood pulping waste liuor.
OBSERVATION : Source of sample : Date of collection : Time : Temperature :
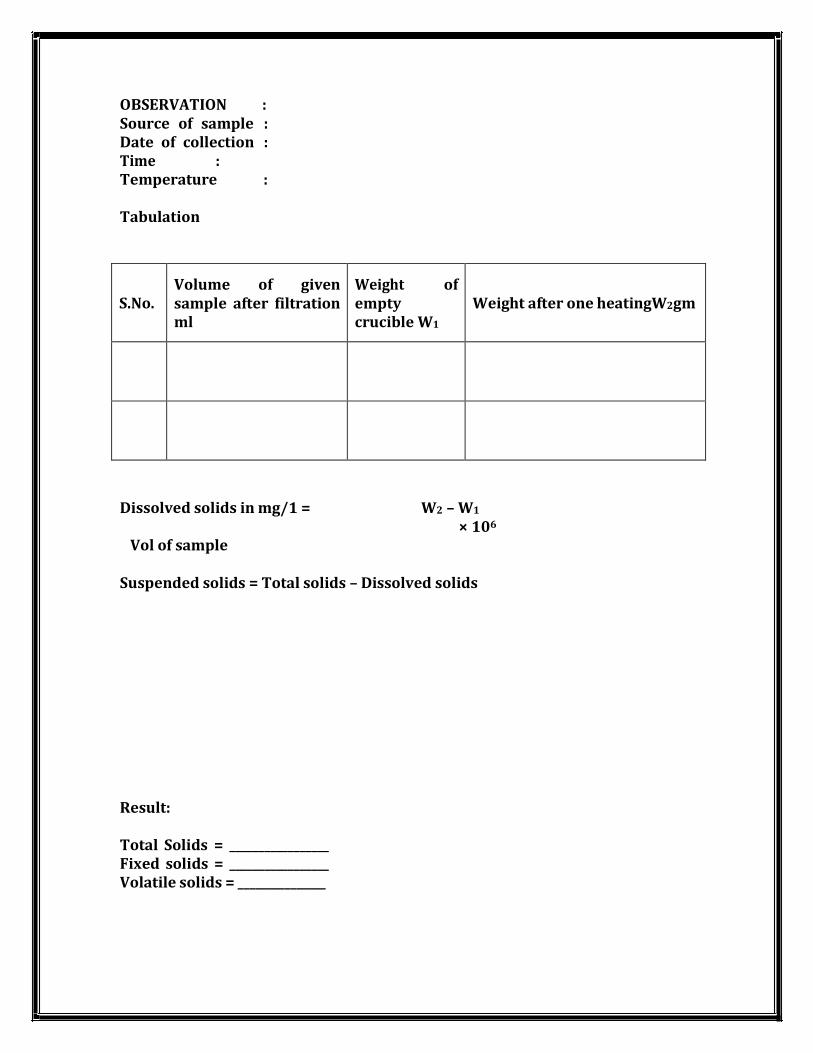
Tabulation
S.No. Volume of given
sample after filtration
ml
Weight of empty
crucible W1
Weight after one heatingW2gm
Dissolved solids in mg/1 = W2 – W1
× 106
Vol of sample
Suspended solids = Total solids – Dissolved solids
Result:
Total Solids = _________________
Fixed solids = _________________
Volatile solids = _______________
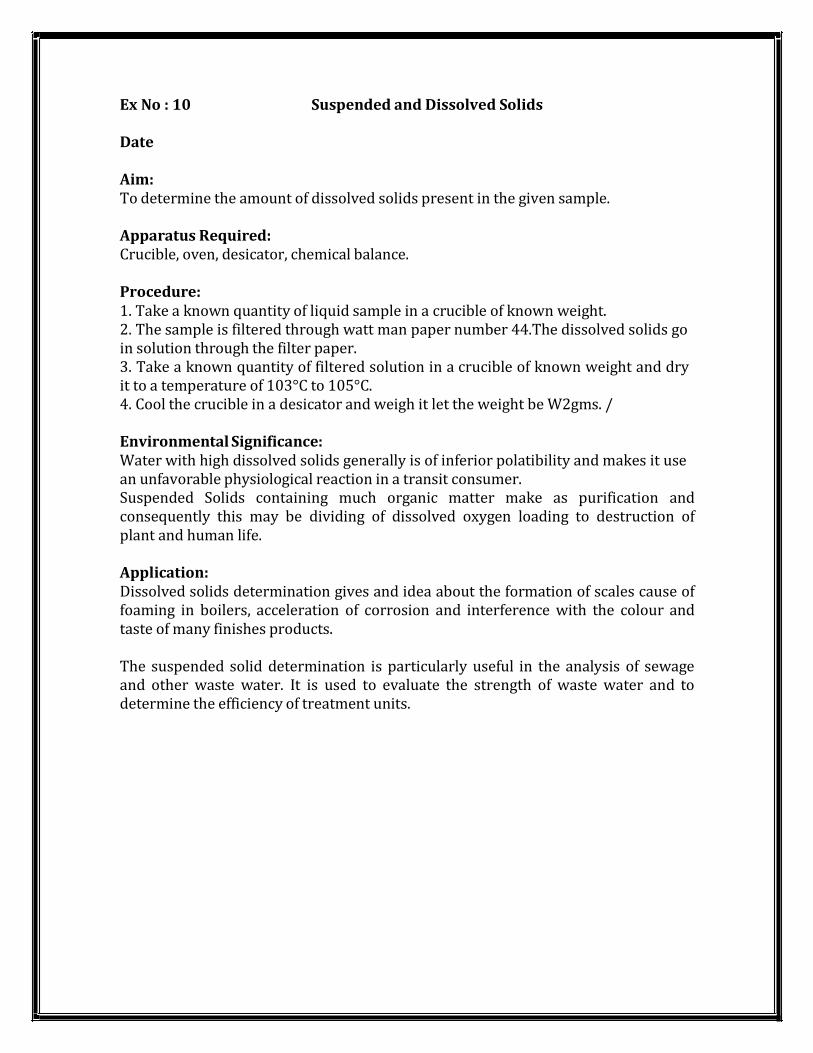
Ex No : 10 Suspended and Dissolved Solids
Date
Aim: To determine the amount of dissolved solids present in the given sample.
Apparatus Required: Crucible, oven, desicator, chemical balance.
Procedure: 1. Take a known quantity of liquid sample in a crucible of known weight. 2. The sample is filtered through watt man paper number 44.The dissolved solids go
in solution through the filter paper. 3. Take a known quantity of filtered solution in a crucible of known weight and dry
it to a temperature of 103°C to 105°C. 4. Cool the crucible in a desicator and weigh it let the weight be W2gms. /
Environmental Significance: Water with high dissolved solids generally is of inferior polatibility and makes it use
an unfavorable physiological reaction in a transit consumer. Suspended Solids containing much organic matter make as purification and
consequently this may be dividing of dissolved oxygen loading to destruction of plant and human life.
Application: Dissolved solids determination gives and idea about the formation of scales cause of foaming in boilers, acceleration of corrosion and interference with the colour and
taste of many finishes products. The suspended solid determination is particularly useful in the analysis of sewage
and other waste water. It is used to evaluate the strength of waste water and to
determine the efficiency of treatment units.

OBSERVATION : Source of sample : Date of collection : Time : Temperature :
Tabulation
S.No.
Sample
details
Volume of given sample
ml
Total settlable
solids
ml/1/hr
Result: Solids present in the given sample
Dissolved solids = ___________________ Suspended solids= ___________________

Ex No: 11 TOTAL SETTLABLE SOLIDS Date
Aim: To find out the total settlable solids of the given sample.
Apparatus Required: Imhoff cone, holding device
Procedure: 1. The imhoff cone is gently filled with the thoroughly well mixed sample usually 1
litre and allowed it to settle. 2. After 45 minutes, the cone is rotated between hands to ensure that all solids
adhering to the sides are loosened. 3. The solids are allowed to settle for 15 mm more to make up for a total period of 1
hour. 4. The volume of the sludge which has settled in the open is noted. 5. The results are expressed in ml settlable solids per litre of sample per hour.
Precautions: 1. The imhoff cones must be cleaned with a strong soap and hot water using a brush. 2. The cone is wetter before use, which helps in preventing adherence of the solids
to the sides. 3. The method is subjected to considerable in accuracy if the solids contain large
fragments. 4. The determination of total settle able solids should be carried out soon after
sampling in order to avoid errors through flocculation. Application: 1. The settlable solids determination is used extensively in the analysis of industrial waste to determine the need for and design of plain settling tank in plants
employing biological treatment process. 2. It is also widely used in waste water treatment plant operation to determine the
efficiency of sedimentation tanks.

OBSERVATION : Source of sample : Date of collection : Time : Temperature :
Tabulation
Sodium thiosulphate Vs given sample S.No.
Volume of given
sample ml
Burette Reading (ml) Indicator
Endpoint
Initial Final
Calculation :
100 ml of N thiosulphate solution = 8 gms of oxygen
Dissolved Oxygen in mg/L = V2×N×8×1000
V1
V1 = Volume of water sample in ml. V2 = Volume of Sodium thiosulphate in ml. N = Normality of sodium thiosulphate
Result: The total settlable solids is= ml/l/hr
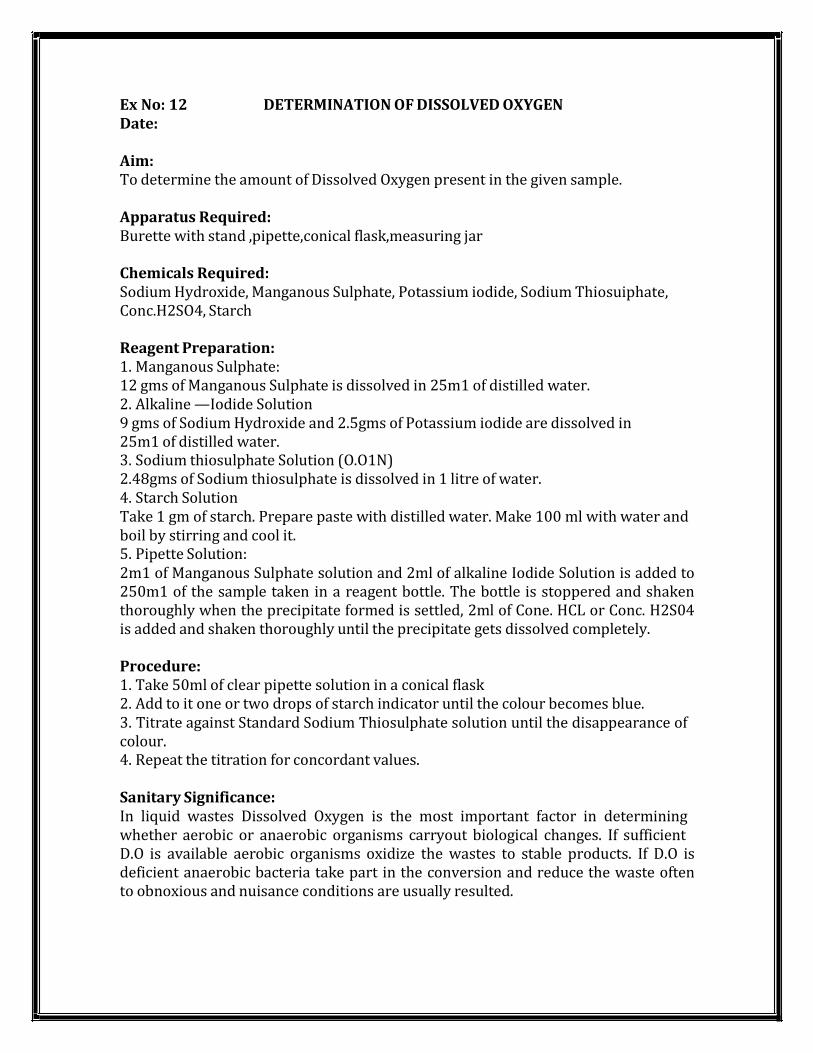
Ex No: 12 DETERMINATION OF DISSOLVED OXYGEN Date:
Aim: To determine the amount of Dissolved Oxygen present in the given sample.
Apparatus Required: Burette with stand ,pipette,conical flask,measuring jar
Chemicals Required: Sodium Hydroxide, Manganous Sulphate, Potassium iodide, Sodium Thiosuiphate, Conc.H2SO4, Starch
Reagent Preparation: 1. Manganous Sulphate: 12 gms of Manganous Sulphate is dissolved in 25m1 of distilled water. 2. Alkaline —Iodide Solution 9 gms of Sodium Hydroxide and 2.5gms of Potassium iodide are dissolved in
25m1 of distilled water. 3. Sodium thiosulphate Solution (O.O1N) 2.48gms of Sodium thiosulphate is dissolved in 1 litre of water. 4. Starch Solution Take 1 gm of starch. Prepare paste with distilled water. Make 100 ml with water and
boil by stirring and cool it. 5. Pipette Solution: 2m1 of Manganous Sulphate solution and 2ml of alkaline Iodide Solution is added to
250m1 of the sample taken in a reagent bottle. The bottle is stoppered and shaken
thoroughly when the precipitate formed is settled, 2ml of Cone. HCL or Conc. H2S04
is added and shaken thoroughly until the precipitate gets dissolved completely. Procedure: 1. Take 50ml of clear pipette solution in a conical flask 2. Add to it one or two drops of starch indicator until the colour becomes blue. 3. Titrate against Standard Sodium Thiosulphate solution until the disappearance of colour. 4. Repeat the titration for concordant values.
Sanitary Significance: In liquid wastes Dissolved Oxygen is the most important factor in determining
whether aerobic or anaerobic organisms carryout biological changes. If sufficient D.O is available aerobic organisms oxidize the wastes to stable products. If D.O is
deficient anaerobic bacteria take part in the conversion and reduce the waste often
to obnoxious and nuisance conditions are usually resulted.
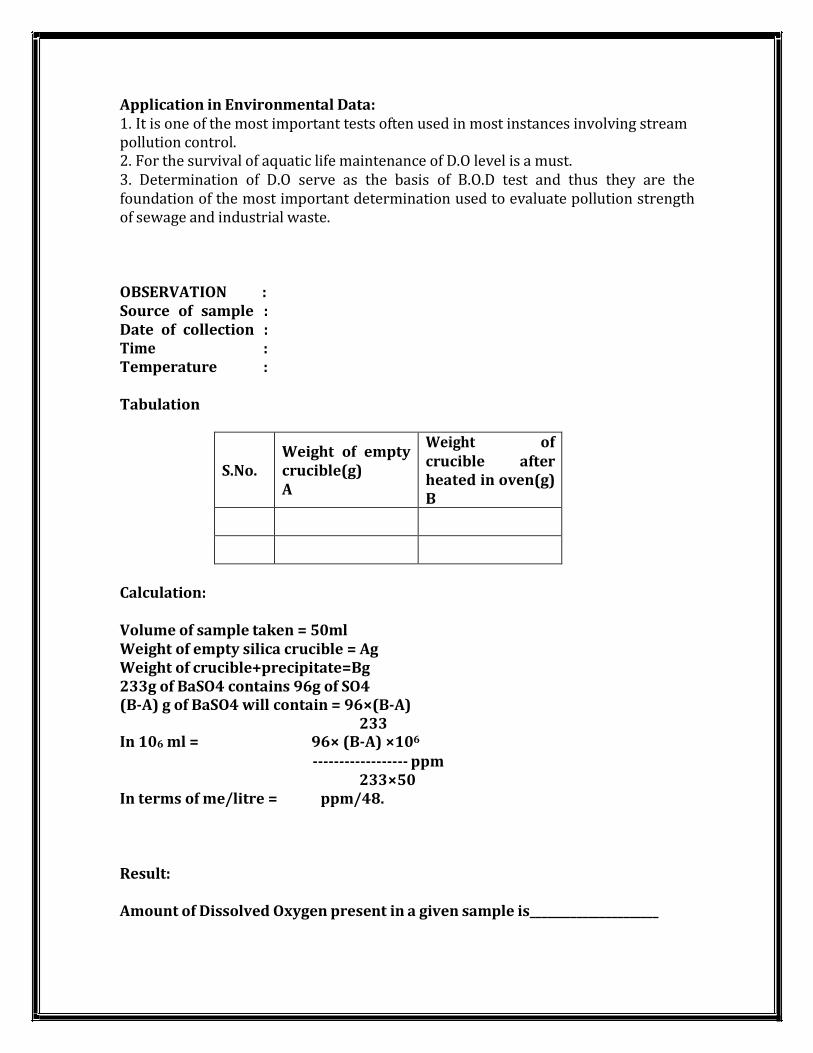
Application in Environmental Data: 1. It is one of the most important tests often used in most instances involving stream
pollution control. 2. For the survival of aquatic life maintenance of D.O level is a must. 3. Determination of D.O serve as the basis of B.O.D test and thus they are the
foundation of the most important determination used to evaluate pollution strength
of sewage and industrial waste. OBSERVATION : Source of sample : Date of collection : Time : Temperature :
Tabulation
S.No.
Weight of empty
crucible(g) A
Weight of crucible after
heated in oven(g)
B
Calculation: Volume of sample taken = 50ml Weight of empty silica crucible = Ag
Weight of crucible+precipitate=Bg
233g of BaSO4 contains 96g of SO4 (B-A) g of BaSO4 will contain = 96×(B-A)
233 In 106 ml = 96× (B-A) ×106
------------------ ppm 233×50
In terms of me/litre = ppm/48. Result:
Amount of Dissolved Oxygen present in a given sample is______________________
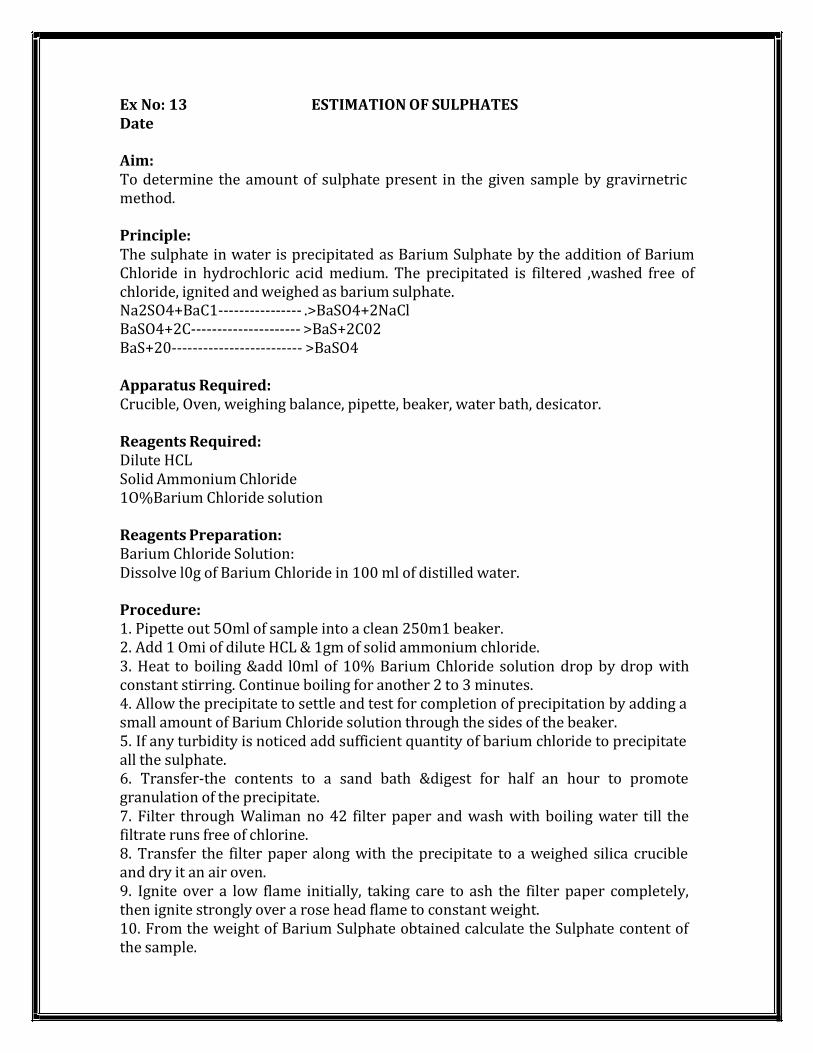
Ex No: 13 ESTIMATION OF SULPHATES Date
Aim: To determine the amount of sulphate present in the given sample by gravirnetric
method. Principle: The sulphate in water is precipitated as Barium Sulphate by the addition of Barium
Chloride in hydrochloric acid medium. The precipitated is filtered ,washed free of chloride, ignited and weighed as barium sulphate. Na2SO4+BaC1---------------- .>BaSO4+2NaCl BaSO4+2C--------------------- >BaS+2C02 BaS+20------------------------- >BaSO4
Apparatus Required: Crucible, Oven, weighing balance, pipette, beaker, water bath, desicator.
Reagents Required: Dilute HCL Solid Ammonium Chloride
1O%Barium Chloride solution Reagents Preparation: Barium Chloride Solution: Dissolve l0g of Barium Chloride in 100 ml of distilled water.
Procedure: 1. Pipette out 5Oml of sample into a clean 250m1 beaker. 2. Add 1 Omi of dilute HCL & 1gm of solid ammonium chloride. 3. Heat to boiling &add l0ml of 10% Barium Chloride solution drop by drop with
constant stirring. Continue boiling for another 2 to 3 minutes. 4. Allow the precipitate to settle and test for completion of precipitation by adding a
small amount of Barium Chloride solution through the sides of the beaker. 5. If any turbidity is noticed add sufficient quantity of barium chloride to precipitate
all the sulphate. 6. Transfer-the contents to a sand bath &digest for half an hour to promote
granulation of the precipitate. 7. Filter through Waliman no 42 filter paper and wash with boiling water till the
filtrate runs free of chlorine. 8. Transfer the filter paper along with the precipitate to a weighed silica crucible
and dry it an air oven. 9. Ignite over a low flame initially, taking care to ash the filter paper completely, then ignite strongly over a rose head flame to constant weight. 10. From the weight of Barium Sulphate obtained calculate the Sulphate content of the sample.
Environmental Significance: Sulphates in natural waters in concentrations ranging from a few to thousand
mg/L.Excess Na2SO4 and MgSO4 should not be present in drinking waters as they
cause Cathartic action. Higher Concentration of Sodium Sulphate in water can cause
malfunctioning of the alimentary canal. So the recommended upper limit is 250m/l in water intended for human consumption. In anaerobic decomposition of waste
waters, Suiphates are reduced to hydrogen Sulphide causing obnoxious odours and
promote corrosion of sewers.Sulphates are reduced to sulphide in sludge digesters
and may upset the biological process, if the sulphide concentration exceeds
200mg/L. Application of Sulphate Data in Environmental Engineering Practice:
1. The sulphate content of natural waters is an important consideration in
determining their suitability for public and industrial water supplies. 2. The amount of sulphate in waste water is a factor of concern in determining the
magnitude of problems that can arise from reduction of sulphates to hydrogen
sulphide. 3. A knowledge of the sulphate content of the sludge or waste fed to digestion units
provides a means of estimating the hydrogen sulphide content of the gas produced. From this information, the design engineer can determine whether scrubbing
facilities will be needed to remove hydrogen sulphides and size of the units
required. Result:
The amount of Sulphate present in the given sample _________mg/L.

Ex No: 14 DETERMINATION OF FLUORIDES Date :
Aim: To determine the fluorides present in the give sample.
Apparatus Required: Burette with stand, Pipette, Conical flask, measuring flask.
Chemical required: Oxalate, concentrated hydrochloric acid, phenolphthalein indicator, sodium
hydroxide. Reagents Preparation: Oxalate Solution:
Dissolve 630mg of oxalate in distilled water and make up to l00ml.
Phenolphthalein indicator: Add ig of phenolphthalein in 200 ml distilled water and dissolve it. Add 0.02N
Sodium hydroxide solution drop wise until a faint pink colour appears. Sodium hydroxide solution: Dissolve 4g of sodium hydroxide in distilled water and make up to 100ml.
Procedure: Titration — I NaoH Vs Oxalic acid 1. Pipette 20m1 of oralic acid solution into the conical flast. 2. Add one or two drops of phenolphthalein indicator. 3. Titrate against sodium hydroxide solution until the appearance of pink
colour. 4. Repeat the titration for concordant values.
Titration —II NaoH Vs Sample: 1. Take 19m1 of sample in the conical flask and add 1 ml of concentrated
hydrochloric acid. 2. Add one or two drops of phenolphthalein indicator. 3. Titrate against sodium hydroxide solution until the appearance of pink colour. 4. Repeat the titration for concordant values.

OBSERVATION : Source of sample : Date of collection : Time : Temperature :
Tabulation
Titration – I NaoH Vs Oxalic acid
Sample
details
Volume
sample
taken (ml)
Burette reading (ml) Volume of NaoH used
(ml)
End Point Initial
reading Final reading
Oxalic acid
Appearance
of pale pink
colour
Titration – II NaoH Vs Sample
Sample
details
Volume
sample
taken (ml)
Burette reading (ml) Volume of NaoH used
(ml)
End Point Initial
reading Final reading
Tap Water
Appearance
of pale pink
colour
Titration – III NaoH Vs HCL
Sample
details
Volume
sample
taken (ml)
Burette reading (ml) Volume of NaoH used
(ml)
End Point Initial
reading Final reading
Conc .HCL
Appearance
of pale pink
colour

Calculation: Titration I Volume of oxalic acid×Normality of oxalic acid
Normality of NaOHX = Volume of NaOH
Titration II Volume of NaOH×Normality of NaOH
Normality of SampleY = Volume of sample
Amount of Flourides =
Volume of Sample Titration — Ill NaoH Vs Hcl:
Titration II-III×X×Y
1. Take 19m1 of distilled water in the conical flask and add imi of concentrated
hydrochloric acid. 2. Add one or two drops of phenolphthalein indicator. 3. Titrate against sodium hydroxide solution until the appearance of pink colour. 4. Repeat the titration for concordant values.
Environmental Significance Fluorine in Human health Presence of large amount of fluoride is associated with dental and skeletal fluorisis
(>1.5 mg/i) and in adequate amounts with dental caries (<I ing/i) Dental Fluorosis In young children the diseases affects only on the teeth. This is known as dental fluorosis.The teeth lose their shiny appearance and chalk-white patches develop on
them . This is known as mottled enamel and is an early sign of dental fluorisis.The
white patches later become yellow and turn brown or black. Skeletal Fluorosis Inn aged people the disease affects the bones, tendons and ligaments. This is known
as skeletal fluorosis.This is followed by pain and stiff of the back and later the joints
of both limbs and limitation of neck movements.
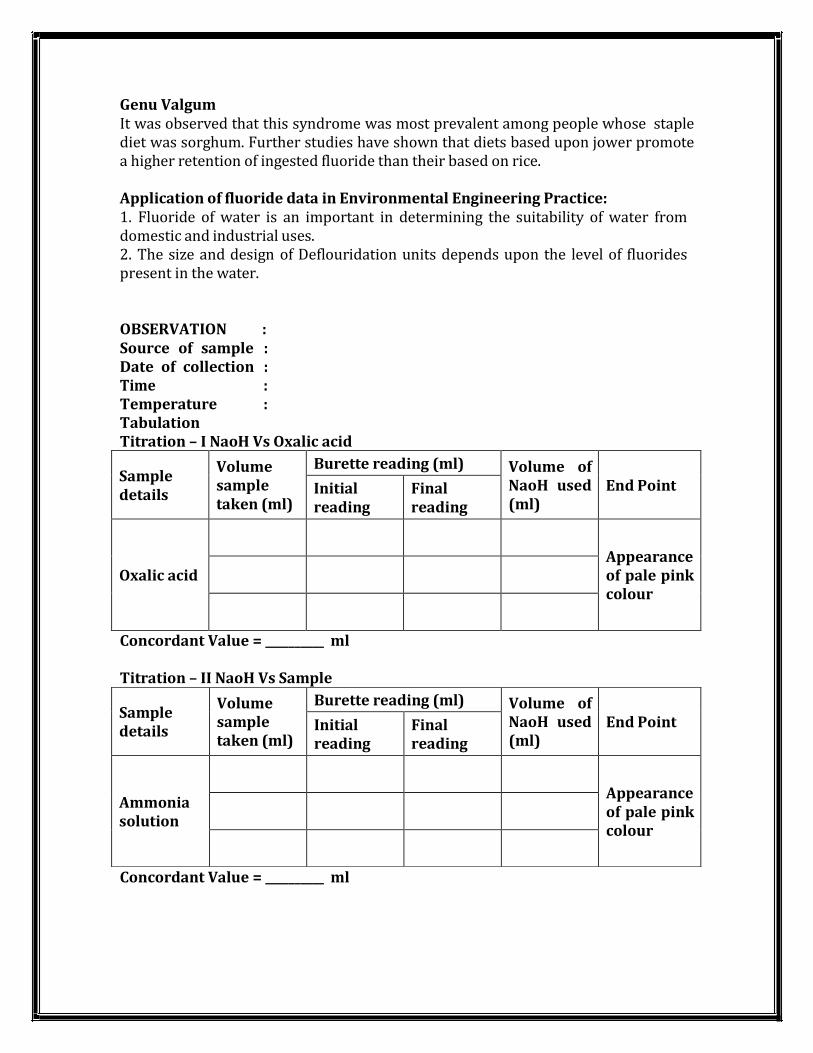
Genu Valgum It was observed that this syndrome was most prevalent among people whose staple
diet was sorghum. Further studies have shown that diets based upon jower promote
a higher retention of ingested fluoride than their based on rice.
Application of fluoride data in Environmental Engineering Practice: 1. Fluoride of water is an important in determining the suitability of water from
domestic and industrial uses. 2. The size and design of Deflouridation units depends upon the level of fluorides
present in the water.
OBSERVATION : Source of sample : Date of collection : Time : Temperature : Tabulation Titration – I NaoH Vs Oxalic acid
Sample
details
Volume
sample
taken (ml)
Burette reading (ml) Volume of NaoH used
(ml)
End Point Initial
reading Final reading
Oxalic acid
Appearance
of pale pink
colour
Concordant Value = __________ ml
Titration – II NaoH Vs Sample
Concordant Value = __________ ml
Sample
details
Volume
sample
taken (ml)
Burette reading (ml) Volume of NaoH used
(ml)
End Point Initial
reading Final reading
Ammonia
solution
Appearance
of pale pink
colour
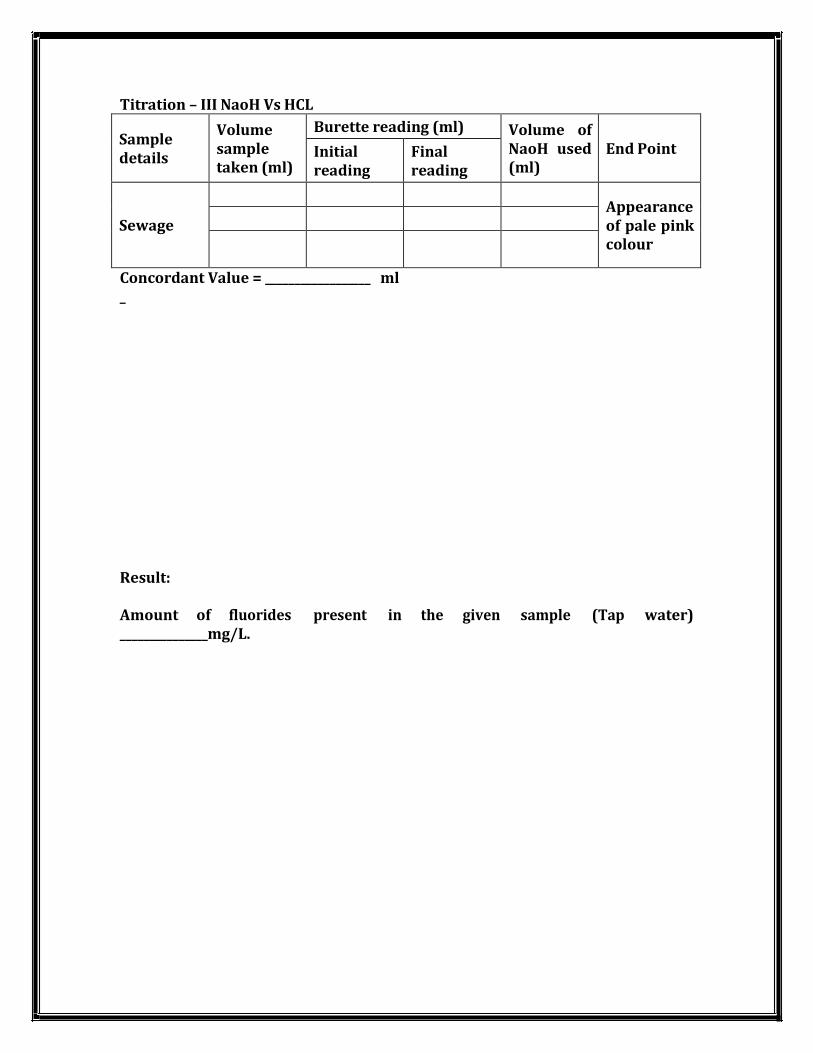
Titration – III NaoH Vs HCL
Sample
details
Volume
sample
taken (ml)
Burette reading (ml) Volume of NaoH used
(ml)
End Point Initial
reading Final reading
Sewage
Appearance
of pale pink
colour
Concordant Value = __________________ ml _
Result:
Amount of fluorides present in the given sample (Tap water) _______________mg/L.

Ex.No:15 DETERMINATION OF AMMONIACAL NITROGEN Date:
Aim: To determine the ammoniacal nitrogen present in the givJsamp1e.
Apparatus Required: Burette with stand, Pipette, Conical flask, measuring flask.
Chemical required: Oxalate, concentrated hydrochloric acid, phenolphthalein indicator, sodium
hydroxide, ammonia solution. Reagents Preparation: Oxalate Solution: Dissolve 630mg of oxalate in distilled water and make up to l00ml.
Phenolphthalein indicator: Add 1g of phenolphthalein in 200 ml distilled water and dissolve it. Add
0.02N Sodium hydroxide solution drop wise until a faint pink colour appears. Sodium hydroxide solution: Dissolve 4g of sodium hydroxide in distilled water and make up to l00ml.
Standard Hydrochloric acid: Dissolve 2 ml of HC1 in distilled water and make upto 100 ml.
Procedure: Titration — I NaoH Vs Oxalic acid 1. Pipette 20ml of oxalic acid solution into the conical flask 2. Add one or two drops of phenolphthalein indicator. 3. Titrate against sodium hydroxide solution until the appearance of pink colour. 4. Repeat the titration for concordant values.
Titration —II NaoH Vs Ammonia 1. Take l7ml of distilled water in the conical flask and add lml of ammonia solution
and 2 ml of hydrochloric acid. 2. Add one or two drops of phenolphthalein indicator. 3. Titrate against sodium hydroxide solution until the appearance of pink colour. 4. Repeat the titration for concordant values.

Calculation: Titration I Volume of oxalic acid×Normality of oxalic acid (0.1)
Normality of NaOH = Volume of NaOH
Titration II Volume of NaOH× Normality of NaOH×0.0091
Normality of Sample X = Volume of sample
X×Vol of NaOH Amount of Ammoniacal Nitrogen in mg/L = ×1000
Volume of Sample Titration — III NaoH Vs sample
1. Take 17m1 of distilled water in the conical flask and add 1ml of sample and 2 ml of hydrochloric acid. 2. Add one or two drops of phenolphthalein indicator. 3. Titrate against sodium hydroxide solution until the appearance of pink colour. 4. Repeat the titration for concordant values.
Environmental Significance I. Excess of ammonia in the form of nitrogen leads to Eutrophication in lakes. 2. Consumption of Nitrogen greater than 2mg/I in drinking water may lead to
mathemoglobonemia in children. APPLICATION 1. Determination of ammoniacal nitrogen used for standardizing the drinking water
supply. 2. The data is used in the treatment of waste water before it is subjected to water
courses. 3. It is also used to determine the extend of eutrophication and possible methods of removal of Nitrogen.

OBSERVATION : Source of sample : Date of collection : Time : Temperature : Tabulation Titration – I NaoH Vs Oxalic acid
Sample
details
Volume
sample
taken (ml)
Burette reading (ml) Volume of NaoH used
(ml)
End Point Initial
reading Final reading
Concordant Value = _________ ml
Calculation:
COD mg/L = (A-B) C×8×1000 ---------------------- ml.of sample used
Where
A = ml of ferrous ammonium sulphate used for balnk
B = ml of ferrous ammonium sulphate used for sample
C = Normality of ferrous ammonium sulphate solution
Result:
Amount of Ammoniacal Nitrogen present in the given sample is------------ mg/L
Ex No: 16 DETERMINATION OF COD Date:
Aim: To determine the amount of Chemical Oxygen Demand present in the given sample.
Principle: COD test is widely used for measuring the pollution strength of waste water. All organic compounds with a few exceptions can be oxidized to C02 and water by the
action of strong oxidizing agents regardless of biological assimilability of the
substances. Apparatus Required: 1. COD Reactor 2. Burette with stand 3. Pipette 4. Measuring jar 5. Tiles 6. Beakers 7. Conical flask
Chemicals Required: 1. Sid. Potassium dichrornate 2. Conc. Sulphuric acid 3. Ferroin indicator solution 4. Std. Ferrous ammonium sulphate solution 5. Mercuric Sulphate
Reagents Preparation: Std. Potassium dichromate (0.25 N) solution: Dissolve 12.26 gm of Potassium dichromate previously dried at 180°C for 2 hr in
distilled water and diluted to 1 litre. Ferroin Indicator Solution: Dissolve 1 .485 gm of 1, 10 Phenophtholine sulphate monohydrate with 0.695gm of ferrous Sulphate (FeSO4.7H20) in water and dilute to l00ml.
Std.Ferrous Am ‘no ni urn Sulphateȋ0.25NȌ: Dissolve 98gm FAS in distilled water and add 20m1 of Conc.H2S04.Cool and dilute
to I Iitre.This solution must be standardized against the K2Cr2O7 every day of its
use.
Procedure: 1. Take 50m1 of sample in a flask and add boiling chips and 1gm of HgSO4 and 5 ml of H2S04 add slowly to dissolve HgSO4 and cool the mixture. 2. Add 25 ml of 0.25N K2Cr2O7 solution and gain mix. Attach the condense and start the cooling water. The remaining acid agent is added thoroughly through the open
end of condenser and the efflux mixture was mixed. Apply the heat and reflux for
2hrs. 3. Dilute the mixture to about 300m1 and titrate excess dichromate with std.FAS
using Ferro in indicator. 4. The colour will change from yellow to green to blue and finally red and the ml of titrate was deduced. 5. Reflux on the same manner to a flask consisting of distilled water, equal to the
volume of the sample and the reagents titrate as he sample and ml of titrant was
deduced. Environmental Significance: 1. BOD cannot be determined accurately when toxins are present and conditions are
un favour for the growth of microbes. 2. BOD test consumes more time i.e a minimum of 5 days where COD test is
relatively faster than BOD taking only 3hr for completion. Application of COD: 1. COD test used extensively in the analysis of industrial wastes. 2. It is particularly valuable in survey system to determine and control losses in
sewer system. 3. This Lest is widely used I BOD in the operation of treatment facilities because of the speed with which the result can be obtained. 4. It is useful to access the strength of waste which contains toxins and biological resultant and organic substance. 5. The ratio of BOD to COD is useful to Access the amenability of waste for biological treatment. 6. The ratio of BOD to COD is greater than or equal to 0.8 indicates that the waste
water are highly amenable to biological treatment.