Embed Size (px)
Citation preview
* Information in this press release reflects program status up to the release of the President’s Budget for FY 2021 and
not current program status.
Department of Defense
Comprehensive Selected Acquisition Reports
for the Annual 2019 Reporting Requirement as Updated by the
President’s Fiscal Year 2021 Budget
The Department of Defense (DoD) has released details on major defense acquisition program
cost, schedule, and performance changes for the December 2019 reporting period. This information
is based on the comprehensive annual Selected Acquisition Reports (SARs) through the first quarter
of FY 2020, as updated by the President’s Fiscal Year (FY) 2021 budget submitted to Congress on
May 26, 2020.*
SARs summarize the latest estimates of cost, schedule, and performance status. These reports
are prepared annually in conjunction with submission of the President's Budget. Subsequent
quarterly exception reports are required only for those programs experiencing unit cost increases of
at least 15 percent or schedule delays of at least six months. Quarterly SARs are also submitted for
initial reports, final reports, and for programs that are rebaselined at major milestone decisions.
The total program acquisition cost estimates provided in the SARs include research and
development, procurement, military construction, and acquisition-related operations and
maintenance. These totals reflect actual costs to date as well as future anticipated costs. All
estimates are shown in fully inflated then-year dollars.
The prior estimate of program acquisition costs for programs covered by SARs for the
reporting period for December 2018 (87 programs) was $2,022,806 million. The current estimate
for December 2019 (86 programs) is $2,020,299 million.
New SARs
DoD is submitting no new SARs for the December 2019 reporting period.
Summary Explanations of Selected SAR Cost Changes
(As of May 26, 2020)
Program Cost Changes
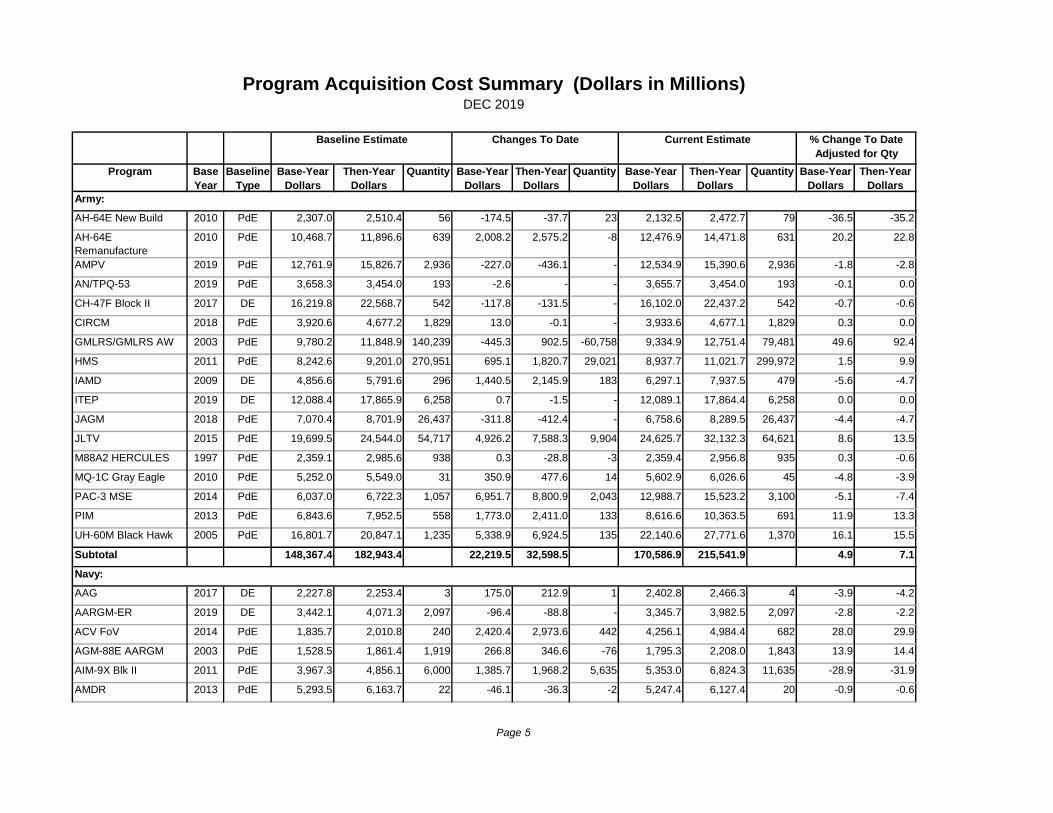
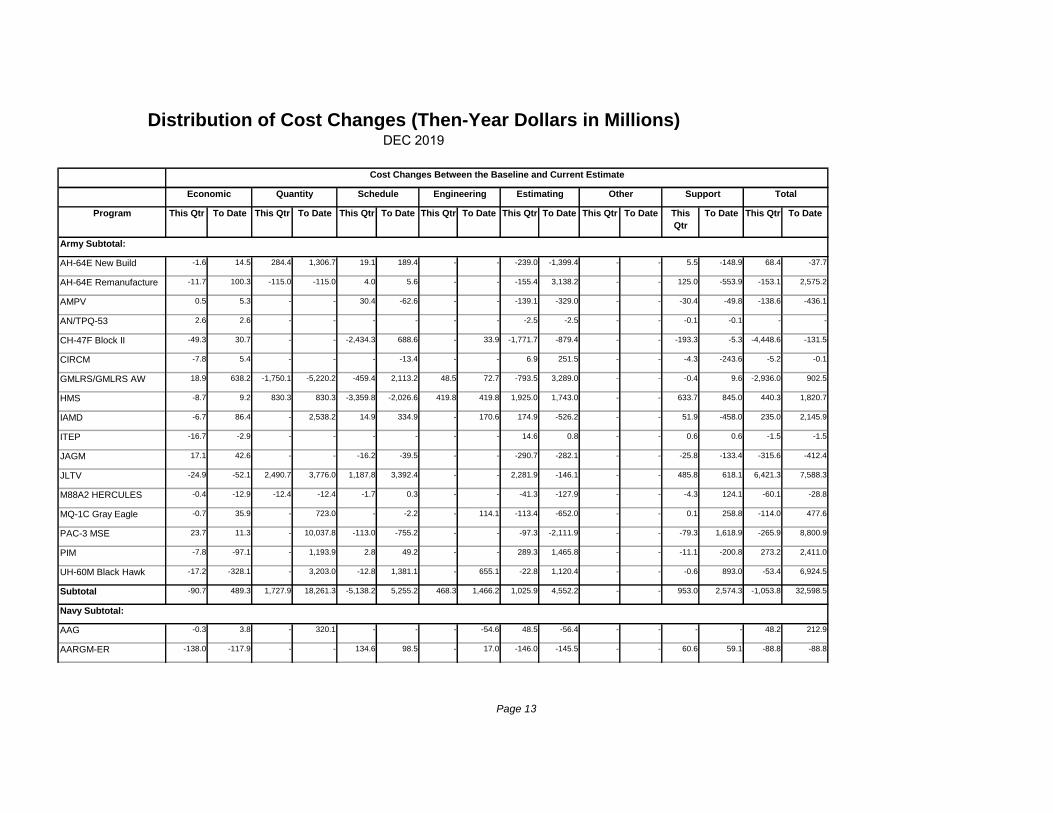
Army - Total program costs for the Army have decreased $1,053.8 million (-0.5%) from
$216,595.7 million to $215,541.9 million. The changes that have increased or decreased
greater than $1 billion or 10% are below:
CH-47F Modernized Cargo Helicopter (CH-47F Block II) - Program costs decreased $4,448.6
million (-16.5%) from $26,885.8 million to $22,437.2 million, due primarily to a revised schedule
that adjusts the end of production seven years earlier from FY 2049 to FY 2042.
Guided Multiple Launch Rocket System/Guided Multiple Launch Rocket System Alternative
Warhead (GMLRS/GMLRS AW) - Program costs decreased $2,936.0 million (-18.7%) from
2
$15,687.4 million to $12,751.4 million, due primarily to a decrease of 17,969 GMLRS AW and
Unitary rockets from 97,051 to 79,082.
Joint Light Tactical Vehicle (JLTV) - Program costs increased $6,421.3 million (+25%) from
$25,711.0 million to $32,132.3 million, due primarily to an increase of 6,299 JLTV’s from 9,091
to 15,390 for the Navy, the stretch-out of the Army’s procurement buy profile end date from FY
2034 to FY 2041, and a revised estimate for a manufacturing increase based on the addition of
trailers from zero to 18,224.
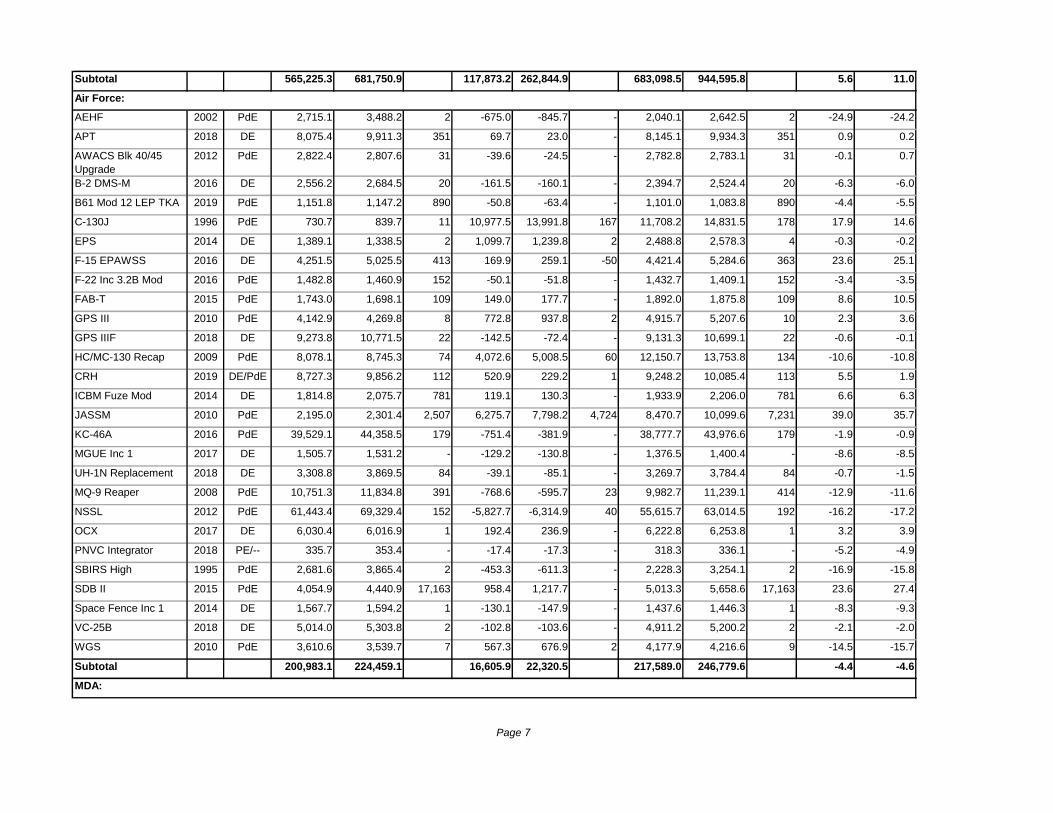
Navy – Total program costs for the Navy have increased $13,755.4 million (+1.5%) from
$930,840.4 million to $944,595.8 million. The changes that have increased or decreased
greater than $1 billion or 10% are below:
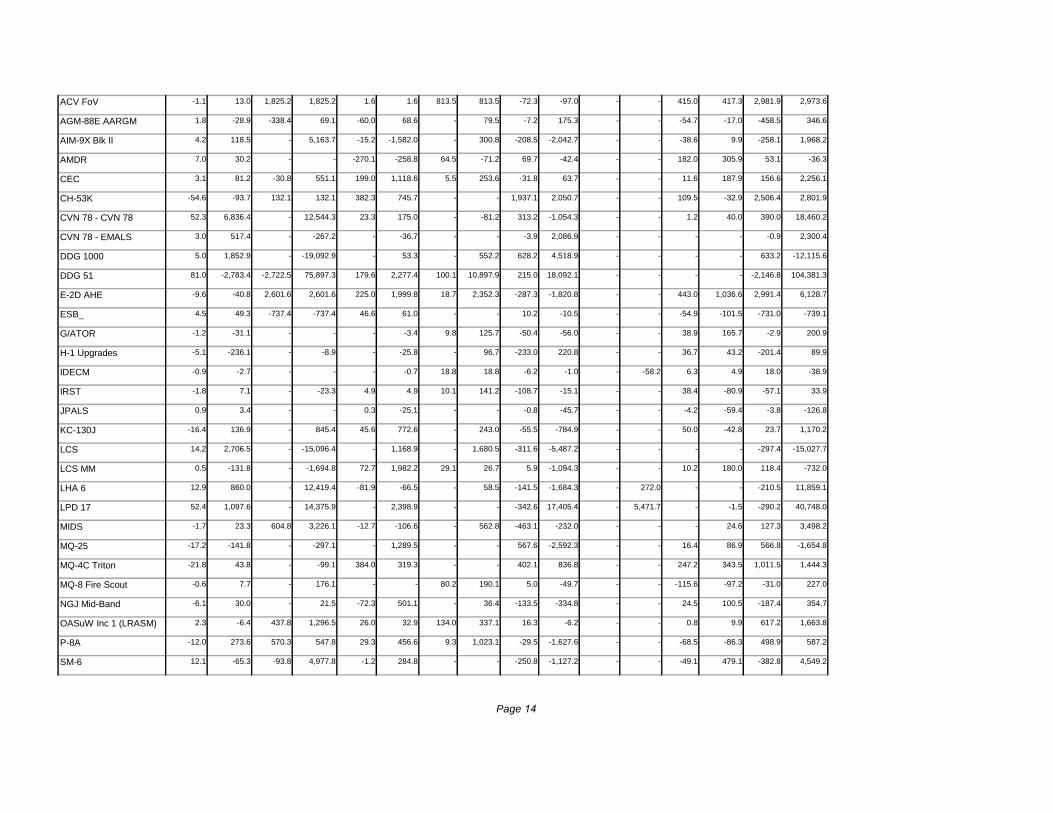
Amphibious Combat Vehicle Family of Vehicles (ACV FoV) - Program costs increased
$2,981.9 million (+148.9%) from $2,002.5 million to $4,984.4 million, due primarily to an
increase of 432 vehicles from 204 to 636 due to the merger of ACV 1.1 and 1.2 programs.
AGM-88E Advanced Anti-Radiation Guided Missile (AGM-88E AARGM) - Program costs
decreased $458.5 million (-17.2%) from $2,666.5 million to $2,208.0 million, due primarily to a
decrease of 632 AARGMs from 2,435 to 1,803.
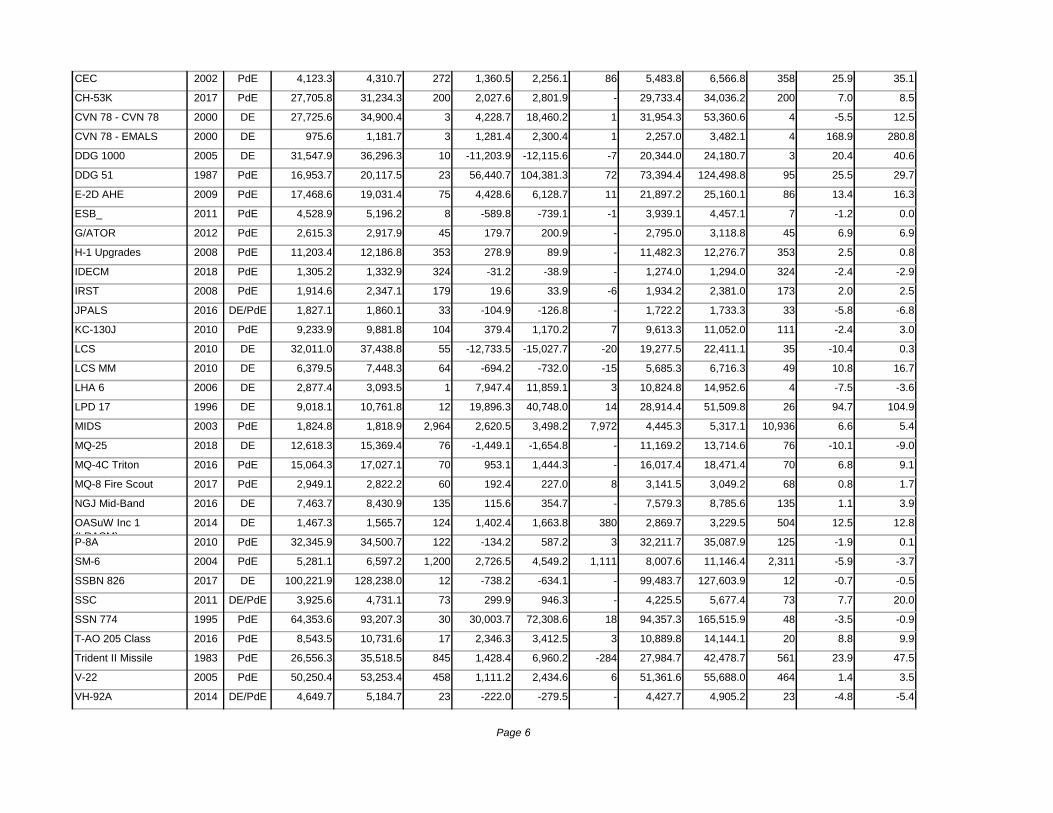
(CH-53K) – Program costs increased $2,506.4 million (+8%) from $31,529.8 million to
$34,036.2 million, due primarily to a stretch-out of the procurement buy profile to add two years
in FY 2029 and 2030.
DDG 51 Arleigh Burke Class Guided Missile Destroyer (DDG 51) - Program costs decreased
$2,146.8 million (-1.7%) from $126,645.6 million to $124,498.8 million, due primarily to a
decrease of two DDGs from 97 to 95, which was offset by a revised estimate to reflect an
increase in outfitting and post-delivery requirements.
Expeditionary Sea Base (ESB_) - Program costs decreased $731.0 million (-14.9%) from
$5,188.1 million to $4,457.1 million, primarily due to the removal of ESB 8 and refined
requirements for ESB 4, ESB 5, ESB 6, and ESB 7.
MQ-4C Triton Unmanned Aircraft System (MQ-4C Triton) - Program costs increased $1,011.5
million (+5.8%) from $17,459.9 million to $18,471.4 million, due primarily to an increase in
Other Support resulting from a production extension of two years and depot standup realignment
to FY 2026 and beyond, and a stretch-out of the procurement buy profile by two years to FY
2035.
Offensive Anti-Surface Warfare Increment 1 (Long Range Anti-Ship Missile) (OASuW Inc 1
(LRASM)) - Program costs increased $617.2 million (+23.6%) from $2,612.3 million to
$3,229.5 million, due primarily to an increase of 129 All Up Rounds from 50 to 179 for the Air
Force.
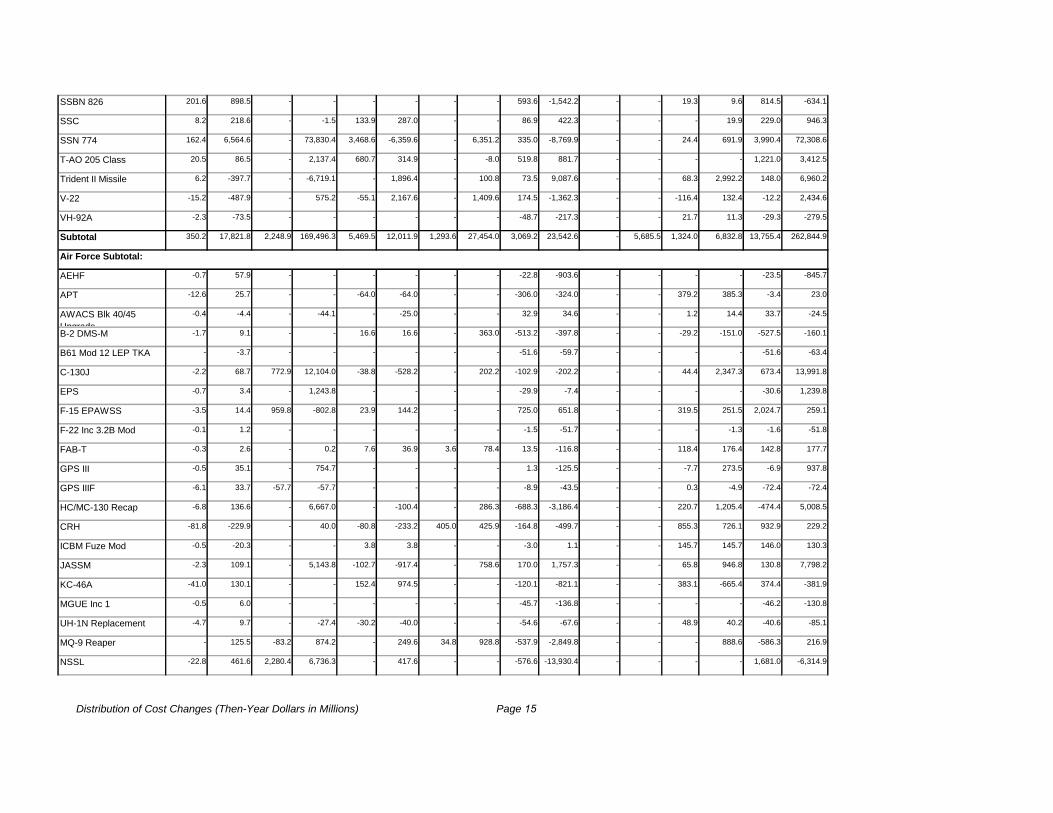
SSN 774 Virginia Class Submarine (SSN 774)- Program costs increased $3,990.4 million
(+2.5%) from $161,525.5 million to $165,515.9 million, due primarily to the stretch-out of the
3
procurement profile of two submarines, one FY 2020 ship to FY 2028 and one FY 2021 ship to
FY 2029, and a revised estimate for Block VI FY 2024 Economic Order Quantity (EOQ)
procurement for FY 2027 SSNs.
T-AO 205 John Lewis Class Fleet Replenishment Oiler (T-AO 205 Class) - Program costs
increased $1,221.0 million (+9.5%) from $12,923.1 million to $14,144.1 million, due primarily
to a revised estimate and shift and stretch in the procurement buy profile due to the movement of
quantities out of FY 2021-FY 2023 to FY 2024, FY 2034, and FY 2035.
Air Force - Total program costs for the Air Force have increased $3,677.9 million (+1.5%)
from $243,101.7 million to $246,779.6 million. The changes that have increased or
decreased greater than $1 billion or 10% are below:
B-2 Defensive Management System - Modernization (B-2 DMS-M)- Program costs decreased
$527.5 million (-17.3%) from $3,051.9 million to $2,524.4 million, due primarily to a revised
estimate to align to the FY 2021 President’s Budget which transitioned DMS-M to a displays
only program.
F-15 Eagle Passive Active Warning Survivability System (F-15 EPAWSS) - Program costs
increased $2,024.7 million (+62.1%) from $3,259.9 million to $5,284.6 million, due primarily to
an increase of 140 aircraft (from 36 to 221) that will receive the system.
HH-60W Combat Rescue Helicopter (CRH) - Program costs increased $932.9 million (+10.2%)
from $9,152.5 million to $10,085.4 million, due primarily to an increase for procurement
modification capability upgrade retrofit kits and the realignment of flyaway and initial spares.
MQ-9 Reaper Unmanned Aircraft System (MQ-9 Reaper) - Program costs decreased $1,398.9
million (-11.7%) from $12,638.0 million to $11,239.1 million, due primarily to revised estimates
to incorporate a reduction in funding due to the cancelation of Block 50 Ground Control Station
Procurement, and Congressional marks in FY 2020.
National Security Space Launch (NSSL) - Program costs increased $1,681.0 million (+2.7%)
from $61,333.5 million to $63,014.5 million, due primarily to an increase of 12 launch services,
from 179 to 191, based on Satellite Vehicle requirements. This was offset by a revised estimate
reflecting changes in satellite vehicle requirements necessitating assignment of missions to
different configurations.
DoD – The total program costs for DoD have decreased $30,871 million (-6.33%) from
$441,717 million to $410,846 million. The changes that have increased or decreased
greater than $1 billion or 10% are below:
F-35 Lightning II Joint Strike Fighter (JSF) Program (F-35) – The overall Acquisition Cost
(RDT&E, Procurement, and MILCON) of the program decreased by $19.0B in base year 2012
dollars (BY12$) and decreased by $30.7B in then-year dollars (TY$). The Total Program Costs
(RDT&E, Procurement, MILCON, and O&S) decreased by $18.7B in (BY12$) and by $30.4B in
(TY$).
4
Development: The RDT&E costs have increased by $1.6B (BY12$) and $2.1B (TY$). RDT&E
costs increased due to several factors including the need for program-aligned training systems,
revised partner cost-sharing arrangements, and the extension of Block 4 through 2026.
Procurement: The overall average Unit Recurring Flyaway (URF) (Aircraft & Engine) cost in
BY12$ decreased by $12.5M for the F-35A, by $8.6M for the F-35B, and by $7.6M for the F-35C.
The Average Procurement Unit Cost (APUC) for the program decreased by $8.4M (BY12$) and the
Program Acquisition Unit Cost (PAUC) decreased by $7.6M (BY12$). These changes resulted in an
overall decrease in Procurement cost of $20.6B (BY12$) and $32.8B (TY$) driven by incorporation
of the Lot 11 actuals as well as the negotiated values for Lot 12-14 procurement.
MILCON: The estimated MILCON costs were revised based on Service inputs reflecting only
minor changes based on inflation indices. The F-35 JPO does not manage MILCON funds but
reports the latest Service projections.
Sustainment: The 2018 SAR O&S cost estimate was not updated by OSD CAPE for 2019. As such,
there are no program driven variances to the O&S cost estimate incorporated in the F-35 2019 SAR.
The F-35 JPO continues to work to refine and increase the accuracy of the sustainment cost estimate
while also working to decrease the cost per flying hour of the aircraft across its life cycle. Recent
updates include aligning with 2019 OSD escalation guidance, incorporating DoD CLS requirements
beyond FY 2022, revising Propulsion maintenance to reflect new F135 specific workscopes
definition, revising Air Vehicle maintenance to reflect actual pricing and reliabilities, incorporating
IPT inputs, adjusting Flight Test Support to reflect current plans, incorporating the latest beddowns,
updating labor rates, removing Turkey, including prior year actuals through FY 2018, updating fuel
burn rates, incorporation of anticipated cost savings related to LCSP Success Elements and CRIs,
and aligning with the latest DoD Unit Level manning documents.
Program Base
Year
Baseline
Type
Base-Year
Dollars
Then-Year
Dollars
Quantity Base-Year
Dollars
Then-Year
Dollars
Quantity Base-Year
Dollars
Then-Year
Dollars
Quantity Base-Year
Dollars
Army:
AH-64E New Build 2010 PdE 2,307.0 2,510.4 56 -174.5 -37.7 23 2,132.5 2,472.7 79 -36.5
AH-64E
Remanufacture
2010 PdE 10,468.7 11,896.6 639 2,008.2 2,575.2 -8 12,476.9 14,471.8 631 20.2
AMPV 2019 PdE 12,761.9 15,826.7 2,936 -227.0 -436.1 - 12,534.9 15,390.6 2,936 -1.8
AN/TPQ-53 2019 PdE 3,658.3 3,454.0 193 -2.6 - - 3,655.7 3,454.0 193 -0.1
CH-47F Block II 2017 DE 16,219.8 22,568.7 542 -117.8 -131.5 - 16,102.0 22,437.2 542 -0.7
CIRCM 2018 PdE 3,920.6 4,677.2 1,829 13.0 -0.1 - 3,933.6 4,677.1 1,829 0.3
GMLRS/GMLRS AW 2003 PdE 9,780.2 11,848.9 140,239 -445.3 902.5 -60,758 9,334.9 12,751.4 79,481 49.6
HMS 2011 PdE 8,242.6 9,201.0 270,951 695.1 1,820.7 29,021 8,937.7 11,021.7 299,972 1.5
IAMD 2009 DE 4,856.6 5,791.6 296 1,440.5 2,145.9 183 6,297.1 7,937.5 479 -5.6
ITEP 2019 DE 12,088.4 17,865.9 6,258 0.7 -1.5 - 12,089.1 17,864.4 6,258 0.0
JAGM 2018 PdE 7,070.4 8,701.9 26,437 -311.8 -412.4 - 6,758.6 8,289.5 26,437 -4.4
JLTV 2015 PdE 19,699.5 24,544.0 54,717 4,926.2 7,588.3 9,904 24,625.7 32,132.3 64,621 8.6
M88A2 HERCULES 1997 PdE 2,359.1 2,985.6 938 0.3 -28.8 -3 2,359.4 2,956.8 935 0.3
MQ-1C Gray Eagle 2010 PdE 5,252.0 5,549.0 31 350.9 477.6 14 5,602.9 6,026.6 45 -4.8
PAC-3 MSE 2014 PdE 6,037.0 6,722.3 1,057 6,951.7 8,800.9 2,043 12,988.7 15,523.2 3,100 -5.1
PIM 2013 PdE 6,843.6 7,952.5 558 1,773.0 2,411.0 133 8,616.6 10,363.5 691 11.9
UH-60M Black Hawk 2005 PdE 16,801.7 20,847.1 1,235 5,338.9 6,924.5 135 22,140.6 27,771.6 1,370 16.1
Subtotal 148,367.4 182,943.4 22,219.5 32,598.5 170,586.9 215,541.9 4.9
Navy:
AAG 2017 DE 2,227.8 2,253.4 3 175.0 212.9 1 2,402.8 2,466.3 4 -3.9
AARGM-ER 2019 DE 3,442.1 4,071.3 2,097 -96.4 -88.8 - 3,345.7 3,982.5 2,097 -2.8
ACV FoV 2014 PdE 1,835.7 2,010.8 240 2,420.4 2,973.6 442 4,256.1 4,984.4 682 28.0
AGM-88E AARGM 2003 PdE 1,528.5 1,861.4 1,919 266.8 346.6 -76 1,795.3 2,208.0 1,843 13.9
AIM-9X Blk II 2011 PdE 3,967.3 4,856.1 6,000 1,385.7 1,968.2 5,635 5,353.0 6,824.3 11,635 -28.9
AMDR 2013 PdE 5,293.5 6,163.7 22 -46.1 -36.3 -2 5,247.4 6,127.4 20 -0.9 -0.6
-4.2
-2.2
29.9
14.4
13.3
15.5
7.1
-4.7
0.0
-4.7
13.5
-0.6
-31.9
92.4
9.9
Then-Year
Dollars
-35.2
22.8
-2.8
-3.9
-7.4
Program Acquisition Cost Summary (Dollars in Millions)DEC 2019
Baseline Estimate Changes To Date Current Estimate % Change To Date
Adjusted for Qty
0.0
-0.6
0.0
Page 5
CEC 2002 PdE 4,123.3 4,310.7 272 1,360.5 2,256.1 86 5,483.8 6,566.8 358 25.9
CH-53K 2017 PdE 27,705.8 31,234.3 200 2,027.6 2,801.9 - 29,733.4 34,036.2 200 7.0
CVN 78 - CVN 78 2000 DE 27,725.6 34,900.4 3 4,228.7 18,460.2 1 31,954.3 53,360.6 4 -5.5
CVN 78 - EMALS 2000 DE 975.6 1,181.7 3 1,281.4 2,300.4 1 2,257.0 3,482.1 4 168.9
DDG 1000 2005 DE 31,547.9 36,296.3 10 -11,203.9 -12,115.6 -7 20,344.0 24,180.7 3 20.4
DDG 51 1987 PdE 16,953.7 20,117.5 23 56,440.7 104,381.3 72 73,394.4 124,498.8 95 25.5
E-2D AHE 2009 PdE 17,468.6 19,031.4 75 4,428.6 6,128.7 11 21,897.2 25,160.1 86 13.4
ESB_ 2011 PdE 4,528.9 5,196.2 8 -589.8 -739.1 -1 3,939.1 4,457.1 7 -1.2
G/ATOR 2012 PdE 2,615.3 2,917.9 45 179.7 200.9 - 2,795.0 3,118.8 45 6.9
H-1 Upgrades 2008 PdE 11,203.4 12,186.8 353 278.9 89.9 - 11,482.3 12,276.7 353 2.5
IDECM 2018 PdE 1,305.2 1,332.9 324 -31.2 -38.9 - 1,274.0 1,294.0 324 -2.4
IRST 2008 PdE 1,914.6 2,347.1 179 19.6 33.9 -6 1,934.2 2,381.0 173 2.0
JPALS 2016 DE/PdE 1,827.1 1,860.1 33 -104.9 -126.8 - 1,722.2 1,733.3 33 -5.8
KC-130J 2010 PdE 9,233.9 9,881.8 104 379.4 1,170.2 7 9,613.3 11,052.0 111 -2.4
LCS 2010 DE 32,011.0 37,438.8 55 -12,733.5 -15,027.7 -20 19,277.5 22,411.1 35 -10.4
LCS MM 2010 DE 6,379.5 7,448.3 64 -694.2 -732.0 -15 5,685.3 6,716.3 49 10.8
LHA 6 2006 DE 2,877.4 3,093.5 1 7,947.4 11,859.1 3 10,824.8 14,952.6 4 -7.5
LPD 17 1996 DE 9,018.1 10,761.8 12 19,896.3 40,748.0 14 28,914.4 51,509.8 26 94.7
MIDS 2003 PdE 1,824.8 1,818.9 2,964 2,620.5 3,498.2 7,972 4,445.3 5,317.1 10,936 6.6
MQ-25 2018 DE 12,618.3 15,369.4 76 -1,449.1 -1,654.8 - 11,169.2 13,714.6 76 -10.1
MQ-4C Triton 2016 PdE 15,064.3 17,027.1 70 953.1 1,444.3 - 16,017.4 18,471.4 70 6.8
MQ-8 Fire Scout 2017 PdE 2,949.1 2,822.2 60 192.4 227.0 8 3,141.5 3,049.2 68 0.8
NGJ Mid-Band 2016 DE 7,463.7 8,430.9 135 115.6 354.7 - 7,579.3 8,785.6 135 1.1
OASuW Inc 1
(LRASM)
2014 DE 1,467.3 1,565.7 124 1,402.4 1,663.8 380 2,869.7 3,229.5 504 12.5
P-8A 2010 PdE 32,345.9 34,500.7 122 -134.2 587.2 3 32,211.7 35,087.9 125 -1.9
SM-6 2004 PdE 5,281.1 6,597.2 1,200 2,726.5 4,549.2 1,111 8,007.6 11,146.4 2,311 -5.9
SSBN 826 2017 DE 100,221.9 128,238.0 12 -738.2 -634.1 - 99,483.7 127,603.9 12 -0.7
SSC 2011 DE/PdE 3,925.6 4,731.1 73 299.9 946.3 - 4,225.5 5,677.4 73 7.7
SSN 774 1995 PdE 64,353.6 93,207.3 30 30,003.7 72,308.6 18 94,357.3 165,515.9 48 -3.5
T-AO 205 Class 2016 PdE 8,543.5 10,731.6 17 2,346.3 3,412.5 3 10,889.8 14,144.1 20 8.8
Trident II Missile 1983 PdE 26,556.3 35,518.5 845 1,428.4 6,960.2 -284 27,984.7 42,478.7 561 23.9
V-22 2005 PdE 50,250.4 53,253.4 458 1,111.2 2,434.6 6 51,361.6 55,688.0 464 1.4
VH-92A 2014 DE/PdE 4,649.7 5,184.7 23 -222.0 -279.5 - 4,427.7 4,905.2 23 -4.8
-0.9
9.9
47.5
3.5
-5.4
12.8
0.1
-3.7
-0.5
20.0
5.4
-9.0
9.1
1.7
3.9
3.0
0.3
16.7
-3.6
104.9
6.9
0.8
-2.9
2.5
-6.8
280.8
40.6
29.7
16.3
0.0
35.1
8.5
12.5
Page 6
Subtotal 565,225.3 681,750.9 117,873.2 262,844.9 683,098.5 944,595.8 5.6
Air Force:
AEHF 2002 PdE 2,715.1 3,488.2 2 -675.0 -845.7 - 2,040.1 2,642.5 2 -24.9
APT 2018 DE 8,075.4 9,911.3 351 69.7 23.0 - 8,145.1 9,934.3 351 0.9
AWACS Blk 40/45
Upgrade
2012 PdE 2,822.4 2,807.6 31 -39.6 -24.5 - 2,782.8 2,783.1 31 -0.1
B-2 DMS-M 2016 DE 2,556.2 2,684.5 20 -161.5 -160.1 - 2,394.7 2,524.4 20 -6.3
B61 Mod 12 LEP TKA 2019 PdE 1,151.8 1,147.2 890 -50.8 -63.4 - 1,101.0 1,083.8 890 -4.4
C-130J 1996 PdE 730.7 839.7 11 10,977.5 13,991.8 167 11,708.2 14,831.5 178 17.9
EPS 2014 DE 1,389.1 1,338.5 2 1,099.7 1,239.8 2 2,488.8 2,578.3 4 -0.3
F-15 EPAWSS 2016 DE 4,251.5 5,025.5 413 169.9 259.1 -50 4,421.4 5,284.6 363 23.6
F-22 Inc 3.2B Mod 2016 PdE 1,482.8 1,460.9 152 -50.1 -51.8 - 1,432.7 1,409.1 152 -3.4
FAB-T 2015 PdE 1,743.0 1,698.1 109 149.0 177.7 - 1,892.0 1,875.8 109 8.6
GPS III 2010 PdE 4,142.9 4,269.8 8 772.8 937.8 2 4,915.7 5,207.6 10 2.3
GPS IIIF 2018 DE 9,273.8 10,771.5 22 -142.5 -72.4 - 9,131.3 10,699.1 22 -0.6
HC/MC-130 Recap 2009 PdE 8,078.1 8,745.3 74 4,072.6 5,008.5 60 12,150.7 13,753.8 134 -10.6
CRH 2019 DE/PdE 8,727.3 9,856.2 112 520.9 229.2 1 9,248.2 10,085.4 113 5.5
ICBM Fuze Mod 2014 DE 1,814.8 2,075.7 781 119.1 130.3 - 1,933.9 2,206.0 781 6.6
JASSM 2010 PdE 2,195.0 2,301.4 2,507 6,275.7 7,798.2 4,724 8,470.7 10,099.6 7,231 39.0
KC-46A 2016 PdE 39,529.1 44,358.5 179 -751.4 -381.9 - 38,777.7 43,976.6 179 -1.9
MGUE Inc 1 2017 DE 1,505.7 1,531.2 - -129.2 -130.8 - 1,376.5 1,400.4 - -8.6
UH-1N Replacement 2018 DE 3,308.8 3,869.5 84 -39.1 -85.1 - 3,269.7 3,784.4 84 -0.7
MQ-9 Reaper 2008 PdE 10,751.3 11,834.8 391 -768.6 -595.7 23 9,982.7 11,239.1 414 -12.9
NSSL 2012 PdE 61,443.4 69,329.4 152 -5,827.7 -6,314.9 40 55,615.7 63,014.5 192 -16.2
OCX 2017 DE 6,030.4 6,016.9 1 192.4 236.9 - 6,222.8 6,253.8 1 3.2
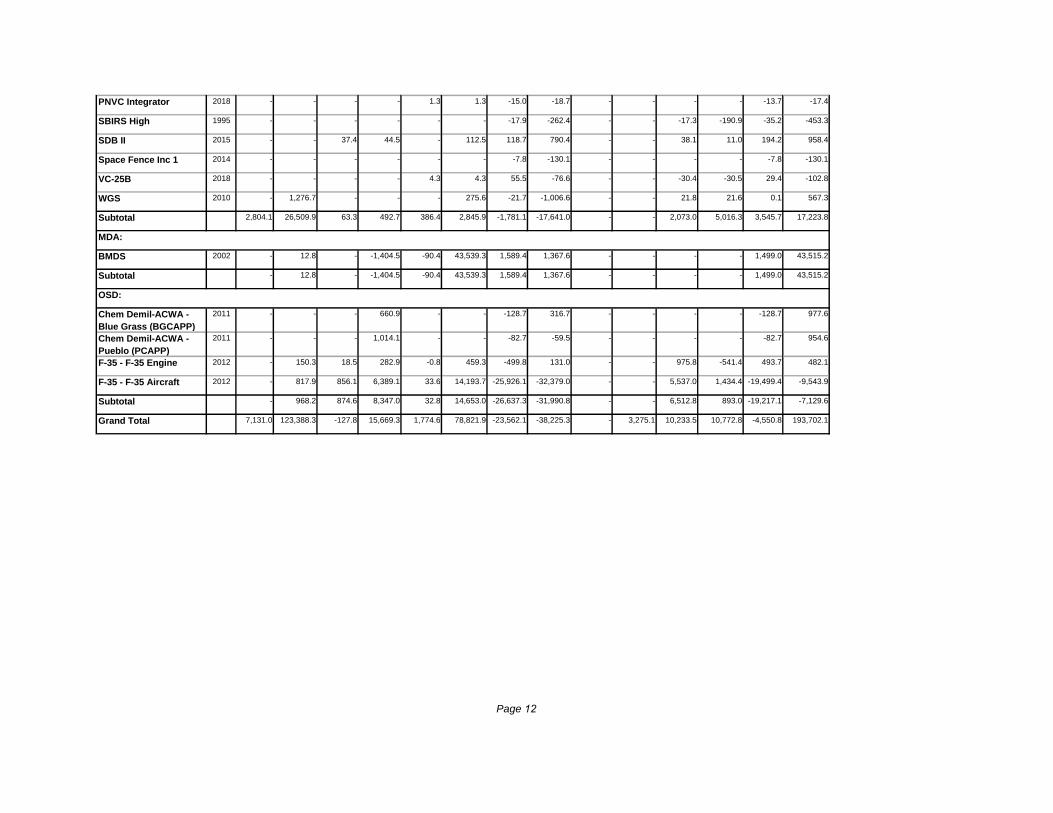
PNVC Integrator 2018 PE/-- 335.7 353.4 - -17.4 -17.3 - 318.3 336.1 - -5.2
SBIRS High 1995 PdE 2,681.6 3,865.4 2 -453.3 -611.3 - 2,228.3 3,254.1 2 -16.9
SDB II 2015 PdE 4,054.9 4,440.9 17,163 958.4 1,217.7 - 5,013.3 5,658.6 17,163 23.6
Space Fence Inc 1 2014 DE 1,567.7 1,594.2 1 -130.1 -147.9 - 1,437.6 1,446.3 1 -8.3
VC-25B 2018 DE 5,014.0 5,303.8 2 -102.8 -103.6 - 4,911.2 5,200.2 2 -2.1
WGS 2010 PdE 3,610.6 3,539.7 7 567.3 676.9 2 4,177.9 4,216.6 9 -14.5
Subtotal 200,983.1 224,459.1 16,605.9 22,320.5 217,589.0 246,779.6 -4.4
MDA:
-4.6
-15.8
27.4
-9.3
-2.0
-15.7
-1.5
-11.6
-17.2
3.9
-4.9
1.9
6.3
35.7
-0.9
-8.5
-3.5
10.5
3.6
-0.1
-10.8
-6.0
-5.5
14.6
-0.2
25.1
11.0
-24.2
0.2
0.7
Page 7
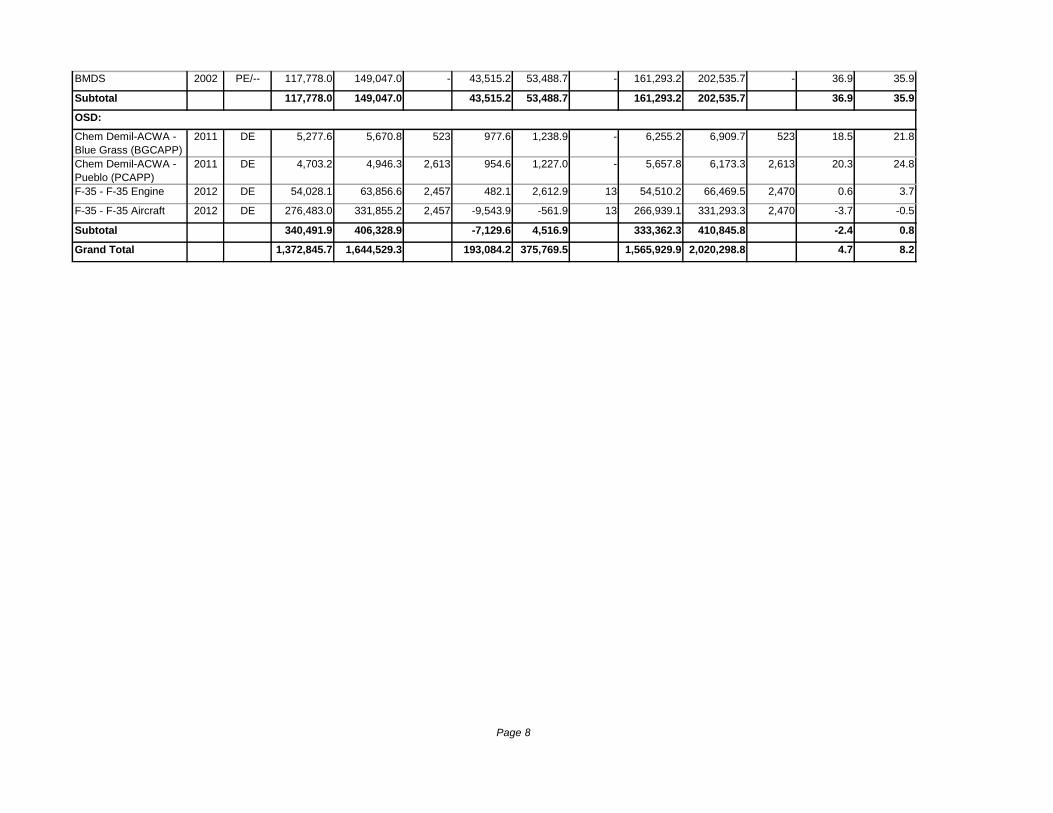
BMDS 2002 PE/-- 117,778.0 149,047.0 - 43,515.2 53,488.7 - 161,293.2 202,535.7 - 36.9
Subtotal 117,778.0 149,047.0 43,515.2 53,488.7 161,293.2 202,535.7 36.9
OSD:
Chem Demil-ACWA -
Blue Grass (BGCAPP)
2011 DE 5,277.6 5,670.8 523 977.6 1,238.9 - 6,255.2 6,909.7 523 18.5
Chem Demil-ACWA -
Pueblo (PCAPP)
2011 DE 4,703.2 4,946.3 2,613 954.6 1,227.0 - 5,657.8 6,173.3 2,613 20.3
F-35 - F-35 Engine 2012 DE 54,028.1 63,856.6 2,457 482.1 2,612.9 13 54,510.2 66,469.5 2,470 0.6
F-35 - F-35 Aircraft 2012 DE 276,483.0 331,855.2 2,457 -9,543.9 -561.9 13 266,939.1 331,293.3 2,470 -3.7
Subtotal 340,491.9 406,328.9 -7,129.6 4,516.9 333,362.3 410,845.8 -2.4
Grand Total 1,372,845.7 1,644,529.3 193,084.2 375,769.5 1,565,929.9 2,020,298.8 4.7 8.2
21.8
24.8
3.7
-0.5
0.8
35.9
35.9
Page 8
Program Base
Year
This
Qtr
To Date This Qtr To Date This Qtr To Date This Qtr To Date This Qtr To Date This Qtr To Date This Qtr To Date
Army:
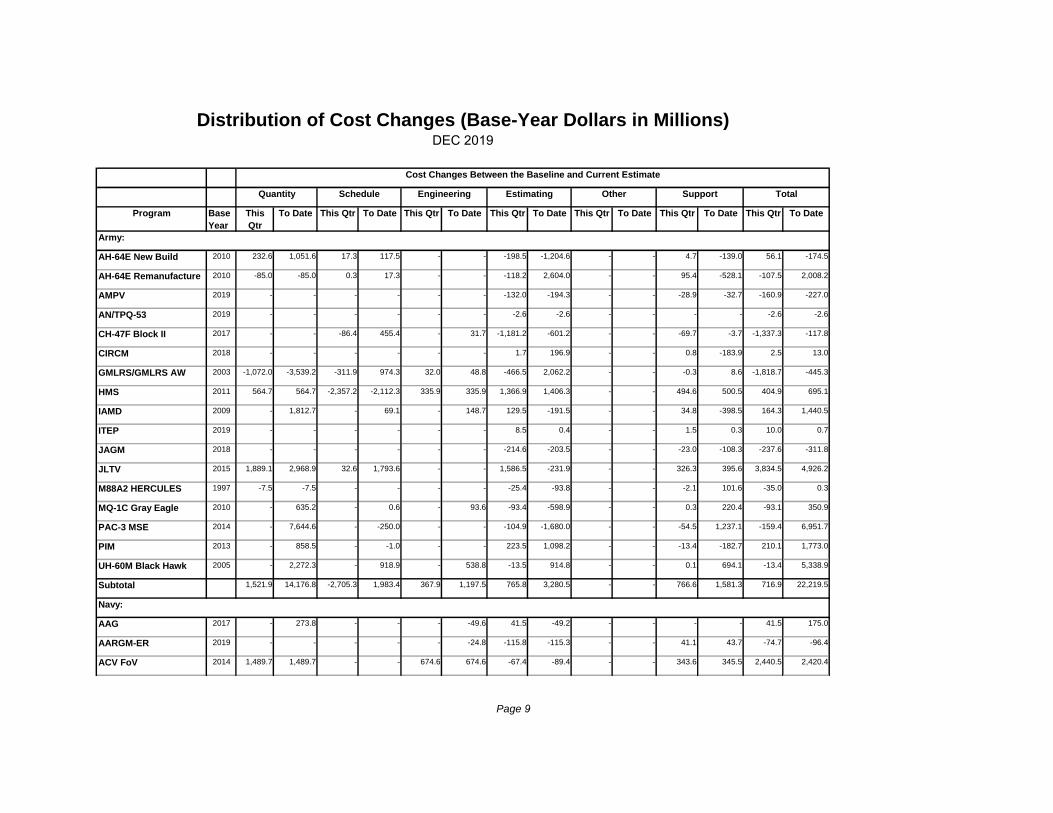
AH-64E New Build 2010 232.6 1,051.6 17.3 117.5 - - -198.5 -1,204.6 - - 4.7 -139.0 56.1 -174.5
AH-64E Remanufacture 2010 -85.0 -85.0 0.3 17.3 - - -118.2 2,604.0 - - 95.4 -528.1 -107.5 2,008.2
AMPV 2019 - - - - - - -132.0 -194.3 - - -28.9 -32.7 -160.9 -227.0
AN/TPQ-53 2019 - - - - - - -2.6 -2.6 - - - - -2.6 -2.6
CH-47F Block II 2017 - - -86.4 455.4 - 31.7 -1,181.2 -601.2 - - -69.7 -3.7 -1,337.3 -117.8
CIRCM 2018 - - - - - - 1.7 196.9 - - 0.8 -183.9 2.5 13.0
GMLRS/GMLRS AW 2003 -1,072.0 -3,539.2 -311.9 974.3 32.0 48.8 -466.5 2,062.2 - - -0.3 8.6 -1,818.7 -445.3
HMS 2011 564.7 564.7 -2,357.2 -2,112.3 335.9 335.9 1,366.9 1,406.3 - - 494.6 500.5 404.9 695.1
IAMD 2009 - 1,812.7 - 69.1 - 148.7 129.5 -191.5 - - 34.8 -398.5 164.3 1,440.5
ITEP 2019 - - - - - - 8.5 0.4 - - 1.5 0.3 10.0 0.7
JAGM 2018 - - - - - - -214.6 -203.5 - - -23.0 -108.3 -237.6 -311.8
JLTV 2015 1,889.1 2,968.9 32.6 1,793.6 - - 1,586.5 -231.9 - - 326.3 395.6 3,834.5 4,926.2
M88A2 HERCULES 1997 -7.5 -7.5 - - - - -25.4 -93.8 - - -2.1 101.6 -35.0 0.3
MQ-1C Gray Eagle 2010 - 635.2 - 0.6 - 93.6 -93.4 -598.9 - - 0.3 220.4 -93.1 350.9
PAC-3 MSE 2014 - 7,644.6 - -250.0 - - -104.9 -1,680.0 - - -54.5 1,237.1 -159.4 6,951.7
PIM 2013 - 858.5 - -1.0 - - 223.5 1,098.2 - - -13.4 -182.7 210.1 1,773.0
UH-60M Black Hawk 2005 - 2,272.3 - 918.9 - 538.8 -13.5 914.8 - - 0.1 694.1 -13.4 5,338.9
Subtotal 1,521.9 14,176.8 -2,705.3 1,983.4 367.9 1,197.5 765.8 3,280.5 - - 766.6 1,581.3 716.9 22,219.5
Navy:
AAG 2017 - 273.8 - - - -49.6 41.5 -49.2 - - - - 41.5 175.0
AARGM-ER 2019 - - - - - -24.8 -115.8 -115.3 - - 41.1 43.7 -74.7 -96.4
ACV FoV 2014 1,489.7 1,489.7 - - 674.6 674.6 -67.4 -89.4 - - 343.6 345.5 2,440.5 2,420.4
Distribution of Cost Changes (Base-Year Dollars in Millions)DEC 2019
Cost Changes Between the Baseline and Current Estimate
Quantity Schedule Engineering Estimating Other Support Total
Page 9
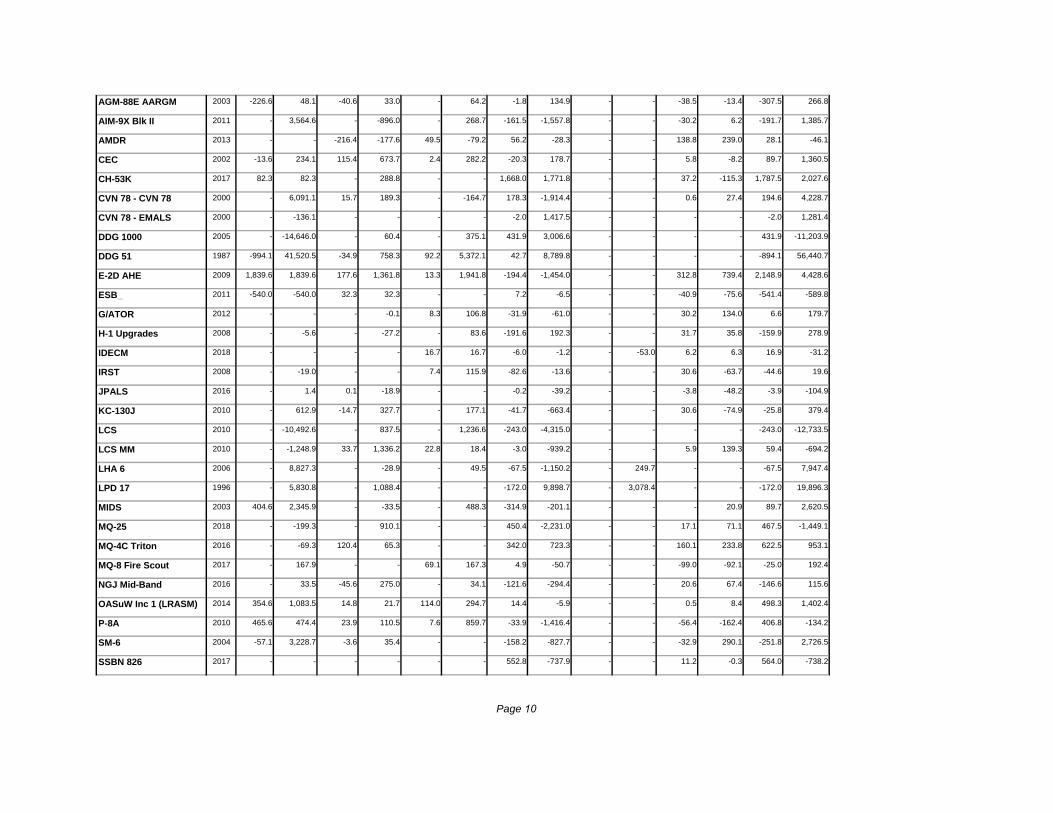
AGM-88E AARGM 2003 -226.6 48.1 -40.6 33.0 - 64.2 -1.8 134.9 - - -38.5 -13.4 -307.5 266.8
AIM-9X Blk II 2011 - 3,564.6 - -896.0 - 268.7 -161.5 -1,557.8 - - -30.2 6.2 -191.7 1,385.7
AMDR 2013 - - -216.4 -177.6 49.5 -79.2 56.2 -28.3 - - 138.8 239.0 28.1 -46.1
CEC 2002 -13.6 234.1 115.4 673.7 2.4 282.2 -20.3 178.7 - - 5.8 -8.2 89.7 1,360.5
CH-53K 2017 82.3 82.3 - 288.8 - - 1,668.0 1,771.8 - - 37.2 -115.3 1,787.5 2,027.6
CVN 78 - CVN 78 2000 - 6,091.1 15.7 189.3 - -164.7 178.3 -1,914.4 - - 0.6 27.4 194.6 4,228.7
CVN 78 - EMALS 2000 - -136.1 - - - - -2.0 1,417.5 - - - - -2.0 1,281.4
DDG 1000 2005 - -14,646.0 - 60.4 - 375.1 431.9 3,006.6 - - - - 431.9 -11,203.9
DDG 51 1987 -994.1 41,520.5 -34.9 758.3 92.2 5,372.1 42.7 8,789.8 - - - - -894.1 56,440.7
E-2D AHE 2009 1,839.6 1,839.6 177.6 1,361.8 13.3 1,941.8 -194.4 -1,454.0 - - 312.8 739.4 2,148.9 4,428.6
ESB_ 2011 -540.0 -540.0 32.3 32.3 - - 7.2 -6.5 - - -40.9 -75.6 -541.4 -589.8
G/ATOR 2012 - - - -0.1 8.3 106.8 -31.9 -61.0 - - 30.2 134.0 6.6 179.7
H-1 Upgrades 2008 - -5.6 - -27.2 - 83.6 -191.6 192.3 - - 31.7 35.8 -159.9 278.9
IDECM 2018 - - - - 16.7 16.7 -6.0 -1.2 - -53.0 6.2 6.3 16.9 -31.2
IRST 2008 - -19.0 - - 7.4 115.9 -82.6 -13.6 - - 30.6 -63.7 -44.6 19.6
JPALS 2016 - 1.4 0.1 -18.9 - - -0.2 -39.2 - - -3.8 -48.2 -3.9 -104.9
KC-130J 2010 - 612.9 -14.7 327.7 - 177.1 -41.7 -663.4 - - 30.6 -74.9 -25.8 379.4
LCS 2010 - -10,492.6 - 837.5 - 1,236.6 -243.0 -4,315.0 - - - - -243.0 -12,733.5
LCS MM 2010 - -1,248.9 33.7 1,336.2 22.8 18.4 -3.0 -939.2 - - 5.9 139.3 59.4 -694.2
LHA 6 2006 - 8,827.3 - -28.9 - 49.5 -67.5 -1,150.2 - 249.7 - - -67.5 7,947.4
LPD 17 1996 - 5,830.8 - 1,088.4 - - -172.0 9,898.7 - 3,078.4 - - -172.0 19,896.3
MIDS 2003 404.6 2,345.9 - -33.5 - 488.3 -314.9 -201.1 - - - 20.9 89.7 2,620.5
MQ-25 2018 - -199.3 - 910.1 - - 450.4 -2,231.0 - - 17.1 71.1 467.5 -1,449.1
MQ-4C Triton 2016 - -69.3 120.4 65.3 - - 342.0 723.3 - - 160.1 233.8 622.5 953.1
MQ-8 Fire Scout 2017 - 167.9 - - 69.1 167.3 4.9 -50.7 - - -99.0 -92.1 -25.0 192.4
NGJ Mid-Band 2016 - 33.5 -45.6 275.0 - 34.1 -121.6 -294.4 - - 20.6 67.4 -146.6 115.6
OASuW Inc 1 (LRASM) 2014 354.6 1,083.5 14.8 21.7 114.0 294.7 14.4 -5.9 - - 0.5 8.4 498.3 1,402.4
P-8A 2010 465.6 474.4 23.9 110.5 7.6 859.7 -33.9 -1,416.4 - - -56.4 -162.4 406.8 -134.2
SM-6 2004 -57.1 3,228.7 -3.6 35.4 - - -158.2 -827.7 - - -32.9 290.1 -251.8 2,726.5
SSBN 826 2017 - - - - - - 552.8 -737.9 - - 11.2 -0.3 564.0 -738.2
Page 10
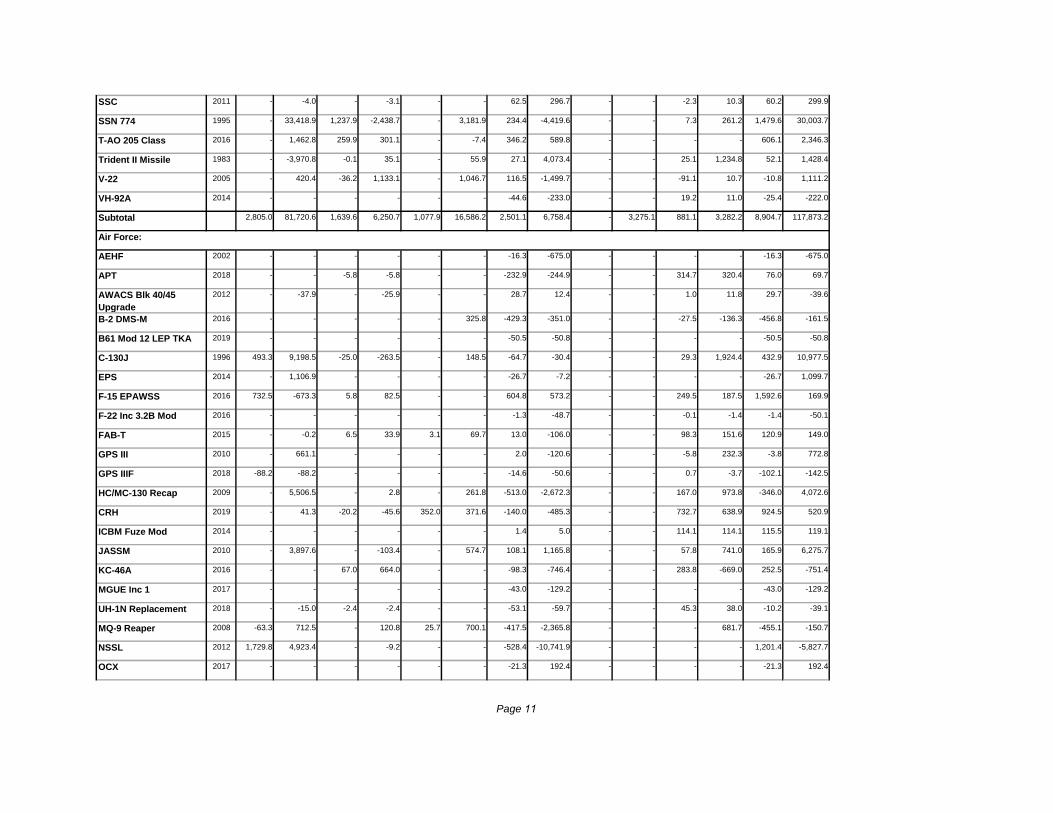
SSC 2011 - -4.0 - -3.1 - - 62.5 296.7 - - -2.3 10.3 60.2 299.9
SSN 774 1995 - 33,418.9 1,237.9 -2,438.7 - 3,181.9 234.4 -4,419.6 - - 7.3 261.2 1,479.6 30,003.7
T-AO 205 Class 2016 - 1,462.8 259.9 301.1 - -7.4 346.2 589.8 - - - - 606.1 2,346.3
Trident II Missile 1983 - -3,970.8 -0.1 35.1 - 55.9 27.1 4,073.4 - - 25.1 1,234.8 52.1 1,428.4
V-22 2005 - 420.4 -36.2 1,133.1 - 1,046.7 116.5 -1,499.7 - - -91.1 10.7 -10.8 1,111.2
VH-92A 2014 - - - - - - -44.6 -233.0 - - 19.2 11.0 -25.4 -222.0
Subtotal 2,805.0 81,720.6 1,639.6 6,250.7 1,077.9 16,586.2 2,501.1 6,758.4 - 3,275.1 881.1 3,282.2 8,904.7 117,873.2
Air Force:
AEHF 2002 - - - - - - -16.3 -675.0 - - - - -16.3 -675.0
APT 2018 - - -5.8 -5.8 - - -232.9 -244.9 - - 314.7 320.4 76.0 69.7
AWACS Blk 40/45
Upgrade
2012 - -37.9 - -25.9 - - 28.7 12.4 - - 1.0 11.8 29.7 -39.6
B-2 DMS-M 2016 - - - - - 325.8 -429.3 -351.0 - - -27.5 -136.3 -456.8 -161.5
B61 Mod 12 LEP TKA 2019 - - - - - - -50.5 -50.8 - - - - -50.5 -50.8
C-130J 1996 493.3 9,198.5 -25.0 -263.5 - 148.5 -64.7 -30.4 - - 29.3 1,924.4 432.9 10,977.5
EPS 2014 - 1,106.9 - - - - -26.7 -7.2 - - - - -26.7 1,099.7
F-15 EPAWSS 2016 732.5 -673.3 5.8 82.5 - - 604.8 573.2 - - 249.5 187.5 1,592.6 169.9
F-22 Inc 3.2B Mod 2016 - - - - - - -1.3 -48.7 - - -0.1 -1.4 -1.4 -50.1
FAB-T 2015 - -0.2 6.5 33.9 3.1 69.7 13.0 -106.0 - - 98.3 151.6 120.9 149.0
GPS III 2010 - 661.1 - - - - 2.0 -120.6 - - -5.8 232.3 -3.8 772.8
GPS IIIF 2018 -88.2 -88.2 - - - - -14.6 -50.6 - - 0.7 -3.7 -102.1 -142.5
HC/MC-130 Recap 2009 - 5,506.5 - 2.8 - 261.8 -513.0 -2,672.3 - - 167.0 973.8 -346.0 4,072.6
CRH 2019 - 41.3 -20.2 -45.6 352.0 371.6 -140.0 -485.3 - - 732.7 638.9 924.5 520.9
ICBM Fuze Mod 2014 - - - - - - 1.4 5.0 - - 114.1 114.1 115.5 119.1
JASSM 2010 - 3,897.6 - -103.4 - 574.7 108.1 1,165.8 - - 57.8 741.0 165.9 6,275.7
KC-46A 2016 - - 67.0 664.0 - - -98.3 -746.4 - - 283.8 -669.0 252.5 -751.4
MGUE Inc 1 2017 - - - - - - -43.0 -129.2 - - - - -43.0 -129.2
UH-1N Replacement 2018 - -15.0 -2.4 -2.4 - - -53.1 -59.7 - - 45.3 38.0 -10.2 -39.1
MQ-9 Reaper 2008 -63.3 712.5 - 120.8 25.7 700.1 -417.5 -2,365.8 - - - 681.7 -455.1 -150.7
NSSL 2012 1,729.8 4,923.4 - -9.2 - - -528.4 -10,741.9 - - - - 1,201.4 -5,827.7
OCX 2017 - - - - - - -21.3 192.4 - - - - -21.3 192.4
Page 11
PNVC Integrator 2018 - - - - 1.3 1.3 -15.0 -18.7 - - - - -13.7 -17.4
SBIRS High 1995 - - - - - - -17.9 -262.4 - - -17.3 -190.9 -35.2 -453.3
SDB II 2015 - - 37.4 44.5 - 112.5 118.7 790.4 - - 38.1 11.0 194.2 958.4
Space Fence Inc 1 2014 - - - - - - -7.8 -130.1 - - - - -7.8 -130.1
VC-25B 2018 - - - - 4.3 4.3 55.5 -76.6 - - -30.4 -30.5 29.4 -102.8
WGS 2010 - 1,276.7 - - - 275.6 -21.7 -1,006.6 - - 21.8 21.6 0.1 567.3
Subtotal 2,804.1 26,509.9 63.3 492.7 386.4 2,845.9 -1,781.1 -17,641.0 - - 2,073.0 5,016.3 3,545.7 17,223.8
MDA:
BMDS 2002 - 12.8 - -1,404.5 -90.4 43,539.3 1,589.4 1,367.6 - - - - 1,499.0 43,515.2
Subtotal - 12.8 - -1,404.5 -90.4 43,539.3 1,589.4 1,367.6 - - - - 1,499.0 43,515.2
OSD:
Chem Demil-ACWA -
Blue Grass (BGCAPP)
2011 - - - 660.9 - - -128.7 316.7 - - - - -128.7 977.6
Chem Demil-ACWA -
Pueblo (PCAPP)
2011 - - - 1,014.1 - - -82.7 -59.5 - - - - -82.7 954.6
F-35 - F-35 Engine 2012 - 150.3 18.5 282.9 -0.8 459.3 -499.8 131.0 - - 975.8 -541.4 493.7 482.1
F-35 - F-35 Aircraft 2012 - 817.9 856.1 6,389.1 33.6 14,193.7 -25,926.1 -32,379.0 - - 5,537.0 1,434.4 -19,499.4 -9,543.9
Subtotal - 968.2 874.6 8,347.0 32.8 14,653.0 -26,637.3 -31,990.8 - - 6,512.8 893.0 -19,217.1 -7,129.6
Grand Total 7,131.0 123,388.3 -127.8 15,669.3 1,774.6 78,821.9 -23,562.1 -38,225.3 - 3,275.1 10,233.5 10,772.8 -4,550.8 193,702.1
Page 12
Program This Qtr To Date This Qtr To Date This Qtr To Date This Qtr To Date This Qtr To Date This Qtr To Date This
Qtr
To Date To Date
Army Subtotal:
AH-64E New Build -1.6 14.5 284.4 1,306.7 19.1 189.4 - - -239.0 -1,399.4 - - 5.5 -148.9 -37.7
AH-64E Remanufacture -11.7 100.3 -115.0 -115.0 4.0 5.6 - - -155.4 3,138.2 - - 125.0 -553.9 2,575.2
AMPV 0.5 5.3 - - 30.4 -62.6 - - -139.1 -329.0 - - -30.4 -49.8 -436.1
AN/TPQ-53 2.6 2.6 - - - - - - -2.5 -2.5 - - -0.1 -0.1 -
CH-47F Block II -49.3 30.7 - - -2,434.3 688.6 - 33.9 -1,771.7 -879.4 - - -193.3 -5.3 -131.5
CIRCM -7.8 5.4 - - - -13.4 - - 6.9 251.5 - - -4.3 -243.6 -0.1
GMLRS/GMLRS AW 18.9 638.2 -1,750.1 -5,220.2 -459.4 2,113.2 48.5 72.7 -793.5 3,289.0 - - -0.4 9.6 902.5
HMS -8.7 9.2 830.3 830.3 -3,359.8 -2,026.6 419.8 419.8 1,925.0 1,743.0 - - 633.7 845.0 1,820.7
IAMD -6.7 86.4 - 2,538.2 14.9 334.9 - 170.6 174.9 -526.2 - - 51.9 -458.0 2,145.9
ITEP -16.7 -2.9 - - - - - - 14.6 0.8 - - 0.6 0.6 -1.5
JAGM 17.1 42.6 - - -16.2 -39.5 - - -290.7 -282.1 - - -25.8 -133.4 -412.4
JLTV -24.9 -52.1 2,490.7 3,776.0 1,187.8 3,392.4 - - 2,281.9 -146.1 - - 485.8 618.1 7,588.3
M88A2 HERCULES -0.4 -12.9 -12.4 -12.4 -1.7 0.3 - - -41.3 -127.9 - - -4.3 124.1 -28.8
MQ-1C Gray Eagle -0.7 35.9 - 723.0 - -2.2 - 114.1 -113.4 -652.0 - - 0.1 258.8 477.6
PAC-3 MSE 23.7 11.3 - 10,037.8 -113.0 -755.2 - - -97.3 -2,111.9 - - -79.3 1,618.9 8,800.9
PIM -7.8 -97.1 - 1,193.9 2.8 49.2 - - 289.3 1,465.8 - - -11.1 -200.8 2,411.0
UH-60M Black Hawk -17.2 -328.1 - 3,203.0 -12.8 1,381.1 - 655.1 -22.8 1,120.4 - - -0.6 893.0 6,924.5
Subtotal -90.7 489.3 1,727.9 18,261.3 -5,138.2 5,255.2 468.3 1,466.2 1,025.9 4,552.2 - - 953.0 2,574.3 32,598.5
Navy Subtotal:
AAG -0.3 3.8 - 320.1 - - - -54.6 48.5 -56.4 - - - - 212.9
AARGM-ER -138.0 -117.9 - - 134.6 98.5 - 17.0 -146.0 -145.5 - - 60.6 59.1 -88.8
48.2
-88.8
-114.0
-265.9
273.2
-53.4
-1,053.8
235.0
-1.5
-315.6
6,421.3
-60.1
-
-4,448.6
-5.2
-2,936.0
440.3
This Qtr
68.4
-153.1
-138.6
Distribution of Cost Changes (Then-Year Dollars in Millions)DEC 2019
Cost Changes Between the Baseline and Current Estimate
Economic Quantity Schedule Engineering Estimating Other Support Total
Page 13
ACV FoV -1.1 13.0 1,825.2 1,825.2 1.6 1.6 813.5 813.5 -72.3 -97.0 - - 415.0 417.3 2,973.6
AGM-88E AARGM 1.8 -28.9 -338.4 69.1 -60.0 68.6 - 79.5 -7.2 175.3 - - -54.7 -17.0 346.6
AIM-9X Blk II 4.2 118.5 - 5,163.7 -15.2 -1,582.0 - 300.8 -208.5 -2,042.7 - - -38.6 9.9 1,968.2
AMDR 7.0 30.2 - - -270.1 -258.8 64.5 -71.2 69.7 -42.4 - - 182.0 305.9 -36.3
CEC 3.1 81.2 -30.8 551.1 199.0 1,118.6 5.5 253.6 -31.8 63.7 - - 11.6 187.9 2,256.1
CH-53K -54.6 -93.7 132.1 132.1 382.3 745.7 - - 1,937.1 2,050.7 - - 109.5 -32.9 2,801.9
CVN 78 - CVN 78 52.3 6,836.4 - 12,544.3 23.3 175.0 - -81.2 313.2 -1,054.3 - - 1.2 40.0 18,460.2
CVN 78 - EMALS 3.0 517.4 - -267.2 - -36.7 - - -3.9 2,086.9 - - - - 2,300.4
DDG 1000 5.0 1,852.9 - -19,092.9 - 53.3 - 552.2 628.2 4,518.9 - - - - -12,115.6
DDG 51 81.0 -2,783.4 -2,722.5 75,897.3 179.6 2,277.4 100.1 10,897.9 215.0 18,092.1 - - - - 104,381.3
E-2D AHE -9.6 -40.8 2,601.6 2,601.6 225.0 1,999.8 18.7 2,352.3 -287.3 -1,820.8 - - 443.0 1,036.6 6,128.7
ESB_ 4.5 49.3 -737.4 -737.4 46.6 61.0 - - 10.2 -10.5 - - -54.9 -101.5 -739.1
G/ATOR -1.2 -31.1 - - - -3.4 9.8 125.7 -50.4 -56.0 - - 38.9 165.7 200.9
H-1 Upgrades -5.1 -236.1 - -8.9 - -25.8 - 96.7 -233.0 220.8 - - 36.7 43.2 89.9
IDECM -0.9 -2.7 - - - -0.7 18.8 18.8 -6.2 -1.0 - -58.2 6.3 4.9 -38.9
IRST -1.8 7.1 - -23.3 4.9 4.9 10.1 141.2 -108.7 -15.1 - - 38.4 -80.9 33.9
JPALS 0.9 3.4 - - 0.3 -25.1 - - -0.8 -45.7 - - -4.2 -59.4 -126.8
KC-130J -16.4 136.9 - 845.4 45.6 772.6 - 243.0 -55.5 -784.9 - - 50.0 -42.8 1,170.2
LCS 14.2 2,706.5 - -15,096.4 - 1,168.9 - 1,680.5 -311.6 -5,487.2 - - - - -15,027.7
LCS MM 0.5 -131.8 - -1,694.8 72.7 1,982.2 29.1 26.7 5.9 -1,094.3 - - 10.2 180.0 -732.0
LHA 6 12.9 860.0 - 12,419.4 -81.9 -66.5 - 58.5 -141.5 -1,684.3 - 272.0 - - 11,859.1
LPD 17 52.4 1,097.6 - 14,375.9 - 2,398.9 - - -342.6 17,405.4 - 5,471.7 - -1.5 40,748.0
MIDS -1.7 23.3 604.8 3,226.1 -12.7 -106.6 - 562.8 -463.1 -232.0 - - - 24.6 3,498.2
MQ-25 -17.2 -141.8 - -297.1 - 1,289.5 - - 567.6 -2,592.3 - - 16.4 86.9 -1,654.8
MQ-4C Triton -21.8 43.8 - -99.1 384.0 319.3 - - 402.1 836.8 - - 247.2 343.5 1,444.3
MQ-8 Fire Scout -0.6 7.7 - 176.1 - - 80.2 190.1 5.0 -49.7 - - -115.6 -97.2 227.0
NGJ Mid-Band -6.1 30.0 - 21.5 -72.3 501.1 - 36.4 -133.5 -334.8 - - 24.5 100.5 354.7
OASuW Inc 1 (LRASM) 2.3 -6.4 437.8 1,296.5 26.0 32.9 134.0 337.1 16.3 -6.2 - - 0.8 9.9 1,663.8
P-8A -12.0 273.6 570.3 547.8 29.3 456.6 9.3 1,023.1 -29.5 -1,627.6 - - -68.5 -86.3 587.2
SM-6 12.1 -65.3 -93.8 4,977.8 -1.2 284.8 - - -250.8 -1,127.2 - - -49.1 479.1 4,549.2
617.2
498.9
-382.8
127.3
566.8
1,011.5
-31.0
-187.4
23.7
-297.4
118.4
-210.5
-290.2
-2.9
-201.4
18.0
-57.1
-3.8
-0.9
633.2
-2,146.8
2,991.4
-731.0
-258.1
53.1
156.6
2,506.4
390.0
2,981.9
-458.5
Page 14
SSBN 826 201.6 898.5 - - - - - - 593.6 -1,542.2 - - 19.3 9.6 -634.1
SSC 8.2 218.6 - -1.5 133.9 287.0 - - 86.9 422.3 - - - 19.9 946.3
SSN 774 162.4 6,564.6 - 73,830.4 3,468.6 -6,359.6 - 6,351.2 335.0 -8,769.9 - - 24.4 691.9 72,308.6
T-AO 205 Class 20.5 86.5 - 2,137.4 680.7 314.9 - -8.0 519.8 881.7 - - - - 3,412.5
Trident II Missile 6.2 -397.7 - -6,719.1 - 1,896.4 - 100.8 73.5 9,087.6 - - 68.3 2,992.2 6,960.2
V-22 -15.2 -487.9 - 575.2 -55.1 2,167.6 - 1,409.6 174.5 -1,362.3 - - -116.4 132.4 2,434.6
VH-92A -2.3 -73.5 - - - - - - -48.7 -217.3 - - 21.7 11.3 -279.5
Subtotal 350.2 17,821.8 2,248.9 169,496.3 5,469.5 12,011.9 1,293.6 27,454.0 3,069.2 23,542.6 - 5,685.5 1,324.0 6,832.8 262,844.9
Air Force Subtotal:
AEHF -0.7 57.9 - - - - - - -22.8 -903.6 - - - - -845.7
APT -12.6 25.7 - - -64.0 -64.0 - - -306.0 -324.0 - - 379.2 385.3 23.0
AWACS Blk 40/45
Upgrade
-0.4 -4.4 - -44.1 - -25.0 - - 32.9 34.6 - - 1.2 14.4 -24.5
B-2 DMS-M -1.7 9.1 - - 16.6 16.6 - 363.0 -513.2 -397.8 - - -29.2 -151.0 -160.1
B61 Mod 12 LEP TKA - -3.7 - - - - - - -51.6 -59.7 - - - - -63.4
C-130J -2.2 68.7 772.9 12,104.0 -38.8 -528.2 - 202.2 -102.9 -202.2 - - 44.4 2,347.3 13,991.8
EPS -0.7 3.4 - 1,243.8 - - - - -29.9 -7.4 - - - - 1,239.8
F-15 EPAWSS -3.5 14.4 959.8 -802.8 23.9 144.2 - - 725.0 651.8 - - 319.5 251.5 259.1
F-22 Inc 3.2B Mod -0.1 1.2 - - - - - - -1.5 -51.7 - - - -1.3 -51.8
FAB-T -0.3 2.6 - 0.2 7.6 36.9 3.6 78.4 13.5 -116.8 - - 118.4 176.4 177.7
GPS III -0.5 35.1 - 754.7 - - - - 1.3 -125.5 - - -7.7 273.5 937.8
GPS IIIF -6.1 33.7 -57.7 -57.7 - - - - -8.9 -43.5 - - 0.3 -4.9 -72.4
HC/MC-130 Recap -6.8 136.6 - 6,667.0 - -100.4 - 286.3 -688.3 -3,186.4 - - 220.7 1,205.4 5,008.5
CRH -81.8 -229.9 - 40.0 -80.8 -233.2 405.0 425.9 -164.8 -499.7 - - 855.3 726.1 229.2
ICBM Fuze Mod -0.5 -20.3 - - 3.8 3.8 - - -3.0 1.1 - - 145.7 145.7 130.3
JASSM -2.3 109.1 - 5,143.8 -102.7 -917.4 - 758.6 170.0 1,757.3 - - 65.8 946.8 7,798.2
KC-46A -41.0 130.1 - - 152.4 974.5 - - -120.1 -821.1 - - 383.1 -665.4 -381.9
MGUE Inc 1 -0.5 6.0 - - - - - - -45.7 -136.8 - - - - -130.8
UH-1N Replacement -4.7 9.7 - -27.4 -30.2 -40.0 - - -54.6 -67.6 - - 48.9 40.2 -85.1
MQ-9 Reaper - 125.5 -83.2 874.2 - 249.6 34.8 928.8 -537.9 -2,849.8 - - - 888.6 216.9
NSSL -22.8 461.6 2,280.4 6,736.3 - 417.6 - - -576.6 -13,930.4 - - - - -6,314.9
-40.6
-586.3
1,681.0
932.9
146.0
130.8
374.4
-46.2
-1.6
142.8
-6.9
-72.4
-474.4
-527.5
-51.6
673.4
-30.6
2,024.7
13,755.4
-23.5
-3.4
33.7
3,990.4
1,221.0
148.0
-12.2
-29.3
814.5
229.0
Distribution of Cost Changes (Then-Year Dollars in Millions) Page 15
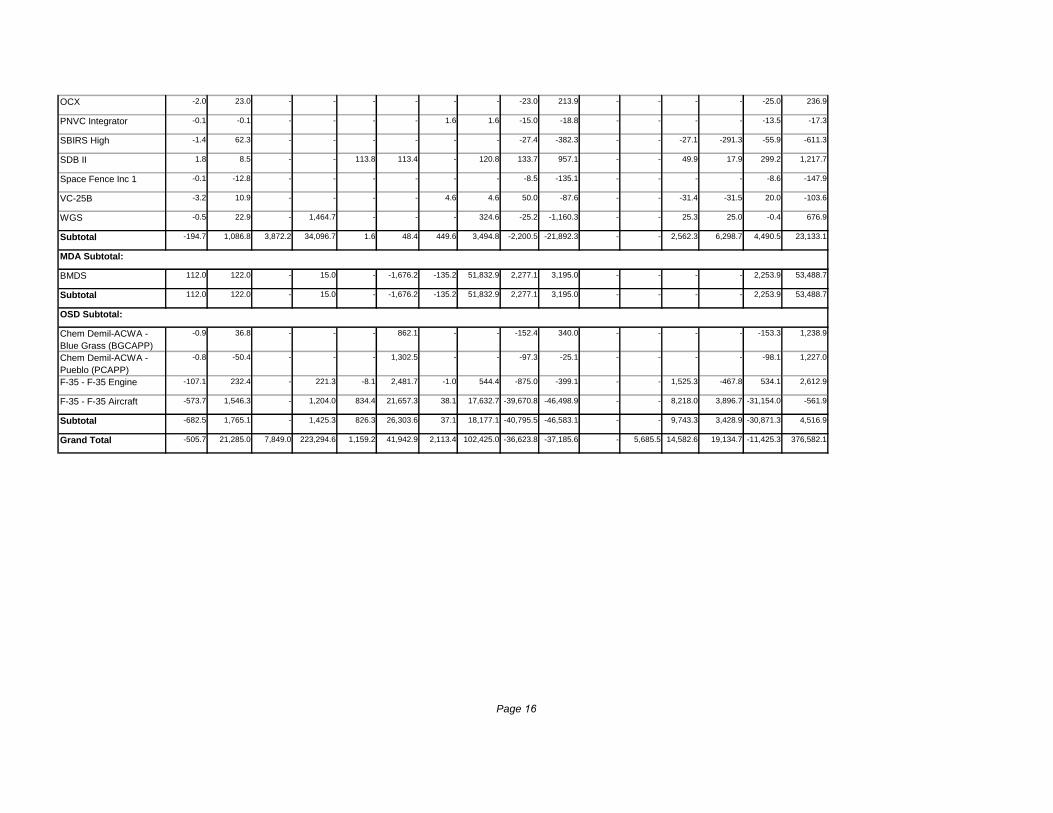
OCX -2.0 23.0 - - - - - - -23.0 213.9 - - - - 236.9
PNVC Integrator -0.1 -0.1 - - - - 1.6 1.6 -15.0 -18.8 - - - - -17.3
SBIRS High -1.4 62.3 - - - - - - -27.4 -382.3 - - -27.1 -291.3 -611.3
SDB II 1.8 8.5 - - 113.8 113.4 - 120.8 133.7 957.1 - - 49.9 17.9 1,217.7
Space Fence Inc 1 -0.1 -12.8 - - - - - - -8.5 -135.1 - - - - -147.9
VC-25B -3.2 10.9 - - - - 4.6 4.6 50.0 -87.6 - - -31.4 -31.5 -103.6
WGS -0.5 22.9 - 1,464.7 - - - 324.6 -25.2 -1,160.3 - - 25.3 25.0 676.9
Subtotal -194.7 1,086.8 3,872.2 34,096.7 1.6 48.4 449.6 3,494.8 -2,200.5 -21,892.3 - - 2,562.3 6,298.7 23,133.1
MDA Subtotal:
BMDS 112.0 122.0 - 15.0 - -1,676.2 -135.2 51,832.9 2,277.1 3,195.0 - - - - 53,488.7
Subtotal 112.0 122.0 - 15.0 - -1,676.2 -135.2 51,832.9 2,277.1 3,195.0 - - - - 53,488.7
OSD Subtotal:
Chem Demil-ACWA -
Blue Grass (BGCAPP)
-0.9 36.8 - - - 862.1 - - -152.4 340.0 - - - - 1,238.9
Chem Demil-ACWA -
Pueblo (PCAPP)
-0.8 -50.4 - - - 1,302.5 - - -97.3 -25.1 - - - - 1,227.0
F-35 - F-35 Engine -107.1 232.4 - 221.3 -8.1 2,481.7 -1.0 544.4 -875.0 -399.1 - - 1,525.3 -467.8 2,612.9
F-35 - F-35 Aircraft -573.7 1,546.3 - 1,204.0 834.4 21,657.3 38.1 17,632.7 -39,670.8 -46,498.9 - - 8,218.0 3,896.7 -561.9
Subtotal -682.5 1,765.1 - 1,425.3 826.3 26,303.6 37.1 18,177.1 -40,795.5 -46,583.1 - - 9,743.3 3,428.9 4,516.9
Grand Total -505.7 21,285.0 7,849.0 223,294.6 1,159.2 41,942.9 2,113.4 102,425.0 -36,623.8 -37,185.6 - 5,685.5 14,582.6 19,134.7 376,582.1-11,425.3
-153.3
-98.1
534.1
-31,154.0
-30,871.3
4,490.5
2,253.9
2,253.9
-55.9
299.2
-8.6
20.0
-0.4
-25.0
-13.5
Page 16
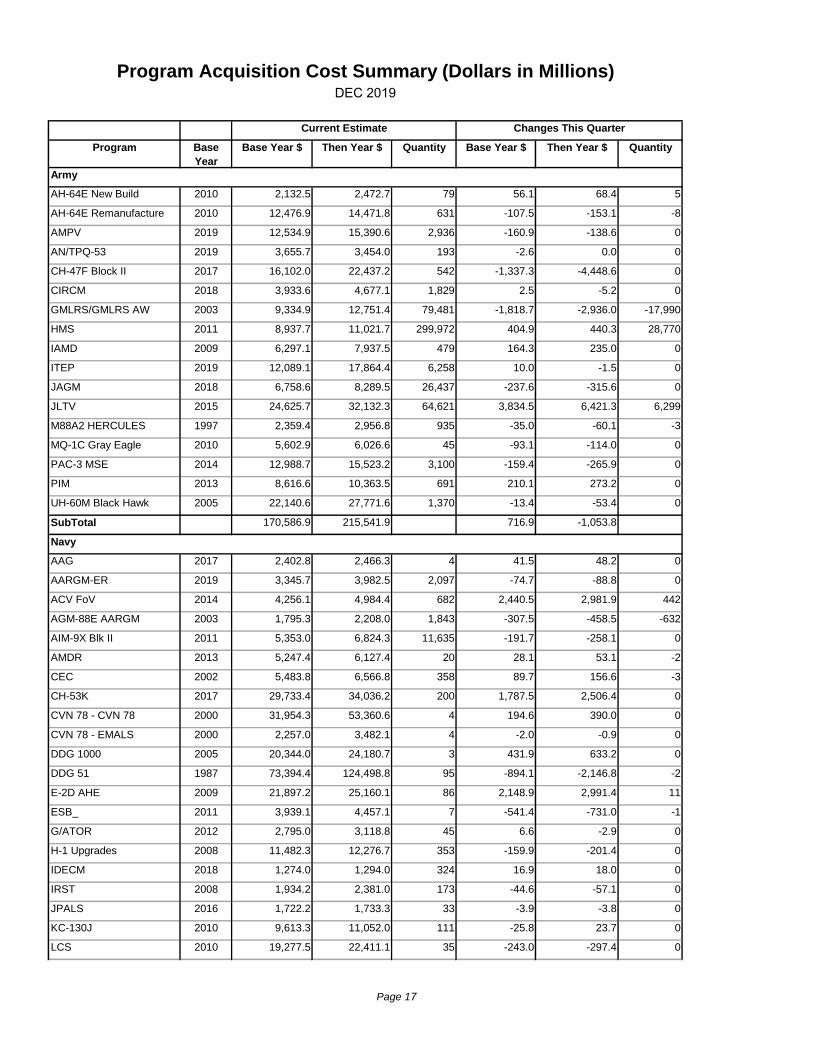
Program Base
Year
Base Year $ Then Year $ Quantity Base Year $ Then Year $ Quantity
Army
AH-64E New Build 2010 2,132.5 2,472.7 79 56.1 68.4 5
AH-64E Remanufacture 2010 12,476.9 14,471.8 631 -107.5 -153.1 -8
AMPV 2019 12,534.9 15,390.6 2,936 -160.9 -138.6 0
AN/TPQ-53 2019 3,655.7 3,454.0 193 -2.6 0.0 0
CH-47F Block II 2017 16,102.0 22,437.2 542 -1,337.3 -4,448.6 0
CIRCM 2018 3,933.6 4,677.1 1,829 2.5 -5.2 0
GMLRS/GMLRS AW 2003 9,334.9 12,751.4 79,481 -1,818.7 -2,936.0 -17,990
HMS 2011 8,937.7 11,021.7 299,972 404.9 440.3 28,770
IAMD 2009 6,297.1 7,937.5 479 164.3 235.0 0
ITEP 2019 12,089.1 17,864.4 6,258 10.0 -1.5 0
JAGM 2018 6,758.6 8,289.5 26,437 -237.6 -315.6 0
JLTV 2015 24,625.7 32,132.3 64,621 3,834.5 6,421.3 6,299
M88A2 HERCULES 1997 2,359.4 2,956.8 935 -35.0 -60.1 -3
MQ-1C Gray Eagle 2010 5,602.9 6,026.6 45 -93.1 -114.0 0
PAC-3 MSE 2014 12,988.7 15,523.2 3,100 -159.4 -265.9 0
PIM 2013 8,616.6 10,363.5 691 210.1 273.2 0
UH-60M Black Hawk 2005 22,140.6 27,771.6 1,370 -13.4 -53.4 0
SubTotal 170,586.9 215,541.9 716.9 -1,053.8
Navy
AAG 2017 2,402.8 2,466.3 4 41.5 48.2 0
AARGM-ER 2019 3,345.7 3,982.5 2,097 -74.7 -88.8 0
ACV FoV 2014 4,256.1 4,984.4 682 2,440.5 2,981.9 442
AGM-88E AARGM 2003 1,795.3 2,208.0 1,843 -307.5 -458.5 -632
AIM-9X Blk II 2011 5,353.0 6,824.3 11,635 -191.7 -258.1 0
AMDR 2013 5,247.4 6,127.4 20 28.1 53.1 -2
CEC 2002 5,483.8 6,566.8 358 89.7 156.6 -3
CH-53K 2017 29,733.4 34,036.2 200 1,787.5 2,506.4 0
CVN 78 - CVN 78 2000 31,954.3 53,360.6 4 194.6 390.0 0
CVN 78 - EMALS 2000 2,257.0 3,482.1 4 -2.0 -0.9 0
DDG 1000 2005 20,344.0 24,180.7 3 431.9 633.2 0
DDG 51 1987 73,394.4 124,498.8 95 -894.1 -2,146.8 -2
E-2D AHE 2009 21,897.2 25,160.1 86 2,148.9 2,991.4 11
ESB_ 2011 3,939.1 4,457.1 7 -541.4 -731.0 -1
G/ATOR 2012 2,795.0 3,118.8 45 6.6 -2.9 0
H-1 Upgrades 2008 11,482.3 12,276.7 353 -159.9 -201.4 0
IDECM 2018 1,274.0 1,294.0 324 16.9 18.0 0
IRST 2008 1,934.2 2,381.0 173 -44.6 -57.1 0
JPALS 2016 1,722.2 1,733.3 33 -3.9 -3.8 0
KC-130J 2010 9,613.3 11,052.0 111 -25.8 23.7 0
LCS 2010 19,277.5 22,411.1 35 -243.0 -297.4 0
Program Acquisition Cost Summary (Dollars in Millions)DEC 2019
Current Estimate Changes This Quarter
Page 17
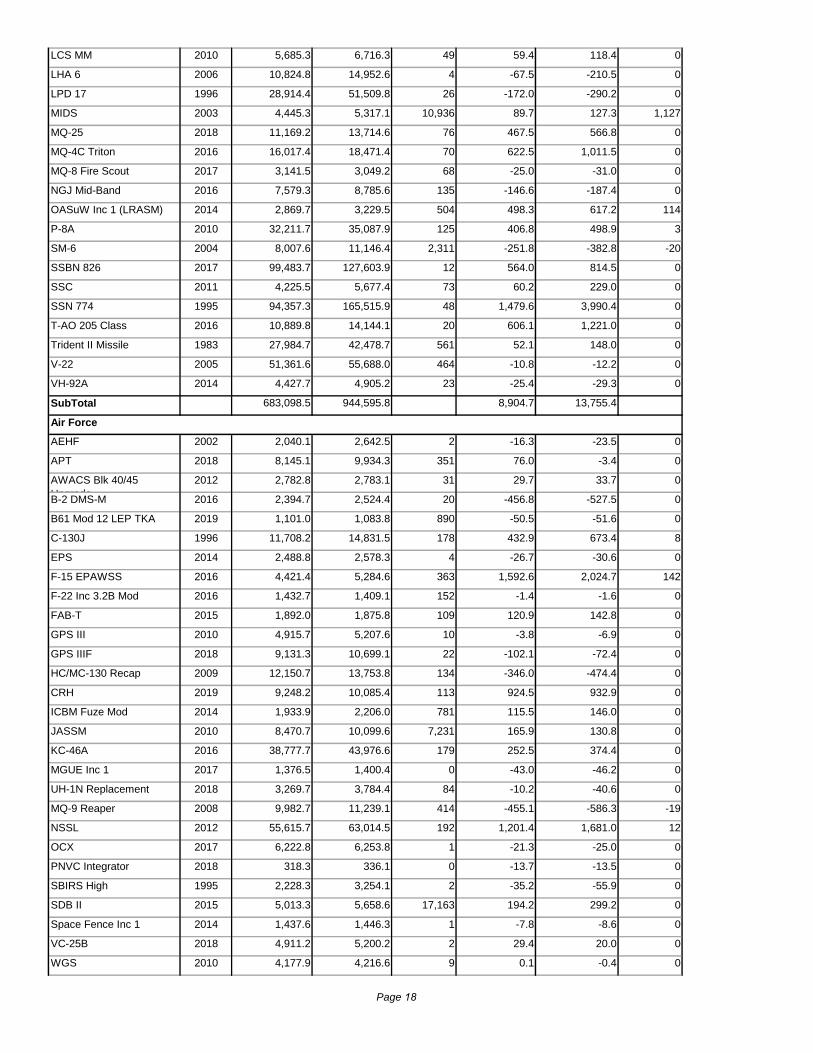
LCS MM 2010 5,685.3 6,716.3 49 59.4 118.4 0
LHA 6 2006 10,824.8 14,952.6 4 -67.5 -210.5 0
LPD 17 1996 28,914.4 51,509.8 26 -172.0 -290.2 0
MIDS 2003 4,445.3 5,317.1 10,936 89.7 127.3 1,127
MQ-25 2018 11,169.2 13,714.6 76 467.5 566.8 0
MQ-4C Triton 2016 16,017.4 18,471.4 70 622.5 1,011.5 0
MQ-8 Fire Scout 2017 3,141.5 3,049.2 68 -25.0 -31.0 0
NGJ Mid-Band 2016 7,579.3 8,785.6 135 -146.6 -187.4 0
OASuW Inc 1 (LRASM) 2014 2,869.7 3,229.5 504 498.3 617.2 114
P-8A 2010 32,211.7 35,087.9 125 406.8 498.9 3
SM-6 2004 8,007.6 11,146.4 2,311 -251.8 -382.8 -20
SSBN 826 2017 99,483.7 127,603.9 12 564.0 814.5 0
SSC 2011 4,225.5 5,677.4 73 60.2 229.0 0
SSN 774 1995 94,357.3 165,515.9 48 1,479.6 3,990.4 0
T-AO 205 Class 2016 10,889.8 14,144.1 20 606.1 1,221.0 0
Trident II Missile 1983 27,984.7 42,478.7 561 52.1 148.0 0
V-22 2005 51,361.6 55,688.0 464 -10.8 -12.2 0
VH-92A 2014 4,427.7 4,905.2 23 -25.4 -29.3 0
SubTotal 683,098.5 944,595.8 8,904.7 13,755.4
Air Force
AEHF 2002 2,040.1 2,642.5 2 -16.3 -23.5 0
APT 2018 8,145.1 9,934.3 351 76.0 -3.4 0
AWACS Blk 40/45
Upgrade
2012 2,782.8 2,783.1 31 29.7 33.7 0
B-2 DMS-M 2016 2,394.7 2,524.4 20 -456.8 -527.5 0
B61 Mod 12 LEP TKA 2019 1,101.0 1,083.8 890 -50.5 -51.6 0
C-130J 1996 11,708.2 14,831.5 178 432.9 673.4 8
EPS 2014 2,488.8 2,578.3 4 -26.7 -30.6 0
F-15 EPAWSS 2016 4,421.4 5,284.6 363 1,592.6 2,024.7 142
F-22 Inc 3.2B Mod 2016 1,432.7 1,409.1 152 -1.4 -1.6 0
FAB-T 2015 1,892.0 1,875.8 109 120.9 142.8 0
GPS III 2010 4,915.7 5,207.6 10 -3.8 -6.9 0
GPS IIIF 2018 9,131.3 10,699.1 22 -102.1 -72.4 0
HC/MC-130 Recap 2009 12,150.7 13,753.8 134 -346.0 -474.4 0
CRH 2019 9,248.2 10,085.4 113 924.5 932.9 0
ICBM Fuze Mod 2014 1,933.9 2,206.0 781 115.5 146.0 0
JASSM 2010 8,470.7 10,099.6 7,231 165.9 130.8 0
KC-46A 2016 38,777.7 43,976.6 179 252.5 374.4 0
MGUE Inc 1 2017 1,376.5 1,400.4 0 -43.0 -46.2 0
UH-1N Replacement 2018 3,269.7 3,784.4 84 -10.2 -40.6 0
MQ-9 Reaper 2008 9,982.7 11,239.1 414 -455.1 -586.3 -19
NSSL 2012 55,615.7 63,014.5 192 1,201.4 1,681.0 12
OCX 2017 6,222.8 6,253.8 1 -21.3 -25.0 0
PNVC Integrator 2018 318.3 336.1 0 -13.7 -13.5 0
SBIRS High 1995 2,228.3 3,254.1 2 -35.2 -55.9 0
SDB II 2015 5,013.3 5,658.6 17,163 194.2 299.2 0
Space Fence Inc 1 2014 1,437.6 1,446.3 1 -7.8 -8.6 0
VC-25B 2018 4,911.2 5,200.2 2 29.4 20.0 0
WGS 2010 4,177.9 4,216.6 9 0.1 -0.4 0
Page 18
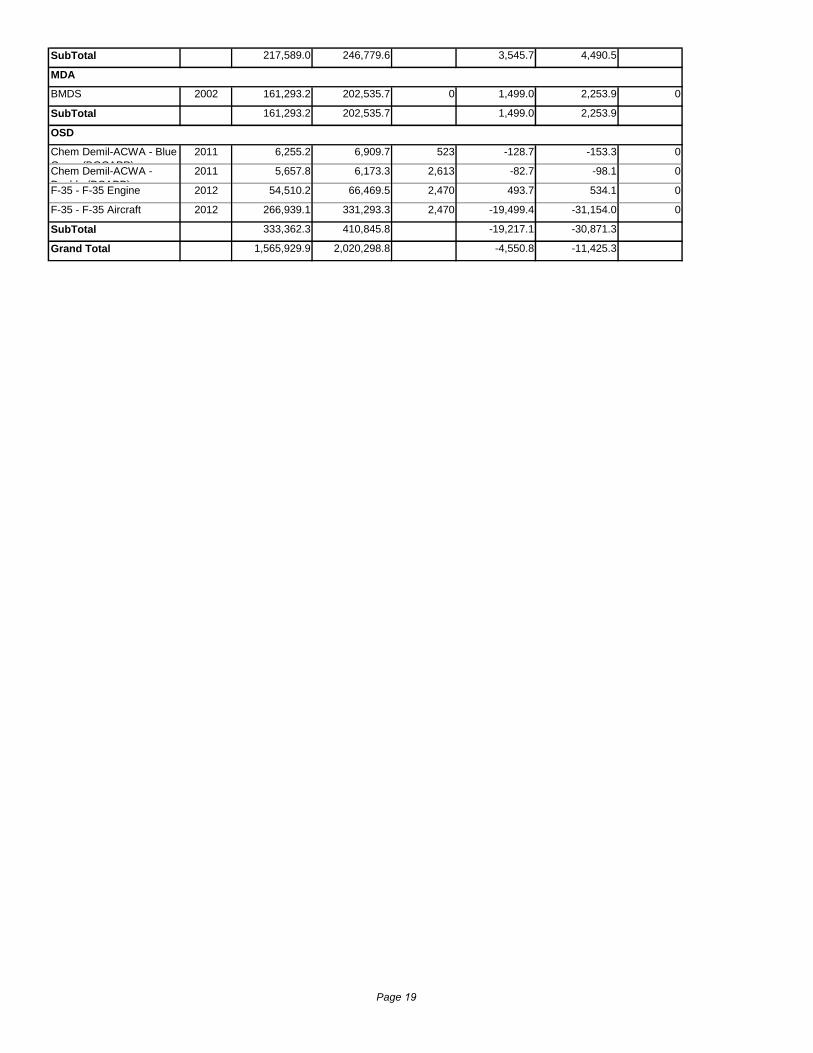
SubTotal 217,589.0 246,779.6 3,545.7 4,490.5
MDA
BMDS 2002 161,293.2 202,535.7 0 1,499.0 2,253.9 0
SubTotal 161,293.2 202,535.7 1,499.0 2,253.9
OSD
Chem Demil-ACWA - Blue
Grass (BGCAPP)
2011 6,255.2 6,909.7 523 -128.7 -153.3 0
Chem Demil-ACWA -
Pueblo (PCAPP)
2011 5,657.8 6,173.3 2,613 -82.7 -98.1 0
F-35 - F-35 Engine 2012 54,510.2 66,469.5 2,470 493.7 534.1 0
F-35 - F-35 Aircraft 2012 266,939.1 331,293.3 2,470 -19,499.4 -31,154.0 0
SubTotal 333,362.3 410,845.8 -19,217.1 -30,871.3
Grand Total 1,565,929.9 2,020,298.8 -4,550.8 -11,425.3
Page 19
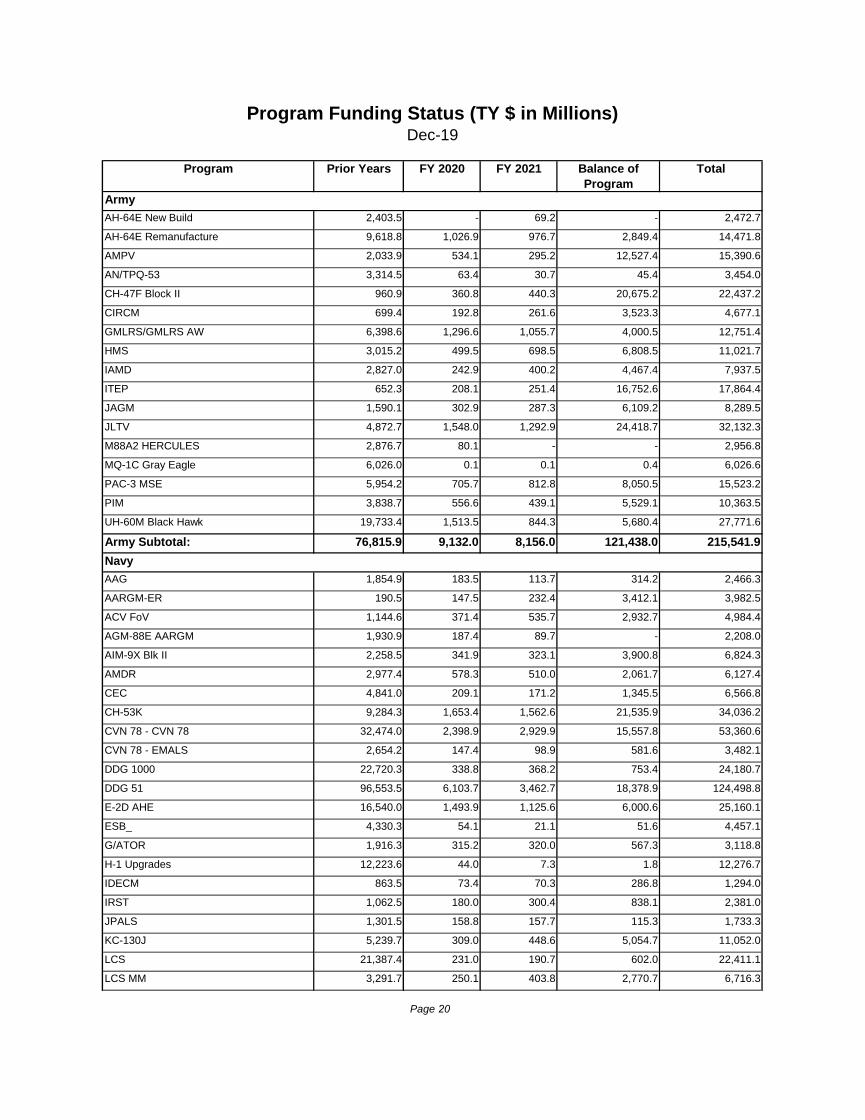
Program Prior Years FY 2020 FY 2021 Balance of
Program
Total
Army
AH-64E New Build 2,403.5 - 69.2 - 2,472.7
AH-64E Remanufacture 9,618.8 1,026.9 976.7 2,849.4 14,471.8
AMPV 2,033.9 534.1 295.2 12,527.4 15,390.6
AN/TPQ-53 3,314.5 63.4 30.7 45.4 3,454.0
CH-47F Block II 960.9 360.8 440.3 20,675.2 22,437.2
CIRCM 699.4 192.8 261.6 3,523.3 4,677.1
GMLRS/GMLRS AW 6,398.6 1,296.6 1,055.7 4,000.5 12,751.4
HMS 3,015.2 499.5 698.5 6,808.5 11,021.7
IAMD 2,827.0 242.9 400.2 4,467.4 7,937.5
ITEP 652.3 208.1 251.4 16,752.6 17,864.4
JAGM 1,590.1 302.9 287.3 6,109.2 8,289.5
JLTV 4,872.7 1,548.0 1,292.9 24,418.7 32,132.3
M88A2 HERCULES 2,876.7 80.1 - - 2,956.8
MQ-1C Gray Eagle 6,026.0 0.1 0.1 0.4 6,026.6
PAC-3 MSE 5,954.2 705.7 812.8 8,050.5 15,523.2
PIM 3,838.7 556.6 439.1 5,529.1 10,363.5
UH-60M Black Hawk 19,733.4 1,513.5 844.3 5,680.4 27,771.6
Army Subtotal: 76,815.9 9,132.0 8,156.0 121,438.0 215,541.9
Navy
AAG 1,854.9 183.5 113.7 314.2 2,466.3
AARGM-ER 190.5 147.5 232.4 3,412.1 3,982.5
ACV FoV 1,144.6 371.4 535.7 2,932.7 4,984.4
AGM-88E AARGM 1,930.9 187.4 89.7 - 2,208.0
AIM-9X Blk II 2,258.5 341.9 323.1 3,900.8 6,824.3
AMDR 2,977.4 578.3 510.0 2,061.7 6,127.4
CEC 4,841.0 209.1 171.2 1,345.5 6,566.8
CH-53K 9,284.3 1,653.4 1,562.6 21,535.9 34,036.2
CVN 78 - CVN 78 32,474.0 2,398.9 2,929.9 15,557.8 53,360.6
CVN 78 - EMALS 2,654.2 147.4 98.9 581.6 3,482.1
DDG 1000 22,720.3 338.8 368.2 753.4 24,180.7
DDG 51 96,553.5 6,103.7 3,462.7 18,378.9 124,498.8
E-2D AHE 16,540.0 1,493.9 1,125.6 6,000.6 25,160.1
ESB_ 4,330.3 54.1 21.1 51.6 4,457.1
G/ATOR 1,916.3 315.2 320.0 567.3 3,118.8
H-1 Upgrades 12,223.6 44.0 7.3 1.8 12,276.7
IDECM 863.5 73.4 70.3 286.8 1,294.0
IRST 1,062.5 180.0 300.4 838.1 2,381.0
JPALS 1,301.5 158.8 157.7 115.3 1,733.3
KC-130J 5,239.7 309.0 448.6 5,054.7 11,052.0
LCS 21,387.4 231.0 190.7 602.0 22,411.1
LCS MM 3,291.7 250.1 403.8 2,770.7 6,716.3
Program Funding Status (TY $ in Millions)Dec-19
Page 20
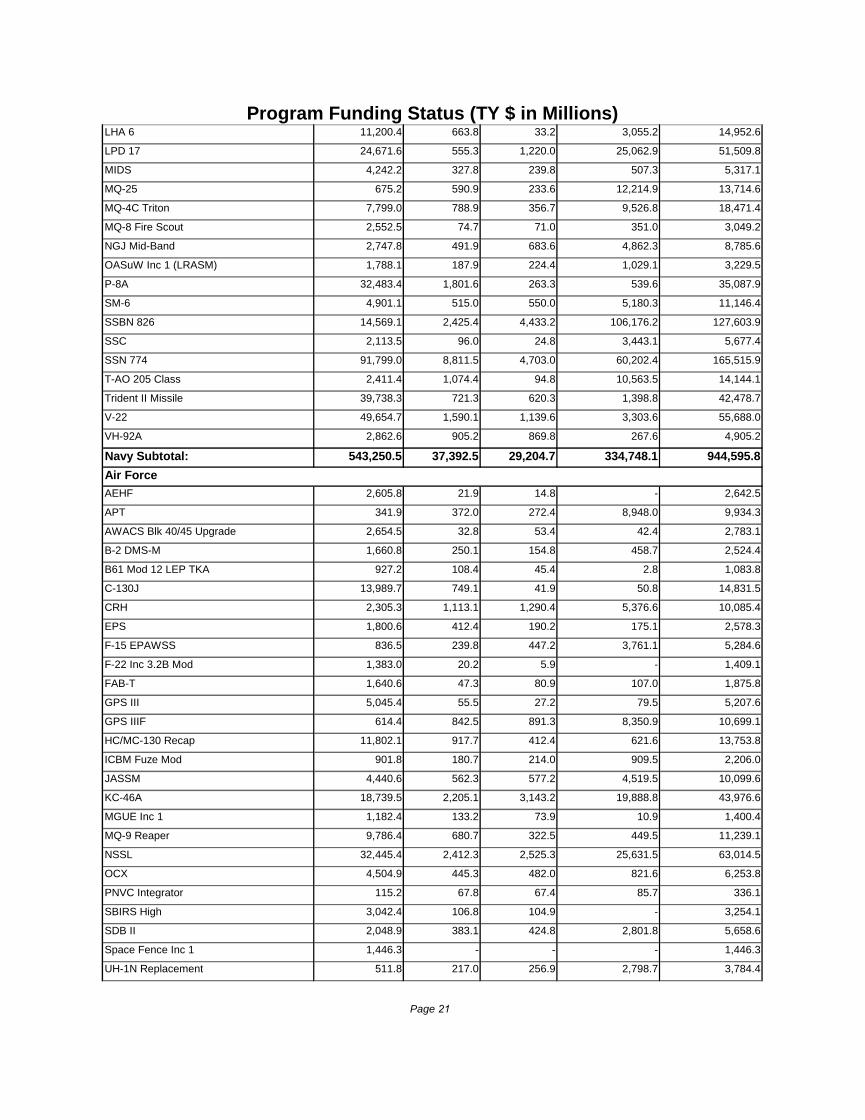
Program Funding Status (TY $ in Millions)LHA 6 11,200.4 663.8 33.2 3,055.2 14,952.6
LPD 17 24,671.6 555.3 1,220.0 25,062.9 51,509.8
MIDS 4,242.2 327.8 239.8 507.3 5,317.1
MQ-25 675.2 590.9 233.6 12,214.9 13,714.6
MQ-4C Triton 7,799.0 788.9 356.7 9,526.8 18,471.4
MQ-8 Fire Scout 2,552.5 74.7 71.0 351.0 3,049.2
NGJ Mid-Band 2,747.8 491.9 683.6 4,862.3 8,785.6
OASuW Inc 1 (LRASM) 1,788.1 187.9 224.4 1,029.1 3,229.5
P-8A 32,483.4 1,801.6 263.3 539.6 35,087.9
SM-6 4,901.1 515.0 550.0 5,180.3 11,146.4
SSBN 826 14,569.1 2,425.4 4,433.2 106,176.2 127,603.9
SSC 2,113.5 96.0 24.8 3,443.1 5,677.4
SSN 774 91,799.0 8,811.5 4,703.0 60,202.4 165,515.9
T-AO 205 Class 2,411.4 1,074.4 94.8 10,563.5 14,144.1
Trident II Missile 39,738.3 721.3 620.3 1,398.8 42,478.7
V-22 49,654.7 1,590.1 1,139.6 3,303.6 55,688.0
VH-92A 2,862.6 905.2 869.8 267.6 4,905.2
Navy Subtotal: 543,250.5 37,392.5 29,204.7 334,748.1 944,595.8
Air Force
AEHF 2,605.8 21.9 14.8 - 2,642.5
APT 341.9 372.0 272.4 8,948.0 9,934.3
AWACS Blk 40/45 Upgrade 2,654.5 32.8 53.4 42.4 2,783.1
B-2 DMS-M 1,660.8 250.1 154.8 458.7 2,524.4
B61 Mod 12 LEP TKA 927.2 108.4 45.4 2.8 1,083.8
C-130J 13,989.7 749.1 41.9 50.8 14,831.5
CRH 2,305.3 1,113.1 1,290.4 5,376.6 10,085.4
EPS 1,800.6 412.4 190.2 175.1 2,578.3
F-15 EPAWSS 836.5 239.8 447.2 3,761.1 5,284.6
F-22 Inc 3.2B Mod 1,383.0 20.2 5.9 - 1,409.1
FAB-T 1,640.6 47.3 80.9 107.0 1,875.8
GPS III 5,045.4 55.5 27.2 79.5 5,207.6
GPS IIIF 614.4 842.5 891.3 8,350.9 10,699.1
HC/MC-130 Recap 11,802.1 917.7 412.4 621.6 13,753.8
ICBM Fuze Mod 901.8 180.7 214.0 909.5 2,206.0
JASSM 4,440.6 562.3 577.2 4,519.5 10,099.6
KC-46A 18,739.5 2,205.1 3,143.2 19,888.8 43,976.6
MGUE Inc 1 1,182.4 133.2 73.9 10.9 1,400.4
MQ-9 Reaper 9,786.4 680.7 322.5 449.5 11,239.1
NSSL 32,445.4 2,412.3 2,525.3 25,631.5 63,014.5
OCX 4,504.9 445.3 482.0 821.6 6,253.8
PNVC Integrator 115.2 67.8 67.4 85.7 336.1
SBIRS High 3,042.4 106.8 104.9 - 3,254.1
SDB II 2,048.9 383.1 424.8 2,801.8 5,658.6
Space Fence Inc 1 1,446.3 - - - 1,446.3
UH-1N Replacement 511.8 217.0 256.9 2,798.7 3,784.4
Page 21
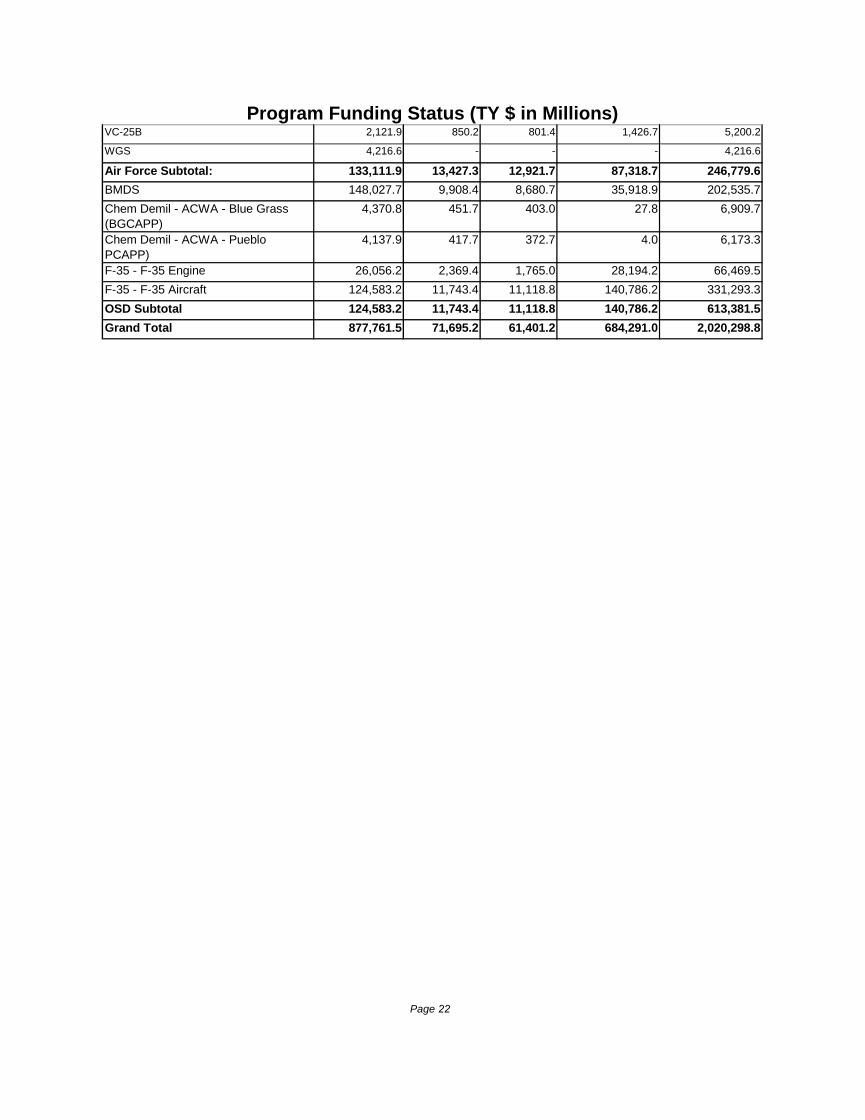
Program Funding Status (TY $ in Millions)VC-25B 2,121.9 850.2 801.4 1,426.7 5,200.2
WGS 4,216.6 - - - 4,216.6
Air Force Subtotal: 133,111.9 13,427.3 12,921.7 87,318.7 246,779.6
BMDS 148,027.7 9,908.4 8,680.7 35,918.9 202,535.7
Chem Demil - ACWA - Blue Grass
(BGCAPP)
4,370.8 451.7 403.0 27.8 6,909.7
Chem Demil - ACWA - Pueblo
PCAPP)
4,137.9 417.7 372.7 4.0 6,173.3
F-35 - F-35 Engine 26,056.2 2,369.4 1,765.0 28,194.2 66,469.5
F-35 - F-35 Aircraft 124,583.2 11,743.4 11,118.8 140,786.2 331,293.3
OSD Subtotal 124,583.2 11,743.4 11,118.8 140,786.2 613,381.5
Grand Total 877,761.5 71,695.2 61,401.2 684,291.0 2,020,298.8
Page 22