Embed Size (px)
Citation preview

DEPARTMENT OF EDUCATION AND TRAINING
Objectives
The Department of Education and Training (the Department) works in partnership with the community to provide sustainable, high quality school education and training services to meet the needs of the people of Canberra.
Departmental services include the provision of government school education; registration of non government schools; registration for home education; planning and coordination of vocational education and training; and provision of preschool and early intervention education programs.
Through these services, the Department aims to improve learning and employment outcomes for all students and trainees.
2006-07 Priorities
Strategic and operational issues to be pursued in 2006-07 include: • consulting with the community regarding the Government’s Towards 2020: renewing our
schools proposal, and implementing those components agreed by Government;
• undertaking upgrades of school facilities to improve the environment for learning;
• resolving and implementing the teacher Enterprise Bargaining Agreement;
• implementing the Smart Schools – Smart Students IT program;
• restructuring central office to achieve efficiencies;
• continuing the delivery of 12 hours per week of preschool education for all eligible four year olds;
• implementing the next stage of Curriculum Renewal in all ACT schools;
• planning for the construction of new schools in West Belconnen and Harrison, and conducting the feasibility study for a college in Gungahlin;
• continuing the partnership with the Australian National University to provide advanced senior secondary studies for years 11 and 12 students in physics, chemistry and mathematics; and
• strengthening educational provision in ACT senior secondary colleges following the 2005 external review.
2006-07 Budget Paper No. 4 373 Department of Education and Training
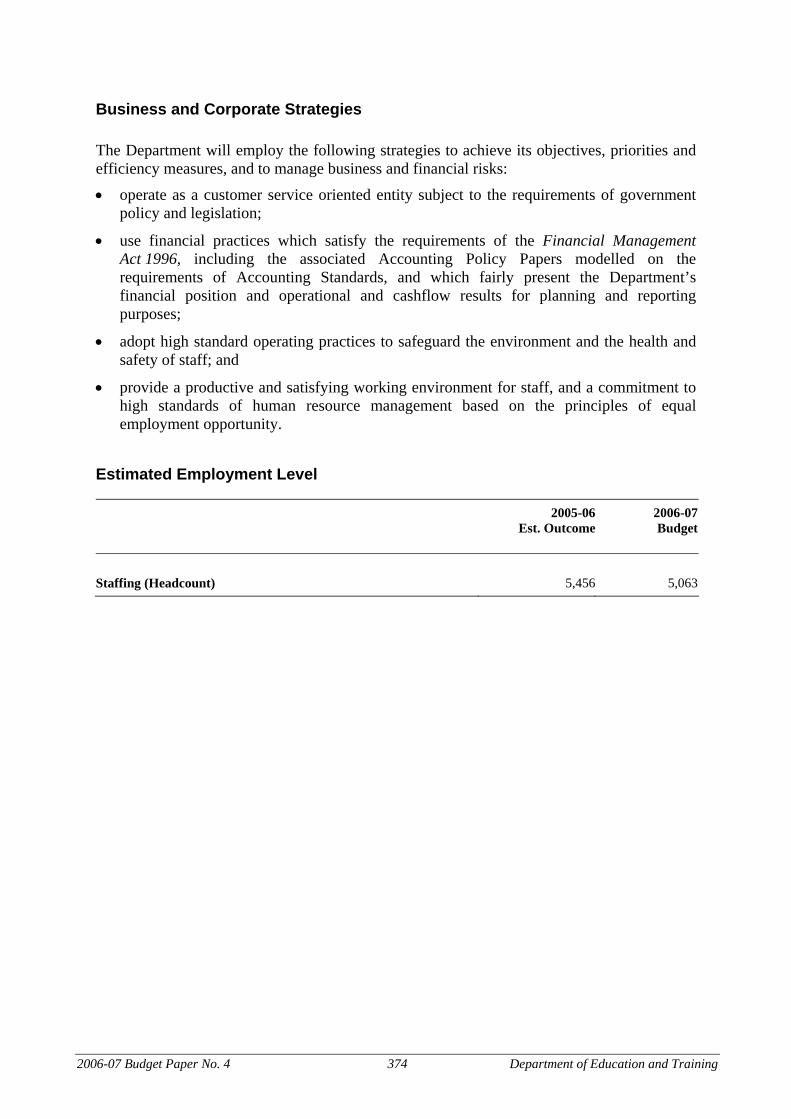
Business and Corporate Strategies
The Department will employ the following strategies to achieve its objectives, priorities and efficiency measures, and to manage business and financial risks: • operate as a customer service oriented entity subject to the requirements of government
policy and legislation;
• use financial practices which satisfy the requirements of the Financial Management Act 1996, including the associated Accounting Policy Papers modelled on the requirements of Accounting Standards, and which fairly present the Department’s financial position and operational and cashflow results for planning and reporting purposes;
• adopt high standard operating practices to safeguard the environment and the health and safety of staff; and
• provide a productive and satisfying working environment for staff, and a commitment to high standards of human resource management based on the principles of equal employment opportunity.
Estimated Employment Level
2005-06
Est. Outcome2006-07Budget
Staffing (Headcount) 5,456 5,063
2006-07 Budget Paper No. 4 374 Department of Education and Training
Output Classes
Education in government schools is guided by six principles: Best Practice, High Standards, Self Assessment, Innovation, Professional Learning Communities and Quality Teaching.
Total Cost Government Payment for
Outputs 2005-06
Est. Outcome$’000
2006-07Budget
$’000
2005-06 Est. Outcome
$’000
2006-07Budget
$’000
Output Class 1: Government School Education1
419,700 430,498 349,477 367,553 Output 1.1: Government Primary School Education 173,360 187,376 148,224 156,558
Note: 1 Total cost for Government School Education, includes depreciation and amortisation of $25.337 million in 2005-06 and
$28.158 million in 2006-07.
Output Description
Provision of government primary school education over an average of seven years to all enrolled students. Within a broad comprehensive education, there is a focus on literacy and numeracy, health and fitness, self-management and interpersonal skills.
Teaching programs and learning environments in government primary schools are designed to assist each student to reach their potential. Flexible learning structures cater for the needs of all students and access is provided to a wide range of performing and visual arts. ACT Government primary school students consistently achieve high academic results against national benchmarks. Parents, teachers and local communities have a voice in school governance through school boards and in setting future school directions through school reviews.
2006-07 Budget Paper No. 4 375 Department of Education and Training

Output Classes cont.
Total Cost Government Payment for Outputs
2005-06Est. Outcome
$’000
2006-07Budget
$’000
2005-06 Est. Outcome
$’000
2006-07Budget
$’000
Output 1.2: Government High School Education 124,534 116,381 97,351 101,503
Output Description
Provision of government high school education over an average of four years to all enrolled students. Within a broad comprehensive education across key learning areas, the focus is on providing challenging and engaging learning, building relationships based on mutual trust and respect and connecting students to the outside world.
School programs aim to develop students’ critical thinking, problem solving, interpersonal and teamwork skills, and empower students to participate in community, national and international forums. ACT Government high school students consistently achieve high academic results against national and international benchmarks. Social and environmental responsibility is developed through peer support, and school and community service programs. Career education, work experience, vocational and enterprise education programs link students with industry and the business community. Parents, students, teachers and local communities have a voice in school governance through school boards and in setting future school directions through school reviews.
Total Cost Government Payment for Outputs
2005-06Est. Outcome
$’000
2006-07Budget
$’000
2005-06 Est. Outcome
$’000
2006-07Budget
$’000
Output 1.3: Government Secondary College Education 75,771 79,003 64,255 67,821
Output Description
Provision of government secondary college education leading to further education and training or the workplace. Secondary college education is available to all enrolled students, over an average of two years.
Government secondary colleges offer courses accredited with the ACT Board of Senior Secondary Studies to ensure courses leading to tertiary entrance qualifications meet the requirements of tertiary institutions throughout Australia. Colleges offer a range of courses enabling greater student specialisation. The incorporation of vocational education and training programs into the curriculum provides students with valuable industry experience. Parents, students, teachers and local communities have a voice in school governance through school boards and in setting future school directions through school reviews.
2006-07 Budget Paper No. 4 376 Department of Education and Training
Output Classes cont.
Total Cost Government Payment for Outputs
2005-06Est. Outcome
$’000
2006-07Budget
$’000
2005-06 Est. Outcome
$’000
2006-07Budget
$’000
Output 1.4: Government Special Education 46,035 47,738 39,647 41,671
Output Description
Provision of government special education in special and mainstream schools. Within a broad comprehensive education, the focus is on literacy and numeracy, health and self management and interpersonal skills appropriate to the assessed needs of students with disabilities.
A range of programs is available for students with a disability including enrolment in special schools, enrolment in specific classes or units in mainstream schools, or enrolment in mainstream classes with varying levels of support. Parents and schools work together in developing and reviewing an Individual Learning Plan (ILP) for each student that identifies their educational goals. The Student Centred Appraisal of Need identifies the level of resourcing required by the student in order to access and participate in their educational program. Student progress against the ILP is reviewed annually.
Total Cost Government Payment for Outputs
2005-06Est. Outcome
$’000
2006-07Budget
$’000
2005-06 Est. Outcome
$’000
2006-07Budget
$’000
Output Class 2: Non Government Education 1,344 1,418 1,276 1,351 Output 2.1: Non Government Education 1,344 1,418 1,276 1,351
Output Description
The Department contributes to the maintenance of standards in non government schools and home education through compliance and registration, accreditation and certification of senior secondary courses, support and liaison with the non government sector, administration and payment of Australian Government and Territory grants for the non government sector, and the conduct of an annual non government schools census.
2006-07 Budget Paper No. 4 377 Department of Education and Training
Output Classes cont.
Total Cost Government Payment for Outputs
2005-06Est. Outcome
$’000
2006-07Budget
$’000
2005-06 Est. Outcome
$’000
2006-07Budget
$’000
Output Class 3: Vocational Education and Training1
80,450 22,325 79,970 21,865 Output 3.1: Planning and Coordination of Vocational Education and Training Services 22,522 22,325 22,042 21,865
Note: 1 Total cost includes depreciation and amortisation of $0.103 million in 2005-06 and $0.103 million in 2006-07.
Output Description
Contribute to the planning and coordination of vocational education and training by managing apprentice and traineeship schemes, and registration and accreditation of providers under the Australian Quality Training Framework. Undertake disbursal of funding for training purchased from providers through competitive processes.
Vocational education and training is planned in consultation with industry and community groups to predict industry trends and identify the future training requirements of the ACT. National objectives for vocational education and training are progressed through liaison with other State Training Authorities and the Australian Government. Output to cease after 2005-06 Total Cost Government Payment for
Outputs
2005-06Est. Outcome
$’000
2006-07Budget
$’000
2005-06 Est. Outcome
$’000
2006-07Budget
$’000
Output: Provision of Vocational Education and Training Services through the Canberra Institute of Technology1
57,928 n/a 57,928 n/a
Note: 1 This output has been discontinued for the 2006-07 Budget. Output: Provision of Vocational Education and Training Services through
the Canberra Institute of Technology is now reported by the Canberra Institute of Technology in Output 1.1: Provision of Vocational Education and Training Services.
2006-07 Budget Paper No. 4 378 Department of Education and Training
Output Classes cont.
Total Cost Government Payment for Outputs
2005-06Est. Outcome
$’000
2006-07Budget
$’000
2005-06 Est. Outcome
$’000
2006-07Budget
$’000
Output Class 4: Early Intervention1
17,923 21,419 16,529 18,336 Output 4.1: Early Childhood and Preschool Education 17,923 21,419 16,529 18,336
Note: 1 Total cost includes depreciation and amortisation of $0.685 million in 2005-06 and $0.681 million in 2006-07.
Output Description
Provision of Early Intervention programs to children from around two to six years who are not enrolled in a primary school and who have a disability or a developmental delay.
Provision of 12 hours per week of preschool education to all eligible four year olds to consolidate and extend early learning experiences with a focus on literacy, numeracy and socialisation.
Early Intervention is a means of identifying and addressing the physical, emotional, social and educational needs of children from birth to five years. The focus is on the critical years of growth and transition to increase protective factors and reduce social and environmental risks that may have lifetime implications. Programs can be universal (available to all) or more specifically targeted to those with special needs.
2006-07 Budget Paper No. 4 379 Department of Education and Training
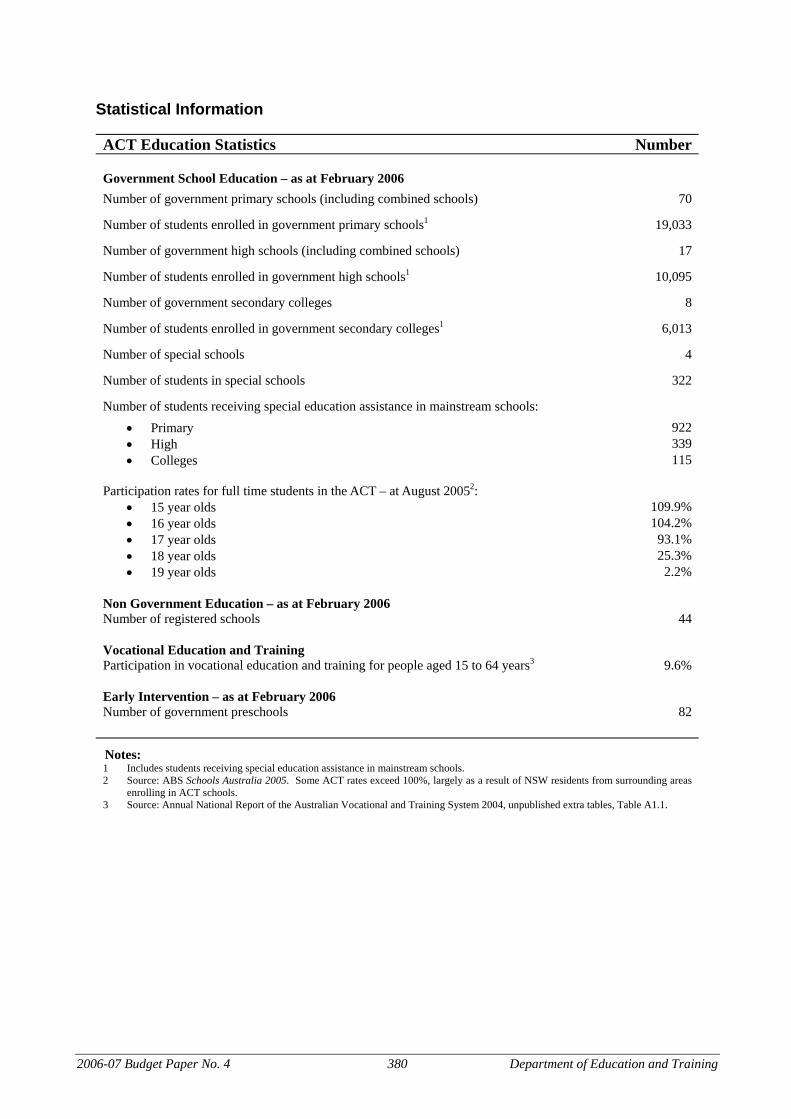
Statistical Information
ACT Education Statistics Number
Government School Education – as at February 2006
Number of government primary schools (including combined schools) 70
Number of students enrolled in government primary schools1 19,033
Number of government high schools (including combined schools) 17
Number of students enrolled in government high schools1 10,095
Number of government secondary colleges 8
Number of students enrolled in government secondary colleges1 6,013
Number of special schools 4
Number of students in special schools 322
Number of students receiving special education assistance in mainstream schools: • Primary 922 • High 339 • Colleges 115
Participation rates for full time students in the ACT – at August 20052:
• 15 year olds 109.9% • 16 year olds 104.2% • 17 year olds 93.1% • 18 year olds 25.3% • 19 year olds 2.2%
Non Government Education – as at February 2006
Number of registered schools 44
Vocational Education and Training
Participation in vocational education and training for people aged 15 to 64 years3 9.6%
Early Intervention – as at February 2006
Number of government preschools 82
Notes: 1 Includes students receiving special education assistance in mainstream schools. 2 Source: ABS Schools Australia 2005. Some ACT rates exceed 100%, largely as a result of NSW residents from surrounding areas
enrolling in ACT schools. 3 Source: Annual National Report of the Australian Vocational and Training System 2004, unpublished extra tables, Table A1.1.
2006-07 Budget Paper No. 4 380 Department of Education and Training

Strategic Indicators
Strategic Indicator 1 Student performance
A key strategic priority is the achievement of excellent outcomes for students through high quality teaching and a broad and innovative curriculum.
Quality and effectiveness can be measured through student outcomes against national and international benchmarks and proficiencies.
A range of programs is used to measure student performance. At the national level, students in years 3, 5 and 7 are assessed against national benchmarks in reading, writing and numeracy. National assessment programs are currently being developed for science, civics and citizenship, and information and communication technology. At the international level, 15 year old students participate in the Program for International Student Assessment (PISA) and in years 4 and 8, students participate in the Trends in International Mathematics and Science Study (TIMSS). Nationally comparable learning outcomes ACT years 3, 5 and 7 reading and numeracy benchmark results for 2004 were among the highest in the country and confirm the high literacy and numeracy levels of students in ACT schools. ACT students performed very well against the reading, writing and numeracy benchmarks in all year levels tested.
Students Who Achieved National Reading, Writing and Numeracy Benchmarks1
Percentage of Students Achieving the National Benchmarks in 2004
80
90
100
Readingyear 3
Writingyear 3
Numeracyyear 3
Readingyear 5
Writingyear 5
Numeracyyear 5
Readingyear 7
Writingyear 7
Numeracyyear 7Pe
rcen
tage
abo
ve B
ench
mar
k
ACT Australia
Note: 1. The most recently reported figures are for 2004, as published in the National Report on Schooling 2004, Preliminary Paper.
2006-07 Budget Paper No. 4 381 Department of Education and Training
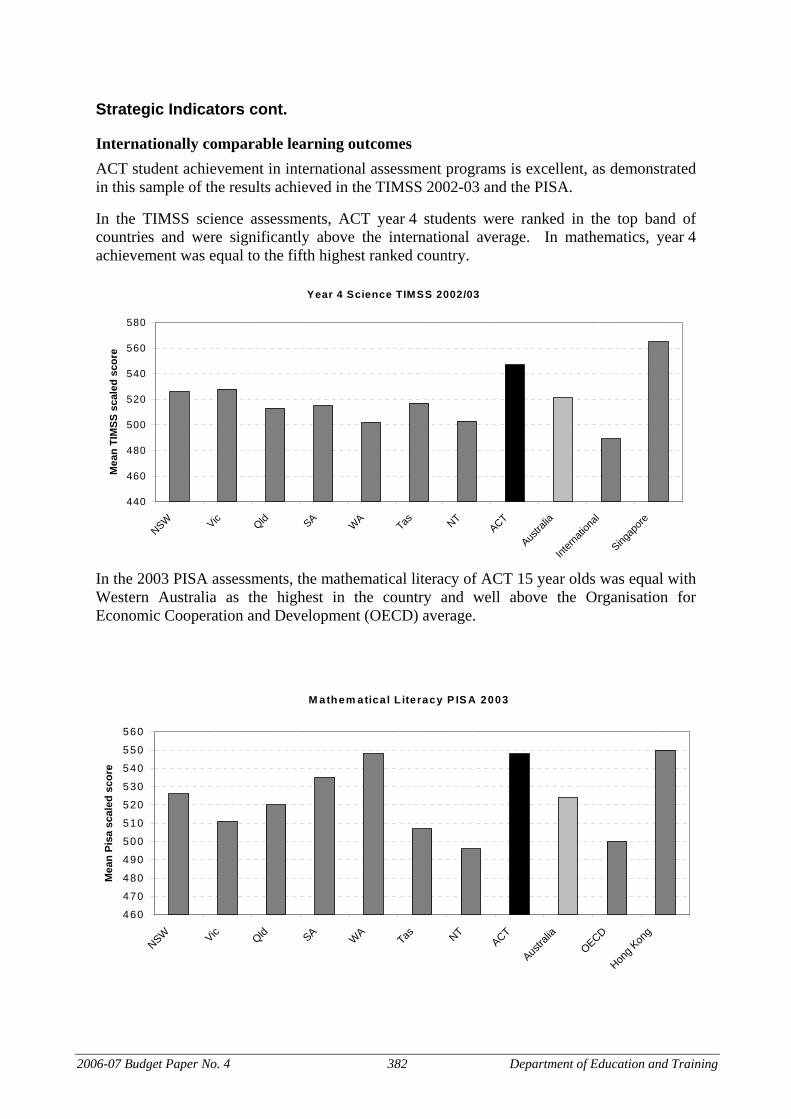
Strategic Indicators cont.
Internationally comparable learning outcomes ACT student achievement in international assessment programs is excellent, as demonstrated in this sample of the results achieved in the TIMSS 2002-03 and the PISA.
In the TIMSS science assessments, ACT year 4 students were ranked in the top band of countries and were significantly above the international average. In mathematics, year 4 achievement was equal to the fifth highest ranked country.
Year 4 Science TIMSS 2002/03
440
460
480
500
520
540
560
580
NSW Vic Qld SAW
ATas NT
ACT
Austra
lia
Intern
ation
al
Singap
ore
Mea
n TI
MSS
sca
led
scor
e
In the 2003 PISA assessments, the mathematical literacy of ACT 15 year olds was equal with Western Australia as the highest in the country and well above the Organisation for Economic Cooperation and Development (OECD) average.
M athem atica l L iteracy P IS A 2003
460
470
480
490
500
510
520
530
540
550
560
NSW Vic Qld SA WA
Tas NTACT
Austra
liaOECD
Hong K
ong
Mea
n Pi
sa s
cale
d sc
ore
2006-07 Budget Paper No. 4 382 Department of Education and Training
Strategic Indicators cont.
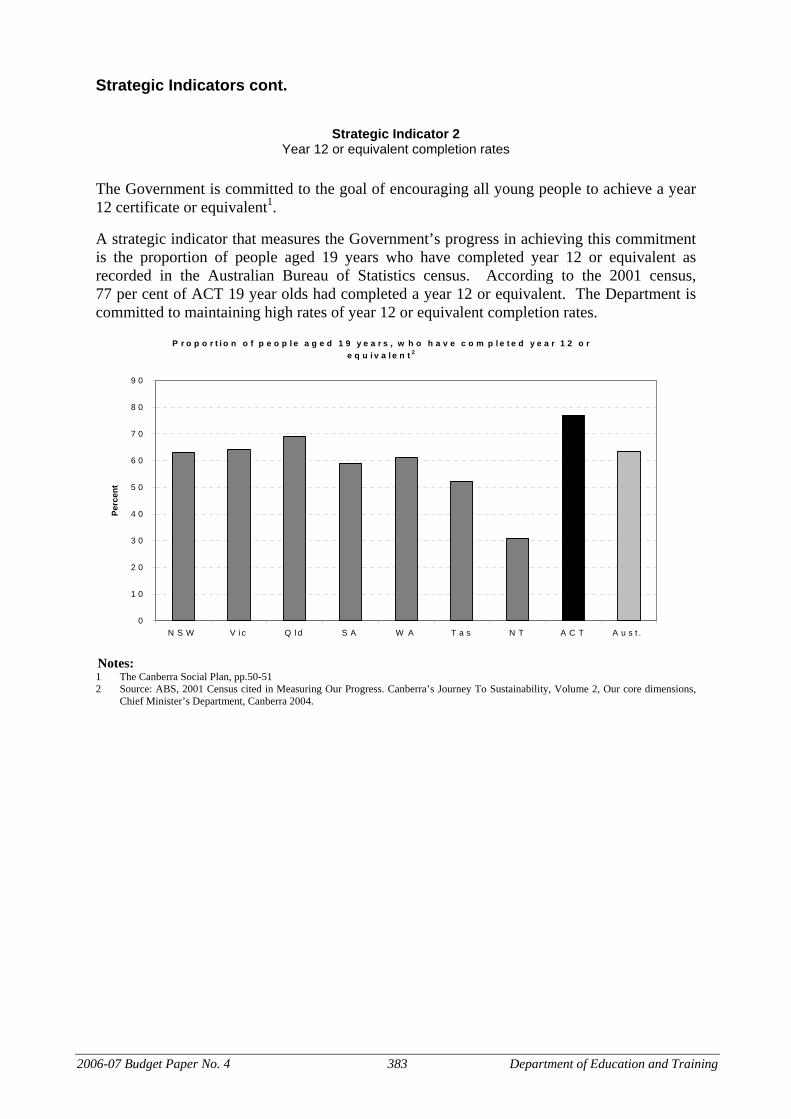
Strategic Indicator 2 Year 12 or equivalent completion rates
The Government is committed to the goal of encouraging all young people to achieve a year 12 certificate or equivalent1.
A strategic indicator that measures the Government’s progress in achieving this commitment is the proportion of people aged 19 years who have completed year 12 or equivalent as recorded in the Australian Bureau of Statistics census. According to the 2001 census, 77 per cent of ACT 19 year olds had completed a year 12 or equivalent. The Department is committed to maintaining high rates of year 12 or equivalent completion rates.
P r o p o r t i o n o f p e o p l e a g e d 1 9 y e a r s , w h o h a v e c o m p l e t e d y e a r 1 2 o r e q u i v a l e n t 2
0
1 0
2 0
3 0
4 0
5 0
6 0
7 0
8 0
9 0
N S W V ic Q ld S A W A T a s N T A C T A u s t .
Perc
ent
Notes: 1 The Canberra Social Plan, pp.50-51 2 Source: ABS, 2001 Census cited in Measuring Our Progress. Canberra’s Journey To Sustainability, Volume 2, Our core dimensions,
Chief Minister’s Department, Canberra 2004.
2006-07 Budget Paper No. 4 383 Department of Education and Training

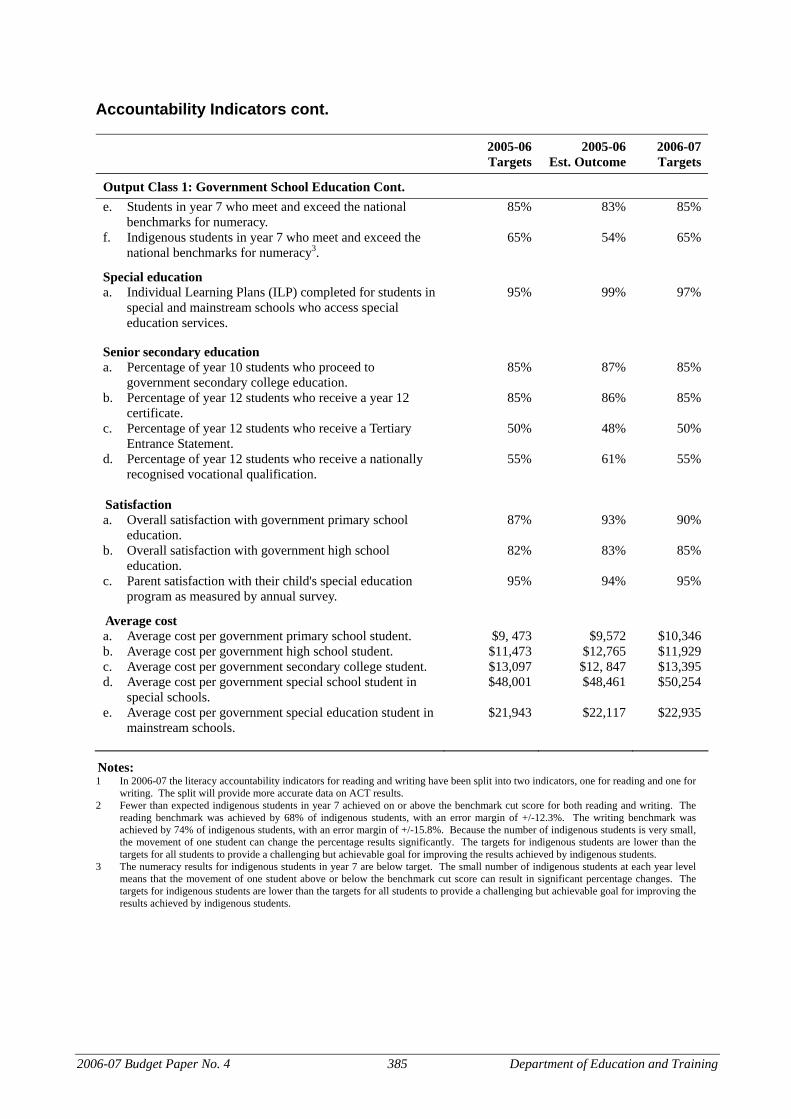
Accountability Indicators
2005-06Targets
2005-06 Est. Outcome
2006-07Targets
Output Class 1: Government School Education
Literacy1 a. Students in year 3 who meet and exceed the national
benchmarks for reading. n/a n/a 95%
b. Indigenous students in year 3 who meet and exceed the national benchmarks for reading.
n/a n/a 94%
c. Students in year 5 who meet and exceed the national benchmarks for reading.
n/a n/a 95%
d. Indigenous students in year 5 who meet and exceed the national benchmarks for reading.
n/a n/a 85%
e. Students in year 7 who meet and exceed the national benchmarks for reading.
n/a n/a 90%
f. Indigenous students in year 7 who meet and exceed the national benchmarks for reading.
n/a n/a 77%
g. Students in year 3 who meet and exceed the national benchmarks for writing.
n/a n/a 94%
h. Indigenous students in year 3 who meet and exceed the national benchmarks for writing.
n/a n/a 90%
i. Students in year 5 who meet and exceed the national benchmarks for writing.
n/a n/a 91%
j. Indigenous students in year 5 who meet and exceed the national benchmarks for writing.
n/a n/a 75%
k. Students in year 7 who meet and exceed the national benchmarks for writing.
n/a n/a 90%
l. Indigenous students in year 7 who meet and exceed the national benchmarks for writing.
n/a n/a 80%
2005-06 accountability indicators for reading and writing1 a. Students in year 3 who meet and exceed the national
benchmarks for reading and writing. 90% 90% n/a
b. Students in year 5 who meet and exceed the national benchmarks for reading and writing.
90% 91% n/a
c. Students in year 7 who meet and exceed the national benchmarks for reading and writing.
85% 83% n/a
d. Indigenous students in year 3 who meet and exceed the national benchmarks for reading and writing.
90% 84% n/a
e. Indigenous students in year 5 who meet and exceed the national benchmarks for reading and writing.
75% 76% n/a
f. Indigenous students in year 7 who meet and exceed the national benchmarks for reading and writing2.
75% 55% n/a
Numeracy
a. Students in year 3 who meet and exceed the national benchmarks for numeracy.
90% 93% 90%
b. Indigenous students in year 3 who meet and exceed the national benchmarks for numeracy.
90% 91% 90%
c. Students in year 5 who meet and exceed the national benchmarks for numeracy.
90% 91% 90%
d. Indigenous students in year 5 who meet and exceed the national benchmarks for numeracy.
75% 79% 75%
2006-07 Budget Paper No. 4 384 Department of Education and Training
Accountability Indicators cont.
2005-06Targets
2005-06 Est. Outcome
2006-07Targets
Output Class 1: Government School Education Cont. e. Students in year 7 who meet and exceed the national
benchmarks for numeracy. 85% 83% 85%
f. Indigenous students in year 7 who meet and exceed the national benchmarks for numeracy3.
65% 54% 65%
Special education
a. Individual Learning Plans (ILP) completed for students in special and mainstream schools who access special education services.
95% 99% 97%
Senior secondary education
a. Percentage of year 10 students who proceed to government secondary college education.
85% 87% 85%
b. Percentage of year 12 students who receive a year 12 certificate.
85% 86% 85%
c. Percentage of year 12 students who receive a Tertiary Entrance Statement.
50% 48% 50%
d. Percentage of year 12 students who receive a nationally recognised vocational qualification.
55% 61% 55%
Satisfaction
a. Overall satisfaction with government primary school education.
87% 93% 90%
b. Overall satisfaction with government high school education.
82% 83% 85%
c. Parent satisfaction with their child's special education program as measured by annual survey.
95% 94% 95%
Average cost
a. Average cost per government primary school student. $9, 473 $9,572 $10,346 b. Average cost per government high school student. $11,473 $12,765 $11,929 c. Average cost per government secondary college student. $13,097 $12, 847 $13,395 d. Average cost per government special school student in
special schools. $48,001 $48,461 $50,254
e. Average cost per government special education student in mainstream schools.
$21,943 $22,117 $22,935
Notes: 1 In 2006-07 the literacy accountability indicators for reading and writing have been split into two indicators, one for reading and one for
writing. The split will provide more accurate data on ACT results. 2 Fewer than expected indigenous students in year 7 achieved on or above the benchmark cut score for both reading and writing. The
reading benchmark was achieved by 68% of indigenous students, with an error margin of +/-12.3%. The writing benchmark was achieved by 74% of indigenous students, with an error margin of +/-15.8%. Because the number of indigenous students is very small, the movement of one student can change the percentage results significantly. The targets for indigenous students are lower than the targets for all students to provide a challenging but achievable goal for improving the results achieved by indigenous students.
3 The numeracy results for indigenous students in year 7 are below target. The small number of indigenous students at each year level means that the movement of one student above or below the benchmark cut score can result in significant percentage changes. The targets for indigenous students are lower than the targets for all students to provide a challenging but achievable goal for improving the results achieved by indigenous students.
2006-07 Budget Paper No. 4 385 Department of Education and Training
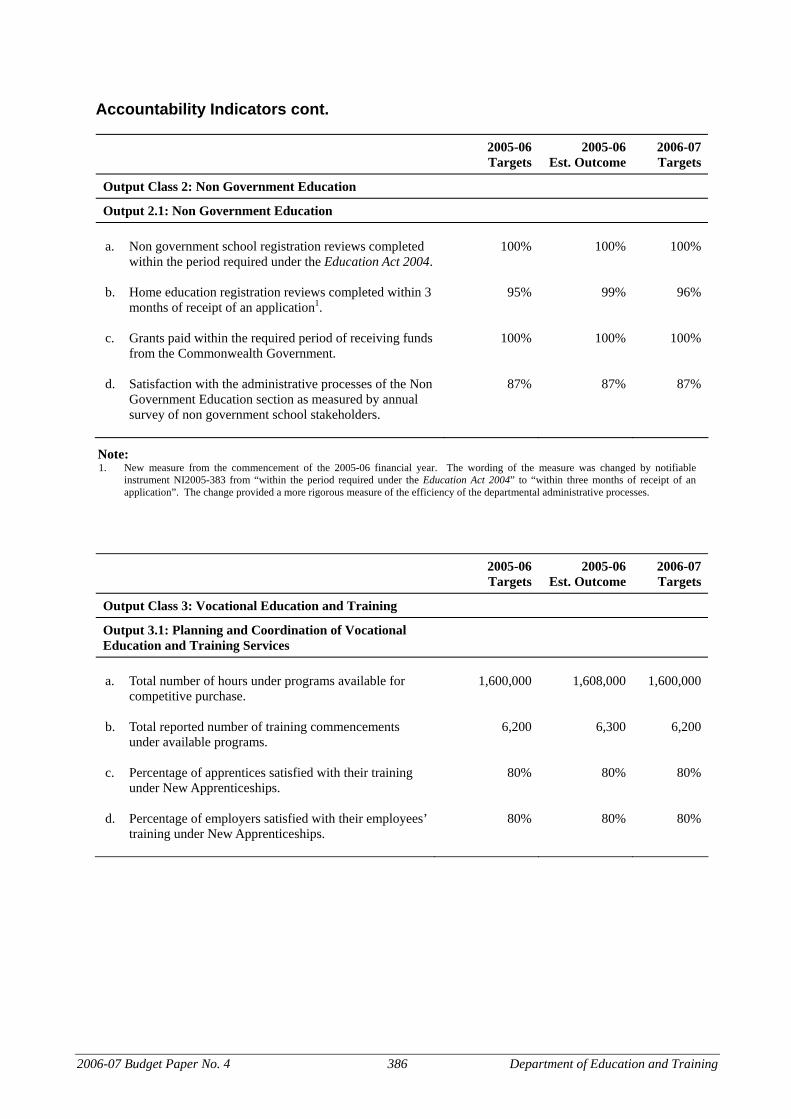
Accountability Indicators cont.
2005-06Targets
2005-06 Est. Outcome
2006-07Targets
Output Class 2: Non Government Education
Output 2.1: Non Government Education a. Non government school registration reviews completed
within the period required under the Education Act 2004. 100% 100% 100%
b. Home education registration reviews completed within 3
months of receipt of an application1. 95% 99% 96%
c. Grants paid within the required period of receiving funds
from the Commonwealth Government. 100% 100% 100%
d. Satisfaction with the administrative processes of the Non
Government Education section as measured by annual survey of non government school stakeholders.
87% 87% 87%
Note: 1. New measure from the commencement of the 2005-06 financial year. The wording of the measure was changed by notifiable
instrument NI2005-383 from “within the period required under the Education Act 2004” to “within three months of receipt of an application”. The change provided a more rigorous measure of the efficiency of the departmental administrative processes.
2005-06
Targets 2005-06
Est. Outcome 2006-07Targets
Output Class 3: Vocational Education and Training
Output 3.1: Planning and Coordination of Vocational Education and Training Services
a. Total number of hours under programs available for
competitive purchase. 1,600,000 1,608,000 1,600,000
b. Total reported number of training commencements
under available programs. 6,200 6,300 6,200
c. Percentage of apprentices satisfied with their training
under New Apprenticeships. 80% 80% 80%
d. Percentage of employers satisfied with their employees’
training under New Apprenticeships. 80% 80% 80%
2006-07 Budget Paper No. 4 386 Department of Education and Training
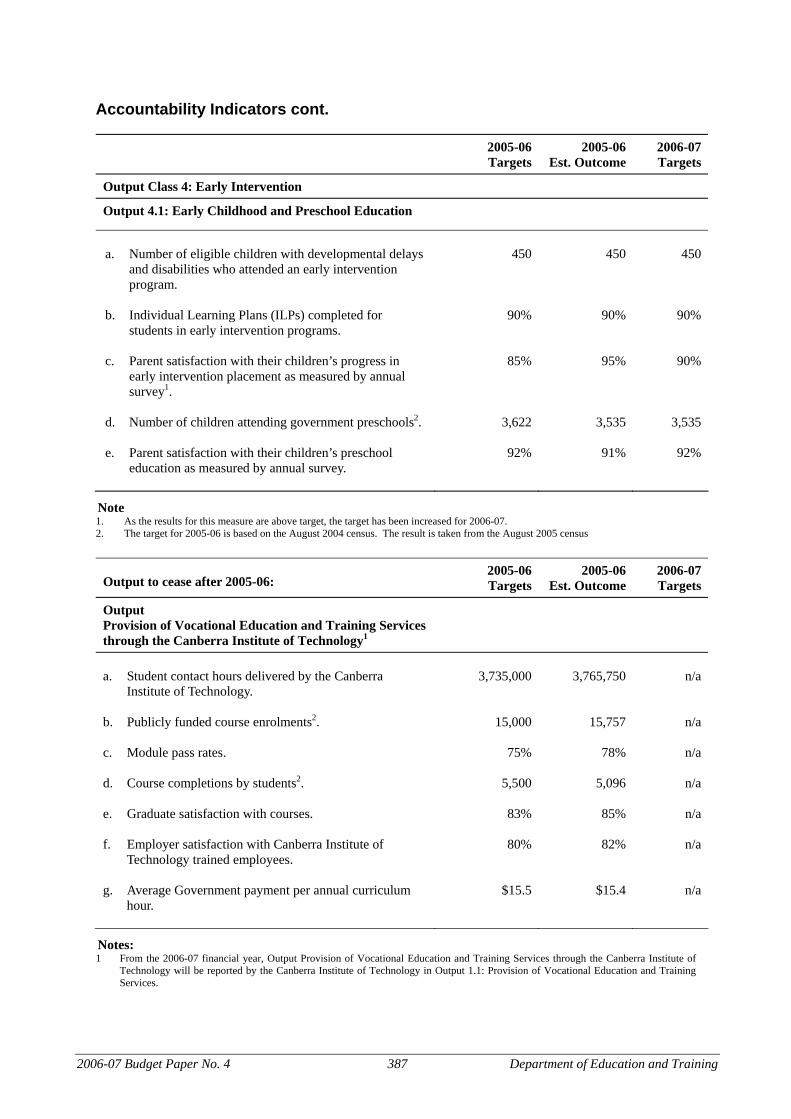
Accountability Indicators cont.
2005-06Targets
2005-06 Est. Outcome
2006-07Targets
Output Class 4: Early Intervention
Output 4.1: Early Childhood and Preschool Education
a. Number of eligible children with developmental delays
and disabilities who attended an early intervention program.
450 450 450
b. Individual Learning Plans (ILPs) completed for
students in early intervention programs. 90% 90% 90%
c. Parent satisfaction with their children’s progress in
early intervention placement as measured by annual survey1.
85% 95% 90%
d. Number of children attending government preschools2. 3,622 3,535 3,535 e. Parent satisfaction with their children’s preschool
education as measured by annual survey. 92% 91% 92%
Note 1. As the results for this measure are above target, the target has been increased for 2006-07. 2. The target for 2005-06 is based on the August 2004 census. The result is taken from the August 2005 census
Output to cease after 2005-06:
2005-06Targets
2005-06 Est. Outcome
2006-07Targets
Output Provision of Vocational Education and Training Services through the Canberra Institute of Technology1
a. Student contact hours delivered by the Canberra
Institute of Technology. 3,735,000 3,765,750 n/a
b. Publicly funded course enrolments2. 15,000 15,757 n/a c. Module pass rates. 75% 78% n/a d. Course completions by students2. 5,500 5,096 n/a e. Graduate satisfaction with courses. 83% 85% n/a f. Employer satisfaction with Canberra Institute of
Technology trained employees. 80% 82% n/a
g. Average Government payment per annual curriculum
hour. $15.5 $15.4 n/a
Notes: 1 From the 2006-07 financial year, Output Provision of Vocational Education and Training Services through the Canberra Institute of
Technology will be reported by the Canberra Institute of Technology in Output 1.1: Provision of Vocational Education and Training Services.
2006-07 Budget Paper No. 4 387 Department of Education and Training
2 The target was increased by notifiable instrument NI2006-110 for the second half of the 2005-06 financial year. The target has been increased to more accurately reflect the activity in course enrolments and course completions.
2006-07 Budget Paper No. 4 388 Department of Education and Training
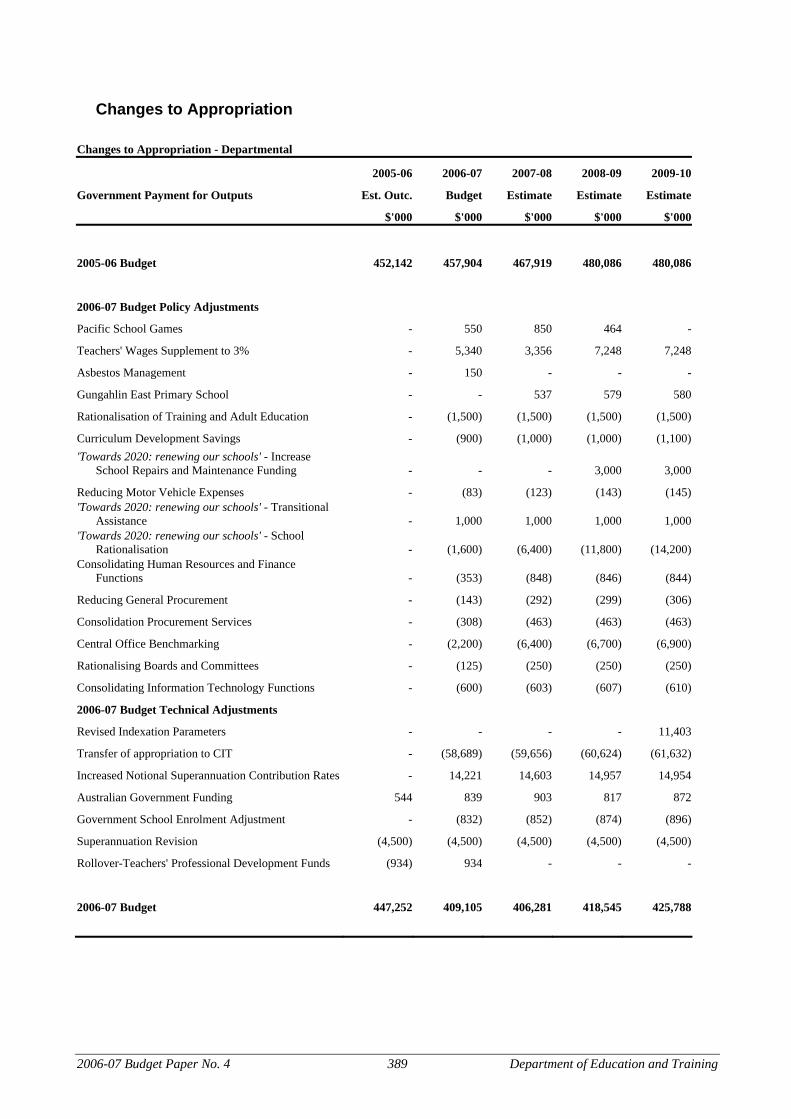
Changes to Appropriation
Changes to Appropriation - Departmental
2005-06 2006-07 2007-08 2008-09 2009-10
Government Payment for Outputs Est. Outc. Budget Estimate Estimate Estimate
$'000 $'000 $'000 $'000 $'000
2005-06 Budget 452,142 457,904 467,919 480,086 480,086
2006-07 Budget Policy Adjustments
Pacific School Games - 550 850 464 -
Teachers' Wages Supplement to 3% - 5,340 3,356 7,248 7,248
Asbestos Management - 150 - - -
Gungahlin East Primary School - - 537 579 580
Rationalisation of Training and Adult Education - (1,500) (1,500) (1,500) (1,500)
Curriculum Development Savings - (900) (1,000) (1,000) (1,100)'Towards 2020: renewing our schools' - Increase
School Repairs and Maintenance Funding - - - 3,000 3,000
Reducing Motor Vehicle Expenses - (83) (123) (143) (145)'Towards 2020: renewing our schools' - Transitional
Assistance - 1,000 1,000 1,000 1,000'Towards 2020: renewing our schools' - School
Rationalisation - (1,600) (6,400) (11,800) (14,200)Consolidating Human Resources and Finance
Functions - (353) (848) (846) (844)
Reducing General Procurement - (143) (292) (299) (306)
Consolidation Procurement Services - (308) (463) (463) (463)
Central Office Benchmarking - (2,200) (6,400) (6,700) (6,900)
Rationalising Boards and Committees - (125) (250) (250) (250)
Consolidating Information Technology Functions - (600) (603) (607) (610)
2006-07 Budget Technical Adjustments
Revised Indexation Parameters - - - - 11,403
Transfer of appropriation to CIT - (58,689) (59,656) (60,624) (61,632)
Increased Notional Superannuation Contribution Rates - 14,221 14,603 14,957 14,954
Australian Government Funding 544 839 903 817 872
Government School Enrolment Adjustment - (832) (852) (874) (896)
Superannuation Revision (4,500) (4,500) (4,500) (4,500) (4,500)
Rollover-Teachers' Professional Development Funds (934) 934 - - -
2006-07 Budget 447,252 409,105 406,281 418,545 425,788
2006-07 Budget Paper No. 4 389 Department of Education and Training
Changes to Appropriation - Territorial
2005-06 2006-07 2007-08 2008-09 2009-10
Payment for Expenses on Behalf of Territory Est. Outc. Budget Estimate Estimate Estimate
$'000 $'000 $'000 $'000 $'000
2005-06 Budget 157,687 167,757 177,862 187,506 187,506
2006-07 Budget Technical Adjustments
Revised Indexation Parameters - - - 952 5,547
Australian Government Funding (10,445) (1,965) (2,137) (4,906) (5,638)
Non Government Schooling Enrolment Adjustment 107 236 242 248 255
2006-07 Budget 147,349 166,028 175,967 183,800 187,670
Changes to Appropriation - Departmental
2005-06 2006-07 2007-08 2008-09 2009-10
Capital Injections Est. Outc. Budget Estimate Estimate Estimate
$'000 $'000 $'000 $'000 $'000
2005-06 Budget 21,929 13,350 13,401 13,454 13,454
2006-07 Budget Policy Adjustments
West Belconnen Regional School - 4,020 23,000 16,200 -
Gungahlin College - Feasibility Study - 1,000 - - -
Gungahlin East Primary School - 8,500 12,550 - -'Towards 2020: renewing our schools' - Schools
Infrastructure Refurbishment - 15,000 25,000 25,000 25,000'Towards 2020: renewing our schools' - Smart
Schools, Smart Students - 5,000 5,000 5,000 5,000
2006-07 Budget Technical Adjustments
Removal of Non Continuing Budget Initiative - - - - (2,154)
Australian Government Funding 3,098 7,834 2,043 1,500 1,500
Rollover - Capital Works Program (5,180) 5,180 - - -
2006-07 Budget 19,847 59,884 80,994 61,154 42,800
2006-07 Budget Paper No. 4 390 Department of Education and Training
Changes to Appropriation - Territorial
2005-06 2006-07 2007-08 2008-09 2008-09
Capital Injections Est. Outc. Budget Estimate Estimate Estimate
$'000 $'000 $'000 $'000 $'000
2005-06 Budget 5,170 5,170 5,170 5,170 5,170
2006-07 Budget Technical Adjustments
Transfer Capital Injection to CIT - (5,170) (5,170) (5,170) (5,170)
2006-07 Budget 5,170 - - - -
2006-07 Budget Paper No. 4 391 Department of Education and Training

2006-07 Capital Works Program
Departmental
Estimated Estimated 2006-07 2007-08 2008-09 Expected Total Expenditure Financing Financing Financing Completion Cost Pre 2006-07 Date $’000 $’000 $’000 $’000 $’000 New Capital Works West Belconnen High School 45,000 840 4,960 23,000 16,200 Jan 2009Gungahlin East Preschool/ Primary
School 21,050 - 8,500 12,550 - Jan 2008
Gungahlin College – Feasibility Study 1,000 - 1,000 - - Mar 2007Schools Infrastructure Refurbishment1 90,000 - 15,000 25,000 25,000 Jun 2010 Total New Works 157,050 840 29,460 60,550 41,200 Capital Upgrades Older School Refurbishments 2,500 - 2,500 Older Preschool Refurbishments 1,500 - 1,500 Student Amenity and Infrastructure 1,040 - 1,040 Specialist Teaching Area Improvements 2,000 - 2,000 Building Services Improvements 1,830 - 1,830 Health and Safety Improvements 760 - 760 Support for Disabled Persons 1,270 - 1,270 Transportable Classrooms 400 - 400 Total Capital Upgrades 11,300 - 11,300 Total New Capital Works 168,350 840 40,760 60,550 41,200
Works in Progress Amaroo School 540 - 540 - - Jun 2007Melrose High School – Gymnasium 2,800 500 2,300 - - Mar 2007Gungahlin East Primary School –
Forward Design 1,900 500 1,400 - -
Dec 2006 Total Works in Progress 5,240 1,000 4,240 - - Total Departmental Capital Works 173,590 1,840 45,000 60,550 41,200
Note: 1. $25 million forecast for the 2009-10 financial year.
2006-07 Budget Paper No. 4 392 Department of Education and Training
Commonwealth Grants
The major Commonwealth payments for which the Portfolio has responsibility are: Name of Grant Activities Funded by Grant 2006-07
Estimate $’000s
Government Schools
General – Per Capita Grants Delivery of Government School education, mainly to assist schools with recurrent costs.
29,428
Joint Schools Literacy and numeracy, English as a second language and other curriculum initiatives projects in schools.
4,405
Investing in Our Schools Program
Australian Government sponsored projects in Government Schools for capital infrastructure.
3,476
Capital Capital works projects. 6,053
Aboriginal Education Delivery of Aboriginal Education services in schools. 391
Non Government Schools
Per Capita Grants Delivery of Non Government School education, mainly to assist schools with recurrent costs.
106,532
Investing in Our Schools Program
Australian Government sponsored projects in Non Government Schools for capital infrastructure.
1,777
Capital Grants Grant to assist and provide maintenance to school facilities.
4,459
Other Schools Payments – Non Government
Literacy, Numeracy and Special Learning Needs and English as a second language.
3,188
Vocational Education and Training
Skilling Australia’s Workforce New Apprenticeship Program, Group Training Organisations Innovation and Equity Training for Industry Program, Adult and Community Education.
19,122
Capital Infrastructure Capital grant for Canberra Institute of Technology infrastructure.
2,720
Contracts Vocational Education and Training in schools and School based New Apprenticeship Pathways.
659
Other
Services Provision to Jervis Bay and French Australia School
Delivery of education services. 2,204
Total 184,414
2006-07 Budget Paper No. 4 393 Department of Education and Training
Department of Education and Training
Operating Statement
2005-06 2005-06 2006-07 2007-08 2008-09 2009-10 Budget Est.Outcome Budget Var Estimate Estimate Estimate
$'000 $'000 $'000 % $'000 $'000 $'000
Income
Revenue
452,142 Government Payment for Outputs
447,252 409,105 -9 406,281 418,545 425,788
7,952 User Charges - Non ACT Government
12,028 11,445 -5 11,397 11,380 11,683
328 User Charges - ACT Government
928 520 -44 120 120 120
2,826 Grants from the Commonwealth
0 0 - 0 0 0
1,250 Interest 1,700 1,058 -38 1,058 1,058 1,05817,202 Other Revenue 18,298 17,702 -3 17,702 17,702 17,702
499 Resources Received free of charge
449 449 - 449 449 449
482,199 Total Revenue 480,655 440,279 -8 437,007 449,254 456,800
Gains
0 Total Gains 0 0 - 0 0 0
482,199 Total Income 480,655 440,279 -8 437,007 449,254 456,800
Expenses
277,520 Employee Expenses 279,504 274,091 -2 270,995 277,979 282,19146,655 Superannuation Expenses 42,155 56,072 33 55,430 56,684 56,41633,254 Supplies and Services 34,575 39,418 14 39,744 43,505 44,68526,295 Depreciation and Amortisation 26,126 28,943 11 30,169 31,378 31,864
322 Borrowing Costs 322 699 117 573 358 13075,741 Grants and Purchased Services 76,111 19,298 -75 18,735 19,551 20,06348,595 Other Expenses 60,624 57,139 -6 89,340 65,426 49,828
508,382 Total Ordinary Expenses 519,417 475,660 -8 504,986 494,881 485,177
-26,183 Operating Result -38,762 -35,381 9 -67,979 -45,627 -28,377
2006-07 Budget Paper No. 4 394 Department of Education and Training
Department of Education and Training
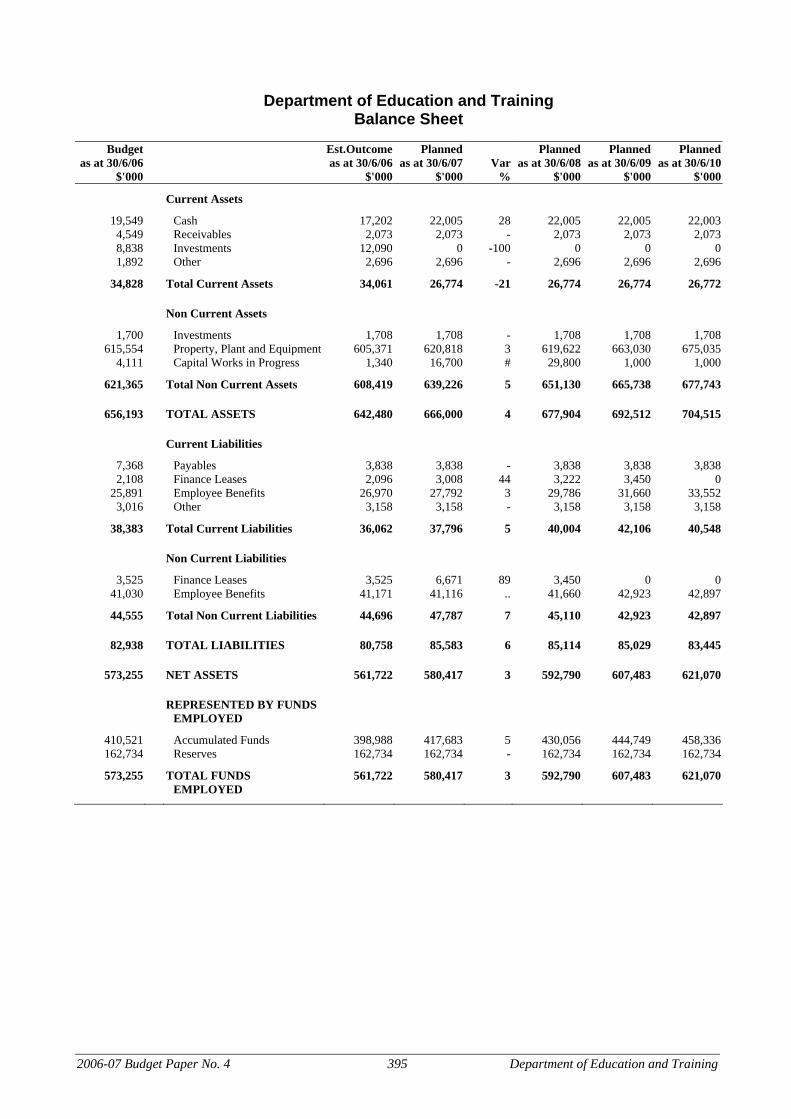
Balance Sheet
Budget Est.Outcome Planned Planned Planned Plannedas at 30/6/06 as at 30/6/06 as at 30/6/07 Var as at 30/6/08 as at 30/6/09 as at 30/6/10
$'000 $'000 $'000 % $'000 $'000 $'000
Current Assets
19,549 Cash 17,202 22,005 28 22,005 22,005 22,0034,549 Receivables 2,073 2,073 - 2,073 2,073 2,0738,838 Investments 12,090 0 -100 0 0 01,892 Other 2,696 2,696 - 2,696 2,696 2,696
34,828 Total Current Assets 34,061 26,774 -21 26,774 26,774 26,772
Non Current Assets
1,700 Investments 1,708 1,708 - 1,708 1,708 1,708615,554 Property, Plant and Equipment 605,371 620,818 3 619,622 663,030 675,035
4,111 Capital Works in Progress 1,340 16,700 # 29,800 1,000 1,000
621,365 Total Non Current Assets 608,419 639,226 5 651,130 665,738 677,743
656,193 TOTAL ASSETS 642,480 666,000 4 677,904 692,512 704,515
Current Liabilities
7,368 Payables 3,838 3,838 - 3,838 3,838 3,8382,108 Finance Leases 2,096 3,008 44 3,222 3,450 0
25,891 Employee Benefits 26,970 27,792 3 29,786 31,660 33,5523,016 Other 3,158 3,158 - 3,158 3,158 3,158
38,383 Total Current Liabilities 36,062 37,796 5 40,004 42,106 40,548
Non Current Liabilities
3,525 Finance Leases 3,525 6,671 89 3,450 0 041,030 Employee Benefits 41,171 41,116 .. 41,660 42,923 42,897
44,555 Total Non Current Liabilities 44,696 47,787 7 45,110 42,923 42,897
82,938 TOTAL LIABILITIES 80,758 85,583 6 85,114 85,029 83,445
573,255 NET ASSETS 561,722 580,417 3 592,790 607,483 621,070
REPRESENTED BY FUNDS EMPLOYED
410,521 Accumulated Funds 398,988 417,683 5 430,056 444,749 458,336162,734 Reserves 162,734 162,734 - 162,734 162,734 162,734
573,255 TOTAL FUNDS EMPLOYED
561,722 580,417 3 592,790 607,483 621,070
2006-07 Budget Paper No. 4 395 Department of Education and Training
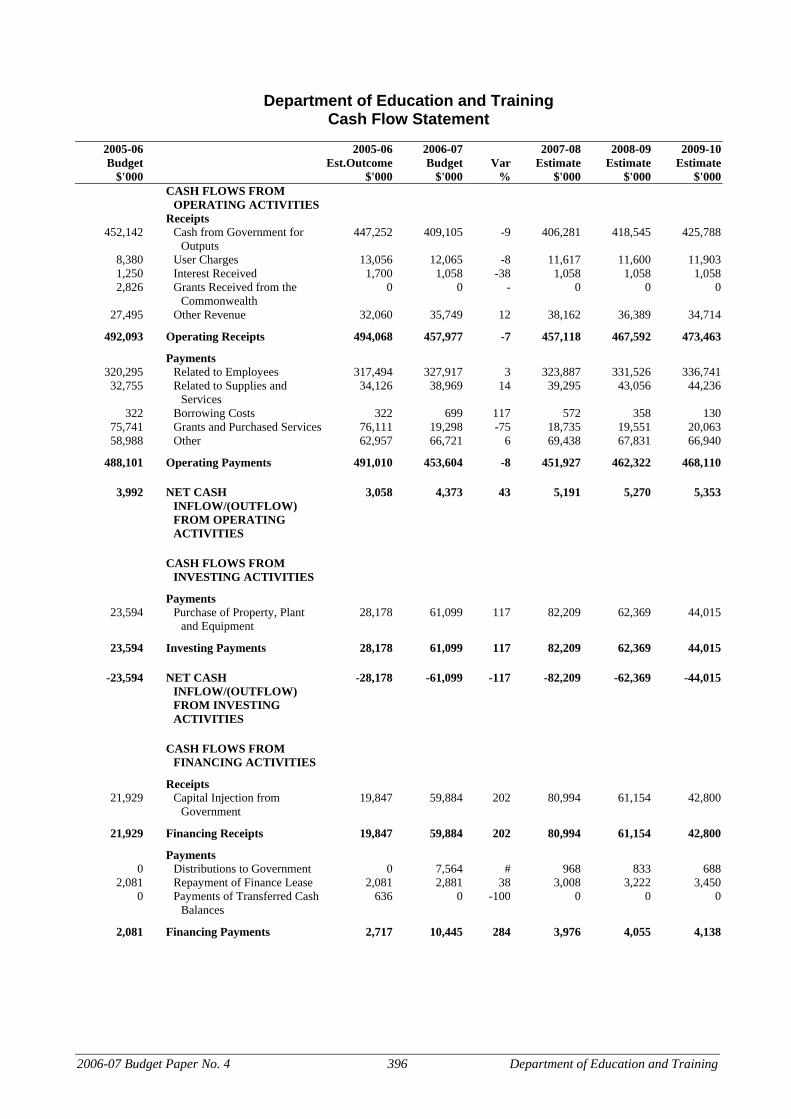
Department of Education and Training
Cash Flow Statement
2005-06 2005-06 2006-07 2007-08 2008-09 2009-10 Budget Est.Outcome Budget Var Estimate Estimate Estimate
$'000 $'000 $'000 % $'000 $'000 $'000 CASH FLOWS FROM
OPERATING ACTIVITIES
Receipts 452,142 Cash from Government for
Outputs 447,252 409,105 -9 406,281 418,545 425,788
8,380 User Charges 13,056 12,065 -8 11,617 11,600 11,9031,250 Interest Received 1,700 1,058 -38 1,058 1,058 1,0582,826 Grants Received from the
Commonwealth 0 0 - 0 0 0
27,495 Other Revenue 32,060 35,749 12 38,162 36,389 34,714
492,093 Operating Receipts 494,068 457,977 -7 457,118 467,592 473,463
Payments 320,295 Related to Employees 317,494 327,917 3 323,887 331,526 336,741
32,755 Related to Supplies and Services
34,126 38,969 14 39,295 43,056 44,236
322 Borrowing Costs 322 699 117 572 358 13075,741 Grants and Purchased Services 76,111 19,298 -75 18,735 19,551 20,06358,988 Other 62,957 66,721 6 69,438 67,831 66,940
488,101 Operating Payments 491,010 453,604 -8 451,927 462,322 468,110
3,992 NET CASH INFLOW/(OUTFLOW) FROM OPERATING ACTIVITIES
3,058 4,373 43 5,191 5,270 5,353
CASH FLOWS FROM INVESTING ACTIVITIES
Payments 23,594 Purchase of Property, Plant
and Equipment 28,178 61,099 117 82,209 62,369 44,015
23,594 Investing Payments 28,178 61,099 117 82,209 62,369 44,015
-23,594 NET CASH INFLOW/(OUTFLOW) FROM INVESTING ACTIVITIES
-28,178 -61,099 -117 -82,209 -62,369 -44,015
CASH FLOWS FROM FINANCING ACTIVITIES
Receipts 21,929 Capital Injection from
Government 19,847 59,884 202 80,994 61,154 42,800
21,929 Financing Receipts 19,847 59,884 202 80,994 61,154 42,800
Payments 0 Distributions to Government 0 7,564 # 968 833 688
2,081 Repayment of Finance Lease 2,081 2,881 38 3,008 3,222 3,4500 Payments of Transferred Cash
Balances 636 0 -100 0 0 0
2,081 Financing Payments 2,717 10,445 284 3,976 4,055 4,138
2006-07 Budget Paper No. 4 396 Department of Education and Training

Department of Education and Training Cash Flow Statement
2005-06 2005-06 2006-07 2007-08 2008-09 2009-10 Budget Est.Outcome Budget Var Estimate Estimate Estimate
$'000 $'000 $'000 % $'000 $'000 $'000
19,848 NET CASH INFLOW/(OUTFLOW) FROM FINANCING ACTIVITIES
17,130 49,439 189 77,018 57,099 38,662
246 NET INCREASE/(DECREASE) IN CASH HELD
-7,990 -7,287 9 0 0 0
29,841 CASH AT BEGINNING OF REPORTING PERIOD
38,988 30,998 -20 23,711 23,711 23,711
30,087 CASH AT THE END OF THE REPORTING PERIOD
30,998 23,711 -24 23,711 23,711 23,711
2006-07 Budget Paper No. 4 397 Department of Education and Training
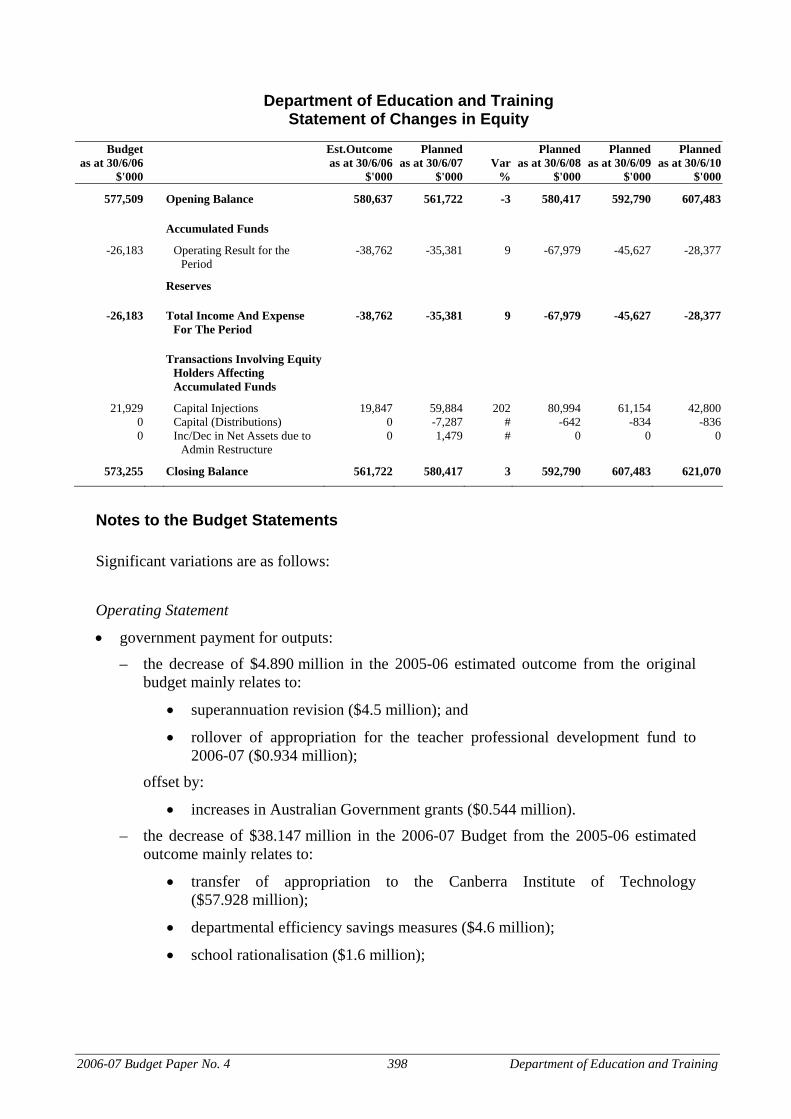
Department of Education and Training
Statement of Changes in Equity
Budget Est.Outcome Planned Planned Planned Plannedas at 30/6/06 as at 30/6/06 as at 30/6/07 Var as at 30/6/08 as at 30/6/09 as at 30/6/10
$'000 $'000 $'000 % $'000 $'000 $'000
577,509 Opening Balance 580,637 561,722 -3 580,417 592,790 607,483
Accumulated Funds
-26,183 Operating Result for the Period
-38,762 -35,381 9 -67,979 -45,627 -28,377
Reserves
-26,183 Total Income And Expense For The Period
-38,762 -35,381 9 -67,979 -45,627 -28,377
Transactions Involving Equity Holders Affecting Accumulated Funds
21,929 Capital Injections 19,847 59,884 202 80,994 61,154 42,8000 Capital (Distributions) 0 -7,287 # -642 -834 -8360 Inc/Dec in Net Assets due to
Admin Restructure 0 1,479 # 0 0 0
573,255 Closing Balance 561,722 580,417 3 592,790 607,483 621,070
Notes to the Budget Statements
Significant variations are as follows:
Operating Statement
• government payment for outputs:
– the decrease of $4.890 million in the 2005-06 estimated outcome from the original budget mainly relates to:
• superannuation revision ($4.5 million); and
• rollover of appropriation for the teacher professional development fund to 2006-07 ($0.934 million);
offset by:
• increases in Australian Government grants ($0.544 million).
– the decrease of $38.147 million in the 2006-07 Budget from the 2005-06 estimated outcome mainly relates to:
• transfer of appropriation to the Canberra Institute of Technology ($57.928 million);
• departmental efficiency savings measures ($4.6 million);
• school rationalisation ($1.6 million);
2006-07 Budget Paper No. 4 398 Department of Education and Training
• the impact of the adjustment to student enrolments in government schools ($0.957 million);
• the impact of consolidating the following into the Shared Services Centre; human resources and finance functions ($0.353 million); information technology functions ($0.6 million); and procurement services ($0.308 million);
• reducing general procurement and motor vehicle expenses ($0.226 million); and
• rationalising boards and committees ($0.125 million);
offset by:
• supplementation for notional superannuation rate increases ($14.973 million);
• indexation ($7.924 million);
• supplementation for wage increases ($1.019 million);
• transitional assistance ($1 million);
• teacher professional development funds rolled over from 2005-06 ($0.934 million);
• Australian Government grants ($0.801 million);
• previous years’ initiatives ($0.777 million); and
• new initiatives for 2006-07, comprising the Pacific Schools Games ($0.550 million) and Asbestos Management ($0.150 million).
• user charges – non ACT Government: the increase of $4.076 million in the 2005-06 estimated outcome from the original budget is primarily due to reclassification of national agreement revenue from ‘grants from Commonwealth’ ($2.826 million) and an increase in revenue relating to international private students and the Active Leisure Centre ($1.250 million). The decrease of $0.583 million in the 2006-07 Budget from the 2005-06 estimated outcome mainly relates to a decrease in funding received for the Jervis Bay pre and primary schools;
• user charges – ACT Government: the increase of $0.6 million in the 2005-06 estimated outcome from the original budget is primarily due to an increase in revenue relating to the provision of payroll services to other government agencies. The decrease of $0.408 million in the 2006-07 Budget from the 2005-06 estimated outcome reflects the impact of consolidating human resource functions into the Shared Services Centre;
• interest: the increase of $0.450 million in the 2005-06 estimated outcome from the original budget is primarily due to efficient cash management practices. The decrease of $0.642 million in the 2006-07 Budget from the 2005-06 estimated outcome relates to the implementation of cash management reforms;
• grants from commonwealth: the decrease of $2.826 million in the 2005-06 estimated outcome from the original budget relates to reclassification of national agreement payments as ‘user charges’;
• other revenue: the increase of $1.096 million in the 2005-06 estimated outcome from the original budget mainly relates to schools transitory revenue ($0.5 million) and one-off funding from the restructure fund ($0.596 million). The decrease of $0.596 million in the
2006-07 Budget Paper No. 4 399 Department of Education and Training
2006-07 Budget from the 2005-06 estimated outcome relates to the one-off funding mentioned above.
• employee expenses:
– the increase of $1.984 million in the 2005-06 estimated outcome from the original budget is primarily due to increases relating to services funded from user charges and interest ($0.751 million), costs associated with redundancies ($0.596 million) and the flow on impact in employee provisions for the new teachers’ enterprise bargaining agreement ($0.285 million);
– the decrease of $5.413 million in the 2006-07 Budget from the 2005-06 estimated outcome mainly relates to:
• the impact of consolidating in the Shared Services Centre information technology functions ($3.221 million) and human resources and the finance functions ($1.885 million);
• departmental efficiency savings measures ($3.187 million);
• school rationalisation ($1.061 million);
• the impact of the adjustment to student enrolments in government schools ($1.333 million);
• costs associated with voluntary redundancies ($0.596 million); and
• the impact of cash management reforms ($0.318 million);
offset by:
• wage increases of $4.651 million resulting, in part, from the enterprise bargaining agreements for teaching and for non teaching staff;
• previous years’ initiatives ($0.726 million);
• transitional assistance ($0.375 million); and
• a new initiative for the Pacific Schools games ($0.355 million).
• superannuation expenses:
– the decrease of $4.5 million in the 2005-06 estimated outcome from the original budget primarily relates to superannuation savings;
– the increase of $13.917 million in the 2006-07 Budget from the 2005-06 estimated outcome mainly relates to:
• increased notional superannuation contribution rates ($14.973 million);
• wage and salary increases for teaching and non teaching staff ($0.605 million);
• new initiatives ($0.120 million); and
• previous years’ initiatives ($0.106 million);
offset by:
• departmental efficiency savings measures ($0.790 million);
• the impact of consolidating into the Shared Services Centre information technology functions ($0.444 million) and human resources and finance functions ($0.269 million);
2006-07 Budget Paper No. 4 400 Department of Education and Training
• school rationalisation ($0.252 million); and
• the impact of the adjustment to student enrolments in government schools ($0.166 million).
• supplies and services:
– the increase of $1.321 million in the 2005-06 estimated outcome from the original budget is mainly due to additional expenditure associated with international private students ($0.6 million), the Active Leisure Centre ($0.3 million) and the hire of facilities ($0.3 million);
– the increase of $4.843 million in the 2006-07 Budget from the 2005-06 estimated outcome relates to:
• teacher professional development funds ($0.934 million);
• the impact of consolidating human resources, finance and information technology functions into the Shared Services Centre ($4.212 million);
• indexation ($0.923 million);
• transitional assistance ($0.535 million); and
• new initiatives for the Pacific School Games ($0.165 million) and Asbestos Management ($0.150 million);
offset by:
• departmental productivity savings measures ($0.623 million);
• revised interest policies under the new cash management reforms ($0.324 million);
• the impact of consolidating the procurement services into the Shared Services Centre ($0.308 million);
• reducing general procurement and motor vehicle expenses ($0.226 million); and
• rationalisation of boards and committees ($0.125 million).
• depreciation and amortisation: the increase of $2.817 million in the 2006-07 Budget from the 2005-06 estimated outcome relates to:
– depreciation associated with leased plant and equipment for the teachers’ laptop program ($1.252 million);
– the Smart Schools, Smart Students Program ($1.3 million); and
– capital additions from the current and previous years’ capital works programs and investing in our schools program ($0.945 million);
offset by:
– the write down of schools ($0.633 million).
• borrowing costs: the increase of $0.377 million in the 2006-07 Budget from the 2005-06 estimated outcome is primarily due to entering into a new finance lease agreement for teachers’ computers;
2006-07 Budget Paper No. 4 401 Department of Education and Training

• grants and purchased services:
– the increase of $0.370 million in the 2005-06 estimated outcome from the original budget is primarily due to increased grants from the Australian Government; and
– the decrease of $56.813 million in the 2006-07 Budget from the 2005-06 estimated outcome is primarily related to the transfer of appropriation to the Canberra Institute of Technology ($57.928 million);
offset by:
– increased Australian Government grants ($0.684 million); and
– indexation ($0.418 million).
• other expenses:
– the increase of $12.029 million in the 2005-06 estimated outcome from the original budget is primarily due to the write-off of Ginninderra District High School ($11.120 million), schools transitory revenue ($0.5 million) and the transfer of Erindale Skate Park and Uriarra Primary school to the Department of Territory and Municipal Services (DTMS) ($0.409 million).
– the decrease of $3.845 million in the 2006-07 Budget from the 2005-06 estimated outcome primarily relates to:
• write down of schools ($2.555 million);
• reclassification of expenses to reflect repayment of finance lease ($1.3 million);
• the transfer of Erindale Skate Park and Uriarra Primary school to DTMS ($0.409 million); and
• rationalisation of accommodation ($0.287 million);
offset by:
• indexation ($1.040 million).
– the estimates include the write down of schools associated with Towards 2020 of $8.565 million in 2006-07, $40.462 million in 2007-08 and $16.382 million in 2008-09;
Balance Sheet
• current assets: the decrease of $7.287 million in the 2006-07 Budget from the 2005-06 estimated outcome mainly relates to the distribution of cash to the government as a result of the new cash management reforms;
• non current assets:
– the decrease of $12.946 million in the 2005-06 estimated outcome from the original budget is mainly due to the write-off of Ginninderra District High School; and
– the increase of $30.807 million in the 2006-07 Budget from the 2005-06 estimated outcome is primarily related to the capital works program and the purchase of plant and equipment ($67.890 million), offset by depreciation ($28.943 million) and the write down of schools ($8.565 million);
2006-07 Budget Paper No. 4 402 Department of Education and Training
• total liabilities:
– the decrease of $2.180 million in the 2005-06 estimated outcome from the original budget mainly relates to decreased payables ($3.530 million) offset by an increase in employee entitlements ($1.220 million);
– the increase of $4.825 million in the 2006-07 Budget from the 2005-06 estimated outcome relates to:
• increased finance lease costs ($4.058 million); and
• the impact of net increased employee entitlements associated with the new enterprise bargaining agreements ($2.032 million);
offset by:
• the transfer of employee provisions associated with the consolidation of human resources, finance and information technology functions ($1.479 million).
Statement of Changes in Equity
• capital injection:
– the decrease of $2.082 million in the 2005-06 estimated outcome from the original budget is due to the deferral of 2005-06 capital works ($5.180 million) offset by capital injection associated with the Investing in Our Schools programs ($3.098 million); and
– the increase of $40.037 million in the 2006-07 Budget from the 2005-06 estimated outcome is due to an increase in new capital works ($26.3 million) and works in progress ($5.180 million), increased capital injection for school information communication technology projects ($3.771 million) and funding associated with the Investing in Our Schools program ($4.736 million).
2006-07 Budget Paper No. 4 403 Department of Education and Training
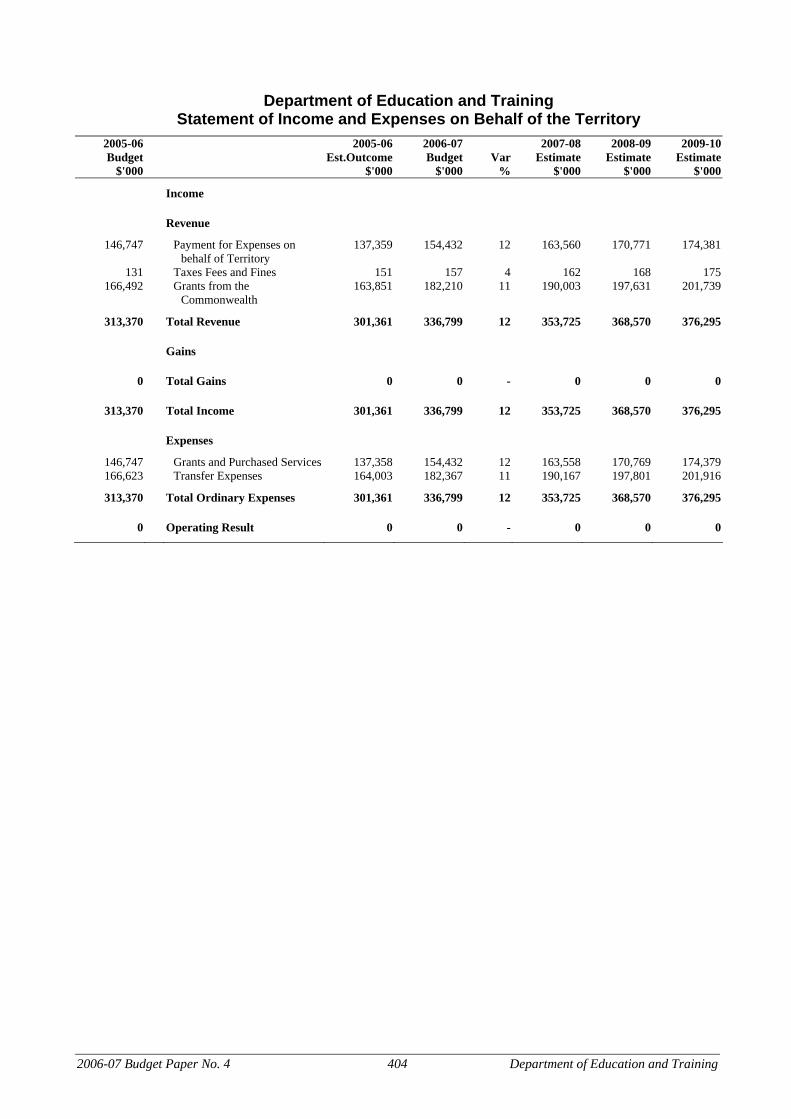
Department of Education and Training
Statement of Income and Expenses on Behalf of the Territory
2005-06 2005-06 2006-07 2007-08 2008-09 2009-10 Budget Est.Outcome Budget Var Estimate Estimate Estimate
$'000 $'000 $'000 % $'000 $'000 $'000
Income
Revenue
146,747 Payment for Expenses on behalf of Territory
137,359 154,432 12 163,560 170,771 174,381
131 Taxes Fees and Fines 151 157 4 162 168 175166,492 Grants from the
Commonwealth 163,851 182,210 11 190,003 197,631 201,739
313,370 Total Revenue 301,361 336,799 12 353,725 368,570 376,295
Gains
0 Total Gains 0 0 - 0 0 0
313,370 Total Income 301,361 336,799 12 353,725 368,570 376,295
Expenses
146,747 Grants and Purchased Services 137,358 154,432 12 163,558 170,769 174,379166,623 Transfer Expenses 164,003 182,367 11 190,167 197,801 201,916
313,370 Total Ordinary Expenses 301,361 336,799 12 353,725 368,570 376,295
0 Operating Result 0 0 - 0 0 0
2006-07 Budget Paper No. 4 404 Department of Education and Training
Department of Education and Training
Statement of Assets and Liabilities on Behalf of the Territory
Budget Est.Outcome Planned Planned Planned Plannedas at 30/6/06 as at 30/6/06 as at 30/6/07 Var as at 30/6/08 as at 30/6/09 as at 30/6/10
$'000 $'000 $'000 % $'000 $'000 $'000
Current Assets
438 Cash 154 154 - 154 154 15498 Receivables 129 76 -41 76 76 76
536 Total Current Assets 283 230 -19 230 230 230
536 TOTAL ASSETS 283 230 -19 230 230 230
Current Liabilities
483 Payables 230 230 - 230 230 23053 Interest Bearing Liabilities 53 0 -100 0 0 0
536 Total Current Liabilities 283 230 -19 230 230 230
536 TOTAL LIABILITIES 283 230 -19 230 230 230
0 NET ASSETS 0 0 - 0 0 0
REPRESENTED BY FUNDS EMPLOYED
0 Accumulated Funds 0 0 - 0 0 0
0 TOTAL FUNDS EMPLOYED
0 0 - 0 0 0
2006-07 Budget Paper No. 4 405 Department of Education and Training
Department of Education and Training
Budgeted Statement of Cashflows on Behalf of the Territory
2005-06 2005-06 2006-07 2007-08 2008-09 2009-10 Budget Est.Outcome Budget Var Estimate Estimate Estimate
$'000 $'000 $'000 % $'000 $'000 $'000 CASH FLOWS FROM
OPERATING ACTIVITIES
Receipts 157,687 Cash from Government for
EBT 147,349 166,028 13 175,967 183,800 187,670
131 Taxes, Fees and Fines 151 157 4 162 168 175177,432 Grants Received from the
Commonwealth 173,843 193,806 11 202,414 210,664 215,031
3,779 Other Revenue 3,790 3,889 3 3,982 4,081 4,183
339,029 Operating Receipts 325,133 363,880 12 382,525 398,713 407,059
Payments 157,687 Grants and Purchased Services 147,349 166,028 13 175,967 183,800 187,670
3,779 Other 3,790 3,889 3 3,982 4,081 4,183177,563 Territory Receipts to
Government 173,994 193,963 11 202,576 210,832 215,206
339,029 Operating Payments 325,133 363,880 12 382,525 398,713 407,059
0 NET CASH INFLOW/(OUTFLOW) FROM OPERATING ACTIVITIES
0 0 - 0 0 0
CASH FLOWS FROM INVESTING ACTIVITIES
Payments 5,170 Capital Payments to
Government Agencies 5,170 0 -100 0 0 0
5,170 Investing Payments 5,170 0 -100 0 0 0
-5,170 NET CASH INFLOW/(OUTFLOW) FROM INVESTING ACTIVITIES
-5,170 0 100 0 0 0
CASH FLOWS FROM FINANCING ACTIVITIES
Receipts 5,170 Capital Injection from
Government 5,170 0 -100 0 0 0
107 Borrowings Received 107 53 -50 0 0 0
5,277 Financing Receipts 5,277 53 -99 0 0 0
Payments 107 Repayment of Borrowings 107 53 -50 0 0 0
107 Financing Payments 107 53 -50 0 0 0
5,170 NET CASH INFLOW/(OUTFLOW) FROM FINANCING ACTIVITIES
5,170 0 -100 0 0 0
0 NET INCREASE/(DECREASE) IN CASH HELD
0 0 - 0 0 0
438 CASH AT BEGINNING OF REPORTING PERIOD
154 154 - 154 154 154
438 CASH AT THE END OF THE REPORTING PERIOD
154 154 - 154 154 154
2006-07 Budget Paper No. 4 406 Department of Education and Training
Notes to the Budget Statements
Significant variations are as follows:
Statement of Income and Expenses on Behalf of the Territory
• payments for expenses on behalf of the Territory:
– the decrease of $9.388 million in the 2005-06 estimated outcome from the original budget relates to the revision of the overestimated Australian Government grants for non government schools ($11.966 million) offset by new funding for the Investing in Our Schools program ($2.471 million) and increased ACT Government funding for non government schools ($0.107 million); and
– the increase of $17.073 million in the 2006-07 Budget from the 2005-06 estimated outcome is due to:
• additional non government schools funding from the Australian Government ($16.053 million); and
• additional non government schools funding from the ACT Government ($1.020 million).
• grants from the Commonwealth:
– the decrease of $2.641 million in the 2005-06 estimated outcome from the original budget is mainly due to the revision of Australian Government funding to non government schools ($11.966 million), and a decrease in government schooling grants ($0.970 million), offset by new funding for the Investing in Our Schools program ($9.927 million), of which $7.456 million relates to government schooling and $0.370 million relates to additional Australian Government grants; and
– the increase of $18.359 million in the 2006-07 Budget from the 2005-06 estimated outcome is primarily due to:
• additional non government schooling grants ($16.053 million);
• additional vocational education and training grants ($0.725 million); and
• additional government schooling grants ($1.581 million).
• grants and purchased services:
– the increase of $9.388 million in the 2005-06 estimated outcome from the original budget is due to the allocation of Australian Government grants as mentioned above; and
– the increase of $17.073 million in the 2006-07 Budget from the 2005-06 estimated outcome is due to increased funding for non government schools from the Australian Government ($16.053 million) and the ACT Government ($1.020 million).
Statement of Assets and Liabilities on Behalf of the Territory
• total assets and total liabilities: the decrease of $0.053 million in the 2006-07 Budget from the 2005-06 estimated outcome is due to a reduction in receivables and liabilities
2006-07 Budget Paper No. 4 407 Department of Education and Training
reflecting loan repayments by the Catholic Education Office associated with the Joint Facility at Gold Creek School.
Budgeted Statement of Cashflows on Behalf of the Territory
• capital injection from government and capital payments to agencies: the decrease of $5.170 million in the 2006-07 Budget from the 2005-06 estimated outcome relates to the transfer of capital injection appropriation to the Canberra of Institute of Technology.
2006-07 Budget Paper No. 4 408 Department of Education and Training
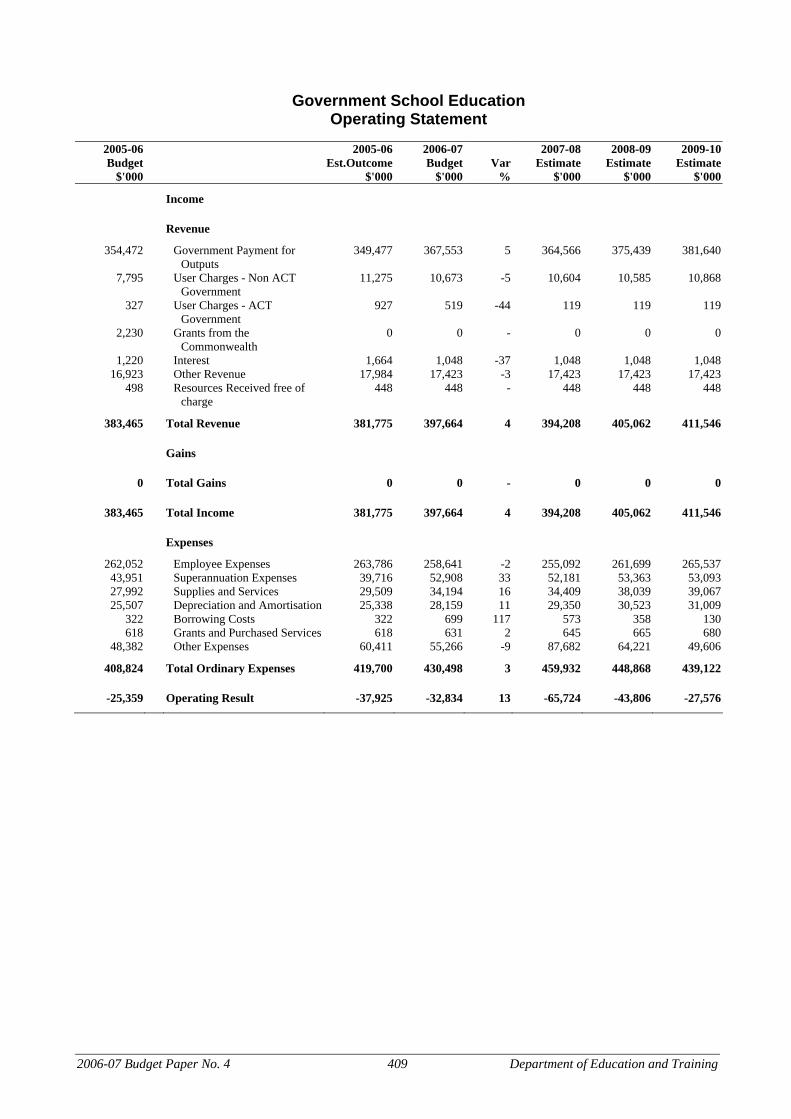
Government School Education
Operating Statement
2005-06 2005-06 2006-07 2007-08 2008-09 2009-10 Budget Est.Outcome Budget Var Estimate Estimate Estimate
$'000 $'000 $'000 % $'000 $'000 $'000
Income
Revenue
354,472 Government Payment for Outputs
349,477 367,553 5 364,566 375,439 381,640
7,795 User Charges - Non ACT Government
11,275 10,673 -5 10,604 10,585 10,868
327 User Charges - ACT Government
927 519 -44 119 119 119
2,230 Grants from the Commonwealth
0 0 - 0 0 0
1,220 Interest 1,664 1,048 -37 1,048 1,048 1,04816,923 Other Revenue 17,984 17,423 -3 17,423 17,423 17,423
498 Resources Received free of charge
448 448 - 448 448 448
383,465 Total Revenue 381,775 397,664 4 394,208 405,062 411,546
Gains
0 Total Gains 0 0 - 0 0 0
383,465 Total Income 381,775 397,664 4 394,208 405,062 411,546
Expenses
262,052 Employee Expenses 263,786 258,641 -2 255,092 261,699 265,53743,951 Superannuation Expenses 39,716 52,908 33 52,181 53,363 53,09327,992 Supplies and Services 29,509 34,194 16 34,409 38,039 39,06725,507 Depreciation and Amortisation 25,338 28,159 11 29,350 30,523 31,009
322 Borrowing Costs 322 699 117 573 358 130618 Grants and Purchased Services 618 631 2 645 665 680
48,382 Other Expenses 60,411 55,266 -9 87,682 64,221 49,606
408,824 Total Ordinary Expenses 419,700 430,498 3 459,932 448,868 439,122
-25,359 Operating Result -37,925 -32,834 13 -65,724 -43,806 -27,576
2006-07 Budget Paper No. 4 409 Department of Education and Training
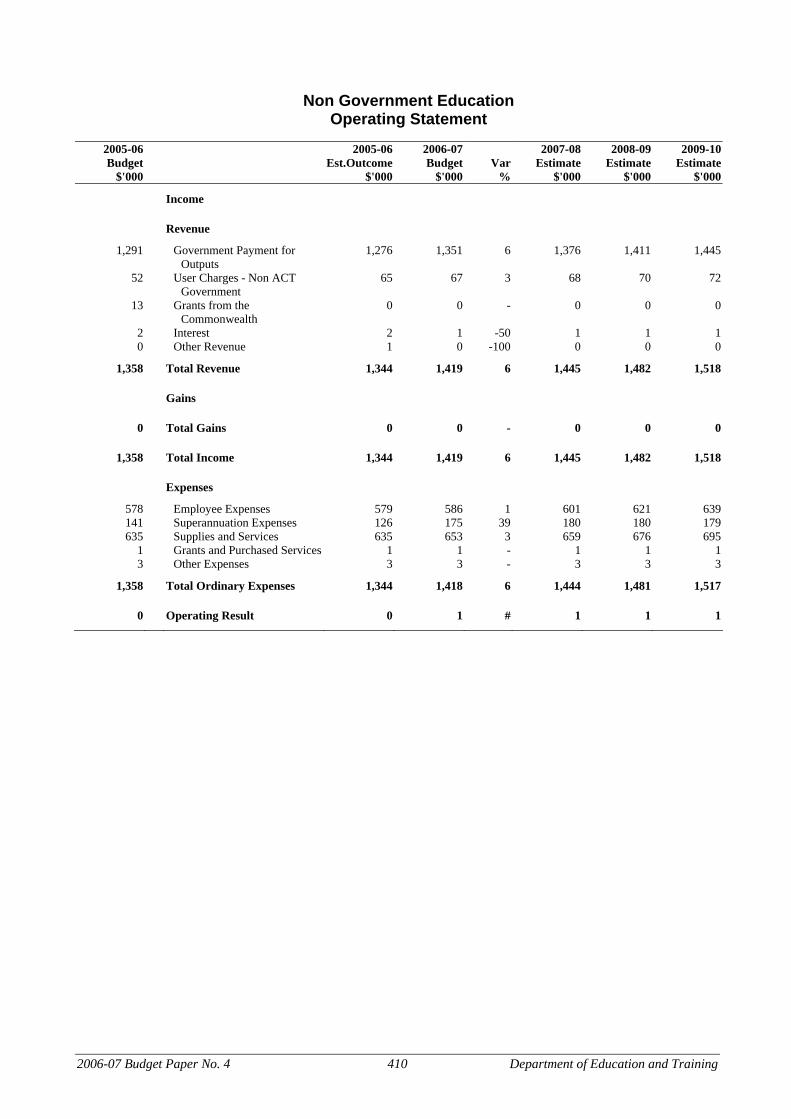
Non Government Education
Operating Statement
2005-06 2005-06 2006-07 2007-08 2008-09 2009-10 Budget Est.Outcome Budget Var Estimate Estimate Estimate
$'000 $'000 $'000 % $'000 $'000 $'000
Income
Revenue
1,291 Government Payment for Outputs
1,276 1,351 6 1,376 1,411 1,445
52 User Charges - Non ACT Government
65 67 3 68 70 72
13 Grants from the Commonwealth
0 0 - 0 0 0
2 Interest 2 1 -50 1 1 10 Other Revenue 1 0 -100 0 0 0
1,358 Total Revenue 1,344 1,419 6 1,445 1,482 1,518
Gains
0 Total Gains 0 0 - 0 0 0
1,358 Total Income 1,344 1,419 6 1,445 1,482 1,518
Expenses
578 Employee Expenses 579 586 1 601 621 639141 Superannuation Expenses 126 175 39 180 180 179635 Supplies and Services 635 653 3 659 676 695
1 Grants and Purchased Services 1 1 - 1 1 13 Other Expenses 3 3 - 3 3 3
1,358 Total Ordinary Expenses 1,344 1,418 6 1,444 1,481 1,517
0 Operating Result 0 1 # 1 1 1
2006-07 Budget Paper No. 4 410 Department of Education and Training
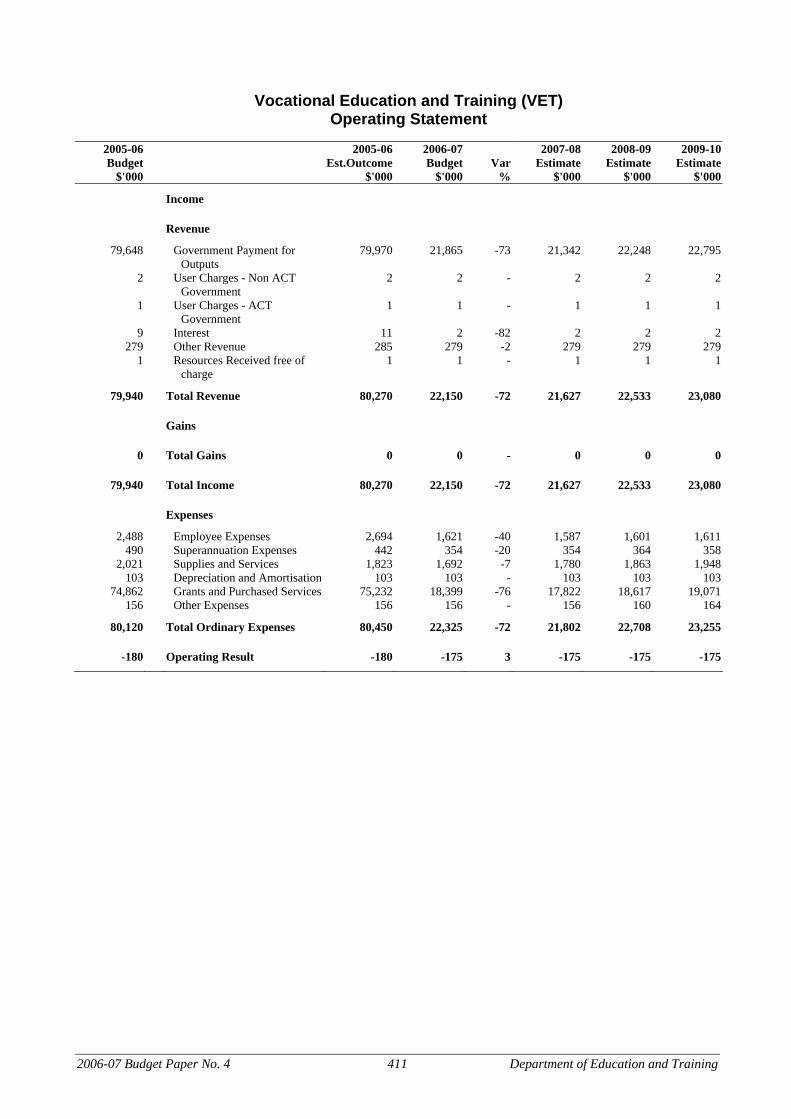
Vocational Education and Training (VET)
Operating Statement
2005-06 2005-06 2006-07 2007-08 2008-09 2009-10 Budget Est.Outcome Budget Var Estimate Estimate Estimate
$'000 $'000 $'000 % $'000 $'000 $'000
Income
Revenue
79,648 Government Payment for Outputs
79,970 21,865 -73 21,342 22,248 22,795
2 User Charges - Non ACT Government
2 2 - 2 2 2
1 User Charges - ACT Government
1 1 - 1 1 1
9 Interest 11 2 -82 2 2 2279 Other Revenue 285 279 -2 279 279 279
1 Resources Received free of charge
1 1 - 1 1 1
79,940 Total Revenue 80,270 22,150 -72 21,627 22,533 23,080
Gains
0 Total Gains 0 0 - 0 0 0
79,940 Total Income 80,270 22,150 -72 21,627 22,533 23,080
Expenses
2,488 Employee Expenses 2,694 1,621 -40 1,587 1,601 1,611490 Superannuation Expenses 442 354 -20 354 364 358
2,021 Supplies and Services 1,823 1,692 -7 1,780 1,863 1,948103 Depreciation and Amortisation 103 103 - 103 103 103
74,862 Grants and Purchased Services 75,232 18,399 -76 17,822 18,617 19,071156 Other Expenses 156 156 - 156 160 164
80,120 Total Ordinary Expenses 80,450 22,325 -72 21,802 22,708 23,255
-180 Operating Result -180 -175 3 -175 -175 -175
2006-07 Budget Paper No. 4 411 Department of Education and Training
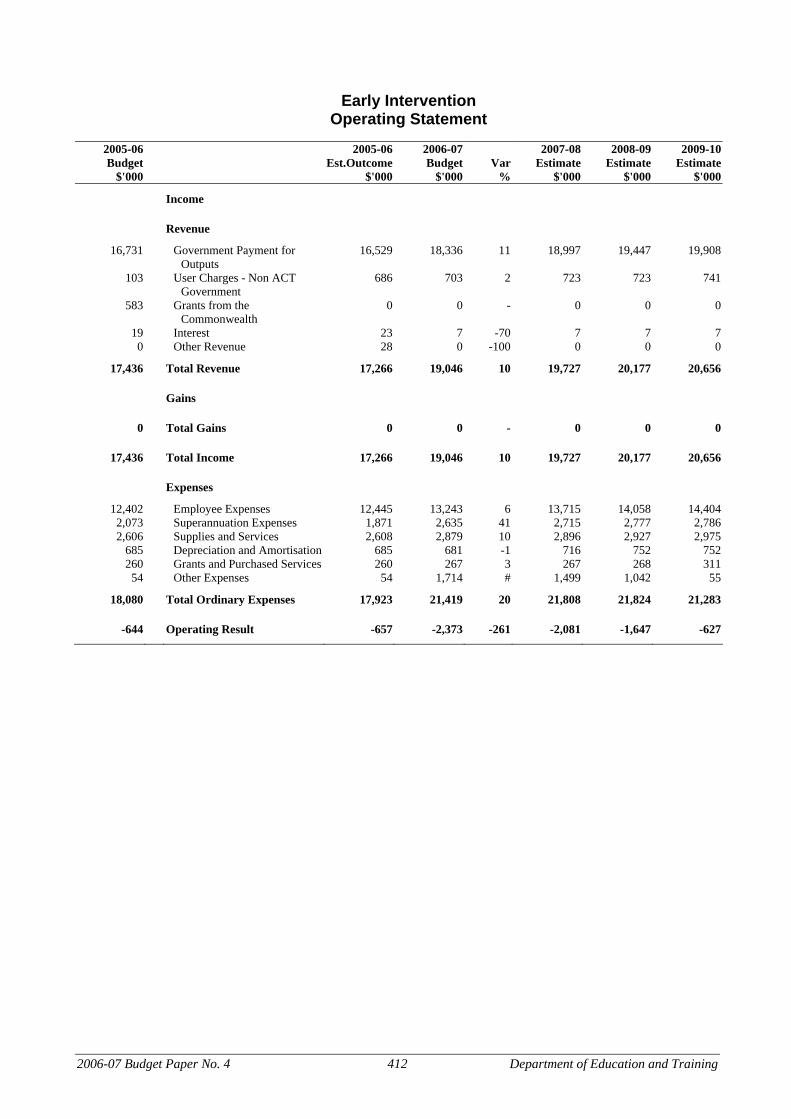
Early Intervention
Operating Statement
2005-06 2006-07 2009-10 2005-06 2007-08 2008-09 Budget Est.Outcome Budget Var Estimate
$'000 $'000 $'000 % $'000 Estimate Estimate
$'000 $'000
Income
Revenue
16,731 Government Payment for Outputs
16,529 18,336 11 18,997 19,447 19,908
103 User Charges - Non ACT Government
686 703 2 723 723 741
583 Grants from the Commonwealth
0 0 - 0 0 0
19 Interest 23 7 -70 7 7 70 Other Revenue 28 0 -100 0 0 0
17,436 Total Revenue 17,266 19,046 10 19,727 20,177 20,656
Gains
0 Total Gains 0 0 - 0 0 0
17,436 Total Income 17,266 19,046 10 19,727 20,177 20,656
Expenses
12,402 Employee Expenses 12,445 13,243 6 13,715 14,058 14,4042,073 Superannuation Expenses 1,871 2,635 41 2,715 2,777 2,7862,606 Supplies and Services 2,608 2,879 10 2,896 2,927 2,975
685 Depreciation and Amortisation 685 681 -1 716 752 752260 Grants and Purchased Services 260 267 3 267 268 311
54 Other Expenses 54 1,714 # 1,499 1,042 55
18,080 Total Ordinary Expenses 17,923 21,419 20 21,808 21,824 21,283
-644 Operating Result -657 -2,373 -261 -2,081 -1,647 -627
2006-07 Budget Paper No. 4 412 Department of Education and Training