Embed Size (px)
Citation preview
Department of Education STUDENT LOANS OVERVIEW
Fiscal Year 2014 Budget Proposal CONTENTS
Page Account Summary Table .............................................................................................................. S-1 Program Description:
Federal Student Loans............................................................................................................. S-3 Interest Rates and Terms—By Type of Loan .......................................................................... S-4 Student Loan Program Maximums .......................................................................................... S-6 Lender Interest Rate and Special Allowance .......................................................................... S-8 Special Allowance Related to Tax-Exempt Financing ............................................................. S-8 Borrower Interest Rates By Academic Year and Program Component .................................. S-9 FFEL and Direct Loans Funding ............................................................................................ S-10 Credit Reform Estimates ........................................................................................................ S-10 Program Subsidy Costs ......................................................................................................... S-11
FY 2014 Budget Proposal: Student Loan Reform Proposals ........................................................................................... S-13 FY 2014 Estimated Loan Subsidy Cost ................................................................................. S-16 FY 2014 Estimated New Direct Loan Volume ....................................................................... S-17 FY 2014 Estimated Consolidation Loan Volume ................................................................... S-18 The Role of Student Loans .................................................................................................... S-19 Postsecondary Cost and Enrollment by Institutional Sector .................................................. S-19 FFEL Liquidating Account ...................................................................................................... S-21 Federal Student Loan Reserve Fund .................................................................................... S-21
Program Output Measures: Direct Loans ........................................................................................................................... S-22 FFEL Loans ............................................................................................................................ S-23 Student Borrowing.................................................................................................................. S-23 Average Federal Debt and Total Debt—Academic Year 2007-2008 .................................... S-24 Median Federal Student Loan Debt ....................................................................................... S-24 Undergraduate Stafford Loan Borrower Distribution by Family Income ................................ S-25 Undergraduate Students by Income Category ...................................................................... S-26 Loan Volume by Institutional Sector ...................................................................................... S-27 Loan Volume by Subsidized and Unsubsidized Stafford Loans ........................................... S-28
Program Performance Information: Performance Measures.......................................................................................................... S-28 National Student Loan Cohort Default Rate .......................................................................... S-29 National and Perkins Cohort Default Rates ........................................................................... S-30 FY 2014 Budget Lifetime Dollar Default and Recovery Rates .............................................. S-31
Click here for accessible version
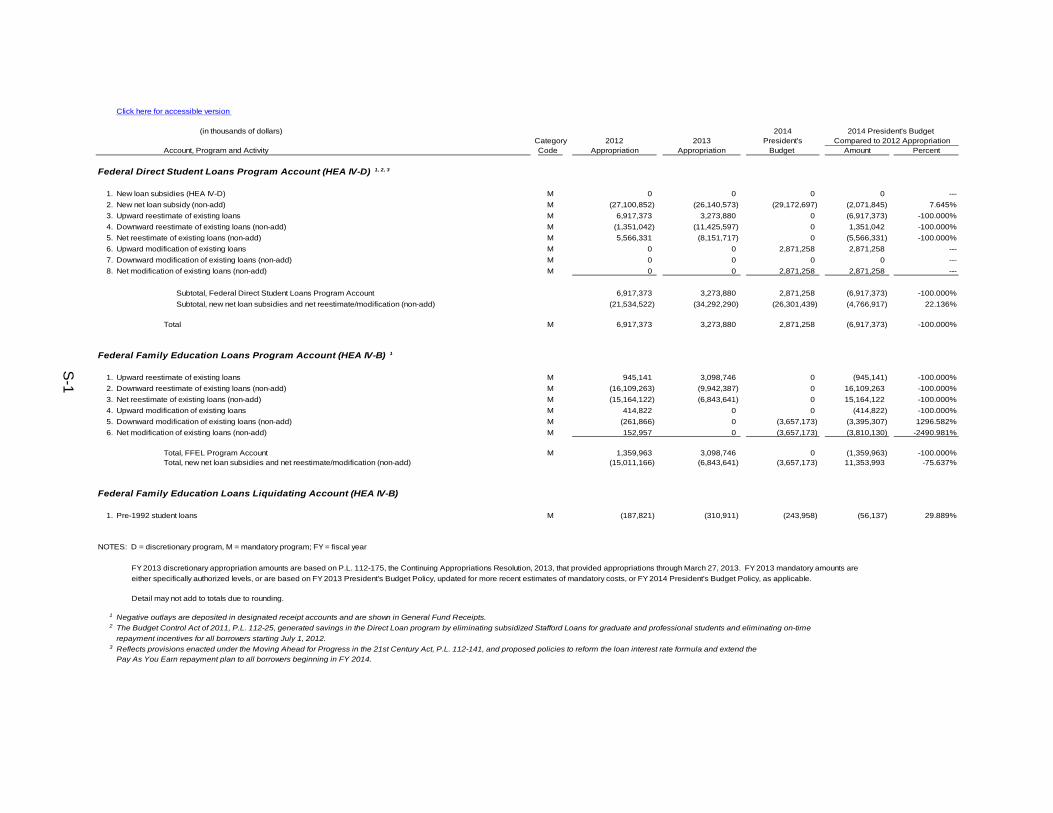
(in thousands of dollars) 2014Category 2012 2013 President's
Account, Program and Activity Code Appropriation Appropriation Budget Amount Percent
Federal Direct Student Loans Program Account (HEA IV-D) 1, 2, 3
1. New loan subsidies (HEA IV-D) M 0 0 0 0 --- 2. New net loan subsidy (non-add) M (27,100,852) (26,140,573) (29,172,697) (2,071,845) 7.645% 3. Upward reestimate of existing loans M 6,917,373 3,273,880 0 (6,917,373) -100.000% 4. Downward reestimate of existing loans (non-add) M (1,351,042) (11,425,597) 0 1,351,042 -100.000% 5. Net reestimate of existing loans (non-add) M 5,566,331 (8,151,717) 0 (5,566,331) -100.000% 6. Upward modification of existing loans M 0 0 2,871,258 2,871,258 --- 7. Downward modification of existing loans (non-add) M 0 0 0 0 --- 8. Net modification of existing loans (non-add) M 0 0 2,871,258 2,871,258 ---
Subtotal, Federal Direct Student Loans Program Account 6,917,373 3,273,880 2,871,258 (6,917,373) -100.000%Subtotal, new net loan subsidies and net reestimate/modification (non-add) (21,534,522) (34,292,290) (26,301,439) (4,766,917) 22.136%
Total M 6,917,373 3,273,880 2,871,258 (6,917,373) -100.000%
Federal Family Education Loans Program Account (HEA IV-B) 1
1. Upward reestimate of existing loans M 945,141 3,098,746 0 (945,141) -100.000% 2. Downward reestimate of existing loans (non-add) M (16,109,263) (9,942,387) 0 16,109,263 -100.000% 3. Net reestimate of existing loans (non-add) M (15,164,122) (6,843,641) 0 15,164,122 -100.000% 4. Upward modification of existing loans M 414,822 0 0 (414,822) -100.000% 5. Downward modification of existing loans (non-add) M (261,866) 0 (3,657,173) (3,395,307) 1296.582% 6. Net modification of existing loans (non-add) M 152,957 0 (3,657,173) (3,810,130) -2490.981%
Total, FFEL Program Account M 1,359,963 3,098,746 0 (1,359,963) -100.000%Total, new net loan subsidies and net reestimate/modification (non-add) (15,011,166) (6,843,641) (3,657,173) 11,353,993 -75.637%
Federal Family Education Loans Liquidating Account (HEA IV-B)
1. Pre-1992 student loans M (187,821) (310,911) (243,958) (56,137) 29.889%
NOTES: D = discretionary program, M = mandatory program; FY = fiscal year
FY 2013 discretionary appropriation amounts are based on P.L. 112-175, the Continuing Appropriations Resolution, 2013, that provided appropriations through March 27, 2013. FY 2013 mandatory amounts are either specifically authorized levels, or are based on FY 2013 President's Budget Policy, updated for more recent estimates of mandatory costs, or FY 2014 President's Budget Policy, as applicable.
Detail may not add to totals due to rounding.
1 Negative outlays are deposited in designated receipt accounts and are shown in General Fund Receipts.2 The Budget Control Act of 2011, P.L. 112-25, generated savings in the Direct Loan program by eliminating subsidized Stafford Loans for graduate and professional students and eliminating on-time
repayment incentives for all borrowers starting July 1, 2012. 3 Reflects provisions enacted under the Moving Ahead for Progress in the 21st Century Act, P.L. 112-141, and proposed policies to reform the loan interest rate formula and extend the
Pay As You Earn repayment plan to all borrowers beginning in FY 2014.
2014 President's Budget Compared to 2012 Appropriation
Account Summary Table
S-1
STUDENT LOANS OVERVIEW
S-2
Federal Family Education Loan Program (FFEL) (Higher Education Act of 1965, Title IV, Part B) William D. Ford Federal Direct Loan Program (Direct Loan) (Higher Education Act of 1965, Title IV, Part D) (dollars in thousands) FY 2014 Authorization: Indefinite1 Budget Authority:
2012
2013
2014
Change from 2013
Net Loan Subsidies: DL New Loan Subsidy2 -$27,100,852 -$26,140,573 -$29,172,697 -$3,032,124 DL Net Reestimate3 +5,566,331 -8,151,717 0 +8,151,717 DL Net Modification4 0 0 2,871,258 +2,871,258 DL Total Net Subsidy5 -21,534,522 -34,292,290 -26,301,439 +7,990,851
FFEL New Loan Subsidy2 0 0 0 0 FFEL Net Reestimate3 -15,164,122 -6,843,641 0 +6,843,641 FFEL Net Modification4 +152,957 0 -3,657,173 -3,657,173 FFEL Total Net Subsidy5 -15,011,166 -6,843,641 -3,657,173 +3,186,468 ____________________ Details may not sum to totals due to rounding.
1 Selected reauthorizing language authorizing the loan programs beyond FY 2008 was contained in the Higher Education Reconciliation Act (HERA) of 2005 (P.L. 109-171). The College Cost Reduction and Access Act (CCRAA) (P.L. 110-84) also amended loan program provisions and other Higher Education Act (HEA) programs, starting October 1, 2007. The Ensuring Continued Access to Student Loans Act (ECASLA) of 2008 (P.L. 110-227) provided the Government with purchase authority to buy Federal student loans from lenders and ensure access to FFEL loans. The law also increased Unsubsidized Stafford loan limits for undergraduates. The SAFRA Act (Student Aid and Fiscal Responsibility Act), Title II, Part A of the larger Health Care and Education Reconciliation Act of 2010 (HCERA), (P.L. 111-152), terminated the FFEL loan program by providing that all new student loans would originate in the Direct Loan program as of July 1, 2010. The Budget Control Act of 2011 (P.L. 112-25) generated savings in the Direct Loan program by eliminating Subsidized Stafford Loans for graduate and professional students and eliminating most repayment incentives for all borrowers—starting July 1, 2012. The Consolidated Appropriations Act, 2012, produced student loan savings by eliminating Federal payment of student loan interest during the grace period for loans made in academic years 2012-13, and 2013-14, and introducing a lender option to choose an alternative index—the 1-month London InterBank Offered Rate (LIBOR)—for determining special allowance. The Moving Ahead for Progress in the 21st Century Act (MAP-21) (P.L. 112-141), signed July 6, 2012, extended the Subsidized Stafford interest rate of 3.4 percent for 1 year and limited the Subsidized Stafford in-school interest subsidy to150 percent of normal program length. 2 Federal administration funds associated with the FFEL and Direct Loan accounts are shown in Student Aid Administration, beginning on page AA-1. New loan subsidy reflects the estimated cost of loans for the 2013 and 2014 loan cohorts. Normally, the program account does not show budget authority if it is negative. Such subsidy is reported (as a collection of negative outlays) to a negative subsidy receipt account. However, for informational purposes, the amounts shown above do reflect estimated negative budget authority. 3 Annual reestimates of prior loans costs to the Government are performed usually in the December timeframe. 4 Modification in FY 2014 reflects: a Direct Loan proposal to extend the Pay As You Earn repayment plan to all qualified borrowers, regardless of when borrowers obtained their loans; and in FFEL, a proposed reduction to guaranty agency fee retention on rehabilitated FFEL loans. 5 Total net subsidy provides a net subsidy cost of the loan programs. It includes positive and negative subsidies and upward and downward impacts of reestimates and modifications, consistent with the presentation on page S-1.
STUDENT LOANS OVERVIEW
FFEL and Direct Loans
S-3
PROGRAM DESCRIPTION Federal Student Loans The Federal student loan programs provide students and their families with the funds to help meet postsecondary education costs. Student loans also address the important Administration strategic goal of ensuring the affordability, accessibility and accountability of higher education, and ensuring students and adults are better prepared for employment and future learning. Because funding for the loan programs is provided through permanent and indefinite budget authorities, for budget purposes, student loans are considered separately from other Federal student financial assistance programs. However, as part of the overall Federal effort to expand access to higher education, student loans should be viewed in combination with those other programs. As provided by SAFRA (Student Aid and Fiscal Responsibility Act), Title II, Part A of the Health Care and Education Reconciliation Act of 2010, the Federal Family Education Loan (FFEL) program ceased making new loans as of July 1, 2010, and as of that date, the Direct Loan (DL) program has originated all new such loans. Federal student loans were first disbursed under the FFEL program in 1965. From its inception through the end of June 2010, the FFEL program provided almost $899 billion in student loans to postsecondary students and their parents. The Direct Loan program, created by the Higher Education Amendments of 1992 as a pilot program and was expanded by the Student Loan Reform Act of 1993, has operated since July 1, 1994. Under this program, the Federal Government provides the loan capital while loan origination is done by postsecondary institutions and loan servicing is handled by the Department through private sector contractors. The DL program began operation in academic year 1994-1995 with 7 percent of overall loan volume; as of July 1, 2010, the program accounts for all new loan volume. Because lenders continue to service billions of dollars in outstanding FFEL loans that are still in repayment, this program description includes information on both the Direct Loan and FFEL programs. Four types of loans are available under the Direct Loan program: Subsidized Stafford, Unsubsidized Stafford (Unsub), PLUS, and Consolidation. Loans can be used only to meet qualified educational expenses. A financial needs test based on family income is required for a student to receive a Subsidized Stafford Loan. Unsubsidized Stafford, PLUS, and Consolidation Loans are available to borrowers at all income levels. PLUS Loans are available to parents of dependent undergraduate students as well as to graduate and professional students. Consolidation Loans allow borrowers to combine their obligations from loans made under Title IV of the Higher Education Act—FFEL, Direct Loans, and Perkins Loans as well as some loans made under the Public Health Service Act—into one loan, thereby eliminating multiple monthly payments during the repayment term. Direct Loan borrowers are charged an origination fee. Stafford and Unsubsidized Stafford Loan borrowers are charged an origination fee equal to 1 percent of principal. PLUS borrowers are charged a 4 percent origination fee. Under the special rules of the sequestration, origination fees for Stafford and Unsubsidized Stafford Loans are 1.051 percent, and PLUS Loan origination fees are 4.204 percent. In general, student loans may be discharged when
STUDENT LOANS OVERVIEW
FFEL and Direct Loans
S-4
borrowers die, are totally and permanently disabled, or, under limited hardship circumstances, declare bankruptcy. Historically, private lenders provided loan capital in the FFEL program, facilitated by the Federal guarantee on the loans. The Federal Government also promised interest subsidies to lenders for certain situations, as well as reimbursement to guaranty agencies for most costs associated with loan defaults and other write-offs. State and private nonprofit guaranty agencies act as agents of the Federal Government, providing a variety of services including insurance payments to lenders for defaults, collection of some defaulted loans, default avoidance activities, and counseling to schools, students, and lenders. There are currently 32 active guaranty agencies. Some of these guaranty agencies also act as contractors to the Department of Education, servicing loans under the Direct Loan program. Under the FFEL program, lenders may receive a special allowance, a type of interest subsidy paid by the Government to ensure a specified yield, or rate of return on their loans. Special allowance payments vary by loan type (e.g., Subsidized Stafford, Unsub.), are determined quarterly, and are based on current borrower interest rates and market-yield formulas. For periods when the borrower interest rate exceeds the special allowance rate on FFEL loans made on or after April 1, 2006, lenders remit the difference back to the Government; lenders retain the difference on loans made before April 1, 2006. For outstanding FFEL loans serviced by FFEL lenders, the guarantee percentage paid by guaranty agencies to lenders on most defaults (for those loans disbursed as of July 1, 2006) is 97 percent of unpaid loan principal (including any accrued interest on the full loan principal). As of July 1, 2010, the Direct Loan program originates all Subsidized and Unsubsidized Stafford Loans, PLUS, and Consolidation Loans. New loan volume typically reflects new student loan demand, and therefore does not include Consolidation volume, which relates to students consolidating prior loans. (Consolidation loan volume is included when reporting total student loan volume.) In fiscal year (FY) 2014, new Direct Loan volume is estimated at $112 billion and Consolidation loan volume is estimated at $28 billion, yielding a total of about $140 billion, accounting for 77 percent of all postsecondary aid available from the Department of Education. The Direct Loan program, including interest rates and loan terms, is discussed in greater detail below. Interest Rates and Terms—By Type of Loan The current interest rates on Federal student loans are set in statute. The CCRAA of 2007 included a phased interest rate reduction for new undergraduate Subsidized Stafford loans, with fixed interest rates dropping from 6.8 percent to 6.0 percent on July 1, 2008, to 5.6 percent on July 1, 2009, 4.5 percent on July 1, 2010, and 3.4 percent on July 1, 2011. As of July 1, 2006, the borrower interest rate on all Unsubsidized Stafford loans was fixed at 6.8 percent while the borrower interest rate on Direct PLUS loans was fixed at 7.9 percent. The Moving Ahead for Progress in the 21st Century Act (MAP-21) (P.L. 112-141), signed July 6, 2012, extended the Subsidized Stafford interest rate of 3.4 percent for 1 year. In this budget, the Administration proposes to reform the interest rate formula for the Direct Loan program so that it
STUDENT LOANS OVERVIEW
FFEL and Direct Loans
S-5
is tied to the 10-year Treasury bill rate with a spread depending on the loan type. More details of this proposal appear in a later section, FY 2014 Budget Proposal, page S-13.. Shown below by loan type are the current interest rates and rate changes proposed in the 2014 Budget:
• Subsidized Stafford (Stafford) Loans are subsidized, low-interest, fixed rate loans for undergraduates based on financial need. The Budget Control Act of 2011 made graduate and professional students no longer eligible for Subsidized Stafford loans, effective July 1, 2012. On all Subsidized Stafford Loans interest does not accrue while the student is in school and during deferment periods. Additionally, interest does not accrue during the 6-month grace period—starting when the loan first enters repayment, except as noted below. The Consolidated Appropriations Act of 2012 eliminated the grace period benefit for Subsidized Stafford loans made in academic years (AY) 2012-2013 and 2013-2014. The interest rate for these loans is scheduled to rise from 3.4 percent for AY 2012-2013 to 6.8 percent for AY 2013-2014. For AY 2013 and beyond the Administration proposes new fixed interest rates for Subsidized Stafford loans that would be set each year to equal the then-prevailing 10-year Treasury note rate plus an add-on of 0.93 percentage points (i.e., 93 basis points).
• Unsubsidized Stafford (Unsub.) Loans are low-interest, fixed rate loans available to student borrowers, regardless of financial need. Interest accrues while the borrower is in school. Borrowers may defer payment of interest while in school and have it capitalized upon entering repayment. For loans made on or after July 1, 2006, the interest rate is fixed at 6.8 percent. For AY 2013 and beyond, the Administration proposes that new fixed rates for Unsubsidized Stafford loans be set each year to equal the then-prevailing 10-year Treasury note rate plus an add-on of 293 basis points. The interest rate would stay fixed for the duration of the loan.
• PLUS Loans for parents (Parent PLUS) of dependent undergraduate students and
graduate and professional degree students have no annual or aggregate limit on the amount that can be borrowed. Generally, to be eligible, PLUS Loan applicants must not have an adverse credit history. The Federal Government does not pay interest accruing on PLUS Loans. The PLUS interest rate is fixed at 7.9 percent. For AY 2013 and beyond, the Administration proposes that new fixed rates for PLUS loans be set each year to equal the then-prevailing 10-year Treasury note rate plus an add-on of 393 basis points.
• Consolidation Loans allow borrowers with existing student loans to combine their obligations and possibly extend their repayment schedules based on their total student loan debt outstanding. The interest rate for Consolidation Loans is based on the weighted average of the underlying loans being consolidated rounded up to the nearest 1/8 of 1 percent, with a cap of 8.25 percent. Under the Administration proposal, the cap of 8.25 percent would be eliminated for Consolidation Loans made in AY 2013 and beyond.
STUDENT LOANS OVERVIEW
FFEL and Direct Loans
S-6
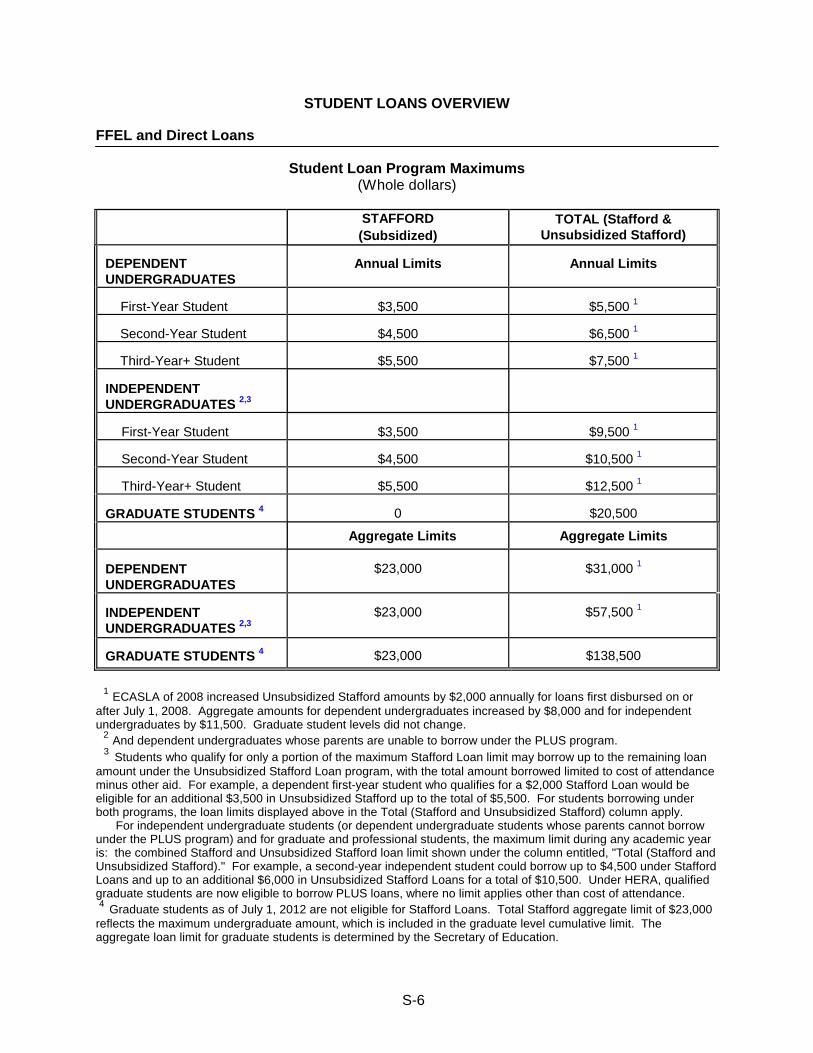
Student Loan Program Maximums (Whole dollars)
STUDENT STATUS
STAFFORD (Subsidized)
TOTAL (Stafford & Unsubsidized Stafford)
DEPENDENT UNDERGRADUATES
Annual Limits
Annual Limits
Dependent Undergraduates:First-Year Student
$3,500
$5,500 1
Dependent UndergraduatesSecond-Year Student
$4,500
$6,500 1
Dependent UndergraduatesThird-Year+ Student
$5,500
$7,500 1
INDEPENDENT UNDERGRADUATES 2,3
Stafford Total (Stafford & Unsubsidized Stafford)
Independent Undergraduates: First-Year Student
$3,500
$9,500 1
Independent Undergraduates: Second-Year Student
$4,500
$10,500 1
Independent Undergraduates: Third-Year+ Student
$5,500
$12,500 1
GRADUATE STUDENTS 4
0
$20,500
STUDENT STATUS AAggregate Limits Aggregate Limits
DEPENDENT UNDERGRADUATES
$23,000
$31,000 1
INDEPENDENT UNDERGRADUATES 2,3
$23,000
$57,500 1
GRADUATE STUDENTS 4
$23,000
$138,500
1 ECASLA of 2008 increased Unsubsidized Stafford amounts by $2,000 annually for loans first disbursed on or after July 1, 2008. Aggregate amounts for dependent undergraduates increased by $8,000 and for independent undergraduates by $11,500. Graduate student levels did not change. 2 And dependent undergraduates whose parents are unable to borrow under the PLUS program. 3 Students who qualify for only a portion of the maximum Stafford Loan limit may borrow up to the remaining loan amount under the Unsubsidized Stafford Loan program, with the total amount borrowed limited to cost of attendance minus other aid. For example, a dependent first-year student who qualifies for a $2,000 Stafford Loan would be eligible for an additional $3,500 in Unsubsidized Stafford up to the total of $5,500. For students borrowing under both programs, the loan limits displayed above in the Total (Stafford and Unsubsidized Stafford) column apply. For independent undergraduate students (or dependent undergraduate students whose parents cannot borrow under the PLUS program) and for graduate and professional students, the maximum limit during any academic year is: the combined Stafford and Unsubsidized Stafford loan limit shown under the column entitled, "Total (Stafford and Unsubsidized Stafford)." For example, a second-year independent student could borrow up to $4,500 under Stafford Loans and up to an additional $6,000 in Unsubsidized Stafford Loans for a total of $10,500. Under HERA, qualified graduate students are now eligible to borrow PLUS loans, where no limit applies other than cost of attendance. 4 Graduate students as of July 1, 2012 are not eligible for Stafford Loans. Total Stafford aggregate limit of $23,000 reflects the maximum undergraduate amount, which is included in the graduate level cumulative limit. The aggregate loan limit for graduate students is determined by the Secretary of Education.
STUDENT LOANS OVERVIEW
FFEL and Direct Loans
S-7
Loan forgiveness: Under both FFEL and Direct Loan programs, new borrowers after October 1, 1998, who are employed as teachers in schools serving low-income populations for 5 consecutive, complete school years, qualify for up to $5,000 in loan forgiveness; this benefit is increased to $17,500 for mathematics, science, and special education teachers considered highly qualified under criteria established in the No Child Left Behind Act of 2001. In addition, the CCRAA of 2007 provided a public-service loan forgiveness program for nonprofit and public-sector employees. Eligible borrowers who work for 10 years while making timely payments on their student loan debt will have any remaining loan balance forgiven. This benefit is only available in the Direct Loan program, though FFEL borrowers may access the benefit by taking out a Direct Consolidation Loan, which is available for all borrowers, regardless of when they took out their loans. Loan repayment plans: FFEL borrowers may choose from multiple repayment plans. Repayment periods under standard, graduated, and income-sensitive repayment may not exceed 10 years. An extended repayment plan of up to 25 years is available for qualified borrowers who have outstanding loans totaling more than $30,000. FFEL borrowers may change repayment plans once per year. Borrowers under Direct Loans may choose from the same repayment plans as FFEL, except that instead of the FFEL income-sensitive repayment plan, an income-contingent repayment (ICR) plan is available in Direct Loans (with terms similar to the newer income-based repayment plan). Direct Loan borrowers may switch between repayment plans at any time. Qualifying students may also choose an income-based repayment (IBR) plan where FFEL or Direct Loans (except Parent PLUS) are repaid according to the borrower’s income. Under this plan, any outstanding balances remaining after 25 years in repayment will be forgiven by the Federal Government. To ensure that student debts are manageable, SAFRA reduced monthly payments in IBR from 15 percent of a borrower’s prior-year discretionary income to 10 percent, and reduced the maximum length of time a borrower is in the IBR program from 25 years to 20 years, after which any remaining balance is forgiven. SAFRA authorized that new loans beginning July 1, 2014, were eligible for this IBR treatment. In October 2011, the Administration announced an initiative—Pay As You Earn (PAYE)—that accelerates these benefits for qualified borrowers who were new borrowers as of October 1, 2007, and had received a Direct Loan disbursement on or after October 1, 2011. This PAYE plan became available for eligible borrowers as of December 21, 2012. The 2014 Budget proposes to extend this plan to all qualified borrowers beginning in FY 2014, regardless of when borrowers obtained their loans. Outstanding Loan Volume—September, 2012: At the end of 2012, outstanding FFEL and Direct Loans totaled approximately $896 billion. This total was comprised of 1) $473 in Direct Loans; 2) $322 billion in FFEL loans; 3) $6 billion in FFEL Liquidating Account loans; and 4) $95 billion in the FFEL-derived program known as Ensuring Continued Access to Student Loans (ECASLA of 2008) program loans.
STUDENT LOANS OVERVIEW
FFEL and Direct Loans
S-8
Lender Interest Rate and Special Allowance Since January 1, 2000, FFEL lenders earn a guaranteed lender yield on the loans they hold and may receive Federal interest subsidy payments to ensure they receive this yield. The interest subsidy, which is called a “special allowance payment” is based on a formula in law and paid by the Government to lenders on a quarterly basis when the guaranteed lender yield exceeds the interest rate paid by a student loan borrower. The guaranteed lender yield is based on the average of bond equivalent rates for 3-month commercial paper during a quarter, plus a factor for loans in repayment, and a factor during in-school, grace, or deferment periods. Under current law, FFEL lenders receive the higher of the borrower interest rate or the guaranteed lender yield. If the borrower rate is lower than the guaranteed lender yield, the Government pays lenders an interest subsidy called a “special allowance.” Under HERA, for new loans made on or after April 1, 2006, when the borrower rate is higher than the guaranteed lender yield, lenders are required to rebate the difference to the Government. Under CCRAA, the guaranteed lender yield formula factors cited above for most lenders were reduced by 55 basis points to 1.79 percent for loans in repayment and 1.19 percent for loans in an in-school, grace, or deferment period. Eligible non-profit lenders had their formula factor reduced by 40 basis points to 1.94 percent for loans in repayment and 1.34 percent for loans in an in-school, grace, or deferment period. The Consolidated Appropriations Act of 2012 gave loan holders an option to make a one-time switch from the commercial paper rate to the 1-month London InterBank Offered Rate (LIBOR) index for determining special allowance, starting April 1, 2012. For PLUS loans disbursed on or after October 1, 2007, and held by for-profit lenders, the guaranteed lender yield is the average of 3-month commercial paper for the quarter and 1.79 percent. For non-profit loan holders, the yield formula is the average of 3-month commercial paper rate and 1.94 percent. Special Allowance Related to Tax-Exempt Financing Loans funded with the proceeds of tax-exempt securities originally issued before October 1, 1993, receive substantially higher special allowance payments than are currently paid on other types of loans. These loans have come to be known as “9.5 percent” loans for their higher special allowance treatment. The Taxpayer-Teacher Protection Act of 2004 temporarily limited the ability of loan holders to retain these higher subsidies indefinitely by refinancing the underlying securities. These temporary provisions were in effect through December 30, 2005. HERA made this change permanent and also eliminated “recycling” loans for most loan holders, thereby conforming these older loans to the special allowance rates paid on most other loans.
STUDENT LOANS OVERVIEW
FFEL and Direct Loans
S-9
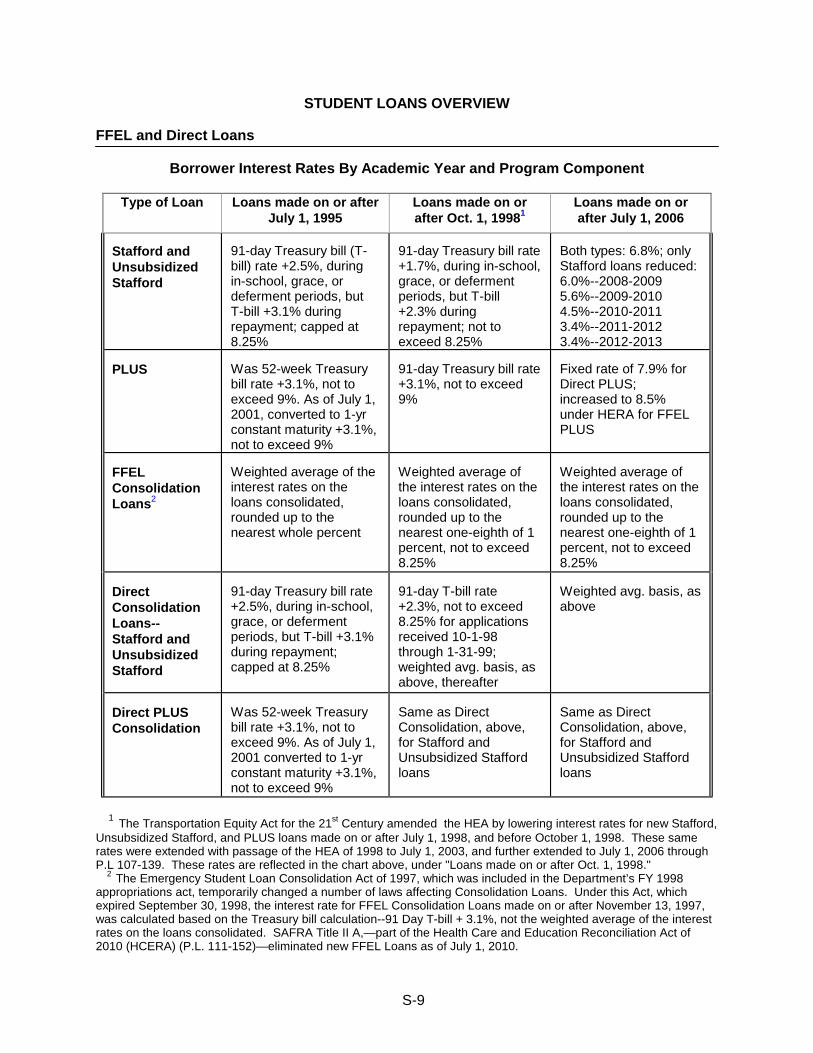
Borrower Interest Rates By Academic Year and Program Component
Type of Loan Loans made on or after July 1, 1995
Loans made on or after Oct. 1, 19981
Loans made on or after July 1, 2006
Stafford and Unsubsidized Stafford
91-day Treasury bill (T-bill) rate +2.5%, during in-school, grace, or deferment periods, but T-bill +3.1% during repayment; capped at 8.25%
91-day Treasury bill rate +1.7%, during in-school, grace, or deferment periods, but T-bill +2.3% during repayment; not to exceed 8.25%
Both types: 6.8%; only Stafford loans reduced: 6.0%--2008-2009 5.6%--2009-2010 4.5%--2010-2011 3.4%--2011-2012 3.4%--2012-2013
PLUS
Was 52-week Treasury bill rate +3.1%, not to exceed 9%. As of July 1, 2001, converted to 1-yr constant maturity +3.1%, not to exceed 9%
91-day Treasury bill rate +3.1%, not to exceed 9%
Fixed rate of 7.9% for Direct PLUS; increased to 8.5% under HERA for FFEL PLUS
FFEL Consolidation Loans2
Weighted average of the interest rates on the loans consolidated, rounded up to the nearest whole percent
Weighted average of the interest rates on the loans consolidated, rounded up to the nearest one-eighth of 1 percent, not to exceed 8.25%
Weighted average of the interest rates on the loans consolidated, rounded up to the nearest one-eighth of 1 percent, not to exceed 8.25%
Direct Consolidation Loans-- Stafford and Unsubsidized Stafford
91-day Treasury bill rate +2.5%, during in-school, grace, or deferment periods, but T-bill +3.1% during repayment; capped at 8.25%
91-day T-bill rate +2.3%, not to exceed 8.25% for applications received 10-1-98 through 1-31-99; weighted avg. basis, as above, thereafter
Weighted avg. basis, as above
Direct PLUS Consolidation
Was 52-week Treasury bill rate +3.1%, not to exceed 9%. As of July 1, 2001 converted to 1-yr constant maturity +3.1%, not to exceed 9%
Same as Direct Consolidation, above, for Stafford and Unsubsidized Stafford loans
Same as Direct Consolidation, above, for Stafford and Unsubsidized Stafford loans
1 The Transportation Equity Act for the 21st Century amended the HEA by lowering interest rates for new Stafford, Unsubsidized Stafford, and PLUS loans made on or after July 1, 1998, and before October 1, 1998. These same rates were extended with passage of the HEA of 1998 to July 1, 2003, and further extended to July 1, 2006 through P.L 107-139. These rates are reflected in the chart above, under "Loans made on or after Oct. 1, 1998." 2 The Emergency Student Loan Consolidation Act of 1997, which was included in the Department’s FY 1998 appropriations act, temporarily changed a number of laws affecting Consolidation Loans. Under this Act, which expired September 30, 1998, the interest rate for FFEL Consolidation Loans made on or after November 13, 1997, was calculated based on the Treasury bill calculation--91 Day T-bill + 3.1%, not the weighted average of the interest rates on the loans consolidated. SAFRA Title II A,—part of the Health Care and Education Reconciliation Act of 2010 (HCERA) (P.L. 111-152)—eliminated new FFEL Loans as of July 1, 2010.
STUDENT LOANS OVERVIEW
FFEL and Direct Loans
S-10
FFEL and Direct Loans Funding Both FFEL and Direct Loans are mandatory programs whose costs are largely driven by Federal borrowing costs, prevailing interest rates, defaults, and loan volume demand. The programs are funded by mandatory and indefinite budget authority and therefore do not receive annual congressional discretionary appropriations. A loan subsidy—the portion of cost paid by the Federal Government—is calculated for each loan cohort based on the Federal Credit Reform Act of 1990, and reflects the net present value of future cash flows associated with the Direct Loan or FFEL guaranteed loan. Both the FFEL and Direct Loan programs incur various administrative expenses, some of which are funded through mandatory appropriations within the loan programs, while most are funded through mandatory and discretionary administrative funds outside of the loan accounts. In FY 2014, the Administration requests $1.05 billion in discretionary funding to administer the Federal student aid programs in the Student Aid Administration (SAA) account. This includes $736.2 million for student aid administration, and $316.9 million for loan servicing activities. In addition, $434 million in mandatory funds would be provided for funding loan servicing performed by not-for-profit loan servicers and $9 million in mandatory funds would support the proposed new Perkins Loan program. The 2014 SAA budget is discussed in detail in the justification for Student Aid Administration, beginning on page AA-1. Credit Reform Estimates Student loan program costs are estimated consistent with the terms of the Federal Credit Reform Act (FCRA) of 1990. Under the Act, future costs and revenues associated with a loan are estimated for the life of the loan and discounted back to the date of disbursement using Treasury interest rates. Costs related to pre-1992 loans in the FFEL Liquidating account and most Federal administrative costs are statutorily excluded from credit reform calculations. For FFEL, key credit reform costs include reimbursements for in-school interest benefits and special allowance payments to lenders, and default reinsurance payments to guaranty agencies. These costs can be partially or more than completely offset by various fees, negative special allowance payments—referred to as rebates—and collections on defaulted loans. In the Direct Loan program, cash transactions consist of Federal Government loan disbursements to students, payments of student loan fees, and borrower loan repayments. Defaults and loan discharges reduce future student loan repayments. In FY 2013 and FY 2014, the Direct Loan program reflects an estimated net total negative subsidy due in part to reduced discount rates that reflect lower borrowing costs paid by the Federal Government, while borrower repayments and loan fees contribute to cash flows as collections to the Government, helping to offset Federal costs. Federal loan programs are often compared using subsidy rates, which represent the Federal cost (the appropriation) as a percentage of loan originations. For Direct Loans, the overall weighted average negative subsidy rate was estimated to be -16.49 percent in FY 2012; that is, the overall program on average is projected to earn about 16.49 percent on each dollar of loans made, thereby providing net revenue to the Federal Government. In an effort to better reflect interest rate variability of future estimates, the Department of Education in 2006 implemented probabilistic scoring for the FFEL and Direct Loan programs
STUDENT LOANS OVERVIEW
FFEL and Direct Loans
S-11
similar to the Congressional Budget Office methodology. Previously, estimates were developed using point estimates of future interest rates. The updated method factors in the probability that a range of interest rate scenarios may differ from current economic projections. Program Subsidy Costs The largest loan subsidy costs involve in-school interest benefits for borrowers and costs associated with borrowers who default on their loans. A 2014 FFEL Budget proposal would lower payments to guaranty agencies for rehabilitated loans resulting in almost $3.7 billion in savings. The Direct Loan negative subsidy costs in FY 2014 are estimated at -$26.3 billion, (that is, $26 billion in net revenue), reflecting impacts of the Administration’s proposed Direct Loan policies, and supporting approximately $154 billion in estimated total Direct Loan gross (volume) commitments equating to aid available of $140 billion in net commitments—after loan cancellations. Generally, subsidy costs may reflect a combination of positive and negative subsidy by loan type with the relative weightings by loan type and other accounting rules determining the overall net positive or negative subsidy. A negative subsidy occurs when the present value of cash inflows to the Government is estimated to exceed the present value of cash outflows. In that case, the Federal Government is earning more than it is spending. Currently, the Direct Loan program reflects a negative subsidy. Subsidy rates represent the Federal portion of non-administrative costs—principally interest subsidies and defaults—associated with each borrowed dollar over the life of the loan. Under FCRA rules, subsidy costs such as default costs and in-school interest benefits are embedded within the program subsidy, whereas Federal administration costs are treated as annual cash amounts and are not included within the subsidy rate. The subsidy rate reflects the estimated unit cost per loan, over the life of the loan, to the Federal Government. For example, a $1,000 loan with Federal subsidy costs of $100 would have a subsidy rate of 10 percent. If loan subsidy costs were negative, such as -$100, the loan would have a negative subsidy rate of -10 percent, indicating that the Federal Government was earning 10 percent on each dollar of loans made instead of incurring a cost. Program changes, economic conditions, as well as borrower repayment patterns can affect subsidy estimates and reestimates. Annual variations in the subsidy rate are largely due to the relationship between the OMB-provided discount rate that approximates the Government’s borrowing rate and the interest rate at which borrowers repay their loans. Technical assumptions for defaults, repayment patterns, and other borrower characteristics would also apply. The loan subsidy estimates are particularly sensitive to fluctuations in the discount rate. Even small shifts in economic projections may produce substantial movement, up or down, in the subsidy rate. Reestimates of Subsidy Costs Under credit reform, the Department annually reestimates the cost of all outstanding loans by cohort to reflect updated modeling assumptions, the President’s Budget economic assumptions, and actual experience. In essence, the reestimating process allows for a “reality check” each year whereby the most recent economic and technical assumptions get applied to prior cohorts.
STUDENT LOANS OVERVIEW
FFEL and Direct Loans
S-12
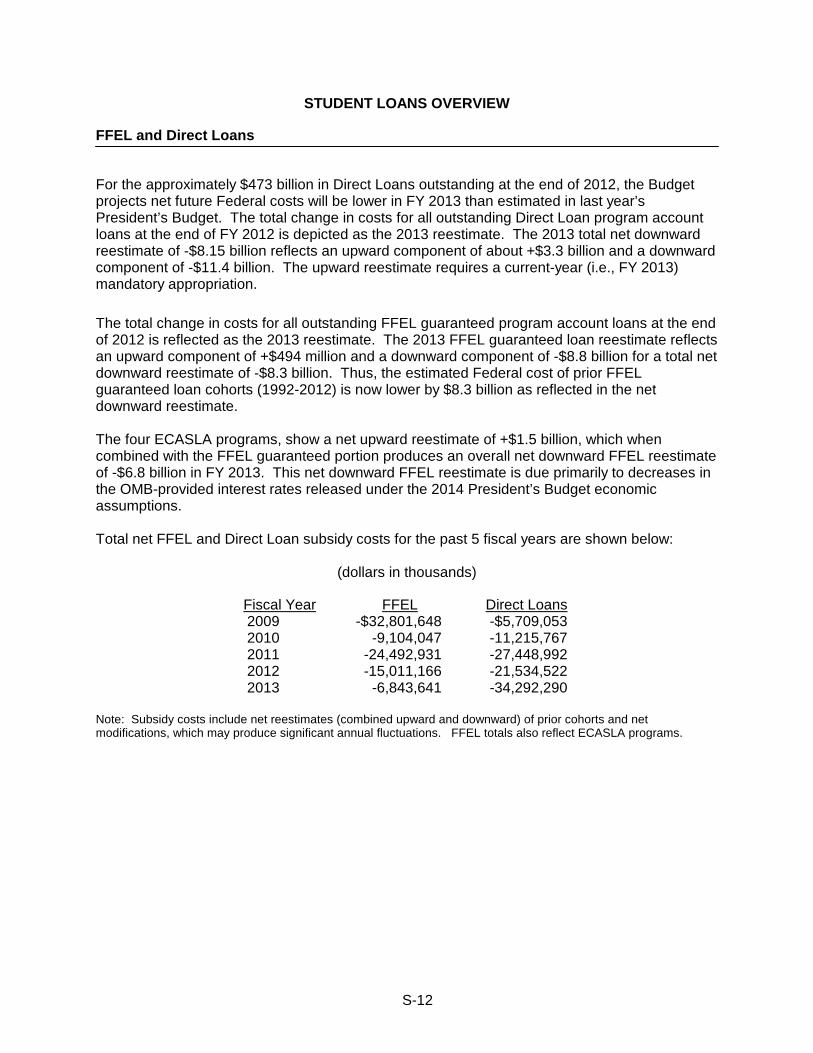
For the approximately $473 billion in Direct Loans outstanding at the end of 2012, the Budget projects net future Federal costs will be lower in FY 2013 than estimated in last year’s President’s Budget. The total change in costs for all outstanding Direct Loan program account loans at the end of FY 2012 is depicted as the 2013 reestimate. The 2013 total net downward reestimate of -$8.15 billion reflects an upward component of about +$3.3 billion and a downward component of -$11.4 billion. The upward reestimate requires a current-year (i.e., FY 2013) mandatory appropriation. The total change in costs for all outstanding FFEL guaranteed program account loans at the end of 2012 is reflected as the 2013 reestimate. The 2013 FFEL guaranteed loan reestimate reflects an upward component of +$494 million and a downward component of -$8.8 billion for a total net downward reestimate of -$8.3 billion. Thus, the estimated Federal cost of prior FFEL guaranteed loan cohorts (1992-2012) is now lower by $8.3 billion as reflected in the net downward reestimate. The four ECASLA programs, show a net upward reestimate of +$1.5 billion, which when combined with the FFEL guaranteed portion produces an overall net downward FFEL reestimate of -$6.8 billion in FY 2013. This net downward FFEL reestimate is due primarily to decreases in the OMB-provided interest rates released under the 2014 President’s Budget economic assumptions. Total net FFEL and Direct Loan subsidy costs for the past 5 fiscal years are shown below:
(dollars in thousands)
Fiscal Year FFEL Direct Loans 2009 -$32,801,648 -$5,709,053 2010 -9,104,047 -11,215,767 2011 -24,492,931 -27,448,992 2012 -15,011,166 -21,534,522 2013 -6,843,641 -34,292,290
Note: Subsidy costs include net reestimates (combined upward and downward) of prior cohorts and net modifications, which may produce significant annual fluctuations. FFEL totals also reflect ECASLA programs.
STUDENT LOANS OVERVIEW
FFEL and Direct Loans
S-13
FY 2014 BUDGET PROPOSAL Student Loan Reform Proposals The Administration proposes several student loan reforms in this FY 2014 Budget to help lower costs to student borrowers and improve loan system efficiencies. Highlights of key student loan proposals appear below. Change the Student Loan Interest Rate Structure The Administration’s FY 2014 Budget proposes to change the structure of interest rates on Federal student and parent loans to provide market-based rates tied to the 10-year Treasury note with specified basis point add-ons for each type of loan. Interest rates on new loans would depend on financial market conditions and be set at the beginning of each academic year for loans made in that year, but would remain fixed for the life of the loans. Interest rates would be set by adding a margin, or add-on, to the cost of Government borrowing to derive the fixed borrower rate for loans made during that academic year. Under the proposal, new rates for Subsidized Stafford loans would be set equal to the 10-year Treasury note with an add-on of 0.93 percentage points (i.e., 93 basis points). The add-on to the 10-year Treasury note for Unsubsidized Stafford and PLUS Loans would be 293 and 393 basis points, respectively. As a result of these add-ons, the proposal maintains the current policy of providing a lower rate on Subsidized Stafford loans, which are awarded based on the financial need of students and families, than on other Federal student and parent loans made regardless of need. The following example illustrates how the new interest rate structure would operate. For example, the 2014 Budget assumes the interest rate on the 10-year Treasury note is 1.97 percent. Under this scenario, the borrower interest rate on Subsidized Stafford Loans made in academic year 2013-2014 would be 2.90 percent (1.97% + 0.93% = 2.90%), while the rates on Unsubsidized Stafford Loans and PLUS Loans would be 4.90 percent (1.97% + 2.93% = 4.90%) and 5.90 percent (1.97% + 3.93% = 5.90%), respectively. Unlike the variable borrower rate structure that existed prior to 2006, rates would be fixed for the life of the loans and not vary from year to year. In addition, the proposal would eliminate the cap of 8.25 percent on new Consolidation Loans. Rather than proposing a cap on borrower rates, the Administration’s budget proposal seeks to guarantee student borrowers an affordable repayment option by extending the income-based Pay As You Earn (PAYE) repayment plan to all qualified student borrowers. This PAYE plan caps a borrower’s student loan monthly payment at 10 percent of the borrower’s discretionary income and limits the repayment period to 20 years. Put together, the Administration’s proposal to change the student loan interest rate structure and extend the Pay As You Earn repayment plan to all qualified student borrowers is budget cost neutral and, thereby, provides a long-term, sustainable solution to ensure students have the certainty they need to plan for the cost of attending college in a fiscally-responsible manner.
STUDENT LOANS OVERVIEW
FFEL and Direct Loans
S-14
Extend Pay As You Earn Repayment Plan to All Qualified Borrowers As noted above, the Administration’s FY 2014 student loan budget proposes to extend the President’s Pay As You Earn (PAYE) Repayment initiative to all qualified borrowers. The CCRAA of 2007 established the Income-Based Repayment (IBR) plan, which capped monthly loan repayments to help make them affordable based on borrowers’ income and family size. All Stafford, Grad PLUS, and Consolidation Loans made under either the Direct Loan or Federal Family Education Loan programs are eligible. Non-Federal loans, loans currently in default, and Parent PLUS Loans are not eligible for the IBR plan. The IBR program lowers monthly payments for borrowers who have high loan debt and modest incomes, but it may increase the length of the loan repayment period, accruing more interest over the life of the loan. Under CCRAA, monthly payment amounts under IBR were set at 15 percent of a borrower’s discretionary income, can never be more than the amount required under the 10-year standard repayment plan, and any outstanding balances remaining after 25 years of IBR repayments are forgiven. To further ensure that student debts are manageable, in 2010, SAFRA reduced monthly payments in IBR from 15 percent to 10 percent, and reduced the maximum length of repayment from 25 years to 20 years, after which any remaining balance is forgiven. SAFRA makes these more generous benefits available for new borrowers beginning July 1, 2014. In October 2011, the Administration announced an initiative—Pay As You Earn—to accelerate these features for qualified borrowers who were new borrowers as of October 1, 2007, and had received a Direct Loan disbursement on or after October 1, 2011. Qualified borrowers could apply to participate starting in December 2012. The Budget proposes to extend this PAYE plan, starting in FY 2014, to all qualified borrowers regardless of when borrowers obtained their loans, or became new borrowers, thereby harmonizing various income-based repayment options available to borrowers. Reconfigure the FFEL Loan Rehabilitation Program The Administration’s FY 2014 student loan budget proposes to reconfigure the FFEL Loan Rehabilitation Program to reduce costs for both the Federal Government and borrowers. Loan rehabilitation is an important option for borrowers because it means that a loan is no longer considered in default and the default status is removed from their credit report with the national credit bureaus. To rehabilitate a defaulted FFEL loan, a borrower must make 9 on-time, voluntary, reasonable and affordable full monthly payments (in an amount agreed to by the borrower and the agency) over a 10 consecutive month period to the guaranty agency. Once the borrower complies, the loan is eligible for rehabilitation and is considered rehabilitated when the guaranty agency sells the loan to an eligible FFEL lender, often at a price less than the outstanding balance of the loan.
STUDENT LOANS OVERVIEW
FFEL and Direct Loans
S-15
Under the Administration’s proposal, the maximum collection fee that guaranty agencies may charge borrowers to rehabilitate their defaulted FFEL loans would be reduced from 18.5 percent of the outstanding principal and interest owed on the loan at the time of sale to 16.0 percent; and, guaranty agencies would be required to return 100 percent--rather than 81.5 percent--of the Federal default reinsurance payment they received from the Federal Government when the borrower of the rehabilitated loan originally defaulted on the loan. In addition, guaranty agencies would be required to transfer rehabilitated loans to the Department if they are unable to find a FFEL lender to purchase the loan. Currently, when guaranty agencies rehabilitate defaulted FFEL loans, the agencies retain the 18.5 percent in collection costs charged to the borrower when the loan is rehabilitated through sale of the loan to an eligible lender. The 18.5 percent collection cost is charged regardless of the time the borrower remained in default or the actual cost incurred by the agency to collect the defaulted loan. In addition, guaranty agencies also retain 18.5 percent of the Federal default reinsurance payment the guaranty agency received from the Department when a borrower defaulted on the loan. Besides easing the financial burden on borrowers, the proposal to reduce the maximum collection fee charged to borrowers would make the compensation earned by guaranty agencies comparable to the compensation earned by the Department’s private sector contractors that rehabilitate defaulted FFEL and Direct Loan program loans held by the Department. Moreover, guaranty agencies would benefit from being able to transfer rehabilitated student loans to the Department rather than relying on private lenders who may not be interested in buying the loans at their full value. Under the proposal, the Department would compensate the guaranty agency for the defaulted loan at par, thus eliminating the costs of any discount currently being funded by guaranty agencies when loans are sold at less than par.
The savings from this proposal would be reinvested in the Pell Grant program, to help maintain the maximum award.
Modernize and Expand Perkins Loan Program Current annual loan limits in the Federal student loan programs are inadequate for some students. As a result, the 50-year-old Perkins Loan program has served as a supplementary source of low-interest loans. However, the program is too small and its current structure is inefficient and inequitable. Loans are serviced directly by institutions at considerable cost, and students at many institutions often have little or no access to the program. The Administration proposes reforming and expanding the current Perkins Loan program into a new Perkins Loan program which would provide up to $8.5 billion in new loan volume annually. As part of an overall campus-based aid reform, the Department would allocate loan volume in the program to those institutions that keep net tuition down, provide good value and serve financially-needy students effectively. Institutions would retain flexibility in awarding loans among their students and determining student eligibility. The Department would service the new Perkins Loans, as it does other Direct Loans. Under the Administration’s proposal, the Department would set the interest rate on Perkins Loans at the same annually determined, fixed interest rate as that proposed for Unsubsidized
STUDENT LOANS OVERVIEW
FFEL and Direct Loans
S-16
Stafford Loans: that is, interest rates would be determined each year based on the then-prevailing 10-year Treasury Note plus an add-on of 293 basis points. Loan amounts for both undergraduate and graduate students would remain the same as in the current Perkins program. To increase loan availability, interest on the loans would accrue while students are in school. The savings from this proposal would be reinvested in the Pell Grant program, to help maintain the maximum award. Modify Automatic Dialing System Procedures for Debt Collection The Budget proposes modifying current procedures regarding the use of automatic dialing systems and prerecorded voice messages to contact wireless phones in the collection of debt owed to or granted by the Federal Government. This approach would be consistent with proposed Federal Communications Commission policy allowing automatic dialing for land-line phones. The Department fully employs every available tool to assist borrowers in avoiding the negative consequences of default by offering numerous, affordable loan repayment options, including, for example, the Pay As You Earn and other income-based repayment plans. FY 2014 Estimated Loan Subsidy Cost For FY 2014, the Direct Loan program weighted average subsidy rate is estimated to be -18.99 percent. This reflects the projection that, on average, the Federal Government will earn 18.99 percent on each dollar of loans originated in FY 2014. The FY 2014 Budget for student loans is best understood in the context of the Administration’s proposals for the student aid programs as a whole. Accordingly, other student aid program-specific funding information and policy proposals are discussed further in the Student Aid Overview, beginning on page P-1 and in the Student Financial Assistance account, beginning on page Q-1.
STUDENT LOANS OVERVIEW
FFEL and Direct Loans
S-17
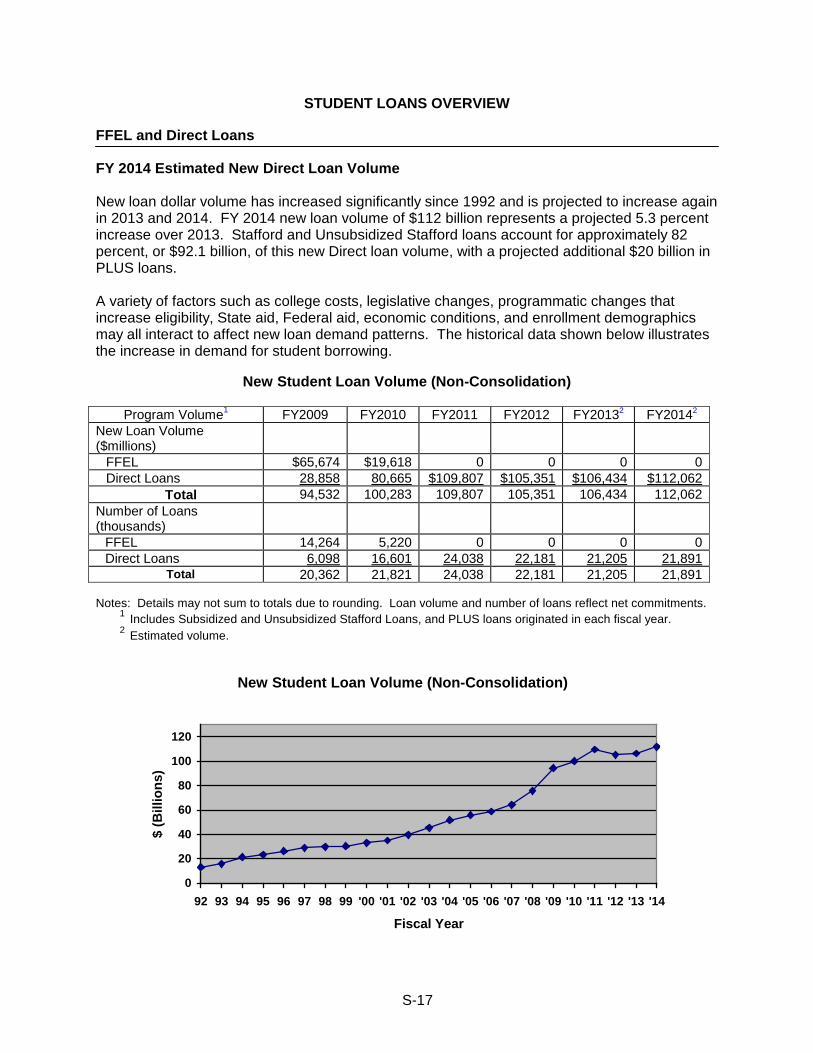
FY 2014 Estimated New Direct Loan Volume New loan dollar volume has increased significantly since 1992 and is projected to increase again in 2013 and 2014. FY 2014 new loan volume of $112 billion represents a projected 5.3 percent increase over 2013. Stafford and Unsubsidized Stafford loans account for approximately 82 percent, or $92.1 billion, of this new Direct loan volume, with a projected additional $20 billion in PLUS loans. A variety of factors such as college costs, legislative changes, programmatic changes that increase eligibility, State aid, Federal aid, economic conditions, and enrollment demographics may all interact to affect new loan demand patterns. The historical data shown below illustrates the increase in demand for student borrowing.
New Student Loan Volume (Non-Consolidation)
Program Volume1 FY2009 FY2010 FY2011 FY2012 FY20132 FY20142 New Loan Volume ($millions)
New Loan Volume: FFEL $65,674 $19,618 0 0 0 0 New Loan Volume: Direct Loans 28,858 80,665 $109,807 $105,351 $106,434 $112,062
New Loan Volume: Total 94,532 100,283 109,807 105,351 106,434 112,062 Number of Loans (thousands)
2008 2009 2010 2011 20121 20131
Number of loans: FFEL 14,264 5,220 0 0 0 0 Number of loans: Direct Loans 6,098 16,601 24,038 22,181 21,205 21,891
Number of loans: Total 20,362 21,821 24,038 22,181 21,205 21,891 Notes: Details may not sum to totals due to rounding. Loan volume and number of loans reflect net commitments.
1 Includes Subsidized and Unsubsidized Stafford Loans, and PLUS loans originated in each fiscal year. 2 Estimated volume.
New Student Loan Volume (Non-Consolidation)
0
20
40
60
80
100
120
92 93 94 95 96 97 98 99 '00 '01 '02 '03 '04 '05 '06 '07 '08 '09 '10 '11 '12 '13 '14
Fiscal Year
$ (B
illio
ns)
STUDENT LOANS OVERVIEW
FFEL and Direct Loans
S-18
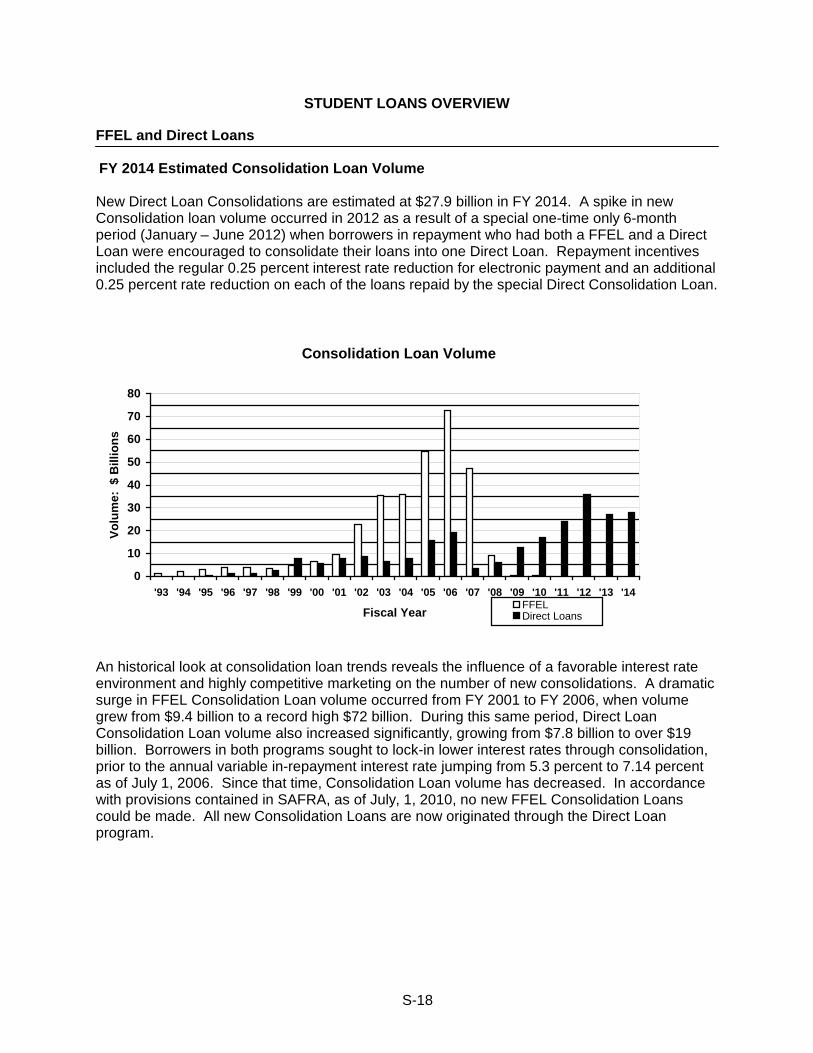
FY 2014 Estimated Consolidation Loan Volume New Direct Loan Consolidations are estimated at $27.9 billion in FY 2014. A spike in new Consolidation loan volume occurred in 2012 as a result of a special one-time only 6-month period (January – June 2012) when borrowers in repayment who had both a FFEL and a Direct Loan were encouraged to consolidate their loans into one Direct Loan. Repayment incentives included the regular 0.25 percent interest rate reduction for electronic payment and an additional 0.25 percent rate reduction on each of the loans repaid by the special Direct Consolidation Loan.
Consolidation Loan Volume
0
10
20
30
40
50
60
70
80
'93 '94 '95 '96 '97 '98 '99 '00 '01 '02 '03 '04 '05 '06 '07 '08 '09 '10 '11 '12 '13 '14
Fiscal Year
Volu
me:
$ B
illio
ns
FFELDirect Loans
An historical look at consolidation loan trends reveals the influence of a favorable interest rate environment and highly competitive marketing on the number of new consolidations. A dramatic surge in FFEL Consolidation Loan volume occurred from FY 2001 to FY 2006, when volume grew from $9.4 billion to a record high $72 billion. During this same period, Direct Loan Consolidation Loan volume also increased significantly, growing from $7.8 billion to over $19 billion. Borrowers in both programs sought to lock-in lower interest rates through consolidation, prior to the annual variable in-repayment interest rate jumping from 5.3 percent to 7.14 percent as of July 1, 2006. Since that time, Consolidation Loan volume has decreased. In accordance with provisions contained in SAFRA, as of July, 1, 2010, no new FFEL Consolidation Loans could be made. All new Consolidation Loans are now originated through the Direct Loan program.
STUDENT LOANS OVERVIEW
FFEL and Direct Loans
S-19
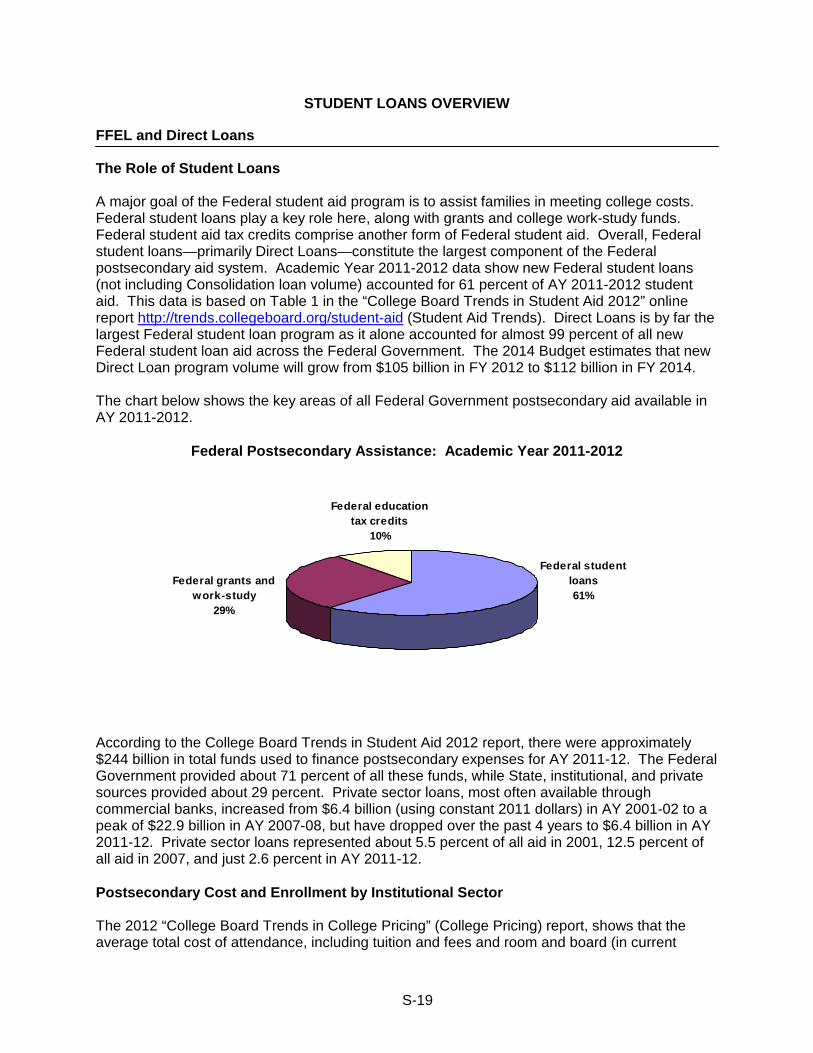
The Role of Student Loans A major goal of the Federal student aid program is to assist families in meeting college costs. Federal student loans play a key role here, along with grants and college work-study funds. Federal student aid tax credits comprise another form of Federal student aid. Overall, Federal student loans—primarily Direct Loans—constitute the largest component of the Federal postsecondary aid system. Academic Year 2011-2012 data show new Federal student loans (not including Consolidation loan volume) accounted for 61 percent of AY 2011-2012 student aid. This data is based on Table 1 in the “College Board Trends in Student Aid 2012” online report http://trends.collegeboard.org/student-aid (Student Aid Trends). Direct Loans is by far the largest Federal student loan program as it alone accounted for almost 99 percent of all new Federal student loan aid across the Federal Government. The 2014 Budget estimates that new Direct Loan program volume will grow from $105 billion in FY 2012 to $112 billion in FY 2014. The chart below shows the key areas of all Federal Government postsecondary aid available in AY 2011-2012.
Federal Postsecondary Assistance: Academic Year 2011-2012
Federal student loans61%
Federal education tax credits
10%
Federal grants and work-study
29%
According to the College Board Trends in Student Aid 2012 report, there were approximately $244 billion in total funds used to finance postsecondary expenses for AY 2011-12. The Federal Government provided about 71 percent of all these funds, while State, institutional, and private sources provided about 29 percent. Private sector loans, most often available through commercial banks, increased from $6.4 billion (using constant 2011 dollars) in AY 2001-02 to a peak of $22.9 billion in AY 2007-08, but have dropped over the past 4 years to $6.4 billion in AY 2011-12. Private sector loans represented about 5.5 percent of all aid in 2001, 12.5 percent of all aid in 2007, and just 2.6 percent in AY 2011-12. Postsecondary Cost and Enrollment by Institutional Sector The 2012 “College Board Trends in College Pricing” (College Pricing) report, shows that the average total cost of attendance, including tuition and fees and room and board (in current
STUDENT LOANS OVERVIEW
FFEL and Direct Loans
S-20
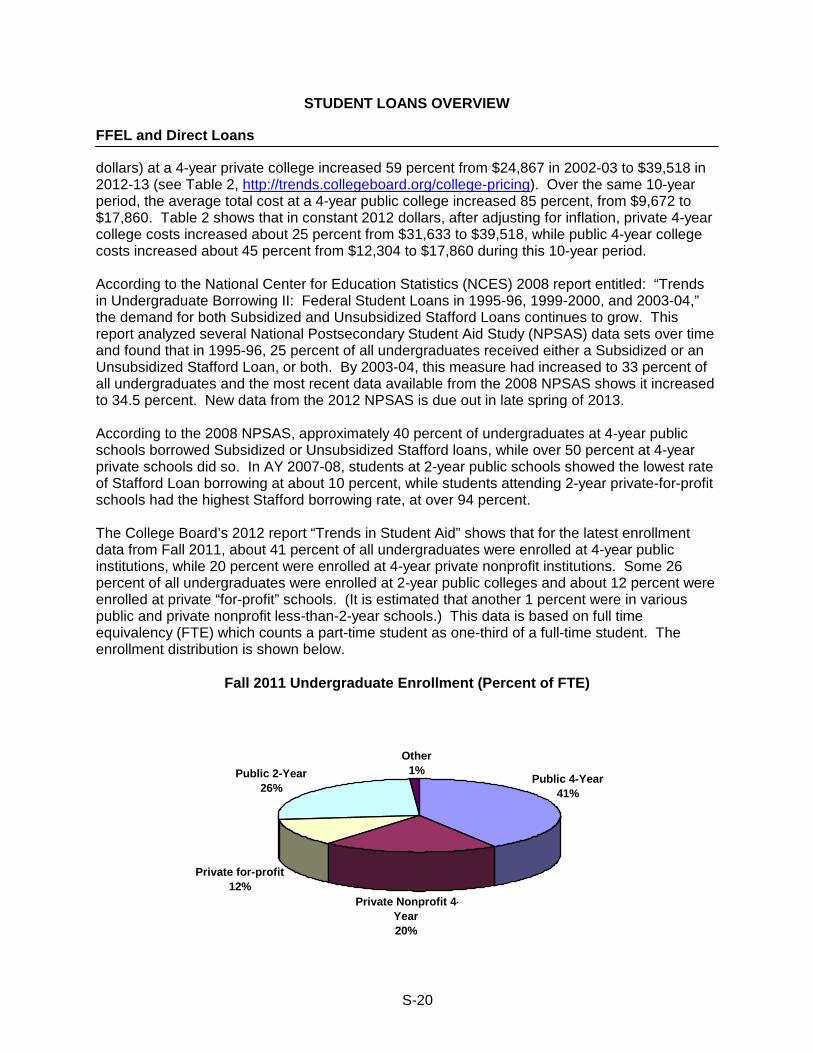
dollars) at a 4-year private college increased 59 percent from $24,867 in 2002-03 to $39,518 in 2012-13 (see Table 2, http://trends.collegeboard.org/college-pricing). Over the same 10-year period, the average total cost at a 4-year public college increased 85 percent, from $9,672 to $17,860. Table 2 shows that in constant 2012 dollars, after adjusting for inflation, private 4-year college costs increased about 25 percent from $31,633 to $39,518, while public 4-year college costs increased about 45 percent from $12,304 to $17,860 during this 10-year period. According to the National Center for Education Statistics (NCES) 2008 report entitled: “Trends in Undergraduate Borrowing II: Federal Student Loans in 1995-96, 1999-2000, and 2003-04,” the demand for both Subsidized and Unsubsidized Stafford Loans continues to grow. This report analyzed several National Postsecondary Student Aid Study (NPSAS) data sets over time and found that in 1995-96, 25 percent of all undergraduates received either a Subsidized or an Unsubsidized Stafford Loan, or both. By 2003-04, this measure had increased to 33 percent of all undergraduates and the most recent data available from the 2008 NPSAS shows it increased to 34.5 percent. New data from the 2012 NPSAS is due out in late spring of 2013. According to the 2008 NPSAS, approximately 40 percent of undergraduates at 4-year public schools borrowed Subsidized or Unsubsidized Stafford loans, while over 50 percent at 4-year private schools did so. In AY 2007-08, students at 2-year public schools showed the lowest rate of Stafford Loan borrowing at about 10 percent, while students attending 2-year private-for-profit schools had the highest Stafford borrowing rate, at over 94 percent. The College Board’s 2012 report “Trends in Student Aid” shows that for the latest enrollment data from Fall 2011, about 41 percent of all undergraduates were enrolled at 4-year public institutions, while 20 percent were enrolled at 4-year private nonprofit institutions. Some 26 percent of all undergraduates were enrolled at 2-year public colleges and about 12 percent were enrolled at private “for-profit” schools. (It is estimated that another 1 percent were in various public and private nonprofit less-than-2-year schools.) This data is based on full time equivalency (FTE) which counts a part-time student as one-third of a full-time student. The enrollment distribution is shown below.
Fall 2011 Undergraduate Enrollment (Percent of FTE)
Other1%
Public 4-Year41%
Private Nonprofit 4-Year20%
Private for-profit12%
Public 2-Year26%
STUDENT LOANS OVERVIEW
FFEL and Direct Loans
S-21
FFEL Liquidating Account The cost of FFEL student loan commitments made prior to fiscal year 1992 (the start of credit reform) is appropriated annually under indefinite authority in a Liquidating Account on a cash basis. This account does not issue any new loans, nor estimate loan-lifetime costs by cohort, and does not use a net present value calculation. The Liquidating Account pays pre-1992 student loan activities, such as loan default payments, special allowance payments, and interest benefits. Consequently, as default and in-school interest costs on these older loans decline over time, and recoveries on defaulted loans continue to be collected, annual revenues—also referred to as offsetting collections—will more than offset annual costs, resulting in negative program costs for which no new budget authority is needed. Based on the 2014 budget, total net outlays are estimated to be -$311 million in FY 2013 and -$244 million in FY 2014, a net budget savings. The portion of projected offsetting collections that exceeds program costs in each of these years is returned to the U.S. Treasury as a capital transfer. Federal Student Loan Reserve Fund The Higher Education Amendments (HEA) of 1998 clarified that reserve money held by public and non-profit guaranty agencies participating in the FFEL program are Federal property. These funds are used to pay default claims from FFEL lenders, as well as other claims related to death, disability, bankruptcy, and closed schools. The fund, commonly referred to as the Reserve Fund, also pays fees to support successful guaranty agency efforts to avert defaults. Federal payments reimbursing agencies for default claim payments are paid into these funds. The FY 2002 President’s Budget clarified that the Reserve Fund should be included on-budget. As required by law, the Reserve Fund returned $1.085 billion to the Treasury in FY 2002 under a scheduled recall of $1 billion in reserves mandated by the 1997 Balanced Budget Act, and an additional $85 million in reserves required to be returned by the Higher Education Amendments of 1998. The Reserve Fund began FY 2012 with an adjusted balance of about $1.7 billion. The Fund’s major revenues are primarily reinsurance payments from the Federal Government and its major expenses are insurance payments to lenders. These and other cash flows resulted in an ending balance in FY 2012 of about $1.3 billion that becomes the Reserve Fund starting position for FY 2013. Under SAFRA, which eliminated new FFEL loans starting July 1, 2010, the fund ceased to collect revenues related to new originations. Overall, the Reserve Fund annual account balances are projected to decrease in future years.
STUDENT LOANS OVERVIEW
FFEL and Direct Loans
S-22
PROGRAM OUTPUT MEASURES Direct Loans Loan Type FY 2012 FY 2013 FY 2014 Direct Stafford Loans: Direct Stafford: Loan volume (million $)1 $33,612 $28,645 $29,346 Direct Stafford Number of loans (in thousands) 9,911 8,941 9,153 Direct Stafford Average loan (whole $) 3,392 3,204 3,206 Direct Stafford Subsidy rate2 5.82% 3.31% 1.57%
Direct Unsubsidized Stafford Loans: Direct Unsubsidized:Loan volume (million $)1 $53,888 $59,186 $62,729 Direct Unsubsidized:Number of loans (in thousands) 10,924 10,973 11,420 Direct Unsubsidized:Average loan (whole $) 4,933 5,394 5,493 Direct Unsubsidized:Subsidy rate2 -28.30% -26.17% -27.56%
Direct PLUS Loans: Direct PLUS: Loan volume (million $)1 $17,851 $18,602 $19,987 Direct PLUS: Number of loans (in thousands) 1,347 1,291 1,318 Direct PLUS: Average loan (whole $) 13,256 14,410 15,169 Direct PLUS: Subsidy rate2 -33.29% -33.64% -37.12%
Direct Consolidation Loans: Direct Consolidation:Loan volume (million $)1 $35,964 $27,049 $27,938 Direct Consolidation:Number of loans (in thousands) 2,579 690 600 Direct Consolidation:Average loan (whole $) 13,946 39,201 46,537 Direct Consolidation:Subsidy rate2 -9.90% -11.56% -7.92%
Total Direct Loans: Total Di: Loan volume (million $)1 $141,316 $133,483 $140,000 Total Dire ct Number of loans (in thousands) 24,760 21,895 22,491 Total DirectAverage loan (whole $) 5,707 6,096 6,225
Subsidy Cost Total DirectNew loan subsidy cost (million $)3 -$27,101 -$26,141 -$29,173 Total Direct Subsidy Net Reestimate (million $)3 $5,566 -8,152 0 Total Direct Net Modification (million $)3 0 0 2,871 DL Total Net Subsidy (million $) -$21,535 -$34,292 -$26,301 Total Direct Subsidy rate2 -16.49% -17.94% -18.99%
Outstanding Loan Volume (billion $): Total Direct Loans Outstanding4 $473 $577 $679 NOTES: Details may not sum due to rounding. 1 Net commitments (disbursements) which are less than amounts committed (e.g., due to loan cancellations). 2 This rate generally reflects the Federal cost per new loan dollar. When negative, this rate indicates a net gain to the Federal Government. Reestimates and modifications are not reflected in the subsidy rate. 3 Subsidy amounts of existing loans are estimated on a net present value basis. Negative subsidy results in a net gain to the Federal Government. Net reestimates and modifications may reflect both upward and downward amounts— consistent with data on page S-1. 4 Reflects total Direct Loan principal (including consolidations) as end-of-year estimate.
STUDENT LOANS OVERVIEW
FFEL and Direct Loans
S-23
FFEL Program Loans In accordance with P.L. 111-152 (SAFRA), as of July 1, 2010, all new student loans originate through the Direct Loan program. Since there are no new FFEL loans, only the FFEL annual reestimates and in some cases, subsidy modifications, are presented below.
FFEL Loans
oan type FY 2012 FY 2013 FY 2014 Subsidy Cost Total FFEL Net subsidy cost (million $)1 0 0 0 Total FFESubsidy Net Reestimate (million $)1 -$15,164 -$6,844 0 Total FFEL Net Modification (million $)1 153 0 -$3,657 TFFEL Total Net Subsidy (million $) -$15,011 -$6,844 -3,657 Total FFEL Subsidy rate2 0 0 0
Outstanding Loan Volume (billion $): Outstanding: Total FFEL Loans $322 $288 $257 Outstanding: Total Liquidating Account Loans 6 6 6 Total Combined Outstanding3 328 294 263
NOTES: Details may not sum due to rounding.
1 Subsidy amounts of existing loans are estimated on a net present value basis. Net reestimates and modifications may reflect both upward and downward amounts— consistent with data on page S-1. 2 This rate generally reflects the Federal cost per new loan dollar. When negative, this rate indicates a net gain to the Federal Government. Reestimates and modifications are not reflected in the subsidy rate. 3 Reflects total FFEL and Liquidating account loan principal (including consolidations) as end of year estimate. Student Borrowing Students rely on the Federal loan programs to help close the gap between what their families can afford to pay (“estimated family contribution”) and the cost of attendance (including tuition, fees, and room and board). Based on the latest 2008 NPSAS, slightly over 60 percent of seniors who graduated in 2007-2008 from a 4-year institution reported borrowing a Federal loan at some point in their undergraduate studies. Data available from the 2008 NPSAS shows that for those students who borrowed, the average cumulative Stafford Loan debt (including subsidized and unsubsidized loans) owed by “graduating seniors” in 2007-2008 at 4-year undergraduate schools was $17,063. The average total debt reported, including private student loan debt, was $23,118. New data from the 2012 NPSAS is due out in late spring of 2013. The following table based on data from the 2008 NPSAS provides a snapshot of the average Federal and total debt (which could include private student loans) by Associate’s and Bachelor’s degrees and school sectors for students completing their educational programs in 2007-08. Debt levels may vary considerably by institutional sector and credential.
STUDENT LOANS OVERVIEW
FFEL and Direct Loans
S-24
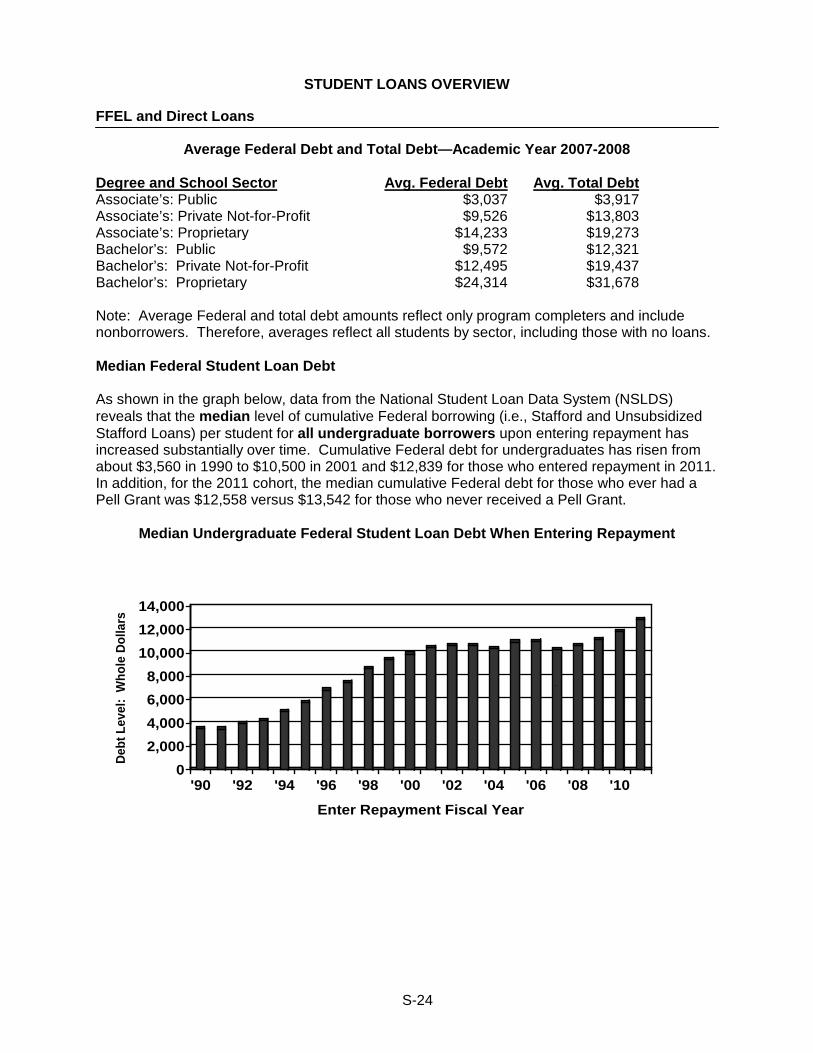
Average Federal Debt and Total Debt—Academic Year 2007-2008 Degree and School Sector Avg. Federal Debt Avg. Total Debt Associate’s: Public $3,037 $3,917 Associate’s: Private Not-for-Profit $9,526 $13,803 Associate’s: Proprietary $14,233 $19,273 Bachelor’s: Public $9,572 $12,321 Bachelor’s: Private Not-for-Profit $12,495 $19,437 Bachelor’s: Proprietary $24,314 $31,678 Note: Average Federal and total debt amounts reflect only program completers and include nonborrowers. Therefore, averages reflect all students by sector, including those with no loans. Median Federal Student Loan Debt As shown in the graph below, data from the National Student Loan Data System (NSLDS) reveals that the median level of cumulative Federal borrowing (i.e., Stafford and Unsubsidized Stafford Loans) per student for all undergraduate borrowers upon entering repayment has increased substantially over time. Cumulative Federal debt for undergraduates has risen from about $3,560 in 1990 to $10,500 in 2001 and $12,839 for those who entered repayment in 2011. In addition, for the 2011 cohort, the median cumulative Federal debt for those who ever had a Pell Grant was $12,558 versus $13,542 for those who never received a Pell Grant.
Median Undergraduate Federal Student Loan Debt When Entering Repayment
02,0004,0006,0008,000
10,00012,00014,000
Debt
Lev
el:
Who
le D
olla
rs
'90 '92 '94 '96 '98 '00 '02 '04 '06 '08 '10
Enter Repayment Fiscal Year
STUDENT LOANS OVERVIEW
FFEL and Direct Loans
S-25
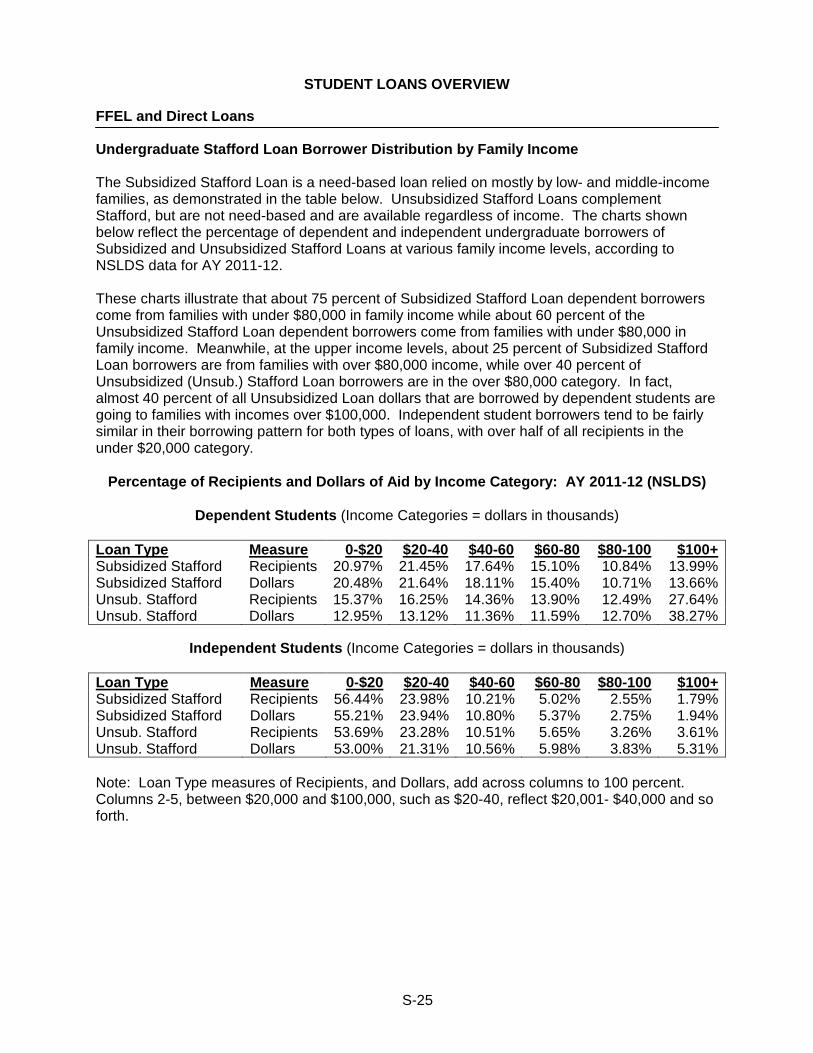
Undergraduate Stafford Loan Borrower Distribution by Family Income The Subsidized Stafford Loan is a need-based loan relied on mostly by low- and middle-income families, as demonstrated in the table below. Unsubsidized Stafford Loans complement Stafford, but are not need-based and are available regardless of income. The charts shown below reflect the percentage of dependent and independent undergraduate borrowers of Subsidized and Unsubsidized Stafford Loans at various family income levels, according to NSLDS data for AY 2011-12. These charts illustrate that about 75 percent of Subsidized Stafford Loan dependent borrowers come from families with under $80,000 in family income while about 60 percent of the Unsubsidized Stafford Loan dependent borrowers come from families with under $80,000 in family income. Meanwhile, at the upper income levels, about 25 percent of Subsidized Stafford Loan borrowers are from families with over $80,000 income, while over 40 percent of Unsubsidized (Unsub.) Stafford Loan borrowers are in the over $80,000 category. In fact, almost 40 percent of all Unsubsidized Loan dollars that are borrowed by dependent students are going to families with incomes over $100,000. Independent student borrowers tend to be fairly similar in their borrowing pattern for both types of loans, with over half of all recipients in the under $20,000 category.
Percentage of Recipients and Dollars of Aid by Income Category: AY 2011-12 (NSLDS)
Dependent Students (Income Categories = dollars in thousands)
Loan Type Measure 0-$20 $20-40 $40-60 $60-80 $80-100 $100+ Subsidized Stafford Recipients 20.97% 21.45% 17.64% 15.10% 10.84% 13.99% Subsidized Stafford Dollars 20.48% 21.64% 18.11% 15.40% 10.71% 13.66% Unsub. Stafford Recipients 15.37% 16.25% 14.36% 13.90% 12.49% 27.64% Unsub. Stafford Dollars 12.95% 13.12% 11.36% 11.59% 12.70% 38.27%
Independent Students (Income Categories = dollars in thousands)
Loan Type Measure 0-$20 $20-40 $40-60 $60-80 $80-100 $100+ Subsidized Stafford Recipients 56.44% 23.98% 10.21% 5.02% 2.55% 1.79% Subsidized Stafford Dollars 55.21% 23.94% 10.80% 5.37% 2.75% 1.94% Unsub. Stafford Recipients 53.69% 23.28% 10.51% 5.65% 3.26% 3.61% Unsub. Stafford Dollars 53.00% 21.31% 10.56% 5.98% 3.83% 5.31% Note: Loan Type measures of Recipients, and Dollars, add across columns to 100 percent. Columns 2-5, between $20,000 and $100,000, such as $20-40, reflect $20,001- $40,000 and so forth.
STUDENT LOANS OVERVIEW
FFEL and Direct Loans
S-26
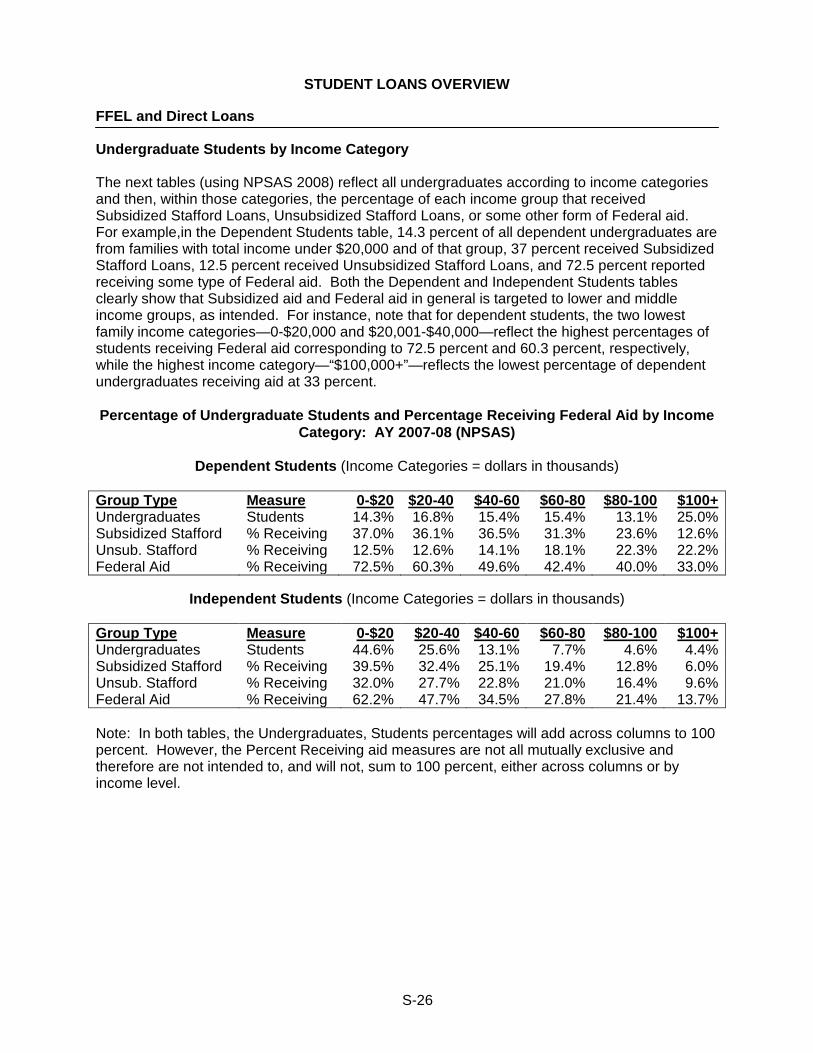
Undergraduate Students by Income Category The next tables (using NPSAS 2008) reflect all undergraduates according to income categories and then, within those categories, the percentage of each income group that received Subsidized Stafford Loans, Unsubsidized Stafford Loans, or some other form of Federal aid. For example,in the Dependent Students table, 14.3 percent of all dependent undergraduates are from families with total income under $20,000 and of that group, 37 percent received Subsidized Stafford Loans, 12.5 percent received Unsubsidized Stafford Loans, and 72.5 percent reported receiving some type of Federal aid. Both the Dependent and Independent Students tables clearly show that Subsidized aid and Federal aid in general is targeted to lower and middle income groups, as intended. For instance, note that for dependent students, the two lowest family income categories—0-$20,000 and $20,001-$40,000—reflect the highest percentages of students receiving Federal aid corresponding to 72.5 percent and 60.3 percent, respectively, while the highest income category—“$100,000+”—reflects the lowest percentage of dependent undergraduates receiving aid at 33 percent. Percentage of Undergraduate Students and Percentage Receiving Federal Aid by Income
Category: AY 2007-08 (NPSAS)
Dependent Students (Income Categories = dollars in thousands)
Group Type Measure 0-$20 $20-40 $40-60 $60-80 $80-100 $100+ Undergraduates Students 14.3% 16.8% 15.4% 15.4% 13.1% 25.0% Subsidized Stafford % Receiving 37.0% 36.1% 36.5% 31.3% 23.6% 12.6% Unsub. Stafford % Receiving 12.5% 12.6% 14.1% 18.1% 22.3% 22.2% Federal Aid % Receiving 72.5% 60.3% 49.6% 42.4% 40.0% 33.0%
Independent Students (Income Categories = dollars in thousands)
Group Type Measure 0-$20 $20-40 $40-60 $60-80 $80-100 $100+ Undergraduates Students 44.6% 25.6% 13.1% 7.7% 4.6% 4.4% Subsidized Stafford % Receiving 39.5% 32.4% 25.1% 19.4% 12.8% 6.0% Unsub. Stafford % Receiving 32.0% 27.7% 22.8% 21.0% 16.4% 9.6% Federal Aid % Receiving 62.2% 47.7% 34.5% 27.8% 21.4% 13.7%
Note: In both tables, the Undergraduates, Students percentages will add across columns to 100 percent. However, the Percent Receiving aid measures are not all mutually exclusive and therefore are not intended to, and will not, sum to 100 percent, either across columns or by income level.
STUDENT LOANS OVERVIEW
FFEL and Direct Loans
S-27
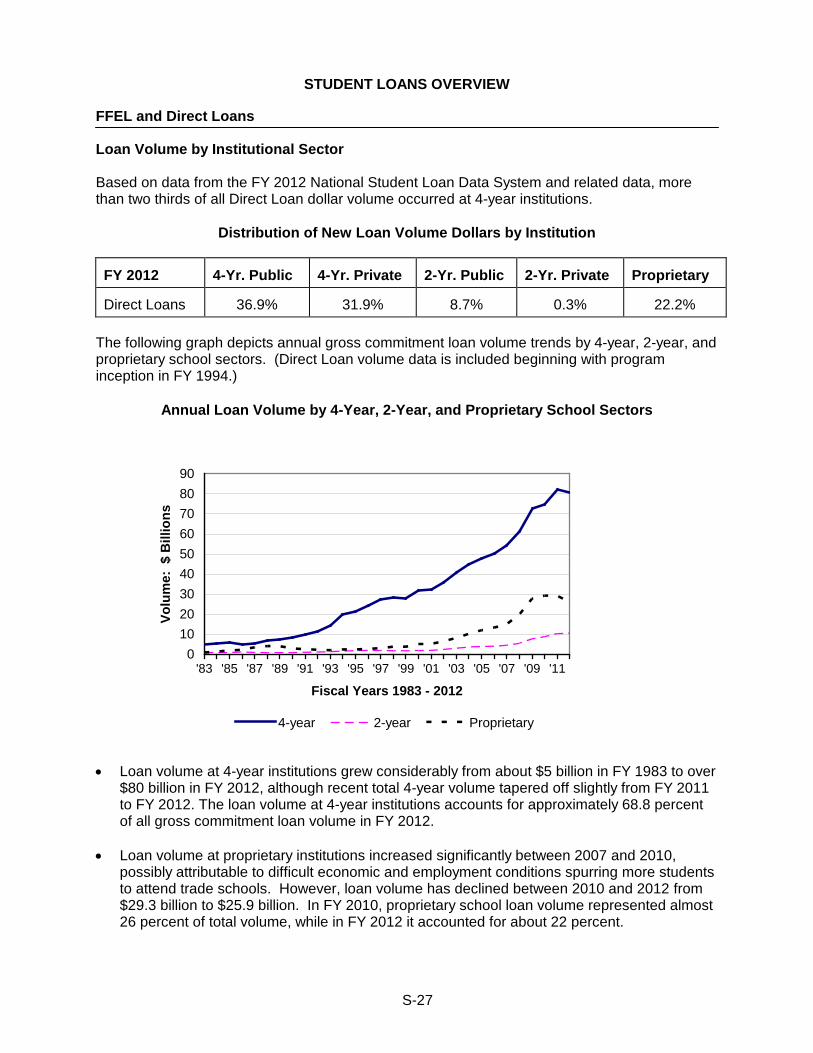
Loan Volume by Institutional Sector Based on data from the FY 2012 National Student Loan Data System and related data, more than two thirds of all Direct Loan dollar volume occurred at 4-year institutions.
Distribution of New Loan Volume Dollars by Institution
FY 2012
4-Yr. Public
4-Yr. Private
2-Yr. Public
2-Yr. Private
Proprietary
Direct Loans
36.9%
31.9%
8.7%
0.3%
22.2%
The following graph depicts annual gross commitment loan volume trends by 4-year, 2-year, and proprietary school sectors. (Direct Loan volume data is included beginning with program inception in FY 1994.)
Annual Loan Volume by 4-Year, 2-Year, and Proprietary School Sectors
0102030405060708090
'83 '85 '87 '89 '91 '93 '95 '97 '99 '01 '03 '05 '07 '09 '11
Fiscal Years 1983 - 2012
Volu
me:
$ B
illio
ns
4-year 2-year Proprietary
• Loan volume at 4-year institutions grew considerably from about $5 billion in FY 1983 to over
$80 billion in FY 2012, although recent total 4-year volume tapered off slightly from FY 2011 to FY 2012. The loan volume at 4-year institutions accounts for approximately 68.8 percent of all gross commitment loan volume in FY 2012.
• Loan volume at proprietary institutions increased significantly between 2007 and 2010,
possibly attributable to difficult economic and employment conditions spurring more students to attend trade schools. However, loan volume has declined between 2010 and 2012 from $29.3 billion to $25.9 billion. In FY 2010, proprietary school loan volume represented almost 26 percent of total volume, while in FY 2012 it accounted for about 22 percent.
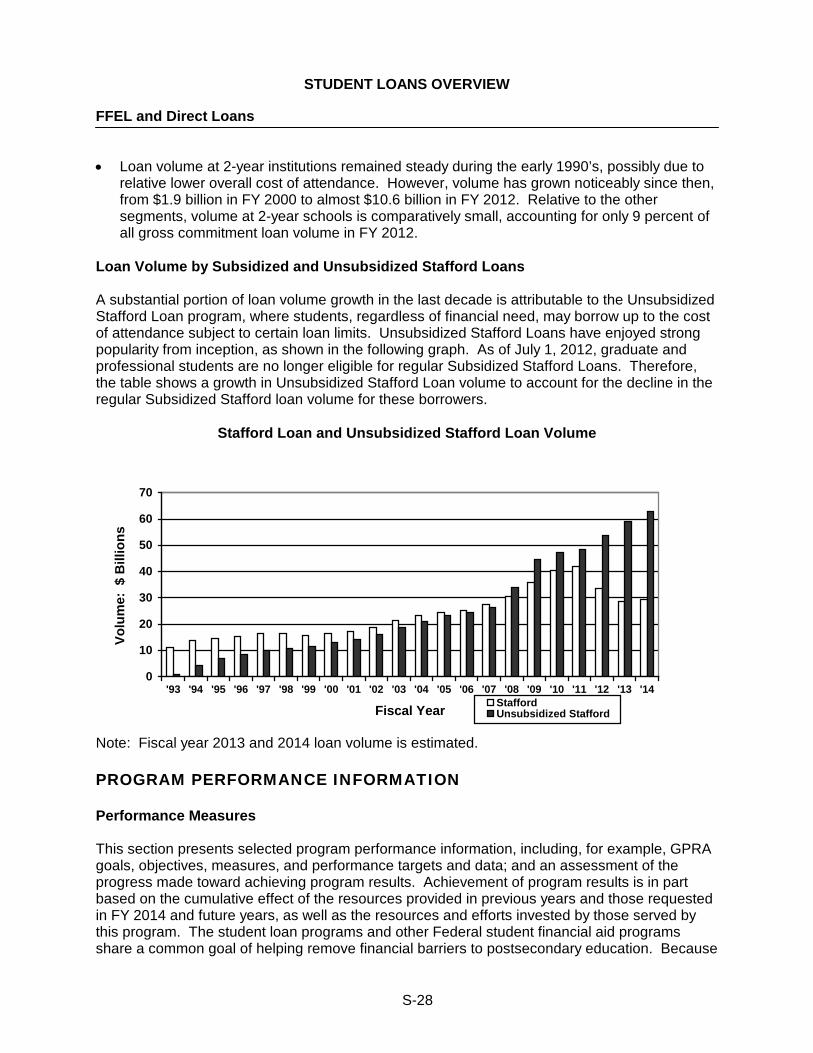
STUDENT LOANS OVERVIEW
FFEL and Direct Loans
S-28
• Loan volume at 2-year institutions remained steady during the early 1990’s, possibly due to
relative lower overall cost of attendance. However, volume has grown noticeably since then, from $1.9 billion in FY 2000 to almost $10.6 billion in FY 2012. Relative to the other segments, volume at 2-year schools is comparatively small, accounting for only 9 percent of all gross commitment loan volume in FY 2012.
Loan Volume by Subsidized and Unsubsidized Stafford Loans A substantial portion of loan volume growth in the last decade is attributable to the Unsubsidized Stafford Loan program, where students, regardless of financial need, may borrow up to the cost of attendance subject to certain loan limits. Unsubsidized Stafford Loans have enjoyed strong popularity from inception, as shown in the following graph. As of July 1, 2012, graduate and professional students are no longer eligible for regular Subsidized Stafford Loans. Therefore, the table shows a growth in Unsubsidized Stafford Loan volume to account for the decline in the regular Subsidized Stafford loan volume for these borrowers.
Stafford Loan and Unsubsidized Stafford Loan Volume
0
10
20
30
40
50
60
70
'93 '94 '95 '96 '97 '98 '99 '00 '01 '02 '03 '04 '05 '06 '07 '08 '09 '10 '11 '12 '13 '14
Fiscal Year
Volu
me:
$ B
illio
ns
StaffordUnsubsidized Stafford
Note: Fiscal year 2013 and 2014 loan volume is estimated. PROGRAM PERFORMANCE INFORMATION Performance Measures This section presents selected program performance information, including, for example, GPRA goals, objectives, measures, and performance targets and data; and an assessment of the progress made toward achieving program results. Achievement of program results is in part based on the cumulative effect of the resources provided in previous years and those requested in FY 2014 and future years, as well as the resources and efforts invested by those served by this program. The student loan programs and other Federal student financial aid programs share a common goal of helping remove financial barriers to postsecondary education. Because
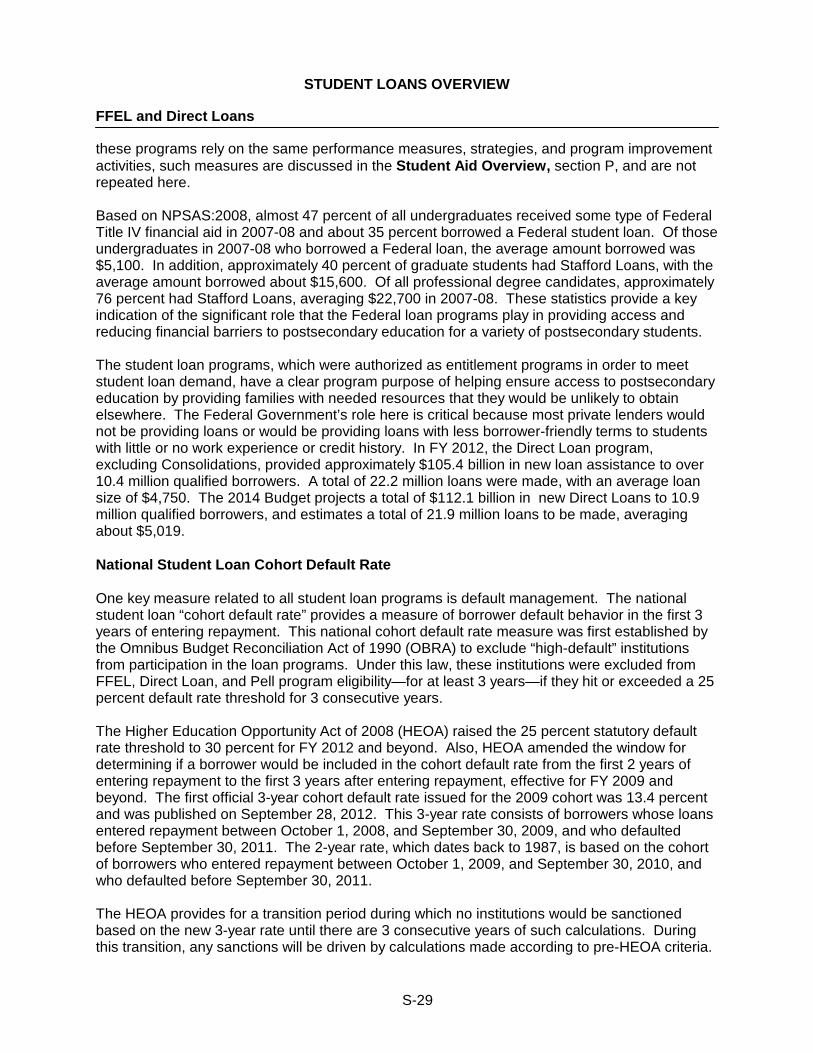
STUDENT LOANS OVERVIEW
FFEL and Direct Loans
S-29
these programs rely on the same performance measures, strategies, and program improvement activities, such measures are discussed in the Student Aid Overview, section P, and are not repeated here. Based on NPSAS:2008, almost 47 percent of all undergraduates received some type of Federal Title IV financial aid in 2007-08 and about 35 percent borrowed a Federal student loan. Of those undergraduates in 2007-08 who borrowed a Federal loan, the average amount borrowed was $5,100. In addition, approximately 40 percent of graduate students had Stafford Loans, with the average amount borrowed about $15,600. Of all professional degree candidates, approximately 76 percent had Stafford Loans, averaging $22,700 in 2007-08. These statistics provide a key indication of the significant role that the Federal loan programs play in providing access and reducing financial barriers to postsecondary education for a variety of postsecondary students. The student loan programs, which were authorized as entitlement programs in order to meet student loan demand, have a clear program purpose of helping ensure access to postsecondary education by providing families with needed resources that they would be unlikely to obtain elsewhere. The Federal Government’s role here is critical because most private lenders would not be providing loans or would be providing loans with less borrower-friendly terms to students with little or no work experience or credit history. In FY 2012, the Direct Loan program, excluding Consolidations, provided approximately $105.4 billion in new loan assistance to over 10.4 million qualified borrowers. A total of 22.2 million loans were made, with an average loan size of $4,750. The 2014 Budget projects a total of $112.1 billion in new Direct Loans to 10.9 million qualified borrowers, and estimates a total of 21.9 million loans to be made, averaging about $5,019. National Student Loan Cohort Default Rate One key measure related to all student loan programs is default management. The national student loan “cohort default rate” provides a measure of borrower default behavior in the first 3 years of entering repayment. This national cohort default rate measure was first established by the Omnibus Budget Reconciliation Act of 1990 (OBRA) to exclude “high-default” institutions from participation in the loan programs. Under this law, these institutions were excluded from FFEL, Direct Loan, and Pell program eligibility—for at least 3 years—if they hit or exceeded a 25 percent default rate threshold for 3 consecutive years. The Higher Education Opportunity Act of 2008 (HEOA) raised the 25 percent statutory default rate threshold to 30 percent for FY 2012 and beyond. Also, HEOA amended the window for determining if a borrower would be included in the cohort default rate from the first 2 years of entering repayment to the first 3 years after entering repayment, effective for FY 2009 and beyond. The first official 3-year cohort default rate issued for the 2009 cohort was 13.4 percent and was published on September 28, 2012. This 3-year rate consists of borrowers whose loans entered repayment between October 1, 2008, and September 30, 2009, and who defaulted before September 30, 2011. The 2-year rate, which dates back to 1987, is based on the cohort of borrowers who entered repayment between October 1, 2009, and September 30, 2010, and who defaulted before September 30, 2011. The HEOA provides for a transition period during which no institutions would be sanctioned based on the new 3-year rate until there are 3 consecutive years of such calculations. During this transition, any sanctions will be driven by calculations made according to pre-HEOA criteria.
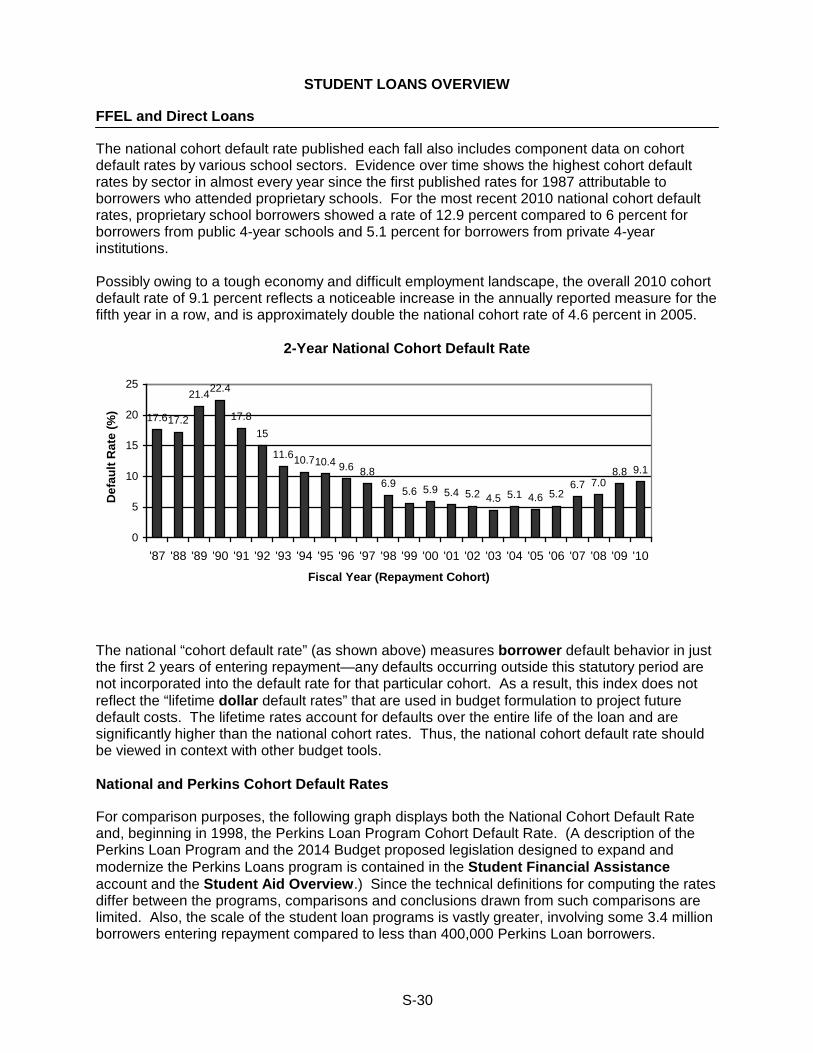
STUDENT LOANS OVERVIEW
FFEL and Direct Loans
S-30
The national cohort default rate published each fall also includes component data on cohort default rates by various school sectors. Evidence over time shows the highest cohort default rates by sector in almost every year since the first published rates for 1987 attributable to borrowers who attended proprietary schools. For the most recent 2010 national cohort default rates, proprietary school borrowers showed a rate of 12.9 percent compared to 6 percent for borrowers from public 4-year schools and 5.1 percent for borrowers from private 4-year institutions. Possibly owing to a tough economy and difficult employment landscape, the overall 2010 cohort default rate of 9.1 percent reflects a noticeable increase in the annually reported measure for the fifth year in a row, and is approximately double the national cohort rate of 4.6 percent in 2005.
2-Year National Cohort Default Rate
17.617.2
21.422.4
17.815
11.610.710.4 9.6 8.86.9
5.6 5.9 5.4 5.2 4.5 5.1 4.6 5.26.7 7.0
8.8 9.1
0
5
10
15
20
25
'87 '88 '89 '90 '91 '92 '93 '94 '95 '96 '97 '98 '99 '00 '01 '02 '03 '04 '05 '06 '07 '08 '09 '10
Fiscal Year (Repayment Cohort)
Def
ault
Rat
e (%
)
The national “cohort default rate” (as shown above) measures borrower default behavior in just the first 2 years of entering repayment—any defaults occurring outside this statutory period are not incorporated into the default rate for that particular cohort. As a result, this index does not reflect the “lifetime dollar default rates” that are used in budget formulation to project future default costs. The lifetime rates account for defaults over the entire life of the loan and are significantly higher than the national cohort rates. Thus, the national cohort default rate should be viewed in context with other budget tools. National and Perkins Cohort Default Rates
For comparison purposes, the following graph displays both the National Cohort Default Rate and, beginning in 1998, the Perkins Loan Program Cohort Default Rate. (A description of the Perkins Loan Program and the 2014 Budget proposed legislation designed to expand and modernize the Perkins Loans program is contained in the Student Financial Assistance account and the Student Aid Overview.) Since the technical definitions for computing the rates differ between the programs, comparisons and conclusions drawn from such comparisons are limited. Also, the scale of the student loan programs is vastly greater, involving some 3.4 million borrowers entering repayment compared to less than 400,000 Perkins Loan borrowers.
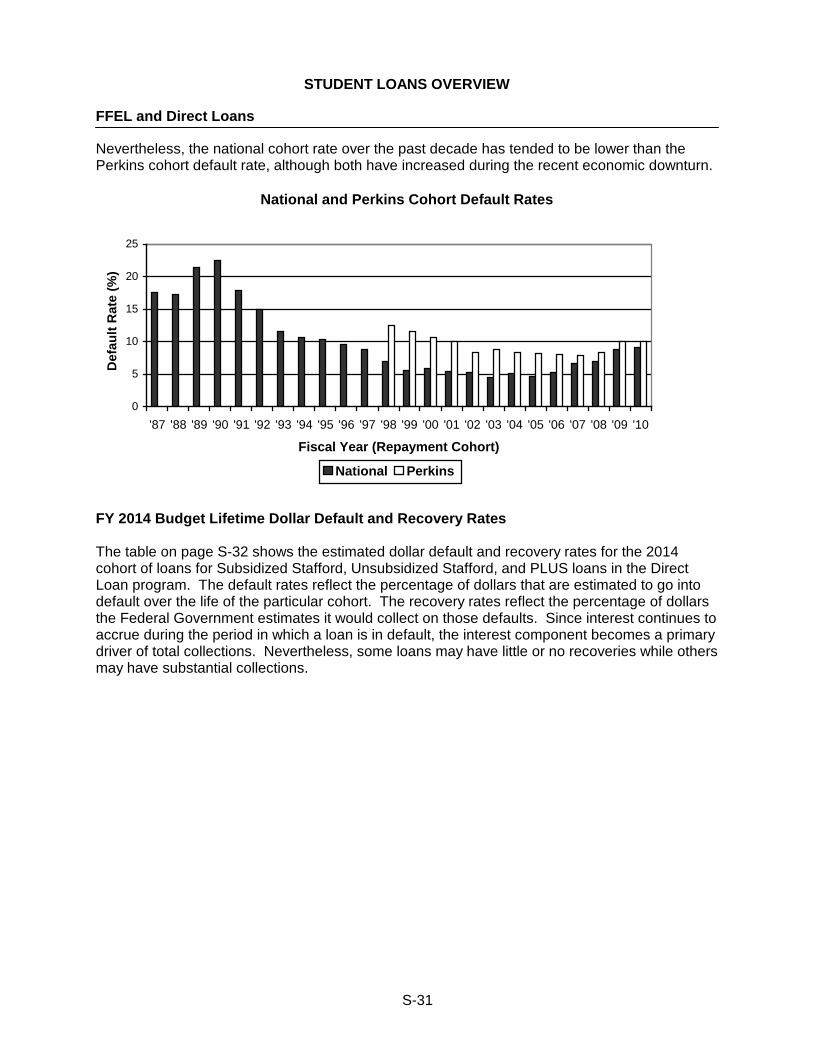
STUDENT LOANS OVERVIEW
FFEL and Direct Loans
S-31
Nevertheless, the national cohort rate over the past decade has tended to be lower than the Perkins cohort default rate, although both have increased during the recent economic downturn.
National and Perkins Cohort Default Rates
0
5
10
15
20
25
'87 '88 '89 '90 '91 '92 '93 '94 '95 '96 '97 '98 '99 '00 '01 '02 '03 '04 '05 '06 '07 '08 '09 '10
Fiscal Year (Repayment Cohort)
Def
ault
Rat
e (%
)
National Perkins
FY 2014 Budget Lifetime Dollar Default and Recovery Rates The table on page S-32 shows the estimated dollar default and recovery rates for the 2014 cohort of loans for Subsidized Stafford, Unsubsidized Stafford, and PLUS loans in the Direct Loan program. The default rates reflect the percentage of dollars that are estimated to go into default over the life of the particular cohort. The recovery rates reflect the percentage of dollars the Federal Government estimates it would collect on those defaults. Since interest continues to accrue during the period in which a loan is in default, the interest component becomes a primary driver of total collections. Nevertheless, some loans may have little or no recoveries while others may have substantial collections.
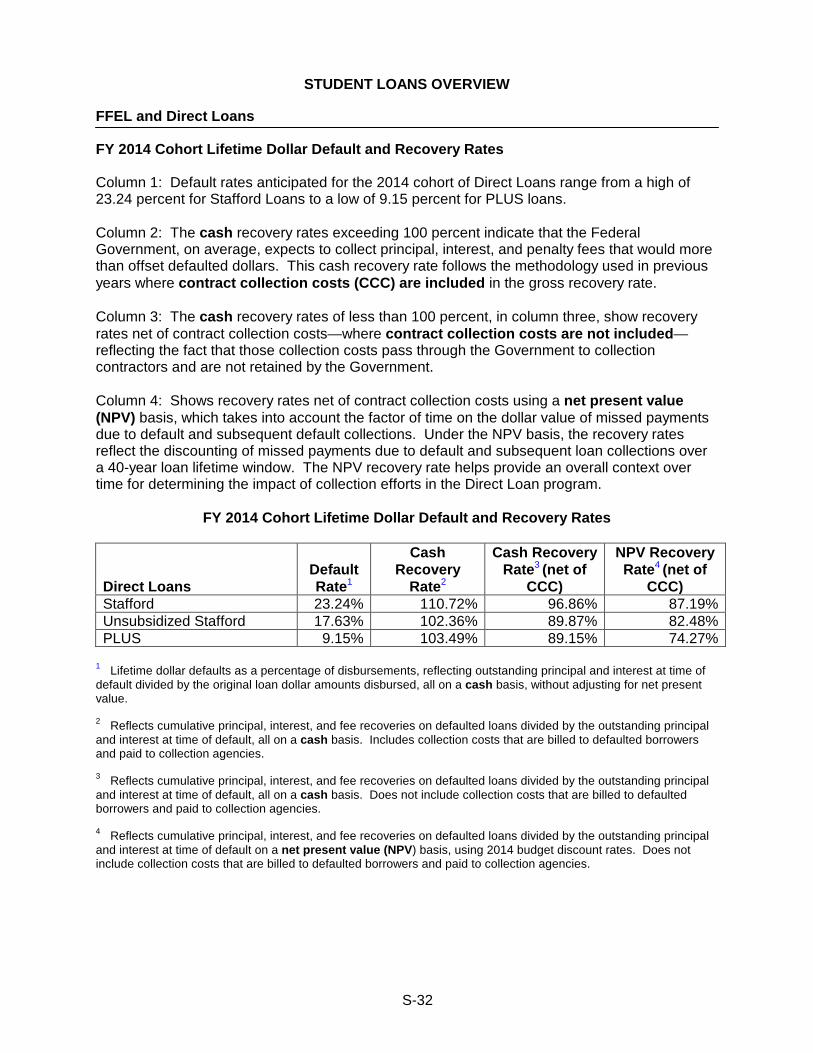
STUDENT LOANS OVERVIEW
FFEL and Direct Loans
S-32
FY 2014 Cohort Lifetime Dollar Default and Recovery Rates Column 1: Default rates anticipated for the 2014 cohort of Direct Loans range from a high of 23.24 percent for Stafford Loans to a low of 9.15 percent for PLUS loans. Column 2: The cash recovery rates exceeding 100 percent indicate that the Federal Government, on average, expects to collect principal, interest, and penalty fees that would more than offset defaulted dollars. This cash recovery rate follows the methodology used in previous years where contract collection costs (CCC) are included in the gross recovery rate. Column 3: The cash recovery rates of less than 100 percent, in column three, show recovery rates net of contract collection costs—where contract collection costs are not included—reflecting the fact that those collection costs pass through the Government to collection contractors and are not retained by the Government. Column 4: Shows recovery rates net of contract collection costs using a net present value (NPV) basis, which takes into account the factor of time on the dollar value of missed payments due to default and subsequent default collections. Under the NPV basis, the recovery rates reflect the discounting of missed payments due to default and subsequent loan collections over a 40-year loan lifetime window. The NPV recovery rate helps provide an overall context over time for determining the impact of collection efforts in the Direct Loan program.
FY 2014 Cohort Lifetime Dollar Default and Recovery Rates
Direct Loans Default Rate1
Cash Recovery
Rate2
Cash Recovery Rate3 (net of
CCC)
NPV Recovery Rate4 (net of
CCC) Stafford 23.24% 110.72% 96.86% 87.19% Unsubsidized Stafford 17.63% 102.36% 89.87% 82.48% PLUS 9.15% 103.49% 89.15% 74.27%
1 Lifetime dollar defaults as a percentage of disbursements, reflecting outstanding principal and interest at time of default divided by the original loan dollar amounts disbursed, all on a cash basis, without adjusting for net present value. 2 Reflects cumulative principal, interest, and fee recoveries on defaulted loans divided by the outstanding principal and interest at time of default, all on a cash basis. Includes collection costs that are billed to defaulted borrowers and paid to collection agencies. 3 Reflects cumulative principal, interest, and fee recoveries on defaulted loans divided by the outstanding principal and interest at time of default, all on a cash basis. Does not include collection costs that are billed to defaulted borrowers and paid to collection agencies. 4 Reflects cumulative principal, interest, and fee recoveries on defaulted loans divided by the outstanding principal and interest at time of default on a net present value (NPV) basis, using 2014 budget discount rates. Does not include collection costs that are billed to defaulted borrowers and paid to collection agencies.