Embed Size (px)
Citation preview

Department of Family ServicesEmployment & Training Team Report
June 2020
• Pages 1-2: Workforce Innovation and Opportunity Act Program
• Page 3: Workforce Innovation and Opportunity Act/ Other Grants
• Page 4: Fairfax Alternative Incarceration Branch (AIB) Center
• Page 5: ITA and OJT Breakdown
• Page 6: Northern Virginia IT Employment (NVITE) Partnership
• Page 7: Senior Community Service Employment Program (SCSEP)
• Page 8: Economic Equity Initiative (EEI)- Prince William Regional/Adult
Detention Center (PWRADC)

Center Visits 34,039 Total Participants 722
Unique One-Stop Visits 15,859 WIOA Job Placements 295 Total Enrolled 743
One-Stop Job Placements 234 Average Hourly Wage at Placement (Adult) $18.85 Total Exited 396
Average Hourly Wage at Placement $16.86 Average Hourly Wage at Placement (DW) $36.44 Total Job Placements 311
* Data represents visits between July 1, 2019 - February 29, 2020. Average Hourly Wage at Placement (Youth) $12.03 Total Participants with Disabilities 134
Reporting will resume when VCW centers reopen after COVID-19 Credentials Received in PY19 201 Total Veterans 31
Pandemic. Credentials Received at Closure 180
Page 1
At-A-GlanceOne-Stop Services* WIOA Services (Youth/Adult/DW) All Employment & Training Programs
WIOA Breakdown - Adult, Dislocated Worker and Youth
Northern Virginia Workforce Development Area, LWDA XIWIOA Adult, Dislocated Worker, and Youth Statistics (July 1, 2019-June 30, 2020)
*IWT not included, see Page 3 for Data
34,039
15,85916,390
5,416
10,553
5,8303,529
1,666
0
5,000
10,000
15,000
20,000
25,000
30,000
35,000
Total number of visits Unique Visits
One-Stop Visits
Consortium Wide
Fairfax County
Prince William County
Loudoun County
722
368
295342
189146
183
94 77
159
70 6138
15 110
100
200
300
400
500
600
700
800
Enrolled Exited Job Placements
WIOA Cumulative (Adult, DW, Youth)
Consortium Wide
Fairfax County
Prince William County
Loudoun County
Cherokee Ave
189
366
86
175
48
77
48
83
731
0
50
100
150
200
250
300
350
400
DW Enrolled Adult Enrolled
WIOA Enrollments
Consortium Wide
Fairfax County
Prince William County
Loudoun County
Cherokee Ave
9283
182
147
40 36
99
75
28 2533 30
20 20
39 33
4 211 9
0
25
50
75
100
125
150
175
200
DW Exited DW ExitedPlacements
Adult Exited Adult ExitedPlacements
WIOA Exits and Placements
Consortium Wide
Fairfax County
Prince William County
Loudoun County
Cherokee Ave

Page 2
$35,287
$73,904
$0
$10,000
$20,000
$30,000
$40,000
$50,000
$60,000
$70,000
$80,000
Adult Dislocated
WIOA Average Annual Salary at Placement
167
94
65
81
5035
58
3322
28
11 8
0
25
50
75
100
125
150
175
Enrolled Exited Exited Placements
WIOA Youth
Consortium Wide
Fairfax County
Prince William County
Loudoun County
Cherokee Ave
$18.85
$36.44
$0.00
$5.00
$10.00
$15.00
$20.00
$25.00
$30.00
$35.00
$40.00
Adult Dislocated
WIOA Average Hourly Wage at Placement
1
10
1
40
4
11
68
49
20
10
20
30
40
50
60
70
WIOA Credential by Industry (at Closure)Accounting/Finance
Clerical/Administrative
Construction/Trade
Entrepreneurship
Education
Healthcare
Hospitality/Service
Management/Business
Technology
Transportation
HS Diploma/GED (duplicated)
153
27
159
42
0
20
40
60
80
100
120
140
160
Adult/DW Youth
WIOA Credential Attainment
Credentials at Closure
Credential Total PY19
Page 3
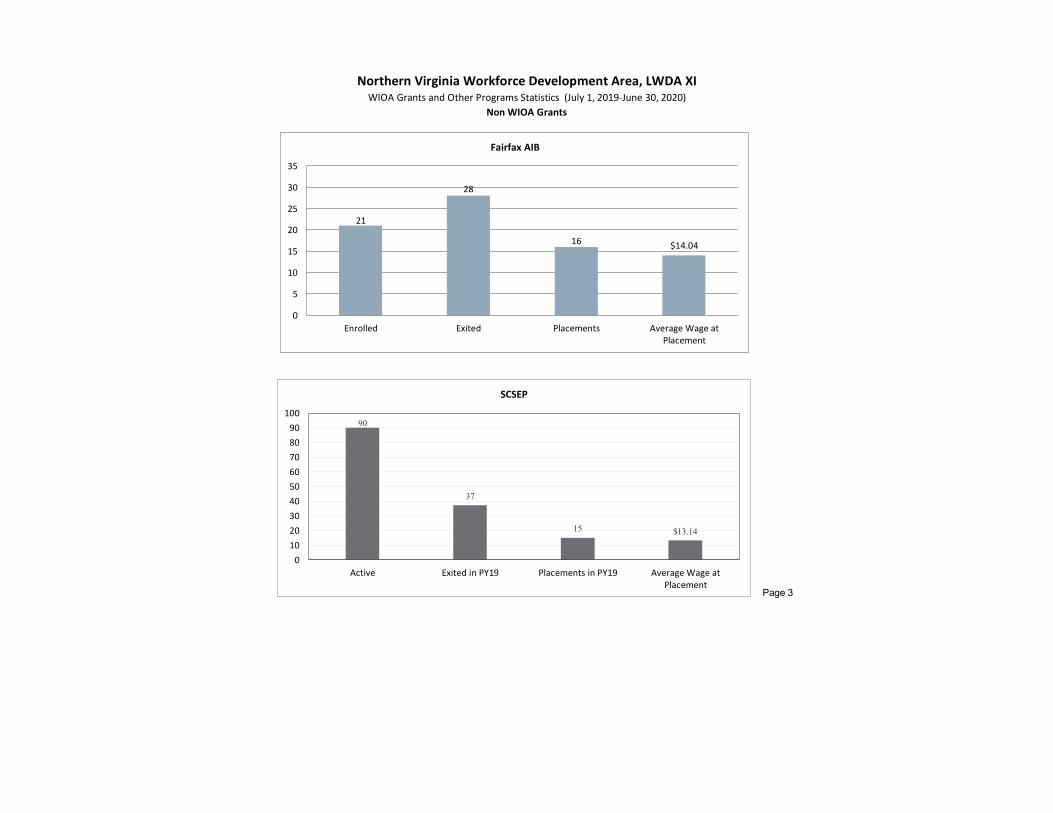
Northern Virginia Workforce Development Area, LWDA XIWIOA Grants and Other Programs Statistics (July 1, 2019-June 30, 2020)
Non WIOA Grants
21
28
16 $14.04
0
5
10
15
20
25
30
35
Enrolled Exited Placements Average Wage atPlacement
Fairfax AIB
90
37
15 $13.14
0
10
20
30
40
50
60
70
80
90
100
Active Exited in PY19 Placements in PY19 Average Wage atPlacement
SCSEP

Jul-19 Aug-19 Sep-19 Oct-19 Nov-19 Dec-19 Jan-20 Feb-20 Mar-20 Apr-20 May-20 Jun-20
Enrolled 4 2 2 3 2 2 0 2 2 0 0 0
Placed in Employment 0 3 2 2 3 1 2 2 1 0 0 0
Exited 1 5 2 2 3 7 3 2 0 3 0 0
Employed at Exit 1 5 0 1 3 7 3 2 0 2 0 0
Unemployed at Exit 0 0 2 1 0 0 0 0 0 1 0 0
Currently Employed 8 6 8 9 9 3 2 2 3 1 1 1
Average Hourly Wage $13.91 $14.18 $13.93 $14.06 $13.95 $14.16 $14.02 $14.27 $13.87 $13.97 $14.00 $14.17
Cumulative
Enrolled 938
Non-Exited Placements 133
Exited 790 Recidivism Rate 8%
Unemployed at Exit 127
Employed at Exit 657
Insured by Federal Bonding 68
Total Bonding Value $340,000
Total On the Job Trainings 29
On the Job Training Expenditures $62,628
Re-Offended 74
Sample of Monthly Placements
Positions
Laborer
Crew
Laundry Attendant Page 4I&L Laundry $9.00
Shirley Contracting
Employers
Chipotle
Fairfax AIB (Alternative Incarceration Branch) Center
Monthly Report
Wage
$12.00
$10.75
38%
0%3%
21%
0%
35%3%
OJT Occupational Training
Trades
Technology
Admin
Service
Transportation
Retail
Food Svc
0% 5%1%
20%
52%
7%
15%0%
Employment by Industry
Admin.
Construction
Hospitality
Retail
Food
Trades
Service
Healthcare
3
94
62
99
82 85
65 64
75 74
4538
0
20
40
60
80
100
120
2008 2009 2010 2011 2012 2013 2014 2015 2016 2017 2018 2019
Placements by Fiscal Year (July - June)

Number Percent Number Percent
Accounting/Finance (AF) $9,667 0 0.00% 4 1.94% 4
Clerical / Administrative (CA) $8,808 6 22.22% 6 2.91% 12
Construction / Trade (CT) $8,898 0 0.00% 4 1.94% 4
Education (Ed) $2,385 0 0.00% 1 0.49% 1
Healthcare (He) $113,663 18 66.67% 29 14.08% 47
Hospitality / Services (HS) $6,440 1 3.70% 1 0.49% 2
Literacy Activities (LA) $0 0 0.00% 0 0.00% 0
Management/Business (MB) $40,495 0 0.00% 24 11.65% 24
Technology (Tech) $190,696 1 3.70% 85 41.26% 86
Transportation (Tr) $157,000 1 3.70% 52 25.24% 53
Others $0 0 0.00% 0 0.00% 0
TOTAL $538,052 $0 27 100.00% 206 100.00% 233
AF: bookkeeping He: medical, dental, pet health
CA: Administrative Certificate, MS Office Certificate HS: food, design, massage, hair
CT: HVAC, plumbing, electric Tech: information technology
Ed: teaching, childcare Tr: CDL ( A & B or endorsement)
LA: ESL, basic computer MB: government contracts, HR, project management
ITA Obligated by GrantsTraining
Amount
OJT /WEX
Amount
WIOA Adult $338,322 $0
WIOA Dislocated $141,066 $0
WIOA Youth $58,663 $2,850
TOTAL $538,052 $2,850
TOTAL
Number Percent Number Percent
Accounting/Finance (AF) $0 0 0.00% 0 0.00% 0
Clerical / Administrative (CA) $0 0 0.00% 0 0.00% 0
Construction / Trade (CT) $2,850 1 100% 0 0.00% 1
Education (Ed) $0 0 0.00% 0 0.00% 0
Healthcare (He) $0 0 0.00% 0 0.00% 0
Hospitality / Services (HS) $0 0 0.00% 0 0.00% 0
Literacy Activities (LA) $0 0 0.00% 0 0.00% 0
Management/Business (MB) $0 0 0.00% 0 0.00% 0
Technology (Tech) $0 0 0.00% 0 0.00% 0
Transportation (Tr) $0 0 0.00% 0 0.00% 0
TOTAL $2,850 1 100.00% 0 0.00% 1 Page 5
BREAKDOWN REPORT ON ITAS AND OJTS July 1, 2019 -June 30, 2020
ITAs / INDUSTRY
OJTs &WEX / INDUSTRY
TOTAL Obligated
Funds
WIOA YOUTH WIOA ADULT/DWAdditional
Training
Expenses
WIOA YOUTH
TOTAL
OJT Obligated by Grants
WIOA Adult
WIOA DW
Youth
WIOA A/WIOA DWObligated
Funds

NVITE Eligible Clients Identified Jul'19 Aug '19 Sept '19 Oct '19 Nov ' 19 Dec '19 Jan '20 Feb '20 Mar '20 Apr '20 May'20 June'20
NVITE Active Participants 22 22 22 22 22 22 24 24 26 26 26 26
Non-WIOA Participants 0 0 0 1 3 0 1 0 0 0 0 0
Enrolled in Occupational Training
(technically related)22 22 22 22 22 22 24 24 26 26 26 26
Technically Related Trainings: IT, Electronic Health Records, Medical
Billing and Coding
Attained Certification 0 0 6 7 8 9 10 10 6 8 8 8
Referred to OJT 0 0 0 0 1 0 0 0 0 0 0 0
Entered OJT 0 0 0 0 1 0 0 0 0 0 0 0
Retained OJT Employment (Unique) 0 0 0 0 0 0 0 0 0 0 0 0
NVITE Participant Exits 0 1 3 5 6 8 8 11 14 14 14
Entered IT-Related Employment 0 1 1 2 3 3 3 3 5 5 5
Entered non-IT Related Employment 0 0 1 1 1 2 2 8 5 5 5
Average Unsubsidized Wage $27.00 $28.03 $20.00 $19.00 $23.33 $30.00 $28.49 $28.49 $25.78 $25.05 $25.05 $25.05
Employers Contacted 16 35 49 32 20 16 15 14 12 14 12 15
Employer Commitments Received 0 0 0 0 1 0 0 0 0 0 0 $0.00
Page 6
NVITE Monthly Report
Northern Virginia Workforce Area #11
Demographics
White, 50%Black, 50%
0% 0% 0%0% 0%
Ethnicity
Female50%
Male50%
Gender
HS Diploma
50%
Some Post-Secondary
50%
Participant Educational Attainment
< 50 Employees100%
Size of Participating Business

SCSEP Eligible Clients Identified Jul-19 Aug-19 Sep-19 Oct-19 Nov-19 Dec-19 Jan-20 Feb-20 Mar-20 Apr-20 May-20 Jun-20
SCSEP Active Participants Each Month 64 58 50 53 53 57 63 73 88 89 94 90
Participants on LWOP 0 1 0 0 1 2 3 2 1 0 3 1
New SCSEP Enrollments 1 0 0 6 3 5 10 12 19 2 5 0
Average Age of Enrolled 66 66 65 66 65 66 66 65 65 65 65 65
New SCSEP Applicants 7 11 15 35 22 11 15 9 3 5 4 8
Referred to Identified Host Site 2 2 3 9 8 7 4 7 0 0 0 1
Exited from Program 7 6 8 3 3 1 1 2 2 1 0 3
Exited with Placement 4 1 1 1 2 1 0 2 1 1 0 1
Average Employed Wage $ 13.61 $ 12.89 $ 12.74 $ 12.74 $ 12.88 $ 11.62 $ 11.25 $ 12.63 $ 13.24 $ 13.46 $ 13.46 $ 13.14
Active Host Site Agencies 32 32 32 33 32 32 33 31 31 31 31 31
Host Site Agencies with Slots x x x x x 12 14 12 NA NA NA 2
Number of Avalable Slots x x x x x 19 21 17 NA NA NA 3
Potential Host Site Agencies Contacted 14 13 5 53 5 6 9 19 7 0 0 0
Referral from WIOA One Stop Centers 3 0 7 13 10 5 64 7 3 1 1 1
Dual Enrolled with WIOA 0 0 0 0 0 1 0 0 1 0 1 0
na
Page 7
Demographics
Northern Virginia Workforce Area #11 SCSEP Monthly Report
6%
35%
4%14%
32%
1%8%
Educational Attainment
GED
High School Diploma
Master's Degree
Bachelors
Some College
Not reported
Less than High School
61%
39%
Gender
Female
Male
15%
51%0%
16%
7%
Ethnicity
White
Black
Hispanic
Hispanic/Latino
Native Americans
Asian
Other
45%
15%
8%
24%
1%
5%
2%
County of Residence
Fairfax
Arlington
Prince William
Alexandria City
Page County
Faquier County
Loudoun

Column1Sep-19 -
Jan-20Feb-20 Mar-20 Apr-20 May-20 Jun-20 Jul-20 Aug-20 Sep-20 Oct-20 Cummulative
Total Center Visits_
141 43 0 0 0 184
Unique Center Visits_
32 9 0 0 0 41
Total Placements_
19 5 1 0 0 25
Wages at Placements_
$ 12.43 $ 17.18 $ 13.00 _ _
$13.55
Enrolled in EEI Only_ _
2 1 0 0 3
EEI Entered Employment_ _
0 0 0 0 0
EEI Exited_ _
0 0 0 0 0
EEI Wages at Exit_ _ _ _ _ _ _
Enrolled in WIOA* 8 2 3 3 0 1 17
Entered WIOA-funded Training 3 0 0 0 0 1 4
Received a Credential 0 0 0 1 0 0 1
WIOA Entered Employment 0 0 0 0 1 0 1
WIOA Exited 0 0 0 0 1 0 1
WIOA Employed at Exit 0 0 0 0 1 0 1
WIOA Wages at Exit_ _ _ _
$18.00_
$18.00
Page 8
Northern Virginia Workforce Area XI
Demographics of EEI and WIOA Enrolled
*All WIOA clients are also enrolled in EEI
Monthly Report
Prince William - Manassas Regional ADC Job Center Economic Equity Initiative (EEI)
Less than High School10%
High School Diploma
55%
Some College 25%
Bachelor's Degree10%
Beyond Bachelor's
Degree0%
Educational Attainment
Female40%
Male60%
Gender
White25%
Black45%
Hispanic20%
Black & Hispanic/Latino
0%
Native Americans0%
Asian0%
No Answer10%
Other0%
Ethnicity
18-2450%
25-295%
30-3420%
35-395%
40-445%
45-4915%
50-540%
55+0%
Age