Embed Size (px)
Citation preview

w w w . d f a t . g o v. a u / e a a u
D E PA R T M E N T O F F O R E I G N A F F A I R S A N D T R A D E

© Commonwealth of Australia 2000
This work is copyright. Apart from any use permitted under the Copyright Act 1968, no part may be
reproduced by any process without prior written permission from the East Asia Analytical Unit. Requests
and inquiries concerning reproduction and rights should be addressed to the Executive Director,
East Asia Analytical Unit, Department of Foreign Affairs and Trade, RG Casey Building, John McEwen
Crescent, Barton ACT 0221.
Austrade contributed to the cost of producing this report.
National Library of Australia Cataloguing-in-Publication data: 13 September 2000
Accessing Middle East Growth: Business Opportunities in the Arabian Peninsula and Iran.
Bibliography
Includes index
ISBN 0 642 47659 4
ISBN 0 642 47660 8 (CD Rom)
1. Investments, Foreign Arabian Peninsula. 2. Investments, Foreign - Iran.
3. Business Enterprises - Arabian Peninsula. 4. Business Enterprises - Iran.
332.6730953
Design by Green Advertising 13442

A c k n o w l e d g e m e n t s
P A G E III
ACKNOWLEDGEMENTS
This report was directed by William Brummitt, Director, East Asia Analytical Unit, assisted by James
Bloomfield, Deputy Director. Dr Frances Perkins, Executive Director, provided advice and oversight.
Initial project design was by Richard Begley, Deputy Director. Nathan Backhouse provided research
and administrative assistance.
Australian diplomatic missions in the Persian Gulf region provided invaluable assistance in producing
this report, coordinating East Asia Analytical Unit visits to the region and providing data. At the Australian
Embassy Abu Dhabi, United Arab Emirates, we thank HE John Hines, Ambassador; Brett Farmer,
First Secretary; Muatasim Babakerali, Researcher and Policy Analyst; and Nicole Van Hattem,
Executive Assistant. In Riyadh, we thank HE George Atkin, Ambassador; Jeremy Bruer, Deputy
Head of Mission; and Jamil Hanna, Second Secretary. At the Australian Embassy, Tehran, Iran, we
thank HE Stuart Hume, Ambassador; Chris Brettingham-Moore, Second Secretary (Economic); David
Windsor and Miranda Sissons, Third Secretaries (Political); and Mahnia Vakilzadeh, Economic Researcher.
Austrade’s network of posts in the Persian Gulf also provided invaluable assistance, advice and
administrative support. We thank Roger Bayliss, Executive General Manager at Austrade’s Middle
East and Indian Ocean Regional Office, Dubai, United Arab Emirates. At the Australian Consulate
General, Dubai, (managed by Austrade), we thank Julie Bayliss, Senior Trade Commissioner and
Consul General; Susan Kahwati, Trade Commissioner; Greg Coelho and Afaq Hussein. In Riyadh,
we thank Damien Fisher, Senior Trade Commissioner; and in Tehran, we thank Ian Davey, Senior
Trade Commissioner. We also thank Peter Deacon, Executive Director of the Victorian Government
Business Office in Dubai, and also acting Chairman of Australian Business in the Gulf, ABIG, for his
invaluable comments, and assistance in developing East Asia Analytical Unit contacts in the region.
Within the Department of Foreign Affairs and Trade in Canberra, Pamela Fayle, Deputy Secretary;
Jane Drake Brockman, Assistant Secretary, Middle East and Africa Branch; Bob Bowker, Director;
Steve Hill, Executive Officer; and Tony Grenenger, Desk Officer Middle East Section, provided valuable
comments and assistance.
Within Austrade, Canberra, we thank Jim Enright, Manager, Middle East and Indian Ocean Office;
Matthew Gray, who provided the initial draft of Chapter 3; and Ghassan Zarifeh.
The East Asia Analytical Unit wishes to acknowledge the valuable contribution made by the following
consultants: Dr Helen Cabalu, Curtin University; Professor Rodney Wilson, Durham University;
Brendan Millane, Key Economics; and Matthew Gray, Austrade.
We thank the Australia Arab Chamber of Commerce and Industry, in particular Syd Giller, National
President; Don Moore, Victorian President; Tony Knight, Executive Director; Maggie Bunton, National
Director and President of the Western Australian branch; and Rex McCashney, past president, for
their valuable assistance with comments and contacts. We also thank Charles Stott, Chairman,
Australia Iran Chamber of Commerce and Industry for his assistance.
A C C E S S I N G T H E M I D D L E E A S T
B U S I N E S S O P P O R T U N I T I E S I N T H E A R A B I A N P E N I N S U L A A N D I R A N
P A G E IV
We thank the Ambassador of the United Arab Emirates to Australia, HE Khalifa Bakhit Al-Falasi and
K. Sheikh Hassani, Deputy Chief of Mission, Embassy of the Islamic Republic of Iran to Australia for
their information and assistance.
Australian company managers, located in Australia who provided valuable assistance and material
include Thomas Harley, Vice President, Mergers, Acquisitions and Divestments, BHP Petroleum;
Charles Stott, General Manager, International Marketing and Phillip Hughes, Account Manager, Middle
East, Africa and Europe, AWB Limited; Bob McGowage, Queensland Sugar Corporation; Dr Glen
Simpson and Gordon Matthews of SAGRIC International; Jack Beighton, Managing Director, and
Paul De Angelis, Supervisor, Trade Finance, Arab Bank; Glenn Baxter, Cargo Manager, Australia
and New Zealand, Emirates SkyCargo; Geoff Walls, Clipsal; James Cook, Finance Director, Pacifica
Group Limited; Roger Peacock, Vice President, University Development, University of Melbourne;
Peter Elton, General Manager, Raywood Communications; and Ralph Stevenson and Robert Branson,
Export Managers, Holden Limited.
Special thanks also are due to the following people in the Gulf region who gave time to be interviewed
by the East Asia Analytical Unit, or supplied material, information or insights.
In Abu Dhabi we thank:
HE Abdullah Al-Turifi, Assistant Undersecretary, International Economic Affairs, Department of
Commerce and the Economy; HE Mohamad Omar Abdullah, Director General, Rashed Tarish Al-
Qubaisi, Director, Information and Trade Relations, Essam S Azar, Head, International Trade and
Promotion Section, Riad Khaleel Mattar, Head of Data Bank Section, Abu Dhabi Chamber of Commerce
and Industry; Dr Abdallah Mograby, Head of Policy, HE the President’s Office; A.I. Jaffer, Assistant
Corporate Director, Barclays Bank; Waleed Hashem, Executive Director, Talal Abu-Ghazaleh and
Co; Andrew Garrett, Director, Assurance and Business Advisory Services, PricewaterhouseCoopers;
Dr Mohamad Amerah, Economic Adviser, Ministry of Economy and Commerce; Graham John Pirnie,
Counsellor and Deputy Head of Mission, British Embassy; Matthew Koch, First Secretary, US Embassy;
Anthony Billingsley, Supervisor, Public Relations, Higher Colleges of Technology; Yawar Mian, Gulf
Correspondent, Middle East Economic Digest; C. Nicholas Cochrane-Dyet, Deputy BP Chief
Representative and Local Relations Manager, BP Amoco; Dr Ilyas Halil, Senior Manager, and Martin
Harrison, Senior Investment Adviser, Treasury Department, Abu Dhabi Investment Authority; Mahmoud
Najjar, Statistician, Ministry of Planning; Sameh Masry, Managing Director, United General Agencies;
Carlos Obeid, UAE Offsets Group; and Abed Allah Usama Malki, Economic Adviser, UAE Central Bank.
In Dubai we thank:
Ram Menen, Senior General Manager Cargo, Emirates Airlines; Mohamad A. Azab, Senior Vice
President, Arab Bank; Arun Nangia, Regional General Manager, Darren Rickards, Senior Manager,
Corporate and Iran, and Eli Chahin, Relationship Manager, Corporate Banking, ANZ Grindlays Bank;
John Ferguson, UAE Area Manager, Nasa Multiplex LLC, Regional Manager; Barrie Harmsworth,
Managing Partner, Al Mutawie General Trading; Peter Sadler, Regional Manager, Novus Petroleum;
Peter Nankervis, Senior Manager, International Equity Sales, Securities and Gavin Rezos, Investment
Banking Director, HSBC Financial Services Middle East Limited; Pieter Stor, Vice President and
Head of Structured Finance Gulf, Tom C. Zwaan, Deputy Country Manager, and Radhika Gore,

A c k n o w l e d g e m e n t s
P A G E V
Analyst, Structured Finance, ABN AMRO Bank; Ralph Shipley, Director, Banking Services, Macro
Corporation, Marwan Bibi, Regional Manager, Middle East and Africa, Bonlac Foods Limited; Tim
Howe, Managing Director, Al Gaith and Co, Public Accountants; John Rummery, General Manager,
Diner’s Club International; Robin Allen, Gulf Correspondent, Financial Times; Cheryl Crosswaith,
Intersearch; Sarah Shouman, Consultant, Australian Agency for Education and Training; Angela
Daniels, Corporate Services Manager, Arabian Gulf Network; Lindsay Courtis, Manager Middle East
and Edward Griffiths, Clough Engineering; Steven Allen, Sales Manager, Rydges Plaza Dubai Hotel;
and Paul Stewart, Sales and Technical Manager, Boral Plasterboard.
In Sharjah we thank:
Sheik Tarik Al Turifi, Deputy Director General, Hamriyah Free Zone; L. Samuel, Managing Director,
Clipsal Middle East.
In Riyadh we thank:
Beshr Bakheet, Managing Partner, Bakheet Financial Advisers; Brad Bourland, Chief Economist,
Saudi American Bank; Abdulmajeed A. Mobarak, Senior Vice President, Riyad Bank; John Moran,
Counsellor and Jack Tucker, Second Secretary, US Embassy; and Bob Craig, Minister-Counsellor
and Ian Shaw, Second Secretary, Canadian Embassy.
In Tehran we thank:
HE Mohamad Roohisefat, former Ambassador to Australia and currently Director-General for
Coordination of Foreign Economic Relations, Ministry of Foreign Affairs; Aziz Farashi, Director General
International Finance, Central Bank of Iran; Kohei Okada, First Secretary and Satoshi Ueki, Second
Secretary, Embassy of Japan; Adrian Bedford, Counsellor, Commercial, British Embassy; Fereydoun
Behnam, Manager, ANZ Grindlays Representative Office; Babak Pasha, Vice President, Dynaway
Corporation; Nazila Fathi, New York Times; Siavash Bakhtiari, Iran Office Manager, BHP Petroleum;
Reza Momoyezadeh, BHP Minerals; Shun Oda, Tomen Iran Limited; Alexander Zinoviev, Ericsson
Iran; Andrew Wilson, Company Secretary, of then BHP Engineering; Toshio Takahashi, Vice President,
Marubeni Iran; Mohamad Keshavarz, CEO, Lord Carpet; and Saeed Ouhadi, President, Touring and
Automobile Club of the Islamic Republic of Iran.
In Manama, Bahrain, we thank:
The Bahrain Monetary Agency, specifically Dr Naser Belooshi, Executive Director, Management
Services, Dr Khalid Ateeq, Executive Director Banking Control, Dr Abdl Rahman Saif, Director of
Economic Research, Khalid Rahman, Director, Banking Supervision Directorate, and John Field,
Adviser Banking and Finance. We also thank Steven Atkinson, Director, and Jeremy Dixon, Manager,
Global Project Finance, ANZ Investment Bank; Hadi Fadayal, Senior Vice President and Denzil Pereira,
Senior Economist, Arab Bank; and Rod Brodedlet, Country Manager, ABN Amro Bank Bahrain.
Austrade, the Australian Trade Commission, provided valuable financial assistance for this report.
We also thank BHP and Pacific Power who are the East Asia Analytical Unit’s corporate sponsors,
and Emirates Airlines and Arab Bank, who sponsored this report.
Editing was by Ann Duffy, typesetting by Robyn Leason, and figures by Lyn Lalor.

A C C E S S I N G T H E M I D D L E E A S T
B U S I N E S S O P P O R T U N I T I E S I N T H E A R A B I A N P E N I N S U L A A N D I R A N
P A G E VI
EAST ASIA ANALYTICAL UNIT
The East Asia Analytical Unit was established in 1990 as the main agency within the Australian
Government responsible for publishing analyses of major economic and political issues in Asia.
Located within the Department of Foreign Affairs and Trade, the East Asia Analytical Unit has
undertaken 24 studies on a major issues related to Australia’s trade policy interests in the region.
This report is the first in a series covering important emerging markets outside East Asia.
Staffed with nine professionals, the East Asia Analytical Unit also contracts a range of consultants
with specific areas of expertise. It draws on a wide range of data and information sources, including
reports from Australia’s diplomatic and trade missions around the world.
Reports and briefing papers produced by the unit are intended to assist analysts and decision makers
in business, the Australian Government and the academic community,
Full copies of previous reports and executive summaries now can be downloaded from the Internet.
See website details below.
Contact details:
East Asia Analytical Unit
Department of Foreign Affairs and Trade
RG Casey Building
John McEwen Crescent
Barton ACT 0221
Australia
Telephone: 61 2 6261 2237
Facsimile: 61 2 6261 3493
Email: [email protected]
Internet site: www.dfat.gov.au/eaau
Executive Director
Dr Frances Perkins
Directors
William Brummitt
Stephen Scott
Deputy Directors
Brendan Berne
James Bloomfield
Joanne Frederiksen
Michael Growder
Administration
Nathan Backhouse
Internet and Information Technology
Robyn Leason

T a b l e o f C o n t e n t s
P A G E VII
TABLE OF CONTENTS
EXECUTIVE SUMMARY* xiii
Australia-Gulf Trade and Investment Trends xiv
Australian Exports to Gulf Economies xiv
The Business Environment xvi
Foreign Investment xvii
Trade xviii
COUNTRY SUMMARIES* xxi
Kingdom of Saudi Arabia xxi
United Arab Emirates xxiii
Islamic Republic of Iran xxv
Bahrain xxvii
Kuwait xxviii
Sultanate of Oman xxix
Qatar xxx
Yemen xxxi
References xxxii
CHAPTER 1 ECONOMIC PROSPECTS* 1
History 2
Regional Economic Performance 4
Exchange Rate Arrangements 8
Drivers of Economic Dynamism 9
Demographics 10
Diversification Away From Oil 14
Fiscal Pressures 17
Declining Oil Reserves 20
Implications 21
References 22

A C C E S S I N G T H E M I D D L E E A S T
B U S I N E S S O P P O R T U N I T I E S I N T H E A R A B I A N P E N I N S U L A A N D I R A N
P A G E VIII
CHAPTER 2 AUSTRALIAN-GULF BUSINESS* 25
Australia’s Exports - Major Gulf Markets 26
Major Sectoral Trends for Australian Exports 30
Manufactured Exports 31
Primary Products 33
Australian Export Opportunities 36
Australia’s Direct Investment Opportunies 50
Gulf Economies’ Investment in Australia 54
Australian Merchandise Imports from the Gulf Economies 54
Australian Business Links with the Gulf 55
Implications 56
References 57
CHAPTER 3 THE BUSINESS ENVIRONMENT* 59
Religion 60
Culture and History 61
The Legal Environment 64
Key Issues for Australian Business 77
References 85
CHAPTER 4 FOREIGN INVESTMENT* 87
Regional FDI Policies 88
Regional FDI Levels 91
FDI Drivers in Individual Gulf Economies 92
Sectoral FDI Opportunities 94
Oil Sector Investment 94
Gas 96
Infrastructure 98
Petrochemicals 102
Manufacturing 102
Free Trade Zones 104
Major Influences on the FDI Outlook 106
Conclusions 107
References 108

T a b l e o f C o n t e n t s
P A G E IX
CHAPTER 5 TRADE POLICY AND PROSPECTS 111
The Importance of Trade in the Gulf Economies 112
Trade Growth 114
Regional Import Developments 116
Main Trading Partners 127
Intra-regional Trade 128
Regional Re-export Centres 129
Effects of WTO Membership on Reform 130
Tariff Barriers 132
Non-tariff Barriers 134
Future Trade Prospects 137
References 138
CHAPTER 6 IMPLICATIONS 141
Implications for Business 142
Implications for Government 143
References 146
Contacts in the Arabian Peninsula and Iran 147
INFORMATION FOR COMPANIES 147
Contacts in Australia 151
INDEX 153
ALSO BY THE EAAU 159
A C C E S S I N G T H E M I D D L E E A S T
B U S I N E S S O P P O R T U N I T I E S I N T H E A R A B I A N P E N I N S U L A A N D I R A N
P A G E X
GLOSSARY
AACCI Australia Arab Chamber of Commerce and Industry Incorporated
ADIA Abu Dhabi Investment Authority
ADNOC Abu Dhabi National Oil Company
ALBA Aluminium Company of Bahrain
APEC Asia Pacific Economic Cooperation
ARAMCO The Saudi state owned oil company
BMA Bahrain Monetary Agency
BOO Build, own, operate
BOOT Build, own, operate, transfer
BOT Build, operate, transfer
Buy-backs A mechanism facilitating investment in Iran’s oil and gas industries, whereby
the ‘investor’ contracts to perform work, and is paid in project output, usually
crude oil or condensate. Buy-backs circumvent the Iranian constitutional
prohibition on foreign ownership of Iranian natural resources
Defence Offsets Provisions incorporated by some GCC countries into defence contracts
requiring the primary contractor to undertake a set value of investment in a
non-defence sector
Dhow Small, usually wooden cargo vessel used extensively in the Gulf for small
scale, traditional, and often unofficial trading
Dolphin Project The Dolphin project proposal involves building a pipeline from Qatar’s giant
North field to Abu Dhabi, Dubai and Oman, to supply gas to meet projected
shortages in these countries to generate electricity and fuel industries such
as aluminium, steel and petrochemicals in new industrial zones. The project
is expected to cost between US$8 billion and $10 billion
Downstream Oil and gas industry term for the refining and processing of oil and gas, such
as petrochemicals manufacturing
Dubal Dubai Aluminium Company
ETM Elaborately transformed manufacture
EU European Union
EFIC Export Finance and Insurance Corporation, of Australia
Farsi The national language of Iran, also referred to as Persian

E x e c u t i v e S u m m a r y
P A G E XI
FDI Foreign direct investment, investment in overseas branches, subsidiaries or
associated companies in which the investor owns 10 per cent or more equity
GCC Gulf Cooperation Council: an organisation comprising Saudi Arabia, Kuwait,
Bahrain, the United Arab Emirates, Qatar, and Oman, dedicated to promoting
closer economic links and integration
GDP Gross domestic product: the value of all goods and services produced in an
economy in a specified time
GTC Government Trading Company, an Iranian monopoly importer of many bulk
agricultural commodities and inputs
Hydrocarbons Oil and gas
IDEX International Defence Exhibition and Conference, the world’s largest, held
annually in Dubai
IPO Initial public offer
IRI Islamic Republic of Iran
KSA Kingdom of Saudi Arabia
LNG Liquefied natural gas
mbd Million barrels per day, a measure of oil production or export volume
MW Megawatt, a unit of 1 000 watts of electricity, commonly used to designate the
size of power stations
National interest Australian Government agreement to act as insurer of last resort for payment
provisions for exports, usually bulk agricultural commodities, to nations with poor credit ratings
OPEC Organisation of Petroleum Exporting Countries
PPP Purchasing power parity: estimated by determining the number of units of a
country’s currency required in-country to buy a standard bundle of goods and
services that US$1 would buy in the United States. This information is then
used to adjust the country’s US dollar per capita income to better reflect its
actual purchasing power
SABIC Saudi Basic Industries Company, Saudi Arabia’s largest industrial group
STM Simply transformed manufacture
TEU Twenty foot equivalent unit, used to measure the volume of container traffic
handled by a port
UAE United Arab Emirates
Upstream Industry term for the primary extraction of oil and gas
WIPO World Intellectual Property Organization
WTO World Trade Organization

A C C E S S I N G T H E M I D D L E E A S T
B U S I N E S S O P P O R T U N I T I E S I N T H E A R A B I A N P E N I N S U L A A N D I R A N
P A G E XII
THE PERSIAN GULF REGION
Note: a Scale 1:21 000 000, Lambert Conformal Conic Projection, standard parallels 12’N and 38'
Source: University of Texas website, www.lib.utexas.edu/Libs/PCL/Map_collection/middle_east_and_asia/MiddleEast_ref802640_1999.jpg,
accessed on 23 August 2000.

E x e c u t i v e S u m m a r y
P A G E XIII
EXECUTIVE SUMMARY
Over the next decade, growing economic and population pressures should drive considerable reform
and structural change in the economies of the Arabian Peninsula and Iran, called the Gulf economies
in this report.1 Recent and anticipated investment and trade reforms should boost opportunities for Australian
business. However, the region’s economic and business environment remains diverse and fluid.
This report should assist traders and investors accessing markets in Saudi Arabia, the United Arab
Emirates, UAE, Iran, Bahrain, Qatar, Kuwait, Oman and Yemen by thoroughly analysing the region’s
current economic, trade and investment policies, recent and projected economic performance and
the unfamiliar business environment, and by highlighting prospective sectoral opportunities for
Australian business.
After oil was exploited commercially in the 1950s and oil prices rose in the 1970s, most Gulf economies
developed rapidly. However, in the 1990s, slower growth, a desire to reduce exposure to volatile oil
prices and increasing demographic pressures forced governments to reassess growth based only
on oil revenue and state investment. Even the prosperous Gulf Cooperation Council, GCC, economies
of Saudi Arabia, the UAE, Bahrain, Qatar, Kuwait and Oman, seek to diversify and develop other
prospective sectors like gas, mining and services. Their strategies include liberalising trade and
investment policies to encourage foreign participation.
Lacklustre growth typified Gulf economies during the 1990s. Regional real gross domestic product,
GDP, growth rates ranged only from an annual average of 5.2 per cent in post-war Kuwait to 1.4 per
cent in Saudi Arabia. Since Iran’s 1979 revolution, the population has doubled, but real GDP has
expanded at only 1.6 per cent per year due to inward looking economic policies, an eight year war
with Iraq and political turmoil. Relatively oil-poor Yemen recently commenced economic reforms and
reversed economic contraction after years of civil war, political upheaval and negative growth.
Throughout the Gulf economies, the need to create employment opportunities for rapidly growing
populations is intensifying pressure to lift economic growth. The 1970s oil boom produced a baby
boom, and oil wealth encourages strong inward migration. Two thirds of GCC economies’ populations
are under 25 years; 21 per cent are aged between 11 and 15 years. As oil sectors provide relatively
few jobs for nationals, governments are encouraging new investment in service sectors able to provide
appropriately paid jobs. To achieve this, young nationals require appropriate education and training;
this expands opportunities for foreign educational service suppliers.
Pressure to diversify from oil is particularly intense in Dubai in the UAE, Qatar, Oman and Bahrain
where oil reserves will last only another 10 to 15 years. Dubai already benefits from diversifying into
transport, distribution, tourism, finance and other services; oil production now accounts for less than
1 In line with standard United Nations’ practice, Australia officially uses ‘the Persian Gulf’. Readers should note that where the
term ‘the Gulf’ is used, it refers to the Persian Gulf.

A C C E S S I N G T H E M I D D L E E A S T
B U S I N E S S O P P O R T U N I T I E S I N T H E A R A B I A N P E N I N S U L A A N D I R A N
P A G E XIV
8 per cent of its GDP. Even in the 1980s, Bahrain achieved similar success by developing into an
offshore banking centre, producing aluminium and refining Saudi and Bahraini oil. Qatar is developing
its extensive gas resources, while Oman is undertaking radical infrastructure reforms and expanding
distribution and tourism sectors.
To diversify into non-oil sectors, Gulf economies increasingly are liberalising their trade and investment
policies. The UAE, Kuwait, Qatar and Bahrain are World Trade Organization, WTO, members while
Saudi Arabia, Oman and Yemen are undertaking reforms under their proposed accession programs.
Saudi Arabia will liberalise its foreign investment regime so 100 per cent foreign owned companies
can participate in many sectors, although international investor interest in this reform is constrained
by continued lack of clarity about excluded sectors and lack of implementing regulations. Iran tentatively
is opening oil, gas and petrochemical sectors to foreign participation through output ‘buy-back’
schemes, although most other sectors remain effectively closed to foreign direct investment, FDI.
Several Gulf economies are opening education sectors to foreign providers and privatising
infrastructure to overcome budgetary constraints.
Because the Gulf economies insufficiently expanded government revenue beyond oil proceeds, they
ran budget deficits throughout the 1990s, averaging 7 per cent of GDP in 1999. With ready access to
oil revenues, few GCC governments levy income or sales taxes, or plan to introduce them in the near
future. However, even major oil producers like Saudi Arabia, the UAE, Iran and Kuwait, feel the
pressure to diversify government revenue sources, because of the cap on oil revenues enforced by
OPEC quotas and growing demand for government services. New revenue raising initiatives include
higher user charges for power and water, and user contributions towards health and education services.
With populations, incomes and demand for new government services rapidly expanding, many regional
governments also are encouraging private infrastructure provision. Between 2000 and 2006, meeting
new Saudi, UAE, Iranian, Qatari, Omani and Kuwaiti electricity demand alone will cost US$40 billion.
Oman has developed a coherent framework for private infrastructure supply, but Kuwait, the UAE,
Saudi Arabia and Yemen seek private infrastructure providers.
AUSTRALIA-GULF TRADE AND INVESTMENT TRENDS
Australia’s trade relationship with the Gulf economies is well developed and growing rapidly. Australian
investment is small but expanding rapidly with the burgeoning range of opportunities.
AUSTRALIAN EXPORTS TO GULF ECONOMIES
Between 1995 and 1999, Australia’s exports to the Gulf economies grew strongly at 19 per cent per
year, 50 per cent higher than overall Australian export growth. Car exports boomed from nearly zero
in 1995 to A$800 million in 1999. As a result, elaborately transformed manufactures, ETMs, now
represent 34 per cent of Australian exports to the Gulf. Australia’s bulk commodity trade in wheat,
sugar, frozen meat and alumina continues to flourish. However, in 1999, primary product exports
represented 64 per cent of Australian exports to the Gulf, down from 94 per cent in 1990.

E x e c u t i v e S u m m a r y
P A G E XV
While cars account for 85 per cent of ETM exports, high oil prices in 2000 and 2001 will offer excellent
opportunities to diversify ETM exports, particularly for telecommunication products, pharmaceutical
and medicinal products now patent protection is improving, and fast ferries. Other key export
opportunities include increasing:
• bulk and high value agricultural exports, as governments reduce costly subsidies and water supplies
to inefficient local agriculture
• education exports, by attracting Gulf students to Australian institutions and providing in-country courses
• Gulf residents’ tourism to Australia and services to Gulf tourism markets
• construction equipment, materials and service exports.
Australian Imports from Gulf Economies
Australia is a net hydrocarbons exporter, so its imports from Gulf economies are limited. Nevertheless,
in 1999, Australia’s imports from Gulf economies totalled A$1.3 billion, including A$894 million in
petroleum products. Non-petroleum related manufactured imports grew from A$32 million in 1990 to
A$177 million in 1999. However, the Gulf economies’ manufacturing base is narrow, while the markets
for niche products such as Persian carpets, musical instruments and dates are limited and suffer
from inadequate trade promotion efforts.
Australia’s Investment Opportunities
Australia’s new investment in the Gulf economies is directed at the relatively open and business
friendly UAE; in 1997, it had attracted 30 Australian companies but in 2000, this had increased
to 70. This extra growth implies at least A$20 million in new investment. The largest Australian UAE
operations include assembly and light manufacturing facilities (Clipsal and Lionweld Kennedy), a
regional distribution centre (Boral Plasterboard), construction operations (Multiplex) and leisure sector
investment (Greater Union).
Outside the UAE, most Australian investment interest is in oil and gas, with BHP Petroleum, Woodside
Petroleum and smaller companies like Novus Petroleum all active. In addition, ANZ Investment Bank
has a Bahrain based regional operation and three Australian companies have significant joint ventures
in Saudi metal processing, health and construction sectors.
Gulf Investment in Australia
Data on the Gulf economies’ investment in Australia are limited, but clearly Australia’s share of their
massive offshore investment is well below Australia’s share of world GDP. Frequent and direct air
links between Australia and the Gulf, with Emirates flights to Dubai and Gulf Air flights to Abu Dhabi
and Bahrain, should increase investment in real estate, tourism, services and Australian financial
products. The UAE’s direct investment in Australian agriculture, horse breeding and real estate is
considerable, but Australia’s agricultural and resource sectors could attract more Gulf investment; in
turn, this could generate new Australian export opportunities to the Gulf.

A C C E S S I N G T H E M I D D L E E A S T
B U S I N E S S O P P O R T U N I T I E S I N T H E A R A B I A N P E N I N S U L A A N D I R A N
P A G E XVI
THE BUSINESS ENVIRONMENT
Understanding the Gulf region’s religion, culture and business environment remains critical to doing
business there. Important issues include appropriately using local agents, choosing local investment
partners, understanding the role of chambers of commerce and managing the region’s bureaucratic
culture. Two important future business issues are the changing role of agents and influence of changing
demographics on market demand.
Religion and Culture
Islam permeates Middle Eastern policy making and daily life far more than religion does in most
western economies. For example, the Leader of the Revolution in Iran and conservative Islamic
theologians in Saudi Arabia considerably influence law making and economic policy. Islam also guides
patterns of food and drink consumption, clothing demand, financial sector products, attitudes to
advertising, and other consumption and investment behaviour.
The distinction between Arab and Persian cultures, histories and languages also is important. Failing
to recognise these differences, and particularly misidentifying Arabs and Persians, can cause offence.
Similarly, using the incorrect term for ‘the Gulf’ can cause serious problems with partners, exports
and contracts. Iranians refer to the ‘Persian Gulf’, while Arabs refer to the ‘Arabian Gulf’. Officially,
Australia, like most western countries, refers to the ‘Persian Gulf’.
The Legal Environment
Governments tend to legislate business law, but even so, legal frameworks are significantly less
developed than in western economies. Consequently, avoiding litigation is important to business
success. Legal problems include complying with often complex and ambiguous foreign ownership
laws, achieving intellectual property protection and terminating agency agreements. Consequently,
thorough due diligence on potential partners and use of all available means of dispute resolution,
such as negotiation or arbitration, if problems do arise, are essential. Where possible, providing for
arbitration in Australia or third countries is desirable.
The Importance and Changing Role of Agents
Most Australian companies selling goods on the Arabian Peninsula initially use an agent for marketing
and distribution. In Oman, Qatar, Kuwait and Bahrain, this often is a legal requirement. However, in
the period to 2005, WTO requirements will increase the difficulty of reserving agency roles for nationals.
In addition, e-commerce, rapid population growth and higher education levels among young nationals
should ensure local agents and joint venture partners add more value and more actively contribute to
joint businesses.
Demographics
The Gulf economies’ young populations should maintain reform pressure and stimulate demand for
education, music products, electronics, information technology and communications, snack foods,
travel, housing and mortgage financing.
E x e c u t i v e S u m m a r y
P A G E XVII
Non-nationals, from the Indian sub-continent, other Middle Eastern states and western economies
are important in GCC workforces and market demand. Expatriates account for about 70 per cent of
the population in the UAE, Qatar and Kuwait and 60 per cent in Bahrain, and are significant in most
other Gulf economies. Non-nationals not only do all menial, dangerous and unskilled work, but fill
many private sector skilled and managerial positions.
In recent years, most Gulf economies have introduced programs to localise skilled jobs to create
employment for the oil boom-baby boomers entering the workforce. Saudi Arabia, the UAE, Qatar
and Oman have formal quotas; however, Bahrain’s initiative of establishing an Institution of Banking
and Finance at Bahrain University to train Bahrainis (and other GCC nationals) to become very
competitive financial sector employees appears more successful. Bahraini banks have 70 per cent
local staff.
FOREIGN INVESTMENT
Due to their huge oil export receipts, GCC economies are traditionally capital exporters. Abundant
capital and restrictive foreign investment regimes have made FDI a much less significant capital
source for the Gulf economies than for East Asia, for example. However, efforts to strengthen growth,
diversify economies and create employment are changing rapidly these restrictive policies.
Regional FDI Polices
Remaining constraints on inwards FDI to the Gulf economies include caps on foreign ownership
outside the free trade zones, prohibitions on investing in many sectors (particularly oil), restrictions
on foreign participation in key infrastructure, energy and manufacturing sectors, and imprecise
regulatory frameworks. However, Qatar, Oman and Saudi Arabia lead reform efforts, and further
opening of FDI regimes is likely in the short to medium term. Iran also is attracting growing interest in
oil and gas buy-backs, and is legislating to provide security for foreign investment.
Investment Opportunities
Gas related projects and infrastructure are generating much private investment interest. Large scale
foreign involvement is more prospective in the region’s huge emerging gas industry than in oil, as
regional expertise and vested interests in the gas sector are less developed. Successful completion
of major gas pipelines, such as the proposed Dolphin project from Qatar to the UAE and Oman, will
increase the competitiveness of energy intensive petrochemicals, aluminium smelting and steel
production. The scale of investment and need for internationally competitive operations should make
foreign investment more attractive than majority state ownership, the previous approach. Private
infrastructure investment opportunities also should expand due to ongoing liberalisation and massive
needs for telecommunications, roads, pipelines construction, railway construction, and electricity
and water production and distribution services. Free trade zones also provide light manufacturing
and distribution opportunities.
A C C E S S I N G T H E M I D D L E E A S T
B U S I N E S S O P P O R T U N I T I E S I N T H E A R A B I A N P E N I N S U L A A N D I R A N
P A G E XVIII
Free Trade Zones
The Gulf’s leading free trade zone, Dubai’s Jebel Ali, has over 600 international manufacturing,
distribution, trading and processing companies, including Colgate Palmolive, Samsung and IBM,
and a range of Australian companies. The UAE’s other major free trade zone is Sharjah, home to
Clipsal’s Middle East and South Asian manufacturing operations, and Lufthansa’s largest cargo hub
after Frankfurt. Dubai also is developing a free trade ‘Internet city’ for technology, e-commerce and media.
Other important regional zones are at Aden in Yemen and Salahah in Oman; both feature large
shipping and distribution investments. Iran’s free and special economic zones, particularly Qeshm
Island, Al Mahdi near Bandar Abbas and Abadan have considerable latent potential, particularly for
heavy industry and petrochemicals, but Iran’s failure hitherto to enact appropriate legislation
guaranteeing investor security constrains this. Kuwait has established a free trade zone with world class
infrastructure at Shuwaikh Port. Ultimately, Kuwait aims to make the entire country a free trade zone.
Foreign Investment Prospects
Significant structural changes underway in the Gulf economies should ensure foreign investors
considerable future opportunities. Most governments recognise they cannot allow current high oil
prices to reduce reform momentum; for example, unless oil prices remain above US$25 per barrel,
only Kuwait could finance its new electricity infrastructure requirements without outside investment.
Service industries require intensive skilled labour, making investment liberalisation in the service
sector critical. As Dubai’s experience shows, sound economic policies and even a partially liberalised
environment offers major growth and employment benefits.
TRADE
Oil dominates regional trade, accounting for up to 70 per cent of Gulf economies’ exports. Oil also
provides the feedstock for the Gulf region’s growing petrochemical exports, which account for around
half of non-oil merchandise exports, except in Bahrain and Iran. When oil prices fell below US$10 per
barrel in 1998, import volumes declined markedly. In 2000, regional imports are forecast to surge to
US$90 billion, and given the significant lag in importing, this strong trend should continue into 2001.
Imports
Because the Arabian Peninsula economies have relatively narrow and underdeveloped industrial
bases compared to OECD economies, they import most manufactures, including consumer durables,
particularly cars and capital goods. In Iran, with its diverse but relatively inefficient state owned
industrial base, bulk foodstuffs and essential machinery dominate imports.
All Gulf economies are significant food importers. Most regional governments subsidise inefficient
local agriculture, but fiscal and demographic pressures are likely to weaken these policies in the next
decade. This should boost prospects for food exporters like Australia.

E x e c u t i v e S u m m a r y
P A G E XIX
While significantly smaller as an import market than East Asia, the Gulf economies still are significant
importers. In 1998, the largest regional economy, Saudi Arabia, imported US$28 billion of merchandise,
followed by the UAE with US$24 billion, Iran with US$10 billion and Kuwait with US$7 billion. As the
UAE is a re-export centre, this significantly inflates its imports. The fastest growing importers are
Qatar, the UAE and Oman, while the fastest growing imports include dairy products (Saudi Arabia,
the UAE and Bahrain), meat (Saudi Arabia and the UAE) and transport equipment (Saudi Arabia, the
UAE, Kuwait and Yemen).
Trading Partners
The Gulf economies dominate world oil trade, but intra-regional trade is relatively limited. Instead,
the region’s main trading partners are the United States, Japan, the UK, Germany, Italy, Republic of
Korea and France. Australia receives only 0.7 per cent of the Gulf economies’ exports (mainly crude
oil) but supplies over 2 per cent of their imports, well above its 1 per cent share of international trade.
Re-exporting Centres
Dubai is the Gulf region’s premier entrepot, with re-exports doubling in value to US$11 billion per
year between 1990 and 1998. Dubai’s twin ports of Jebel Ali and Port Rashid handle 40 per cent of all
Gulf container traffic.
Since 1997, governments and foreign companies have formed joint ventures to build large ports and
container terminals at Salalah in Oman and Aden in Yemen. These strategically located ports, close
to European and Asian sea lanes, allow ships to bypass the Strait of Hormuz, thereby saving time,
fuel and insurance premiums. Nonetheless, for the foreseeable future, Dubai is likely to retain its
premier re-export role due in part to its large internal market and its ports’ efficiency.
Effect of WTO Accession
WTO accession requirements are driving considerable trade and investment reform in Gulf economies.
Oman’s WTO accession is imminent; Saudi Arabia wishes to accede in 2000 but this now appears
unlikely; and Yemen’s application is nascent. Iran’s application for WTO membership has not been
scheduled for consideration due to US opposition.
When Saudi accession occurs, it should drive regional trade growth and improve access for Australian
dairy, car and grain exports. Increased transparency and intellectual property protection, and equal
tax treatment for domestic and foreign companies also should result. Oman’s accession progressively
will open the telecommunications sector and liberalise foreign investment regulations.
Trade Barriers
Tariff barriers, except in Iran, are generally low and not a major constraint on trade. UAE and Kuwaiti
tariffs average 3.5 per cent, while Saudi tariffs average 12.5 per cent. About 75 per cent of UAE

A C C E S S I N G T H E M I D D L E E A S T
B U S I N E S S O P P O R T U N I T I E S I N T H E A R A B I A N P E N I N S U L A A N D I R A N
P A G E XX
imports enter duty free, largely due to imports into free trade zones. Iran has tariffs of between
30 and 50 per cent, bans many imports and awards exclusive importing rights to ministries, religious
foundations and individuals. Rationing of scarce foreign exchange further constrains Iranian trade.
GCC members recently agreed that by 2005, they would adopt a common range of external tariffs
from 5.5 to 7.5 per cent. Implementing this common external tariff is complicated by the need for
substantial falls in Saudi tariffs and for rises in UAE and Kuwaiti tariffs. However, the need to have a
common external tariff before negotiating a free trade agreement with the European Union should
maintain momentum.
Implications
Slower growth, demographic pressures and the benefits of globalisation are convincing many Gulf
governments to diversify their economies and open them further to foreign trade and investment.
High oil prices, the competitive Australian dollar and gradually opening Gulf economies generate
strong Australian business prospects. Major business opportunities include expanding traditional
agricultural and mineral exports, particularly wheat, sugar and alumina, and developing new markets
for fresh and processed food, a wide range of ETMs, particularly cars, and tourism, education,
infrastructure, construction and business services.
The Australian Government has an important role in raising Australia’s trade and investment profile
in the Gulf economies, by encouraging high level delegations and adequately resourcing trade and
diplomatic posts. It also can further promote Australian educational exports and advertise Australia
as a tourist and investment destination.
Prospects
Over the coming decade, Australia’s natural complementarity with the Gulf economies and the region’s
ongoing reforms should deepen trade and investment opportunities for Australian business. However,
the Gulf markets are very competitive and cultural differences are marked, so Australian businesses
should devote appropriate energy and resources to market research and development to access this
highly prospective region.
C o u n t r y S u m m a r i e s
P A G E XXI
COUNTRY SUMMARIES
1 Unless otherwise stated, data for these country briefs has been drawn from Datastream, 2000; Central Intelligence Agency,
1999; The Economist Intelligence Unit’s, EIU’s Country Profiles; and Business Monitor International’s Middle East Monitor,
The Gulf.
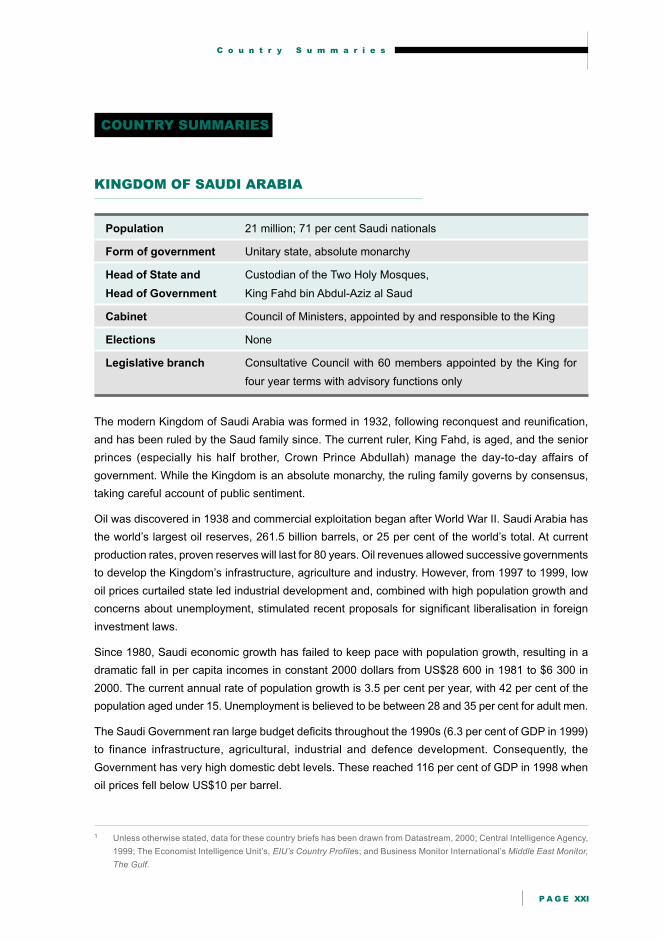
KINGDOM OF SAUDI ARABIA
Population 21 million; 71 per cent Saudi nationals
Form of government Unitary state, absolute monarchy
Head of State and Custodian of the Two Holy Mosques,
Head of Government King Fahd bin Abdul-Aziz al Saud
Cabinet Council of Ministers, appointed by and responsible to the King
Elections None
Legislative branch Consultative Council with 60 members appointed by the King for
four year terms with advisory functions only
The modern Kingdom of Saudi Arabia was formed in 1932, following reconquest and reunification,
and has been ruled by the Saud family since. The current ruler, King Fahd, is aged, and the senior
princes (especially his half brother, Crown Prince Abdullah) manage the day-to-day affairs of
government. While the Kingdom is an absolute monarchy, the ruling family governs by consensus,
taking careful account of public sentiment.
Oil was discovered in 1938 and commercial exploitation began after World War II. Saudi Arabia has
the world’s largest oil reserves, 261.5 billion barrels, or 25 per cent of the world’s total. At current
production rates, proven reserves will last for 80 years. Oil revenues allowed successive governments
to develop the Kingdom’s infrastructure, agriculture and industry. However, from 1997 to 1999, low
oil prices curtailed state led industrial development and, combined with high population growth and
concerns about unemployment, stimulated recent proposals for significant liberalisation in foreign
investment laws.
Since 1980, Saudi economic growth has failed to keep pace with population growth, resulting in a
dramatic fall in per capita incomes in constant 2000 dollars from US$28 600 in 1981 to $6 300 in
2000. The current annual rate of population growth is 3.5 per cent per year, with 42 per cent of the
population aged under 15. Unemployment is believed to be between 28 and 35 per cent for adult men.
The Saudi Government ran large budget deficits throughout the 1990s (6.3 per cent of GDP in 1999)
to finance infrastructure, agricultural, industrial and defence development. Consequently, the
Government has very high domestic debt levels. These reached 116 per cent of GDP in 1998 when
oil prices fell below US$10 per barrel.
A C C E S S I N G T H E M I D D L E E A S T
B U S I N E S S O P P O R T U N I T I E S I N T H E A R A B I A N P E N I N S U L A A N D I R A N
P A G E XXII
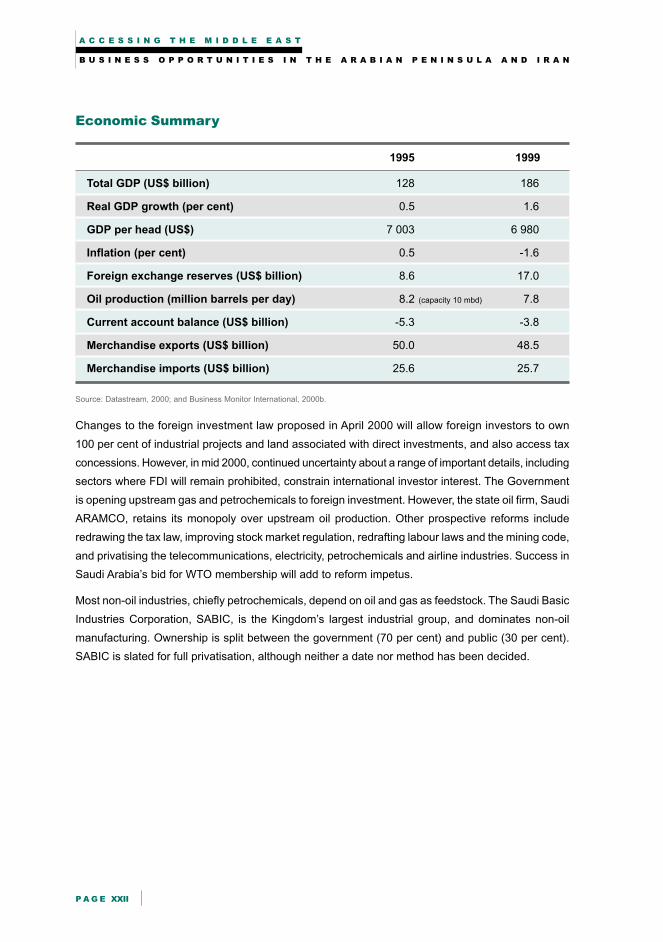
Economic Summary
1995 1999
Total GDP (US$ billion) 128 186
Real GDP growth (per cent) 0.5 1.6
GDP per head (US$) 7 003 6 980
Inflation (per cent) 0.5 -1.6
Foreign exchange reserves (US$ billion) 8.6 17.0
Oil production (million barrels per day) 8.2 (capacity 10 mbd) 7.8
Current account balance (US$ billion) -5.3 -3.8
Merchandise exports (US$ billion) 50.0 48.5
Merchandise imports (US$ billion) 25.6 25.7
Source: Datastream, 2000; and Business Monitor International, 2000b.
Changes to the foreign investment law proposed in April 2000 will allow foreign investors to own
100 per cent of industrial projects and land associated with direct investments, and also access tax
concessions. However, in mid 2000, continued uncertainty about a range of important details, including
sectors where FDI will remain prohibited, constrain international investor interest. The Government
is opening upstream gas and petrochemicals to foreign investment. However, the state oil firm, Saudi
ARAMCO, retains its monopoly over upstream oil production. Other prospective reforms include
redrawing the tax law, improving stock market regulation, redrafting labour laws and the mining code,
and privatising the telecommunications, electricity, petrochemicals and airline industries. Success in
Saudi Arabia’s bid for WTO membership will add to reform impetus.
Most non-oil industries, chiefly petrochemicals, depend on oil and gas as feedstock. The Saudi Basic
Industries Corporation, SABIC, is the Kingdom’s largest industrial group, and dominates non-oil
manufacturing. Ownership is split between the government (70 per cent) and public (30 per cent).
SABIC is slated for full privatisation, although neither a date nor method has been decided.

C o u n t r y S u m m a r i e s
P A G E XXIII
UNITED ARAB EMIRATES, UAE
Population 2 579 000; 30 per cent Emirati nationals
Form of state Federation of seven emirates: Abu Dhabi, Dubai, Sharjah, Ajman,
Ras Al-Khaimah, Ajman, Fujairah and Umm Al-Quwain
Head of state HH Sheikh Zayed bin Sultan Al-Nahayyan,
President of the United Arab Emirates
Head of government Vice President and Prime Minister,
Sheikh Maktoum bin Rashid Al Maktoum, Ruler of Dubai
Cabinet Council of Ministers appointed by the President
Elections President and Vice President elected by the Supreme Council of
Rulers, formed by the hereditary rulers of the seven emirates
Legislative branch Federal National Council, appointed by rulers of the seven emirates,
operates in a consulting capacity only
The United Arab Emirates, UAE, formerly known as the Trucial States, gained independence from
Britain in 1971; before then, individual emirates were British protectorates. The UAE has close defence
links with other Gulf Cooperation Council, GCC, states and the United States, Britain and France. It
has territorial disputes with Iran over sovereignty of the Abu Musa islands and the Greater and
Lesser Tunbs in the Gulf between Iran and the UAE.
Only 20 per cent of the UAE’s population are nationals; the remainder are expatriates from South
Asia (64 per cent), other Middle Eastern countries (15 per cent), and western countries (1 per cent).
Skilled and unskilled labour shortages among UAE nationals, relatively high wages and no income
tax generate expatriate inflows.
The UAE has 9.7 per cent of the world’s crude oil reserves and 4.1 per cent of its natural gas
reserves. Abu Dhabi holds 94 per cent of the UAE’s oil reserves, with more than 100 years’ production
at current levels. Abu Dhabi also provides 80 per cent of the UAE’s budget and generates 58 per cent
of its GDP.
Dubai’s oil output is declining rapidly , with resserves likely to be exhausted by 2015. Dubai accounts
for 26 per cent of UAE GDP and is a regional trade centre, with foreign trade more than double its
US$13 billion GDP. The Dubai Government aggressively promotes the emirate as a regional
commercial services and tourism hub, and developed the Gulf’s largest free trade zone and port at
Jebel Ali. Together with the nearby Port Rashid, these ports processed 2.8 million twenty foot equivalent
units, TEUs, of containers in 1998, the world’s eleventh largest port throughput. Dubai benefited from
business relocation from Kuwait and Bahrain, during and after the Gulf War.

A C C E S S I N G T H E M I D D L E E A S T
B U S I N E S S O P P O R T U N I T I E S I N T H E A R A B I A N P E N I N S U L A A N D I R A N
P A G E XXIV
Economic Summary
1995 1999
Total GDP (US$ billion) 42.8 51.1
Real GDP growth (per cent) 8.1 2.5
GDP per head (US$) 18 500 17 900
Inflation (per cent) 4.4 4.2
Foreign exchange reserves (US$ billion) 7.5 10.7
Oil production (million barrels per day) 2.2 2.1
Total foreign debt (per cent of GDP) 22.2 25.2
Current account balance (US$ billion) 4.3 4.1
Merchandise exports (US$ billion) 29.2 33.8
Merchandise imports (US$ billion) 23.4 29.9
Source: Datastream, 2000; and Business Monitor International, 2000b.
Sharjah produces 10 per cent of UAE GDP, and the other smaller emirates produce between 0.5 and
2.5 per cent each. They have very modest oil and gas reserves and production, but are attempting to
develop their trading and tourism sectors.
The UAE joined the WTO in 1995. Currently, tariffs average 3.5 per cent and 75 per cent of goods
enter duty free. However, by 2005, the UAE is committed to introducing a unified GCC external tariff
of from 5.5 to 7.5 per cent on most goods, which would represent a considerable increase in tariff
barriers. Currently, the UAE is implementing a series of economic reforms, including improving business
laws and intellectual property protection, establishing a formal stock exchange, and privatising and
opening previously closed sectors to foreign direct investment, particularly in the utilities sector.2
The UAE is a rapidly growing transhipment point for Europe-Asia cargo, and for air-sea cargo
combinations. Dubai’s large international airport hubs the flights of its successful Emirates Airline.
Lufthansa has its largest cargo hub outside Frankfurt in Sharjah. Newly opened airport free trade
zones in Dubai and Sharjah, the continued growth of Jebel Ali and other traditional free trade zones,
and the UAE’s growing role as a regional headquarters, shopping and distribution centre, should see
air and sea transport hub activities continue to expand.
Led by Dubai, tourism is a significant growth industry. Visitor arrivals exceeded 3 million in 1999,
representing growth of 35 per cent over 1998. Growth in new hotel rooms at 30 per cent per year
outstrips all major European and Asian tourist destinations. Major markets include other Gulf
economies, the former Soviet Union and the Indian sub-continent.
2 Due to intellectual property law improvements, the UAE no longer is on the US intellectual property watch list. It also has
improved substantially business law transparency. The Dubai Financial Market, the first trading floor of the UAE stock
exchange started trading in March 2000. A further exchange is to be opened in Abu Dhabi.

C o u n t r y S u m m a r i e s
P A G E XXV
ISLAMIC REPUBLIC OF IRAN
Population 65 million (including up to 4 million illegal Iraqi and Afghani refugees)
Form of state Islamic republic
Chief of state Leader of the Islamic Revolution and Supreme Jurisprudent,
Ayatollah Seyed Ali Khamenei
Head of government President HE Hojateslam Seyed Mohamad Khatami
Cabinet Appointed by the President, approved by Majles (legislature)
Elections Presidential, Majles and municipal elections are held, with universal
suffrage from age 15. Also Assembly of Experts elections select the
body which chooses Leader of the Islamic Revolution
Legislative branch Majles, or the Islamic Consultative Assembly, is similar to a
parliament. Universal election of candidates is to a unicameral
chamber; candidates are vetted by the Council of Guardians
The Islamic Republic of Iran was founded in 1979 following a popular revolution led from abroad by
Ayatollah Ruhollah Khomeini. Revolutionary upheaval and an eight year war with Iraq dominated the
1980s. The death of Ayatollah Khomeini in 1988 saw Ayatollah Ali Khamenei, formerly the President,
take up the newly created position of Supreme Leader. Following peace with Iraq, Hashemi Rafsanjani
became President, and between 1988 and 1997, undertook a state funded reconstruction program
focusing on rebuilding and upgrading infrastructure.
In 1997, reformist cleric Seyed Mohammad Khatami was elected President. He embarked on a
political and social reform program opposed by conservatives. The President introduced an economic
recovery program in 1998, designed to reduce the state’s economic role through privatisation,
deregulation and anti-trust actions, promote non-oil industries and increase transparency of economic
and commercial regulations. However, until April 2000, lack of a supportive parliamentary majority
blocked implementation of these reforms. With the next presidential election due in 2001, early passage
of the program’s key elements will be the defining economic test for the remainder of the President’s term.
Key Economic Challenges
Iran’s population is young, with 70 per cent aged under 25. Real economic growth averaged only
2 per cent between 1995 and 1999 compared to labour force growth of 3.5 per cent; this drove up
unemployment to over 30 per cent. These demographic forces increase reform pressure. Annual
economic growth above 5 per cent is needed to keep pace with the 900 000 new labour force
entrants each year.
In 1998 and 1999, low oil prices triggered foreign debt servicing difficulties. Nonetheless, at less than
20 per cent of GDP, the foreign debt level is modest and Iran should be largely debt free by 2003.

A C C E S S I N G T H E M I D D L E E A S T
B U S I N E S S O P P O R T U N I T I E S I N T H E A R A B I A N P E N I N S U L A A N D I R A N
P A G E XXVI
Economic Summary
1995 1999
Total GDP (US$ billion) 59.6 60.5
Real GDP growth (per cent) 2.8 2
GDP per head (US$) 872 816
Inflation (per cent) 49.7 21.3
Foreign exchange reserves (US$ billion) 6.4 4.2
Oil production (million barrels per day) 3.6 3.5
Total foreign debt (per cent of GDP) 36.7 22.4
Current account balance (US$ billion) 3.4 5.0
Merchandise exports (US$ billion) 18.4 16.0
Merchandise imports (US$ billion) 12.8 12.2
Source: Datastream, 2000; Business Monitor International, 2000b.
Iran has a large, diverse state run economy with extensive consumer subsidies. Oil revenues account
for 18 per cent of GDP and provide 78 per cent of export revenues. The Central Bank of Iran gradually
is unifying several overvalued exchange rates to a single market determined rate; continued progress
here should boost non-oil exports. The overvalued exchange rate has eroded non-oil exports, and
dependence on oil export revenue makes import volumes subject to oil price fluctuations. As a result
of shortages, the Government rations foreign exchange to service foreign debt and pay for essential
imports, such as foodstuffs.
Key potential sectors for foreign investment include oil and gas, mining, mineral processing and
petrochemicals. All these now are open to buy-back type investments whereby foreign investors
undertake construction and financing work with expenses repaid out of project revenue. However,
lack of a clear regulatory and constitutional framework, and the United States Iran Libya Sanctions
Act constrain foreign investment.3 Parliamentary approval in August 2000 of new legislation reforming
limits on foreign equity levels, profit repatriation and protection against nationalisation have improved
significantly foreign investment prospects.
Iran is increasing its integration with the global economy. In May 2000, the World Bank approved its
first new loans for Iran since 1993. In addition, Iran has applications pending for WTO accession and
access to IMF financing.
3 The Iran Libya Sanctions Act, ILSA, prohibits investment by US companies, or companies with business in the United
States, or US nationals working for foreign companies, from investing more than US$20 million in Iran’s petroleum sector.

C o u n t r y S u m m a r i e s
P A G E XXVII
BAHRAIN
Population 643 000 (1997); 61 per cent Bahraini nationals
Form of state Traditional monarchy
Head of state HH Sheikh Hamad bin Isa al-Khalifa, Amir of the State of Bahrain
Head of government Prime Minister Khalifa bin Salman Al Khalifa
Cabinet Council of Ministers appointed by the Prime Minister and monarch
Elections None. Monarch is hereditary; monarch appoints the Prime Minister
Legislative branch Unicameral National Assembly dissolved in 1975; Amir and Cabinet
assumed legislative powers. An advisory council was appointed in 1992
Bahrain became a British protectorate in 1861. It developed significantly following the discovery of oil
in the 1930s and became fully independent in 1971. In 1999, Sheik Hamad became Amir. He released
political prisoners, helping to reduce sporadic political turmoil. However, to fully resolve political
dissent, the Government may need to address demands for greater political freedom and restore the
National Assembly.
Bahrain has a well respected central bank, the Bahrain Monetary Agency, and transparent legal
institutions. With Oman, it is the only GCC state with a large indigenous working class. By regional
standards, Bahrain’s economy is relatively diversified; it is a significant regional tourism and financial
centre and major aluminium producer.4 Bahrain’s own oil production is relatively small at
40 000 barrels per day, with reserves to last until 2015. Saudi crude refined in Bahrain therefore
accounts for 80 per cent of Bahrain’s petroleum exports.
Economic Summary
1995 1999
Total GDP (US$ billion) 5.8 6.8
Real GDP growth (per cent) 4.0 2.5
GDP per capita (US$) 10 100 10 300
Inflation (per cent) 2.7 0.5
Foreign exchange reserves (US$ billion) 1.3 1.4
Oil production (million barrels per day) 0.14 0.18
Total foreign debt (per cent of GDP) 48.9 39.1
Current account balance (US$ billion) 0.2 0.4
Merchandise exports (US$ billion) 4.1 4.1
Merchandise imports (US$ billion) 3.7 3.5
Source: Datastream, 2000; and Business Monitor International 2000b.
4 Proposed expansion of capacity by the Aluminium Company of Bahrain, would make it the second largest aluminium smelter in the world.

A C C E S S I N G T H E M I D D L E E A S T
B U S I N E S S O P P O R T U N I T I E S I N T H E A R A B I A N P E N I N S U L A A N D I R A N
P A G E XXVIII
KUWAIT
Population 2 271 000 (1998); 32 per cent Kuwait nationals
Form of state Nominal constitutional monarchy
Head of state HH Sheikh Jaber al Ahmad, Amir of the State of Kuwait
Head of government HH Sheikh Saad al-Abdullah al Salem Al Sabah, Prime Minister and
Crown Prince
Cabinet Council of Ministers appointed by the Prime Minister and approved by
the monarch
Elections Legislative elections for the National Assembly, with male suffrage
Legislative branch A unicameral national assembly, the Majles al-Umma, has 50 seats
Kuwait became an autonomous British protectorate in 1899. Despite affirming Kuwait’s borders a
number of times, Iraq invaded and occupied Kuwait in 1990. In 1991, following widespread Iraqi
destruction and sabotage, the US-led United Nations forces ejected Iraq in Operation Desert Storm.
Kuwait has around 10 per cent of the world’s oil reserves and significant excess production capacity.
Petroleum accounts for 40 per cent of GDP, 89 per cent of export revenues and 78 per cent of
government revenues. Between 1991 and 1993, Kuwait experienced rapid growth driven by
reconstruction; after that, real growth returned to 2 per cent per year until 1998. In January 1999, the
Government began a reform program designed to reduce subsidies and privatise health care,
telecommunications and utilities. It also seeks to liberalise foreign direct investment rules, allow full
foreign ownership of Kuwaiti projects and find mechanisms to allow foreign oil companies to operate
oil fields in Northern Kuwait. However, considerable resistance in the National Assembly to these
reforms, means reform is slower than in some other GCC economies.
Economic Summary
1995 1999
Total GDP (US$ billion) 26.6 30.4
Real GDP growth (per cent) 1 0.9
GDP per head (US$) 14 753 14 500
Inflation (per cent) 2.7 1.3
Oil production (million barrels per day) 2.0 1.9
Total foreign debt (per cent of GDP) 37.6 29.2
Current account balance (US$ billion) 5.0 6.6
Merchandise exports (US$ billion) 12.8 12.2
Merchandise imports (US$ billion) 7.8 6.6
Source: Datastream 2000; and Business Monitor International, 2000b.

C o u n t r y S u m m a r i e s
P A G E XXIX
SULTANATE OF OMAN
Population 2.29 million (1997); 73 per cent Omani
Form of state Monarchy
Head of state HM Sultan Qaboos bin Said al Said
Head of government HM Sultan Qaboos bin Said al Said
Cabinet Appointed by the Sultan
Elections Limited suffrage (150 000), chosen by the Sultan to vote in elections
Legislative branch Majles is a bicameral assembly but its power is limited to proposing
legislation, and it largely is advisory in nature
Oman has an ancient history as a commercial centre and occupies the choke point of the Strait of
Hormuz, facing Iran, through which two thirds of the world’s oil trade passes. Oman was largely
closed to the outside world and undeveloped until Sultan Qaboos acceded in 1970. He used oil
revenues to provide basic infrastructure and services. In the 1990s, his efforts focused on implementing
structural reform and increasing the private sector’s role, particularly in utilities provision.
Economic Summary
1995 1999
Total GDP (US$ billion) 13.8 15.6
Real GDP growth (per cent) 4.8 1.6
GDP per head (US$) 6 480 6 080
Inflation (per cent) -1.3 0.8
Oil production (million barrels per day) 0.86 0.89
Total foreign debt (per cent of GDP) 23.0 29.5
Current account balance (US$ billion) -0.8 -0.9
Merchandise exports (US$ billion) 6.1 7.23
Merchandise imports (US$ billion) 4.3 4.7
Source: Datastream, 2000; and Business Monitor International, 2000a.
In 1994, Oman offered the Gulf’s first build, operate, transfer project, BOT, the Manah power station;
currently, it is extending BOT type arrangements to other infrastructure areas, and privatising ports
telecommunications, airports, utilities, banking, insurance and power generation.5 Further, it is developing
a strong regulatory framework in the electricity sector, allowing competition between generators.
Oman is diversifying into the gas and services sectors. Liquefied natural gas, LNG, exports began in
April 2000, following a US$2.5 billion investment. Tourism facilities also are being upgraded rapidly,
and new hotel investment eagerly sought, although occupancy currently is low.
5 The Government is in the final stages of privatising the Seeb International Airport in the capital, Muscat, and activelyseeking independent power project, IPP, proposals from foreign electricity generators. It also seeks to float part of the statetelephone company on the Muscat Securities Market.

A C C E S S I N G T H E M I D D L E E A S T
B U S I N E S S O P P O R T U N I T I E S I N T H E A R A B I A N P E N I N S U L A A N D I R A N
P A G E XXX
QATAR
Population 560 000; 29 per cent Qatari
Form of state Monarchy
Head of state HH Sheikh Hamad bin Khalifa Al-Thani, Amir of the State of Qatar
Head of government HH Abdullah bin Khalifa al Thani, Prime Minister (brother of the Amir)
Cabinet Council of Ministers appointed by the Crown Prince
Elections Limited universal suffrage (municipal elections only); however, the
Crown Prince, who deposed his father in a bloodless coup in 1995,
intends to gradually transform Qatar into a constitutional monarchy
Legislative branch Majles is a unicameral advisory council, with 35 seats and members
appointed by the monarch
Qatar is the smallest Gulf country. In 1916, it became a British protectorate, and in 1968, it contemplated
joining the UAE following British withdrawal. In 1971, Qatar declared independence and in 1995, the
modernising Sheik Hamad bin Khalifa Al-Thani became Emir. The Emir has ended press censorship,
and set up the Middle East’s most outspoken television channel. He promises to form a parliament
and institute municipal elections with universal suffrage.
Economic Summary
1995 1999
Total GDP (US$ billion) 7.5 12.9
Real GDP growth (per cent) 1.6 2.5
GDP per head (US$) 13 664 23 500
Inflation (per cent) 3.0 2.0
Foreign exchange reserves (US$ billion) 1.5 1.3
Oil production (million barrels per day) 0.45 0.63
Total foreign debt (per cent of GDP) 59.9 94.4
Current account balance (US$ billion) -2.3 -0.6
Merchandise exports (US$ billion) 3.1 5.0
Merchandise imports (US$ billion) 3.3 3.5
Source: Datastream, 2000; and Business Monitor International, 2000a.
Oil and gas dominate Qatar’s economy. Qatar shares the world’s largest gas field with Iran, and has
spent US$25 billion since 1987 on an investment program to develop this gas field and associated
downstream industries. LNG sales are set to rise from 5.7 million tonnes in 1999 to 18.3 million
tonnes in 2003, with the LNG sector’s share in GDP projected to rise from 8 per cent in 1998 to 18 per
cent in 2003 (Fawzi Al-Khatib and Tarik Al-Malki, 2000).

C o u n t r y S u m m a r i e s
P A G E XXXI
YEMEN
Population 17.1 million
Form of state Republic
Head of State HH President Lieutenant General Ali Abdullah Saleh
Head of government Prime Minister Dr Abd al-Karim Ali al Aryani
Cabinet Council of Ministers appointed by the President on the Prime Minister’s advice
Elections Direct popular vote
Legislative branch Unicameral 301 seat House of Representatives elected by popular vote
Modern Yemen resulted from the amalgamation of the former People’s Democratic Republic of Yemen,
PDRY, and the Yemen Arab Republic, YAR, in 1990. Before this, the two countries had fought a
number of wars. Civil war erupted in 1994, following attempted secession by the south, which ended
with the capture of Aden, and arrest of former PDRY leaders, thereby confirming unification.
Economic Summary
1995 1999
Total GDP (US$ billion) 3.7 4.7
Real GDP growth (per cent) 8.6 2.8
GDP per head (US$) 239 265
Inflation (per cent) 56.3 7.9
Oil production (million barrels per day) 0.37 0.41
Total foreign debt (per cent of GNP) 169 94
Current account balance (US$ million) 183 326
Merchandise exports (US$ billion) 1.9 2.5
Merchandise imports (US$ billion) 2.6 3.0
Source: Datastream, 2000.
Yemen is the poorest Gulf economy, but grew strongly in the mid 1990s when oil production began.
It is undertaking IMF-sponsored reforms to reduce subsidies, quell inflation, improve the Government’s
fiscal position and encourage investment. Reflecting its strong economic reform record, the IMF
extended refinancing of US$512 million between 1997 and 2000, which with rising aid inflows and
debt relief via the Paris Club, allows Yemen to meet its external obligations.
The port of Aden is undergoing large scale redevelopment, under a 20 year management contract
with the Port of Singapore Authority, which holds 60 per cent equity. The port should capture significant
Europe-Asia container traffic, as it avoids the detour into the Persian Gulf.

A C C E S S I N G T H E M I D D L E E A S T
B U S I N E S S O P P O R T U N I T I E S I N T H E A R A B I A N P E N I N S U L A A N D I R A N
P A G E XXXII
REFERENCES
Data for tables in the preceding section draws on several sources. The East Asia Analytical Unit has
made every effort to present consistent data.
British Bank of the Middle East, 1999, ‘Sultanate of Oman’, Business Profile Series, Group Public
Affairs, Hong Kong and Shanghai Banking Corporation, Hong Kong.
Business Monitor International, 2000a, ‘The Gulf’, Middle East Monitor, July.
___ 2000b, ‘The Gulf’, Middle East Monitor, August.
Central Intelligence Agency, 1999, ‘World Factbook’, www.cia.gov/cia/publications/factbook/, accessed
on 3 July 2000.
Datastream, 2000, Information on the Datastream product is available on www.primark.com.
Economist Intelligence Unit, 1999a, Oman 1999-2000 Country Profile, EIU, London.
___ 1999b, Iran 1999-2000 Country Profile, EIU, London.
___ 1999c, Bahrain and Qatar 1999-2000 Country Profile, EIU, London.
___ 1999d, Saudi Arabia 1999-2000 Country Profile, EIU, London.
___ 1999e, Yemen 1999-2000 Country Profile, EIU, London.
___ 1999f, United Arab Emirates 1999-2000 Country Profile, EIU, London.
___ 1999g, Kuwait 1999-2000 Country Profile, London.
Fawzi Al-Khatib and Tarik Al-Malki, 2000, ‘Clarifying the Region’s Strategy for Economic and Structural
Reform’, paper presented at the Gulf 2000: Energy, Infrastructure and Finance Conference,
Abu Dhabi, 28 and 29 March.
International Energy Agency, 2000, Oil Market Report, www.iea.org, accessed on 3 July 2000.
US Department of State, Bureau of Economic and Business Affairs, 2000, Country Commercial Guides,
Saudi Arabia, United Arab Emirates, Oman, Bahrain, Kuwait, Qatar and Yemen; www.state.gov/
www/about_state/business/com_guides/, accessed on 3 July, 2000.
US Energy Information Administration, 2000, Country Analysis Briefs, www.eia.doe.gov/emeu/cabs/
contents, accessed on 3 July 2000.

C h a p t e r 1
P A G E 1
ECONOMIC PROSPECTS
KEY POINTS
• Saudi Arabia and Iran are the Gulf region’s largest economies,
followed by the United Arab Emirates, UAE, which has the highest
per capita income and growth.
• In most Gulf economies, economic growth is lower than workforce
growth. Other major reform drivers are the desire to diversify out of
oil, fiscal pressures and declining oil reserves in Oman, Bahrain, Qatar
and Dubai in the UAE.
• Despite modest economic growth over the 1990s, these reform
pressures will create new opportunities for foreign firms; fiscal
pressures will increase the importance of private finance and privately
provided infrastructure, while the drive to diversify will open new
opportunities in gas, heavy industry and service sectors. Efforts to
boost the employment of Gulf nationals will increase the need for
education and skills training.
• Current high oil prices could threaten reform momentum; however,
most Gulf Governments recognise the inevitability of volatile oil prices
and remain committed to reform.

A C C E S S I N G T H E M I D D L E E A S T
B U S I N E S S O P P O R T U N I T I E S I N T H E A R A B I A N P E N I N S U L A A N D I R A N
P A G E 2
Since the first oil shock in 1973, oil wealth has funded rapid growth in the Arabian Peninsula and
Iranian economies, the region called the Gulf economies throughout this report1. In the 1990s, lower
and volatile oil prices, and failure to open economies and diversify from oil moderated Gulf economies’
growth performance. However, now the young, rapidly growing populations and massive infrastructure
needs of the major oil producers, Saudi Arabia, Iran, the United Arab Emirates, UAE, and Kuwait, are
generating strong pressures for economic reform.
Throughout the region, political leaders appear willing to respond to these challenges. Hence, in the
2000s, these governments are likely to seek to intensify diversification efforts, open their trade and
investment regimes, and reduce their pervasive economic role, including by privatising infrastructure
and industry. These reforms should help stimulate more balanced and robust growth, reduce
vulnerability to swings in international oil prices, and expand business opportunities for foreign traders
and investors.
Young, rapidly growing populations are creating significant pressures to lift economic growth and
diversify economic activity. As well as providing a huge workforce, they also create a strong demand
for education, health services and infrastructure like roads, water supply and electricity, which the
state traditionally provides in Gulf economies. Demand for new services imposes fiscal pressures on
Gulf governments, especially as many run significant deficits. This demand creates a major incentive
to increase private sector involvement in infrastructure provision.
In 2000 and 2001, high oil prices will boost government and consumer expenditure, and lift import
growth. While high oil prices could reduce short term economic reform pressures, most governments
recognise oil prices are volatile. Their long term commitment to reform should remain firm because
these governments need to deliver rising prosperity.
Australia’s longstanding trade relationship with the Gulf economies is built on economic
complementarity and Australia’s competitiveness as a reliable supplier of high quality bulk agricultural
commodities. In the 1990s, this relationship broadened as major new exports, including cars and
alumina, emerged. As economic reforms and diversification continue, Australia’s opportunities to
expand and broaden trade and investment links with the Gulf economies should continue to grow.
HISTORY
Advanced civilisations date back at least 4 500 years in the Gulf, although many states are relatively
recent. Modern Saudi Arabia, Kuwait, Qatar, Bahrain, and Yemen all were formed in the eighteenth
or nineteenth centuries from Arabian Peninsula cities and nomadic tribes, while Oman and Iran are
the remainder of once large empires.
1 In line with standard United Nations’ practice, Australia officially uses ‘the Persian Gulf’. Readers should note that where the
term ‘the Gulf’ is used, it refers to the Persian Gulf.

E c o n o m i c P r o s p e c t s
P A G E 3
The Ottoman Empire exerted considerable influence over the Arabian Peninsula, present day Iraq,
and parts of Iran from the sixteenth to the nineteenth centuries. During the second half of the nineteenth
century, Ottoman influence in the Arabian Peninsula gradually dissipated under pressure from local
tribes in the interior, and as the Gulf and Peninsula coast came under British naval domination.
Protectorate arrangements with local Arab rulers continued until the British withdrew in 1968.
The British defined many borders in the nineteenth century. Currently, many of these are contested;
no defined borders separate parts of the UAE and Oman, Saudi Arabia and Yemen, and Kuwait and
Saudi Arabia. However, progress in delineating these borders is being made. Iran had periods of
British, Soviet and US influence during the twentieth century. The Shah’s monarchy was overthrown
by the 1979 Islamic Revolution.
Before widespread commercial exploitation of oil began in the 1950s, many smaller Arabian Peninsula
economies were underdeveloped, with mainly nomadic populations. When world oil prices jumped in
1973, living standards quickly rose to first world levels, and urbanisation was rapid. Post oil-shock
prosperity rapidly expanded the population with a baby boom and major inflows of contract labour for
skilled and unskilled jobs.
Since the 1970s oil price rises, the 1980-88 Iran-Iraq war, Iraq’s 1990-91 invasion of and subsequent
ejection from Kuwait, and significant tensions between Iran and neighbouring Arab states have
dominated Gulf history. By 2000, relations between Iran and Saudi Arabia had improved gradually,
significantly reducing regional tensions. The US Fifth Fleet and British forces are based in Bahrain,
and most Arab states in the area recognise that these forces improve regional security. The main
exception, Iraq, remains subject to the United Nations’ blockade initiated in 1991 in the aftermath of
Operation Desert Storm, and is not considered in this report.

A C C E S S I N G T H E M I D D L E E A S T
B U S I N E S S O P P O R T U N I T I E S I N T H E A R A B I A N P E N I N S U L A A N D I R A N
P A G E 4
Ph
ilip
pin
es
Sin
ga
po
re
Th
aila
nd
Ho
ng
Ko
ng
Ye
me
n
Ba
hra
in
Qa
tar
Om
an
Ku
wa
it
UA
E
Iran
Sa
ud
i Ara
bia
US
$ b
illio
n
0
20
40
60
80
100
120
140
160
180
REGIONAL ECONOMIC PERFORMANCE
The Gulf economies’ size, income levels and growth performance vary considerably depending on
their oil production, human resources, economic openness and success in diversification.
Market Size
Only Iran (with 65 million people) and Saudi Arabia (with 21 million people) have reasonably large
populations and gross domestic products, GDPs; other Gulf economies are relatively small (Figure 1.1).
Saudi Arabia is the only Gulf economy bigger than Singapore or the Philippines.
F i g u r e 1 . 1
Saudi Arabia Is Region’s Largest Economy
Nominal Gross Domestic Product, 1999
Note: Figures for Saudi Arabia, Iran, Kuwait, Oman, Qatar, Bahrain, Yemen and the UAE are based on estimates by Business Monitor
International, 2000a. Figures for Asian economies come from CEIC, 2000.
Source: Business Monitor International, 2000a; and CEIC, 2000.

E c o n o m i c P r o s p e c t s
P A G E 5
Ye
me
n
Ph
ilip
pin
es
Th
aila
nd
Om
an
a
Sa
ud
i A
rab
ia
Ba
hra
in
Ku
wa
ita
Qa
tara
UA
E
Ho
ng
Ko
ng
Sin
ga
po
re
Ira
n
Pe
r ca
pita
GN
P (
US
$ '0
00
) a
nd
PP
P p
er
ca
pita
GN
P (
US
$ '0
00
)
0
5
10
15
20
25
30
35
Nominal GNP per capitaPPP GNP per capita
F i g u r e 1 . 2
Purchasing Power Highest in the UAE and Qatar
Nominal Gross National Product per Capita and PPP Gross National Product
per Capita, 1998
Note: a PPP GNP per capita data are not available for these economies.
b GNP is the value of the final output of goods and services produced by residents of an economy plus net primary income from
non-resident sources.
c PPP is estimated by determining the number of units of a country’s currency required in country to buy a standard bundle of
goods and services that US$1 would buy in the United States, and using this information to adjust the country’s US dollar per
capita income to better reflect its actual purchasing power.
Source: World Bank, 2000a; and Datastream, 2000.
Kuwait, Qatar and the UAE have the highest purchasing power as measured by per capita GDP;
Yemen and Iran have very low per capita incomes (Figure 1.2). However, market potential probably
is greater than these figures indicate, as low domestic prices for many non-traded goods increase
consumers’ purchasing power. Purchasing power parity, PPP, estimates of per capita income show
the average citizen’s capacity to consume goods and services once account is taken of local price
differences. In Saudi Arabia, Iran, Yemen and Bahrain, the difference between PPP per capita gross
national product and US dollar per capita gross national product ranges is substantial (Figure 1.2).
Most notably, in Iran, the PPP figure for GNP per capita is $5 121 compared to a per capita GDP
figure of US$1 650.

A C C E S S I N G T H E M I D D L E E A S T
B U S I N E S S O P P O R T U N I T I E S I N T H E A R A B I A N P E N I N S U L A A N D I R A N
P A G E 6
Pe
r ce
nt
0
1
2
3
4
5
6
Kuwait Bahrain Yemen UAE Qatar Iran Saudi Arabia
F i g u r e 1 . 3
Saudi Growth Slowest
Average Annual Real GDP Growth Rate over Decade, 1990-99
Note: While Saudi Arabia is the region’s slowest growing economy, it is by far the largest economy, so a given level of economic growth
results in more economic activity in absolute terms.
Source: Datastream, 2000.
Growth Performance
In the 1990s, largely reflecting oil price and production swings, Gulf economies’ real GDP growth
performance was erratic. Over the decade as a whole, real GDP growth was moderate, averaging
1.4 per cent in Saudi Arabia, 3.1 per cent in Iran, 3.6 per cent in the UAE and up to 5.2 per cent in
Kuwait (Figure 1.3).2
2 Kuwait’s growth figures are distorted by the Gulf War induced contraction in 1990 and the subsequent rebound in 1992 and 1993.

E c o n o m i c P r o s p e c t s
P A G E 7
Pe
r ce
nt
-10
0
10
20
30
40
50
60
1990 1991 1992 1993 1994 1995 1996 1997 1998 1999 2000
Yemen
Kuwait
Iran
Qatar
UAE
Saudi Arabia
Bahrain
Oman
F i g u r e 1 . 4
Iran Has the Highest Inflation
Annual Consumer Price Rises in Arabian Peninsula and Iran, Per cent
Source: Datastream, 2000.
Inflation
By the 1990s, Arabian Peninsula governments had controlled the high inflation of the 1970s oil boom
years (Figure 1.4). Gulf Cooperation Council, GCC, economies reduced inflation by controlling money
supply and financing budget deficits by issuing bonds, rather than printing money. In the early 1990s,
Yemen’s severe inflation was due to shortages generated by the civil war and increased government
spending associated with unifying North and South Yemen. However, by 1997, Yemen tightened
monetary policy and issued bonds to finance budget deficits, quelling inflation. On the other hand,
Iran’s weak macroeconomic management, especially loose monetary policy, kept annual inflation
above 20 per cent throughout the 1990s.

A C C E S S I N G T H E M I D D L E E A S T
B U S I N E S S O P P O R T U N I T I E S I N T H E A R A B I A N P E N I N S U L A A N D I R A N
P A G E 8
Per
cent
0
10
20
30
40
50
60
70
80
90
Qatar IMF-3 UAE Yemen Kuwait Oman SaudiArabia
Iran
External debt as a share of GDP
Share of short term debt in total external debt
F i g u r e 1 . 5
Short Term Debt Is High
External Debt as a Share of GDP and the Share of Short Term Debt, 1998
Note: IMF-3 refers to the Republic of Korea, Indonesia and Thailand.
Source: Bank for International Settlements, 2000; and World Bank, 2000b.
Foreign Debt Exposure
Except for Qatar, by international standards, Gulf economies did not have high external debt burdens
in 1998. Qatar has a large debt due to its foreign borrowings to develop its huge gas deposits; these
loans can be repaid readily from projected gas sales. However, most Gulf economies, and particularly
Iran and Kuwait had a high proportion of short term debt, well above that of the Republic of Korea,
Indonesia and Thailand (the IMF-3) in 1998 (Figure 1.5).
EXCHANGE RATE ARRANGEMENTS
Fixed and pegged3 exchange rates predominate in the region making A$:US$ movements significant
in driving Australian competitiveness. The UAE, Bahrain, Saudi Arabia, Kuwait, Qatar and Oman
maintain longstanding fixed exchange rates against the US dollar (Table 1.1). Fixed exchange rates
are backed by significant official and unofficial foreign exchange reserves generated from oil income.
3 Fixed exchange rates do not change over the long term, while pegged exchange rates are revalued periodically. Saudi
Arabia, the UAE, Kuwait, Oman, Qatar, and Bahrain all have maintained fixed exchange rates, pegged to the US dollar,
since the early 1970s, while Iran and Yemen maintain pegged rates which have been revised periodically.

E c o n o m i c P r o s p e c t s
P A G E 9
In late 1998 and early 1999, in the wake of the Asian financial crisis, Saudi foreign exchange reserves
proved more than adequate to counter speculation against the Saudi riyal.
Yemen’s exchange rate is a crawling peg against the US dollar and given Yemen’s higher inflation
rate, the dinar has been devaluing slowly. Iran maintains a complex system of multiple rates, which
the central bank eventually wishes to unify. The official rate, available only to Iranian government
ministries (R1 750:US$1), was only about 20 per cent of the more market determined rate that other
importers pay (R8 200:US$1 in mid August 2000). Consequently, private sector importers often cannot
obtain foreign exchange, even for export processing. Scarce foreign exchange is rationed to service
foreign debt and pay for essential goods imports.
T a b l e 1 . 1
Fixed Exchange Rates Predominate
Exchange Rates by Economy, Units per US dollar
Economy/currency Units per US dollar Units per US dollar
1995 August 2000
Bahrain dinar, BHD 0.37 0.37
Iran rial, IRR 1747.93a
1 750 to 8 200
Kuwait dinar, KUD 0.30 0.30
Oman rial, OMR 0.38 0.38
Qatar riyal, QAR 3.64 3.64
Saudi Arabia riyal, SAR 3.75 3.75
United Arab Emirates dirham, AED 3.67 3.67
Yemen dinar, YED 40.83 158.59
Note: a Official rate only.
Source: International Monetary Fund, 2000; and Central Intelligence Agency, 1999.
DRIVERS OF ECONOMIC DYNAMISM
In the 2000s, the need to improve modest economic growth rates and diversify, urgent demographic
and fiscal pressures, and in some cases, declining oil reserves, should drive considerable structural
change in Gulf economies. This should boost foreign business opportunities.

A C C E S S I N G T H E M I D D L E E A S T
B U S I N E S S O P P O R T U N I T I E S I N T H E A R A B I A N P E N I N S U L A A N D I R A N
P A G E 10
Popula
tion 1
998
Per
cent gro
wth
per
year
1990-9
8
0
10
20
30
40
50
60
70
Iran SaudiArabia
Yemen UAE Oman Qatar Bahrain World
7
6
5
4
3
2
1
0
Population 1998 (LHS)
Per cent growth per year, 1990-98 (RHS)
DEMOGRAPHICS
Except for Kuwait, populations in the Gulf economies are growing much faster than the world average,
with high natural increases and continuing inflows of migrant workers (Figure 1.6).4 Rates of natural
increase have been high since the oil boom-baby boom in the 1970s. Hence GCC economy populations
are very young, with two thirds under 25 years and half under 15 years (Figure 1.7).5 This creates
significant potential for exporters of youth related goods and services, and will drive growing urban
infrastructure demand and growing demand for convenience foods as household formation increases.
(See Chapter 3 - Business Environment.)
F i g u r e 1 . 6
Population Growth Is High…
Population Level and Growth Rate, 1990-97
Source: World Bank, 1999a; and Asian Development Bank, 1999.
4 This rapid population growth is set to continue, with projected population increases between 1998 and 2050 of 161 per cent
in Saudi Arabia, 51 per cent in the UAE, 72 per cent in Iran, 238 per cent in Oman, 43 per cent in Qatar, 64 per cent in
Bahrain, 86 per cent in Kuwait and 236 per cent in Yemen, compared to a projected increase in world population of 49 per
cent (United Nations, 2000).
5 Iran’s population also is very young with 70 per cent of the population aged under 25. Kuwait’s low population growth is due
to the exodus of locals and expatriates during the Gulf War.

E c o n o m i c P r o s p e c t s
P A G E 11
F i g u r e 1 . 7
…and Populations Young
Population Age Structure in GCC Economies
Source: Gulf Cooperation Council, 1999.
Population Growth and Reform
Moderate real economic growth and rapid population growth together lower per capita living standards.
Between 1990 and 1998, average per capita gross national product fell at an annual rate of
1.1 per cent in Saudi Arabia, 1.6 per cent in Iran and 2.4 per cent in Bahrain (World Bank, 2000a).
Falling living standards motivate reforms.
Rapid workforce growth, flowing from earlier population growth, also drives major reforms, particularly
in Saudi Arabia, Bahrain, Qatar, the UAE and Iran where population growth exceeds economic growth
(Figure 1.8).6 Such a situation increases unemployment pressures, although official unemployment
statistics generally are not available in Gulf economies, except for Iran where the official unemployment
rate was 13.1 per cent in the year ending 20 March 1998.
Saudi Arabia illustrates the pressures building from the divergence between workforce growth and
economic growth. The government workforce, the mainstay of employment to date, is unlikely to
expand. Saudiisation mandates the replacement of skilled expatriates with Saudis, providing a pool
of jobs for new Saudi citizens entering the workforce, with the Government expecting private sector
6 The workforce is defined as all people willing and able to work at the current wage rate, whether employed or unemployed.
Per
cent
0
5
10
15
20
25
Lessthan
5
6-10 11-15 16-20 21-25 26-30 31-35 36-40 41-45 46-50 51-55 56-60 Greaterthan60
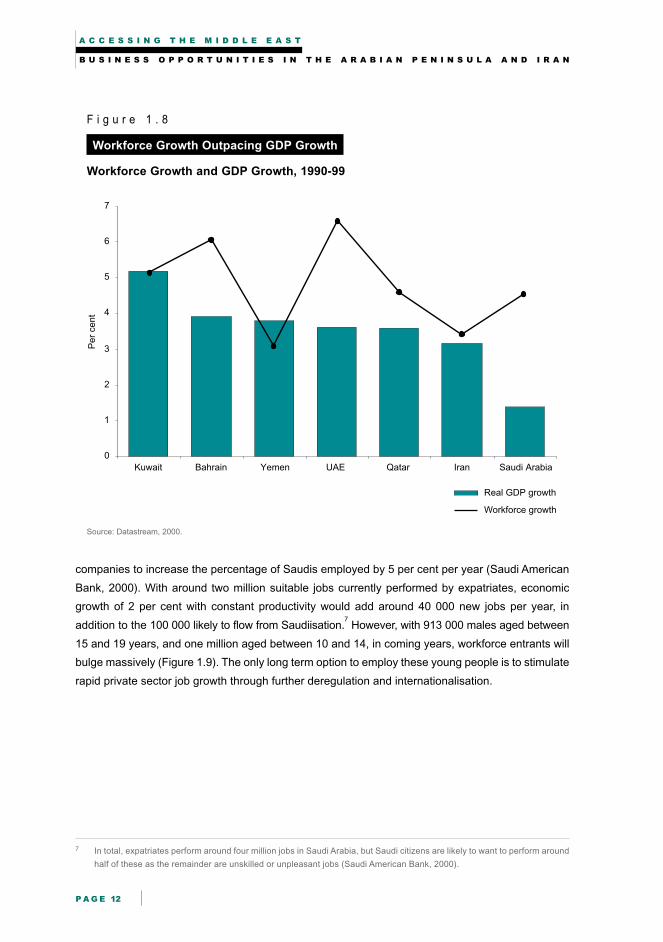
A C C E S S I N G T H E M I D D L E E A S T
B U S I N E S S O P P O R T U N I T I E S I N T H E A R A B I A N P E N I N S U L A A N D I R A N
P A G E 12
Per
cent
0
1
2
3
4
5
6
7
Kuwait Bahrain Yemen UAE Qatar Iran Saudi Arabia
Real GDP growth
Workforce growth
F i g u r e 1 . 8
Workforce Growth Outpacing GDP Growth
Workforce Growth and GDP Growth, 1990-99
Source: Datastream, 2000.
companies to increase the percentage of Saudis employed by 5 per cent per year (Saudi American
Bank, 2000). With around two million suitable jobs currently performed by expatriates, economic
growth of 2 per cent with constant productivity would add around 40 000 new jobs per year, in
addition to the 100 000 likely to flow from Saudiisation.7 However, with 913 000 males aged between
15 and 19 years, and one million aged between 10 and 14, in coming years, workforce entrants will
bulge massively (Figure 1.9). The only long term option to employ these young people is to stimulate
rapid private sector job growth through further deregulation and internationalisation.
7 In total, expatriates perform around four million jobs in Saudi Arabia, but Saudi citizens are likely to want to perform around
half of these as the remainder are unskilled or unpleasant jobs (Saudi American Bank, 2000).
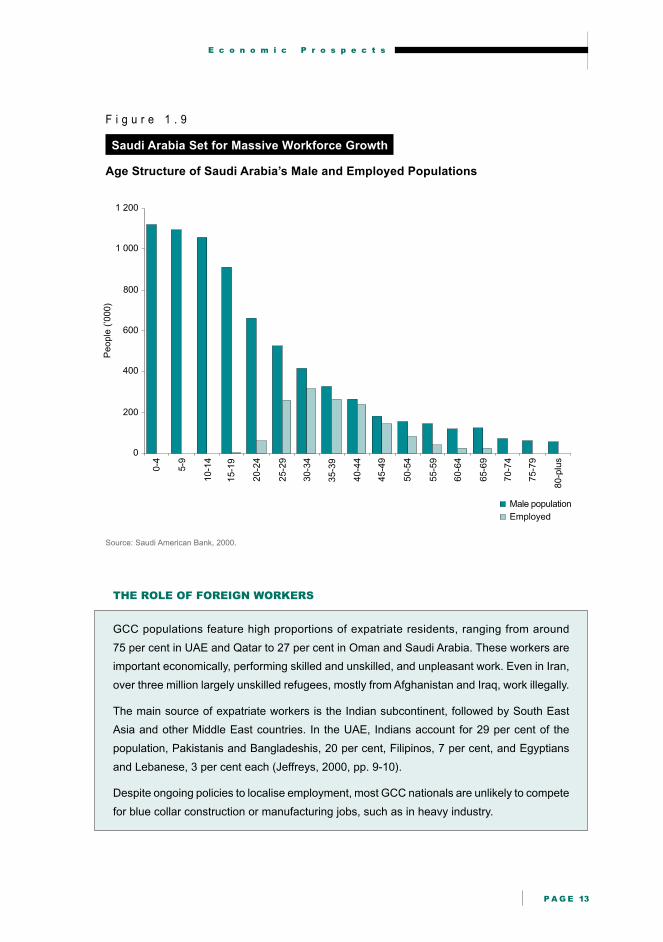
E c o n o m i c P r o s p e c t s
P A G E 13
F i g u r e 1 . 9
Saudi Arabia Set for Massive Workforce Growth
Age Structure of Saudi Arabia’s Male and Employed Populations
Source: Saudi American Bank, 2000.
THE ROLE OF FOREIGN WORKERS
GCC populations feature high proportions of expatriate residents, ranging from around
75 per cent in UAE and Qatar to 27 per cent in Oman and Saudi Arabia. These workers are
important economically, performing skilled and unskilled, and unpleasant work. Even in Iran,
over three million largely unskilled refugees, mostly from Afghanistan and Iraq, work illegally.
The main source of expatriate workers is the Indian subcontinent, followed by South East
Asia and other Middle East countries. In the UAE, Indians account for 29 per cent of the
population, Pakistanis and Bangladeshis, 20 per cent, Filipinos, 7 per cent, and Egyptians
and Lebanese, 3 per cent each (Jeffreys, 2000, pp. 9-10).
Despite ongoing policies to localise employment, most GCC nationals are unlikely to compete
for blue collar construction or manufacturing jobs, such as in heavy industry.
Pe
op
le (
’00
0)
0
200
400
600
800
1 000
1 200
0-4
5-9
10
-14
20
-24
25
-29
30
-34
40
-44
45
-49
50
-54
55
-59
60
-64
65
-69
70
-74
75
-79
80
-plu
s
Male population
Employed
35
-39
15
-19
A C C E S S I N G T H E M I D D L E E A S T
B U S I N E S S O P P O R T U N I T I E S I N T H E A R A B I A N P E N I N S U L A A N D I R A N
P A G E 14
Workforce Growth and Education
To avoid economic disruption as local citizens replace skilled expatriates in the workforce, nationals
must have better access to education and skills training. This opens up opportunities to attract additional
students to Australia and provide in-country educational services. (See Chapter 2 -
Australian Opportunities.)
DIVERSIFICATION AWAY FROM OIL
All Gulf economies are highly reliant on oil. The share of oil in GDP ranges from 17 per cent in Iran to
38 per cent in Qatar (Figure 1.10). Oil reliance for exports is higher, ranging from 23 per cent in
Bahrain to 90 per cent in Saudi Arabia, while oil reliance for government finances ranges from 41 per
cent in Iran to 89 per cent in Kuwait (Figure 1.10). Consequently, oil prices strongly influence economic
activity, export income, domestic demand and government expenditure, particularly capital expenditure.
To reduce oil dependence, regional governments employ four main strategies:
• developing gas industries and gas powered heavy industry, including petrochemicals, aluminium
and steel
• expanding service sectors including tourism, finance, transport and distribution
• promoting import substitution industrialisation via tariff barriers
• requiring defence offsets, which involve suppliers of military equipment investing in often unrelated
areas, as part of their contractual obligations.
Expansion of Gas and Heavy Industries
Saudi Arabia, Qatar, Iran, Oman and the UAE are expanding their gas industries; to achieve this,
they seek foreign involvement. (See Chapter 4 - Foreign Investment.) As Iran, Qatar, the UAE and
Saudi Arabia alone contain 30 per cent of the world’s proven natural gas reserves, many with relatively
low development costs, gas developments have enormous potential (BP Amoco, 1999).
In addition to being exported, gas also will be used as an energy source to generate electricity and
fuel energy intensive industry. A prime new development is the proposed Dolphin pipeline from Qatar’s
giant North gas field through the UAE and into Oman; if it proceeds, it will fuel electricity generation
and aluminium, steel and petrochemical industries (Fawzy, 2000). Similarly, in Saudi Arabia, the
Crown Prince has invited selected foreign companies to submit proposals for upstream and
downstream gas development projects. (See Chapter 4 - Foreign Investment.)

E c o n o m i c P r o s p e c t s
P A G E 15
��������
�
�
�
��
��
�
��
��
��
��
��
������������ ���� ������ ���� ����� �� !�"����
�"��������#$%��&�"�������'%(����������(�����"�������)*�
F i g u r e 1 . 1 0
Oil the Dominant Economic Driver
Share of Oil Revenue in GDP, Exports and Government Revenue
Note: a Gross domestic product, GDP, figures are for fiscal year 1997-98 for Iran, 1997 for Saudi Arabia, 1998 for Oman, and 1999 for
the UAE and Qatar.
b Export figures are for 1998 for all economies and refer to crude oil and petroleum.
c Government finance figures are for 1998 for Kuwait, Saudi Arabia and Oman, 1997-98 for Iran and Qatar, and 1997 for the UAE.
d For Saudi Arabia and Oman, GDP figures refer to crude petroleum and natural gas. For all other economies, GDP figures refer to oil.
e Government finance figures relate to oil and gas for all economies, except Kuwait where the figures relate to oil only.
Source: Economist Intelligence Unit, 1999a, 1999b, 1999c, 1999d, 1999e, 1999f, 1999g and 1999h; Gulf Cooperation Council, 1999; and
International Economic Data Bank 2000.
Currently, most major regional heavy industry companies, such as Saudi Arabian Basic Industries
Corporation, Dubai Aluminium and the Aluminium Company of Bahrain, are majority state owned.
However, proposed heavy industry expansions require massive amounts of capital. This should
increase opportunities for foreign companies to take equity shares in projects, or at least provide
expertise. Heavy industry expansion also should create additional opportunities for Australia to increase
alumina, and iron and steel making resources exports. (See Chapter 2 - Australian Opportunities.)

A C C E S S I N G T H E M I D D L E E A S T
B U S I N E S S O P P O R T U N I T I E S I N T H E A R A B I A N P E N I N S U L A A N D I R A N
P A G E 16
Stimulating Services Sectors
Gulf economies are expanding their service sectors to diversify their economies. Dubai and Bahrain
are setting the pace, with their service sectors accounting for 70 per cent and 78 per cent of their
respective GDPs, compared to only 49 per cent in Saudi Arabia.8 Dubai is the Arabian Peninsula’s
premier re-export centre, servicing the Middle East and Africa. (See Chapter 5 - Trade.) It also is a
substantial tourism, financial, exhibition and conference centre. Bahrain is a major offshore banking
centre and like Dubai, targets regional headquarters and tourism investment.
With a growing imperative to strengthen private sector employment, all regional economies need to
expand their telecommunications, information technology, tourism, finance and education sectors.
As part of this process, increasing opportunities should emerge for foreign service providers. Already
Oman has committed to liberalise its electricity and telecommunications markets as part of its World
Trade Organization, WTO, accession agreement, while Iran, Oman and Saudi Arabia are attempting
to boost tourism. (See Chapter 2 - Australian Opportunities and Chapter 5 - Trade.)
Import Substitution Policies
In the past, to diversify, many Gulf governments pursued import substitution policies assisted by
trade barriers. With no incentive to export, mostly small local markets and limited foreign competition,
these policies failed to create viable new industries. However, with all regional economies except
Iran and Yemen now WTO members or well advanced in the accession process, these policies will
be even less successful in diversifying industry.9
One major import substitution industry likely to remain is food processing; Saudi Arabia alone has
around 400 plants relying on imports for 75 per cent of their inputs (Austrade, 2000). Further, Saudi
Arabia still protects its agricultural sector.
Defence Offsets
Saudi Arabia, the UAE and Kuwait still use defence offset programs. These raise the cost of military
acquisitions but can provide a form of assistance to foreign companies looking to establish Gulf
businesses. (See Chapter 2 - Australian Opportunities.) However, to be a successful diversification
tool, incentives to export and establish value-adding businesses must be strong.
8 These figures come from Jeffreys, 2000, pp 31-33; Bahrain Monetary Agency, 1998; and World Bank, 2000b. For these
calculations, Dubai’s service sector includes trade, transport and communications, real estate, government services, finance
and insurance, restaurants and hotels, and other services. Bahrain’s service sector includes trade, hotels and restaurants,
transport and communication, social and personal services, real estate, onshore and offshore financial institutions, insurance,
government and household services.
9 The UAE, Kuwait, Qatar and Bahrain already are WTO members. Oman’s accession is imminent, while Saudi Arabia’s
is in process.

E c o n o m i c P r o s p e c t s
P A G E 17
FISCAL PRESSURES
Gulf economies generally run weak fiscal policies, operating deficits in most years, and failing to run
these down when oil revenues are high. Apart from Qatar, all Gulf economies have budget deficits; in
1999, these averaged 7 per cent of GDP (Figure 1.11). Persistent deficits generate large official debt
stocks. For example, Saudi Arabia’s central government debt stock in 1998 was 116 per cent of GDP,
with interest payments consuming 25 per cent of expenditure in 1999 (Saudi American Bank, 2000).
F i g u r e 1 . 1 1
Budget Deficits the Norm
Government Budget Balances as a Percentage of GDP
Note: a The 1990 figure for Kuwait (-137.8) is massively distorted by disruption during the Gulf War.
b 1990 figures and all Bahrain figures are from Datastream, 2000.
Source: Business Monitor International, 2000a; and Datastream, 2000.
While in 2000, high oil prices will relieve fiscal strains, pressures remain to control expenditure and
diversify revenue. All regional governments need to invest more in economic and social infrastructure
as populations boom and demand for utilities, education and health burgeons.
Expenditure Restraint
During the 1990s, uncertainty about oil revenue led Gulf governments to more seriously control
expenditure. For example, the Saudi Government reduced expenditure by 14 per cent in 1998 and by
a further 5 per cent in 1999. Expenditure should rise only 2.2 per cent in 2000, despite higher oil
��������
/�
/
/�
/
�
�
������ �� 0���� !�"���� ���� ������������ ����� ����
/��.�
����� ���

A C C E S S I N G T H E M I D D L E E A S T
B U S I N E S S O P P O R T U N I T I E S I N T H E A R A B I A N P E N I N S U L A A N D I R A N
P A G E 18
prices (Saudi American Bank, 2000; and Business Monitor International, 2000b).10
However, fiscal
control mechanisms are crude, largely relying on slowing or postponing capital spending. Consequently,
the share of capital expenditure in total expenditure fluctuates dramatically (Figure 1.12). This situation
is most serious in Saudi Arabia, where government capital expenditure has declined over the long
term (Figure 1.13).
F i g u r e 1 . 1 2
Capital Expenditure Fluctuates
Share of Capital Expenditure in Total Government Expenditure for GCC Economies,
Per cent
Source: Gulf Cooperation Council, 1999; and Saudi American Bank, 2000.
Revenue Diversification Efforts
Few regional governments impose broad based sales taxes or company or personal income taxes;
instead, most rely on oil revenues to finance government spending. As this introduces excessive
volatility to government receipts, many regional governments are attempting to increase non-oil
revenue. However, rather than structurally reforming the tax system, by introducing personal or
company income taxes, or broad based consumption taxes, most measures have been piecemeal.
For example, in 1999, Saudi Arabia introduced airport taxes, and raised visa charges, retail fuel
prices and electricity tariffs (Saudi American Bank, 2000).
Per
cent
0
5
10
15
20
25
30
35
40
45
50
1986 1987 1988 1989 1990 1991 1992 1993 1994 1995 1996 1997 1998
10 The 2.2 per cent expenditure rise in 2000 represents the difference between actual 1999 expenditure and projected 2000
expenditure (Business Monitor International, 2000b).
Kuwait
Saudi Arabia
UAE
Bahrain
Oman
Qatar

E c o n o m i c P r o s p e c t s
P A G E 19
1983
1984
19
85
1986
1987
1988
1989
1990
1991
1992
1993
1994
1995
1996
1997
1998
1999
2000
f
1982
1981
US
$ b
illio
n
0
10
20
30
40
50
60
70
80
Current expenditure
Capital expenditure
F i g u r e 1 . 1 3
Saudi Capital Expenditure in Long Term Decline
Capital and Current Expenditure by the Saudi Government, US$ billion
Source: Saudi American Bank, 2000.
Implications of Growing Fiscal Pressures for Foreign Companies
Growing fiscal pressures create opportunities for foreign companies in social services, infrastructure
provision and financing.
Trend Towards User Pays
Without major tax reforms, a key method to improve the budget balance is to increase use of the user
pays principle for education and health services. This should open up new opportunities for foreign
providers to supply services.
Increased Private Infrastructure Provision
Most Gulf economies also now seek to compensate for inadequate government revenue by attracting
privately provided infrastructure. Increasingly, Gulf Governments recognise the fiscal burden of publicly
funding and subsidising electricity and water infrastructure needs, and the potential efficiency benefits
of private provision. (See Chapter 4 - Foreign Investment.) Oman is setting the pace by establishing
a best practice market and regulatory regime for private electricity provision. However, Gulf economies
have massive requirements for additional electricity and water production and distribution, as well as

A C C E S S I N G T H E M I D D L E E A S T
B U S I N E S S O P P O R T U N I T I E S I N T H E A R A B I A N P E N I N S U L A A N D I R A N
P A G E 20
for enhanced telecommunications, gas and oil pipelines, railways and ports. Between 2000 and
2006, Saudi Arabia, Iran, the UAE, Kuwait, Qatar and Oman will require new electricity infrastructure
with an estimated value of US$40 billion (Business Monitor International, 2000d).
Increased Importance of Private Finance
Continuing government efforts to increase private infrastructure provision also will increase the role
of private financiers. Foreign financial institutions already are active in infrastructure and project
finance, and this role should escalate. Opportunities to sell expertise and services also should increase
in other areas, particularly in equity markets if the UAE’s stock exchange, established in March 2000,
is successful.
THE RELATIVE ROLE OF WESTERN AND ISLAMIC FINANCE
Islamic financing of infrastructure could increase due to the massive funding needs and the
new pool of funds Islamic financing can access (Knox, 2000). Conventional and Islamic
methods of financing co-exist in GCC economies; most financing currently uses conventional
lending arrangements, but Islamic financing is becoming more popular as more products,
including managed funds, are developed.
The relative importance of Western and Islamic financing varies throughout Gulf economies.
Saudi commercial banks levy service charges for conventional lending rather than charging
interest. Other Arabian Peninsula states offer interest on conventional lending, but have
specialist Islamic banks, such as Dubai Islamic Bank and Abu Dhabi Islamic Bank, and offer
Islamic products within traditional commercial banks. The Iranian banking system is a hybrid
of Islamic and western systems. The term ‘profit share’ is widely used for returns, although
the share is calculated as a percentage, like interest. Moreover, the Central Bank of Iran uses
term deposits to soak up excess liquidity.
DECLINING OIL RESERVES
At current production rates, oil reserves in Saudi Arabia, Abu Dhabi, Iran and Kuwait should last over
65 years, but in Qatar, Oman, Dubai and Bahrain oil reserves will last only another 10 to 15 years
(Figure 1.14) (Jeffreys, 2000, pp. 9-10).
The prospect of oil reserves running out is a powerful incentive to diversify and reform economies. It
creates regional examples of successful strategies. For example, Dubai successfully reoriented its
economy, so oil now accounts for under 8 per cent of GDP.11
Dubai now achieves more rapid and less
volatile growth than major oil producers; oil rich states may emulate its strategy. Similarly, Oman is
adopting a world’s best practice approach to attracting private sector infrastructure providers, and
encourages foreign participation in its oil and gas sectors.
11 The share of oil in gross domestic product comes from Jeffreys, 2000, pp. 31-33.

E c o n o m i c P r o s p e c t s
P A G E 21
F i g u r e 1 . 1 4
Qatar, Oman and Bahrain Face Declining Oil Reserves
Years of Production at Current Extraction Rates, 1997
Note: Iran data are for 1998 from Jeffreys, 2000.
Source: Gulf Cooperation Council, 1999; and Jeffreys, 2000, pp. 47-49.
IMPLICATIONS
Very modest and volatile growth, demographic and fiscal pressures, the need for diversification and
declining oil reserves create strong reform pressures. Current high oil prices may reduce the short
term imperative for reform, but few governments are likely to change long term strategies.
In 2000, high oil prices will stimulate import growth which should assist new products in penetrating
the market. More importantly, ongoing reforms should open more investment opportunities to foreign
companies in gas production, infrastructure provision, manufacturing, finance and education. Goods
and services trade opportunities are expanding as Gulf economies increasingly source imports from
the most competitive suppliers.
Ye
ars
of
rem
ain
ing
pro
du
ctio
n
0
20
40
60
80
100
120
140
Kuwait UAE Saudi Arabia Iran Qatar Oman Bahrain

A C C E S S I N G T H E M I D D L E E A S T
B U S I N E S S O P P O R T U N I T I E S I N T H E A R A B I A N P E N I N S U L A A N D I R A N
P A G E 22
REFERENCES
Asian Development Bank, 1999, Key Indicators of Developing Asian and Pacific Countries, Vol. 30,
Oxford University Press, Oxford.
Austrade, 2000a, ‘Australia’s Trade Relations with the Middle East Including the Gulf Region’, Austrade
submission to Joint Standing Committee on Foreign Affairs, Defence and Trade Inquiry into
Australia’s Relations with the Middle East, March, Canberra.
Bahrain Monetary Agency, 1998, Annual Report 1998, Bahrain Monetary Agency, Bahrain.
Bank for International Settlements, 2000, ‘Joint BIS-World Bank-OECD Statistics on External Debt’,
www.bis.org/publ/index.htm, accessed on 9 March 2000.
BP Amoco, 1999, ‘Statistical Review of World Energy’, BP Amoco, London.
Business Monitor International, 2000a, ‘Regional Macroeconomic Data and Forecasts’, August, p. 12.
___ 2000b, ‘Saudi Arabia: Careful Spending in 2000’, Middle East Monitor, February, pp. 2-4.
___ 2000c, ‘Saudi Arabia: High Noon in the Neutral Zone’, Middle East Monitor, March, pp. 2-4.
___ 2000d, ‘UAE: Gradual Growth of Foreign Ownership’, Middle East Monitor, July, pp. 5-7.
CEIC, 2000, CEIC Database, Hong Kong, supplied by Econdata, Canberra.
Central Bank of Iran, 1998, Annual Review 1997-98, Central Bank of Iran, Tehran.
Central Intelligence Agency, 1999, ‘CIA World Factbook 1999’, www.cia.gov/cia/publications/factbook/
index.html, accessed on 18 April 2000.
Datastream, 2000. Datastream Database, supplied by Primark Corporation, Massachusets,
www.primark.com, accessed on 15 July, 2000.
Economist Intelligence Unit, 1999a, Iran 1999-2000 Country Profile, EIU, London.
___ 1999b, Saudi Arabia 1999-2000 Country Profile, EIU, London.
___ 1999c, United Arab Emirates 1999-2000 Country Profile, EIU, London.
___ 1999d, Iran 1999-2000 Country Profile, EIU, London.
___ 1999e, Kuwait 1999-2000 Country Profile, EIU, London.
___ 1999f, Oman 1999-2000 Country Profile, EIU, London.
___ 1999g, Bahrain/Qatar 1999-2000 Country Profiles, EIU, London.
___ 1999h, Yemen 1999-2000 Country Profiles, EIU, London.
Fawzy, H., 2000, ‘Dolphin’, paper presented at the Gulf 2000: Energy, Infrastructure and Finance
Conference, Abu Dhabi, 28 and 29 March.
E c o n o m i c P r o s p e c t s
P A G E 23
Gulf Cooperation Council, 1999, Economic Bulletin, Vol. 14, Gulf Cooperation Council, Riyadh.
International Economic Data Bank, 2000, International Economic Data Bank, Australian National
University, Canberra.
International Monetary Fund, 2000, International Financial Statistics, IMF, Washington DC.
Jeffreys, A. (ed.), 2000, Emerging Emirates 2000, Oxford Business Group, London.
Knox, G., 2000, ‘Raising Finance for Middle East Infrastructure Projects’, paper presented at the Gulf
2000: Energy, Infrastructure and Finance Conference, Abu Dhabi, 28 and 29 March.
Saudi American Bank, 2000, ‘The Saudi Economy: 1999 Performance, 2000 Forecast’, February, Riyadh.
United Nations, 2000, ‘United Nations Population Information Network’, United Nations Population
Division, Department of Economic and Social Affairs, www.undp.org/popin, accessed July 2000.
World Bank, 2000a, World Bank Atlas 2000, World Bank, Washington DC.
___ 2000b, Entering the Twenty First Century: World Development Report 1999/2000, World Bank,
Washington DC.

A C C E S S I N G T H E M I D D L E E A S T
B U S I N E S S O P P O R T U N I T I E S I N T H E A R A B I A N P E N I N S U L A A N D I R A N
P A G E 24

C h a p t e r 2
P A G E 25
AUSTRALIAN-GULF BUSINESS
KEY POINTS
• Australian trade with the Gulf region grew significantly in the 1990s.
The region remains a growing and important market for Australia’s
agricultural and mineral exports. Manufactured export values,
particularly for cars, are large and rapidly growing. As a share of
total Australian exports to the Gulf, elaborately transformed
manufactures, ETMs, have expanded more dramatically than in any
other major Australian export market.
• The Gulf’s planned heavy industry growth should boost Australian
exports of alumina and iron and steel making inputs and increase
incentives for Gulf economies to invest in Australia.
• Key areas of export opportunity include bulk and high value
agricultural products, processed food industry inputs, manufactures
including cars, food processing machinery, telecommunications
equipment, medical and pharmaceutical products, and construction,
education and tourism services.
• Australia’s small, diverse investment presence in the Gulf is mostly
in UAE manufacturing and distribution, or the region’s petroleum
extraction or gas sectors. However, other attractive investment
opportunities include infrastructure, mining, manufacturing, finance,
tourism, transport and business services.

A C C E S S I N G T H E M I D D L E E A S T
B U S I N E S S O P P O R T U N I T I E S I N T H E A R A B I A N P E N I N S U L A A N D I R A N
P A G E 26
Australia has well established export markets in the Gulf and a rapidly growing investment presence.
In the last decade, Australia’s merchandise exports to the Gulf economies expanded rapidly, averaging
almost 11 per cent per year since 1990, and almost 20 per cent per year since 1995. By 1999, two
way trade topped A$4.3 billion, with Australia’s goods and services exports valued at A$3 billion, up
from only A$1.6 billion in 1990 (Department of Foreign Affairs and Trade, 2000). While primary exports
remain very important, car exports now exceed A$800 million per year. In the next decade, the
challenge will be to expand higher value added food exports, diversify manufactured exports beyond
cars, expand Australia’s investment presence and attract more Gulf investment to Australia.
This chapter first briefly examines Australia’s main Gulf markets. It then highlights major sectoral
export trends and examines key export opportunities including in the service sector. Next it explores
Australia’s current direct investment in the Gulf and investment opportunities. It analyses Gulf
economies’ current and potential direct investment in Australia and exports to Australia. Finally, it
discusses Australian business links with the Gulf.
AUSTRALIA’S EXPORTS - MAJOR GULF MARKETS
Australia’s main Gulf markets are Saudi Arabia, the UAE and Iran. Over the past decade, manufactured
exports to Saudi Arabia and the UAE grew strongly. Exports to Iran were more volatile with no clear
trend (Figure 2.1).
F i g u r e 2 . 1
Saudi Arabia and the UAE Are Australia’s Key Gulf Markets
Australia’s Merchandise Exports to the Arabian Peninsula and Iran, 1990-99
Source: Department of Foreign Affairs and Trade, 2000.
IranUAE
Saudi ArabiaBahrainYemenOman
KuwaitQatar
US
$ m
illio
n
0
200
400
600
800
1 000
1 200
1990 1991 1992 1993 1994 1995 1996 1997 1998 1999

A u s t r a l i a n O p p o r t u n i t i e s
P A G E 27
Saudi Arabia
In 1999, Saudi Arabia was Australia’s main Gulf export market (Figure 2.1), accounting for 35 per
cent of Australian exports to Gulf economies and 55 per cent of elaborately transformed manufacture,
ETM, exports. Since 1997, exports have expanded at an annual rate of 52 per cent due to surging
demand for Australian produced cars. In 1999, apart from cars (worth A$499 million, and in the year
to 30 June 2000, A$700 million), major exports to Saudi Arabia included confidential items like sugar
(A$212 million), dairy products (A$99 million), non-bovine meat (A$52 million), non-monetary gold
(A$45 million) and flat rolled steel (A$21 million) (Figure 2.2).
F i g u r e 2 . 2
Cars Dominate Exports
Top Ten Australian Exports to Saudi Arabia, 1998-99
Source: Department of Foreign Affairs and Trade, 2000.
The UAE
The UAE was Australia’s second largest Gulf export market in 1999, receiving 27 per cent of Australia’s
Gulf exports. Exports were 89 per cent above 1995 levels. In 1999, the UAE’s main Australian imports
were confidential items, principally alumina (A$373 million), cars (A$98 million), non-monetary gold
(A$41 million), live sheep (A$35 million), non-bovine meat (A$32 million) and dairy products
(A$24 million) (Figure 2.3).
Telecommunicationsequipment
Coated flat-rolled steel
Cars
0 100 200 300 400 500 600
Chemicals
Non-ferrous metals
Aluminium
Non-monetary gold
Non-bovine meat
Dairy products
Confidential items
A$ million
1998 1999

A C C E S S I N G T H E M I D D L E E A S T
B U S I N E S S O P P O R T U N I T I E S I N T H E A R A B I A N P E N I N S U L A A N D I R A N
P A G E 28
F i g u r e 2 . 3
Alumina Is a Major Export
Top Ten Australian Exports to the UAE
Source: Department of Foreign Affairs and Trade, 2000.
Iran
Before 1990, Iran was easily Australia’s largest Gulf export market. It remains Australia’s third most
important market and a key bulk commodity market (Figure 2.4). Over the 1990s Iran’s relative
importance as an export destination shrank dramatically due to strong growth in exports to the UAE
and Saudi Arabia, and Iran’s weak economic performance and chronic foreign exchange shortages.
Iran’s imports also fluctuate as climatic conditions determine wheat and sugar imports.
In 1999, major exports to Iran included wheat, barley and other agricultural products classified as
confidential items (A$325 million), coking coal (A$48 million), bovine meat (A$11 million), animal oils
and fats (A$11 million), and wool (A$9 million). Non-agricultural exports were constrained due to
prohibitions on car imports and, since 1993, generalised non-essential import restrictions resulting
from export revenue shortfalls.
0 50 100 150 200 250 300 350 400
Fresh vegetables
Chemicals
Food and live animals
Base metalmanufactures
Non-bovine meat
Live animals
Non-monetary gold
Dairy products
Cars
Confidential items
A$ million1998 1999
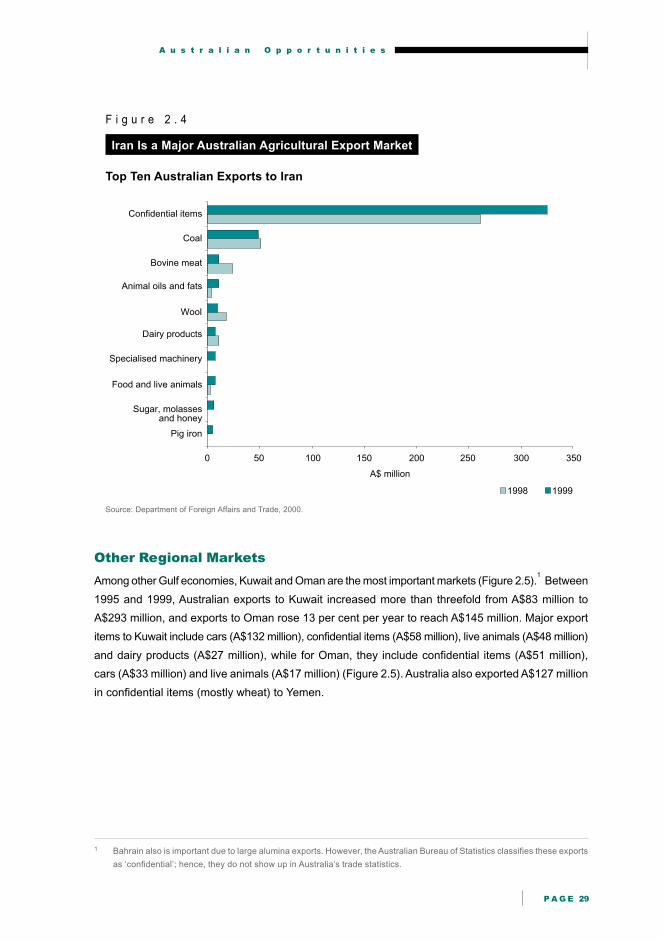
A u s t r a l i a n O p p o r t u n i t i e s
P A G E 29
F i g u r e 2 . 4
Iran Is a Major Australian Agricultural Export Market
Top Ten Australian Exports to Iran
Source: Department of Foreign Affairs and Trade, 2000.
Other Regional Markets
Among other Gulf economies, Kuwait and Oman are the most important markets (Figure 2.5).1 Between
1995 and 1999, Australian exports to Kuwait increased more than threefold from A$83 million to
A$293 million, and exports to Oman rose 13 per cent per year to reach A$145 million. Major export
items to Kuwait include cars (A$132 million), confidential items (A$58 million), live animals (A$48 million)
and dairy products (A$27 million), while for Oman, they include confidential items (A$51 million),
cars (A$33 million) and live animals (A$17 million) (Figure 2.5). Australia also exported A$127 million
in confidential items (mostly wheat) to Yemen.
1 Bahrain also is important due to large alumina exports. However, the Australian Bureau of Statistics classifies these exports
as ‘confidential’; hence, they do not show up in Australia’s trade statistics.
A$ million
0 50 100 150 200 250 300 350
Pig iron
Sugar, molassesand honey
Food and live animals
Specialised machinery
Dairy products
Wool
Animal oils and fats
Bovine meat
Coal
Confidential items
1998 1999

A C C E S S I N G T H E M I D D L E E A S T
B U S I N E S S O P P O R T U N I T I E S I N T H E A R A B I A N P E N I N S U L A A N D I R A N
P A G E 30
0 20 40 60 80 100 120 140
Non-bovine meat
Cheese and curd
Cars
Cheese and curd
Confidential items
Cars
QATAR
Cars
Confidential items
Non-bovine meat
Live animals
Confidential items
Milk and cream
Live animals
Cars
A$ million
KUWAIT
Confidential items
Cheese and curd
OMAN
Cars
Milk and cream
YEMEN
Milk and cream
Machinery and transport equipment
Live animals
Non-bovine meat
BAHRAIN
Live animals
Inorganic chemical elements
Fresh vegetables
F i g u r e 2 . 5
Kuwait Is a Major Car Market
Top Five Exports to Kuwait, Oman, Yemen, Qatar and Bahrain, 1999, A$ million
Note: Data on Australia’s large-scale alumina exports to Bahrain are unavailable due to confidentiality restrictions.
Source: Department of Foreign Affairs and Trade, 2000.
MAJOR SECTORAL TRENDS FOR AUSTRALIAN EXPORTS
While primary products still dominate Australia’s Gulf exports, over the decade primary products’
share in total Australian exports to the Gulf shrank from 87 to 60 per cent, while ETMs’ share grew
from 5 to 34 per cent (Figure 2.6). This ETM growth was more rapid than in any other major Australian
market. Over the same period, ETM export shares to Asia grew from 9 to only 13 per cent, to Europe
from 20 to 26 per cent and to the United States from 23 to 37 per cent.

A u s t r a l i a n O p p o r t u n i t i e s
P A G E 31
F i g u r e 2 . 6
Primary Products Dominate, ETM Exports Expand Rapidly
Composition of Australian Merchandise Exports to the Gulf Region, 1990-99
Note: a ETMs are manufactured products with unique features that are identified as differentiated goods on world markets. They
are predominantly finished goods.
b Simply transformed manufactures are the remaining manufactured exports and consist largely of basic, unworked iron, steel
and non-ferrous metal products.
Source: Department of Foreign Affairs and Trade, 2000.
MANUFACTURED EXPORTS
As a result of the rapid growth in car exports during the 1990s, by 1999 approximately 95 per cent of
manufactured exports were ETMs.
Elaborately Transformed Manufactures
Between 1990 and 1999, as car exports boomed, Australian ETM exports to the Gulf grew 29 per cent per year.
Car Exports
During this period, cars’ share of ETM exports to the Gulf economies rose from below 2 per cent to
over 80 per cent (Figure 2.7). Australian Toyota and General Motors Holden plants are the dominant
suppliers of this market, which expanded from A$124 million in 1996 to A$810 million in 1999. Saudi
Arabia is emerging as the key market, followed by the UAE and Kuwait (Figure 2.8).
���
�
�
��
��
��
��
��
��
��
��
��
���
���� ���� ���� ���� ���� ���� ���� ���� ���� ����
��������������
!�"�
#���$����� %��������%�����
&$�'����$����� %��������%�����

A C C E S S I N G T H E M I D D L E E A S T
B U S I N E S S O P P O R T U N I T I E S I N T H E A R A B I A N P E N I N S U L A A N D I R A N
P A G E 32
F i g u r e 2 . 7
Cars Drive ETM Export Growth
Australian ETM Exports to the Gulf Region, 1990-99
Source: Department of Foreign Affairs and Trade, 2000.
F i g u r e 2 . 8
Saudi Market Dominates Car Exports
Exports of Australian Cars to the Gulf, 1995-99
Note: Other comprises Bahrain, Qatar, Yemen and Iran.
Source: Department of Foreign Affairs and Trade, 2000.
A$
mill
ion
Pe
r ce
nt
0
100
200
300
400
500
600
700
800
900
1990 1996 1999
0
10
20
30
40
50
60
70
80
90Cars (LHS)
Non-cars (LHS)
Share of cars in total ETM exports (RHS)
1995 1996 1997 1998 1999
A$
mill
ion
0
100
200
300
400
500
600
700
800
900 Other
Saudi Arabia
Oman
UAE
Kuwait

A u s t r a l i a n O p p o r t u n i t i e s
P A G E 33
F i g u r e 2 . 9
Non-automotive ETMs Accelerate
Top Ten Australian Non-automotive ETMs to the Gulf Region, 1990-99
Source: Department of Foreign Affairs and Trade, 2000.
Other ETMs
In 1999, the main non-automotive ETM exports included steel plates and sheets (A$30 million),
telecommunications equipment (A$23 million), steel castings and forgings (A$17 million) and copper
(A$14 million) (Figure 2.9). Growth averaged 8 per cent between 1990 and 1997, but despite weak
oil prices accelerated to 15 per cent in 1998 and 1999.
Simply Transformed Manufactures
The export value of simply transformed manufactures, STMs, declined from A$136 million (65 per
cent of manufactured exports) in 1990 to A$56 million (5 per cent of manufactured exports) in 1999.
This was largely because a previously large iron export line to Iran ceased. The remaining major
STMs performed erratically, with declining pig iron exports and growing inorganic chemical exports
the only consistent pattern (Figure 2.10).
PRIMARY PRODUCTS
The great bulk of primary exports to the Gulf, including wheat, sugar and alumina, are listed as
confidential items, to protect commercially confidential information of large sole suppliers.
0
20
40
60
80
100
120
140
160
1990 1991 1992 1993 1994 1995 1996 1997 1998 1999
A$ m
illio
n
Steel plates and sheets
Medicinal and pharmaceutical products
Computer parts and accessories
Electrical switches and fuses
Resins and plastics
Pumps
Specialised machinery
Copper
Steel castings and forgings
Telecommunications equipment

A C C E S S I N G T H E M I D D L E E A S T
B U S I N E S S O P P O R T U N I T I E S I N T H E A R A B I A N P E N I N S U L A A N D I R A N
P A G E 34
F i g u r e 2 . 1 0
Exports of Inorganic Chemicals Grow
Composition of Major Australian STM Exports to the Gulf Region, 1990-99
Source: Department of Foreign Affairs and Trade, 2000.
Agricultural Products
Between 1995 and 1999, non-confidential agricultural exports performed well, growing 13 per cent
per year to A$692 million. Dairy products, live animals and meat were among the fastest growing
non-confidential exports (Figure 2.11). Confidential agricultural exports, largely wheat and sugar still
dominate Gulf trade and are growing well. In 1998-99, wheat exports by AWB Limited (formally the
Australian Wheat Board) to the Gulf reached A$1.1 billion or 30 per cent of Australia’s wheat exports
to the world, with tonnages up almost fourfold on 1994-95 levels.
Sugar exports to the region also are significant. Queensland Sugar Corporation, QSC, undertakes
most of this trade and supplies about 20 per cent of the world raw sugar market, making it one of the
world’s largest sugar exporters. In 1999-2000, it sold 168 000 tons of sugar to Iran and 208 000 tons
to Saudi Arabia, representing 19 per cent and 40 per cent respectively of these nations’ sugar imports
(Queensland Sugar Corporation, 2000).
A$ m
illio
n
0
5
10
15
20
25
30
35
40
45
50
1990 1991 1992 1993 1994 1995 1996 1997 1998 1999
InorganicchemicalsPig iron
Textile yarn
Zinc andalloysAluminiumand alloys

A u s t r a l i a n O p p o r t u n i t i e s
P A G E 35
F i g u r e 2 . 1 1
Agricultural Commodity Exports Growing Well
Australia’s Major Non-confidential Agricultural Commodity Exports to the Gulf
Region, 1990-99
Note: No barley exports to the Gulf region were recorded in 1995 and animal oils and fats were not exported in 1990 or 1995.
Source: Department of Foreign Affairs and Trade, 2000.
Bulk Mineral Exports
Alumina is the major bulk mineral export to the Gulf; exports to Bahrain and Dubai are worth between
A$400 million and A$600 million per year and growing rapidly. Bahrain alone accounts for 11 per cent
of Western Australia’s alumina exports, with Western Australia Bahrain’s sole supplier.2 Similarly,
Dubai Aluminium, Dubal, consumes 60 000 tonnes of alumina every three weeks from Alcoa’s refinery
at Kwinana, Western Australia (Department of Minerals and Energy Western Australia, 2000). The
other significant bulk mineral export is coking coal, with exports to Iran of A$48 million in 1999.
2 Western Australia’s four alumina refineries are owned by Alcoa at Kwinana, Pinjarra and Wagerup, and by Worsley Alumina
near Collie (Department of Minerals and Energy Western Australia, 2000).
0 20 40 60 80 100 120 140 160 180 200 220
Wool
Animal feed
Sugar, molassesand honey
Barley
Meat
A$ million
Dairy
Live animals
Fresh vegetables
Alcoholicbeverages
Animal oilsand fats
1990 1995 1999

A C C E S S I N G T H E M I D D L E E A S T
B U S I N E S S O P P O R T U N I T I E S I N T H E A R A B I A N P E N I N S U L A A N D I R A N
P A G E 36
AUSTRALIAN EXPORT OPPORTUNITIES
Opportunities for Australian goods and service exporters in Gulf markets are wide, encompassing
traditional and higher value added agricultural products, a rapidly broadening range of ETMs and
expanding services exports, including tourism and education. Furthermore, many Australian direct
investments in the Gulf are drawing in new Australian goods and services exports.
Agricultural Exports
Throughout the Gulf, environmental, fiscal and demographic pressures drive expanding opportunities
for agricultural exports, like wheat, sugar, live sheep, frozen meat, and fruit and vegetables. Much of
the region’s agriculture is unsustainable; renewable per capita water reserves are falling rapidly, and
agriculture demands 91 per cent of water withdrawals in Saudi Arabia, 80 per cent in the UAE and
94 per cent in Oman. (See Chapter 4 - Foreign Investment.) In addition, the growing fiscal cost of
subsidising agricultural production via input and direct subsidies strains budgets, deepening structural
deficits. In the short term, high oil prices may reduce fiscal pressures, but in the medium to longer
term, pressing social and economic infrastructure demands on stretched budgets should drive the
continuing reform of wasteful agricultural support policies.
Saudi Arabia provides the largest agricultural export opportunities for Australia. Since 1992, agricultural
subsidy reforms reduced Saudi grain production from 4.8 million tonnes to 1.9 million tonnes in 1996,
and the country switched from being a net exporter to a net importer of US$5 billion of agricultural
products (Gulf Cooperation Council, 1999; and Middle East Economic Digest, 28 January 2000, p.8).
Australia supplies around 5 per cent of these agricultural imports (Fisher, 2000a).
Opportunities for agricultural supplies and services also are significant. For example, in early 2000,
Perth based Food Equipment of Australia installed and commissioned an abattoir in Saudi Arabia
(Fisher, 2000a); Smorgon Cyclone has built large stock pens for holding imported live animals; and
Austanz International has installed and is maintaining major irrigation systems (Bunton, 2000;
and Giller, 2000).
Factors Driving Agricultural Export Growth
Both supply and demand factors drive growth in agricultural exports. On the supply side, as a leading
agricultural exporter, Australia is a reliable, cost competitive, customer focused, long term supplier of
bulk agricultural commodities.3 On the demand side, rapid population growth, which underpinned
growing demand for Australian primary products in the 1990s should continue into the next decade
and beyond (Figure 2.12). Moderate growth in Gulf Cooperation Council, GCC, economies’ per capita
income, from US$8 171 in 1990 to US$9 262 in 1997, also sustains demand. Further, in 2000 and
2001, higher oil prices should spur increased demand, particularly from Iran.
3 For example, while Australia produces only 3 per cent of the world’s total wheat production, it accounts for 17 to 20 per cent
of the world’s exports.

A u s t r a l i a n O p p o r t u n i t i e s
P A G E 37
F i g u r e 2 . 1 2
More Mouths to Feed
Australian Agricultural Exports to the Gulf and Population Growth, 1990-98
Note: Population data for Iran are from International Monetary Fund, 2000.
Source: Department of Foreign Affairs and Trade, 2000; Gulf Cooperation Council, 1999; and International Monetary Fund, 2000.
Wheat
Prospects are good for expanding wheat sales. Population growth will continue to drive strong demand,
with product requirements changing due to young consumers’ growing importance and increasing
affluence. A push towards trade and overall economic reform also may facilitate greater trade
with Australia.
A$ b
illio
n
0.0
0.5
1.0
1.5
2.0
2.5
1990 1991 1992 1993 1994 1995 1996 1997 1998
Agricultural exports (LHS)
Gulf population (RHS)
Gulf p
opula
tion, m
illio
n
50
55
60
65
70
75
80
85
90
95

A C C E S S I N G T H E M I D D L E E A S T
B U S I N E S S O P P O R T U N I T I E S I N T H E A R A B I A N P E N I N S U L A A N D I R A N
P A G E 38
RISING DEMAND FOR AUSTRALIAN WHEAT: AWB LIMITED SALES TO THE GULF
AWB Limited is Australia’s sole bulk wheat exporter.4 It began exporting to the Gulf in 1942
and maintains a strong market position. It values its strong relationship with the Gulf economies.
The Gulf wheat market is largely shared between Australia, Canada and Argentina, although
the United States has made inroads via subsidised sales. In 1998-99, Australia’s 4.7 million
tonnes of wheat exports to the Gulf states represented around 30 per cent of total Australian
wheat exports, and was worth A$1.1 billion. Depending on climatic conditions, AWB Limited
often is the largest Australian exporter to many Gulf economies. In 1998-99, AWB Limited
sold 1.7 million tonnes of wheat to Iran, 1.4 million tonnes to Iraq, 700 000 tonnes to Yemen,
220 000 tonnes to Kuwait, 248 000 tonnes to Oman, 620 000 tonnes to the UAE,
21 000 tonnes to Bahrain and 61 000 tonnes to Qatar.
Source: AWB Limited, 2000.
Sugar
Population pressures, and growth of processed food industries also should expand Australia’s
substantial raw sugar export opportunities.
QSC’S ROAD TO EXPORT SUCCESS IN IRAN
QSC began selling raw sugar to Iran in 1996. Previously, the Iranian Government Trading
Corporation purchased sugar via tender, on a cargo-by-cargo basis on terms QSC found
unacceptable. After extensive negotiations, QSC made an initial sale. Sales volumes grew as
the relationship developed, and the Government Trading Corporation recognised the foreign
exchange savings and employment benefits of importing raw sugar instead of refined
sugar. QSC now is a major supplier of bulk raw sugar to Iran and anticipates sales should
continue to grow.
Source: Queensland Sugar Corporation, 2000.
Live Sheep Exports
From 1990 to 1999, while live sheep exports to Gulf economies, mainly the UAE and Kuwait, expanded
from A$62 million to A$130 million exports to Saudi Arabia ceased. Exports had reached three million
sheep per year, but encountered problems due to sheep quality and some rejected shipments which
created animal welfare problems. Now, a strict quality assurance program is in place with Saudi
Arabia, and in 2000, four trial shipments of around 65 000 sheep have been successful.5 Should the
trade resume on a fully commercial basis, export volumes could reach one million sheep per year.
4 AWB Limited has a statutory monopoly on bulk wheat exports due to the ‘single desk policy’. This policy currently is under review.
5 Key elements of this quality assurance program include ensuring sheep are vaccinated twice against scabby mouth, having
a vet on board the ship and making Saudi Arabia the first port of call. Three more trial shipments are planned for the
remainder of 2000.

A u s t r a l i a n O p p o r t u n i t i e s
P A G E 39
Meat Exports
Exporters using the strong air links and handling infrastructure of Emirates Airlines and Gulf Air could
open up new chilled sheep-meat markets. Already chilled sheep-meat is shipped to Dubai, Abu
Dhabi, Doha in Qatar and Muscat in Oman. Efforts to establish markets for higher value boned meat
could further increase the value of this trade. The provision of non-stop flights from Australia from
2003 also will boost trade, as meat exports then will not have to compete for space with high value
computer parts and European bound freight currently loaded in Singapore.
Fruit and Vegetables
Fruit and vegetable exports to the Gulf economies grew from A$18 million in 1995 to A$22 million in
1999; due partly to improved air links since 1996, and show good growth prospects. Australian company,
Pardy and Sons, has a longstanding market presence through exporting fresh fruit and vegetables to
supermarkets and market agents in Kuwait, Dubai, Abu Dhabi, Bahrain and Muscat. Around 60 per cent
of its business by value is air freighted, with most exports during the Australian summer (Pardy, 2000).
While competition from South Africa and high yielding South East Asian cargoes loaded in Singapore
is fierce, direct air links from 2003 also may help in expanding the high value end of this trade.
Processed Food
The fiscal, demographic and water supply pressures likely to stimulate agricultural imports also should
increase opportunities for processed food exports. The markets for food processing inputs also should
remain vibrant due to economic diversification.
Convenience Foods
With 30 per cent of the GCC’s population aged between 11 and 20, opportunities exist to service a
rapidly growing snack food industry (Canadian Business Development International, 1997; and Gulf
Cooperation Council, 1999).6 As this youthful population moves into its twenties, demand for
convenience foods also should accelerate rapidly. Higher value added prepared meats, for home
cooking, uncooked products for small supermarket based bakeries and packaged beverages are
potential niche exports for these relatively high income markets (Giller, 2000).
6 This figure on the percentage of the population aged between 11 and 20 excludes Kuwait due to lack of data.
A C C E S S I N G T H E M I D D L E E A S T
B U S I N E S S O P P O R T U N I T I E S I N T H E A R A B I A N P E N I N S U L A A N D I R A N
P A G E 40
BERRI: PRESENTATION THE KEY
Berri Limited started exporting to the Middle East in 1997; now exports exceed A$1 million.
Initial test marketing in Bahrain quickly revealed locally made Tetrapaks (foil lined cartons)
undercut Australian manufactured juice products by 30 to 50 per cent. Consequently, Berri
focused on product formulations and packaging styles not produced in the region. Its most
successful product range is juice in polyethylene (or PET) plastic bottles; most competing
products are foil lined boxes or pouches. Competing imported plastic products are significantly
higher in price. While local competition from plastic bottles is expected soon, Berri is developing
strategies to remain competitive and expand sales.
Source: Giller, 2000.
Dairy Products
The 66 per cent growth in dairy products exports to the Gulf economies from 1995 to 1999 reflects
the strong opportunities in this young market. A major dairy goods exporter to the Middle East is
Bonlac, which has extensive experience selling food processing ingredients and some consumer
products in the region.7 Bonlac emphasises quality control and successfully capitalises on Australia’s clean,
green image.
Inputs for Domestic Food Processing Industries
The growing snack and convenience food sector and diversifying economies provide opportunities to
supply raw materials to rapidly expanding domestic food processing industries. For example, more
than 400 Saudi factories produce around US$3 billion worth of processed food products annually.
These factories need around US$1 billion in raw materials, intermediate ingredients, concentrates
and bases; 75 per cent of these inputs are imported (Austrade, 2000a).
Bulk Minerals and Metals
The Gulf economies’ competitiveness in energy intensive industry, gas from potential new pipeline
projects like Dolphin, and Gulf governments’ desire to further develop heavy industry to diversify
economic activity all should create opportunities to expand Australia’s minerals and metals trade.
Alumina
The success of Dubai Aluminium, Dubal, and the Aluminium Company of Bahrain, ALBA, the planned
expansion of the downstream aluminium industry in areas such as foil rolling, and long term contracts
like the recent A$1.4 billion deal to supply Dubal with alumina feedstock for the next eight years, all
should ensure this trade continues to flourish (Vaile, 2000b; and Business Monitor International,
2000a). A proposed export oriented aluminium smelter in Oman could create further demand. Exports
also may rise if the 6 per cent EU duty on primary aluminium exports from Gulf economies is removed
and if a planned US$1 billion expansion at ALBA goes ahead (Business Monitor International, 2000a).
7 Bonlac’s sales to the Middle East and Africa are almost US$100 million per year. All orders are organised and serviced from Dubai.

A u s t r a l i a n O p p o r t u n i t i e s
P A G E 41
Other Mineral and Metal Exports
If proposed major gas pipeline projects proceed, then integrated steel mills and electric arc furnace
plants could use this cheap energy source. This, in turn, could generate demand for Australian iron
ore and hot briquetted iron pellets.
Elaborately Transformed Manufactures
In 2000, high oil prices enhance opportunities to expand Australian ETM exports and diversify beyond
car exports. Most Australian produced manufactures, which are competitive in Australia (without
tariff protection), are likely to be competitive in the Gulf, provided tariffs are not prohibitive.
Cars
Australia’s car exports to the Gulf have grown exponentially since 1996, mainly because:
• Australian produced cars suit the Gulf region, they perform well during long distance travel on
often substandard roads, and have very good air conditioning and dust sealing
• restructuring of the Australian car industry since the late 1980s has improved production quality
and reliability, convincing Australian car manufacturers’ parent companies they can deliver on
price, quality and reliability, despite smaller production volumes.
As car manufacturing is multinational, and supply decisions are centralised in parent company
headquarters, future prospects for Australian cars’ access to Gulf markets are somewhat uncertain;
however, their success to date should boost their prospects.
CAR EXPORTS TO THE GULF SOAR
Australian-made left hand drive Toyota Camrys and GMH Commodores and Statesmans, re-
badged as Chevrolet Luminas and Caprices, are very popular in the Gulf. In 1999, Toyota
Australia shipped 23 000 cars to Saudi Arabia, up 40 per cent on 1998, with the Camry now
the largest selling car in Saudi Arabia. In addition, both Toyota and GMH Australia have made
big inroads in the UAE market. For example, Dubai Taxi Company runs a fleet of 2 000 Camrys
and has ordered replacement vehicles worth A$21 million.
Source: Vaile, 2000a.
Construction Materials
Australian exports of construction materials to the Gulf are expanding rapidly, at 9 per cent per year
in the 1990s, reaching A$70 million in 1999. Major export items include rolled metal, aluminium alloys
and copper pipes. Driving these exports is Australian investment in local distribution and processing
plants, like Lionweld Kennedy in Dubai and Clipsal’s factory in Sharjah, and BHP’s sales office and
Boral Plasterboard’s distribution centre in Dubai. In addition, Australia’s growing construction sector
success creates export opportunities for Australian construction material suppliers, as many Australian

A C C E S S I N G T H E M I D D L E E A S T
B U S I N E S S O P P O R T U N I T I E S I N T H E A R A B I A N P E N I N S U L A A N D I R A N
P A G E 42
construction companies specify Australian subcontractors and materials. For example, Multiplex uses
Australian crane and concrete forming companies (Deacon, 2000).
Telecommunications Equipment
Continued growth in the region’s telecommunications markets and WTO driven liberalisation in Oman
should improve prospects for Australian telecommunications exports, which grew from A$6 million in
1995 to A$23 million in 1999. Consequently, telecommunications equipment is a rapidly growing air
cargo (Emirates SkyCargo, 2000).
Pharmaceuticals
With the Gulf’s improving drug patent protection, opportunities to increase Australia’s medicinal and
pharmaceutical product exports should expand. Australian exports of medicinal and pharmaceutical
products to the Gulf doubled to A$6 million in 1999 from A$3 million in 1996. They also are a fast
growing air freight item (Emirates SkyCargo, 2000).
EMIRATES AIR FREIGHT EXPORTS EXPAND RAPIDLY
Emirates Airlines has flown daily from Melbourne to Dubai since October 1998, and has flown
four times per week from Sydney to Dubai since 27 March 2000. Connections onward are
available throughout the Gulf region. In 1999, the volume of Emirates air freight from Australia
to Dubai grew 19 per cent. Major end markets include the UAE, Kuwait, Lebanon, Qatar and
Saudi Arabia, with exports originating from Adelaide, Brisbane, Melbourne and Sydney.
Export cargo consists of both perishable and manufactured goods. Chilled meat and produce
is regularly air freighted to Dubai, Abu Dhabi, Doha, Riyadh and Kuwait. Manufactures include
car parts, communications equipment, computer parts, machinery and pharmaceuticals.
Exports of perishables, telecommunication equipment and pharmaceuticals are growing fastest.
Source: Emirates SkyCargo, 2000.
Defence Related Equipment
Defence equipment is another area of ETM export opportunity, with Australia’s key strengths lying in
infrastructure, service and technology support. Major Australian defence sales include military vehicles
by Tenix Defence Systems to Kuwait (A$20 million), military explosive warehouses to the UAE by
Spontech (A$45 million) and targeting systems to various countries by Australian Defence
Industries (A$1.4 million).
The UAE again is a hub for opportunities. In March 2001, it will hold the world’s biggest defence
exhibition, IDEX 2001, in Abu Dhabi. The Australian Middle East Defence Export Council will coordinate
Australia’s representation at this event. Austrade and the Department of Defence also are assisting
market penetration.

A u s t r a l i a n O p p o r t u n i t i e s
P A G E 43
OPPORTUNITIES UNDER DEFENCE OFFSET PROGRAMS
Participation in offset programs is another defence related opportunity. Offset programs are
attached to most major Saudi, Kuwaiti and Emirati defence purchases. Designed to assist
diversification, offsets require the defence contractor to re-invest a proportion of the contract
value in non-defence areas.
One project offering opportunities is the Al Yamamah deal to supply a range of defence
equipment to Saudi Arabia. British Aerospace is the prime contractor. Austrade has an
agreement with British Aerospace Australia to identify Australian companies able to enter into
significant joint ventures in Saudi Arabia, then British Aerospace can help identify an appropriate
Saudi partner to progress the proposal through the Saudi Offsets Committee and secure
finance. Incentives under the program include import duty exemptions, tariff free raw material
access, ten year tax holidays, and low cost utilities and rents.
Source: Austrade, 2000b.
Other ETMs
In 2000, high oil prices offer opportunities to expand the value and range of ETMs, with annual
growth of 20 per cent possible, based on past relationships between oil prices and import values. A
diverse range of Australian ETMs, from taxi meters to fast ferries, have found ready markets in the
Gulf in recent years.8 Other areas of opportunity include:
• food processing machinery for Saudi Arabia’s large food processing industry
• accessories and aftermarket products for four wheel drive vehicles, which are extremely popular.
Service Exports
Given the GCC economies’ high per capita incomes, services provide a major export opportunity. The most
prospective areas include education, tourism, construction, infrastructure, finance and business services.
Education
To augment employment localisation drives, most regional governments are spending large sums on
education and training. Each year, regional governments offer around 50 000 scholarships for residents
to study abroad (Al Falasi, 2000). However, most study in the United States and Europe. With only
376 Gulf students in Australia in 1999, Australia clearly could expand its market share (Department of
Education, Training and Youth Affairs, 2000). Most Gulf students who come to study in Australia are
from the UAE and Iran; the large Saudi market is virtually untapped.9
8 Between 1990 and 1997, Australian exports of ships and boats to the Gulf averaged A$18 million per year, although this
dropped to A$1 million in 1998 and 1999 (Department of Foreign Affairs and Trade, 2000).
9 Numbers of Iranian students in Australia fell from 693 in 1998 to 138 in 1999 due to Iran’s fiscal difficulties and persistent
visa approval problems. UAE student numbers reached 191 in 1999, but only ten students came to Australia from Saudi
Arabia (Department of Education, Training and Youth Affairs, 2000).
A C C E S S I N G T H E M I D D L E E A S T
B U S I N E S S O P P O R T U N I T I E S I N T H E A R A B I A N P E N I N S U L A A N D I R A N
P A G E 44
Factors boosting growth prospects include greatly improved transport links with direct flights to Dubai
and Abu Dhabi, and growing awareness of Australia and its education system due to expanding
tourism and promotion by Australian universities. The reciprocated presence of the UAE, Saudi and
Iranian embassies in Australia also helps promote education exports. However, at this early stage of
market development, Australian government promotional effort and institution level links need to be
stronger. Student advisers with Australian tertiary experience could be based in Australia’s embassies,
and faster visa turnaround times also would help (Deacon, 2000).
THE UNIVERSITY OF MELBOURNE ENGAGES THE ARAB WORLD
The University of Melbourne has long held a world renowned collection of Qur’anic texts, and
from the 1960s taught Arab and Islamic studies. It now is pursuing a broadly based strategy
to engage with the Gulf economies. Along with Indonesian, Japanese and Chinese Studies, it
designated Arab and Islamic Studies as a strategic pillar of the teaching and research program
of the cross-disciplinary Melbourne Institute of Asian Languages and Studies, created in 1997.
Also in 1997, the university audited the Islamic responsiveness of its courses, services and
administration. Subsequently, it established new prayer and meeting facilities, and appointed
an Islamic Counsellor. In 1998, a high level university mission visited four GCC economies to
explore new academic, research, cultural and business relationships with regional academic leaders.
Evidence of the university’s growing interaction with GCC economies includes:
• collaborating with the Victorian Education Department to provide advice on the development
of schools and teachers in the UAE, Oman and Saudi Arabia
• cooperating with Monash University to tailor professional postgraduate medical programs
for GCC candidates
• growing numbers of undergraduate and postgraduate GCC students
• using the Internet to offer worldwide, the only Masters of Islamic Studies.
Source: Peacock, 2000.
As GCC economies’ education systems grow, in-country educational services offer further
opportunities. Expanding GCC university student numbers make the university sector a key area
(Figure 2.13). Strategies include establishing Gulf campuses, as Wollongong University did with its
Dubai campus, establishing Internet delivered degree programs as Melbourne University did, or
obtaining contracts to teach particular courses. The rapidly growing technical education sector also
offers opportunities (Figure 2.13). While relatively small now, it is likely to expand considerably with the
employment localisation drive. Australia’s strong reputation for technical education positions it to tap
this growth (Deacon, 2000).
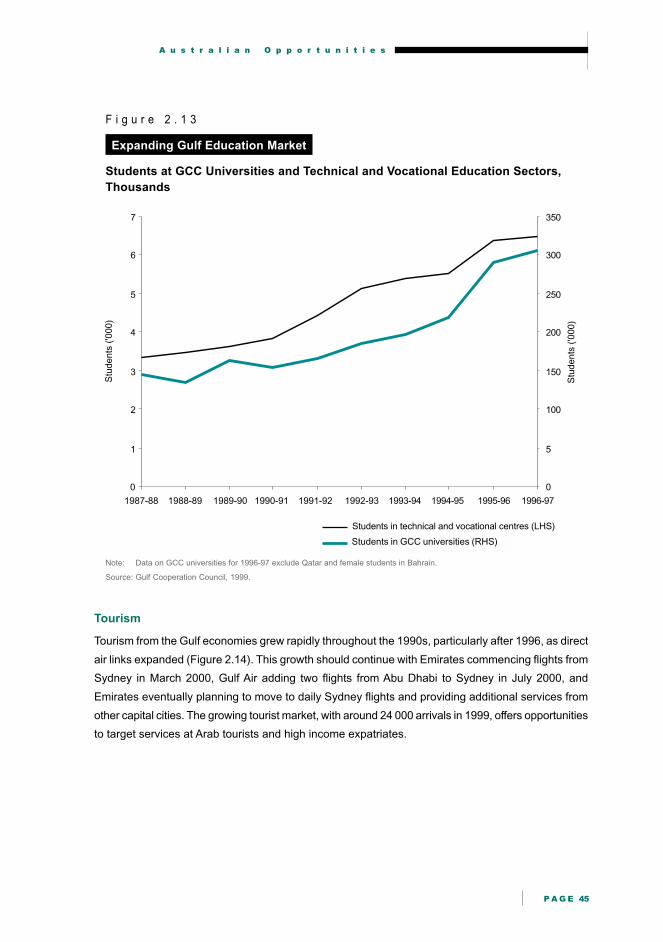
A u s t r a l i a n O p p o r t u n i t i e s
P A G E 45
Stu
dents
('0
00)
Stu
dents
('0
00)
0
1
2
3
4
5
6
7
1987-88 1988-89 1989-90 1990-91 1991-92 1992-93 1993-94 1994-95 1995-96 1996-97
0
5
100
150
200
250
300
350
Students in technical and vocational centres (LHS)
Students in GCC univesities (RHS)Students in GCC universities (RHS)
F i g u r e 2 . 1 3
Expanding Gulf Education Market
Students at GCC Universities and Technical and Vocational Education Sectors,
Thousands
Note: Data on GCC universities for 1996-97 exclude Qatar and female students in Bahrain.
Source: Gulf Cooperation Council, 1999.
Tourism
Tourism from the Gulf economies grew rapidly throughout the 1990s, particularly after 1996, as direct
air links expanded (Figure 2.14). This growth should continue with Emirates commencing flights from
Sydney in March 2000, Gulf Air adding two flights from Abu Dhabi to Sydney in July 2000, and
Emirates eventually planning to move to daily Sydney flights and providing additional services from
other capital cities. The growing tourist market, with around 24 000 arrivals in 1999, offers opportunities
to target services at Arab tourists and high income expatriates.

A C C E S S I N G T H E M I D D L E E A S T
B U S I N E S S O P P O R T U N I T I E S I N T H E A R A B I A N P E N I N S U L A A N D I R A N
P A G E 46
Tourists
('0
00)
0
5
10
15
20
25
1990 1991 1992 1993 1994 1995 1996 1997 1998 1999
Visiting friends/relatives
Education
Holiday
Business
Employment
Other
UAE share (RHS)
Per
cent
0
10
20
30
40
50
60
70
F i g u r e 2 . 1 4
Tourism from the Gulf Is Growing Rapidly
Inbound Gulf Tourists to Australia by Reason for Journey, and the UAE’s Share
Source: Australian Bureau of Statistics, 2000a.
Construction Services
Population growth, gas developments, tourism growth and technological change are likely to generate
further opportunities for Australian construction companies, which already have a strong presence.
As today’s adolescents move into their twenties, demand for housing and urban infrastructure, such
as electricity, roads and fresh water, will grow rapidly. Government initiatives to encourage private
sector infrastructure provision in Oman, the UAE, Saudi Arabia and Kuwait also should increase
infrastructure construction activity. (See Chapter 4 - Foreign Investment.) Increased activity also
should flow from major planned projects exploiting Saudi, Qatari and Omani gas resources, including
gas pipelines and liquefied natural gas, LNG, plants. Continuing tourism growth also should stimulate
construction activity, particularly in Dubai where nine five-star and three four-star hotels are either
approved or under construction, and in Oman which is encouraging international hotel construction
(Austrade, 2000a).

A u s t r a l i a n O p p o r t u n i t i e s
P A G E 47
AUSTRALIA’S GROWING CONSTRUCTION SERVICES PRESENCE
Several Australian construction firms have won major contracts in Gulf economies, particularly
the UAE, and are well placed to access future opportunities. Australian construction services
companies with UAE offices include:
• Multiplex (major building and infrastructure construction provider)
• Meinhardt and Snowy Mountains Engineering Corporation (engineering consultants)
• Bonacci Winard (structural engineers)
• Crone and Woods Bagot (architects)
• Australian Prestressing Services and Northern Territory Prestressing (suppliers of
prestressed concrete)
• Worley Engineering and Clough Engineering (oil and gas engineers).
The Commonwealth Scientific and Industrial Research Organisation, which tests building
materials, and the Building Control Commission of Victoria, which provides draft building
regulations for Dubai, provide services via temporary offices or from Australia.
Source: Deacon, 2000.
By applying their leading edge in new energy, labour or time saving and environmentally friendly
construction technologies, Australian companies can generate opportunities. Already Australian firms
doing this include two specialist prestressed concrete companies pioneering this sector in the UAE,
a company with a new technique (jumpforming) for holding setting concrete in high rise buildings and
Favell Favco which developed a unique climbing crane for very high buildings (Deacon, 2000).10
LIONWELD KENNEDY: A NEW AUSTRALIAN PRESENCE
In 1998, Melbourne based industrial group, Pacifica Group Limited, acquired Lionweld Kennedy,
a UK company which exported to Dubai. As Pacifica’s philosophy is to build flexible plants
close to its customer base, it has established a full manufacturing capability, including
fabrication, in a joint venture with the Dubai Transport Company to produce customised steel
gratings and handrails. At this stage, it mainly focuses production on Dubai, but ultimately, it
may serve other regional markets.
Source: Pacifica Group Limited, 2000.
10 The prestressing companies are Australian Prestressing Services and Northern Territory Prestressing.

A C C E S S I N G T H E M I D D L E E A S T
B U S I N E S S O P P O R T U N I T I E S I N T H E A R A B I A N P E N I N S U L A A N D I R A N
P A G E 48
REACHING FOR THE SKY: MULTIPLEX IN DUBAI
Nasa Multiplex, a partnership between Multiplex Australia and His Excellency Naser Abdulla
Lootah’s Nasa group of companies, built the Emirates Towers office complex in Dubai, the
tallest building in the Middle East and Europe. It completed the project ahead of time and
under budget.
Multiplex now is pursuing other regional construction projects. It finds its Australian business
culture valuable, particularly its emphasis on innovation and quality. Multiplex works with, and
encourages, Australian business ventures in the Gulf. Multiplex also uses many Australian
materials and subcontractors on its buildings, including an Australian concrete forming company
and Favell Favco’s climbing crane, which it used on the Emirates Towers office complex.
Multiplex has pursued work in the Middle East for ten years, and has established itself as a
major force in the UAE; it is confident of further growth.
Source: Multiplex, 2000.
Financial Services
Growing infrastructure requirements, including privately provided infrastructure, increasingly liberal
foreign investment regimes and major gas related projects generate significant project financing and
investment banking opportunities in the Gulf; ANZ Investment Bank is a major player. As required
financing volumes increase, the demand for new financial products will grow. Funding diversity will
become increasingly important due to the limited investor appeal of any one debt instrument from a
particular part of the world (Knox, 2000).
Demand for mortgage products also is likely to grow as the Gulf’s young populations purchase their
own homes. For example, the traditional Saudi practice of purchasing a home from savings became
less viable in the 1990s, as per capita incomes fell. This could create opportunities for Australian
financial institutions working in joint ventures with established financial institutions to create markets
in mortgage products, including securitised products.

A u s t r a l i a n O p p o r t u n i t i e s
P A G E 49
CAPITALISING ON REGIONAL GROWTH: ANZ INVESTMENT BANK
ANZ Investment Bank, the investment banking arm of the Australia and New Zealand Banking
Group Limited, offers a full range of investment banking services in the region. It is separate
from ANZ Grindlays, the retail banking network purchased from Grindlays in 1984, which
ANZ sold to Standard Chartered in early 2000.
Through its Bahrain office, ANZ Investment Bank offers project, corporate, trade, export,
Islamic and transport finance. The office services the GCC economies as well as Iran, Jordan,
Egypt, and Turkey. Its sectoral expertise covers oil, gas and petrochemicals, power, water,
natural resources, media, telecommunications, infrastructure and industrial transport.
ANZ Investment Bank played a key role in financing several major recent petrochemical
projects. In Qatar, it was a lead arranger of a US$750 million syndicated loan facility for the
Q-Chem project for Qatar General Petroleum Corporation. In Saudi Arabia, it acted as an
arranger of US$4.8 billion of financing for four major projects Saudi Arabian Basic Industries
Corporation developed in joint ventures with Shell, Mobil and Exxon.11
In the power and
utilities sector, ANZ Investment Bank also has advised international developers on bids for
major infrastructure projects in Jordan, Kuwait, Oman, Saudi Arabia and the UAE.
ANZ Investment Bank expects large scale financing opportunities in the region to expand. As
governments accelerate privatisation initiatives, significant transactions are occurring in
Saudi Arabia, Oman and the UAE, with Iran, Egypt and Turkey also offering exciting medium
term prospects.
Source: ANZ Investment Bank, 2000.
Business Services
Computer hardware and software use is expanding rapidly, but regional economies have limited local
expertise; this generates considerable opportunities for trade and investment in IT related services.
Peachtree, an Australian software and consultancy firm with a Dubai office, recently won a contract
with Saudi ARAMCO, the world’s largest oil company, to provide human resource management services
(The Australian, 4 April 2000, p. 39).12
11 These projects are the Saudi Petrochemical Company, Sadaf, expansion, the Saudi Yanbu Petrochemical Company, Yanpet,
expansion, the Al-Jubail Petrochemical Company, Kemya, expansion and the Saudi Iron and Steel Company, Hadeed.
12 The widespread use of expatriate managers and professional personnel also creates considerable opportunities for human
relations firms. As these usually require local offices, they are discussed in the ‘Opportunities for Australian Investment -
Business Services’ section.
A C C E S S I N G T H E M I D D L E E A S T
B U S I N E S S O P P O R T U N I T I E S I N T H E A R A B I A N P E N I N S U L A A N D I R A N
P A G E 50
AUSTRALIA’S DIRECT INVESTMENT OPPORTUNIES
Australia’s direct investment presence in the Gulf is growing rapidly. Between 1997 and 2000, the
number of Australian firms represented in the UAE rose from around 30 to 70 (Austrade, 2000c).
Disaggregated official data on Australian investment in the Gulf do not exist.13
However, with the cost
of establishing a three person office averaging about A$500 000, between 1997 and 2000, new
Australian direct investment in the UAE alone could have exceeded A$20 million. Australian companies
with the largest UAE presence include Clipsal, Lionweld Kennedy, Boral, Multiplex and Greater Union.
Outside the UAE, most Australian investment is in oil and gas, with BHP Petroleum, Woodside and
Novus Petroleum all active. (See Chapter 4 - Foreign Investment.) In addition, ANZ Investment Bank’s
regional operation is based in Bahrain, while three Australian companies have significant joint ventures
in Saudi Arabia:
• B&D Rollerdoor and Al Zamil make rollerdoors
• Enviroflow and Jamjoon provide health care
• McConnell Dowell is involved in oil and gas pipeline construction with Saudi ARAMCO.
Opportunities for Australian Investment
Demographics, economic reforms, non-oil diversification policies, government fiscal problems and
new gas based developments drive opportunities for profitable Australian direct investment in the
Gulf region. Key areas of opportunity include infrastructure, transport, construction, petroleum
extraction, gas, mining, manufacturing, insurance and banking, tourism, leisure and business services.14
Infrastructure, Transport and Construction
Opportunities to invest in telecommunications, electricity and water supply service provision throughout
the Gulf should expand in the next few years, as the private sector’s role in infrastructure provision
expands. (See Chapter 4 - Foreign Investment.) Unlike projects in major Asian markets, opportunities
in Gulf markets usually are smaller and more manageable for many Australian companies. Moreover,
in Oman and Abu Dhabi, where sound electricity regulatory frameworks are emerging, Australian
utilities’ experience with corporatisation and operation in competitive private markets and private
infrastructure provision could yield important competitive advantages or make them valuable joint
venture partners. Australian construction, distribution and maintenance experience in hot, difficult
and remote terrains also is an advantage in Gulf economies.
Opportunities also are opening to invest in transport infrastructure and services to support intra-
regional trade and passenger transport. Potential investment opportunities include fast ferry services,
13 Official statistics on Australia’s investment in individual Gulf economies are unavailable due to the small values involved.
Investment in Gulf economies is included along with many other economies in an ‘other Asia’ category.
14 Discussion of opportunities in infrastructure, petroleum, gas and mining sectors overlaps with Chapter 4 - Foreign Investment.
However, as far as possible, Chapter 4 conveys more detailed information on these sectors, while this chapter focuses on
the Australian presence and specific areas of Australian opportunity.

A u s t r a l i a n O p p o r t u n i t i e s
P A G E 51
further port developments and railways. In Saudi Arabia, the World Bank is advising the Government
on port infrastructure and feasibility of north-south and east-west rail links. Such projects will require
multi-billion dollar private sector investment and create opportunities for foreign investment and know
how (Fisher, 2000b). Growing trade flows also create opportunities to develop transport links between
the Gulf and Central Asian republics, via Iran, which promotes its road and rail links as a landbridge
and actively seeks investment in land transport infrastructure.
As discussed in the section on construction services, investment and growth prospects in the
construction sector remain good, particularly given high oil prices in 2000, demographic trends and
moves to greater openness and economic reform.
Petroleum Extraction
In Saudi Arabia, Qatar and Bahrain, upstream oil production is closed to foreign investment. Similar
restrictions apply in Kuwait, although efforts are being made to allow foreign companies a role in
developing the Northern oil fields. In the UAE, longstanding foreign leases effectively exclude new
entrants. However, Oman, Yemen and Iran actively seek new investment in their upstream oil extraction
sectors. (See Chapter 4 - Foreign Investment.)
Oman and Yemen may offer further attractive opportunities for Australian companies used to working
viably in small, geologically complex fields major oil companies pass over. Potential opportunities are
considerable in Iran, where much oil producing capacity is becoming obsolete. Since 1996, the Iranian
Government has released 34 projects for tender under the buy-back system.15
BHP Petroleum,
Woodside Petroleum and numerous smaller firms, such as Novus Petroleum, seek to participate in
the Iranian upstream oil and gas sectors.
However, two key disincentives constrain investors. Firstly, the US 1993 Iran Libya Sanctions Act
imposes sanctions on companies investing more than US$20 million in Iran’s oil and gas industry.
Total already has obtained a waiver to proceed with its investment, while Elf Aquitaine and Shell are
proceeding with large investments, despite not having waivers.
Secondly, the Iranian buy-back approach makes many projects unviable for international oil companies
who generally work on longer time frames than its seven to nine year terms. Buy-backs also are
difficult to finance as they are contracts not assets, so on balance sheets, they are unfunded liabilities,
therefore attracting premium financing rates.
Gas
Australian companies are pursuing gas extraction and subcontracting opportunities in Iran, Oman
and Bahrain. BHP Petroleum is one of eight foreign companies involved in developing Iran’s gas
industry master plan (Business Monitor International, 2000b).
Overall, prospects for increased involvement in the gas sector are stronger than in oil, as in-country
expertise in this relatively new industry is less developed, and vested interests are less powerful.
15 Buy-backs are a foreign investment mechanism whereby the investor contracts to develop a project, and is paid an agreed
sum in dollar terms, via revenue from the project.

A C C E S S I N G T H E M I D D L E E A S T
B U S I N E S S O P P O R T U N I T I E S I N T H E A R A B I A N P E N I N S U L A A N D I R A N
P A G E 52
Mining
Although significant regulatory reform is needed, future mining investment opportunities will be
concentrated in Iran and Saudi Arabia. (See Chapter 4 - Foreign Investment.) Projects involving
mineral processing are more likely to attract official support than those with minimal processing.
Manufacturing
Australia has a small, diverse manufacturing presence in the Gulf, including joint venture investments
in Saudi Arabia and free trade zone investments in the UAE. The two main manufacturing investment
opportunities for Australian companies in the Gulf are:
• manufacturing operations in free trade zones, particularly in the UAE; Australian companies
including Clipsal, Kempe Engineering, Hunter Watertech, Worley Engineering and Orica Explosives
already have successful investments in these zones. Key attractions include full foreign ownership,
duty free status, income and company tax exemptions, and excellent transport links with European
and Asian markets
• equity investments in aluminium, steel and petrochemical projects using gas from Dolphin and
other major gas pipeline projects once they proceed.
Insurance and Banking
While GCC governments generally prohibit foreign insurance companies from writing premiums,
some opportunities are emerging in health insurance.16
Saudi Arabia is moving to private sector
provision of health insurance, first for expatriates, then for Saudi citizens, and foreign companies will
be able to provide coverage (Business Monitor International, 2000c).17
This is highly significant, as
medical insurance constitutes 18 per cent of Saudi insurance premiums, and medical insurance
premiums grew 25 per cent in 1997, making them Saudi Arabia’s most rapidly growing insurance
business (US Department of State, 1999a). Kuwait introduced mandatory health insurance for
expatriates in January 2000, and while foreigners cannot write insurance premiums, foreign companies
can provide local companies with support and expertise (US Department of State, 1999b).
Prospects for investment and retail banking also are growing. Likely future liberalisation of foreign
direct investment regimes should enhance these opportunities. Currently, ANZ’s investment banking
presence in Bahrain is Australia’s main presence in this sector.
16 A Saudi state owned cooperative is the only legal entity able to sell insurance, and the Kuwaiti Government bans foreign
investment in insurance. Foreign insurance companies can establish a presence in the UAE, but the Government limits their
business activities to offshore operations (US State Department, 1999a and 1999b).
17 Health insurance for Saudi Arabia’s six million expatriates will move to the private sector by the end of 2000; this initiative
will be extended to Saudi citizens within three years (Business Monitor International, 2000b).
A u s t r a l i a n O p p o r t u n i t i e s
P A G E 53
Tourism and Leisure
Significant opportunities to invest in the Gulf region’s leisure and tourism sector are emerging. Dubai
successfully markets itself as a regional centre for high value tourism based on shopping, western
style entertainment, watersports and beach/desert activities; it attracted three million visitors in 1999
(Jeffreys, 2000, pp. 99-100). Oman is increasing its efforts to attract tourists with its beach holidays
and ancient architecture, and actively seeks hotel investment; and Iran seeks to cooperate with
western tourism wholesalers to develop historical and cultural tourism.18
Several Australian firms already are active in the sector. Rydges began managing a Dubai hotel in
1999, and is looking to increase its regional presence (Allen, 2000). Greater Union has cinemas in
Dubai and Abu Dhabi via a joint venture, and an Australian firm operates the tourist ferry service on
Dubai Creek. In April 2000, Australian consultancy firm, SAGRIC, signed an agreement with Iranian
tourism authorities to help promote tourism to Iran and Australian investment in Iran’s tourism sector.
IRANIAN TOURISM DEVELOPMENT: SAGRIC SHOWS THE WAY
Iran seeks foreign expertise to develop its tremendous tourism potential. Iran has contracted
SAGRIC, a major Australian international project management and technology transfer
company, to help promote Iran as a tourist destination. The agreement includes tourism training
and planning, infrastructure development, and advice on marketing. The project originated in
1999 during Australia Iran Joint Ministerial Commission discussions.
In May 2000, SAGRIC organised for senior Iranian tourism officials to visit Australia to see
the depth of Australian expertise available to assist Iran implement its Tourism Master Plan.
In November 2000, a business mission of Australian tourism wholesalers, retailers, and media
and construction industry representatives will visit Iran.
Success in assisting Iran’s tourism development could generate opportunities for Australian
companies to invest in Iran’s tourism infrastructure and services sector.
Source: SAGRIC International Proprietary Limited, 2000.
Business Services
The need to upgrade computer hardware and software, and the continued demand for senior
expatriates, drives opportunities to invest in business services, including information technology and
recruitment. Melbourne based Independent Corporate Solutions has been in the Saudi market for
four years and in the UAE for two years, placing over 100 senior executives (Moore, 2000). Moreover,
Australian managed executive search companies, Inter Search and Morgan and Banks, have Dubai
offices. Such firms are well placed to recruit the many Australian professionals and managers employed
in the Gulf, who are respected for their flexibility and ‘can do’ approach (Crosthwaite, 2000).
18 Saudi Arabia also has a large tourism industry revolving around the massive influxes of religious pilgrims.

A C C E S S I N G T H E M I D D L E E A S T
B U S I N E S S O P P O R T U N I T I E S I N T H E A R A B I A N P E N I N S U L A A N D I R A N
P A G E 54
GULF ECONOMIES’ INVESTMENT IN AUSTRALIA
The Gulf region has exported huge volumes of capital since the 1973 oil shock, as oil revenues
exceeded domestic investment opportunities and investors sought to keep surplus funds in safe
financial centres. The entire Middle East currently has at least US$800 billion of private capital invested
abroad, and the Gulf economies at least US$500 billion, including US$150 billion from the Abu Dhabi
Investment Authority (Atkinson, 2000; and Jeffreys, 2000, pp. 43-44).19
Most of this capital is invested
in the United States, United Kingdom, Germany, France and Switzerland.
If Australia’s share of this capital were in line with its share of world gross domestic product, it would
have received about US$10 billion in investment from the Middle East, and around US$2 billion from
Abu Dhabi Investment Company. However, as the Australian Bureau of Statistics only records Australia’s
total stock of investment from Gulf economies and a number of other economies in a residual ‘other
Asia’ category at US$940 million, the potential to lift Australia’s share of Gulf capital exports is significant.20
Increasing travel and tourism between Australia and the UAE should boost investment in Australian
real estate, hotels, financial markets and service sectors. Already Gulf tourism to the Gold Coast is
generating considerable investment interest, as families recognise Australia’s relative price
competitiveness and secure permanent accommodation for their traditional two to three month summer
holidays (Gold Coast City Council, 2000).
The increasing tourist flows from the Gulf, and hence increased familiarity with Australia, also create
opportunities to attract more Gulf investment in the agriculture and resources sectors, which in turn
could help open new Gulf export opportunities. Already, investment is significant in the agriculture
sector, including racehorse studs and a cheese factory.
AUSTRALIAN MERCHANDISE IMPORTS FROM THE GULF ECONOMIES
In 1999, Australia imported A$1.3 billion of merchandise from Gulf economies, representing 1.3 per
cent of total imports. These imports are mostly petroleum related; crude and refined petroleum
accounted for 69 per cent of total imports in 1999 (Figure 2.15). Saudi Arabia supplied 51 per cent
and the UAE supplied 22 per cent of these imports.
Manufactured Imports
Gulf manufactured exports to Australia (excluding petroleum products) grew from A$32 million in
1990 to A$177 million in 1999, growing at an average of 26 per cent per year (Department of Foreign
Affairs and Trade, 2000) (Figure 2.15). The large confidential imports were mainly petrochemicals.
The most important other import is fertiliser (A$75.8 million); also important are sugar confectionery,
perfume and cosmetics, glass and glassware, pottery, manufactures of base metals, motor cycles,
lighting fixtures, musical instruments, clothing accessories and printed matter.
19 Abu Dhabi Investment Authority, ADIA, is the investment arm of the Abu Dhabi Government. It invests all surplus oil revenue
after paying oil companies and funding general government expenditure.
20 This Australian Bureau of Statistics figure is converted to US dollars at A$1:US$0.60 (Australian Bureau of Statistics, 2000b).

A u s t r a l i a n O p p o r t u n i t i e s
P A G E 55
A$
mill
ion
0
50
100
150
200
250
300
350
400
1990 1991 1992 1993 1994 1995 1996 1997 1998 1999
Wire productsStructures of iron, steelor aluminiumEthylene polymers
Floor coveringsFruit and nuts
Aluminium
Inorganic chemicalsLiquefied propane and butane
FertilizersConfidential itemsPetroleum's import share (RHS)
Pe
r ce
nt
65
70
75
80
85
90
95
F i g u r e 2 . 1 5
Non-oil Imports from the Gulf Region Rising Slowly
Australia’s Imports from the Arabian Peninsula and Iran, 1990-99
Source: Department of Foreign Affairs and Trade, 2000.
Constraints on Australian Imports from the Gulf
The main factor constraining Gulf imports is Australia’s position as a net hydrocarbons exporter;
imports therefore are restricted to specific types of crude oil for petroleum refining and refined products.
Lack of price competitiveness for mass market products, inherent volume restrictions in Australia for
niche products such as Persian carpets, musical instruments or dates, and limited trade promotion
efforts in Australia constrain manufactured imports’ growth.
AUSTRALIAN BUSINESS LINKS WITH THE GULF
Australian diplomatic and business links with the Gulf region are strong. In addition, Australians of
Middle East origin can help in forming business links and provide valuable bilingual, bicultural
employees and managers.

A C C E S S I N G T H E M I D D L E E A S T
B U S I N E S S O P P O R T U N I T I E S I N T H E A R A B I A N P E N I N S U L A A N D I R A N
P A G E 56
Diplomatic and Austrade Links
Australia maintains embassies in Saudi Arabia, the UAE, and Iran. The Australian Ambassador to
Saudi Arabia also is accredited to Bahrain, Qatar, Oman, Kuwait and Yemen.21
Saudi Arabia, the
UAE and Iran all maintain Canberra embassies, and Kuwait maintains a Military Liaison Office. The
Kuwaiti, Omani, and Qatari ambassadors to Japan are accredited to Australia.
Austrade has a Middle East and Indian Ocean regional base in Dubai, UAE and local offices in Abu
Dhabi, UAE, Iran and Saudi Arabia. In addition, the Victorian Government has a business office in
Dubai, while the South Australian Government has a representative employed on a contract basis. In
the year to 30 June 1999, Austrade assisted 309 companies who were either new to exporting or new
to the Gulf markets (Austrade, 2000b).
Business Networks
Bilateral chambers of commerce in Australia and the Gulf strengthen trade and investment links. In
Australia, the Australia-Arab Chamber of Commerce with over 400 members, is growing at 15 per
cent per year. Members range from BHP, Toyota and General Motors Holden to one person consultancy
companies. Similarly, the Australia-Iran Chamber of Commerce has 22 members comprising both
large and small Australian companies.
In the Gulf, the Australian Business in the Gulf Group, ABIG, represents Australian businesses and
individual Australians working in the Gulf region.22
Middle East Immigrants
Many Australians have migrated from the Middle East, but mainly from Lebanon, Turkey, Iran, Iraq and
Egypt rather than the Arabian Peninsula. Nonetheless, the Australian Middle Eastern community provides
an important source of native Arabic and Farsi speakers, and cultural and business contacts in the Gulf.
IMPLICATIONS
Prospects for closer trade and investment relations between Australia and the Gulf economies are
bright. In the long term, economic diversification, foreign investment liberalisation and privatisation
should reduce income volatility and increase average growth rates. In the short term, high oil prices
offer an important opportunity to diversify and expand Australian manufactured exports. Australia’s
well developed agricultural and mineral export trade also should continue to grow as populations and
industrialisation expand.
Australia’s small, diverse Gulf investment presence is growing rapidly. The range of opportunities
has never been wider, encompassing infrastructure, construction, oil and gas, mining, manufacturing,
finance, tourism, transport and business services. A stronger investment presence is likely to have
flow on trade benefits. The Gulf’s small investment in Australia also is growing as air, tourism and
business links between Australia and the Gulf expand.
21 From October 2000, Australia’s embassy in Abu Dhabi, UAE will become accredited to Qatar.
22 Contact details for these organisations, and others, are listed in ‘Information for Companies’ at the end of this report.
A u s t r a l i a n O p p o r t u n i t i e s
P A G E 57
REFERENCES
Allen, S., 2000, East Asia Analytical Unit interview with Sales Manager, Rydges Plaza, Dubai, March.
Atkinson, S., 2000, ‘Recent GCC Infrastructure Developments, Sector Needs and the Prognosis’,
paper presented at the Gulf 2000: Energy, Infrastructure and Finance Conference, Abu Dhabi,
28 and 29 March.
Austrade, 2000a, ‘Australia’s Trade Relations with the Middle East Including the Gulf Region’, Austrade
Submission to Joint Standing Committee on Foreign Affairs, Defence and Trade Enquiry into
Australia’s Relations with the Middle East, Canberra, March.
___ 2000b, Information supplied to the East Asia Analytical Unit by Austrade, Canberra, August.
___ 2000c, Information supplied to the East Asia Analytical Unit by Susan Kahwati, Trade
Commissioner, Austrade, Dubai, June.
Australian Bureau of Statistics, 2000a, Unpublished tourism statistics, ABS, Canberra, July.
___ 2000b, ‘Balance of Payments and International Investment Position: 1998-99’, Catalogue
No. 5363.0, ABS, Canberra.
ANZ Investment Bank, Information supplied to the East Asia Analytical Unit, June.
AWB Limited, 2000, Information supplied to the East Asia Analytical Unit, July.
Bunton, M., 2000, East Asia Analytical Unit interview with Manager, International Trade, Smorgon
Cyclone Rural, Canberra, April.
Business Monitor International, 2000a, ‘Decision Time for Aluminium’, Middle East Monitor, June, p. 11.
___ 2000b, ‘Buy-Backs Move Onshore’, Middle East Monitor, March, pp. 2-4.
___ 2000c, ‘High Noon in the Neutral Zone’, Middle East Monitor, March, pp. 2-4.
Canadian Business Development International, 1997, The Agriculture and Agri-Food Exporter’s Guide
to Opportunities in the Middle East: Saudi Arabia, Agriculture and Agri-Food, Canada, July, atn-
riae.agr.ca/public/htmldocs/e1557.htm, accessed on 22 February 2000.
Crosthwaite, C., 2000, East Asia Analytical Unit interview with General Manager, Inter Search,
Dubai, May.
Deacon, P., 2000, Information supplied to the East Asia Analytical Unit by Executive Director, Victorian
Government Business Office, Dubai, June-July.
Department of Education, Training and Youth Affairs, 2000, Information supplied to the East Asia Analytical
Unit by the Department of Employment, Education, Training and Youth Affairs, Canberra, July.
Department of Foreign Affairs and Trade, 2000, Stars Database, Department of Foreign Affairs and
Trade, Canberra.

A C C E S S I N G T H E M I D D L E E A S T
B U S I N E S S O P P O R T U N I T I E S I N T H E A R A B I A N P E N I N S U L A A N D I R A N
P A G E 58
Department of Minerals and Energy Western Australia, 2000, ‘Alumina’, www.dme.wa.gov.au/statistics/
resourcefocus00/alumina.html, accessed on 7 July 2000.
Emirates SkyCargo, 2000, Information supplied to the East Asia Analytical Unit by Emirates Airlines, July.
Fisher, D., 2000a, ‘Desert Storm’, Overseas Trading, May, pp. 30-33.
___ 2000b, Information supplied to the East Asia Analytical Unit by Senior Trade Commissioner,
Riyadh, July.
Giller, S., 2000, East Asia Analytical Unit interview with Director, Austanz International and President,
Australia Arab Chamber of Commerce, Melbourne, June.
Gold Coast City Council, 2000, Information supplied to the East Asia Analytical Unit by Gold Coast
City Council, Mayor’s Office, July.
Gulf Cooperation Council, 1999, Economic Bulletin, Vol. 14.
International Monetary Fund, 2000, International Financial Statistics, IMF, Washington DC.
Jeffreys, A. (ed.), 2000, Emerging Emirates 2000, Oxford Business Group, London.
Knox, G., 2000, ‘Raising Finance for Middle East Infrastructure Projects’, paper presented at the Gulf
2000: Energy, Infrastructure and Finance Conference, Abu Dhabi, 28 and 29 March.
Moore, D., 2000, Information supplied to the East Asia Analytical Unit, June.
Multiplex, 2000, Information supplied to the East Asia Analytical Unit, June.
Pacifica Group Limited, 2000, Information supplied to the East Asia Analytical Unit, July.
Pardy, C., 2000, East Asia Analytical Unit interview with Director, Pardy and Sons, Sydney
Markets, August.
Peacock, R., 2000, Information supplied to the East Asia Analytical Unit, August.
Queensland Sugar Corporation, 2000, Information supplied to the East Asia Analytical Unit, June.
SAGRIC International Proprietary Limited, 2000, Information supplied to the East Asia Analytical
Unit, July.
US Department of State, 1999a, ‘FY 2000 Country Commercial Guide: Saudi Arabia’, prepared by
US Embassy Riyadh, released by Bureau of Economic and Business Affairs, US Department of
State, at www.state.gov/www/about_state/business/com_guides/index.html, accessed on
21 June 2000.
___ 1999b, ‘FY 2000 Country Commercial Guide: Kuwait’, prepared by US Embassy Kuwait, released
by Bureau of Economic and Business Affairs, US Department of State, at www.state.gov/www/
about_state/business/com_guides/index.html, accessed on 21 June 2000.
Vaile, M., 2000a, 2000, Press release by the Minister for Trade, ‘Auto Exports to Middle East Soar’,
3 March.
___ 2000b, Press release by the Minister for Trade, ‘Reassurance on Alumina Supplies’, 3 March.

C h a p t e r 3
P A G E 59
THE BUSINESS ENVIRONMENT
KEY POINTS
• Most Australian companies use commercial agencies to distribute
their goods in the Gulf. However, companies need to take great care
in choosing agents and drawing up agency agreements. As the long
term trend is for agents’ legal importance to decline, agents are
looking to add more value and be more actively involved in businesses
than in the past.
• Arabian Peninsula economies generally have similar, investment
grade risk ratings to the Republic of Korea, Malaysia and Thailand,
although Iran is rated significantly more risky. Further economic
reform and diversification are critical to improve ratings.
• The Gulf region’s young population will influence the future regional
business environment. Young populations will stimulate demand
for snack foods, housing, education, information technology and
communication products. On the other hand, pressure to
localise employment will grow as the number of local workforce
entrants swells.
• Several Gulf jurisdictions’ legal frameworks are not as well developed
as western economies’, so avoiding litigation is important to business
success. To avoid litigation, undertake thorough due diligence
on potential partners and use all available means of non-legal
dispute resolution, such as negotiation and arbitration.
A C C E S S I N G T H E M I D D L E E A S T
B U S I N E S S O P P O R T U N I T I E S I N T H E A R A B I A N P E N I N S U L A A N D I R A N
P A G E 60
Understanding the Gulf region’s unique history, religion and culture significantly improves the business
prospects of today’s traders and investors. For millennia, these countries have been trade crossroads
between Europe, Asia and Africa, actively engaging in and facilitating international trade. The Gulf
economies present an array of market types, ranging from extremely poor Yemen and lower middle
income Iran, to very wealthy Saudi Arabia, the UAE, Qatar and Kuwait. Unusual demographic, ethnic
and cultural diversity also influences commercial opportunities.
This chapter draws out the implications for western businesses of the region’s religion, culture and
history. It then assesses the regional legal environment and analyses some key business issues,
including the role of distribution representatives, market risk, taxation, demographics, bureaucratic
culture, the role of chambers of commerce, Arab-Israeli relations, the role of negotiation, marketing
issues and visa requirements. Appendices detail taxation, labour and other business environment
policies in individual economies.
RELIGION
Islam, the region’s dominant religion, permeates policy making and daily life far more than religion
does in western economies. For example, while exceptional by regional standards, the Leader of the
Islamic Revolution in Iran and conservative Islamic theologians in Saudi Arabia considerably influence
law making and economic policy. Islam also guides food and drink consumption, clothing patterns,
financial sector activities and products, attitudes to advertising, sayings and phrases, and most of
the population’s world view.
The primary source for Muslim behaviour and beliefs is the Koran, the holy book of Islam, which is
complemented by the Prophet Mohamad’s sayings recorded by historians or hadith, and a large
body of Islamic jurisprudence and scholarly analysis. Sharia, or traditional Islamic law, underpins the
legal systems of all the Gulf states.
All Muslims should adhere to the five basic tenets of Islam:
1. Al-Shahada – declaring and living by the statement, ‘there is no God but Allah and Mohamad is
his Prophet’
2. Al-Salah – praying according to the laws of Islam, five times each day (three in the case of the
Shi’a denomination)
3. Al-Zakah – giving alms to the poor (normally 2.5 per cent of income and inheritance each year)
4. Al-Siyam – observing the holy month of Ramadan (which includes abstaining from eating, drinking,
smoking and sexual relations during daylight hours)
5. Al-Hajj – undertaking a pilgrimage to Mecca at least once in a lifetime, if affordable.
The Gulf region contains followers of both Sunni and Shi’a Islam. These two communities dispute the
original method of choosing a successor to the Prophet Mohamad, and Shi’a followers allow appointed
religious leaders, the Imams and Ayatollahs, to control religious doctrine. These differences do not
radically affect the way of life in either community. The Shi’a dominate in Iran, form a majority in
Bahrain, and account for a sizeable proportion of the Kuwaiti and Saudi populations.

B u s i n e s s E n v i r o n m e n t
P A G E 61
The Sunni account for most of the Saudi and lower Gulf populations, and dominate in the rest of the
Arab Middle East, except southern Lebanon.
CULTURE AND HISTORY
Understanding how Arab and Persian culture and history are different, and how they influence business
practices, is critical to business success in the region.
Culture and History on the Arabian Peninsula
Contemporary Arabian Peninsula culture derives from traditional bedouin or nomadic customs, and
from being Islam’s birthplace. Until oil exploitation in the mid twentieth century, much of the Arabian
Peninsula’s settled population lived either in small cities in the west of present day Saudi Arabia or in
Yemen. The rest of the peninsula was either populated by nomadic tribes, or was virtually uninhabited
desert. The borders of twentieth century nation states reflect foreign power demarcations rather than
traditional boundaries, and many are disputed.
Persian Culture and History
Iran (formerly Persia) has a long history of settled civilisations and contact with the outside world.
The area encompassing modern Iran was a trade crossroads on the ancient Silk Road between Asia
and Europe. While outside powers conquered Iran many times, it also controlled a regional empire
and was a major centre of cultural, scientific and economic achievement. Consequently, Iranian
national identity and pride in past achievements is strong.
ARABS AND PERSIANS
Despite geographical proximity and some cultural similarities, Arabs and Persians are
completely separate peoples, often taking offence if misidentified or grouped together.
Arabs are of Semitic background, originally from the Arabian Peninsula and the Levant.1
Arabic language belongs to the same family as Aramaic and Hebrew. Persians are of Caucasian
ethnicity, and Farsi or Persian language is of Indo-European origin. Written Arabic and Persian
overlap, especially in religious, scientific and political terminology, but common usage and
grammar are quite different.
A common issue relating to Arab and Persian terminology is the official term for the Gulf itself.
Iranians refer to it as the ‘Persian Gulf’, which is reflected in reflects the United Nations’ and
the Australian Government’s practice, while Arabs refer to the ‘Arabian Gulf’. Using an
inappropriate term on official documents, such as export labels or contracts, can cause serious
problems for the business involved and local partners or representatives.
1 Semitic refers to a number of racial groups, including the ancient Phonecians and Assyrians, as well as Jews and Arabs.

A C C E S S I N G T H E M I D D L E E A S T
B U S I N E S S O P P O R T U N I T I E S I N T H E A R A B I A N P E N I N S U L A A N D I R A N
P A G E 62
Common Cultural Issues Influencing Business
Persian and Arab cultures share many characteristics, including regarding honour, face, modesty,
hospitality, patience and trust as important indicators of character. Usually, foreigners’ minor,
unintentional cultural and social mistakes are forgiven; many business people and senior officials are
western educated or experienced in dealing with westerners.2 Nonetheless, culturally acceptable
behaviour greatly assists communication between business people.
Personal Honour
Because personal honour is so important, including maintaining face against comments or actions
considered insulting, confrontational behaviour is unlikely to succeed. Honour also applies to the
family, where defending family, including extended family members, is extremely important. Behaviour,
such as reluctance to bear bad news, is related to the importance of honour.
Modesty in Dress and Behaviour
Modesty is manifested foremost by relatively conservative dress and behaviour, by western standards.3
While dress standards for westerners generally are more relaxed in the less conservative states of
the UAE, Oman, Kuwait, Qatar and Bahrain, ‘skimpy’ clothing is culturally insensitive.
The traditional greeting between two Arab or Iranian men includes a hug and often a kiss on the
cheek, as well as extensive personal inquiries. Most Middle Easterners use a handshake with foreigners
and considerable social chat. In more conservative Gulf economies, greetings to foreign women may
not include physical contact, as traditional people and religious leaders never physically touch a
woman who is not family. However, many younger or more westernised Middle Easterners will shake
hands with a woman. Generally, men and women should not publicly display affection; in Saudi
Arabia, married couples do not even hold hands. In Bahrain and the UAE, conventions are less strict
for foreigners, but behaviour should favour conservatism.
Hospitality
Hospitality is a key characteristic of Arab and Iranian culture. Generosity to guests is a strong tenet
of Islam, but also stems from traditional tribal structures, and in the Gulf Arab case, the hardships of
the traditional nomadic desert lifestyle where refusing hospitality to visitors could cause their deaths.
Hospitality therefore is an integral part of business relationships. Guests should not refuse basic
hospitality such as drinks and food, invitations to social functions or small gifts. However, they should
treat more valuable gifts cautiously. If a business person accepts an expensive gift, a holiday or
anything disproportionate to the business relationship, recipients may be seen as indebted to the
provider and their negotiating position weakened (Williams, 1998).
2 For more background and explanation of the foundations and evolution of Arab business and management culture, see Ali,
1990; and Bakhtari, 1995.
3 Male foreigners should wear a business suit during business hours, and a sports jacket or similar casual clothing on
informal occasions (Ghassan, 2000). Female foreigners usually should wear a long sleeved blouse, long skirt or dress or
loose-fitting trousers. In Saudi Arabia, foreign women must wear a loose-fitting black cloak or abaya to completely cover
their normal clothing and should carry a large scarf to cover their heads if required. In Iran, all women must wear clothing to
cover everything, except the face and hands, including upon arrival in the country.
B u s i n e s s E n v i r o n m e n t
P A G E 63
Attitudes to Time and Meetings
Some Middle Eastern people are not rigidly tied to timing or deadlines; this should not be interpreted
as discourtesy or lack of interest (Ghassan, 2000). While some business meetings may not start on
time, foreigners should not assume that turning up late for meetings is acceptable. Because people
accept invitations to simultaneously held events, last minute cancellations or changes of plan are
common. In such situations, Arabs usually attend the more important event without concern for order
of acceptance. Family obligations and responsibilities toward government leaders often override
other considerations.
Arabs often view agendas as unnecessary, so they are best avoided, apart from providing a general
outline of issues for consideration. Agendas including sensitive or uncomfortable issues will be counter-
productive; such matters are only discussed when people are comfortable and ready to progress to
them. Issues of real sensitivity tend to be canvassed toward the end of discussions, and often are
addressed initially in indirect ways. Excessive note taking or verbatim reporting of meetings may be
unacceptable and inhibit establishing strong personal rapport (Williams, 1998).
Friendship and Trust in Business Relationships
In both social and business contexts, many Middle Easterners are unwilling to trust people they do
not know. Mutual respect and trust is the key protection in a relationship and most effective in ensuring
fair treatment for all parties. Hence, while building trust takes time, it is an essential prerequisite for
business relationships. An introduction from a trusted third party can slightly speed up this process,
but several meetings, including some socialising, is normal before commencing serious business
negotiations. Once established, regular visits and contact should nurture a business relationship.
One order does not necessarily become several, even if the client is satisfied, unless the relationship
is maintained.
Political and Historical Factors
Both Arabs and Iranians attach importance to the widely held perception that Australian business
people are honest and reliable business partners. The feeling is widespread that Australians, unlike
some other Westerners, do not have political ambitions or negative historical associations with the
region. These factors create important advantages for Australians seeking opportunities to do business
in both the Arabian Peninsula and Iran.
A C C E S S I N G T H E M I D D L E E A S T
B U S I N E S S O P P O R T U N I T I E S I N T H E A R A B I A N P E N I N S U L A A N D I R A N
P A G E 64
AWB LIMITED: A SUCCESSFUL LONG TERM STRATEGY
AWB Limited, formerly the Australian Wheat Board, has captured around two thirds of the
A$2.4 billion per year Gulf wheat market through a strategy of developing long term partnerships
with key regional buyers and governments.
In Abu Dhabi, in the UAE, AWB has been the sole supplier since a flour mill was established
in the 1970s. In Iran, a close and longstanding relationship with the monopoly importer, the
Government Trading Company, GTC, helps AWB routinely supply up to 60 per cent of Iran’s
import requirements. GTC greatly values AWB’s continued supply, despite the Iran-Iraq war,
US trade embargoes and Iranian economic difficulties. AWB has worked closely with Australia’s
Export Finance Insurance Corporation to extend short term insurance and finance to cover
contracts under National Interest provisions, to maintain market competitiveness.
AWB promotes and markets Australian wheat as a distinct, branded product, with reliable
quality designed to meet specific customer end use requirements. This strategy differentiates
AWB from other bulk wheat suppliers, and meets the demand for quality and service that
adds value to customer businesses.
Source: AWB Limited, 2000.
THE LEGAL ENVIRONMENT
The region has a distinct legal environment with Sharia law forming a basis for regional constitutions
and applying to such civil issues as marriage, divorce and inheritance.4 Sharia law recognises property
rights and contractual obligations. However, beyond that, its direct business impact is limited; business
law is not usually cited in religious texts and tends to be government legislated. Nonetheless, legal
frameworks are not as well developed as in western economies, and avoiding litigation often is
critical to business success.
Key legal issues for foreign companies operating in the Gulf include:
• undertaking thorough due diligence on commercial agents or investment sponsors to minimise
the chances of costly, time consuming legal action
• complying with the complex foreign ownership laws, where movements above certain thresholds
can be illegal or have major tax implications
• minimising the likelihood of paying compensation to agents in the event of non-renewal, or
unjustifiable termination of agency agreements
• seeking intellectual property protection.
4 Information on the regional legal environment was kindly provided by UK law firm Trowers & Hamlin, which maintains a
network of branch offices and cooperation arrangements with local counsel across the region. (See contact details at the
end of the report.)

B u s i n e s s E n v i r o n m e n t
P A G E 65
Courts do not always award interest or costs, and require Arabic documentation. Consequently,
using the court system is generally the last resort after exhausting all avenues of negotiation and
arbitration. Whenever possible, contracts should specify third country arbitration.
All regional economies anticipate substantial business law reform in the near future, with WTO
requirements a major driver. Key priorities include developing competition laws, which currently only exist
in Yemen, further improving intellectual property protection and reforming commercial agency laws.
Saudi Arabia
In Saudi Arabia, appeal to the Board of Grievances is an automatic right in commercial disputes,
including claims against the government and government agencies. Practitioners regard the board
as impartial in deciding between domestic and foreign interests. However, Saudi courts do not award
interest or costs, and damages are limited to actual or tangible losses, with no means to recover loss
of business reputation or anticipated future profit. Consequently, foreign companies prefer arbitration.
The enactment of the new Foreign Investment Regulation of 10 April 2000 marks the beginning of an
extensive reform program of Saudi Arabia’s business laws. Already, laws on taxation of foreign companies
and land ownership have changed, although how all the changes will work in practice is unclear.
The UAE
Federal legislation covers most key business areas to some degree. Individual emirates also have
their own laws governing land, property, natural resources and taxation. The court system is not
necessarily quick or efficient for resolving disputes and costs are not awarded, but frequently courts
award simple interest of up to 12 per cent on disputed late payments. Chambers of commerce
promote arbitration; however, court involvement is usually required for enforcement. Moreover, foreign
arbitral awards and judgements generally are not enforceable without court endorsement.
The United States now considers intellectual property law sufficiently robust for it to remove the UAE
from its ‘watch list’. However, as a WTO member, the UAE is likely to come under pressure to
address the restrictive nature of its commercial agencies law. Competition and consumer protection
laws also are lacking.
Iran
Foreign companies find the current legal situation problematic. Commercial law is codified in
overlapping legislation, and the court system is inefficient and arbitrary. Moreover, government
regulations constantly change and may override legislation; overlapping municipal, provincial and
national legal jurisdictions also make it difficult to determine appropriate jurisdiction.
The strong likelihood of legislative change to business laws under the new, reform minded
administration, particularly acceptance of international arbitration, is a positive sign.

A C C E S S I N G T H E M I D D L E E A S T
B U S I N E S S O P P O R T U N I T I E S I N T H E A R A B I A N P E N I N S U L A A N D I R A N
P A G E 66
Kuwait
Kuwait is undergoing a major reform of business laws, with a new industrial law passed in 1999 and
new intellectual property protection law implemented in 2000. Courts are reasonably effective for
resolving disputes, but arbitration is an important first step, and formally recognised in law.
Oman
Oman’s WTO accession bid has helped business law reform. Oman tightened intellectual property
protection in 1999, and should relax foreign investment and taxation laws discriminating against
companies with foreign equity in 2000. The court system generally is effective for resolving disputes
and becoming more so, as precedents are established. Arbitration is encouraged as the commercial
court upholds both the decision to arbitrate and choice of governing law for, and location of, arbitration.
Bahrain
Bahrain’s business law is generally well developed and respected. The courts are an effective, albeit
time consuming means of resolving disputes. Bahrain has a developed arbitration system, with two
commercial arbitration centres, one being the GCC States Centre for Arbitration. The highly regarded
Bahrain Monetary Agency regulates banking and finance, and its prudential supervision of banking
drives Bahrain’s growth as an offshore financial centre.
Yemen
Yemen’s business laws are well developed, covering intellectual property protection and competition
policy, and equally treating Yemeni and foreign capital. Arbitration also is allowed, and if one party is
non-Yemeni, the parties may agree to arbitrate outside Yemen. However, Yemeni courts require
further development to support fully Yemen’s modern commercial legislation.
Yemen’s desire to accede to the WTO by 2005 should drive further legal reform.
KEY REGIONAL BUSINESS ISSUES
Regional business issues important to commercial success include:
• importance of agents and their changing role
• choice of a local investment partner
• degree of market risk
• taxation regimes
• changing demographics
• bureaucratic culture
• key role of chambers of commerce
• Arab-Israeli relations
• importance of negotiation
• need for a different emphasis in marketing
• visa requirements.5
5 Foreign direct investment restrictions also are a critical issue. (These are considered in Chapter 4 - Foreign Investment.)

B u s i n e s s E n v i r o n m e n t
P A G E 67
The Importance of Agents
Most Australian companies selling goods on the Arabian Peninsula initially use an agent to market
and distribute their products. Generally in Oman, Qatar, Kuwait and Bahrain, by law, foreign companies
exporting directly to the region must use local agents to distribute goods locally (Table 5.1). In the
UAE, for products with low promotion and after sales service requirements, an exchange of letters
between a foreign company and a re-seller can avoid legal problems associated with agency laws
(United States Department of State, 2000). Agents are less critical in Iran, as the central bank
prioritises all potential imports to determine foreign currency allocation. Instead, most exporters,
particularly of basic food, industrial and agricultural items, submit tenders to government trading
companies, ministries or merchants with an import licence.
On the Arabian Peninsula, choice of an agent is critical because laws governing agents and their
relationship with foreign firms are inflexible, and in legal disputes, courts usually favour local agents.
Furthermore, as mass advertising is less prevalent than in the West, agents and distributors are
primary marketing tools. Australian companies establishing a presence in the region often engage
specialist representatives with regional experience, such as Austrade, state government business
offices or export consultants, to help find the right agent or distributor.
Agents’ importance and contractual inflexibility increases the importance of drawing up formal agency
agreements. Agreements in Arabic or Farsi should not be signed without independent translation
(Fisher and Fisher, 1998). Clauses regarding individual responsibilities, performance, expiry and
termination are critical.6 For example, in Oman, local agents must be compensated when terminating
an agreement, unless they clearly failed to fulfil prescribed obligations (British Bank of the Middle
East, 1997a). The Saudi and Kuwaiti Governments have produced ‘model’ agency agreements, which
can form the basis to negotiate a document both parties accept. In Saudi Arabia, any additions to the
agreement cannot conflict with or detract from the model agency agreement. Specific legal advice on
any proposed alterations is critical, as infringement of Saudi commercial law results in fines or bans
on doing business there (Fisher and Fisher, 1998).
SAN REMO: SUCCESSFULLY EXPORTING TO THE GULF
San Remo Macaroni Company Limited has exported to the Middle East through an Australian
manufacturer’s representative for the last ten years. San Remo started with a limited range of
pasta meals, then diversified into a wider range of pasta products, Asian noodles and snack
foods under two brands. Over the decade, sales have fluctuated considerably, but presently
exceed A$1 million and are growing strongly; noodles and snack foods presently are doing
best. San Remo is implementing a new marketing strategy for pasta products and expects
to double its export values over the next two to three years. In addition to the Gulf, San Remo
exports to Egypt, Jordan and Lebanon. It has separate distribution arrangements in each economy.
Source: Giller, 2000.
6 Importantly, an expiry date alone may not be sufficient reason to cancel a registered agency agreement.

A C C E S S I N G T H E M I D D L E E A S T
B U S I N E S S O P P O R T U N I T I E S I N T H E A R A B I A N P E N I N S U L A A N D I R A N
P A G E 68
DIFFERENT AUSTRALIAN APPROACHES TO EXPORT MARKETING
Current President of the Australia Arab Chamber of Commerce and Industry, Syd Giller,
organises importing, marketing and distribution in all Gulf markets through his company,
Austanz International. Austanz represents companies such as Berri and San Remo, focusing
on accessing the most appropriate representatives to distribute products and developing
suitable marketing strategies. Austanz works with local representatives on marketing and
with distributors in preparing the initial draft of each annual marketing plan to ensure a
consistent focus across regional markets, and to inject appropriate international marketing
techniques. Giller maintains that successfully exporting retail ready products to the Middle
East through an agent requires a whole hearted market commitment for at least three years.
This commitment helped Berri and San Remo to succeed.
The Al Mutawie General Trading Company, managed by Australian, Barrie Harmsworth, also
imports and markets Australian products, including metal manufactures and industrial
abrasives, as well as construction related products from Europe. This company has a local
partner who actively promotes the company’s products and provides financial guarantees to
obtain bank credit. Harmsworth believes the active participation of a well informed local partner,
along with an experienced expatriate manager, can avoid damaging pitfalls in a market where
exposure and risk often are difficult to determine accurately.
Source: Giller, 2000; and Harmsworth, 2000.
Future Role of Agents
Over the next five years, the agent’s role is likely to change considerably. As elsewhere, e-commerce
will reduce dramatically the role of intermediaries in many Gulf industries. For example, already
major clients try to do business directly with Johnson and Johnson Medical Middle East (McLaren,
2000). In addition, WTO requirements increase the difficulty of reserving agency roles for nationals
and of requiring exclusive agencies. For example, the Saudi Government recently banned the use of
agents in bidding for downstream gas developments, while Oman and Bahrain no longer require
exclusive agencies. Combined with tariff unification, these reforms will increase the scope to have
one distributor for several different Gulf markets, rather than one distributor per market.
Generational change also is important in driving change in agents’ roles. In the UAE, higher education
levels and recognition that agents increasingly will need to add value means the younger generation
are developing their own businesses and becoming more involved in actively running them (Deacon,
2000). This is opening up opportunities for Australian business, as these young entrepreneurs often
seek non-traditional suppliers to help establish their businesses (Deacon, 2000).

B u s i n e s s E n v i r o n m e n t
P A G E 69
Choosing a Local Investment Partner
Requirements for majority local ownership are common, particularly in the UAE, Kuwait, Iran and
until recently, Saudi Arabia. (See Chapter 4 - Foreign Investment.) Even without these requirements,
a strong local partner can be an important asset, facilitating prompt payment and market access.
Finding the right investment partner often can be time consuming, but Austrade offices in the Gulf,
and state government economic development offices in Dubai provide partner matching services for
Australian companies. (See contact details at the end of the report.) Consulting and accounting firms
like Talal Abu-Ghazaleh also can introduce foreign investors to wealthy local investors looking for
joint venture opportunities (Hashem, 2000).
Contacts through other Australian firms and regional clients can be useful. In establishing its business
supplying and installing mobile taxi data and communications equipment in Dubai, Raywood
Communications found a 51 per cent local partner through the contacts of another Australian company
already operating in the Middle East. The Dubai Transport Corporation helped check the partner’s
credentials, and locally based English solicitors drew up a partnership agreement (Elton, 1999).
Market Risk
Arabian Peninsula economies generally have similar investment grade risk ratings to the Republic of
Korea, Malaysia and Thailand (Table 3.1).7 Iran is rated significantly more risky; however, with most
of Iran’s foreign debt likely to be retired by 2002, prospects for a ratings upgrade are good.
The main factors positively influencing risk weightings on the Arabian Peninsula are large oil reserves
and structural savings surpluses, which strengthen repayment ability. Saudi Arabia’s 1998 gross
domestic savings rate of 35 per cent compared to its gross domestic investment rate of only 20 per cent,
while Kuwait’s 1998 gross domestic savings rate of 25 per cent compared to its gross domestic
investment rate of only 13 per cent (World Bank, 1999).8
Negative factors include weak fiscal and economic management and political and security problems.
For example, in 1998 Saudi central government domestic debt reached 116 per cent of GDP, and
throughout the region economic reform is progressing slowly and over reliance on oil continues.
Internal political problems remain including succession concerns in Saudi Arabia and Kuwait,
unresolved demands for democracy in Bahrain, ongoing banditry in Yemen and tensions between
moderates and conservatives in Iran.
7 Except Yemen which attracts the most negative sovereign risk rating from Australia’s Export Finance Insurance Corporation,
and which Moody’s and other leading international rating agencies do not rate.
8 Data for other Gulf economies are not available from World Bank, 1999.

A C C E S S I N G T H E M I D D L E E A S T
B U S I N E S S O P P O R T U N I T I E S I N T H E A R A B I A N P E N I N S U L A A N D I R A N
P A G E 70
T a b l e 3 . 1
Low, Medium and High Risk Ratings
Moody’s and EFIC Risk Assessments for the Arabian Peninsula and Iran
Moody’s long term bonds EFIC risk ratingsb
and notes ratingsa
Bahrain Ba1 2
Qatar Baa2 2
UAE A2 3
Saudi Arabia Baa3 3
Iran B2 5
Oman Baa2 3
Kuwait Baa1 2
Yemen na 6
Thailand Baa3 3
Republic of Korea Baa2 3
Malaysia Baa3 3
Note: a Moody’s investor service ratings: obligations that extend longer than one year are rated using Moody’s Aaa-through-C long term
rating symbols, with Aaa representing the highest credit quality, meaning that the obligation ranks highest in its margins of investor
safety against credit loss, even under severe economic conditions. The lowest rating, C, indicates the lowest level of credit quality,
meaning that the obligation has extremely poor chances of attaining any real investment value. In between, obligations rated Baa
and above are termed investment grade. Those rated Ba and below are speculative grade. Moody’s uses a separate rating system
to rate securities that mature in less than one year.
b Export Finance and Insurance Corporation, EFIC, ratings also are by category, with 1 the lowest risk and 6 the highest. Ratings
are effective as of August 2000 and may change over time.
na means not available.
Source: Moody’s Investor Services, 2000; and Export Finance and Insurance Corporation, 2000.
Iran’s higher risk rating stems from the slow pace of economic and political change, high reliance on
oil for foreign exchange revenues and absence from international capital markets which gives it little
flexibility to borrow new money or refinance existing debt during oil price slumps. Under these
pressures, Iran twice rescheduled its bilateral debt in the 1990s. Nonetheless, Iran’s higher country
risk can be offset by lower buyer risk. For example, the Iranian Government Trading Company is a
monopoly purchaser of basic foodstuffs with priority access to foreign currency through central bank
letters of credit; Queensland Sugar Corporation and AWB Limited successfully expanded their exports
to Iran through this company. (See Chapter 2 - Australian Opportunities.)
The Future
With the region’s burgeoning infrastructure and project financing requirements, governments
increasingly recognise the benefits of investment grade credit ratings. In 2000, strong oil prices
should improve domestic fiscal positions. However, to improve their credit ratings, the Gulf economies
also need to progress economic reform, further liberalise investment laws and level the playing field
between domestic and foreign companies.

B u s i n e s s E n v i r o n m e n t
P A G E 71
Complementing reform efforts with further economic diversification would reduce the risk associated
with fluctuating oil prices. The UAE and Bahrain already have developed strong services sectors,
while Qatar and Oman are particularly well placed to diversify with major gas projects coming on-
stream, although the foreign debt incurred in establishing these projects needs to be reduced.
Taxation Issues
The Arabian Peninsula is unique in having no personal income tax, wholesale or point of sale taxes.
Bahrain and the UAE also levy no corporate tax on firms in most sectors.9 Generally throughout the
region, corporate tax rates rise as profits and foreign equity rise (Appendix Table 3.1).
Foreign businesses often are taxed implicitly through higher charges for utilities and health care, and
via a range of other charges. For example, according to BDO Hospitality consultants, a Dubai based
management consultancy, governments progressively are using trade licences, residence visas and
work permits for indirect taxation (Wilkinson, 1998). In addition, Abu Dhabi recently raised utility
charges for expatriates by 80 per cent, albeit only to cost recovery levels (Gulf Business, 2000). Until
revenue bases are broadened, this trend is likely to continue and spread to local citizens.
TAXATION OF AUSTRALIAN NATIONALS
Under Section 23AF of the Australian Income Tax Assessment Act, Australian businesses
undertaking specific projects in the Middle East can apply to Austrade, which coordinates
applications for the Australian Tax Office, to have the earnings of employees or contractors
exempted from Australian taxation. Approval as an eligible project depends on factors including
existence of foreign competition, employment of Australians, a net foreign exchange benefit
or a goodwill benefit to Australia. Employees or contractors working for an Australian company
on an eligible project can claim the salary related components of their remuneration package
as tax exempt, thus ensuring a competitive position in the world labour market.10
Source: Deacon, 2000; and Moore, 2000.
Demographics
The Gulf region’s young population and the importance of non-nationals in many economies have
important business implications.
Young Populations
The Gulf Cooperation Council, GCC, economies’ populations are very young, with 66 per cent of the
population aged under 25 (Gulf Cooperation Council, 1999 and Figure 1.9).11
This is due to the high
9 In the UAE, individual emirates levy corporate taxes in the oil and gas sector, and banking.
10 The Australian Tax Office does take the global earnings of the individual into account in determining the average tax rate.
However, this rate only applies to Australian earned income.
11 In Iran, the proportion of the population aged under 25 is even higher, at 70 per cent.

A C C E S S I N G T H E M I D D L E E A S T
B U S I N E S S O P P O R T U N I T I E S I N T H E A R A B I A N P E N I N S U L A A N D I R A N
P A G E 72
birth rate of nationals, whose per capita incomes surged after the 1970s oil shocks, and to large
numbers of young immigrant workers. This young population should stimulate demand for a range of
products including education, music products, snack foods, travel, housing, electronics, information
technology and communication products and mortgage finance. (See Chapter 2 - Australian
Opportunities.) Pressures to lift employment growth also should maintain economic reform pressure.
(See Chapter 1 - Economic Prospects.)
The Importance of Non-nationals
Non-nationals are an important element in all GCC markets, accounting for more than 70 per cent of
the population in the UAE and Qatar, and 65 per cent in Kuwait (Figure 3.1). The different income
levels and cultural backgrounds of expatriate and local populations in already small markets complicate
advertising and marketing.
In many Gulf economies, non-nationals do virtually all menial, dangerous or lowly paid work, and fill
many skilled and managerial private sector positions. In many cases, foreign companies will deal
with non-nationals, although often a local citizen is still the ultimate decision maker.
Localisation of Staff
Young rapidly growing local populations, large non-national populations and state sectors unable to
provide enough quality jobs for citizens drive attempts to increase local citizens’ private sector role.
The programs, known as Saudiisation, Omanisation, Emiratisation and Qatarisation, direct a range
of industries to lift their employment of local citizens.12
For example, by the end of 1998, 60 per cent
of Oman’s transport and storage industry workforce was expected to be Omani, as was 35 per cent
of manufacturing, 30 per cent of the hotel industry and 20 per cent of the restaurant service workforce
(Economist Intelligence Unit, 1999a).
In the UAE, Emiratisation largely applies to banks, which must lift the average proportion of national
employees from 12 to 14 per cent in 2000, then to 25 to 40 per cent by 2006; and individual banks
must raise their Emirati workforces by 2 percentage points each year (Economist Intelligence Unit,
1999b; and Nangia, 2000).
12 Employment of nationals is a lesser issue in Bahrain.
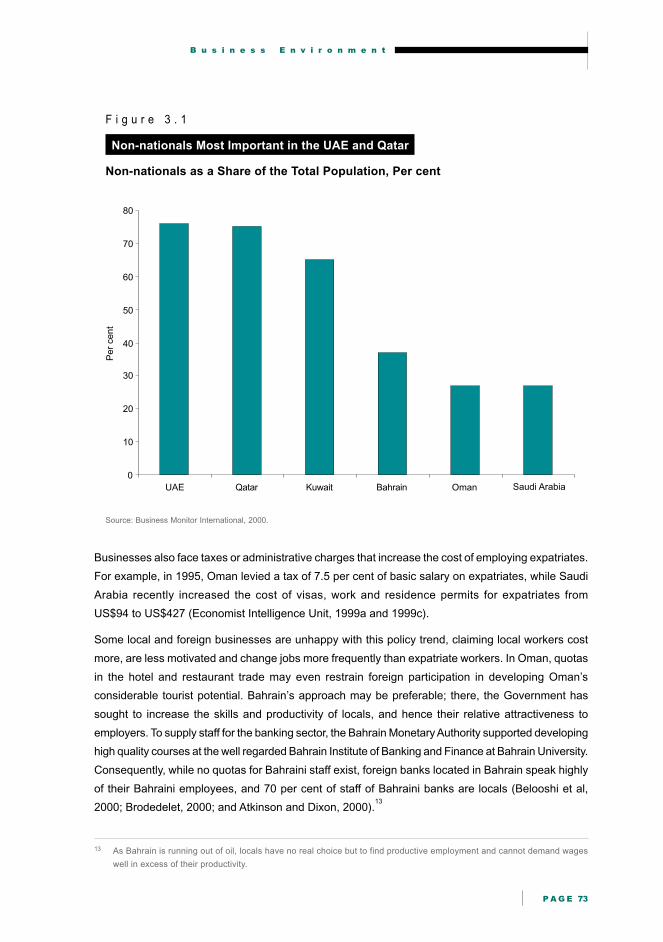
B u s i n e s s E n v i r o n m e n t
P A G E 73
F i g u r e 3 . 1
Non-nationals Most Important in the UAE and Qatar
Non-nationals as a Share of the Total Population, Per cent
Source: Business Monitor International, 2000.
Businesses also face taxes or administrative charges that increase the cost of employing expatriates.
For example, in 1995, Oman levied a tax of 7.5 per cent of basic salary on expatriates, while Saudi
Arabia recently increased the cost of visas, work and residence permits for expatriates from
US$94 to US$427 (Economist Intelligence Unit, 1999a and 1999c).
Some local and foreign businesses are unhappy with this policy trend, claiming local workers cost
more, are less motivated and change jobs more frequently than expatriate workers. In Oman, quotas
in the hotel and restaurant trade may even restrain foreign participation in developing Oman’s
considerable tourist potential. Bahrain’s approach may be preferable; there, the Government has
sought to increase the skills and productivity of locals, and hence their relative attractiveness to
employers. To supply staff for the banking sector, the Bahrain Monetary Authority supported developing
high quality courses at the well regarded Bahrain Institute of Banking and Finance at Bahrain University.
Consequently, while no quotas for Bahraini staff exist, foreign banks located in Bahrain speak highly
of their Bahraini employees, and 70 per cent of staff of Bahraini banks are locals (Belooshi et al,
2000; Brodedelet, 2000; and Atkinson and Dixon, 2000).13
13 As Bahrain is running out of oil, locals have no real choice but to find productive employment and cannot demand wages
well in excess of their productivity.
Per
cent
0
10
20
30
40
50
60
70
80
UAE Qatar Kuwait Bahrain Oman Saudi Arabia

A C C E S S I N G T H E M I D D L E E A S T
B U S I N E S S O P P O R T U N I T I E S I N T H E A R A B I A N P E N I N S U L A A N D I R A N
P A G E 74
Bureaucratic Culture
The Gulf region has a strong bureaucratic culture stemming from state led development and import
substitution industrialisation policies pursued between the 1950s and the 1980s. The strong
bureaucracy and formalised authority structures mean usually a small number of senior people make
decisions. Access to these decision makers can be difficult, but often is vital to obtain an agreement,
approval, or firm product order. Moreover, if businesses do not gain appropriate access, getting low
level decisions reviewed can be difficult. Often senior officials make consensus decisions, which can
slow down the decision making process.
The Greater Role of Chambers of Commerce
Chambers of commerce and industry in the Gulf states are more influential than in Australia, often
performing a function closer to a Department of Industry in western economies. Each emirate in the
UAE, as well as Bahrain, Kuwait and Qatar has its own chamber of commerce, while Saudi Arabia
has a national chamber and a series of subordinate regional chambers. Establishing a business in
the Gulf requires membership of the local chamber of commerce; this generates large revenue bases
for chambers. These chambers are large employers and have strong relationships with government,
which usually appoint chamber executives.14
Chambers of commerce also help resolve agency disputes
and oversee importing. For example, importers to Bahrain must belong to the Bahrain Chamber of
Commerce and Industry, and importers to Qatar must register with the Qatar Chamber of Commerce
(British Bank of the Middle East, 1997b; and Hong Kong Shanghai Banking Corporation, 2000).
The importance of Gulf chambers of commerce means business partners attach importance to
the Australia-Arab Chamber of Commerce and Industry; membership can be an important market
entry tool.
Labelling Requirements
The Gulf economies often require Arabic or Farsi labelling of food, medicine and personal care
products. Required information is less prescriptive than in Australia, and includes product description,
list of ingredients and the supplier’s name and address. Even without legal requirements, Arabic or
Farsi labelling and advertising is more effective than English only marketing.
Food and medical products also require an expiry date, equivalent to an Australian use by date, and
a production date. In Saudi Arabia and the UAE, government regulations specify expiry dates; whereas,
in Bahrain and Kuwait, manufacturers decide safe shelf lives for themselves (Giller, 2000).
Arab-Israeli Relations
Iran and all Arabian Peninsula economies, except Oman and Qatar, still boycott trade with Israel.
However, since 1994, GCC economies no longer enforce secondary and tertiary boycotts of third
parties dealing with or investing in Israel. Hence foreign firms now can maintain links with both Israel
14 Staff also frequently move between the chambers and government.

B u s i n e s s E n v i r o n m e n t
P A G E 75
and most Gulf economies. Nonetheless, travellers to the Gulf region should not use a passport
including Israeli entry or exit stamps.
Negotiation
Local Gulf businesses expect long negotiations, partly because they develop mutual confidence at a
personal level. Final decisions often come down to price, but discussions often focus on quality and
factors differentiating a product. Further, Middle Easterners frequently use diversions and strategic
behaviour to gain the upper hand. For example, to gain concessions, local negotiators may express
surprise at the price demanded or at a comment made. This should be politely refuted, taking care to
avoid loss of face, and not interpreted as a breakdown in discussions (Williams, 1998). Maintaining
a sense of humour and equanimity is important, although self deprecating humour may diminish the
status of the person using it.
Factors particularly important to negotiating successfully in the Gulf economies include:
• putting proposals to appropriate people with decision making powers, such as heads of sections,
vice presidents, and deputy chief executive officers
• being seen as a decision maker with a suitable title. A negotiator continually referring back to
head office for authority quickly loses credibility
• pitching the initial offer at the right level, allowing scope for bargaining down but not
seeming greedy.
Marketing
For many foreign businesses, commercial agencies remain an important marketing tool. Designing
effective advertising is challenging because of the region’s diverse populations. However, advertising
is increasingly important because of the growing importance of brand identity and capturing market share.
Advertising also must suit local standards. For example, catchy one word slogans are rare in Arabic
or Persian, and often cause misunderstandings. Material should be descriptive, ‘soft sell’, and even
‘flowery’ or dramatic. Highlighting how a product will help clients or save them money is more effective
than telling clients what ‘is best’ for them. Material that includes an attractive woman, especially a scantily
clad one, or an amorous couple, can be culturally insensitive, and is banned in Saudi Arabia and Iran.

A C C E S S I N G T H E M I D D L E E A S T
B U S I N E S S O P P O R T U N I T I E S I N T H E A R A B I A N P E N I N S U L A A N D I R A N
P A G E 76
VISAS
Obtaining visas is an important, and often time consuming administrative problem for foreign
business people travelling to the Gulf region. A guide to visa rules for Australians for each
country is:
• Bahrain – visas are available on arrival at Bahrain airport for stays under seven days;
such stays require an onward or return ticket. Longer stay visitors require a visa issued in
advance by an embassy abroad or arranged through a local sponsor
• Kuwait, Oman and Qatar – business travellers should arrange visas in advance through
an in-country sponsor; usually this is the company with which business is being conducted
or a top-end hotel. The sponsor deals directly with local authorities and is responsible for
the visitor during the stay
• the UAE – the UAE Embassy in Canberra issues visas, usually in a few days. Sponsors
also can arrange visas, with hotels again able to act as sponsors
• Iran – the Iranian Embassy in Canberra issues visas. Travellers need a cogent travel
purpose; ‘business’ usually is not a satisfactory explanation. Travellers also should have
a local contact or sponsor plus pre-arranged travel and accommodation bookings
• Saudi Arabia – business travel visas must be arranged in advance with a sponsor and the
Royal Embassy of Saudi Arabia in Canberra issues them after the Ministry of Foreign
Affairs in Saudi Arabia instructs them to do so. The sponsor is usually an actual or
prospective business partner. Austrade also may be able to assist first time visitors with
sponsorship arrangements. Business visa applicants with the requisite letter of sponsorship
from a Saudi individual or company normally receive visas in three days; however, to be
safe, allow two to three weeks for delays. For Australian citizens, normally domiciled in
Australia, visas cannot be obtained outside Australia
• Yemen – business travel visas must be arranged in advance with a sponsor, and a letter
from the traveller’s company must indicate the purpose of the visit. The Yemeni Consulate
General in Dubai or Yemeni Embassies in Abu Dhabi, Riyadh, Kuwait, Qatar, Bahrain,
Tehran or Muscat issue visas. Visas cannot be issued in Australia as Yemen maintains
non-resident diplomatic relations with Australia, conducted from the Yemeni Embassy in Tokyo.
Note: These regulations may change without warning, and only indicate visa conditions at the time this report was prepared.
Source: Department of Foreign Affairs and Trade, 2000; and Austrade, 2000.
B u s i n e s s E n v i r o n m e n t
P A G E 77
KEY ISSUES FOR AUSTRALIAN BUSINESS
Markets of the Gulf region present considerable opportunities for Australian companies willing to
invest time and money cultivating contacts and searching for niche areas of demand. Key guidelines
for doing business in the region include:
• studying the market, being aware of cultural and structural differences and carefully planning
market entry
• allowing time for business relationships and agreements to develop
• taking extreme care in selecting agents, distributors and joint venture partners, including thorough
due diligence to minimise the possibility of legal action which can be time consuming, expensive
and hard to win
• taking a medium term view (two to three years) to initial market entry, and a long term view to
servicing clients to maintain markets.

A C C E S S I N G T H E M I D D L E E A S T
B U S I N E S S O P P O R T U N I T I E S I N T H E A R A B I A N P E N I N S U L A A N D I R A N
P A G E 78
A p p e n d i x T a b l e 3 . 1
Gulf Business Regulations
Saudi Arabia
Corporate income tax Sliding scale of 20 to 30 per cent for foreign firms, depending
on the level of profit, although tax treatment favours lower
foreign equity stakes. Tax holidays from five to ten years, if
Saudi equity is greater than 25 per cent. Saudi and GCC firms
pay zakat (Islamic alms requirement) in lieu of corporate
income tax
Capital gains tax Aggregated and taxed as regular income
Withholding tax Applies to payments to non-residents, charged at corporate
income rates on deemed profit of 15 per cent of the
transaction’s value
Personal income tax Nil
Wholesale or point of sale tax Nil
Social security/payroll tax Employer pays 8 per cent levy and employee pays 5 per cent.
Both Saudi and foreign staff pay a 2 per cent hazard levy
Foreign exchange controls Nil
Labour supply With the shortage of skilled workers, guest workers are
common. Saudiisation of the workforce is a key priority, and
businesses employing foreign nationals must increase Saudi
employment by 5 per cent per year
Staff overtime/bonuses 48 hour week. Foreign employees invariably receive housing
allowance and annual employer funded home leave
Staff leave 15 day minimum; longer periods common
Staff dismissal Three month probationary period, severance payment of two
weeks’ pay for every year of service up to five years, one
month thereafter
Employee health cover 8 per cent employer levy, 5 per cent employee levy and 2 per
cent accident insurance payable by employee
Labour issues Unions not permitted and strikes banned
Accounting principles International standard
Foreign land ownership Not permitted, but under consideration
Banking services Small and sophisticated, with foreign banks well represented
via joint ventures

B u s i n e s s E n v i r o n m e n t
P A G E 79
The UAE
Corporate income tax Nil at federal level (except for oil, gas and banking sectors)
Capital gains tax Nil at federal level
Withholding tax Nil at federal level
Personal income tax Nil
Wholesale or point of sale tax Dubai municipality levies a 5 per cent tax on rent and leases
Import duties 0 to 5 per cent
Social security/payroll tax Nil. Mandatory public health care card costs a nominal fee
Foreign exchange controls Nil
Labour supply With the shortage of skilled workers, guest workers are
common. Visas usually, though not always, are available.
Emiratisation of the workforce is a key priority in service sectors
Staff overtime/bonuses Generally 48 hour week, with set overtime and bonus rates
subject to individual workplace agreements
Staff leave 30 working days per year
Staff dismissal Severance payments of 21 days pay for every year of service
up to five years, 30 days thereafter
Employee health cover Good quality, state provided care for nationals and residents.
Employers to supply any additional cover
Labour issues Unions not permitted and strikes unheard of
Accounting principles International standard
Foreign land ownership Not permitted but leasehold arrangements under consideration
Banking services Quite sophisticated, with foreign banks well represented. The
UAE is becoming a regional banking centre
Stock/financial markets Newly opened stock exchange in Dubai, soon to be extended
to Abu Dhabi

A C C E S S I N G T H E M I D D L E E A S T
B U S I N E S S O P P O R T U N I T I E S I N T H E A R A B I A N P E N I N S U L A A N D I R A N
P A G E 80
Iran
Corporate income tax Complex and as deemed by authorities; not based on
company records
Capital gains tax As for corporate income tax
Withholding tax Varies according to type of payment
Personal income tax Expatriates pay 50 per cent of deemed income
Wholesale or point of sale tax Nil
Social security/payroll tax Employers pay 23 per cent and employees pay 7 per cent
Foreign exchange controls Strict. Converting local currency to hard currency is complex
Labour supply Some shortages of local staff in high technology or other skilled
areas; otherwise good local labour supply and high
unemployment
Staff overtime/bonuses Yearly bonus of one month’s salary
Staff leave Three weeks per year
Staff dismissal Theoretically difficult; although foreign companies manage to
hire and dismiss staff, they must pay end of service indemnity
Employee health cover Provided by the state
Labour issues Unions and legally organised strikes permitted, although uncommon
Accounting principles Theoretically, international standards apply
Foreign land ownership Not permitted
Stock/financial markets Effectively closed to foreigners
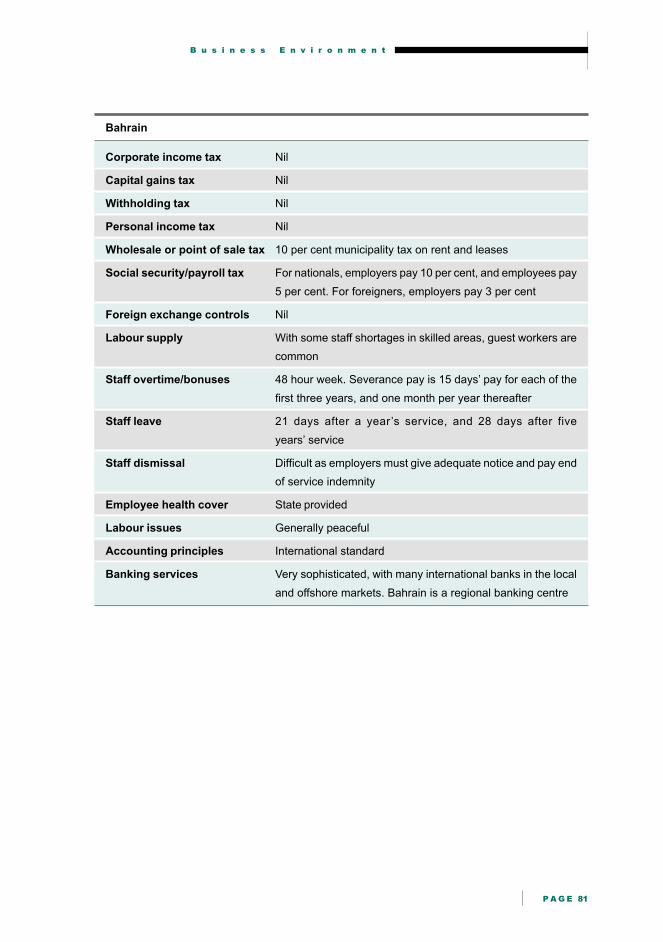
B u s i n e s s E n v i r o n m e n t
P A G E 81
Bahrain
Corporate income tax Nil
Capital gains tax Nil
Withholding tax Nil
Personal income tax Nil
Wholesale or point of sale tax 10 per cent municipality tax on rent and leases
Social security/payroll tax For nationals, employers pay 10 per cent, and employees pay
5 per cent. For foreigners, employers pay 3 per cent
Foreign exchange controls Nil
Labour supply With some staff shortages in skilled areas, guest workers are
common
Staff overtime/bonuses 48 hour week. Severance pay is 15 days’ pay for each of the
first three years, and one month per year thereafter
Staff leave 21 days after a year’s service, and 28 days after five
years’ service
Staff dismissal Difficult as employers must give adequate notice and pay end
of service indemnity
Employee health cover State provided
Labour issues Generally peaceful
Accounting principles International standard
Banking services Very sophisticated, with many international banks in the local
and offshore markets. Bahrain is a regional banking centre

A C C E S S I N G T H E M I D D L E E A S T
B U S I N E S S O P P O R T U N I T I E S I N T H E A R A B I A N P E N I N S U L A A N D I R A N
P A G E 82
Oman
Corporate income tax Omani firms pay 5 to 7.5 per cent depending on profits. Foreign
firms with Omani participation pay 15 to 25 per cent. If Omani
equity is less than 10 per cent, firms pay up to 50 per cent tax.
Oil exploration and production firms are treated separately
Capital gains tax Taxed as regular income
Withholding tax 10 per cent levy on firms without a permanent presence in Oman
Personal income tax Nil
Wholesale or point of sale tax Nil
Social security/payroll tax Employers pay 8 per cent, employees pay 5 per cent and
government pays 3 per cent
Foreign exchange controls Nil. Public or limited liability companies must contribute 10 per
cent of profits to a statutory reserve, similar to a withholding tax
Labour supply With some shortage of skilled workers, guest workers
are common
Staff overtime/bonuses 45 hour week. Severance pay of 15 days for first three years,
one month for each subsequent year
Staff leave Three to four weeks per year
Staff dismissal Difficult to dismiss nationals, and strict severance pay
requirements exist
Employee health cover Employer pays 1 per cent levy
Labour issues Disputes effectively unheard of
Accounting principles International standard
Foreign land ownership Not permitted
Banking services Small and sophisticated, with foreign banks well represented

B u s i n e s s E n v i r o n m e n t
P A G E 83
Kuwait
Corporate income tax Kuwaiti and GCC firms pay no tax. Foreign firms pay from 5 to
55 per cent tax, depending on profit levels
Capital gains tax Nil
Withholding tax Nil
Personal income tax Nil
Wholesale or point of sale tax Nil
Social security/payroll tax Payable for Kuwaiti employees
Foreign exchange controls Nil. Public or limited liability companies must contribute 10 per
cent of profits to a statutory reserve
Labour supply With a significant shortage of skilled workers, guest workers
are common
Staff overtime/bonuses Most companies pay annual bonuses, and overtime ranges
from 25 to 200 per cent of basic salary
Staff leave 14 days for the first year of service; 21 days after five
years’ service
Staff dismissal Must give one month’s notice with reasonable cause. No
severance pay requirements
Employee health cover Provided by the state
Labour issues Unions are legal; membership is optional
Accounting principles International standard
Foreign land ownership Not permitted
Banking services Relatively sophisticated, with many foreign banks operating

A C C E S S I N G T H E M I D D L E E A S T
B U S I N E S S O P P O R T U N I T I E S I N T H E A R A B I A N P E N I N S U L A A N D I R A N
P A G E 84
Qatar
Corporate income tax Foreign company profits and dividends are taxed at 10 to 35 per
cent. Tax exemptions are available for significant national
development projects, or those involving considerable
technology transfer
Capital gains tax Aggregated and taxed as regular income
Withholding tax Final payments are withheld, but offshore payments
are exempt
Personal income tax Nil
Wholesale or point of sale tax Nil
Foreign exchange controls Nil
Labour supply With some shortage of skilled workers, guest workers
are common
Staff overtime/bonuses 48 hour week. Severance pay is 15 days’ pay for the first three
years, one month for each subsequent year
Staff leave Two weeks per year for up to five years’ service, four
weeks thereafter
Staff dismissal One month’s notice for up to five years’ service, four
weeks thereafter
Labour issues Formal arbitration mechanisms exist; strikes are permitted but
are uncommon
Accounting principles International standard. Accrual
Foreign land ownership Not permitted
Banking services Small and sophisticated, with foreign banks well represented
Source: Most of the information contained in the above tables came from Ernst and Young’s Middle East website, www.eyme.com/section/
doing_business/index.htm, accessed on January 14,15 and 16, 2000; additional information was provided by Austrade following
interviews with Senior Trade Commissioners in the Gulf region in January 2000.

B u s i n e s s E n v i r o n m e n t
P A G E 85
REFERENCES
Atkinson, S. and Dixon, J., 2000, East Asia Analytical Unit interview with Director and Manager
Global Project Finance, ANZ Investment Bank Bahrain, May.
Austrade, 2000, ‘Report to the East Asia Analytical Unit on the Gulf Business Environment’, February.
AWB Limited, Information supplied to the East Asia Analytical Unit, July.
Bakhtari, H., 1995, ‘Cultural Effects on Management Style: a Comparative Study of American and
Middle Eastern Management Styles’, International Studies of Management and Organisation,
Vol. 25, No. 3, pp. 97-118.
Belooshi, N., Rahman Saif, and Field, J., 2000, East Asia Analytical Unit interview with Executive
Director Management Services, Director of Economic Research and Adviser, Banking and
Finance, Bahrain Monetary Agency, Bahrain, May.
British Bank of the Middle East, 1997a, ‘Sultanate of Oman’, British Bank of the Middle East, Business
Profile Series, eighth edition, Hong Kong and Shanghai Banking Corporation, Hong Kong.
___ 1997b, ‘Bahrain’, British Bank of the Middle East, Business Profile Series, eighth edition, Hong
Kong and Shanghai Banking Corporation, Hong Kong.
Brodedelet, R., 2000, East Asia Analytical Unit interview with Country Manager, ABM Amro Bank,
Bahrain, May.
Business Monitor International, 2000, ‘Kuwaitis First’, Middle East Monitor - The Gulf, June, p. 10.
Deacon, P., 2000, Information supplied to the East Asia Analytical Unit by Executive Director, Victorian
Government Business Office, Dubai, May-July.
Department of Foreign Affairs and Trade, unpublished visa information, Canberra.
Economist Intelligence Unit, 1999a, Oman 1999-2000 Country Profile, EIU, London.
___ 1999b, United Arab Emirates 1999-2000 Country Profile, EIU, London.
___ 1999c, Saudi Arabia 1999-2000 Country Profile, EIU, London.
Elton, P, 1999, East Asia Analytical Unit interview with General Manager, Raywood Communications,
Melbourne, June.
Ernst and Young, 2000, Doing Business, www.eyme.com/section/doing_business/index.htm, accessed
on 14,15 and 16 January 2000.
Export Finance and Insurance Corporation, 2000, Schedule of Short Term Market Grades,
www.efic.gov.au/markets/index.html, accessed on 30 May 2000.
Fisher, S. and Fisher, D., 1998, Export Best Practice: Commercial and Legal Aspects, Federation
Press, Sydney.

A C C E S S I N G T H E M I D D L E E A S T
B U S I N E S S O P P O R T U N I T I E S I N T H E A R A B I A N P E N I N S U L A A N D I R A N
P A G E 86
Ghassan, Z., 2000, ‘Social Customs in the Arab World’, information provided by Manager, Middle
East Region, Austrade, Canberra, available at www.dfat.gov.au/eaau/gulf.
Giller, S., 2000, East Asia Analytical Unit interview with President, Austanz, Melbourne, May-June.
Gulf Business, 2000, ‘Expat Utility Charges Rise’, Gulf Business, Vol. 4, No. 10, February,
www.gulfbusiness.com/cgi-local/, accessed on 9 July 2000.
Gulf Cooperation Council, 1999, Economic Bulletin, Vol. 14.
Harmsworth, B., 2000, Information provided to the East Asia Analytical Unit by Manager, Al Mutaiwie
Trading, Dubai, June.
Hashem, W., 2000, East Asia Analytical Unit interview with Executive Director, Talal Abu-Ghazaleh,
Certified Public Accountants and Management Consultants, Abu Dhabi, May.
Hong Kong Shanghai Banking Corporation, 2000, ‘Qatar’, Hong Kong Shanghai Bank, Business
Profile Series, tenth edition, Hong Kong and Shanghai Banking Corporation, Hong Kong.
Jeffreys, A. (ed.), 2000, Emerging Emirates 2000, Oxford Business Group, London.
McLaren, C., 2000, East Asia Analytical Unit interview with Managing Director, Johnson and Johnson
Medical Middle East, Dubai, May 2000.
Moody’s Investor Service, ‘Ratings and Ratings Actions’, www.moodys.com/ratings/
ratuse.htm#longterm, accessed on 10 July 2000.
Moore, D., 2000, Information provided by Chairman of the Victorian Chapter of the Arab Australia
Chamber of Commerce and Director, Independent Corporate Solutions, Melbourne, August.
Nangia, A., 2000, East Asia Analytical Unit interview with Regional General Manager, ANZ Grindlays
Bank, Dubai, May.
US Department of State, 2000, ‘FY2000 Country Commercial Guide’, prepared by US Embassy Abu
Dhabi, released by Bureau of Economic and Business Affairs, US Department of State at
www.state.gov/www/about_state/business/com_guides/index.html, accessed on 21 June 2000.
Wilkinson, S., 1998, ‘Small Business, Big Decisions’, Gulf Business, Vol. 3, No. 8, December,
www.gulfbusiness.com.cgi-local/, accessed on 9 July 2000.
Williams, J., 1998, Don’t They Know It’s Friday? Cross Cultural Considerations for Business and Life
in the Gulf, Motivate Publishing, London.
World Bank, 1999, Entering the 21st Century: World Development Report 1999/2000, World Bank,
Washington DC.

C h a p t e r 4
P A G E 87
FOREIGN INVESTMENT
KEY POINTS
• Huge surpluses generated from oil revenue and restrictive foreign
direct investment, FDI, regimes mean FDI has been a less significant
capital source for the Gulf economies than for East Asia.
• Progress in liberalising FDI restrictions is slow, but Qatar, Oman and
recently, Saudi Arabia, lead reform. Important constraints on FDI
across the Gulf region include restrictions on full foreign ownership
outside the free trade zones, prohibitions on investing in many sectors
(particularly oil), restrictions on both domestic and foreign
competition in key infrastructure, energy and manufacturing sectors,
and imprecise and inconsistently applied regulatory frameworks.
• However, opportunities for large scale foreign involvement are greater
in the region’s huge emerging gas industry than in oil, although some
Gulf economies with smaller, less profitable oil resources are keen
to attract more foreign investment.
• Infrastructure needs in the Gulf economies are massive. The greatest
foreign participation opportunities are in pipeline construction,
electricity and water. Dominant state owned monopolies constrain
opportunities in the telecommunications sector, although World Trade
Organization, WTO, driven liberalisation is yielding significant market
opening in Oman.
• Key triggers to improve the foreign investment environment include
further reforming regulations governing FDI in Saudi Arabia (the
Arabian Peninsula’s dominant economy), increasing regional
economic integration and lifting US sanctions on Iran.

A C C E S S I N G T H E M I D D L E E A S T
B U S I N E S S O P P O R T U N I T I E S I N T H E A R A B I A N P E N I N S U L A A N D I R A N
P A G E 88
Since the first oil shock, foreign direct investment, FDI, has been a relatively minor capital source for
Gulf economies. Most foreign participation has involved building productive facilities and providing
services under contract, rather than through FDI. However, rapid population growth, burgeoning
infrastructure requirements, diversification of economic activity away from oil, growing fiscal pressures
and the desire to access new technologies are driving many regional governments to more actively
seek FDI.
This chapter examines regional FDI policies, developments in FDI liberalisation, trends in key sectors
receiving FDI, emerging FDI opportunities and major influences on the FDI outlook.
REGIONAL FDI POLICIES
Compared to East Asia, Gulf economies are relatively closed to FDI. Key features of Gulf FDI
regimes include:
• the difficulty of having effective full foreign ownership outside free trade zones
• the requirement for majority local equity in many types of business, including distribution
• prohibition on FDI in the upstream oil sector (in Saudi Arabia and Kuwait), inability of new oil
companies to enter the oil industry (in the UAE) or severe restrictions on foreign company
involvement in the oil sector (Iran)
• imprecise and inconsistently applied regulatory frameworks.
Oman, Qatar and Saudi Arabia are progressing most towards liberalisation (Table 4.1). Furthermore,
the need for rapid economic growth, the desire to diversify economic activity, growing fiscal pressures
and burgeoning infrastructure requirements are likely to drive further opening of FDI regimes in the
short to medium term. (See Chapter 1 - Economic Prospects.) Moreover, in April 2000, the Saudi
Government announced measures to make full foreign ownership easier. Effectively implementing
these reforms, including clearly indicating where FDI remains prohibited, should encourage more
rapid reform in smaller Arabian Peninsula economies, particularly the UAE.

F o r e i g n I n v e s t m e n t
P A G E 89
T a b l e 4 . 1
Full Foreign Ownership Remains Elusive
Regional FDI Regimes
Economy Key FDI Regulations
UAE Representative offices, branch offices for export marketing and establishments
in free trade zones can be 100 per cent foreign owned. Other firms must have
a majority local partner, although the local partner need not be active, and profits
need not be divided on the basis of formal ownership percentages. Foreign
investment is prohibited in real estate, trading companies, agency companies,
many service sectors and quasi state monopolies such as the
telecommunications company, Etisalat. The UAE has the region’s strongest
intellectual property protection, and offered foreign investors minority shares in
two build, operate, transfer projects in the electricity industry.
Saudi Arabia Commercial agencies must be Saudi owned and the upstream oil sector is off
limits to foreign companies.
In January 1999, Saudi Arabia created the Supreme Petroleum and Mineral
Affairs Council, separate from the Saudi Arabian Oil Company, ARAMCO, to
direct post-production energy policy. In 2000, the Government established a
new investment regulatory body, the General Investment Authority. Subject to
all appropriate documents being lodged, it will process applications within 30 days.
Until April 2000, foreign equity in the industrial sector was limited to 49 per cent.
While in principle full foreign ownership was allowed in other sectors (except
oil), wholly foreign owned firms could not bid for government contracts or access
cheap credit or tax concessions. Proposals approved by the Council of Ministers
in April 2000 allow foreign investors to wholly own projects and industrial property.
These proposals also allow wholly owned foreign companies to access tax
holidays and concessional finance in other sectors, making full foreign ownership
more feasible.1
However, to access government contracts, firms still need to be at least 50 per
cent locally owned. Moreover, FDI remains constrained by a lack of detail on
exactly which sectors are barred from foreign investment and by a lack of detailed
implementing regulations. With revised corporate tax rates, the top marginal
tax rate for foreign firms of 45 per cent of net profit has fallen to 30 per cent.
1 The previous regulations required at least 25 per cent Saudi ownership to qualify for favourable loans from the Saudi
Industrial Development Fund and five year tax holidays (ten years in agricultural or manufacturing sectors).

A C C E S S I N G T H E M I D D L E E A S T
B U S I N E S S O P P O R T U N I T I E S I N T H E A R A B I A N P E N I N S U L A A N D I R A N
P A G E 90
T a b l e 4 . 1 c o n t i n u e d
Full Foreign Ownership Remains Elusive
Regional FDI Regimes
Economy Key FDI Regulations
Iran In principle, FDI is allowed, subject to 51 per cent local ownership. However, in
practice, approved FDI is negligible. Opportunities largely are limited to service
contracts and buy-back arrangements.
Kuwait Foreign firms are limited to 49 per cent ownership, unless they are legally
registered as a local limited liability company. As in Saudi Arabia, foreign
companies cannot invest in the upstream oil sector.
Bahrain Full foreign ownership is permitted particularly among firms operating exclusively
offshore, such as offshore banks, and for insurance, engineering, construction,
trading and financial companies, and among industrial or service companies
using Bahrain as a regional distribution centre. In all other cases, firms must be
51 per cent locally owned.
Qatar In early 2000, Qatar increased allowable foreign ownership from 49 to 100 per
cent in agriculture, industry, energy, tourism, natural resources and mining,
provided projects are consistent with national development priorities.
Oman Oman allows 70 per cent foreign ownership of most economic activities, subject
to government approval. It also treats domestic and foreign firms equally for
tax purposes.
Yemen Full foreign ownership is permitted, except in the petroleum industry, where
production sharing agreements and state participation limit foreign equity to
49 per cent.
Source: Business Monitor International, 2000a and 2000b; Fawzi Al-Khatib and Malki, 2000; Economist Intelligence Unit, 1999a; and British
Bank of the Middle East, 1997a and 1997b.

F o r e i g n I n v e s t m e n t
P A G E 91
REGIONAL FDI LEVELS
FDI is not a major capital source for most Gulf economies, although at various times, some smaller
economies found it important (Figure 4.1). Relatively low FDI inflows primarily reflect policies prohibiting
foreign investment in the oil sector and curtailing full foreign ownership of the most productive projects
and land, as well as uncertainty about domestic legal and regulatory frameworks.
Saudi Arabia has the highest actual annual FDI inflows, averaging around US$600 million per year
between 1993 and 1998, followed by the UAE and Iran (Figure 4.2). It is in these economies FDI
inflows have increased most compared to between 1987 and 1992 (Figure 4.2).
F i g u r e 4 . 1
FDI Lower in Gulf Region than East Asia
FDI as a Percentage of Gross Fixed Capital Formation, 1987-92 and 1993-97,
Annual Averages
Note: Data for Iran also includes buy-backs expenditure, which is not FDI as it does not involve taking an equity share.
Source: United Nations Committee for Trade and Development, 1999.
Pe
r ce
nt
-5
0
5
10
15
20
25
30
35
Singapore Yemen Malaysia Bahrain Oman Thailand Indonesia Qatar UAE Kuwait Iran SaudiArabia
1987-92
1993-97

A C C E S S I N G T H E M I D D L E E A S T
B U S I N E S S O P P O R T U N I T I E S I N T H E A R A B I A N P E N I N S U L A A N D I R A N
P A G E 92
F i g u r e 4 . 2
FDI Levels Are Low
FDI in Gulf Economies, 1987-92 and 1993-98, Annual Average
Note: Data for Iran include buy-backs expenditure, which is not FDI as it does not involve taking an equity share.
Source: United Nations Committee for Trade and Development, 1999.
FDI DRIVERS IN INDIVIDUAL GULF ECONOMIES
Overall, continued FDI restrictions mean joint ventures and free trade zone investments dominate
FDI in Gulf economies. However, the need to upgrade and install infrastructure across the oil, gas,
pipelines, electricity, water and telecommunications sectors is driving FDI reform and expanding
opportunities for foreign capital.
Saudi Arabia
Virtually all FDI flows into Saudi Arabia are joint ventures; by value, most are petrochemical projects
(Figure 4.3).2 Outside the petrochemical sector, smaller projects supply either the local market or
niche export markets. Offset arrangements, whereby defence suppliers must invest a share of project
funds in non-defence sectors are important, but this importance should decline as the Government
seeks to ensure offset projects are profitable.
2 These petrochemical joint ventures are mostly with the Saudi Arabian Basic Industries Corporation.
US
$ m
illio
n
-200
-100
0
100
200
300
400
500
600
700
SaudiArabia
UAE Iran Yemen Qatar Oman Kuwait Bahrain
1987-92
1993-98
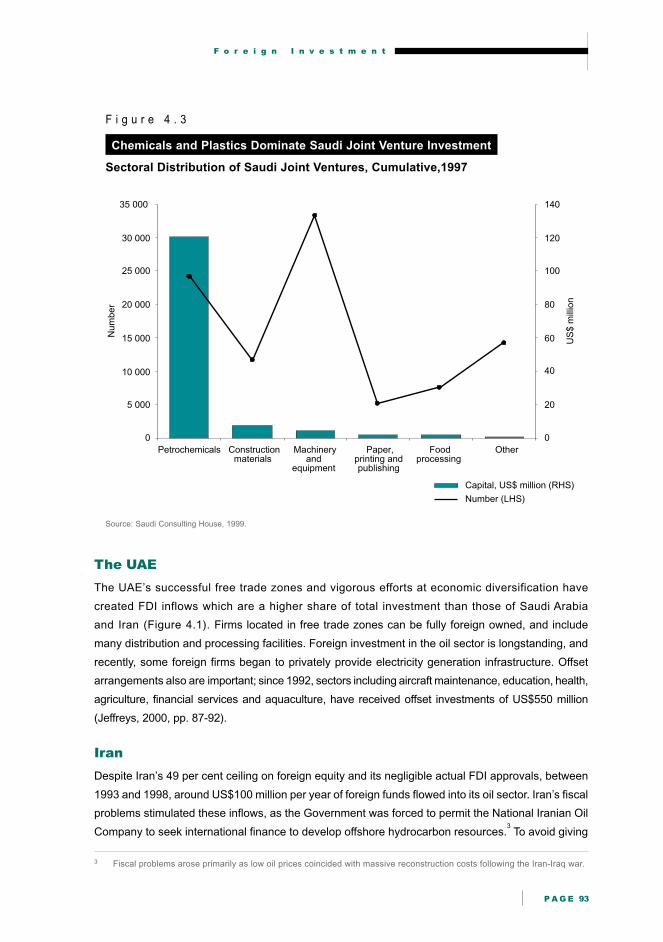
F o r e i g n I n v e s t m e n t
P A G E 93
Nu
mb
er
US
$ m
illio
n
5 000
10 000
15 000
20 000
25 000
30 000
35 000
Petrochemicals Constructionmaterials
Machineryand
equipment
Paper,printing andpublishing
Foodprocessing
Other
20
40
60
80
100
120
140
0 0
Capital, US$ million (RHS)
Number (LHS)
F i g u r e 4 . 3
Chemicals and Plastics Dominate Saudi Joint Venture Investment
Sectoral Distribution of Saudi Joint Ventures, Cumulative,1997
Source: Saudi Consulting House, 1999.
The UAE
The UAE’s successful free trade zones and vigorous efforts at economic diversification have
created FDI inflows which are a higher share of total investment than those of Saudi Arabia
and Iran (Figure 4.1). Firms located in free trade zones can be fully foreign owned, and include
many distribution and processing facilities. Foreign investment in the oil sector is longstanding, and
recently, some foreign firms began to privately provide electricity generation infrastructure. Offset
arrangements also are important; since 1992, sectors including aircraft maintenance, education, health,
agriculture, financial services and aquaculture, have received offset investments of US$550 million
(Jeffreys, 2000, pp. 87-92).
Iran
Despite Iran’s 49 per cent ceiling on foreign equity and its negligible actual FDI approvals, between
1993 and 1998, around US$100 million per year of foreign funds flowed into its oil sector. Iran’s fiscal
problems stimulated these inflows, as the Government was forced to permit the National Iranian Oil
Company to seek international finance to develop offshore hydrocarbon resources.3 To avoid giving
3 Fiscal problems arose primarily as low oil prices coincided with massive reconstruction costs following the Iran-Iraq war.

A C C E S S I N G T H E M I D D L E E A S T
B U S I N E S S O P P O R T U N I T I E S I N T H E A R A B I A N P E N I N S U L A A N D I R A N
P A G E 94
4 Until the 1970s, the major international oil companies dominated oil production in most regional economies. In Iran, Saudi
Arabia and Kuwait, total nationalisation occurred. In Bahrain, the UAE and Qatar partial nationalisation occurred.
foreign firms equity, petroleum projects are tendered on a buy-back basis, with foreign partners
arranging finance and construction, and being repaid in dollar denominated crude oil deliveries once
the project commences operation (Economist Intelligence Unit, 1999d). Total, Shell and Petronas
(Malaysia) already participate in these buy-back agreements. In November 1999, Royal Dutch
Shell Group signed buy-back contracts for the Soroush and Nowruz oil fields, which will cost
around US$800 million to develop (Royal Dutch/Shell Group of Companies, 2000; and Tehran
Times, 15 November 1999).
Other Gulf Economies
In most other Gulf economies, individual projects dominate FDI trends. Major FDI events include
Kuwait’s post war reconstruction (now largely completed), Qatar’s development of the large North
gas field, Oman’s liquefied natural gas, LNG, development and production and development of power,
telecommunications and pipelines infrastructure, and Yemen’s World Bank assisted structural
adjustment privatisation program.
SECTORAL FDI OPPORTUNITIES
The oil and gas sectors dominate most regional economies, and attract most FDI interest, both from
major international oil companies and smaller energy companies and contractors. In several Gulf
economies, new opportunities also are opening up in the mining, infrastructure, financial,
manufacturing, distribution and service sectors. (See also Chapter 2 - Australian Opportunities.)
OIL SECTOR INVESTMENT
Despite 1970s oil facility nationalisations in Iran, Saudi Arabia, Bahrain, the UAE, Kuwait and
Qatar,4 Gulf economy markets remain extremely attractive for international oil companies due to their
low production costs, massive reserves, and the opportunity to increase exploration and often,
production efficiency.
Upstream Opportunities
Opportunities to participate in upstream oil sector drilling and production remain extremely limited in
the key oil producers, Saudi Arabia, Kuwait, Iran and Abu Dhabi, UAE. In particular:
• Saudi Arabia does not allow foreign participation; the state owned oil company, ARAMCO, retains
exclusive rights over oil exploration, drilling and production
• Kuwait bans foreign companies from owning natural resources, although the Government currently
seeks to implement a policy permitting international oil companies to develop the Northern oil
fields on a 20 year contract

F o r e i g n I n v e s t m e n t
P A G E 95
• Iran only allows participation in oil field development on a buy-back basis
• In Abu Dhabi, major international oil companies including British Petroleum, Shell, Mobil, Total
and Exxon have minority shares in three state controlled oil and gas companies, with other
international companies locked out of production.5
The region’s smaller oil producers offer more diverse foreign investment opportunities in the upstream
oil sector. For example, Petroleum Development Oman, the largest producer in Oman, which has
small, geologically complex fields, is 40 per cent foreign owned, with the remaining share state
owned.6 Furthermore, in 1997, Occidental Petroleum of the United States, Novus Petroleum of Australia
and Japex of Japan produced 21 million barrels of crude, or 6.3 per cent of total production (Economist
Intelligence Unit, 1999a).
Terms for foreign companies in the Yemeni oil sector, with its relatively small reserves by Gulf standards,
improved dramatically in the late 1990s. For new fields, companies now can claim 50 to 70 per cent
of oil earnings to recover development costs, compared to 25 to 45 per cent previously (Economist
Intelligence Unit, 1999b).7
Downstream Opportunities
In the downstream oil sector, opportunities largely are confined to contractual work and financing
assistance for state owned oil companies. For example, Kuwait is calling for bids from eight international
oil companies to construct an oil pier at the country’s largest refinery. Oman is receiving bids to
construct a refinery at Sohar, and Iran has expanded its buy-back program to refinery development.8
Financing major oil sector developments also provides many opportunities; for example, Citibank is
financial adviser for the US$800 million expansion and refurbishment of the state owned Bahrain
Petroleum Company’s Sitra refinery and is arranging a syndicated loan to cover 75 per cent of project
costs (Economist Intelligence Unit, 2000a).
However, over time, joint venture opportunities are likely to increase as expansion of the refining
sector accelerates, and as emphasis on producing higher value products increases. One promising
development was the September 1998 Saudi invitation to 18 major foreign oil and energy companies
to submit investment proposals in Saudi Arabia’s downstream oil sector and upstream and downstream
gas sectors; the gas sector is emerging as a main area of focus.
5 These companies are the Abu Dhabi Company for Onshore Oil Operations, ADCO; the Abu Dhabi Marine Operating
Company, ADMA-OPCO; and the Zakum Development Company. The Abu Dhabi National Oil Company, ADNOC is
wholly state owned.
6 Foreign companies holding the 40 per cent share are Royal Dutch Shell, Total and Partex (Economist Intelligence Unit, 1999a).
7 In 1999, Yemen’s proven recoverable oil reserves were around 1.7 billion barrels compared to 261.5 billion in Saudi Arabia
and 96.5 billion in Kuwait.
8 However, the project to reconstruct Iran’s largest refinery at Abadan (bombed in the Iran-Iraq war) has attracted little
investor interest to date.
A C C E S S I N G T H E M I D D L E E A S T
B U S I N E S S O P P O R T U N I T I E S I N T H E A R A B I A N P E N I N S U L A A N D I R A N
P A G E 96
AUSTRALIAN RESOURCE COMPANIES ACTIVE IN THE GULF REGION
BHP Petroleum
BHP Petroleum, BHPP, has been involved in the Iranian oil and gas sector since 1994, and
has undertaken several feasibility studies regarding establishing long term strategic
partnerships with the National Iranian Oil Company and the National Iranian Gas Company.
BHP opened a representative office in Tehran in 1999. Projects BHPP is considering include
a gas pipeline between Iran and Pakistan, construction of LNG export facilities, and buy-back
oil production projects. BHPP also is participating in an Iranian gas resource assessment
study, and is committed to assisting Iran develop its world class petroleum resources.
Novus Petroleum
Novus Petroleum, an Australian based and owned oil and gas exploration and development
company, uses its regional office in Dubai to target smaller oil and gas resources in the
Middle East and South Asia which do not attract major oil company attention, but which are
viable given current technology. It operates a small gas field off Oman, producing 3 000 barrels
of gas and condensate per day to supply the northern UAE. It also is negotiating to develop a
potentially larger field straddling the border between Oman and Iran, and is exploring an area
off Qatar where it has a 25 per cent interest.
Source: BHP Petroleum, 2000; and Novus Petroleum, 2000.
GAS
Gulf governments are according increasing priority to developing the region’s significant gas resources.
(See Chapter 1 - Economic Prospects.) Here, prospects for large scale foreign involvement are
brighter than in the oil sector for three key reasons:
• large scale, commercial gas production has only accelerated over the last decade, so in-country
vested interests and state owned oil company expertise is weaker
• gas marketing, transport and processing challenges are all greater than for oil
• LNG processing facilities and gas pipelines are very expensive, providing an incentive for
governments to seek foreign investors.
Already, foreign capital is helping to expand gas production in Qatar, Saudi Arabia and Oman.
Qatar
Two joint ventures underpin the rapid expansion of Qatar’s large North gas field; one is between the
Qatar General Petroleum Corporation and Total, Mobil, Mitsui and Marubeni, and the other is between
Qatar General Petroleum Corporation and Mobil, the Korean Gas Corporation, Itochu and Nissho
Iwai (Economist Intelligence Unit, 1999c). In addition, in early 2000, Elf and Enron became major
partners on the Dolphin project, a proposed US$8 billion to $10 billion pipeline and industrial

F o r e i g n I n v e s t m e n t
P A G E 97
DOLPHIN: A GIANT PROJECT
The Dolphin project proposal involves building a pipeline from Qatar’s giant North field
to Abu Dhabi, Dubai and Oman. The project aims to supply gas to meet projected
shortages in these economies to generate electricity and fuel industries such as
aluminium, steel and petrochemicals in new industrial zones. The project’s projected cost
to 2007 is between US$8 billion and $10 billion.
By mid 2000, this ambitious project was progressing well. The project’s coordinators, UAE
Offsets Group, have in principle support from the governments of Qatar, Abu Dhabi, Dubai,
Oman and Pakistan.9 UAE Offset Group also has secured contracts from several potential
end users, and announced Elf and Enron as the project’s major upstream and downstream
developers. These developers are expected to create partnerships to invest in production,
storage, distribution and generation facilities.
The major risk facing the project is possible failure to gain effective cross-border transport
arrangements; in the past, this has proved difficult in the Gulf.
Source: Fawzy, 2000.
development project to transport and use Oman’s North field gas. If it proceeds, the project will generate
immense subcontracting opportunities, although its size and profile mean success will depend on
high level lobbying and the ability to break into the consortiums bidding for large project blocks.
Saudi Arabia
Saudi ARAMCO’s exclusive right to explore, drill for and produce gas was lifted in February 1999
and, following a September 1998 request from the Crown Prince, many foreign companies have
submitted proposals for upstream and downstream gas development investments. Among the most
attractive proposals are integrated ‘wells to wires’ projects which use gas from non-oil bearing fields
to produce electricity (Miles, 2000).10
Oman
The Omani Government actively encourages private gas exploration outside the three existing non-
associated gas fields Petroleum Development Oman and its foreign partners are developing. The
most notable development is the early 1999 signing of a gas exploration deal between the Omani
Government and Occidental Petroleum (United States), BP Amoco (United States and UK) and Fortum
Oyj (Finland) to explore and develop several prospective areas for gas reserves. The accord provides
for expenditure of US$25 million and production of seismic data for an area of at least 1 700 square
9 In July 1999, UAE Offsets Group, the Pakistani Minister of Petroleum and the Privatisation Commission of Pakistan signed
long term supply contracts, contingent on the pipeline being extended to Pakistan, a medium term project goal.
10 Production of gas from non-oil bearing fields or ‘non-associated gas’ is attractive for electrical production as OPEC oil
quotas do not affect it.

A C C E S S I N G T H E M I D D L E E A S T
B U S I N E S S O P P O R T U N I T I E S I N T H E A R A B I A N P E N I N S U L A A N D I R A N
P A G E 98
kilometres; any gas produced would supply the Sohar and UAE markets (Economist Intelligence
Unit, 1999a). Downstream projects include a liquefaction facility being developed by Oman LNG and
a range of foreign partners, with output sourced to Japan, the Republic of Korea and India.11
MINING
Of all the Gulf economies, Saudi Arabia and Iran have the largest mineral deposits. If foreign investor
access improves, weaker nationalist sentiment than in the oil sector may open up opportunities for
foreign companies.12
Foreign involvement in the Saudi mining sector is negligible, although the mining
code is under review (Miles, 2000). In Iran, some foreign companies are obtaining buy-back mining
projects or contract work. For example, the Iran National Copper Industries Company, NICSICO,
which operates Sar Cheshmeh, one of the world’s largest copper deposits, engaged BHP Engineering
in 1997 and 1998 to construct a smelter. 13
A Canadian firm has started gold mine operations in Iran’s
West Azerbaijan province, with other Canadian firms negotiating to develop zinc and gold deposits
(Economist Intelligence Unit, 1999e).
INFRASTRUCTURE
Gulf governments recognise improved infrastructure is critical for the region’s long term economic
prospects and increasingly, they are considering private participation. (See Chapter 1 - Economic
Prospects.) Key areas of need include electricity and water production and distribution,
telecommunications and transport infrastructure. The need for fiscal stringency (regional governments
have run budget deficits throughout the 1990s) and the inability of regional governments to fund
infrastructure provision from oil revenue drive opportunities for private sector involvement. Unless oil
prices remain above US$25 per barrel, only Kuwait can fund new electricity infrastructure from
budgetary revenue alone (Atkinson, 2000).
Electricity
Analysts put the cost of new electricity infrastructure between 2000 and 2006 in Saudi Arabia, Iran,
the UAE, Kuwait, Qatar and Oman at US$40 billion, with Saudi Arabia accounting for around
US$20 billion and Iran requiring around US$8 billion (Figure 4.4). Beyond 2006, needs will increase
further. For example, by 2020, Saudi Arabia’s generating capacity may need to triple from
2000 levels to 70 000 MW (Business Monitor International, 2000c).
11 The Government of Oman holds a 51 per cent share in Oman LNG. Royal Dutch Shell is the largest foreign partner with
a 30 per cent share. Other partners include Korea LNG, Partex of Portugal and Mitsubishi, Mitsui and Itochu of Japan
(Business Monitor International, May 2000).
12 Saudi Arabia has substantial deposits of gold, iron ore, copper, phosphates, silver, uranium, bauxite, coal, tungsten, lead
and zinc (Economist Intelligence Unit, 1999d). Major Iranian mineral deposits include copper, aluminium, lead, manganese
and zinc, with copper production largest (101 000 tonnes in 1998) followed by zinc (76 500 tonnes) and aluminium
(62 500 tonnes) (Economist Intelligence Unit, 1999e).
13 BHP Engineering was sold in December 1999 to the Hatch Group of Canada.

F o r e i g n I n v e s t m e n t
P A G E 99
US
$ b
illio
n
0
5 000
10 000
15 000
20 000
25 000
30 000
35 000
40 000
45 000
50 000
Iran Saudi Arabia UAE Kuwait Qatar Oman0
50
100
150
200
250
Additional capacity by 2006 (MW)
Installed generating capacity (MW)
Projected cost (US$ billion) (RHS)
F i g u r e 4 . 4
Electricity Infrastructure Requirements to Surge
Installed and Required Generating Capacity (MW) and Projected Cost
Source: Business Monitor International, 2000d.
Oman and the UAE lead private electricity generation. In 1994, Oman’s 90 MW Al Manah power
plant was the Middle East’s first build, operate, transfer, BOT, power project. Oman also has called
for tenders for the 240 MW Sharqiya build, own, operate, BOO, project and the 400 MW Barqa BOO
project.14
In the UAE, the Taweelah A2 project is underway in Abu Dhabi, with the Taweelah A1
project to follow. The US company, CMS Energy Corporation, is building the Taweelah A2 project,
with 49 per cent equity in the company, and along with a French-Belgian TotalFina-Tractabel consortium,
is shortlisted for the Taweelah A1 project (Business Monitor International, 2000c).
Despite its massive needs, Saudi Arabia is moving slowly to make private sector power provision
more attractive. In August 1997, it gave power projects access to tax holidays and concessional
funding, and in February 2000, it increased electricity tariffs and formed the Saudi Electricity Company
by amalgamating regional power companies. Although the Government has not limited the Saudi
Electricity Company’s power sourcing, no major projects using foreign capital are underway yet.
Saudi ‘well to wire’ gas projects remain the most prospective private power generation projects.
In Iran, despite large additional power requirements, most industry observers believe changes needed
to allow private sector participation will take time (Atkinson, 2000).
14 The Barqa power plant also will produce 756 million litres of water per day.
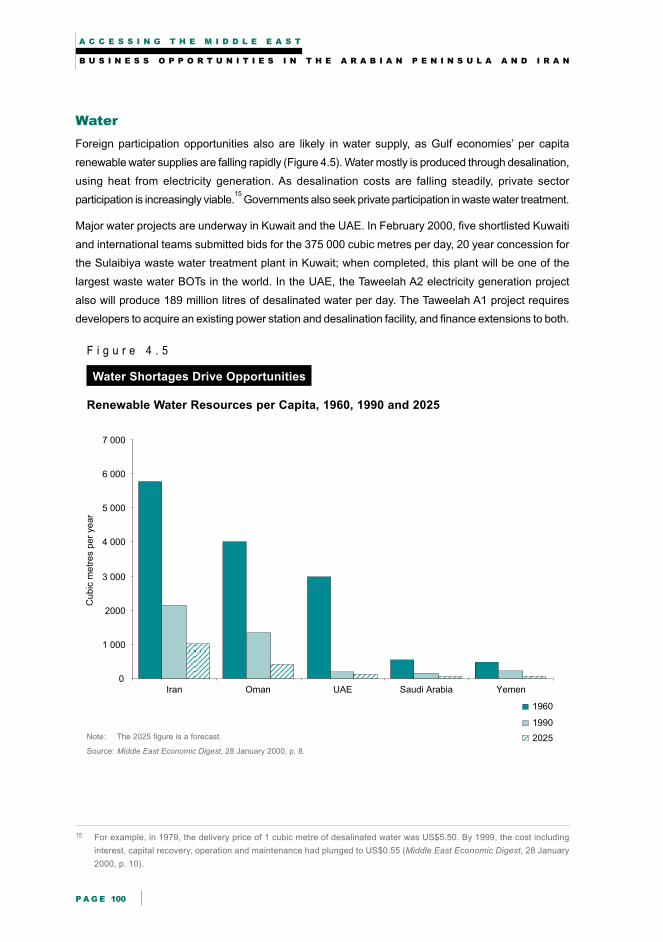
A C C E S S I N G T H E M I D D L E E A S T
B U S I N E S S O P P O R T U N I T I E S I N T H E A R A B I A N P E N I N S U L A A N D I R A N
P A G E 100
Water
Foreign participation opportunities also are likely in water supply, as Gulf economies’ per capita
renewable water supplies are falling rapidly (Figure 4.5). Water mostly is produced through desalination,
using heat from electricity generation. As desalination costs are falling steadily, private sector
participation is increasingly viable.15
Governments also seek private participation in waste water treatment.
Major water projects are underway in Kuwait and the UAE. In February 2000, five shortlisted Kuwaiti
and international teams submitted bids for the 375 000 cubic metres per day, 20 year concession for
the Sulaibiya waste water treatment plant in Kuwait; when completed, this plant will be one of the
largest waste water BOTs in the world. In the UAE, the Taweelah A2 electricity generation project
also will produce 189 million litres of desalinated water per day. The Taweelah A1 project requires
developers to acquire an existing power station and desalination facility, and finance extensions to both.
F i g u r e 4 . 5
Water Shortages Drive Opportunities
Renewable Water Resources per Capita, 1960, 1990 and 2025
Note: The 2025 figure is a forecast.
Source: Middle East Economic Digest, 28 January 2000, p. 8.
Cu
bic
me
tre
s p
er
ye
ar
0
1 000
2000
3 000
4 000
5 000
6 000
7 000
Iran Oman UAE Saudi Arabia Yemen
1960
1990
2025
15 For example, in 1979, the delivery price of 1 cubic metre of desalinated water was US$5.50. By 1999, the cost including
interest, capital recovery, operation and maintenance had plunged to US$0.55 (Middle East Economic Digest, 28 January
2000, p. 10).
F o r e i g n I n v e s t m e n t
P A G E 101
While Iran’s mountainous areas hold relatively large water reserves, Saudi Arabia is facing a sharp
decline in its renewable water resources; Jeddah and other large cities already experience shortages.
The Government has not announced any large water projects with major foreign involvement, although
projects emerging from the ongoing negotiations with major oil companies could well involve water
production alongside gas extraction and electricity generation.
JEDDAH: MAJOR SHORTAGES AHEAD
According to Dr Adel Bushnak, member of the Supreme Economic Council and the Jeddah
Chamber of Commerce and Industry, Jeddah needs one million cubic metres of fresh water
per day to solve its water shortages; existing resources cover only 40 per cent of requirements.
He estimates by 2020, population and economic growth will push daily fresh water requirements
to 3.5 million cubic metres. He anticipates over the next decade, Jeddah’s water supply alone
will need an investment of US$533 million per year.
Source: Atkinson, 2000.
Telecommunications
As in the rest of the world, telecommunications demand in the Gulf is exploding. In 1994, the Saudi
Telecommunications Company installed 80 000 fixed lines per year; now it installs 80 000 fixed lines
per month (Atkinson, 2000). To date, state owned monopolies dominate regional telecommunication
markets; foreign investors may be limited to taking equity in existing state telecommunications
companies as privatisation proceeds.16
For example, Oman and Saudi Arabia aim to privatise state
telecommunications companies, and foreign investors may be able to buy equity shares. The latest
Saudi offer in WTO negotiations with the United States includes sale of a 20 to 40 per cent share in
Saudi Telecommunications Company to a single foreign partner (Economist Intelligence Unit, 2000b).17
However, further liberalisation is in prospect. Most notably, under its WTO accession, Oman is
progressively liberalising access to its telecommunications sector. (See Chapter 5 - Trade.) If other
Gulf economies are to capitalise on electronic commerce and maximise telecommunication’s potential
to contribute to economic growth, many could recognise their need to further liberalise their markets
along these lines, at least for mobile, international and Internet services.
16 The UAE is slightly different as the telecommunications company, Etisalat, is publicly listed, although foreigners cannot yet
own equity. However, Etisalat’s monopoly currently is under serious review.
17 The Saudi Telecommunications Company was corporatised as a first step to privatisation (HE Khalid ibn Mohammed Al-Gosaibi,
2000). The Omani Government is inviting strategic investment in the national telecommunications company as a precursor
to its privatisation (HE Ahmed Bin Abdulnabi Makki, 2000).

A C C E S S I N G T H E M I D D L E E A S T
B U S I N E S S O P P O R T U N I T I E S I N T H E A R A B I A N P E N I N S U L A A N D I R A N
P A G E 102
PETROCHEMICALS
The desire for economic diversification, high oil and gas prices flowing through into petrochemical
end markets and resurging Asian demand drive the region’s rapidly expanding petrochemical industry.
While Saudi Arabia’s new investment guidelines should allow 100 per cent foreign ownership of
petrochemical projects, most existing foreign participation is through joint ventures. The Saudi Arabian
Basic Industries Corporation, SABIC, remains a likely partner in all major projects; between 1998
and 2002, it plans to spend US$9 billion in joint ventures with foreign and domestic partners (Middle
East Economic Digest, 24 March 2000, p. 16).
Abu Dhabi, UAE also is expanding its petrochemicals industry, while Oman’s plans are less advanced.18
These plans may open up new joint venture opportunities for foreign companies. The largest project
is the US$1 billion Borogue polyethelene joint venture between Abu Dhabi National Oil Company and
Borealis of Denmark (Economist Intelligence Unit, 1999f).
Another important development is the November 1999 signing of a letter of intent between National
Petrochemicals Company (Iran) and Elenac (Germany) to construct a low density polyethylene plant;
start up is scheduled for 2003.19
The first Iranian foreign joint venture since the 1979 revolution, the
project will have Elenac owning 55 per cent (Atkinson, 2000).
MANUFACTURING
Thus far, most foreign investment in Gulf economies’ manufacturing sectors is in light manufacturing.
However, increased investment is likely in the region’s expanding heavy industry sector.
Heavy Manufacturing
In addition to the region’s expanding petrochemicals industry, other types of heavy manufacturing
are developing, using the region’s cheap energy, abundant land, favourable tax regime and cheap
expatriate labour. For example, the region contains two of the world’s largest aluminium refineries,
Dubai Aluminium, Dubal, and the Aluminium Company of Bahrain, ALBA.
Thus far, major heavy industry companies, such as Dubal, ALBA and SABIC, are majority state
owned. However, opportunities may arise to increase foreign capital’s role in aluminium, petrochemical
and steel production, including electric arc furnaces and downstream rolling mills. Three main factors
are likely to drive increased foreign involvement in heavy industry:
• firstly, if major gas pipelines, such as Dolphin proceed, the scale of investment required to establish
downstream gas using heavy industry in aluminium, steel and petrochemicals may stimulate
further interest in attracting foreign investment
18 Oman’s petrochemical industry expansion is delayed by the need to complete the Sohar gas pipeline to augment gas
supplies and develop a range of industries to efficiently use the gas feedstock. (Economist Intelligence Unit, 1999a).
19 Elenac is a joint venture between Royal Dutch Shell Group and BASF.
F o r e i g n I n v e s t m e n t
P A G E 103
• secondly, major expansion in mining activity, particularly in Saudi Arabia or Iran which have the
largest reserves, could create investment opportunities in minerals processing, given the availability
of cheap energy and need for foreign expertise
• thirdly, as in the infrastructure sector, increased investment requirements may stimulate better
regulatory and foreign access regimes.
Light Manufacturing
Foreign light manufacturing investment is concentrated in UAE free trade zones and Saudi joint
ventures in food processing, paper, printing and publishing, and construction materials (Saudi
Consulting House, 1999).
Tariff free imports, cheap labour and energy, and regional market access attract foreign light
manufacturing investment to free trade zones, including Sony (electronics), Acer (electronics),
Mannesmann Demag (small motor and gearbox assembler) and Clipsal (Australian electrical
components maker). For example, Sony assembles many products in Jebel Ali before shipping them
throughout the Middle East, to states of the former Soviet Union and to Africa, while Clipsal produces
electrical and wiring accessories at Sharjah International Airport Free Zone to distribute throughout
the Middle East (Gulf Business, 1999 and Clipsal, 2000).20
The proposed introduction of a common Gulf Cooperation Council, GCC, tariff and free trade between
members in 2005 should increase access to the whole GCC market, thus increasing the region’s
attractiveness for light manufacturing investment.
DISTRIBUTION
International distribution sector investment is concentrated in UAE free trade zones. However,
investment in ports is growing strongly across the region.
Free Zone Investment
Major region wide distribution operations run out of UAE free zones include BASF, Colgate-Palmolive,
Johnson and Johnson, Samsung, LG and IBM. In addition, freight companies, Lufthansa, DHL, Federal
Express and TNT Worldwide Express have major hubs in the UAE. Lufthansa’s largest air cargo hub
outside Germany is at Sharjah International Airport Free Zone.
Investment in New Ports
Large scale investment in new ports is region wide, often occurring as part of free trade zones. Major
port upgrades are underway at Aden in Yemen, Salalah in Oman and Jeddah in Saudi Arabia. Of
these upgrades, Salalah largely is funded through a joint venture between Maersk Sealand and the
Omani Government, while the Aden upgrade is a joint venture between the Port of Singapore Authority
and the Government of Yemen.
20 In addition to these multinationals, many companies are from the UAE, India and Iran.

A C C E S S I N G T H E M I D D L E E A S T
B U S I N E S S O P P O R T U N I T I E S I N T H E A R A B I A N P E N I N S U L A A N D I R A N
P A G E 104
In addition, the UAE’s ports and Bandar Abbas in Iran also have been upgraded. While Bandar
Abbas has no foreign partner and Iran’s trade regime is relatively closed, the port has good physical
infrastructure and a direct customs bonded rail link with Turkmenistan, allowing access to states of
the former Soviet Union.
FREE TRADE ZONES
UAE free trade zones are the most established in the region. Other notable free zones are in Oman,
Yemen and Iran. Oman and Yemen are prospective as distribution hubs, but are yet to attract diverse
investment, while the dubious legal status of foreign investment, which the constitution technically
prohibits, constrains Iranian zones.
UAE
The UAE has major free zones in Dubai, Sharjah and Abu Dhabi, and smaller zones in the Northern
Emirates. The highly successful Jebel Ali free zone focuses on light manufacturing and distribution,
while Sharjah focuses on heavy industry. Current plans for the Saadiyat Island free zone proposed
for Abu Dhabi focus on bulk commodities, with offshore banking services to support commodity
trading, storage and transformation activities. The UAE also features airport free zones in Dubai and
Sharjah; the Sharjah zone is a large air cargo hub between Asia and Europe.
All these zones offer a range of benefits including:
• 100 per cent foreign ownership21
• exemption from all import duties
• exemption from corporate tax
• no national agent requirement for branches of foreign companies (Jeffreys, 2000, pp. 118-20).
In addition, Dubai is developing a free zone for technology, e-commerce and media, the so called
Internet City. While construction only started in early 2000, the Government’s commitment to the
zone’s success is reflected in its decision to allow 100 per cent foreign ownership, provide 50 year
guarantees on the ability to transfer capital and repatriate profit, and offer 50 year leases on land or
offices. In addition, the zone’s governing authority is not bound to use Etisalat, the UAE’s monopoly
telecommunications provider (Jeffreys, 2000, pp. 118-20; and Business Monitor International, 2000b).
Thus far, Oracle has confirmed a move in its Europe and Middle East headquarters from Vienna
to Dubai, with IBM and Sun Microsystems also negotiating to establish in the zone (Jeffreys,
2000, pp. 124-26).
21 Investors must establish a branch office or single shareholder free zone establishment to be 100 per cent foreign owned
(Jeffreys, 2000).

F o r e i g n I n v e s t m e n t
P A G E 105
JEBEL ALI FREE TRADE ZONE
Jebel Ali in Dubai is the most successful free trade zone on the Arabian Peninsula, attracting
over 600 international manufacturing, distribution, trading and processing companies. In
addition to major multinationals, large GCC, Indian, Iranian and Russian companies and a
range of Australian companies include:
• Alutech, which provides engineering and technology services for refurbishments and
installations at Dubai’s aluminium smelter
• Hunter Watertech, which produces measurement, process control and automation products
for the agricultural, oil and gas sectors
• Worley Engineering, which undertakes engineering projects, primarily in the oil and gas
sectors, and which recently shifted its international head office to Jebel Ali from Indonesia
• Orica Explosives, which has a local joint venture, Emirates Explosives.22
Factors distinguishing Jebel Ali from other free zones include its early establishment, well
developed deepwater port, efficient management and proximity to Dubai’s relatively large
population (30 minutes by road).
Yemen
The Aden duty free zone is a joint venture between the Yemen Government and the Port of Singapore
Authority, which has a 20 year management contract and 60 per cent project equity (Gulf Business,
2000). Aden only requires ships to deviate 2 nautical miles from established Europe-Asia sealanes,
so it is ideal for distributing goods coming through the Suez Canal. However, after Yemen’s mid
1990s civil war and recent kidnappings, it needs to establish credibility. Also Yemen’s market size is
small and infrastructure is weak compared to the UAE.23
(See Chapter 5 - Trade.)
Oman
Echoing Omani traders’ historic role, trade throughput through Salalah duty free zone is growing
rapidly, due largely to a US$260 million joint venture between the Omani Government and Maersk
Sealand. However, like Aden, Oman’s internal market is small compared to the UAE. In addition,
Salalah may experience competition from Aden, as Salalah requires a larger and more costly deviation
from established Europe-Asia sealanes.
22 Austrade’s Dubai office supplied information on all these companies.
23 The UAE’s GDP of US$49 billion and per capita GDP of US$15 100 compare to US$14 billion and US$6 120 in Oman, and
US$5.6 billion and US$340 in Yemen.

A C C E S S I N G T H E M I D D L E E A S T
B U S I N E S S O P P O R T U N I T I E S I N T H E A R A B I A N P E N I N S U L A A N D I R A N
P A G E 106
Iran
Iran has both free trade zones and special economic zones, which are industry focused and under
the control of individual ministries. Kish Island free trade zone, in the middle of the Gulf, focuses on
tourism, services, and light industry, but thus far has mainly attracted Iranian tourism investment.
The Qeshm Island free zone, near the southern port of Bandar Abbas, lies adjacent to large gas
fields, and is intended for heavy industrial, particularly petrochemicals and LNG investment. The
Chahbahar free zone, which lies outside the Gulf, on the Indian Ocean, lies at the terminus of direct
road and rail links between the Gulf and Central Asia.
Despite their undoubted promise, the Iranian free zones fail to attract significant foreign investment
because of infrastructure deficiencies, the dubious legal status of foreign holdings and the United
States Iran Libya Sanctions Act.24
Iran’s special economic zones experience the same impediments as the free zones, but have superior
infrastructure. The Al-Mahdhi zone, adjacent to Qeshm Island near the port city of Bandar Abbas,
features excellent infrastructure for heavy industry development and seeks foreign investors for a
large aluminium smelter and a steel manufacturing complex; both are operational but require
further investment.
MAJOR INFLUENCES ON THE FDI OUTLOOK
While investment liberalisation is underway throughout the Gulf region, much remains to be done.
Apart from oil price trends, key factors affecting the investment outlook include reform progress in
Saudi Arabia, regional integration and the lifting of US sanctions on Iran.
Oil Price Trends
If oil prices remain above US$25 per barrel, government revenues will rise dramatically and reforms
could slip, as foreign capital becomes less important. However, despite current high oil prices, major
reform slippage is not apparent. For example, the Saudi Government recently finalised new tax rates
for foreign companies and is proceeding to open gas and downstream oil sectors to foreign investment.
Reform Progress in Saudi Arabia
The Saudi economy’s size and massive oil and gas reserves make its FDI reform progress critical to
the Gulf’s future investment environment. Continued progress in Saudi Arabia will trigger further
reform elsewhere in the region; otherwise, smaller economies will struggle to compete for investment
capital. Saudi accession to the WTO would raise the probability of further investment reform.
24 Ongoing disputes within economic and political circles over the desirable level of foreign presence in the economy affect
Iran’s free zones. In addition, religious concerns centre on the more liberal social environment required to attract foreign
investment to the zones.
F o r e i g n I n v e s t m e n t
P A G E 107
Regional Integration
Increased regional integration would boost investment prospects by increasing the likelihood of
competitive reform programs. Furthermore, successfully harmonising tariffs in the 5.5 to 7.5 per cent
range would increase intra-regional trade flows and the attractiveness of establishing distribution
centres and regional headquarters. Finally, reduced tensions between GCC economies and Iran
would boost trade flows and increase the region’s attractiveness to investors.
US Sanctions on Iran
US sanctions on Iran apply to both US and non-US firms investing more than US$20 million in Iran’s
oil and gas sectors in any year, although foreign companies can apply for exemptions. These sanctions
expire in mid 2001 and their non-renewal would open the way for a wave of new investment in Iran.
CONCLUSIONS
Although much remains to be done, Gulf FDI regimes are improving gradually, led by Qatar, Oman
and Saudi Arabia. Potential for large new foreign investment is greatest in gas, infrastructure,
petrochemicals and heavy industry. In these rapidly growing areas, the single most important step
that would increase foreign capital’s contribution to economic activity is to move beyond selling shares
in existing or privatising companies; instead, broad ranging reform implementation is required, allowing
freer domestic and foreign competition, including 100 per cent foreign ownership in most sectors.

A C C E S S I N G T H E M I D D L E E A S T
B U S I N E S S O P P O R T U N I T I E S I N T H E A R A B I A N P E N I N S U L A A N D I R A N
P A G E 108
REFERENCES
Atkinson, S., 2000, ‘Recent GCC Infrastructure Developments, Sector Needs and the Prognosis’,
paper presented at the Gulf 2000: Energy, Infrastructure and Finance Conference, Abu Dhabi,
28 and 29 March.
BHP Petroleum, 2000, Information supplied to the East Asia Analytical Unit, May.
BP Amoco, 1999, Statistical Review of World Energy, London.
British Bank of the Middle East, 1997a, ‘Sultanate of Oman’, British Bank of the Middle East, Business
Profile Series, eighth edition, Hong Kong and Shanghai Banking Corporation, Hong Kong.
___ 1997b, ‘Bahrain’, British Bank of the Middle East, Business Profile Series, ninth edition, Hong
Kong and Shanghai Banking Corporation, Hong Kong.
Business Monitor International, 2000a, ‘Saudi Arabia: Green Light for New Investment Laws’, Middle
East Monitor, May, pp. 2-3.
___ 2000b, ‘Saudi Arabia: Heavy Going for Investment Reforms’, August, pp. 2-4.
___ 2000c, ‘UAE: Growth for All’, Middle East Monitor, February, pp. 5-7.
___ 2000c, ‘Saudi Arabia: Gas Rights and Wrongs’, Middle East Monitor, July, pp. 2-4.
Clipsal, 2000, Information supplied to the East Asia Analytical Unit, May.
Economist Intelligence Unit, 2000a, Bahrain, first quarter, EIU, London.
___ 2000b, Saudi Arabia, first quarter 2000, EIU, London.
___,1999a, Oman 1999-2000 Country Profile, EIU, London.
___ 1999b, Iran 1999-2000 Country Profile, EIU, London.
___ 1999c, Qatar 1999-2000 Country Profile, EIU, London.
___ 1999d, Saudi Arabia 1999-2000 Country Profile, EIU, London.
___ 1999e, ‘Iran: Digging for Treasure’, Business Middle East, accessed at www.eiu.com/latest/
383568.asp on 4 August 2000.
___ 1999f, United Arab Emirates 1999-2000 Country Profile, EIU, London.
Fawzi Al-Khatib and Malki, 2000, ‘Clarifying the Region’s Strategy for Economic and Structural Reform’,
paper presented at the Gulf 2000: Energy, Infrastructure and Finance Conference, Abu Dhabi,
28 and 29 March.
Fawzy, H., 2000, ‘Dolphin’, paper presented at the Gulf 2000: Energy, Infrastructure and Finance
Conference, Abu Dhabi, 28 and 29 March.
F o r e i g n I n v e s t m e n t
P A G E 109
Gulf Business, 2000, ‘Storming Ports’, www.gulfbusiness.com, accessed on 27 June 2000.
___ 1999, ‘Free but Not Always Easy’, Vol. 3, No. 9, www.gulfbusiness.com, accessed on
27 June 2000.
HE Ahmed Bin Abdulnabi Makki, 2000, ‘Progressive Initiatives and Developments of Project and
Financing in Oman’, paper presented at the Gulf 2000: Energy, Infrastructure and Finance
Conference, Abu Dhabi, 28 and 29 March.
HE Khalid ibn Mohammed Al-Gosaibi, 2000, ‘Examining the Main Themes of the Saudi Economic Plan’,
paper presented at the Gulf 2000: Energy, Infrastructure and Finance Conference, Abu Dhabi,
28 and 29 March.
Jeffreys, A. (ed), 2000, Emerging Emirates 2000, Oxford Business Group, London.
Miles, S.R., 2000, ‘Foreign Investment in Saudi Arabia’s Energy Sectors’, paper presented at the
Gulf 2000: Energy, Infrastructure and Finance Conference, Abu Dhabi, 28 and 29 March.
Novus Petroleum, Information supplied to the East Asia Analytical Unit, May.
Royal Dutch/Shell Group of Companies, 2000, ‘Shell and Iran’, www.shell.com, accessed on 27 June 2000.
Saudi Consulting House, 1999, ‘Saudi Economic Survey’, Jeddah.
United Nations Committee for Trade and Development, 1999, UNCTAD World Investment Report,
United Nations, New York.

A C C E S S I N G T H E M I D D L E E A S T
B U S I N E S S O P P O R T U N I T I E S I N T H E A R A B I A N P E N I N S U L A A N D I R A N
P A G E 110

C h a p t e r 5
P A G E 111
TRADE POLICY AND PROSPECTS
KEY POINTS
• Oil dominates regional exports and oil prices drive imports.
Historical import to oil price relationships suggest higher oil prices
will generate 15 to 20 per cent import growth in 2000 and 2001.
However, once oil prices stabilise or fall, OPEC quotas will constrain
export and import growth.
• Reducing oil dependence is a gradual process but rapid gas export
growth will assist it.
• Unlike exports, Gulf imports are diverse. Reflecting the oil industry’s
capital intensity, capital goods dominate all Gulf economies’ imports.
The UAE’s entrepot role means consumer goods imports are particularly
important for the UAE, while Iran’s diverse economy and protectionist
policies means intermediate product imports are important.
• The UAE is expected to remain the dominant Gulf entrepot, despite
increased competition from Salalah in Oman and Aden in Yemen. Its
re-exports are about four times the level of other non-oil exports,
and between 1990 and 1998, doubled to US$11 billion.
• World Trade Organization, WTO, membership is driving reform
in critical areas including intellectual property protection,
agency arrangements, foreign investment equity restrictions,
telecommunications market access, and agricultural trade policy.

A C C E S S I N G T H E M I D D L E E A S T
B U S I N E S S O P P O R T U N I T I E S I N T H E A R A B I A N P E N I N S U L A A N D I R A N
P A G E 112
The Gulf region has a long trading history. Its strategic location between Asia and Europe, and
uneven distribution of arable land and fresh water put it on major trade routes from the earliest times,
ensuring local tribes engaged in trade. In the eighteenth and nineteenth century, the Gulf region
became a major transhipment point between Europe and Asia. Gulf economies are now the hub of
the world’s oil trade, supplying two thirds of globally traded oil.
This chapter examines the Gulf economies’ recent merchandise trade developments and performance,
highlighting the most dynamic sectors. It then analyses intra-regional trade and regional re-export
centres. Finally, it examines regional trade reform progress, much induced by World Trade
Organization, WTO, membership and membership applications, and assesses restraints to trade
imposed by tariffs and non-tariff barriers.
THE IMPORTANCE OF TRADE IN THE GULF ECONOMIES
Oil dominates the Gulf economies’ trade, dominating exports, providing feedstock for petrochemical
non-oil exports and financing imports. However, trade’s importance in economic activity varies
considerably; it is most important in the UAE and Bahrain, and least important in Iran and Saudi
Arabia (Figure 5.1). The UAE’s high import levels largely reflect its role as an entrepot, while the main
driver of Bahrain’s imports is Saudi crude oil used by the Bahraini refining industry. Bahrain and the
UAE also have large service exports. In Saudi Arabia and Iran, trade is less important because they
have larger economies and they have more restrictive tariff and non-tariff barriers (see below).
Nonetheless, in 1998, Saudi Arabia had the highest absolute exports at US$40 billion and the highest
absolute imports at US$28 billion, followed by the UAE and Iran (Figure 5.2).1
1 The export values for 1998, the latest available official statistics, are considerably lower than 1997 figures due to lower oil
prices. For example, in 1997, Saudi exports were US$66 billion and Iranian exports US$21 billion.

T r a d e
P A G E 113
US
$ b
illio
n
0
5
10
15
20
25
30
35
40
45
Saudi Arabia UAE Iran Kuwait Oman Qatar Bahrain Yemen
Exports
Imports
F i g u r e 5 . 1
Gulf Region Has Relatively Open Economies
Ratio of Merchandise Exports and Imports to GDP, 1998
Source: Datastream, 2000; and Department of Foreign Affairs and Trade, 2000a.
F i g u r e 5 . 2
Saudi Arabia, the UAE, Iran and Kuwait Dominate Regional Trade
Gulf Merchandise Exports and Imports, 1998, US Dollars
Note: International Economic Data Bank data for exports and imports were used for all economies except Saudi Arabia, where oil export
data was clearly understated. Business Monitor International data were used for Saudi exports for 1998.
Source: International Economic Data Bank, 2000; and Business Monitor International, 2000a.
Pe
r ce
nt
0
10
20
30
40
50
60
70
Bahrain Yemen APECAverage
Qatar Oman Kuwait SaudiArabia
Australia Iran
Exports to GDP
Imports to GDP
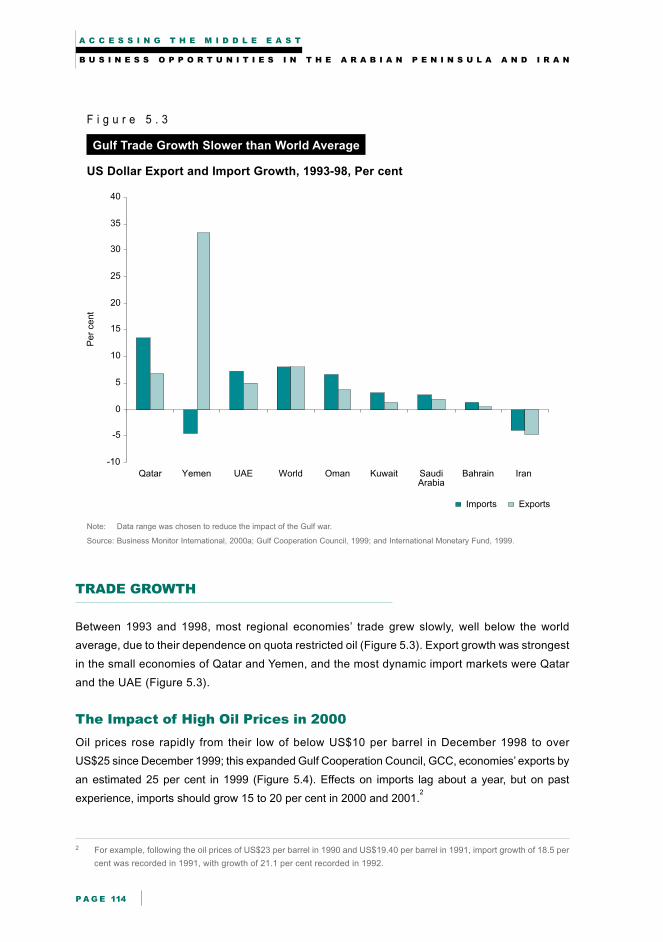
A C C E S S I N G T H E M I D D L E E A S T
B U S I N E S S O P P O R T U N I T I E S I N T H E A R A B I A N P E N I N S U L A A N D I R A N
P A G E 114
2 For example, following the oil prices of US$23 per barrel in 1990 and US$19.40 per barrel in 1991, import growth of 18.5 per
cent was recorded in 1991, with growth of 21.1 per cent recorded in 1992.
F i g u r e 5 . 3
Gulf Trade Growth Slower than World Average
US Dollar Export and Import Growth, 1993-98, Per cent
Note: Data range was chosen to reduce the impact of the Gulf war.
Source: Business Monitor International, 2000a; Gulf Cooperation Council, 1999; and International Monetary Fund, 1999.
TRADE GROWTH
Between 1993 and 1998, most regional economies’ trade grew slowly, well below the world
average, due to their dependence on quota restricted oil (Figure 5.3). Export growth was strongest
in the small economies of Qatar and Yemen, and the most dynamic import markets were Qatar
and the UAE (Figure 5.3).
The Impact of High Oil Prices in 2000
Oil prices rose rapidly from their low of below US$10 per barrel in December 1998 to over
US$25 since December 1999; this expanded Gulf Cooperation Council, GCC, economies’ exports by
an estimated 25 per cent in 1999 (Figure 5.4). Effects on imports lag about a year, but on past
experience, imports should grow 15 to 20 per cent in 2000 and 2001.2
Pe
r ce
nt
-10
-5
0
5
10
15
20
25
30
35
40
Qatar Yemen UAE World Oman Kuwait SaudiArabia
Bahrain Iran
Imports Exports

T r a d e
P A G E 115
F i g u r e 5 . 4
Oil Prices Drive Exports and Imports
Oil Prices and Growth in Export and Import Values in GCC Economies
Note: 1999 export and import figures are estimates from Business Monitor International, 2000a.
Source: Business Monitor International, 2000a; Gulf Cooperation Council, 1999; and International Monetary Fund, 2000.
Beyond 2001, despite diversification efforts, the export and import growth outlook will depend largely
on oil price and production trends. Once oil prices stabilise or fall, OPEC quotas limit export growth,
indirectly constraining import growth. Economic and export diversification will remain a gradual process,
but rapidly growing gas exports, which predominantly are sold on long term contracts, should assist
Qatar, Saudi Arabia, Oman, and in future, Iran, with their diversification efforts.
Per
cent
US
$ p
er
barr
el
-40
-30
-20
-10
0
10
20
30
40
1987 1988 1989 1990 1991 1992 1993 1994 1995 1996 1997 1998 1999
0
5
10
15
20
25
Export growth (LHS)
Import growth (LHS)
Crude oil price (RHS)
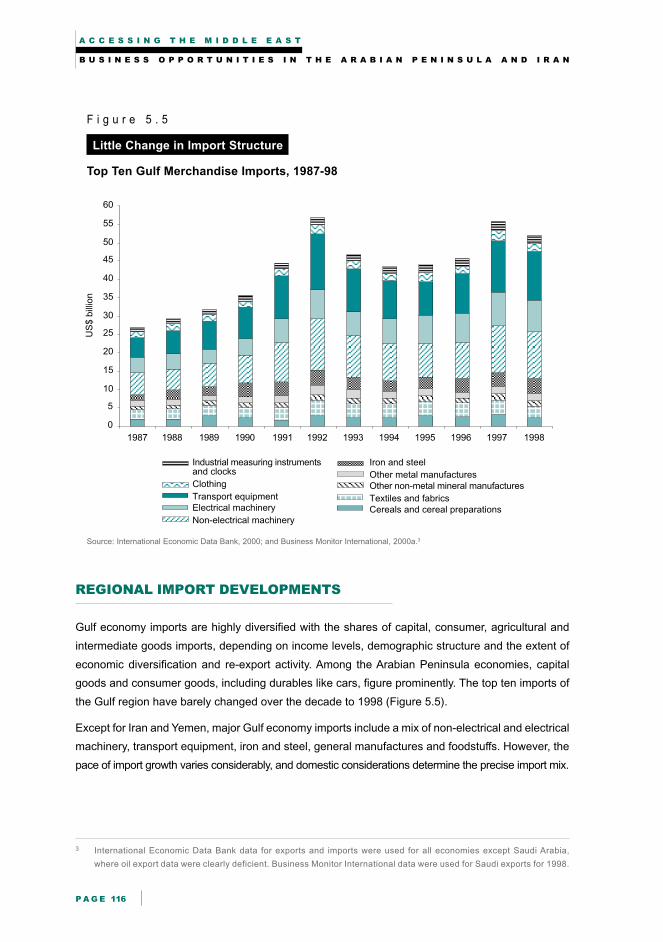
A C C E S S I N G T H E M I D D L E E A S T
B U S I N E S S O P P O R T U N I T I E S I N T H E A R A B I A N P E N I N S U L A A N D I R A N
P A G E 116
US
$ b
illio
n
0
5
10
15
20
25
30
35
40
45
50
55
60
1987 1988 1989 1990 1991 1992 1993 1994 1995 1996 1997 1998
Non-electrical machinery
Industrial measuring instrumentsand clocks
Clothing
Transport equipmentElectrical machinery
Iron and steel
Other metal manufacturesOther non-metal mineral manufactures
Textiles and fabricsCereals and cereal preparations
F i g u r e 5 . 5
Little Change in Import Structure
Top Ten Gulf Merchandise Imports, 1987-98
Source: International Economic Data Bank, 2000; and Business Monitor International, 2000a.3
REGIONAL IMPORT DEVELOPMENTS
Gulf economy imports are highly diversified with the shares of capital, consumer, agricultural and
intermediate goods imports, depending on income levels, demographic structure and the extent of
economic diversification and re-export activity. Among the Arabian Peninsula economies, capital
goods and consumer goods, including durables like cars, figure prominently. The top ten imports of
the Gulf region have barely changed over the decade to 1998 (Figure 5.5).
Except for Iran and Yemen, major Gulf economy imports include a mix of non-electrical and electrical
machinery, transport equipment, iron and steel, general manufactures and foodstuffs. However, the
pace of import growth varies considerably, and domestic considerations determine the precise import mix.
3 International Economic Data Bank data for exports and imports were used for all economies except Saudi Arabia,
where oil export data were clearly deficient. Business Monitor International data were used for Saudi exports for 1998.
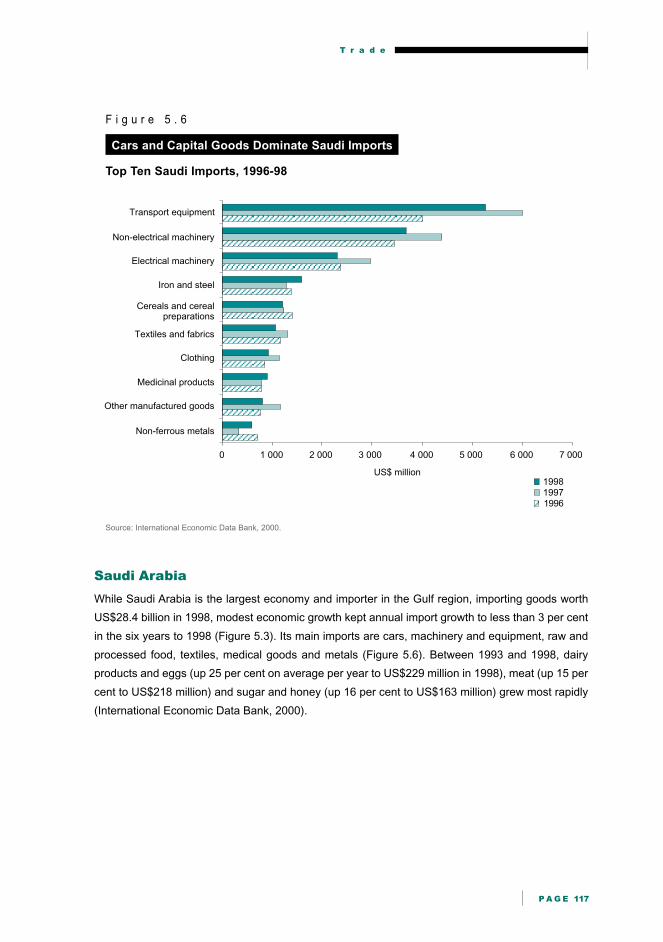
T r a d e
P A G E 117
0 1 000 2 000 3 000 4 000 5 000 6 000 7 000
Non-ferrous metals
Other manufactured goods
Medicinal products
Clothing
Textiles and fabrics
Cereals and cerealpreparations
Iron and steel
Electrical machinery
Non-electrical machinery
Transport equipment
US$ million
199619971998
F i g u r e 5 . 6
Cars and Capital Goods Dominate Saudi Imports
Top Ten Saudi Imports, 1996-98
Source: International Economic Data Bank, 2000.
Saudi Arabia
While Saudi Arabia is the largest economy and importer in the Gulf region, importing goods worth
US$28.4 billion in 1998, modest economic growth kept annual import growth to less than 3 per cent
in the six years to 1998 (Figure 5.3). Its main imports are cars, machinery and equipment, raw and
processed food, textiles, medical goods and metals (Figure 5.6). Between 1993 and 1998, dairy
products and eggs (up 25 per cent on average per year to US$229 million in 1998), meat (up 15 per
cent to US$218 million) and sugar and honey (up 16 per cent to US$163 million) grew most rapidly
(International Economic Data Bank, 2000).
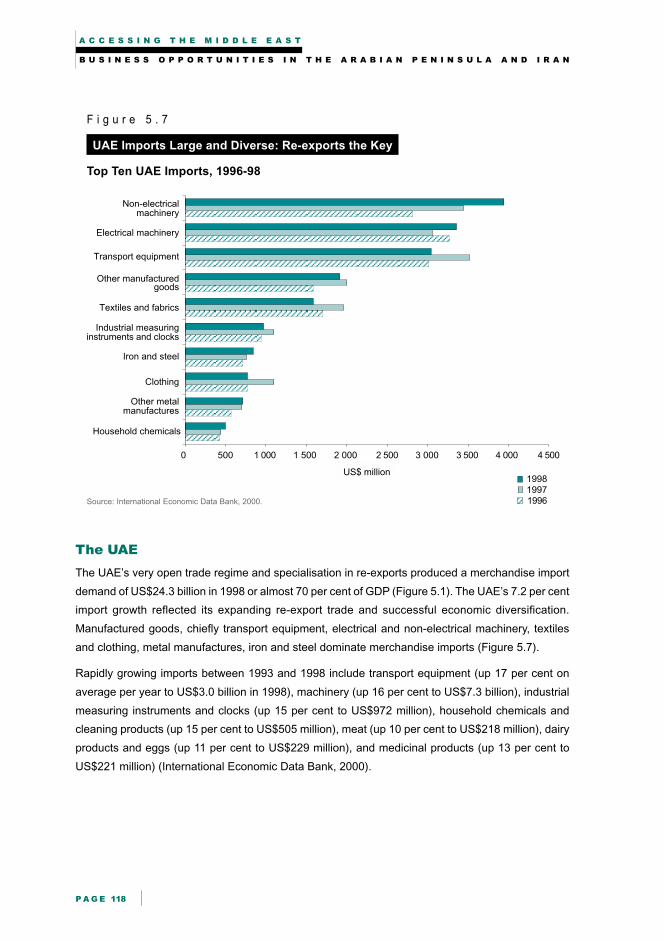
A C C E S S I N G T H E M I D D L E E A S T
B U S I N E S S O P P O R T U N I T I E S I N T H E A R A B I A N P E N I N S U L A A N D I R A N
P A G E 118
0 500 1 000 1 500 2 000 2 500 3 000 3 500 4 000 4 500
Household chemicals
Clothing
Industrial measuringinstruments and clocks
Other manufacturedgoods
Electrical machinery
$US million
Non-electricalmachinery
Transport equipment
Textiles and fabrics
Iron and steel
Other metalmanufactures
199619971998
US$ million
F i g u r e 5 . 7
UAE Imports Large and Diverse: Re-exports the Key
Top Ten UAE Imports, 1996-98
Source: International Economic Data Bank, 2000.
The UAE
The UAE’s very open trade regime and specialisation in re-exports produced a merchandise import
demand of US$24.3 billion in 1998 or almost 70 per cent of GDP (Figure 5.1). The UAE’s 7.2 per cent
import growth reflected its expanding re-export trade and successful economic diversification.
Manufactured goods, chiefly transport equipment, electrical and non-electrical machinery, textiles
and clothing, metal manufactures, iron and steel dominate merchandise imports (Figure 5.7).
Rapidly growing imports between 1993 and 1998 include transport equipment (up 17 per cent on
average per year to US$3.0 billion in 1998), machinery (up 16 per cent to US$7.3 billion), industrial
measuring instruments and clocks (up 15 per cent to US$972 million), household chemicals and
cleaning products (up 15 per cent to US$505 million), meat (up 10 per cent to US$218 million), dairy
products and eggs (up 11 per cent to US$229 million), and medicinal products (up 13 per cent to
US$221 million) (International Economic Data Bank, 2000).

T r a d e
P A G E 119
0 500 1 000 1 500 2 000 2 500
Animal feedstuffs
Medical products
Cereals and cerealpreparations
Iron and steel
Electrical machinery
US$ million
Non-electricalmachinery
Transport equipment
Vegetable oil
Chemicals
Paper andpaperboard
199619971998
F i g u r e 5 . 8
Iran’s Imports Are Minimal
Top Ten Iranian Imports, 1996-98
Source: International Economic Data Bank, 2000.
Iran
Due to the relatively large size of its economy by Gulf standards, its policy of compressing imports
and strict import controls, Iran’s imports as a share of GDP are relatively low (Figure 5.1). Its import
profile is heavily skewed towards bulk foodstuffs and essential capital goods, reflecting recent hard
currency shortages, import bans on many products and Iran’s more diverse and heavily protected
industrial base. While Iran officially imported goods worth US$10.1 billion in 1998 (International
Economic Data Bank, 2000), given its large informal trade sector, and the confidential nature of bulk
food imports, its actual imports are estimated to be around US$14 billion.
In official figures, manufactured imports are more prominent than food imports, with machinery and
transport equipment especially significant (Figure 5.8). However, total food import requirements
average US$3 billion to $5 billion per year, depending on seasonal conditions. Higher oil revenues in
2000-01 will ease pressure on Iran’s debt obligations, and permit the first growth in consumer product
imports since 1995.

A C C E S S I N G T H E M I D D L E E A S T
B U S I N E S S O P P O R T U N I T I E S I N T H E A R A B I A N P E N I N S U L A A N D I R A N
P A G E 120
F i g u r e 5 . 9
Kuwaiti Imports Growing Slowly
Top Ten Kuwaiti Imports 1996-98
Source: International Economic Data Bank, 2000.
Kuwait
Reflecting the 106 per cent import surge in 1992, following the Gulf War, Kuwait’s 1998 imports of
US$7 billion remain slightly below 1993 imports. Major items included defence equipment, clothing
and textiles, iron and steel, dairy products and eggs, electrical and non-electrical machinery and
transport equipment (Figure 5.9). The most rapidly growing imports between 1996 and 1998 included
explosives (up 107 per cent on average per year to US$22 million in 1998), crude fertilisers (up 83 per
cent to US$23 million), transport equipment (up 35 per cent to US$196 million) and plumbing, heating
and lighting equipment (up 23 per cent to US$44 million) (International Economic Data Bank, 2000).
0 500 1 000 1 500 2 000 2 500
Transport equipment
Non-electrical machinery
Electrical machinery
Dairy products and eggs
Iron and steel
Other manufactured goods
Clothing
Firearms and ammunition
Textiles and fabrics
Other metal manufactures
US$ million
199619971998

T r a d e
P A G E 121
0 200 400 600 800 1 000 1 200
Fruit and vegetables
Cereals and cerealpreparations
Tobacco
Non-metallic minerals
Textiles and fabrics
Other manufactured goods
Iron and steel
Electrical machinery
Transport equipment
Non-electrical machinery
US$ million
199619971998
F i g u r e 5 . 1 0
Oman’s Imports Growing Strongly
Top Ten Omani Imports, 1996-98
Source: International Economic Data Bank, 2000.
Oman
After Qatar and the UAE, Oman had the fastest import growth in the six years to 1998, averaging
6.6 per cent per year (Figure 5.3), reflecting relatively low tariff barriers and solid economic growth.
Transport equipment and electrical and non-electrical machinery dominate imports (Figure 5.10);
iron and steel, textiles and fabrics and food imports, principally fruit, vegetables and cereals, also are
significant. The fastest growing imports include non-electrical machinery (up 12 per cent on average
per year between 1993 and 1998 to US$1.1 billion in 1998), iron and steel (up 14 per cent to
US$220 million), edible oils (up 30 per cent to US$34 million), and non-ferrous metals (up 18 per cent
to US$28 million) (International Economic Data Bank, 2000).
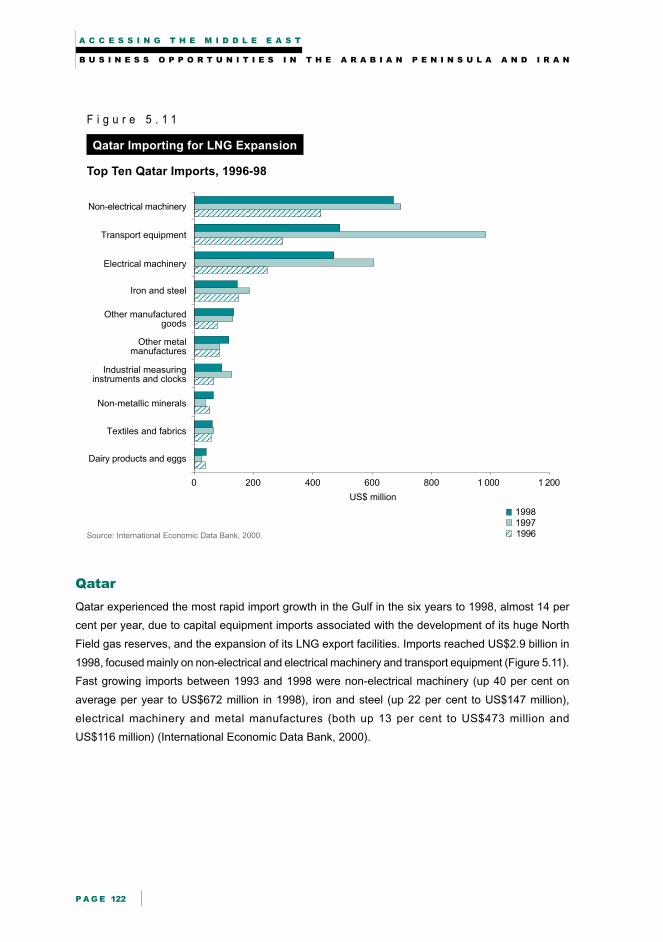
A C C E S S I N G T H E M I D D L E E A S T
B U S I N E S S O P P O R T U N I T I E S I N T H E A R A B I A N P E N I N S U L A A N D I R A N
P A G E 122
0 200 400 600 800 1 000 1 200
Dairy products and eggs
Textiles and fabrics
Non-metallic minerals
Industrial measuringinstruments and clocks
Other metalmanufactures
Other manufacturedgoods
Iron and steel
Electrical machinery
Transport equipment
Non-electrical machinery
US$ million
199619971998
F i g u r e 5 . 1 1
Qatar Importing for LNG Expansion
Top Ten Qatar Imports, 1996-98
Source: International Economic Data Bank, 2000.
Qatar
Qatar experienced the most rapid import growth in the Gulf in the six years to 1998, almost 14 per
cent per year, due to capital equipment imports associated with the development of its huge North
Field gas reserves, and the expansion of its LNG export facilities. Imports reached US$2.9 billion in
1998, focused mainly on non-electrical and electrical machinery and transport equipment (Figure 5.11).
Fast growing imports between 1993 and 1998 were non-electrical machinery (up 40 per cent on
average per year to US$672 million in 1998), iron and steel (up 22 per cent to US$147 million),
electrical machinery and metal manufactures (both up 13 per cent to US$473 million and
US$116 million) (International Economic Data Bank, 2000).
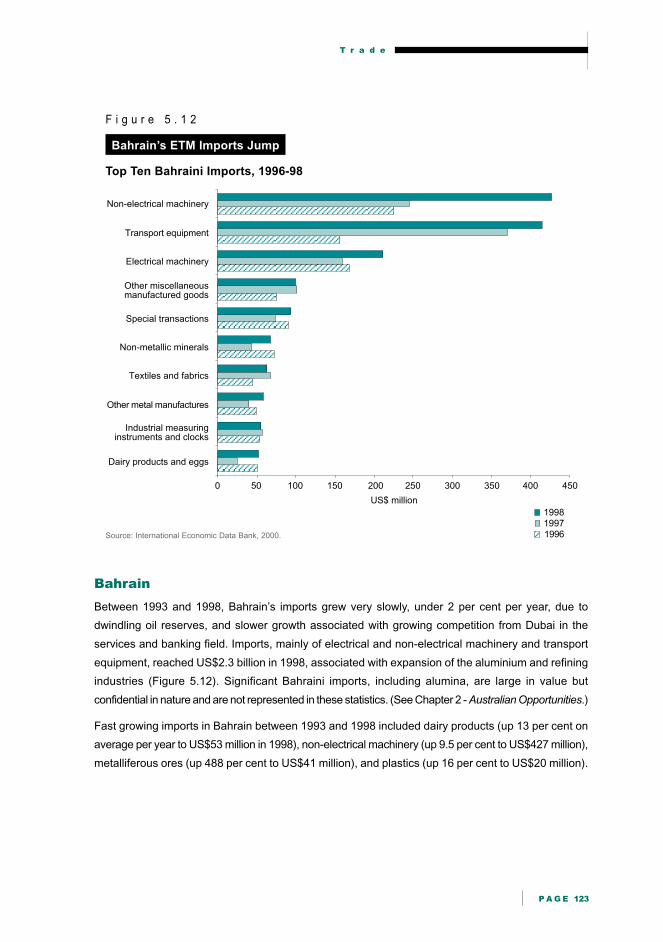
T r a d e
P A G E 123
0 50 100 150 200 250 300 350 400 450
Dairy products and eggs
Industrial measuringinstruments and clocks
Other metal manufactures
Textiles and fabrics
Non-metallic minerals
Special transactions
Other miscellaneousmanufactured goods
Electrical machinery
Transport equipment
Non-electrical machinery
US$ million
199619971998
F i g u r e 5 . 1 2
Bahrain’s ETM Imports Jump
Top Ten Bahraini Imports, 1996-98
Source: International Economic Data Bank, 2000.
Bahrain
Between 1993 and 1998, Bahrain’s imports grew very slowly, under 2 per cent per year, due to
dwindling oil reserves, and slower growth associated with growing competition from Dubai in the
services and banking field. Imports, mainly of electrical and non-electrical machinery and transport
equipment, reached US$2.3 billion in 1998, associated with expansion of the aluminium and refining
industries (Figure 5.12). Significant Bahraini imports, including alumina, are large in value but
confidential in nature and are not represented in these statistics. (See Chapter 2 - Australian Opportunities.)
Fast growing imports in Bahrain between 1993 and 1998 included dairy products (up 13 per cent on
average per year to US$53 million in 1998), non-electrical machinery (up 9.5 per cent to US$427 million),
metalliferous ores (up 488 per cent to US$41 million), and plastics (up 16 per cent to US$20 million).

A C C E S S I N G T H E M I D D L E E A S T
B U S I N E S S O P P O R T U N I T I E S I N T H E A R A B I A N P E N I N S U L A A N D I R A N
P A G E 124
0 50 100 150 200 250 300
Petroleum andpetroleum products
Other rubber manufactures
Textiles and fabrics
Sugar, molassesand honey
Vegetable oil
Dairy products and eggs
Transport equipment
Iron and steel
Electrical machinery
Non-electrical machinery
US$ million
199619971998
F i g u r e 5 . 1 3
Development Challenge Drives Imports
Top Ten Yemeni Imports, 1996-98
Source: International Economic Data Bank, 2000.
Yemen
Due to the disruption of civil war, between 1993 and 1998, Yemen’s imports declined at an annual
average rate of 4.5 per cent (Figure 5.3) to reach US$1.7 billion by 1998. Electrical and non-electrical
machinery and iron and steel were the top three items (Figure 5.13). However, reflecting Yemen’s
relative poverty and harsh climate, food imports were 30 per cent of total imports or US$524 million.
In the six years to 1998, Yemen’s fastest growing imports included animal and vegetable oils (up 19 per
cent on average per year to US$13 million in 1998), transport equipment (up 13 per cent to
US$97 million), fruit and vegetables (up 11 per cent to US$38 million), and electrical machinery
(up 9 per cent to US$121 million) (International Economic Data Bank, 2000).

T r a d e
P A G E 125
F i g u r e 5 . 1 4
Oil Dependence Varies Significantly
Share of Oil in Merchandise Export Revenue, 1996-98, Per cent
Source: International Economic Data Bank, 2000; and Business Monitor International, 2000a.
EXPORTS
While oil is the region’s dominant export, oil dependence is highest in Kuwait, Saudi Arabia and Iran
(Figures 5.14 and 5.15).4 Lower Bahraini oil export dependence reflects relatively modest oil production
and significant aluminum and petrochemical exports while for the UAE, lower oil dependence is
primarily caused by high re-exports. Since the end of the civil war, Yemen has increased its oil
exports rapidly from a low base; this is the main reason for its extraordinary export growth (Figure 5.3).
4 Oil here refers to crude oil and petroleum products, and does not include gas or petrochemical exports.
Pe
r ce
nt
0
10
20
30
40
50
60
70
80
90
100
Saudi Arabia Oman Kuwait Iran Qatar UAE Bahrain

A C C E S S I N G T H E M I D D L E E A S T
B U S I N E S S O P P O R T U N I T I E S I N T H E A R A B I A N P E N I N S U L A A N D I R A N
P A G E 126
US
$ b
illio
n
0
5
10
15
20
25
30
35
Oil Exports Manufactures Other Agriculture
IranUAESaudi Arabia
F i g u r e 5 . 1 5
The UAE Has Large Manufacturing Re-exports
Value of Major Export Categories in Saudi Arabia, the UAE and Iran, 1998
Note: a Oil refers to crude oil and petroleum, and excludes all gas and petrochemical exports.
b The UAE’s re-exports of around US$10.6 billion in 1998 are included in manufactures.
c Agricultural exports for the UAE are nearly zero.
Source: Datastream, 2000; Economist Intelligence Unit, 1999a and 1999b; and additional estimates are by Key Economics, 1999.
Export Prospects
As Iran, Qatar, the UAE, Saudi Arabia and Kuwait account for 30 per cent of world natural gas
reserves, in future, natural gas exports are likely to grow rapidly. LNG schemes already are developed
in Qatar, Oman and the UAE, and Iran, Saudi Arabia and Kuwait are developing their reserves
(US Department of Energy, 1998).5 Qatar’s gas export growth will be the most dramatic with contracted
LNG sales expected to rise from 5.7 million tonnes in 1999 to 18.3 million tonnes in 2003 (Fawzi Al-
Khatib and Tarik Al-Malki, 2000).
Petrochemical exports also should expand rapidly as new projects come onstream in Saudi Arabia,
the UAE and Bahrain. (See Chapter 4 - Foreign Investment.) Petrochemical exports should expand
particularly strongly if oil prices stay high, as higher oil prices generate higher world petrochemical
prices. This boosts profits for Gulf petrochemical producers who can access lower cost domestic
feedstock. Aluminium exports also are set to expand if major gas pipeline projects like Dolphin, and
Saudi, UAE and Bahraini smelter expansion plans proceed.
5 Asia is a major target market for these exports because of strong expected growth in demand.

T r a d e
P A G E 127
Per
cent
0
5
10
15
20
25
USA Japan UK Germany Italy Republicof Korea
France India Australia Canada
Share in total regional imports
Share in total regional exports
F i g u r e 5 . 1 6
United States and Japan the Gulf’s Main Trading Partners
Country Shares of Gulf Economies’ Exports and Imports, Per cent, 1998
Note: The Gulf economies are Iran, Saudi Arabia, the UAE, Oman, Bahrain, Qatar, Kuwait and Yemen. These statistics refer to goods trade only.
Source: International Monetary Fund, 1999.
MAIN TRADING PARTNERS
The Gulf economies’ trading partners are diverse but Japan and the United States supply a large
share of Gulf economy imports, and are their biggest export destinations (Figure 5.16 and Appendix
Table 5.1). The United States is a particularly prominent trading partner for Saudi Arabia, but absent
from Iran’s reported trade statistics, due to US sanctions. EU nations also are important import
suppliers, while the Republic of Korea is a major export destination, reflecting its strong industrial
base and high dependence on energy imports. Australia receives only 0.7 per cent of regional exports,
but supplies 2 per cent of regional imports, well above its 1 per cent share of world trade (International
Monetary Fund, 1999).

A C C E S S I N G T H E M I D D L E E A S T
B U S I N E S S O P P O R T U N I T I E S I N T H E A R A B I A N P E N I N S U L A A N D I R A N
P A G E 128
F i g u r e 5 . 1 7
Intra-regional Trade Is Low
Share of Exports and Imports from the Gulf Economies, 1998
Source: International Monetary Fund, 1999; and Department of Foreign Affairs and Trade, 2000a.
INTRA-REGIONAL TRADE
Intra-regional merchandise trade is limited except for crude oil, gas, oil and gas products and re-
exports (Figure 5.17).6 Most Gulf economies produce and export similar products and lack diversified
manufacturing bases to stimulate intra-industry trade. Intra-regional trade is more important among
the smaller economies, with Oman receiving 36 per cent and Yemen receiving 24 per cent of their
imports, mostly re-exports and oil products, from regional neighbours.7 In contrast, Saudi Arabia, the
UAE and Iran each import as much, or more, from the Republic of Korea than from other regional
economies combined (International Monetary Fund, 1999).
Bahrain and the UAE depend most on exports to other Gulf economies, particularly Bahrain’s financial
services and tourism exports to Saudi Arabia, and the UAE’s transport and tourism exports and re-
exports throughout the Gulf.8
6 Intra-regional trade is defined as trade between the economies detailed in this report.
7 In addition, Bahrain receives significant Saudi crude oil imports for refining and re-export, and Dubai imports gas from
Oman for power generation.
8 In 1998, 9.4 per cent of Bahrain’s exports went to Saudi Arabia, a further 4.4 per cent to the UAE and in total 19.7 per cent
of exports went to the region. Gulf economies took 9.7 per cent of the UAE’s exports.
Per
cent
0
10
20
30
40
50
60
70
80
Bahrain UAE Yemen Iran Qatar Saudi Arabia Oman
Share of exports to other Gulf economies in total exports
Share of imports from Gulf economies in total imports

T r a d e
P A G E 129
F i g u r e 5 . 1 8
Iran and India Major Re-export Markets
Dubai Re-exports by Destination, 1997
Note: Data are January to November only.
Source: Economist Intelligence Unit, 1999d.
REGIONAL RE-EXPORT CENTRES
The UAE is the dominant Gulf entrepot; its re-exports are about four times higher than other non-oil
exports, and doubled to US$11 billion between 1990 and 1998. In 1998, about 40 per cent of UAE
imports were re-exported (Central Bank of the United Arab Emirates, 1999).9 Re-exports also are
important in Oman, with its 1998 re-exports more than double all other non-oil exports. However, with
re-exports of around US$1.3 billion in 1998, Oman is not yet a serious competitor to the UAE (Economist
Intelligence Unit, 1999c).
Dubai is the main re-export centre in the UAE, with its twin ports of Jebel Ali and Port Rashid handling
40 per cent of all Gulf containers. As well, dhows loaded in Dubai carry large volumes of unrecorded
trade to Gulf economies (Middle East Economic Digest, 31 March 2000, p. 2).10
Dubai’s re-export markets are diverse, with the main destinations Iran and the Indian sub-continent
(Figure 5.18). Between 1993 and 1997, recorded re-exports to Iran fell by US$95 million, mainly due
9 For agricultural imports, the percentage of re-exports is even higher at around 60 to 70 per cent (Canadian Business
Development International, 1997).
10 The trade volumes handled through Jebel Ali and Port Rashid in 1998 were almost three times the amount landed at Saudi
Arabia’s Jeddah Islamic Port, the largest port on the Red Sea.
US
$ m
illio
n
0
100
200
300
400
500
600
700
800
900
Iran India SaudiArabia
Kuwait Afghanistan Pakistan Qatar Hong Kong

A C C E S S I N G T H E M I D D L E E A S T
B U S I N E S S O P P O R T U N I T I E S I N T H E A R A B I A N P E N I N S U L A A N D I R A N
P A G E 130
to Iran’s foreign exchange shortages. However, this decline was more than offset by growth in re-
exports to India, up from US$98 million in 1993 to US$320 million in 1997, as Indian economic
growth improved (Economist Intelligence Unit, 1999d).
Dubai’s Prospects
Competition for Dubai’s re-export business is increasing, mainly from Oman and Yemen. Oman is
looking to the new port of Salalah, managed by Maersk Sealand to increase its re-exports further. By
mid 2000, Maersk Sealand had diverted around 30 per cent of its transhipments from Dubai to
Salalah, with much of Salalah’s other throughput coming from less efficient ports outside the Gulf,
such as Colombo (Middle East Economic Digest, 31 March 2000, p. 2). Nonetheless, in 1999, Dubai
ports’ throughput increased by 1.4 per cent, down on the 7.7 per cent increase of 1998, but impressive
given reduced Maersk Sealand business.
Yemen plans to expand throughput in Aden by using its strategic location at the entrance to the Red
Sea leading to the Suez Canal. Its prospects are boosted by the 60 per cent equity share taken by
the Port of Singapore Authority (Gulf Business, 2000).
One major factor underpinning the continued attractiveness of Dubai and other UAE ports as re-
export centres is the UAE’s considerable internal market. The UAE’s GDP of US$49 billion and per
capita GDP of US$15 100 compares favourably with Oman’s US$14 billion GDP and US$6 120 per
capita income and Yemen’s US$5.6 billion GDP and tiny US$340 per capita income.11
Domestic
market size matters, as ports with larger domestic markets offer more back loading potential and
lower average transport costs for primary cargoes.
Dubai’s record of efficient operations also will underpin its continued central role as a trade hub.
Reflecting their high efficiency, Dubai’s ports have the highest crane utilisation rates in the region
(Middle East Economic Digest, 31 March 2000, p. 2).
EFFECTS OF WTO MEMBERSHIP ON REFORM
WTO membership and associated trade liberalisation is critical for the region’s future economic
prospects, lifting economic growth and boosting foreign investor confidence (Borland, 2000). Bahrain,
Kuwait, Qatar and the UAE are all WTO members.12
Oman, Saudi Arabia and Yemen are applying for
membership and negotiating entry conditions, although Yemen’s accession is in its infancy. Iran’s
application for WTO membership has not been scheduled for consideration due to US opposition.
11 Other significant ports in the UAE include Khor Fakkan and Mina Khalid in Sharjah, Fujairah port in Fujairah and Mina
Zayed in Abu Dhabi.
12 Bahrain, Kuwait , Qatar and the UAE proceeded from GATT membership to WTO membership.
T r a d e
P A G E 131
Impact of WTO on Existing Members
WTO membership is an important driver of reform, limiting the forms of protection economies can
apply and generating commitments to future liberalisation. For example, trade liberalisation, particularly
in agriculture and services, elimination of subsidies, protection of intellectual property and equal
treatment of domestic and foreign companies are all requirements of WTO membership. Members
also must remove non-tariff barriers, such as standards, certification, licensing, inspection and
quarantine regimes not in accordance with WTO rules.
One area of major progress is intellectual property protection. For example, before joining the WTO
in 1995, the UAE expanded copyright protection to cover audio and video tapes and computer software,
and introduced legislation governing registration of patents and trademarks (British Bank of the Middle
East, 1998). As UAE legislation and enforcement improved, the United States Trade Representative’s
Office removed the UAE from its watch list on intellectual property protection in the pharmaceutical
and computer software industries (Business Monitor International, 2000b).
Kuwait and Qatar also are improving intellectual property protection. In May 1997, Qatar introduced
an intellectual property law, and should introduce new trademark and intellectual property laws
consistent with World Intellectual Property Standards by the end of 2000 (Hong Kong and Shanghai
Banking Corporation, 2000). Similarly, in 1999 Kuwait passed new copyright and patent protection
laws and regulations to enforce these laws (US Department of State, 1999a).
WTO requirements also are opening important new sectors to foreign competition in several Gulf
economies. For example, the UAE telecommunications monopoly, Etisalat, will face competition from
foreign telecommunications companies by 2004. WTO rules also caused Bahrain to eliminate exclusive
agencies and introduce fixed term agency agreements.
Oman’s WTO Accession
Oman’s WTO admission is imminent. The accession process has driven major reform, with important
benefits for Australia. Oman has agreed to liberalise tariffs and bind tariff commitments for agricultural
exports, as well as minerals, cars, information technology products, chemicals and pharmaceuticals,
paper products and construction materials. It also is adopting WTO rules on standards and quarantine
regimes, and reforming customs valuation procedures.
Oman also has agreed to ensure no taxation discrimination between domestic and foreign companies,
and increased foreign ownership limits from 49 to 70 per cent. It is opening new sectors to competition,
introducing then shortening timeframes for foreign participation in the telecommunications sector,
with foreign participation to start from 2002.13
It also is opening up its electricity sector to foreign
participation after introducing a world’s best practice competitive market environment, similar to that
in Victoria, Australia.
13 Foreign participation in the telecommunications sector will be liberalised progressively, starting in 2002 with payphones
and calling cards, and moving into mobile phones, telex services, audiovisual services and data transmission.
A C C E S S I N G T H E M I D D L E E A S T
B U S I N E S S O P P O R T U N I T I E S I N T H E A R A B I A N P E N I N S U L A A N D I R A N
P A G E 132
Saudi Arabian WTO Accession
Saudi WTO accession will have important domestic and regional implications, given the Saudi
economy’s size. Saudi Arabia’s unilateral foreign investment liberalisation announcement in April 2000
and its improved tax treatment for foreign companies already has placed GCC neighbours like the
UAE under pressure to improve their treatment of foreign investors.
Multilateral and bilateral negotiations to complete Saudi Arabia’s accession process still are underway.
Bilaterally agreed market access improvements, which will apply to all WTO members, will yield
significant benefits should Saudi Arabia’s WTO accession proceed. Multilateral negotiations also
could yield major improvements in access to the Saudi market via reduced agricultural subsidies,
fewer quantitative restrictions, improved intellectual property protection, equal tax treatment for
domestic and foreign companies, and improved customs procedures.
Australia has completed its bilateral accession negotiations with Saudi Arabia, securing access for
previously banned packaged milk, substantially reduced tariffs for wheat and wheat flour, and reduced
tariffs and increased access security for car and car component exports (Vaile, 2000). However, the
United States, European Union and Canada are yet to finalise their bilateral negotiations.
TARIFF BARRIERS
Tariff barriers vary across the Gulf economies; Kuwait and the UAE have the lowest average tariffs at
around 3.5 per cent, and Saudi Arabia has the highest. Kuwait’s agricultural imports incur tariffs of
0 to 4 per cent, while all industrial imports incur 4 per cent tariffs; tobacco product imports incur 70 per
cent tariffs (Department of Foreign Affairs and Trade, 2000b).14
In the UAE, most tariffs are 4 per
cent, although around 75 per cent of imports enter duty free (US Department of State, 1999b). The
main duty free imports are:
• imports entering the free trade zones
• tariff free items including foodstuffs, medicines and public sector imports
• imports from GCC economies, which largely enter the UAE and other GCC economies duty free,
if the GCC adds at least 40 per cent of their value and GCC nationals own at least 51 per cent of
the producing firm.
Saudi Arabia’s simple average tariff rate is 12.5 per cent (Department of Foreign Affairs and Trade,
2000b). Imports of basic foodstuffs and medicine are duty free, with a general 12 per cent tariff on
most other imports, and a 20 per cent tariff on many imports which also are produced locally (Saudi
British Bank, 1999).
Among the other economies, tariff data are less comprehensive. However, the key points are:
• Qatar: the general tariff rate is 4 per cent but tariffs of 20 to 30 per cent apply to goods competing with
local products such as cement, steel and urea (Hong Kong Shanghai Banking Corporation, 2000)
14 Prohibited imports include alcohol, wheat flour, asbestos, fireworks and drinking water coolers.

T r a d e
P A G E 133
• Bahrain: imports of raw materials, semi-manufactured goods and products for development
projects or re-export are duty free (Canadian Business Development International, 1997). Tariffs
start at 5 per cent on foodstuffs and necessities, and as in many other regional economies, much
higher rates apply to cigarettes (50 per cent) and alcohol (125 per cent)
• Oman: a wide range of essential consumer goods enter duty free, as do industrial inputs.15
‘Luxury’ consumer goods, including tea, coffee and prepared foods, attract 15 per cent tariffs,
while cars incur 10 to 15 per cent tariffs depending on engine size (US Department of State,
1999c). Oman’s WTO entry will drive further tariff and non-tariff barrier reductions. For example,
following criticism of its 10 per cent price preference for Omani companies in government
procurement tenders, Oman has agreed to initiate negotiations to join the WTO Agreement on
Government Procurement upon accession (United States Trade Representative, 2000)
• Iran: most consumer good imports incur 30 to 50 per cent tariffs. Capital and intermediate goods
attract lower tariffs, while medicines, wheat and other strategic goods are duty free (Mohammed
Reza Raf’ati, 1995). Regular checks for specific information are critical, as particulars of import
regulations change often.16
Non-essential imports often are banned, due to currency restrictions
• Yemen: since 1996, as part of the IMF sponsored reform program, tariffs have fallen to between
5 and 25 per cent.
Tariff Unification within the GCC
In November 1999, GCC economies decided to move external tariffs to a common range between
5.5 and 7.5 per cent by 2005. The impact of this agreement depends on exemptions and phase-in
times which are yet to be released publicly. However, one factor pushing for effective implementation
is that the GCC free trade agreement with the European Union depends on implementing the common
tariff by 2005. Full implementation of the agreement would see Saudi tariffs fall, resulting in significantly
improved access to the region’s main market. On the other hand, the UAE and Kuwait would have to
raise tariffs, which they are wary of doing.
Moving to a common external tariff will transform the GCC from a regional trading arrangement to a
customs union.17
As such, it is likely to be subject to greater WTO scrutiny, and in common with other
customs unions, will be ineligible for developing countries status (Ravier, 2000).
15 Essential products include rice and meat, seeds, fertilisers, live plants, agricultural implements and books. In May 1999,
around 40 industrial items became tariff free (US Department of State, 1999c).
16 Iran’s trade regime is highly opaque due to overlapping ministerial responsibilities for trade, and ad-hoc administrative
decision making. Some imports like meat are banned in some years, when a domestic surplus is envisaged, but permitted
in others, when a shortfall is predicted.
17 By definition, a customs union involves a grouping with common external tariffs while a regional trading arrangement has
internal tariff concessions for members but no common external tariff.

A C C E S S I N G T H E M I D D L E E A S T
B U S I N E S S O P P O R T U N I T I E S I N T H E A R A B I A N P E N I N S U L A A N D I R A N
P A G E 134
NON-TARIFF BARRIERS
Extensive non-tariff barriers are a defining feature of the regional trading environment. Common
barriers include:
• exclusive agency requirements
• government procurement policies favouring nationals
• significant numbers of prohibited imports
• restrictive labelling requirements.
Agency Requirements
Use of a local distribution agent is a key legal requirement for exporting to Oman, Qatar, Kuwait and
Bahrain, and generally, these agents must be nationals or companies owned by nationals
(Table 5.1). In Saudi Arabia and the UAE, agents are not compulsory but they must be locals or GCC
nationals. They are very commonly used because of difficulties in accessing local markets without
them. Restricting agency business to local citizens, and granting exclusive agency rights to import
specific products is likely to increase the cost of imported products and reduce import volumes.
Because of their important role and the difficulty of ending agency agreements, choosing the right
agent is critical for exporters to the Gulf. (See Chapter 3 - Business Environment.)
Government Procurement Policies
Given the state’s dominant role in economic activity in the Gulf, government procurement policies are
a critical market access issue, particularly for oil and infrastructure projects. Qatar has the most open
government procurement system; invitations to pre-qualify for bids are advertised in local and
international media and via Qatari embassies, and local agents are not required until contract signing.
In contrast, in other markets, requirements for local ownership or price preference for local products
are common (Table 5.2).
An additional procurement requirement applying to major government purchases, particularly of military
equipment, in Kuwait, Saudi Arabia and the UAE is ‘offset’ programs; these require reinvestment of a
portion of the contract value in indigenous industries. (See Chapter - 4 Foreign Investment.)
Prohibitions on Items
Trade prohibitions also influence regional trade patterns. The UAE has the most liberal regulations with
few bans on imported products, except those from Israel. Other Gulf economies often ban imports of
religiously or politically sensitive items. For example, Saudi Arabia and Iran ban imports of pork, alcohol,
statues representing the human form, games of chance and materials offensive to Islamic morals.
Qatar and Yemen also prohibit pork imports while other economies tightly regulate them.
In addition, except for Oman and Qatar, imports from Israel are prohibited, while US trade sanctions
prohibit US firms trading with Iran. (See Chapter 4 - Foreign Investment for more detail on the US sanctions.)

T r a d e
P A G E 135
T a b l e 5 . 1
Local Agents Often Essential
Local Agency Distribution Requirements for Imports
Economy Import distribution requirements
UAE Commercial agents must be UAE nationals or companies wholly owned by
UAE nationals, but use of agents is not legally required. An agent may be
appointed either for the whole UAE, or for one or more emirates. The agency
must provide an exclusive service for the product or territory concerned.
Saudi Arabia Agents are compulsory only for securing government contracts, although, to
enhance its WTO accession bid, the Government recently removed this
requirement for the new gas and downstream project bidding. Agents commonly
are used for exporting. Foreign companies are not restricted to one agent.
However, only Saudi or GCC nationals can have commercial agencies.
Iran In principle, local distributors or agents are not required. The main constraints
are the outright ban on private sector imports in many sectors, and associated
Central Bank allocations of scarce foreign exchange primarily to ministries and
government bodies.
Oman A local agent with an official import licence must handle imports but arrangements
no longer need to be exclusive. Agents must be Omanis or Omani majority
owned companies.
Qatar Only licensed importers who are either Qatari citizens or Qatari companies can
import goods into Qatar.
Bahrain Except for manufacturers or designated regional headquarters, a Bahraini agent
or a joint stock company with at least 51 per cent Bahraini ownership must
manage commercial sales. Since amendments to meet WTO obligations in 1998,
the Government has abolished exclusive agencies and fixed term agreements,
and permitted the principal to terminate unproductive agency agreements.
Kuwait In principle, a Kuwaiti agent is required, although in practice this sometimes is
avoided illegally.
Yemen The Government eliminated import licensing and agency requirements in 1996.
Source: US Department of State, 1999a, 1999c, 1999d, 1999e, 1999f and 1999g; Hong Kong and Shanghai Banking Corporation, 2000;
and Saudi British Bank, 1999.
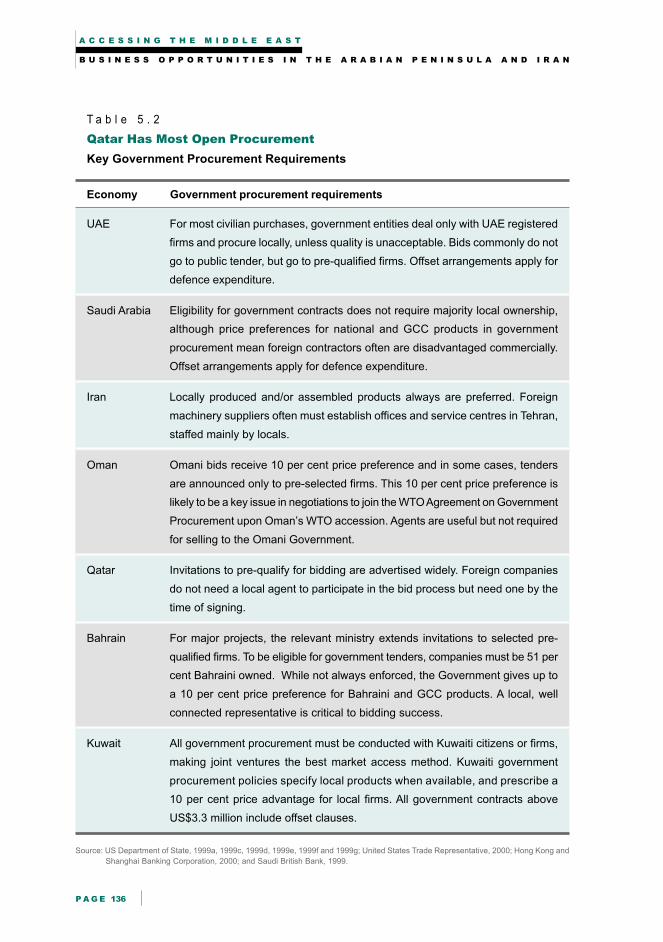
A C C E S S I N G T H E M I D D L E E A S T
B U S I N E S S O P P O R T U N I T I E S I N T H E A R A B I A N P E N I N S U L A A N D I R A N
P A G E 136
T a b l e 5 . 2
Qatar Has Most Open Procurement
Key Government Procurement Requirements
Economy Government procurement requirements
UAE For most civilian purchases, government entities deal only with UAE registered
firms and procure locally, unless quality is unacceptable. Bids commonly do not
go to public tender, but go to pre-qualified firms. Offset arrangements apply for
defence expenditure.
Saudi Arabia Eligibility for government contracts does not require majority local ownership,
although price preferences for national and GCC products in government
procurement mean foreign contractors often are disadvantaged commercially.
Offset arrangements apply for defence expenditure.
Iran Locally produced and/or assembled products always are preferred. Foreign
machinery suppliers often must establish offices and service centres in Tehran,
staffed mainly by locals.
Oman Omani bids receive 10 per cent price preference and in some cases, tenders
are announced only to pre-selected firms. This 10 per cent price preference is
likely to be a key issue in negotiations to join the WTO Agreement on Government
Procurement upon Oman’s WTO accession. Agents are useful but not required
for selling to the Omani Government.
Qatar Invitations to pre-qualify for bidding are advertised widely. Foreign companies
do not need a local agent to participate in the bid process but need one by the
time of signing.
Bahrain For major projects, the relevant ministry extends invitations to selected pre-
qualified firms. To be eligible for government tenders, companies must be 51 per
cent Bahraini owned. While not always enforced, the Government gives up to
a 10 per cent price preference for Bahraini and GCC products. A local, well
connected representative is critical to bidding success.
Kuwait All government procurement must be conducted with Kuwaiti citizens or firms,
making joint ventures the best market access method. Kuwaiti government
procurement policies specify local products when available, and prescribe a
10 per cent price advantage for local firms. All government contracts above
US$3.3 million include offset clauses.
Source: US Department of State, 1999a, 1999c, 1999d, 1999e, 1999f and 1999g; United States Trade Representative, 2000; Hong Kong and
Shanghai Banking Corporation, 2000; and Saudi British Bank, 1999.

T r a d e
P A G E 137
Labelling and Product Standards
Most regional economies have detailed labelling requirements, including Arabic and Farsi labels. (See
Chapter 3 - Business Environment.) In Saudi Arabia, the UAE and Qatar, shelf life requirements often
are far shorter than scientifically necessary to preserve freshness (US Department of State, 1999e).
These requirements inevitably discriminate against non-GCC importers, given their greater distance
from the market.
FUTURE TRADE PROSPECTS
Trade prospects are good in the short and medium term. In 2000 and 2001, high oil prices are likely
to drive rapid import growth in Gulf economies, though beyond 2001 this factor may not sustain
continued growth. In the medium term, the WTO is becoming an increasingly important force for
liberalisation in the region, reducing tariff and non-tariff barriers, improving intellectual property
protection, liberalising agency arrangements and opening rapidly growing sectors such as
telecommunications. Its influence is likely to increase if Saudi Arabia’s accession is successful.
Common GCC external tariffs may raise average tariffs in some of the regions’ most open economies,
like the UAE and Kuwait; however, increased integration also should promote intra-regional trade and
hence manufacturers’ ability to supply the Gulf region from one manufacturing base. Major gas projects
like Dolphin will increase Gulf economies’ demand for industrial inputs. Other diversification policies,
like encouraging service sector development also should increase significantly exports and import demand.
In the medium term, Iran may become a substantially more important trading nation. It has rapid
population growth and shows signs of nascent economic reform. Moreover, it is possible that
US sanctions may not be renewed in September 2001.
A p p e n d i x T a b l e 5 . 1
Trade Directions Diverse
Export/Import Shares of Major Trading Partners, Per cent
Economy Saudi Arabia UAE Iran Kuwait Bahrain Oman Qatar Yemen
Other regional 3.6/2.3 9.1/5.8 6.4/5.1 0.7/0.9 18.1/12.2 1.9/25.8 4.3/11.1 7.1/23.9
United States 15.7/27.3 2.6/7.9 0.0/0.0 16.9/21.7 4.9/9.4 4.7/6.5 4.4/10.2 2.7/5.8
Japan 15.7/10.3 30.1/9.6 17.3/7.3 30/17.5 7.2/10.4 22.8/17 51.6/15.6 3.7/3.5
United Kingdom 3.2/11.5 3.3/8.7 0.4/4.7 3.5/8.2 3.3/6.8 3.1/10.2 0.9/1.4 0.3/5.0
Germany 1.3/6.2 0.7/6.4 3.5/11.6 0.9/8.2 1.3/5.2 0.2/5.5 0.1/6.4 2.1/3.6
France 3.9/3.7 0.4/4.1 5.1/5.3 1.6/4.2 2.4/3.2 0.2/4.4 0.1/11.1 1.5/5.6
Netherlands 3.7/1.6 0.3/1.9 3.3/2.2 6.3/1.5 0.5/1.4 0.1/2.4 0.02/2.4 0.8/2.2
Italy 3.0/4.3 0.4/5.4 9.1/7.6 0.3/6.1 1.5/5.2 0.06/6.7 0.1/4.6 0.8/4.3
Republic of Korea 9.6/3.4 7.7/5 7/6.4 15.2/7.7 7.9/2.7 15.7/1.5 9.8/2.2 11.4/1.9
India 5.6/1.8 6.5/5.4 4.1/1.8 3.7/0.4 17.9/2.9 0.7/2.4 1.4/1.2 0.3/2.3
Singapore 7.2/1.0 3.8/3.4 3.5/0.8 7.9/0.9 3.6/0.4 2.7/1.3 8.8/1.2 5.9/3.2
Source: International Monetary Fund, 1999.

A C C E S S I N G T H E M I D D L E E A S T
B U S I N E S S O P P O R T U N I T I E S I N T H E A R A B I A N P E N I N S U L A A N D I R A N
P A G E 138
REFERENCES
Borland, B., 2000, ‘Gulf 2000: The WTO and GCC’, paper presented at the Gulf 2000: Energy,
Infrastructure and Finance Conference, Abu Dhabi, 28 and 29 March.
British Bank of the Middle East, 1998, United Arab Emirates, British Bank of the Middle East, Business
Profile Series, eighth edition, Hong Kong and Shanghai Banking Corporation, Hong Kong.
Business Monitor International, 2000a, ‘Macroeconomic Data and Forecasts’ (various countries),
Middle East Monitor - The Gulf, May.
___ 2000b, ‘Abu Dhabi’s Power Play’, Middle East Monitor - The Gulf, June pp. 5-7.
Canadian Business Development International, 1997, The Agriculture and Agri-Food Exporter’s Guide
to Opportunities in the Middle East: Saudi Arabia, Agriculture and Agri-Food, Canada, at
atn-riae.agr.ca/public/htmldocs/e1557.htm, accessed on 22 February 2000.
Central Bank of the United Arab Emirates, 1999, Statistical Bulletin, July-September, Vol. 19, No. 3, p. 49.
Datastream, 2000, Datastream Database, www.primark.com, accessed from 7 to 11 August 2000.
Department of Foreign Affairs and Trade, 2000a, ‘The APEC Region Trade and Investment’, Department
of Foreign Affairs and Trade, Canberra.
___ 2000b, ‘Trade Negotiations Analysis System’, Trade Negotiations Division, Department of Foreign
Affairs and Trade, Canberra.
Economist Intelligence Unit, 1999a, Saudi Arabia 1999-2000 Country Profile, EIU, London.
___ 1999b, Iran 1999-2000 Country Profile, EIU, London.
___ 1999c, Oman 1999-2000 Country Profile, EIU, London.
___ 1999d, United Arab Emirates 1999-2000 Country Profile, EIU, London.
Fawzi Al-Khatib and Tarik Al-Malki, 2000, ‘Clarifying the Region’s Strategy for Economic and Structural
Reform’, paper presented at the Gulf 2000: Energy, Infrastructure and Finance Conference,
Abu Dhabi, 28 and 29 March.
Gulf Business, 2000, ‘Storming Ports’, Vol. 4, No. 12, April, www.gulfbusiness.com/cgi-local/index,
accessed on 27 June 2000.
Gulf Cooperation Council, 1999, Economic Bulletin, Vol. 14, Riyadh.
Hong Kong Shanghai Banking Corporation, 2000, ‘Qatar’, Hong Kong Shanghai Bank, Business
Profile Series, tenth edition, Hong Kong and Shanghai Banking Corporation, Hong Kong.

T r a d e
P A G E 139
International Economic Data Bank, 2000, International Economic Data Bank, Australian National
University, Canberra.
International Monetary Fund, 1999, Directions of Trade Statistics Yearbook, IMF, Washington DC.
Key Economics, 1999, Consultancy report to the East Asia Analytical Unit, November.
Mohammed Reza Raf’ati, 1995, ‘Iran’s Standing in Global Trade and Upshots of Membering the
GATT’, Payame Darya (Economic-Scientific Monthly), Vol. 4, No. 33, pp. 14-25, at
new.netiran.com/Frame-Html/Clippings/deconomy-index.html>, accessed December 1999.
Ravier, P. H., 2000, ‘Examining the Implications of the WTO for the GCC’, paper presented at the
Gulf 2000: Energy, Infrastructure and Finance Conference, Abu Dhabi, 28 and 29 March.
Saudi British Bank, 1999, ‘Saudi Arabia’, Hong Kong Shanghai Bank Business Profile Series, eighth
edition, Hong Kong and Shanghai Banking Corporation, Hong Kong.
US Department of Energy, 1998, International Energy Outlook (Gas), Energy Information Administration
Report, DOE/EIA-0484(98), www.eia.doe.gov/oiaf/ieo98, accessed on 8 December 1999.
US Department of State, 1999a, ‘FY 2000 Country Commercial Guide: Kuwait’, prepared by US Embassy
Kuwait, released by Bureau of Economic and Business Affairs, US Department of State, at
www.state.gov/www/about_state/business/com_guides/index.html, accessed on 21 June 2000.
___ 1999b, United Arab Emirates: 1998 Country Report On Economic Policies and Trade Practices,
submitted to the Senate Committees on Foreign Relations and on Finance and to the House
Committees on Foreign Affairs and on Ways and Means, Washington DC.
___ 1999c, ‘FY 2000 Country Commercial Guide: Oman’, prepared by US Embassy Muscat, released
by Bureau of Economic and Business Affairs, US Department of State, at www.state.gov/www/
about_state/business/com_guides/index.html, accessed on 21 June 2000.
___ 1999d, ‘FY 2000 Country Commercial Guide: Saudi Arabia’, prepared by US Embassy Riyadh,
released by Bureau of Economic and Business Affairs, US Department of State, at www.state.gov/
www/about_state/business/com_guides/index.html, accessed on 21 June 2000.
___ 1999e, ‘FY 2000 Country Commercial Guide: Qatar’, prepared by US Embassy Doha, released
by Bureau of Economic and Business Affairs, US Department of State, at www.state.gov/www/
about_state/business/com_guides/index.html, accessed on 21 June 2000.
___ 1999f, ‘FY 2000 Country Commercial Guide: Bahrain’, prepared by US Embassy Manama,
released by Bureau of Economic and Business Affairs, US Department of State, at www.state.gov/
www/about_state/business/com_guides/index.html, accessed on 21 June 2000.

A C C E S S I N G T H E M I D D L E E A S T
B U S I N E S S O P P O R T U N I T I E S I N T H E A R A B I A N P E N I N S U L A A N D I R A N
P A G E 140
___ 1999g, ‘FY 2000 Country Commercial Guide: United Arab Emirates’, prepared by US Embassy
Abu Dhabi, released by Bureau of Economic and Business Affairs, US Department of State, at
www.state.gov/www/about_state/business/com_guides/index.html, accessed on 21 June 2000.
United States Trade Representative, 2000, ‘2000 National Trade Estimate Report on Foreign Trade
Barriers’, at www.ustr.gov/reports/nte/2000/contents.html, accessed on 28 July 2000.
Vaile, M., 2000, Press release by the Minister for Trade, ‘Australia Concludes WTO Deal with
Saudi Arabia’, 31 March.

C h a p t e r 6
P A G E 141
IMPLICATIONS
THE GULF’S ECONOMIC PROSPECTS
Slower and more volatile growth in the 1990s, growing demographic
pressures and the evident success of more open, globalised economies
have convinced many Gulf governments to diversify their economies
and open them further to foreign trade and investment. As a result, trade
and investment policies are becoming more liberal, and many
governments are encouraging foreign participation in manufacturing,
energy and service sectors, including state owned utilities. Current high
oil prices do not appear to be undermining this commitment to reform.
Oman’s accession to the WTO is imminent, and Saudi Arabia is
energetically seeking WTO accession in 2000-01. If the recently agreed
Gulf Cooperation Council, GCC, common tariff proceeds, by 2005,
regional trade and investment could expand. Iran, with 65 million people
(and possibly 120 million by 2050) shows signs of nascent economic
reform, especially as US sanctions, which lapse in September 2001, may
not be renewed (Gulf Business, 1999). All these developments expand
business opportunities for Australian exporters, investors and service
suppliers in sectors ranging from cars, food, education and tourism to
infrastructure, oil and gas.

A C C E S S I N G T H E M I D D L E E A S T
B U S I N E S S O P P O R T U N I T I E S I N T H E A R A B I A N P E N I N S U L A A N D I R A N
P A G E 142
IMPLICATIONS FOR BUSINESS
Prospects to continue Australia’s rapid trade growth with the Gulf region are good. Oil prices are
likely to remain high in 2000 and 2001, and the Australian dollar is priced competitively compared to
the US dollar and European currencies. Ongoing liberalisation of trade and foreign investment regimes,
infrastructure and social service privatisation, major gas field developments, increased regional
integration and rapid population growth will expand trade and investment opportunities. Hence, the
2000s, and 2000 to 2002 in particular, should be very good for seeking new markets or expanding
existing ones in the Gulf economies.
Sectoral Opportunities
Major business opportunities include expanding both traditional agricultural and mineral exports, and
developing new markets for elaborately transformed manufactures, ETMs, and services.
Agricultural Exports
Rapid population growth and fiscal pressures limiting the capacity of governments to expand domestic
agricultural subsidies should expand bulk wheat, sugar, live sheep and frozen meat imports. With
local incomes rising and air links improving, prospects also are good for higher value fresh and
processed food exports, including dairy products, inputs for the processed food industry, and
convenience and snack products.
Minerals and Energy
Major projects like the Dolphin gas pipeline should stimulate the Gulf’s heavy industry development,
boosting demand for Australian alumina and steel making resources. Further expansion of these
heavy industries could stimulate Gulf interest in investing in Australian mineral sectors.
ETMs
Australian ETM exports to the Gulf, particularly cars, telecommunications equipment, construction
materials and medicinal and pharmaceutical products are booming. While the headquarters of
multinational car producers determine sourcing, Australian cars suit Gulf conditions and Australian
manufacturers should have assured themselves a future share in these markets. The small industrial
base of most Gulf economies means most Australian ETMs which are competitive in Australia, can
be sold in the region, if they are well marketed.
Services
Excellent opportunities also exist for service exports, including infrastructure provision, education,
tourism, construction, mining, financial and business services. Australian utilities are exploring
opportunities as Gulf governments gradually privatise their power and water sectors. Youthful Gulf
populations (two thirds are aged under 25 years) present major opportunities for in-country and
Australian provided educational services; Australian institutions are exploring these opportunities.

I m p l i c a t i o n s
P A G E 143
Gulf nationals’ tourism to Australia is strengthening, albeit from a low base; this potentially lucrative
market is undeveloped as the Australian tourism industry has paid relatively little attention to it.
Several major Australian construction firms operate successfully in the Gulf, mainly in the UAE.
Numerous financial business and service providers also are present in the UAE and Bahrain.
Investment in the Gulf
Over the next decade, Australia’s small but diverse investment presence in the Gulf, currently focused
mostly on UAE manufacturing and services, and regional petroleum and gas sectors, could expand
profitably into infrastructure, mining, manufacturing, finance, tourism, transport and business services
throughout the region. The April 2000 Saudi decision to open its industrial sector to full foreign ownership
and make tax concessions and concessional finance available to fully foreign owned firms should
encourage other Gulf governments to liberalise their investment regimes. Over the next decade,
Iran’s foreign investment regime also should open slowly.
Chambers of Commerce
With the close linkages between government and chambers of commerce in Gulf economies,
major Australian companies expanding their interest in the Gulf would benefit from more active
involvement in the Australia Arab Chamber of Commerce. Their involvement also would help raise
the status of the chamber.
IMPLICATIONS FOR GOVERNMENT
As Gulf governments take an active role in economic activity and development, strong Australian-
Gulf state governmental relations open doors for Australian business.
Government Delegations
Australian governments can help raise Australia’s trade and investment presence in the Gulf economies
by continuing to encourage and lead high level business missions to the Gulf region. The large
business delegation Trade Minister Vaile led to Bahrain, Saudi Arabia, Kuwait and the UAE in February
and March 2000 raised Australia’s profile with major Gulf governments and helped generate
opportunities for Australian business people on the mission. Similarly, Foreign Minister Downer’s
visit to Tehran in July 2000, where he met the President, the Foreign Minister and the Minister for
Petroleum, boosted the prospects of Australian resource companies interested in investing in Iran’s
oil, gas and minerals sectors; authorities in Iran evaluate major business opportunities in the context
of political relations and the level of inter-governmental engagement.
However, to ensure each delegation achieves its full potential and avoid poor sequencing or timing,
municipal, state and federal government business delegations should coordinate their activities.

A C C E S S I N G T H E M I D D L E E A S T
B U S I N E S S O P P O R T U N I T I E S I N T H E A R A B I A N P E N I N S U L A A N D I R A N
P A G E 144
Government Resources
Increasing trade flows mean the Department of Foreign Affairs and Trade and Austrade constantly
monitor the appropriateness of their regional resources. Consequently, Australia’s Abu Dhabi embassy
soon will be accredited to Qatar.
Australian Government assistance is most important in enhancing education service exports and
tourism prospects.
Education
Because of their traditional reliance on US and European educational institutions, generally, few Gulf
students consider studying in Australia. However, Australia’s relatively safe social environment, with
lower cost but high quality educational institutions, provides potential to expand Australian education
service exports to the Gulf economies.
Currently Australian posts and education offices in the Gulf region lack Australian based or Australian
educated advisers who could assist students or parents with their inquires. Installing such officers is
an important pre-requisite to expanding this potentially significant market; such resources should be
maintained while demand justifies them. Improved visa issuance processes also would be helpful.
Tourism
Rapid growth in the numbers of Gulf tourists visiting Australia is mainly a result of personal
recommendations and increased capacity from Emirates Airlines and Gulf Air. The Australian Tourism
Commission coordinates promotion of Australian tourism in the Gulf. Most recently, in May 2000, a
range of Australian exhibitors joined it at the Arab world’s largest travel show in Dubai. It then led a
roadshow to Abu Dhabi, Muscat, Bahrain, Kuwait, Riyadh and Jeddah to increase retail agents’
awareness of Australia. Continuing efforts to promote Australia as a tourist destination will be valuable.
Cumbersome visa processes constrain trade and faster visa turnaround times would promote tourism.
Increased tourism also is the key to increasing Gulf investment in Australia, educational exports and
trade generally, as Gulf nationals gain familiarity with what Australia can offer.
Investment in Australia
Gulf investment in Australia centres on agriculture and the Australian hospitality industry, including
tourism infrastructure, although more diverse investment, including in resources, is likely to follow.
Australia’s relatively low share of Gulf foreign investment creates considerable potential for increases.
Already, the Gold Coast is an increasingly popular tourist destination for Gulf nationals, and becoming
a focus of investment.

I m p l i c a t i o n s
P A G E 145
Air Links
Further expanding air links by Australian, Gulf or third party carriers is essential to underpin the
growing trade, tourism and investment relationship between Australia and the Gulf region. Both
Emirates and Gulf Air recently expanded their routes from Australia to the Gulf, but further expansion
is desirable. Non-stop flights could expand trade opportunities as Australian fresh food exports would
not then have to compete with computer parts loaded in Singapore. Emirates Airlines plans to offer
some non-stop services from 2003.
Prospects
With oil prices buoyant and Gulf economies embracing reform, the Australian currency priced
competitively and air links expanding, Australian trade and investment prospects in the Gulf appear
bright. Over the coming decade, the UAE’s rapid growth as a regional and continental hub, increasing
integration within the Arabian Peninsula, ongoing Saudi reforms and Iran’s slow opening will boost
the attractiveness of the increasingly dynamic Gulf market.

A C C E S S I N G T H E M I D D L E E A S T
B U S I N E S S O P P O R T U N I T I E S I N T H E A R A B I A N P E N I N S U L A A N D I R A N
P A G E 146
REFERENCES
Gulf Business, 1999, ‘Iranian Sanctions Crumble’, Vol. 4, No. 2, June, www.gulfbusiness.com/cgi-
local/index.cgi, accessed on 22 August 2000.

I n f o r m a t i o n f o r C o m p a n i e s
P A G E 147
CONTACTS IN THE ARABIAN
PENINSULA AND IRAN
Australian Government
Representatives
Australian Embassy Riyadh, Saudi Arabia
Diplomatic Quarter
Riyadh
Kingdom of Saudi Arabia
Tel: (966 1) 488 7788
Fax: (966 1) 488 7973
Also accredited to Bahrain, Kuwait,
Oman and Yemen
Austrade Riyadh
c/-Australian Embassy
Tel: (966 1) 488 7788
Fax: (966 1) 488 7458
Australian Embassy Abu Dhabi, UAE
14th Floor
Al Muhairy Centre
Sheikh Zayed the First Street
Abu Dhabi
United Arab Emirates
Tel: (971 2) 634 6100
Fax: (971 2) 639 3525
From October 2000, accredited to Qatar
Austrade Dubai
Australian Consulate-General Dubai
6th Floor
Dubai World Trade Centre
Dubai United Arab Emirates
Tel: (971 4) 313 444
Fax: (971 4) 314 812
Australian Embassy Tehran, Iran
No. 13, 23rd Street
Khalid Islambuli Avenue
Tehran 15138
Islamic Republic of Iran
Tel: (98 21) 872 4456
Fax: (98 21) 872 0484
Austrade Tehran
c/- Australian Embassy
Tel: (98 21) 872 0472
Fax: (98 21) 872 0490
State Government
Representatives
Victorian Government Business Office
Dubai World Trade Centre
PO Box 9412
Dubai
United Arab Emirates
Tel: (971 4) 332 1898
Fax: (971 4) 332 8600
www.business.vic.gov.au
Chambers of Commerce
GCC
Federation of GCC Chambers
PO Box 2198
Dammam 31451
Saudi Arabia
Tel: (966 3) 826 5943 / 3792
Fax: (966 3) 826 6794
Email: fgccc@Zajilnet
INFORMATION FOR COMPANIES

A C C E S S I N G T H E M I D D L E E A S T
B U S I N E S S O P P O R T U N I T I E S I N T H E A R A B I A N P E N I N S U L A A N D I R A N
P A G E 148
UAE
Abu Dhabi Chamber of Commerce and Industry
PO Box 662
Abu Dhabi
United Arab Emirates
Tel: (971 5) 214 000
Fax: (971 5) 215 867
www.adcci-uae.com
Dubai Chamber of Commerce and Industry
PO Box 1457
Dubai
United Arab Emirates
Tel: (971 4) 228 0000
Fax: (971 4) 221 1646
Email: [email protected]
www.dcci.org
Sharjah Chamber of Commerce and Industry
PO Box 580
Sharjah
United Arab Emirates
Tel: (971 6) 541 444
Fax: (971 6) 541 119
Iran
Iran Chamber of Commerce, Industry and Mines
254, Taleghani Avenue
15814 Tehran
Islamic Republic of Iran
Tel: (98 21) 884 6031
Fax: (98 21) 882 5111
www.iccim.org
Kuwait
Kuwait Chamber of Commerce and Industry
PO Box 775 Safat
13008 Kuwait
Kuwait
Tel: (965) 243 5801
Fax: (965) 240 4110
Oman
Oman Chamber of Commerce and Industry
Sheikh Salim bin Hilal Al-Khalili, President
PO Box 1400 Ruwi
Postal Code 112
Sultanate of Oman
Tel: (968) 707 674 / 84 / 94
Fax: (968) 708 497
Bahrain
Bahrain Chamber of Commerce and Industry
PO Box 248
Manama
Bahrain
Tel: (973) 229 555
Fax: (973) 241 294, 224 985, 212 937
Qatar
Qatar Chamber of Commerce and Industry
PO Box 402,
Doha
State of Qatar
Tel: (974) 621 491
Fax: (974) 621 131
Saudi Arabia
Council of Saudi Chambers of Commerce
and Industry
PO Box 16683
Riyadh 11474,
Saudi Arabia
Tel: (966 1) 405 3200
Fax: (966 1) 402 4747
Riyadh Chamber of Commerce and Industry
PO Box 596
Riyadh 11421
Saudi Arabia
Tel: (966 1) 404 0044
Fax: (966 1) 402 1103
Jeddah Chamber of Commerce and Industry
PO Box 1264
Jeddah 21431
Saudi Arabia
Tel: (966 2) 651 5111
Fax: (966 2) 651 7373

I n f o r m a t i o n f o r C o m p a n i e s
P A G E 149
Yemen
Sanaa Chamber of Commerce and Industry
PO Box 195,
Sanaa
Republic of Yemen
Tel: (967 1) 234 761 / 2 / 3 / 4
Fax: (967 1) 232 412
Legal Contacts
The UK law firm, Trowers & Hamlins
provided the information on legal issues
contained in this report. Trowers & Hamlins
maintains a network of offices and
representatives across the region
Bahrain
Trowers & Hamlins
9th Floor
The Tower
Sheraton Commercial Complex
PO Box 3012
Manama
Bahrain
Tel: (973 5) 300 82
Fax: (973 5) 356 16
Email: [email protected]
www.trowers.com
Iran
International Law Office
Dr Behrooz Akhlaghi & Associates
17 Fourth Street
Ahmad Ghassir Ave (formerly Bukharest Ave)
PO Box 15745/759
Tehran 15146
Islamic Republic of Iran
Tel: (98 21) 873 6611 / 873 2138
874 8606 / 875 6341
Fax: (98 21) 873 4129 / 875 6342
Email: [email protected]
www.intlaw.win.net
Kuwait
The Law Bureau: Ali Radwan & Partners
Salhiya Complex, Gate 8, 4th Floor
PO Box 2578
Safat – 13026, Kuwait
Tel: (965 2) 447 447 / 412 812
Fax: (965 2) 424 372
Oman
Trowers & Hamlins
Al Mawarid House
Muttrah Business District
PO Box 2991
Ruwi 112
Muscat
Sultanate of Oman
Tel: (968) 771 5500
Fax: (968) 771 5544
Email: [email protected]/oman@ trowers.com
www.trowers.com
Qatar
Hassan A Al Khater Law Office
Advocates & Legal Consultants
2nd Floor, Qatar Cinema Company Building
Gulf Cinema Roundabout, C Ring Road
PO Box 1737
Doha
Qatar
Tel: (974) 443 7770
Fax: (974) 443 7772
Saudi Arabia
The Alliance
PO Box 6387
Jeddah 21442
Tel: (966) 650 4475
Fax: (966) 657 2007
www.saudilaw.de

A C C E S S I N G T H E M I D D L E E A S T
B U S I N E S S O P P O R T U N I T I E S I N T H E A R A B I A N P E N I N S U L A A N D I R A N
P A G E 150
United Arab Emirates
Trowers & Hamlins
PO Box 45628
4th Floor, Butti Al Otaiba Building
Khalifa Street
Abu Dhabi
Tel: (971 2) 626 7274
Fax: (971 2) 626 7276
Email: [email protected]
www.trowers.com
Trowers & Hamlins
7th Floor
Rais Hassan Saadi Building
PO Box 23092
Dubai
Tel: (971 4) 3519 201
Fax: (971 4) 3519 205
Email: [email protected]
www.trowers.com
Yemen
Dr A M A Maktari
PO Box 111
Sana’a
Republic of Yemen
Tel: (967 1) 248 018 / 206 954
Fax: (967 1) 265 320
Business Contacts and
Associations
Australian Business in the Gulf, ABIG
PO Box 20183
Dubai
United Arab Emirates
Tel: (971 4) 265 2781
Fax: (971 4) 222 3246
Email: [email protected]
Iran Australia Joint Chamber of Commerce
254, Taleghani Avenue
Tehran 15814
Iran
Tel: (98 21) 884 6031
Fax: (98 21) 882 5111
Free Trade Zones and
Investment Promotion Agencies
Jebel Ali Free Zone Authority
PO Box 17000
Jebel Ali
Dubai
United Arab Emirates
Tel: (971 4) 881 5000
Fax: (971 4) 881 5001
Dubai Ports Authority
PO Box 2149
Dubai
United Arab Emirates
Tel: (971 4) 511 600
www.dpa.co.ae
Dubai Airport Free Zone
PO Box 2525
Dubai
United Arab Emirates
Tel: (971 4) 206 1111
Fax: (971 4) 244 399
Sharjah Airport International Free Zone
PO Box 8000
Sharjah
United Arab Emirates
Tel: (971 6) 557 0000
Fax: (971 6) 557 1010
Email: [email protected]
www.saif-zone.com
I n f o r m a t i o n f o r C o m p a n i e s
P A G E 151
Hamriyah Free Zone
PO Box 1377,
Sharjah
United Arab Emirates
Tel: (971 6) 526 3333
Fax: (971 6) 526 3444
Email: [email protected]
www.hamriyah.com
Iran High Council of Free Trade and Industrial
Zones
23 Esfandiar Boulevard
Africa Expressway (formerly Jordan Street)
Tehran
Iran
Tel: (98 21) 205 4960 - 205 4784
Fax: (98 21) 205 8657
Email: [email protected]
Oman Centre for Investment Promotion and
Export Development
PO Box 25
Wadi al-Kabir 117
Muscat
Sultanate of Oman
Tel: (968) 771 2344
Fax: (968) 771 0890
www.ociped.com
Kuwait Free Trade Zone
PO Box 64585 Shuwaikh
B-Postal Code 70456 Kuwait
Kuwait
Tel: (965) 802808
Fax: (965) 4822067
Email: [email protected]
www.kuwaitfreezone.com/english/index.html
Kuwait Investment Authority
PO Box 64, 13001
Safat
Kuwait
Tel: (965) 243 5801
Fax: (965) 240 4110
www.kia.gov.kw
Yeminvest
PO Box 4165,
Crater- Aden
Republic of Yemen
Tel: (967 2) 234 871 / 6 or 234 789
Fax: (967 2) 234 790 or 234 880
General Investment Authority of Yemen
PO Box 19022,
Sanaa
Republic of Yemen
Tel: (967 1) 262 958
Fax: (967 1) 262 964
Email: [email protected]
CONTACTS IN AUSTRALIA
Diplomatic Missions and
Commercial Offices
Royal Embassy of Saudi Arabia
38 Guilfoyle Street
Yarralumla ACT 2600
Tel: (02) 6282 6999
Fax: (02) 6282 8911
Embassy of the Islamic Republic of Iran
25 Culgoa Circuit
O’Malley ACT 2606
Tel: (02) 6290 2427
Fax: (02) 6290 2431
Embassy of the United Arab Emirates
36 Culgoa Circuit
O’Malley ACT 2606
Tel: (02) 6286 8802
Fax: (02) 6286 8804
Office of Dubai Department of Business and
Commerce Marketing
Level 7, 210 Clarence Street
Sydney NSW 2000
Tel: (02) 9267 7871
Fax: (02) 9283 1202
Email: [email protected]
www.dubaitourism.co.ae
A C C E S S I N G T H E M I D D L E E A S T
B U S I N E S S O P P O R T U N I T I E S I N T H E A R A B I A N P E N I N S U L A A N D I R A N
P A G E 152
Arabian Peninsula Government
Representatives in Asia-Pacific
Note: Kuwait, Bahrain, Oman, Qatar and
Yemen Kuwait do not maintain embassies in
Australia.
Embassy of the State of Kuwait
4-13-12 Mita
Minato-ku, Tokyo 108-0073
Japan
Tel: (81 3) 3455 0361
Fax: (81 3) 3456 6290
Embassy of the Sultanate of Oman
2-28-11, Sendagaya, Shibuya-ku
Tokyo 151-0051
Japan
Tel: (81 3) 3402 0877
Fax: (81 3) 3404 1334
Embassy of the State of Qatar
2-3-28, Moto-Azabu
Minato-ku Tokyo 106-0046
Japan
Tel: (81 3) 5475 0611
Fax: (81 3) 5475 0617
Embassy of the Republic of Yemen
No 38 Kowa Boulevard
4-12-24 Nishi Azabu, Minato-ku
Tokyo 106-0031
Japan
Tel: (81 3) 3499 7151
Fax: (81 3) 3499 4577
Australian Government
Organisations
Department of Foreign Affairs and Trade
Middle East Section
RG Casey Building
John McEwen Crescent
Barton ACT 0221
Tel: (02) 6261 1111
Fax: (02) 6261 3111
www.dfat.gov.au
Austrade (Canberra Office)
Middle East and Indian Ocean Office
RG Casey Building
John McEwen Crescent
BARTON ACT 0221
Tel: (02) 6201 7611
Fax: (02) 6201 7305
www.austrade.gov.au
Austrade (Head Office, Sydney)
22nd Floor, AIDC Tower
201 Kent Street
Sydney NSW 2000
Export Hotline: 13 28 78
Tel: (02) 9390 2000
Fax: (02) 9390 2922
www.austrade.gov.au
Chambers of Commerce and
Business Councils
Australia-Arab Chamber of Commerce and
Industry Inc
PO Box E14
Kingston ACT 2604
Tel: (02) 6270 8037
Fax: (02) 6273 3196
Australia Iran Chamber of Commerce
Industry and Mines
Commerce House
Barton ACT 2600
Tel (02) 6273 2311
Fax: (02) 6273 3196
The Australia Middle East Defence Export
Council
PO Box 77
West Lindfield NSW 2070
Tel: (02) 9499 4020
Fax: (02) 9499 4021

I n d e x
P A G E 153
INDEX
A
abattoirs, 36
Abu Dhabi, see United Arab Emirates
Abu Dhabi Investment Authority, 54
accounting principles, 78–84
Acer, 103
advertising, 75
Afghanistan, 129
age structure of population, 10–11, 13, 39, 68, 71–72
agendas, attitudes to, 63
agents, 67–68, 135
agricultural products, 27–31, 34–40, 142
exports, 126
tariffs, 132
air services, 42, 45, 144–45
Al Mutawie General Trading Company, 68
alcoholic beverages, 35
aluminium and alumina, 27, 34–35, 40, 55, 102, 123
Aluminium Company of Bahrain, ALBA, 102
ammunition and firearms, 120
animal feed, 35, 119
animal oils and fats, 28–29, 35, 124
animals, 27–30, 35, 38
ANZ Investment Bank, 49
APEC, 113, 128
Arab culture, 61–63
Arab-Israeli relations, 74–75
arbitration, 65–66
Argentine, 38
Austanz International, 36, 68
Austrade, 56
Australia, 25–58, 113, 127
investment in, 54, 144
Australia-Arab Chamber of Commerce, 56, 74
Australia-Iran Chamber of Commerce, 56
Australian Business in the Gulf Group, 56
Australian Defence Industries, 42
Australians, attitudes to, 63
AWB Limited, 34, 38, 64
B
Bahrain, 2–3, 56
alumina, 15, 102
chamber of commerce, 74
demographics, 10–12, 73
economic performance, 4–7, 11
employment, 12, 73
exchange rate arrangements, 8–9
fiscal pressures, 17–18
foreign direct investment, 51, 90–92
legal environment, 66, 81, 135
oil, 15, 21
religion, 60
risk ratings, 70–71
services sector, 16
taxation, 71
Bahrain, trade with, 112–14, 123, 126, 128, 130, 137
agency requirements, 135
Australia’s merchandise exports to, 26, 30, 35, 38
government procurement policies, 136
oil reliance, 15, 125
tariffs, 133
visas, 76
banks and banking, 20, 48–49, 52, 72–73, 78–84
barley, 35
behaviour, modesty in, 62
Berri Limited, 40
BHP Engineering, 98
BHP Petroleum, 96
bonuses, for staff, 78–84
Borealis, 102
borders, 3
bovine meat, 29
BP Amoco, 97
British Petroleum, 95
budget surpluses/deficits, 17
building and construction, 41–42, 46–48, 93
bureaucratic culture, 74
business environment, 59–86
business links, 55–56
business services, 49, 53
C
Canada, 38, 127
capital expenditure, 17–19
capital gains tax, 78–84
cars, 27–32, 41
cereals and cereal preparations, 116–117, 119, 121
chambers of commerce, 56, 74
cheese, see dairy products
chemicals, 27–28, 30, 34, 93, 119
household, 118
chilled sheep-meat, 39
cinemas, 53
Clipsal, 103
clocks and industrial measuring equipment, 116, 118,
122–23
clothing, 116–18, 120
coal, 28–29
computers, 33, 49, 53, 104
confidential items, 27–30, 33–35
construction, 41–42, 46–48, 93
convenience foods, 39
copper, 33
copyright, 65, 131
corporate income tax, 78–84
courts, 65–66
cream, see dairy products

A C C E S S I N G T H E M I D D L E E A S T
B U S I N E S S O P P O R T U N I T I E S I N T H E A R A B I A N P E N I N S U L A A N D I R A N
P A G E 154
culture, 61–63
bureaucratic, 74
curd, see dairy products
current expenditure, 19
D
dairy products, 40, 117–18, 120, 122–24
from Australia, 27–30, 35
deadlines, attitudes to, 63
debt, 8
defence related equipment, 42–43, 120
deficits/surpluses, 17
demographics, 10–14, 37, 71–73
direct investment, 41, 50–54, 87–109, 143–44
local investment partners, 69
dismissal of staff, 78–84
dispute resolution, 65–66, 74
distribution sector, 103–04
Dolphin project, 96–97
downstream oil sector investment, 95–96
dress, modesty in, 62
drugs, see medicinal and pharmaceutical products
Dubai, see United Arab Emirates
Dubai Aluminium, 102
Dubai Tax Company, 41
E
economic performance, 4–8, 11–12
economic prospects, 1–23, 141–46
edible oils, 118, 121, 124
education services, 43–45, 144
eggs, 117–18, 120, 122–24
Elaborately Transformed Manufactures, 30–33, 41–43,
142
electrical machinery, 116–24
electrical switches and fuses, 33
electricity, 89, 98–99, 131
electronics, 103
Elenac, 102
Elf Aquitaine, 51, 96
embassies, 56, 76, 144
Emirates Airlines, 42
Emiratisation, 72
employment, 11–14, 72–73, 78–84
employment services, 53
energy industries, 14, 51, 96–98, 126, 142
see also oil
Enron, 96
equity markets, 20, 79–80
ETMs, 30–33, 41–43, 142
exchange rate arrangements, 8–9
expatriates, employment of, 13, 72–73
expenditure, 17–19
explosives, 120
export marketing, 68
exports, 14–15, 112–15, 125–30, 137
to Australia, 54–55
external debt, 8
Exxon, 95
F
fabrics and textiles, 34, 116–18, 120–24
fats and oils, 28–29, 35, 118, 121, 124
Favell Favco, 47
feedstock, 35, 119
ferry services, 53
fertilisers, 54–55, 120
financial markets, 79–80
financial services, 20, 48–49, 52, 72–73
firearms and ammunition, 120
fiscal pressures, 17–20
floor coverings, 55
Food Equipment of Australia, 36
food and food processing, 16, 93, 116–24
from Australia, 27–30, 35, 39–40, 67
banned, 134
labelling, 74
see also agricultural products
foreign banks, 78–84
foreign debt, 8
foreign exchange, 8–9, 78–84
foreign investment, 41, 50–54, 87–109, 143–44
local investment partners, 69
foreign ownership, 78–84, 89–90, 94–95
foreign workers, 13, 72–73
Fortum Oyj, 97
France, 127, 137
free trade zones, 103–06
fresh vegetables, 28, 30, 35, 39, 121, 124
friendship in business relationships, 63
fruit, 39, 55, 121, 124
G
gas, 14, 51, 96–98, 126
Germany, 127, 137
gifts, 62
GMH Australia, 39, 41
gold, 27–28
government, implications for, 143–45
government procurement policies, 134, 136
grain, 34–38, 64
Greater Union, 53
gross domestic product (GDP), 4–6, 12
external debt as share of, 8
government budget balances as percentage of, 17
merchandise exports and imports, ratio to, 113
oil revenue as share of, 14–15
service sectors as share of, 16
gross fixed capital formation, FDI as percentage of, 91
gross national product (GNP), 5, 11
growth, 6, 11–12
in trade, 114–16
growth of population, 10–12, 36
Gulf Air, 45
H
health cover, of employees, 78–84
health insurance, 52
heating equipment, 120
I n d e x
P A G E 155
heavy manufacturing, 102–03
higher education, 43–45
history, 2–3, 61
home buyers, 48
honey, see sugar, molasses and honey
Hong Kong, 4–5, 129
honour, 62
horticultural industries, 28, 30, 35, 39, 55, 121, 124
hospitality, 62
hotels, 46, 72
hours of work, 78–84
household chemicals, 118
I
IBM, 104
illegal workforce, 13
immigrants, 56
imports, 16, 112–24, 127–28, 132–37
from Australia, 26–49
income tax, 78–84
Independent Corporate Solutions, 53
India, 127, 129, 137
Indonesia, 91
industrial measuring instruments and clocks, 116, 118,
122–23
industrial relations, 78–84
inflation, 7
information technology (computers), 33, 49, 53, 104
infrastructure, 19–20, 89, 98–101, 131
see also transport
inorganic chemicals, 30, 34, 55
insurance, 52
integration, 107
intellectual property law, 65, 131
Inter Search, 53
Internet City, 104
intra-regional trade, 128
investment, 41, 50–54, 87–109, 143–44
investment partners, 69
Iran, 2–3, 56
advertising, 75
culture, 61–63
demographics, 10–13
economic performance, 4–8, 11–12
employment, 11–13
exchange rate arrangements, 9
fiscal pressures, 17
foreign direct investment, 51, 90–94, 96, 98–100,
102, 104, 106, 107: Australian, 52–53
industry diversification, 14, 16
legal environment, 65, 80
oil, 14–15, 21, 93–94, 96
private finance, 20
religion, 60
risk ratings, 69–70
tourism, 16
United States sanctions on, 51, 107
visas, 76
Iran, trade with, 112–15, 119, 126, 128–29, 137
agency requirements, 135
Australia’s merchandise exports to, 26, 28–29,
33–34, 38, 64
barriers, 133–34
government procurement policies, 136
oil reliance, 14–15, 125–26
Iraq, 3, 38
iron and steel, 116–22, 124
from Australia, 27–30, 33–34, 41
to Australia, 55
irrigation systems, 36
Islam, 60–61
Islamic financing, 20
Islamic studies, 44
Israeli-Arab relations, 74–75
Italy, 127, 137
Itochu, 96
J
Japan, 127, 137
Japex, 95
Jebel Ali free trade zone, 105
joint ventures, 92–93, 102–03
juice products, 40
K
Korean Gas Corporation, 96
Kuwait, 2–3, 56
chamber of commerce, 74
defence offset program, 43
economic performance, 4–8, 12
employment, 12
exchange rate arrangements, 8–9
fiscal pressures, 17–18
foreign direct investment, 51–52, 90–92, 94, 98–100
legal environment, 66, 83, 131
oil, 15, 21, 94
population, 72–73
religion, 60
risk ratings, 69–70
visas, 76
Kuwait, trade with, 113–14, 120, 126, 129, 137
agency requirements, 135
Australia’s merchandise exports to, 26, 29–30, 32,
38, 42
government procurement policies, 136
market access, 130–32
oil reliance, 14–15, 125
L
labelling requirements, 74, 137
labour issues, 11–14, 72–73, 78–84
land ownership, 78–84
leave, 78–84
legal environment, 64–69, 74, 78–84, 89–90, 131, 137
leisure sector, 53
lighting equipment, 120
Lionweld Kennedy, 47
live sheep, 27–30, 35–36, 38
LNG, 126
local investment partners, 69

A C C E S S I N G T H E M I D D L E E A S T
B U S I N E S S O P P O R T U N I T I E S I N T H E A R A B I A N P E N I N S U L A A N D I R A N
P A G E 156
M
machinery, 29–30, 33, 93, 116–24
Maersk Sealand, 103
Malaysia, 70, 91
Mannsemann Demag, 103
manufactures, 27–33, 41–43
exports, 126: to Australia, 54–55
foreign direct investment, 52, 93, 102–03
imports, 116–24
tariffs, 132
market risk, 69–71
market size, 4–5
marketing, 68, 75
Marubeni, 96
meat, 27–30, 35, 39, 117–18
medical insurance, 52
medicinal and pharmaceutical products, 117–19
from Australia, 33, 42
labelling, 74
meetings, attitudes to, 63
Melbourne Institute of Asian Languages and Studies, 44
merchandise trade, 26–43, 113–37
milk, see dairy products
mining and mining products, 40–41, 98, 116–24, 142
from Australia, 27–29, 33–35
see also gas; oil
Mitsui, 96
Mobil, 95–96
modesty, 62
Morgan and Banks, 53
mortgage products, 48
motor vehicles, 27–32, 41
Multiplex Australia, 48
N
Nasa Multiplex, 48
natural gas, 14, 51, 96–98, 126
negotiation, 75
Netherlands, 137
Nissho Iwai, 96
nominal gross domestic product, 4
nominal gross national product per capita, 5
non-bovine meat, 27–28, 30
non-electrical machinery, 116–24
non-ferrous metals, 27, 117, 121
non-metallic minerals, 116, 122–23
non-monetary gold, 27–28
non-tariff barriers, 134
Novus Petroleum, 95–96
O
Occidental Petroleum, 95, 97
offset programs, 43
oil, 14–15, 125–26
exports to Australia, 55
foreign direct investment, 51, 93–96
imports, 124
prices, 106, 115
reserves, 20–21
oils and fats, 28–29, 35, 118, 121, 124
Oman, 2–3, 56
agriculture, 36
aluminium smelter, 40
demographics, 10, 13, 73
economic performance, 4–5, 7–8
electricity, 131
employment, 13, 72–73
exchange rate arrangements, 8–9
fiscal pressures, 17–18
foreign direct investment, 53, 88, 90–92, 95–103,
105, 131
hotels, 53, 72
industry diversification, 14, 16
legal environment, 66, 68, 82
oil, 15, 20–21, 95–97
risk ratings, 70–71
services sector, 16
telecommunications, 101, 131
visas, 76
WTO accession, 131
Oman, trade with, 113–15, 121, 126, 128–31, 137
agency requirements, 67, 135
Australia’s exports to, 26, 29–30, 32, 38–39
services, 44
government procurement policies, 136
oil reliance, 15, 125
tariffs, 133
Oracle, 104
overtime, 78–84
ownership, 78–84, 89–90, 94–95
P
Pacifica Group Limited, 47
Pakistan, 129
paper, 93, 119
Pardy and Sons, 39
patents and copyright, 65, 131
payroll tax, 78–84
Peachtree, 49
per capita GDP, 5
per capita GNP, 5, 11
Persians, see Iran
personal honour, 62
personal income tax, 78–84
petrochemicals, 93, 118–19, 102
exports to Australia, 55
imports, 123, 126: from Australia, 27–28, 30, 33–34
petroleum and petroleum products, see gas; oil
Petroleum Development Oman, 95
Petronas, 94
pharmaceuticals, see medicinal and pharmaceutical
products
Philippines, 4–5
pig iron, 29, 33–34
plastics, 33, 55, 123
plumbing, heating and lighting equipment, 120
point of sale tax, 78–84
population, 10–14, 36, 71–73
Port of Singapore Authority, 103

I n d e x
P A G E 157
ports, 103–04, 129–30
PPP GNP per capita, 5
prices, 7
oil, 106, 115
primary products, 27–31, 33–41
see also agricultural products; mining and mining
products
printing and publishing, 93
private finance, 20
processed food, see food
procurement policies, 134, 136
product standards, 137
prospects, 1–23, 141–46
pumps, 33
purchasing policies, 134, 136
purchasing power, 5
Q
Qatar, 2, 56
chamber of commerce, 74
demographics, 10–13, 72–73
economic performance, 4–8, 11–12
employment, 12–13
exchange rate arrangements, 8–9
fiscal pressures, 17–18
foreign direct investment, 51, 88, 90–92, 94, 96–99
legal environment, 67, 84, 131
oil, 14–15, 21, 51, 94
risk ratings, 70–71
shelf life requirements, 137
visas, 76
Qatar, trade with, 113–15, 122, 126, 128–31, 137
agency requirements, 135
Australia’s exports to, 26, 30, 38–39: services, 49
government procurement policies, 134, 136
oil reliance, 15, 125
tariffs, 132
Qatar General Petroleum Corporation, 96
Qatarisation, 72
Queensland Sugar Corporation, QSC, 34, 38
R
re-export centres, 129–30
real estate, 89
recruitment services, 53
regional integration, 107
regional re-export centres, 129–30
religion, 20, 44, 60–61
Republic of Korea, 70, 127–28
resins and plastics, 33, 55, 123
restaurant services, Oman, 72
revenue diversification efforts, 18
risk, 69–71
Royal Dutch Shell Group, 94
rubber manufactures, 124
Rydges, 53
S
SAGRIC, 53
sales tax, 78–84
San Remo Macaroni Company Limited, 67
Saudi Arabia, 2–3, 56
advertising, 75
agriculture, 36, 126
banks, 20, 49
chamber of commerce, 74
defence offset program, 43
demographics, 10–13, 73
economic performance, 4–8, 11–13
employment, 11–13, 72–73
exchange rate arrangements, 8–9
fiscal pressures, 17–19
foreign direct investment, 88–89, 91–94, 96–106:
Australian, 36, 52–53
legal environment, 65, 78
oil, 15, 21, 94, 96
processed food products, 40
religion, 60–61
risk ratings, 69–70
shelf life requirements, 137
taxes, 18, 132
visas, 76
Saudi Arabia, trade with, 112–15, 117, 126, 128–29, 132,
137
agency requirements, 135
Australia’s exports to, 26–27, 32, 34, 38, 39, 41:
services, 44, 49
government procurement policies, 136
oil reliance, 14–15, 125–26
prohibitions, 134
Saudi Arabian Basic Industries Corporation, 102
Saudi Telecommunications Company, 101
Saudiisation, 72
services, 16, 36, 43–49, 72, 142–44
user pays, 19
Sharia law, 64
sheep, 27–30, 35, 38
sheep-meat, 39
Shell, 51, 94–95
Shi’a Islam, 60
shipping, 103–04, 129–30
short term debt, 8
simply transformed manufactures, 31, 33–34
Singapore, 4–5, 91, 137
size of market, 4–5
Smorgon Cyclone, 36
snack foods, 39
social security/payroll tax, 78–84
Sony, 103
South Australian Government, 56
special economic zones, 106
special transactions, 123
specialised machinery, 29, 33
Spontech, 42
staff, 78–84
steel, see iron and steel

A C C E S S I N G T H E M I D D L E E A S T
B U S I N E S S O P P O R T U N I T I E S I N T H E A R A B I A N P E N I N S U L A A N D I R A N
P A G E 158
stock markets, 20, 79–80
strikes, 78–84
students, 43–45, 144
sugar, molasses and honey, 117, 124
from Australia, 27, 29, 34–35, 38
Sun Microsystems, 104
Sunni Islam, 60–61
surpluses/deficits, 17
T
tariff barriers, 132–33
taxes, 18, 71, 73, 78–84, 131–32
technical education, 44–45
telecommunications, 101, 104, 131
telecommunications equipment, 27, 33, 42
Tenix Defence Systems, 42
textiles and fabrics, 34, 116–18, 120–24
Thailand, 4–5, 70, 91
time, attitudes to, 63
tobacco, 121, 132
Total, 51, 94–96
tourism, 16, 45–46, 53, 144
Toyota Australia, 39, 41
trade, 16, 26–49, 54–55, 111–40
trade barriers, 132–34
trading partners, 127–29, 137
transport equipment, 30, 116–24
transport, 50–51, 72
air services, 42, 45, 144–45
ports, 103–04, 129–30
trust in business relationships, 63
U
unemployment, 11
unions, 78–84
United Arab Emirates, UAE, 3, 56
agriculture, 36, 126
air freight to, 42
chamber of commerce, 74
defence offset program, 43
demographics, 10–13, 72–73
economic performance, 4–8, 11–12
employment, 12–13, 72
exchange rate arrangements, 8–9
fiscal pressures, 17–18
foreign direct investment, 89, 91–93, 95–96, 98–
100, 102–05: Australian, 41, 50, 52–53
hotel construction, 46
industry diversification, 14–16
legal environment, 65, 67, 79, 131
oil, 15, 20–21, 95–96
risk ratings, 70–71
services sector, 16
shelf life requirements, 137
stock market, 20
taxation, 71
visas, 76
United Arab Emirates, UAE, trade with, 112–14, 118,
126, 128–30, 132, 137
agency requirements, 135
Australia’s exports to, 26–28, 32, 35, 38, 41–42:
services, 44, 47–48
government procurement policies, 136
oil reliance, 14–15, 125–26
prohibitions, 134
United Kingdom, 127, 137
United States of America, 127, 137
sanctions on Iran, 51, 107
university education, 43–45
University of Melbourne, 44
upstream oil sector, 94–95
user pays, 19
V
vegetable oil, 118, 124
vegetables, 28, 30, 35, 39, 121, 124
Victorian Government, 56
visas, 76
vocational (technical) education, 44–45
W
water infrastructure, 100–01
wheat, 34, 37–38, 64
wholesale sales tax, 78–84
wire products, 55
withholding tax, 78–84
Wollongong University, 44
women, 62, 75
wool, 29
workforce, 11–14, 72–73, 78–84
working hours, 78–84
World Trade Organization membership, 130–32
Y
Yemen, 2–3, 56
demographics, 10, 12
economic performance, 4–8, 12
employment, 12
exchange rate arrangements, 9
fiscal pressures, 17
foreign direct investment, 51, 90–92, 94–95, 100,
103–05
legal environment, 66
risk ratings, 69, 70
visas, 76
Yemen, trade with, 113–15, 124, 128, 130, 137
agency requirements, 135
Australia’s merchandise exports to, 26, 29–30, 38
oil exports, 125
prohibitions, 134
tariffs, 133
Z
zinc and alloys, 34

E A A U P u b l i c a t i o n s
P A G E 159
ALSO BY THE EAAU
Transforming Thailand: Choices for the New Millennium
Published June 2000 (ISBN 0 642 70469 4), 228 pages, A$33
Asia’s Financial Markets: Capitalising on Reform
Published November 1999 (ISBN 0 642 56561 9), 376 pages, A$35
Korea Rebuilds: From Crisis to Opportunity
Published May 1999 (ISBN 0 642 47624 1), 272 pages, A$30
Asia’s Infrastructure in the Crisis: Harnessing Private Enterprise
Published December 1998 (ISBN 0 642 50149 1), 250 pages, A$30
The Philippines: Beyond the Crisis
Published May 1998 (ISBN 0 642 30521 8), 328 pages, A$25
The New Aseans - Vietnam, Burma, Cambodia and Laos
Published June 1997 (ISBN 0642 27148 8), 380 pages, A$20
A New Japan? Change in Asia’s Megamarket
Published June 1997 (ISBN 0 642 27131 3), 512 pages, A$20
China Embraces the Market: Achievements, Constraints and Opportunities
Published April 1997 (ISBN 0 642 26952 1), 448 pages, A$20
Asia’s Global Powers: China-Japan Relations in the 21st Century
Published April 1996 (ISBN 0 642 24525 8), 158 pages, A$15
Pacific Russia: Risks and Rewards
Published April 1996 (ISBN 0 642 24521 5), 119 pages, A$15
Iron and Steel in China and Australia
Published November 1995 (ISBN 0 642 24404 9), 110 pages, A$15
Growth Triangles of South East Asia
Published November 1995 (ISBN 0 642 23571 6), 136 pages, only available online
Overseas Chinese Business Networks in Asia
Published August 1995 (ISBN 0 642 22960 0), 372 pages, A$20
Subsistence to Supermarket: Food and Agricultural Transformation in South-East Asia
Published August 1994 (ISBN 0 644 35093 8), 390 pages, A$15
Expanding Horizons: Australia and Indonesia into the 21st Century
Published June 1994 (ISBN 0 644 33514 9), 364 pages, A$15

A C C E S S I N G T H E M I D D L E E A S T
B U S I N E S S O P P O R T U N I T I E S I N T H E A R A B I A N P E N I N S U L A A N D I R A N
P A G E 160
India’s Economy at the Midnight Hour: Australia’s India Strategy
Published April 1994 (ISBN 0 644 33328 6), 260 pages, A$15
ASEAN Free Trade Area: Trading Bloc or Building Block?
Published April 1994 (ISBN 0 644 33325 1), 180 pages, A$15
Changing Tack: Australian Investment in South-East Asia
Published March 1994 (ISBN 0 644 33075 9), 110 pages, A$10
Australia’s Business Challenge: South-East Asia in the 1990s
Published December 1992 (ISBN 0 644 25852 7), 380 pages, A$15
Southern China in Transition
Published December 1992 (ISBN 0 644 25814 4), 150 pages, A$10
Grain in China
Published December 1992 (ISBN 0 644 25813 6), 150 pages, A$10
Korea to the Year 2000: Implications for Australia
Published November 1992 (ISBN 0 644 27819 5), 150 pages, A$10
Australia and North-East Asia in the 1990s: Accelerating Change
Published February 1992 (ISBN 0 644 24376 7), 318 pages, A$15
Prices cited are current discounted prices inclusive of GST
Forthcoming Reports (working titles only)
A New Indonesia: Opportunities and Risks, late 2000
India: Economic Reform and Opportunities, June 2001
Latin America: Trade and Investment Opportunities, April 2001
Corporate Governance in Asia: Progress and Problems, July 2001
Reports and full publications catalogues can be obtained from:
Jane Monico
Market Information and Analysis Unit
Department of Foreign Affairs and Trade
RG Casey Building, John McEwen Crescent
Barton ACT 0221, Australia
Telephone: 62 2 6261 3114 Facsimile: 61 2 6261 3321
Email: [email protected]
Internet: www.dfat.gov.au/eaau/
gives access to executive summaries, tables of contents,
many full reports, details of briefing papers and order forms