Embed Size (px)
Citation preview
Department of Geographic Information Science, African Regional Institute for Geospatial Information Science and Technology (AFRIGIST), formerly (RECTAS), off Road 1, Obafemi Awolowo University Campus, P. M. B. 5545, Ile-Ife, Osun State, Nigeria.
Deborah B. Alaigba and Osolase E. Ehiremen
➢Soil erosion is a worldwide phenomenon which ravages large areas of land particularly in high
rainfall (Murck et. al, 1996). Soil-gully erosion has been known as one of the major challenges to
global environmental and socio-economic sustainability (Noori et al., 2016).
➢Erosion has been described as a well-defined water worn channel (Monkhouse and Small,
1978) While, Gully erosion is an advanced stage of rill erosion where surface channels have
been eroded to the point where they cannot be smoothened over by normal tillage operations.
➢In Nigeria, the problem of gully erosion has formed a subject for serious consideration since
the early 1920s, The major environmental and ecological problems associated with Edo State, a
southern state in Nigeria; are waste management, pollution and sanitation, forest depletion,
flooding and erosion of the surface of the soil.
➢Recently, the introduction of Remote Sensing and GIS technologies and their
combination with the empirical models have made soil erosion monitoring
more efficient, effective, reliable, faster and easier with sustainable results and
low cost (Gelagaya and Minale, 2016; Noori et al., 2016).
➢The main objectives of the study are to assess sites vulnerable to gully erosion
based on multi-criteria evaluation (MCE) and Analytical Hierarchy Process
(AHP).
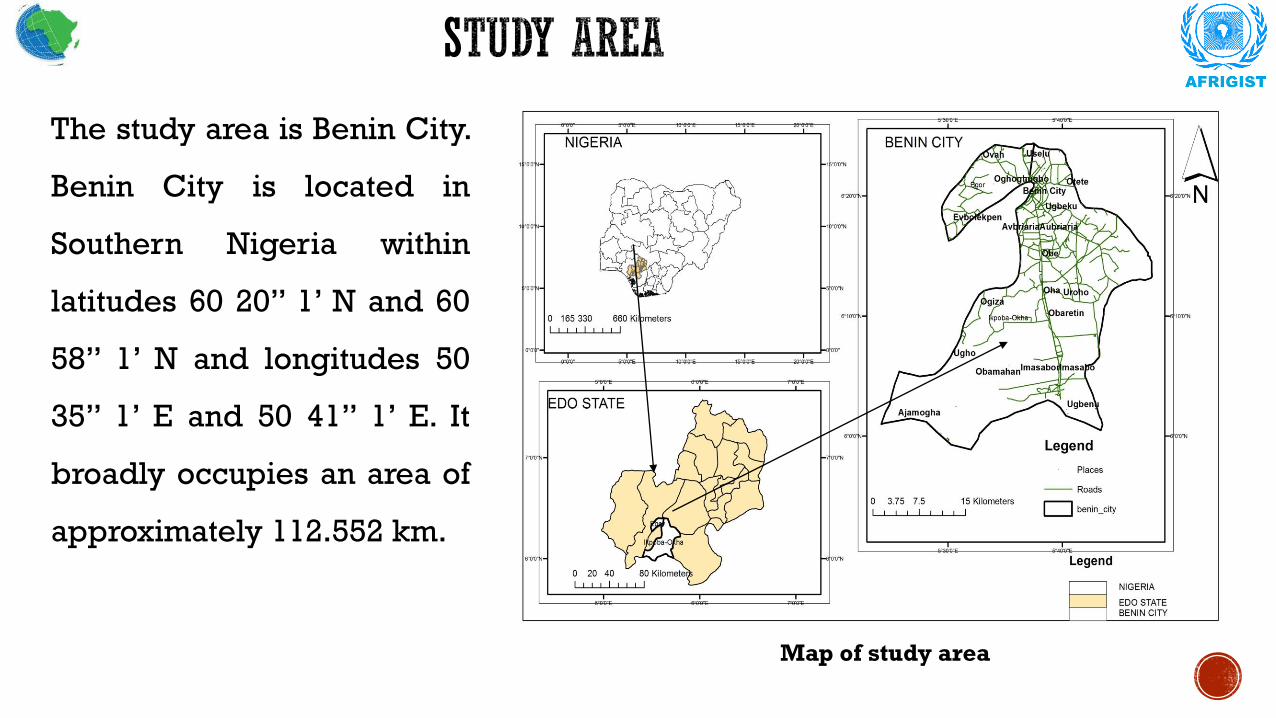
The study area is Benin City.
Benin City is located in
Southern Nigeria within
latitudes 60 20” 1’ N and 60
58” 1’ N and longitudes 50
35” 1’ E and 50 41” 1’ E. It
broadly occupies an area of
approximately 112.552 km.
Map of study area
➢SECONDARY SOURCE
Soil map, high-resolution imagery obtained from google
earth, Sentinel 1 data was downloaded and used for
lineament extraction in this study. Digital Elevation Model
(DEM) using SRTM was downloaded from Alos palsar for
the purpose of slope extraction. Landsat 8 OLI & TIRS was
downloaded from Global Land Cover Facility (GLCF) and
used in classifying Land use/Landcover (LULC). Snap
software was used to analyse the DEM and lineament
image, Pci geomatica was used to extract the lineament
fractures in the study area, Idrisi was used to create color
composites and classify the LULC of the area ArcMap was
used to digitize and also for the map layout production.
A hand-held GPS device,
questionnaire, Field observation,
interviews/interaction with
residence living close to the
gullies.
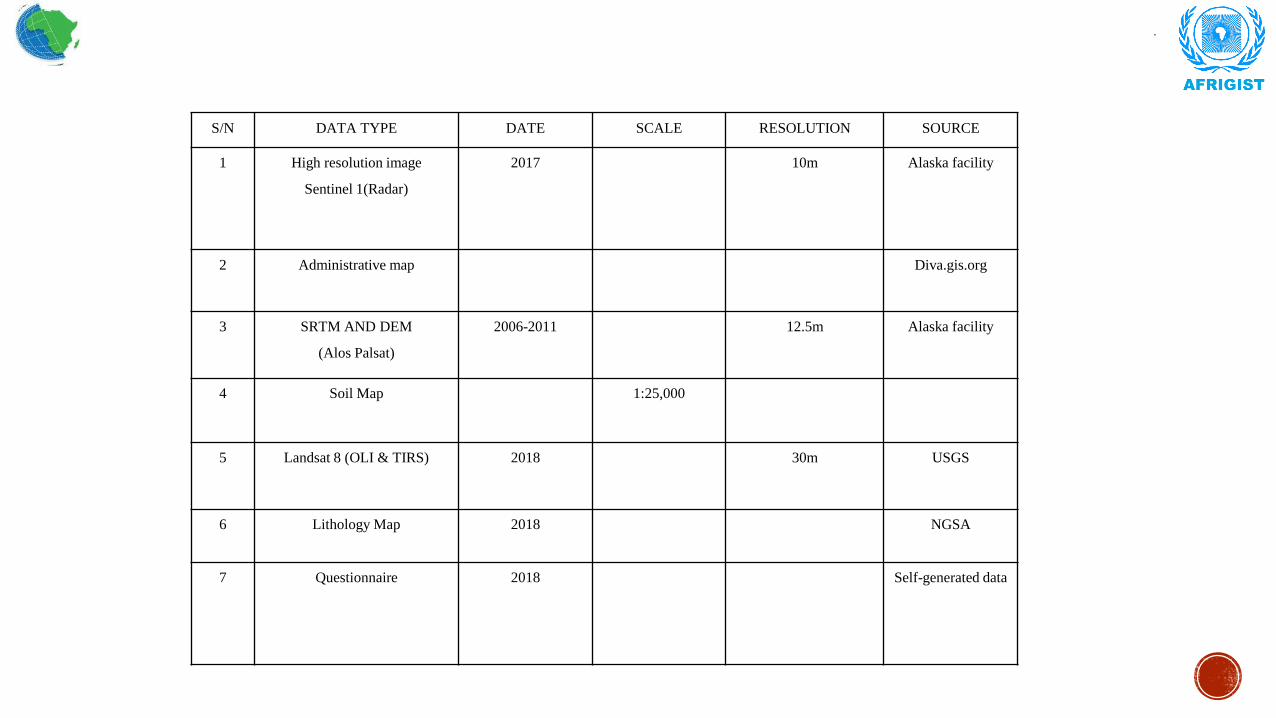
S/N DATA TYPE DATE SCALE RESOLUTION SOURCE
1 High resolution image
Sentinel 1(Radar)
2017 10m Alaska facility
2 Administrative map Diva.gis.org
3 SRTM AND DEM
(Alos Palsat)
2006-2011 12.5m Alaska facility
4 Soil Map 1:25,000
5 Landsat 8 (OLI & TIRS) 2018 30m USGS
6 Lithology Map 2018 NGSA
7 Questionnaire 2018 Self-generated data
➢The Analytic Hierarchy Process (AHP) is a decision approach designed to aid in the
solution of complex multiple criteria problems ( Ayalew et al. 2004).
➢AHP Pairwise Comparison Methods Approach using each sub-class of 3-ranking means
of decreasing order of impact (highly vulnerable, vulnerable and less vulnerable) was
used to determine risk factor using GIS methods. These factors include Slope, Drainage
density, Lineament, lithology, soil and land use/landcover.
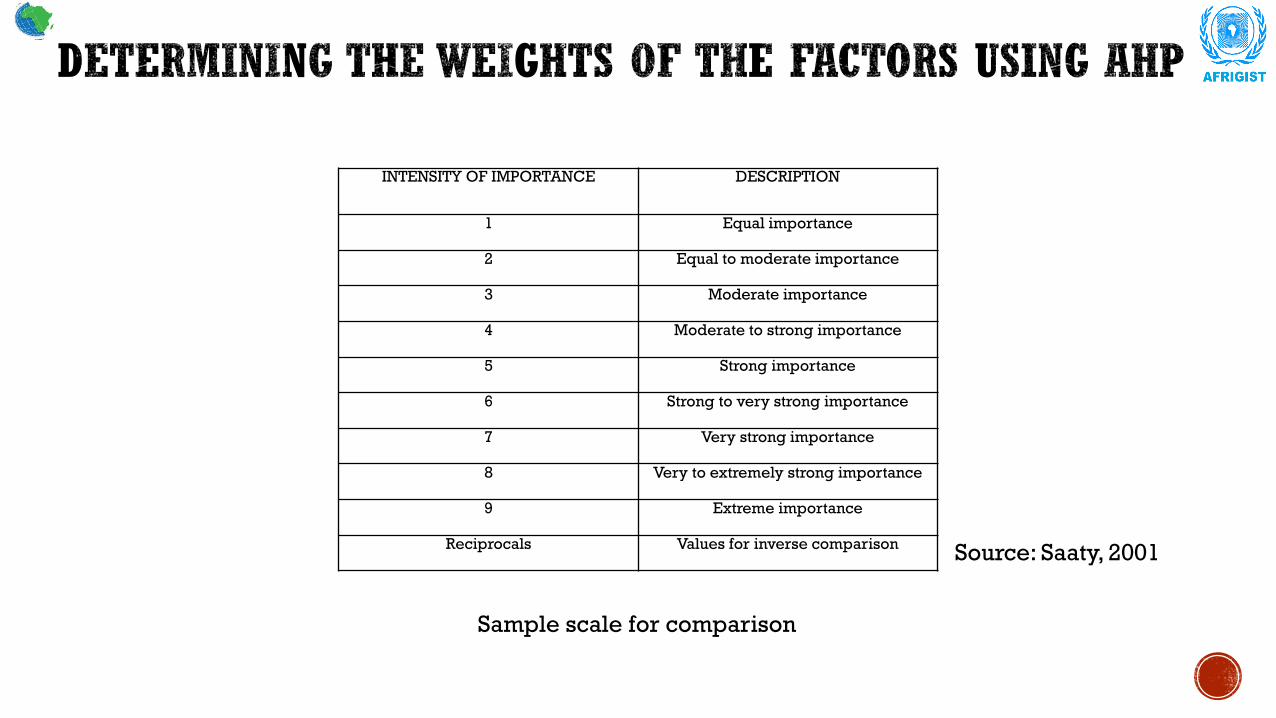
INTENSITY OF IMPORTANCE DESCRIPTION
1 Equal importance
2 Equal to moderate importance
3 Moderate importance
4 Moderate to strong importance
5 Strong importance
6 Strong to very strong importance
7 Very strong importance
8 Very to extremely strong importance
9 Extreme importance
Reciprocals Values for inverse comparisonSource: Saaty, 2001
Sample scale for comparison
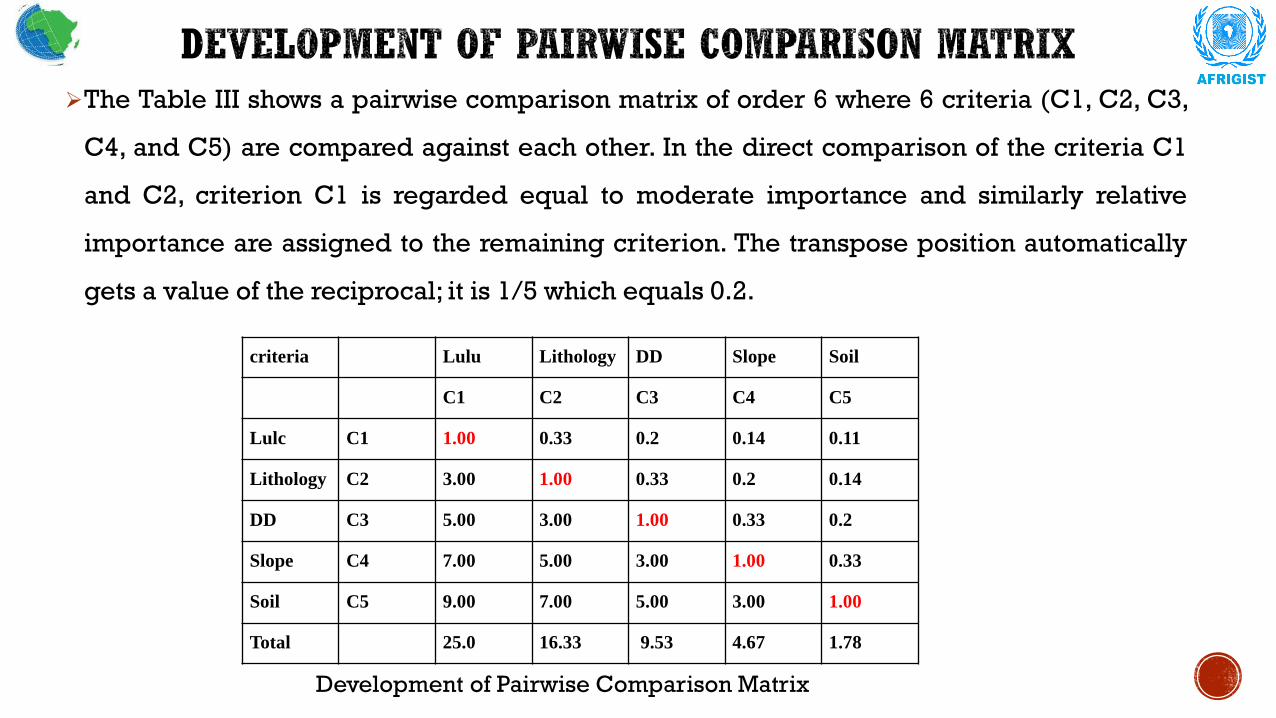
➢The Table III shows a pairwise comparison matrix of order 6 where 6 criteria (C1, C2, C3,
C4, and C5) are compared against each other. In the direct comparison of the criteria C1
and C2, criterion C1 is regarded equal to moderate importance and similarly relative
importance are assigned to the remaining criterion. The transpose position automatically
gets a value of the reciprocal; it is 1/5 which equals 0.2.
criteria Lulu Lithology DD Slope Soil
C1 C2 C3 C4 C5
Lulc C1 1.00 0.33 0.2 0.14 0.11
Lithology C2 3.00 1.00 0.33 0.2 0.14
DD C3 5.00 3.00 1.00 0.33 0.2
Slope C4 7.00 5.00 3.00 1.00 0.33
Soil C5 9.00 7.00 5.00 3.00 1.00
Total 25.0 16.33 9.53 4.67 1.78
Development of Pairwise Comparison Matrix
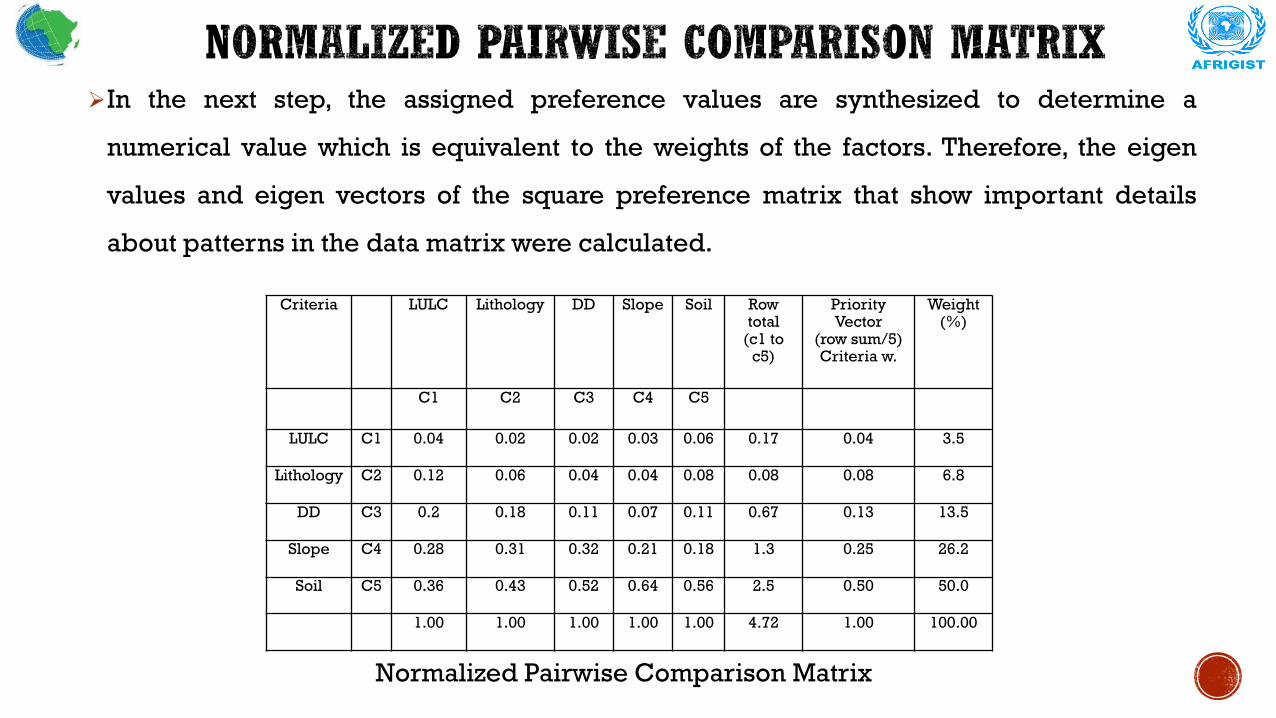
➢In the next step, the assigned preference values are synthesized to determine a
numerical value which is equivalent to the weights of the factors. Therefore, the eigen
values and eigen vectors of the square preference matrix that show important details
about patterns in the data matrix were calculated.
Criteria LULC Lithology DD Slope Soil Row total
(c1 to c5)
PriorityVector
(row sum/5)Criteria w.
Weight(%)
C1 C2 C3 C4 C5
LULC C1 0.04 0.02 0.02 0.03 0.06 0.17 0.04 3.5
Lithology C2 0.12 0.06 0.04 0.04 0.08 0.08 0.08 6.8
DD C3 0.2 0.18 0.11 0.07 0.11 0.67 0.13 13.5
Slope C4 0.28 0.31 0.32 0.21 0.18 1.3 0.25 26.2
Soil C5 0.36 0.43 0.52 0.64 0.56 2.5 0.50 50.0
1.00 1.00 1.00 1.00 1.00 4.72 1.00 100.00
Normalized Pairwise Comparison Matrix
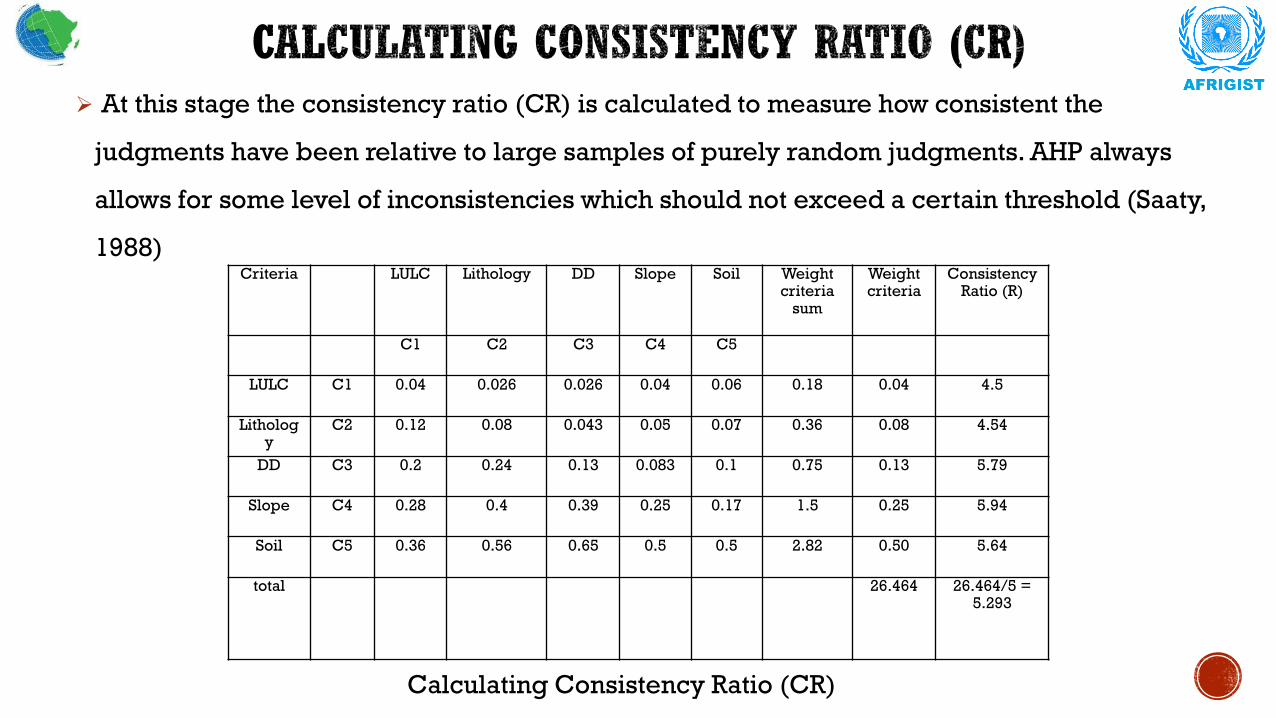
➢ At this stage the consistency ratio (CR) is calculated to measure how consistent the
judgments have been relative to large samples of purely random judgments. AHP always
allows for some level of inconsistencies which should not exceed a certain threshold (Saaty,
1988)Criteria LULC Lithology DD Slope Soil Weight
criteria sum
Weight criteria
ConsistencyRatio (R)
C1 C2 C3 C4 C5
LULC C1 0.04 0.026 0.026 0.04 0.06 0.18 0.04 4.5
Lithology
C2 0.12 0.08 0.043 0.05 0.07 0.36 0.08 4.54
DD C3 0.2 0.24 0.13 0.083 0.1 0.75 0.13 5.79
Slope C4 0.28 0.4 0.39 0.25 0.17 1.5 0.25 5.94
Soil C5 0.36 0.56 0.65 0.5 0.5 2.82 0.50 5.64
total 26.464 26.464/5 = 5.293
Calculating Consistency Ratio (CR)
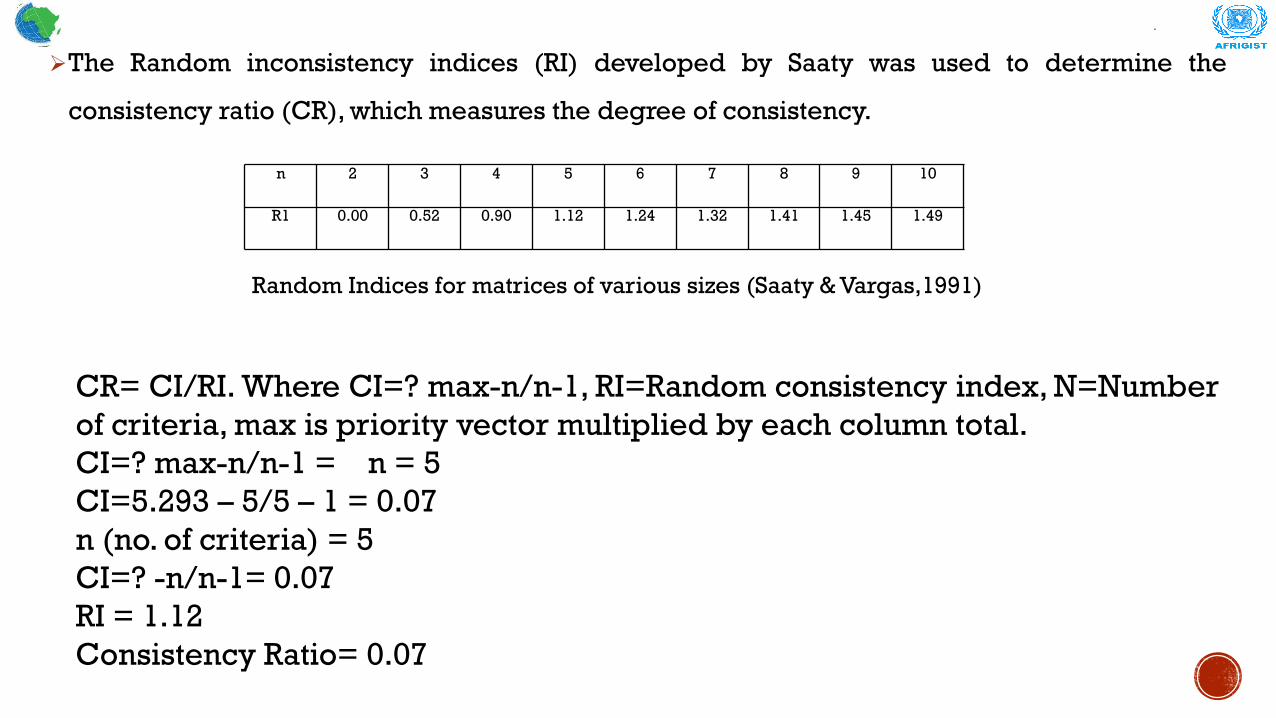
➢The Random inconsistency indices (RI) developed by Saaty was used to determine the
consistency ratio (CR), which measures the degree of consistency.
n 2 3 4 5 6 7 8 9 10
R1 0.00 0.52 0.90 1.12 1.24 1.32 1.41 1.45 1.49
Random Indices for matrices of various sizes (Saaty & Vargas,1991)
CR= CI/RI. Where CI=? max-n/n-1, RI=Random consistency index, N=Number
of criteria, max is priority vector multiplied by each column total.
CI=? max-n/n-1 = n = 5
CI=5.293 – 5/5 – 1 = 0.07
n (no. of criteria) = 5
CI=? -n/n-1= 0.07
RI = 1.12
Consistency Ratio= 0.07
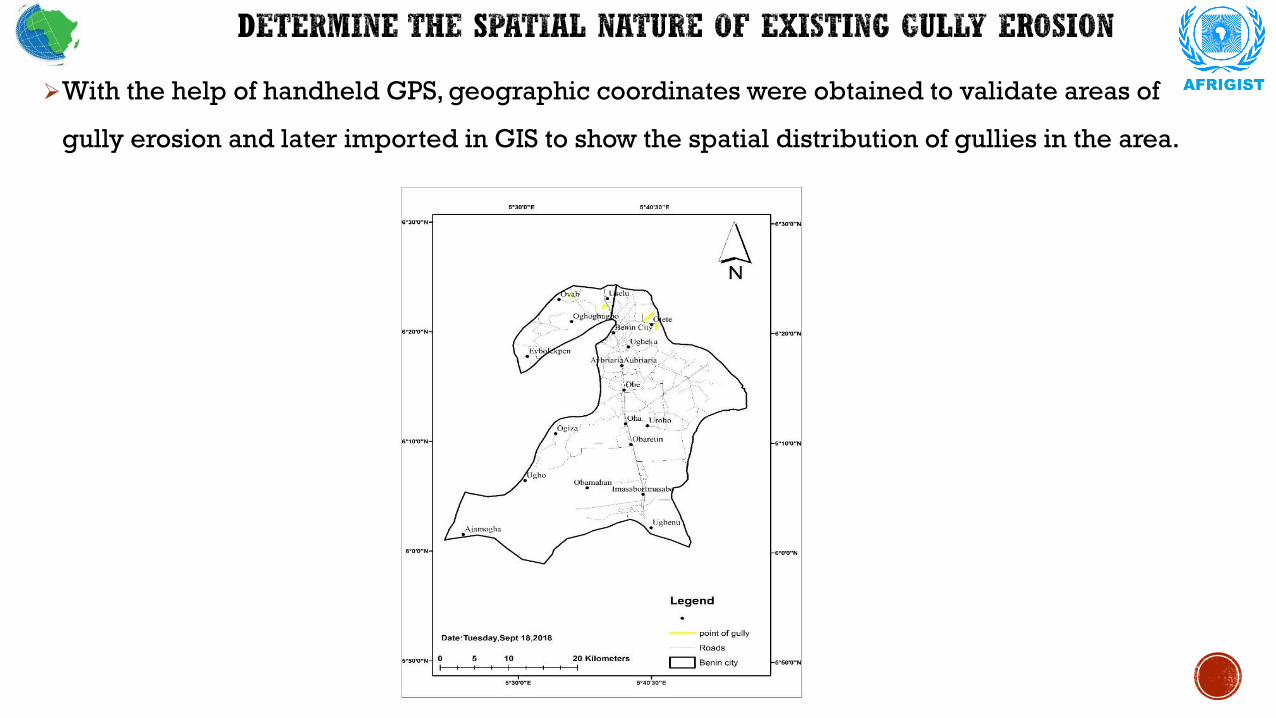
➢With the help of handheld GPS, geographic coordinates were obtained to validate areas of
gully erosion and later imported in GIS to show the spatial distribution of gullies in the area.
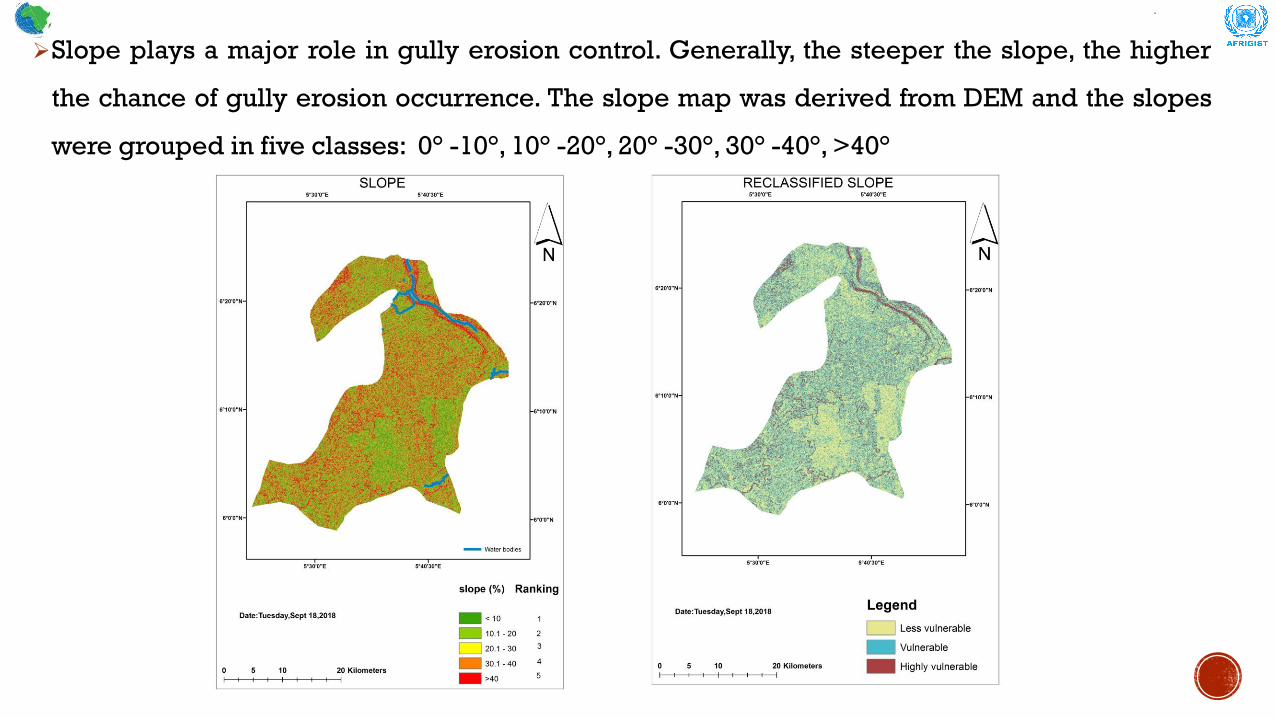
➢Slope plays a major role in gully erosion control. Generally, the steeper the slope, the higher
the chance of gully erosion occurrence. The slope map was derived from DEM and the slopes
were grouped in five classes: 0° -10°, 10° -20°, 20° -30°, 30° -40°, >40°
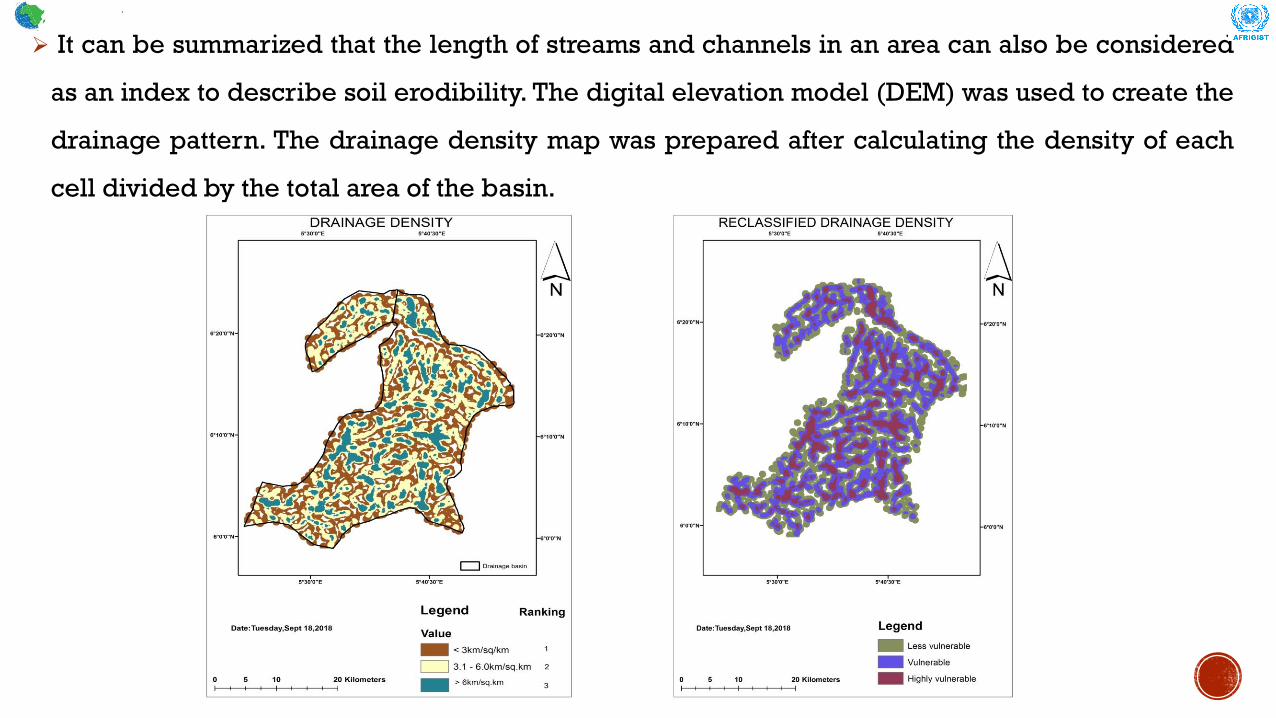
➢ It can be summarized that the length of streams and channels in an area can also be considered
as an index to describe soil erodibility. The digital elevation model (DEM) was used to create the
drainage pattern. The drainage density map was prepared after calculating the density of each
cell divided by the total area of the basin.
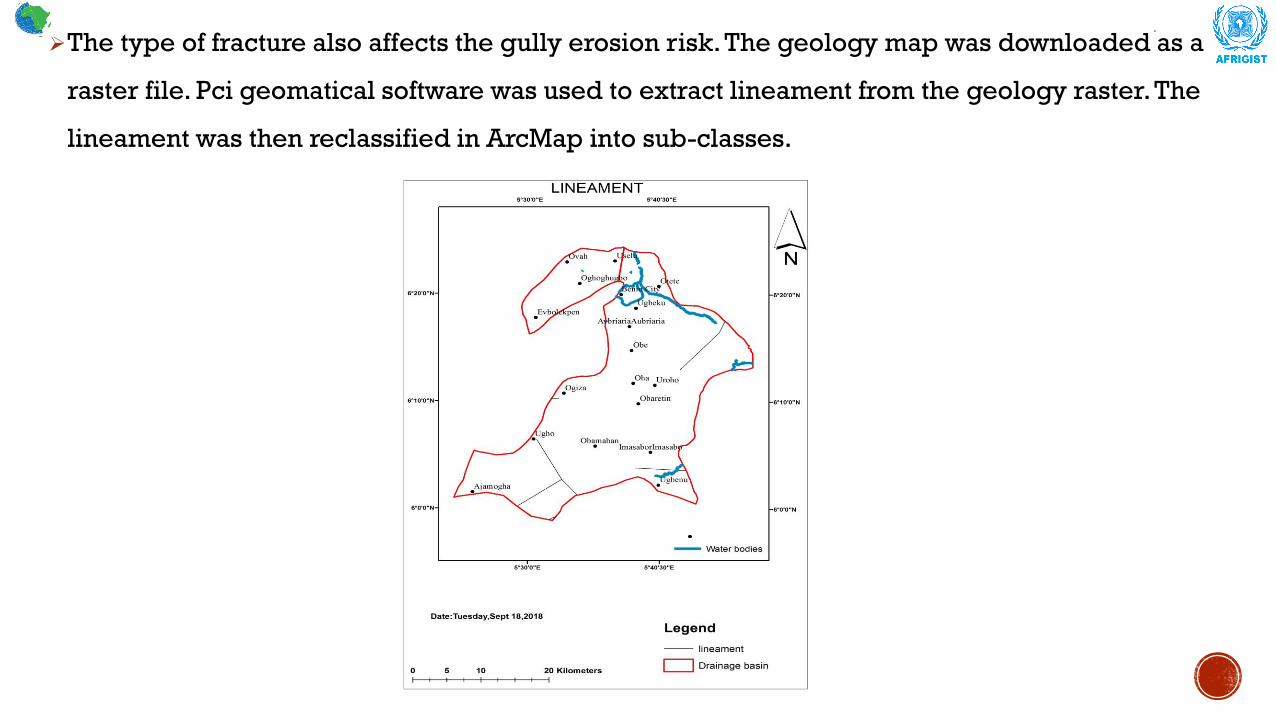
➢The type of fracture also affects the gully erosion risk. The geology map was downloaded as a
raster file. Pci geomatical software was used to extract lineament from the geology raster. The
lineament was then reclassified in ArcMap into sub-classes.
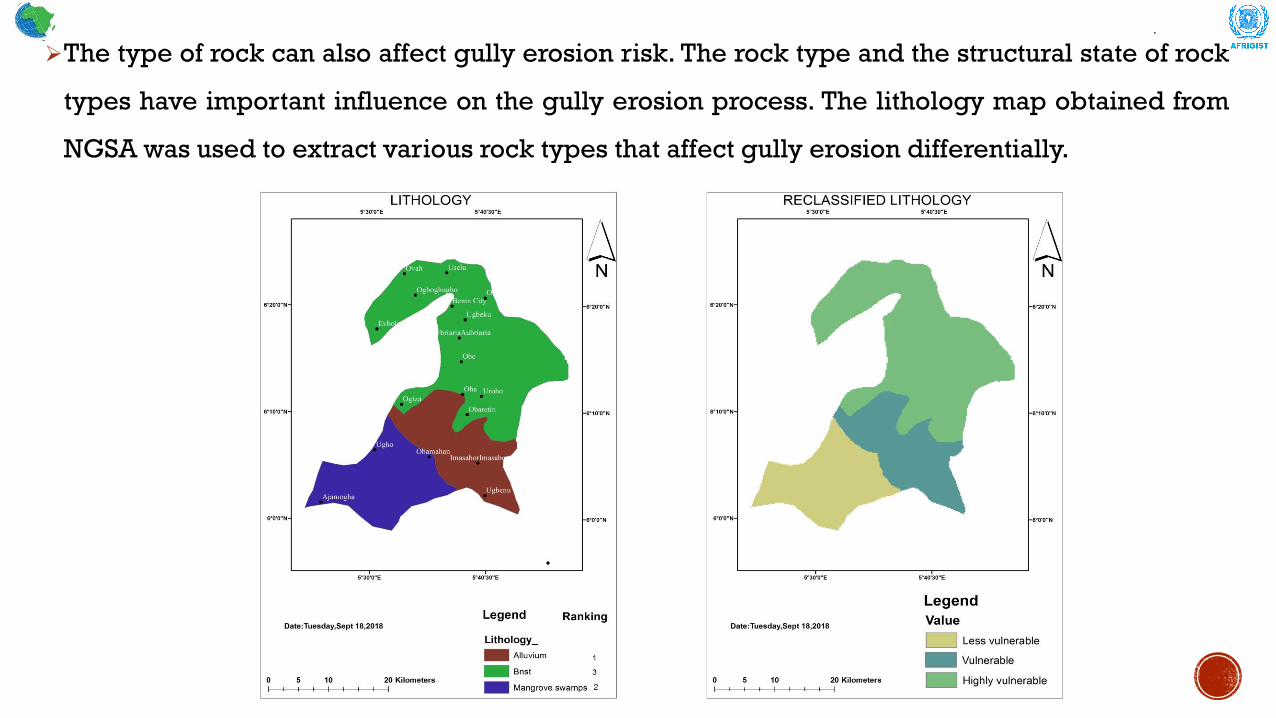
➢The type of rock can also affect gully erosion risk. The rock type and the structural state of rock
types have important influence on the gully erosion process. The lithology map obtained from
NGSA was used to extract various rock types that affect gully erosion differentially.
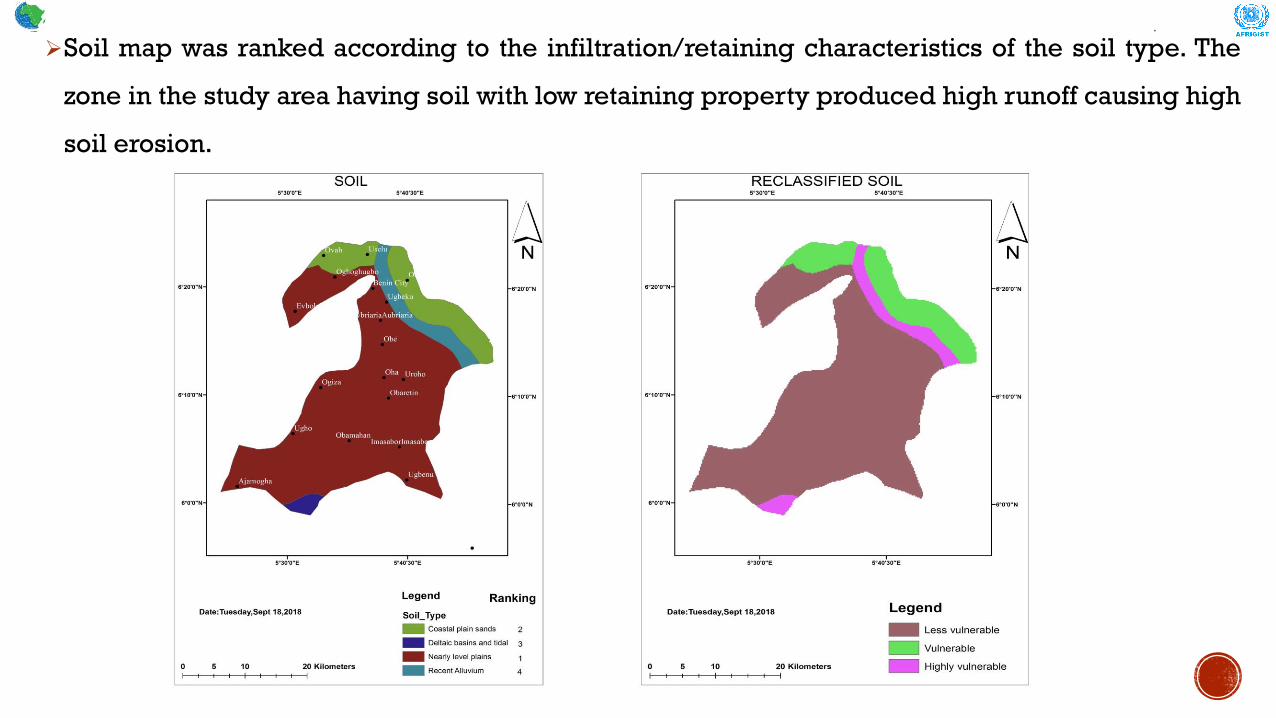
➢Soil map was ranked according to the infiltration/retaining characteristics of the soil type. The
zone in the study area having soil with low retaining property produced high runoff causing high
soil erosion.
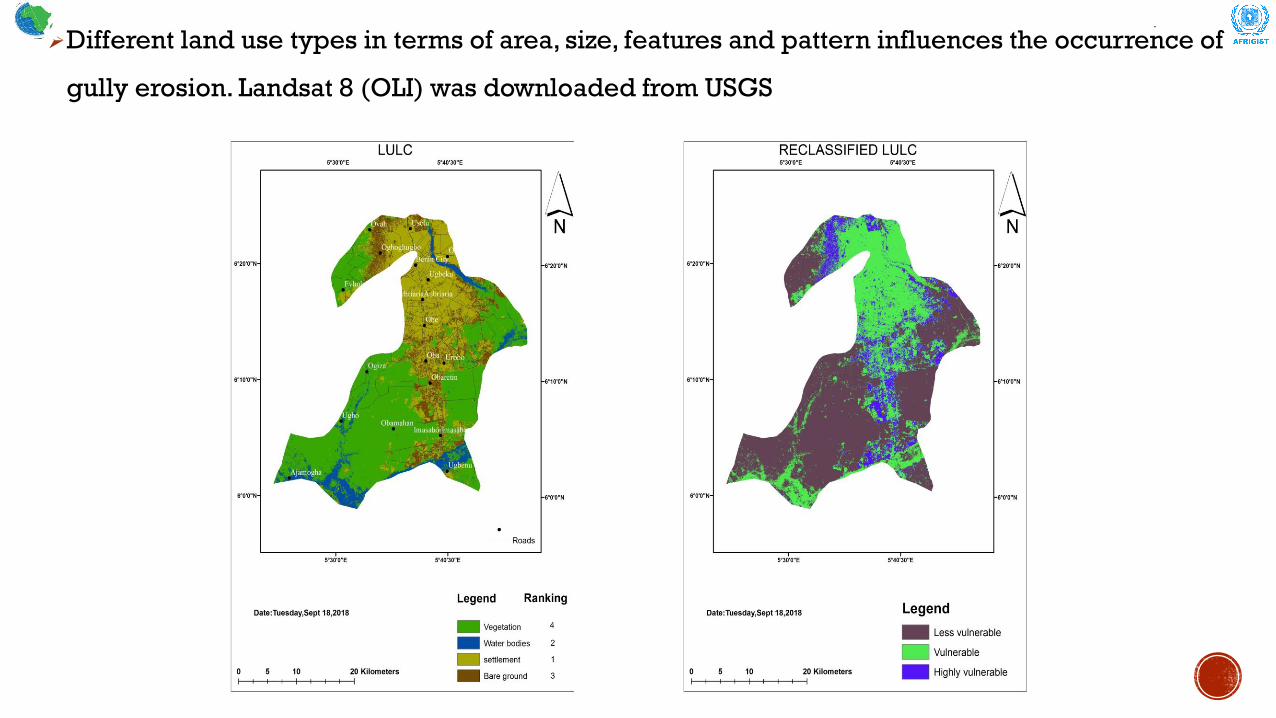
➢Different land use types in terms of area, size, features and pattern influences the occurrence of
gully erosion. Landsat 8 (OLI) was downloaded from USGS
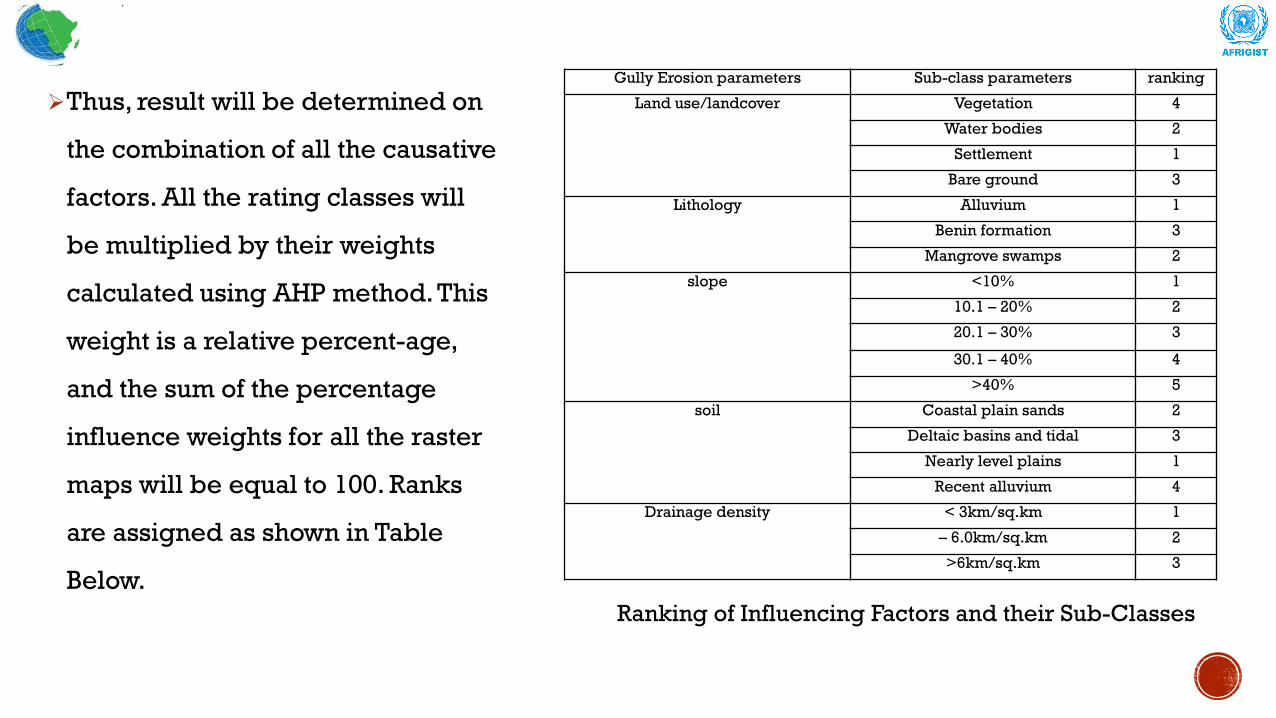
➢Thus, result will be determined on
the combination of all the causative
factors. All the rating classes will
be multiplied by their weights
calculated using AHP method. This
weight is a relative percent-age,
and the sum of the percentage
influence weights for all the raster
maps will be equal to 100. Ranks
are assigned as shown in Table
Below.
Gully Erosion parameters Sub-class parameters ranking
Land use/landcover Vegetation 4
Water bodies 2
Settlement 1
Bare ground 3
Lithology Alluvium 1
Benin formation 3
Mangrove swamps 2
slope <10% 1
10.1 – 20% 2
20.1 – 30% 3
30.1 – 40% 4
>40% 5
soil Coastal plain sands 2
Deltaic basins and tidal 3
Nearly level plains 1
Recent alluvium 4
Drainage density < 3km/sq.km 1
– 6.0km/sq.km 2
>6km/sq.km 3
Ranking of Influencing Factors and their Sub-Classes
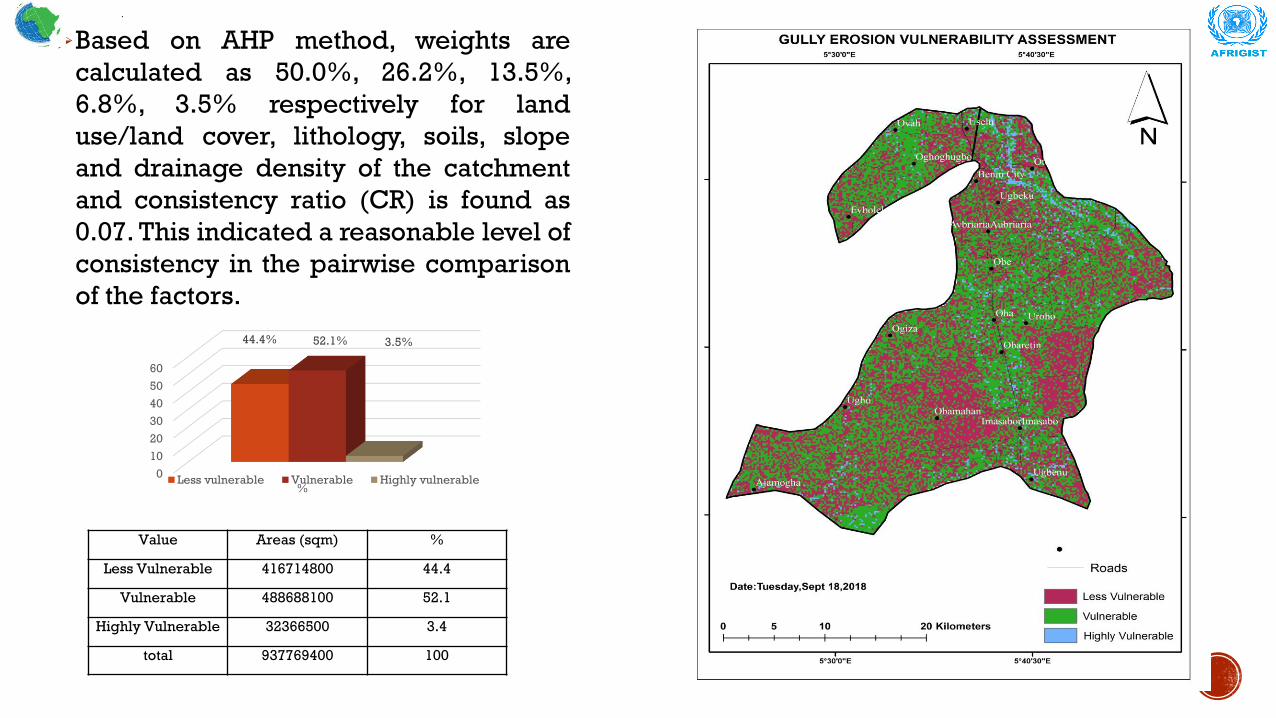
➢Based on AHP method, weights are
calculated as 50.0%, 26.2%, 13.5%,
6.8%, 3.5% respectively for land
use/land cover, lithology, soils, slope
and drainage density of the catchment
and consistency ratio (CR) is found as
0.07. This indicated a reasonable level of
consistency in the pairwise comparison
of the factors.
0
10
20
30
40
50
60
%
44.4% 52.1% 3.5%
Less vulnerable Vulnerable Highly vulnerable
Value Areas (sqm) %
Less Vulnerable 416714800 44.4
Vulnerable 488688100 52.1
Highly Vulnerable 32366500 3.4
total 937769400 100
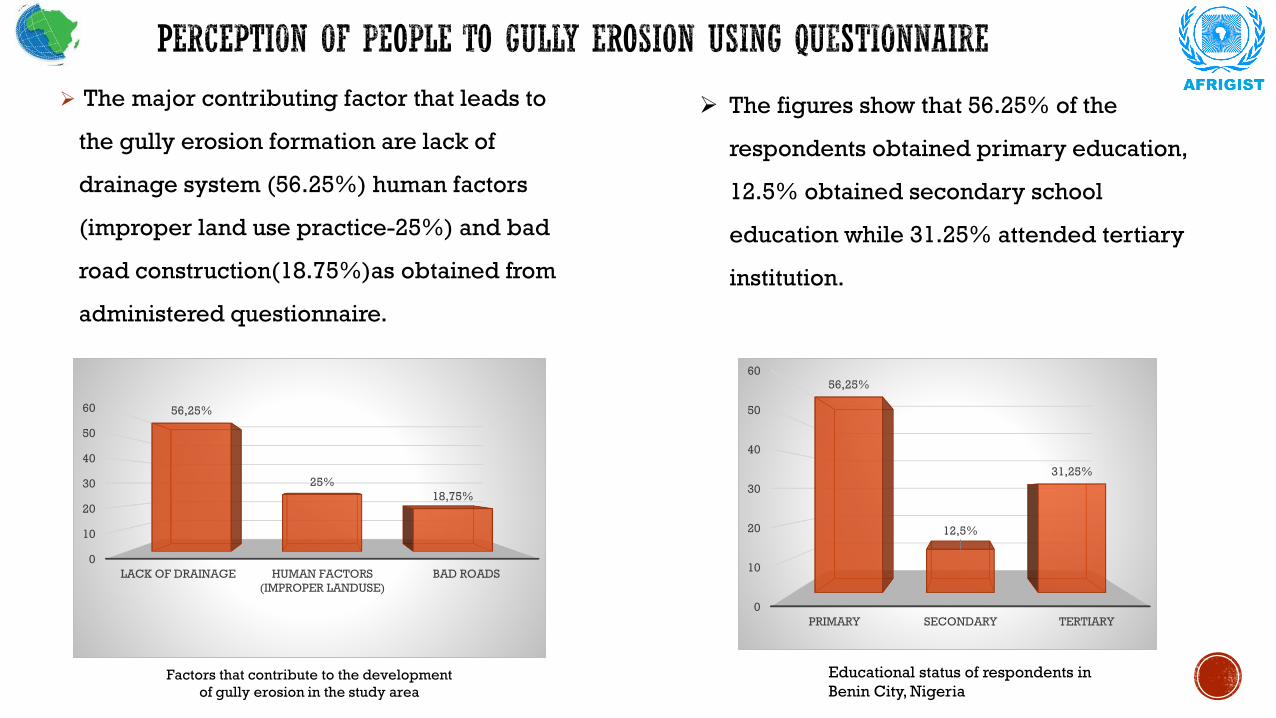
➢ The major contributing factor that leads to
the gully erosion formation are lack of
drainage system (56.25%) human factors
(improper land use practice-25%) and bad
road construction(18.75%)as obtained from
administered questionnaire.
0
10
20
30
40
50
60
LACK OF DRAINAGE HUMAN FACTORS
(IMPROPER LANDUSE)
BAD ROADS
56,25%
25%
18,75%
Factors that contribute to the development
of gully erosion in the study area
➢ The figures show that 56.25% of the
respondents obtained primary education,
12.5% obtained secondary school
education while 31.25% attended tertiary
institution.
0
10
20
30
40
50
60
PRIMARY SECONDARY TERTIARY
56,25%
12,5%
31,25%
Educational status of respondents in
Benin City, Nigeria
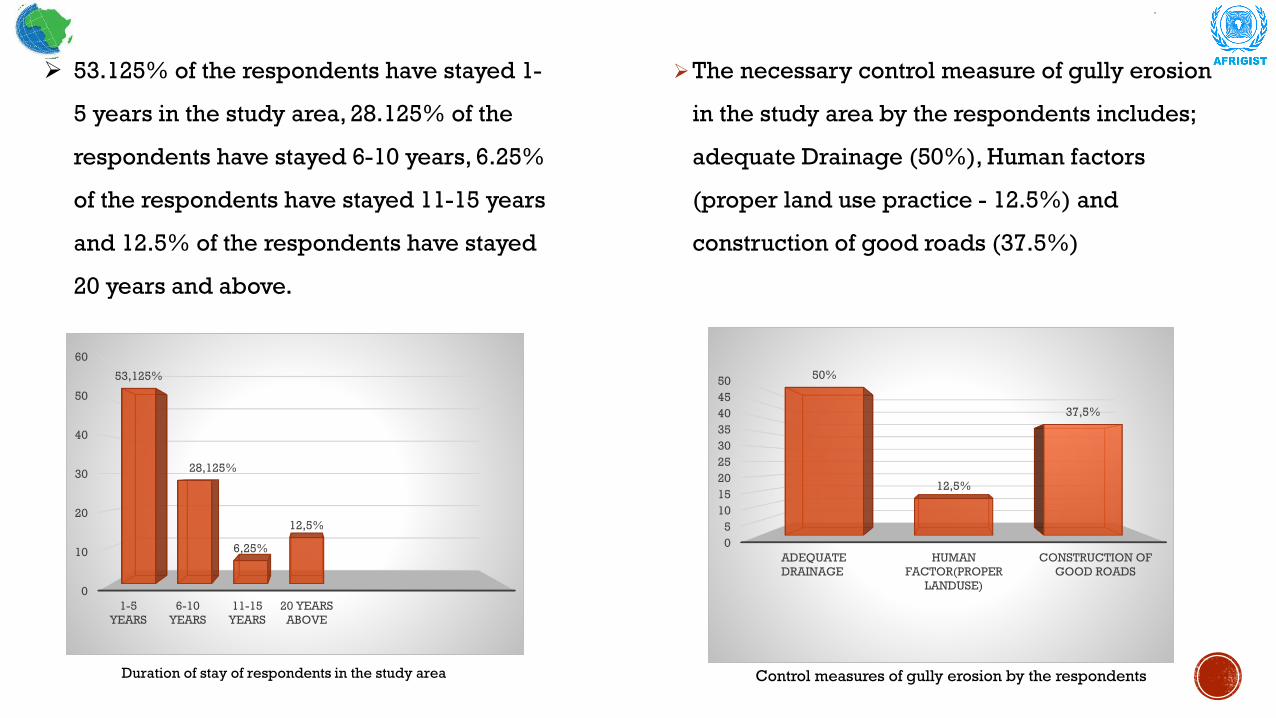
➢The necessary control measure of gully erosion
in the study area by the respondents includes;
adequate Drainage (50%), Human factors
(proper land use practice - 12.5%) and
construction of good roads (37.5%)
0
5
10
15
20
25
30
35
40
45
50
ADEQUATE
DRAINAGE
HUMAN
FACTOR(PROPER
LANDUSE)
CONSTRUCTION OF
GOOD ROADS
50%
12,5%
37,5%
Control measures of gully erosion by the respondents
➢ 53.125% of the respondents have stayed 1-
5 years in the study area, 28.125% of the
respondents have stayed 6-10 years, 6.25%
of the respondents have stayed 11-15 years
and 12.5% of the respondents have stayed
20 years and above.
0
10
20
30
40
50
60
1-5
YEARS
6-10
YEARS
11-15
YEARS
20 YEARS
ABOVE
53,125%
28,125%
6,25%
12,5%
Duration of stay of respondents in the study area
➢About 3.5 percent of the total area was found highly vulnerable to gully erosion, around 52.1
percent of the total study area was found vulnerable to gully erosion and 44.4 per cent of the
total area was less vulnerable to gully erosion. The gully erosion vulnerability map shown
above is strongly related with slope and soil, which was expected due to highest weighting
being given to them.
➢Based on the analysis and the result obtained from this research as interpreted from the
satellite imageries of the gullies in Benin city and questionnaires, the area vulnerable to gully
erosion will increase over time with result from the research.
➢The respondents have the correct perception by showing that the major causes of gully
erosion are lack of drainage, the drainage are inadequate to properly channel water, the water
then finds it way thereby creating its channels which later develop to gullies.
➢Benin city is facing serious environmental threat as a result of gully erosion such as,
inaccessible roads to some areas within the study area, as such some residence
living close the gully have abandoned their building. Proper steps such as timely
control of sheet and rill erosion should be taken before it develops into gully erosion
to prevent further environment degradation resulting to gully erosion.
➢This study therefore shows how critical the problem of gully erosion in the area is
and makes a clarion call on Edo state government and other ecological foundations
to act quickly to remedy the situation, preserve the environment and
reduce/eliminate the vulnerability of inhabitants of the study area to gully erosion,
by treating the geo-environmental hazards of gullies in Benin City.
✓THANK YOU……