Embed Size (px)
Citation preview
Leverhulme Major Research Fellowship
Department of Geography
Global Energy Futures: O i g th Gl b l E g DilOvercoming the Global Energy Dilemma
Professor Mike BradshawProfessor Mike Bradshaw
www.le.ac.uk/geography/staff/academic_bradshaw.html
Introduction: Global Energy Dilemmas Introduction: Global Energy Dilemmas
“Without energy there is no economy Without climate there is noWithout energy there is no economy. Without climate there is noenvironment. Without economy and environment there is no materialwealth, no civil society, no personal or national security. And the problemis that we have been getting the energy our economy needs in ways thatis that we have been getting the energy our economy needs in ways thatare wrecking the climate that our environment needs.”
John P. Holdren (Science Advisor to President Barrack Obama)
“It is no exaggeration to claim that the future of human prosperitydepends on how successfully we tackle two central energy challengesdepends on how successfully we tackle two central energy challengesfacing us today: securing the supply of reliable and affordable energy;and effecting a rapid transformation to a low-carbon, efficient andenvironmentally benign system of energy supply ”environmentally benign system of energy supply.
International Energy Agency 2008
PlanPlan
• The Global Energy Dilemmas• Drivers of Future Energy Demand and Drivers of Future Energy Demand and
Carbon EmissionsTh Gl b l E S t i 2030 40• The Global Energy System in 2030-40
• The Global Energy Dilemmas Nexuse Global e gy le as Ne us• Conclusions
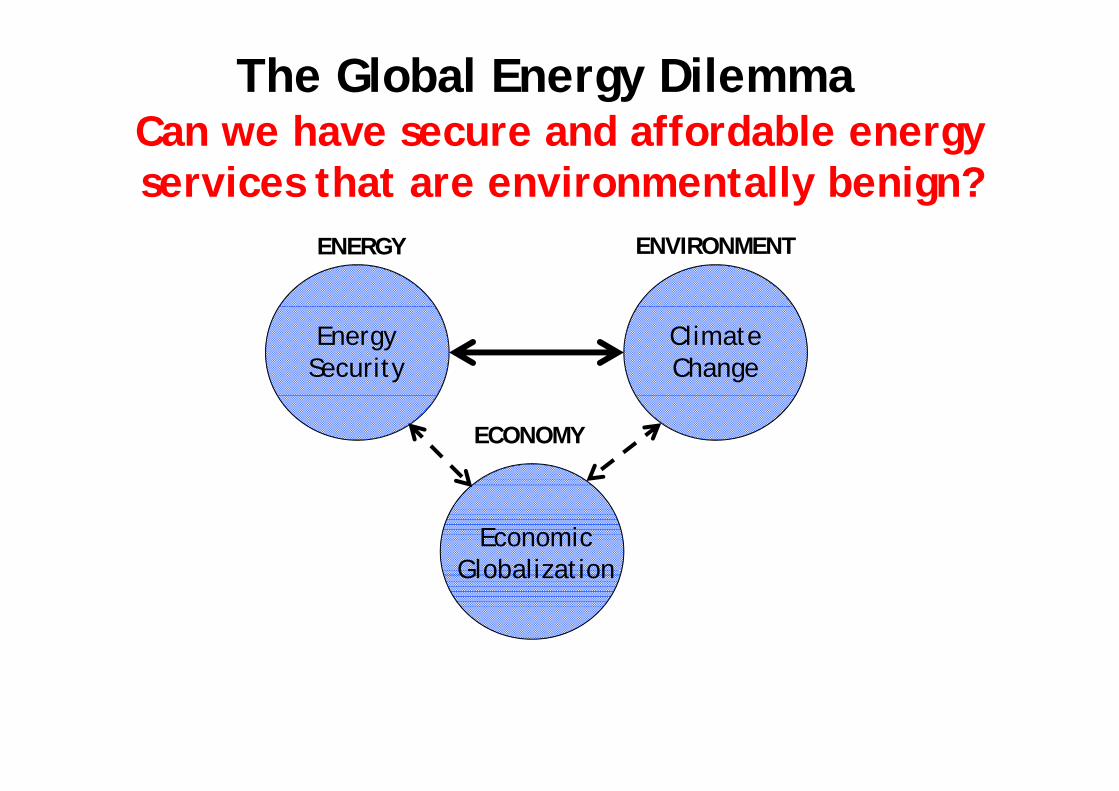
The Global Energy DilemmaCan we have secure and affordable energy Can we have secure and affordable energy services that are environmentally benign?
ENERGY ENVIRONMENT
Energy Security
ClimateChange
ECONOMY
EconomicGlobalizationGlobalization
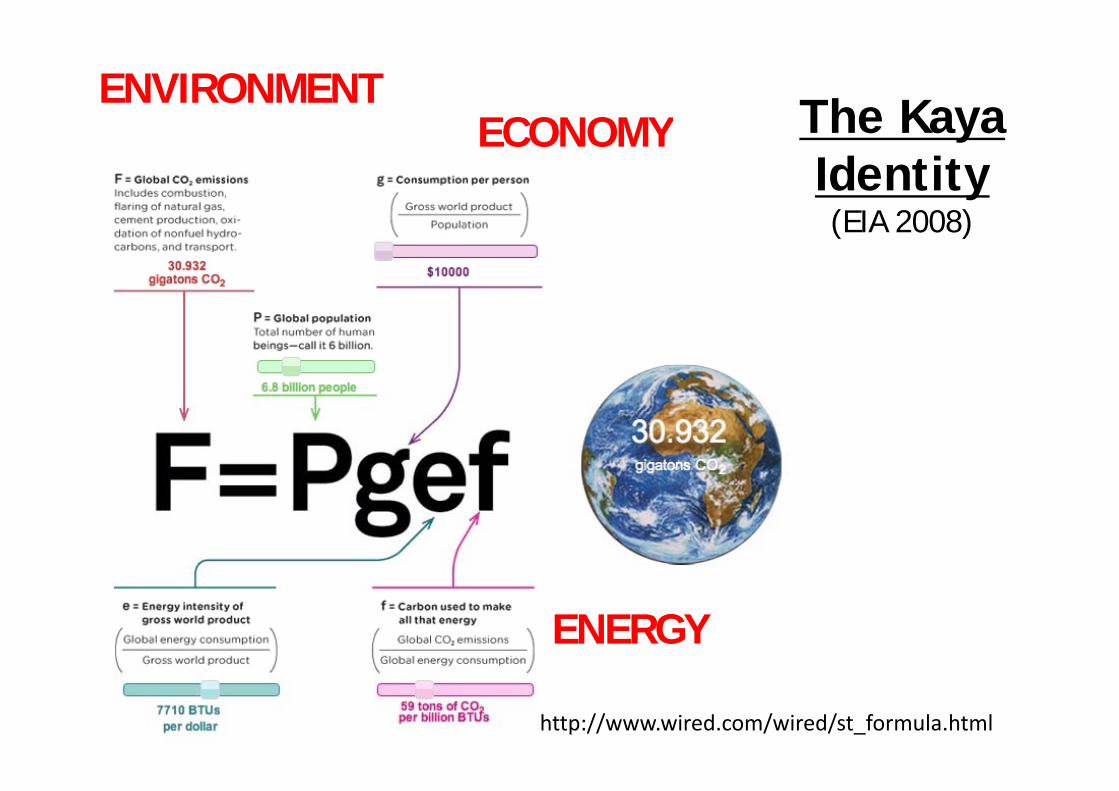
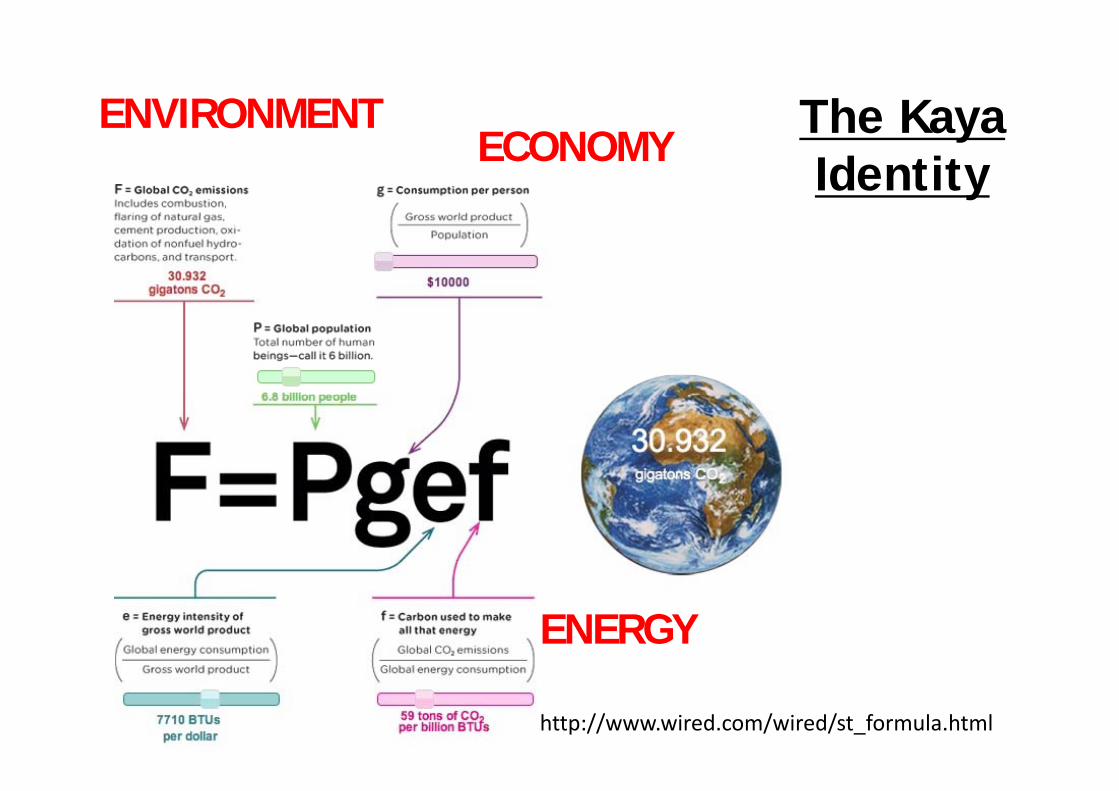
The Kaya ENVIRONMENT
ECONOMY The Kaya Identity(EIA 2008)
ECONOMY
(EIA 2008)
ENERGY
http://www.wired.com/wired/st_formula.html
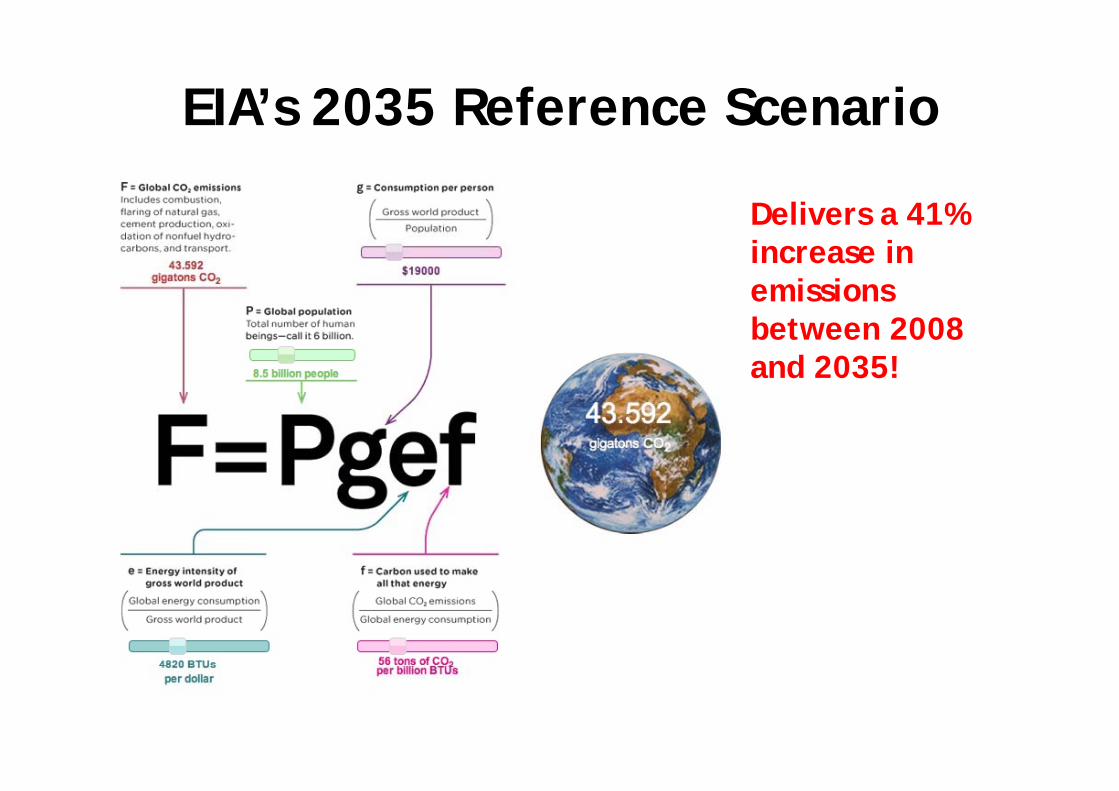
EIA’s 2035 Reference Scenario
Delivers a 41% Delivers a 41% increase in emissions between 2008 and 2035!
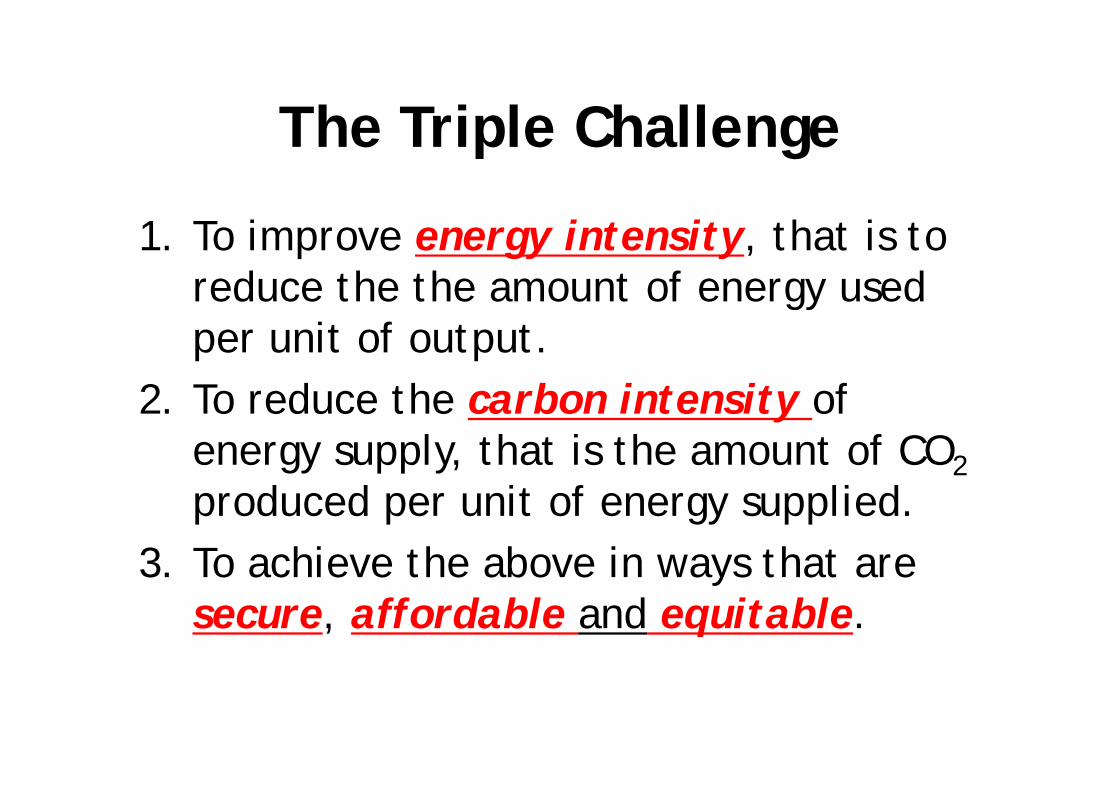
The Triple ChallengeThe Triple Challenge
1. To improve energy intensity, that is to reduce the the amount of energy used gyper unit of output.
2 To reduce the carbon intensity of 2. To reduce the carbon intensity of energy supply, that is the amount of CO2
d d i f li dproduced per unit of energy supplied.3. To achieve the above in ways that are 3. To achieve the above in ways that are
secure, affordable and equitable.
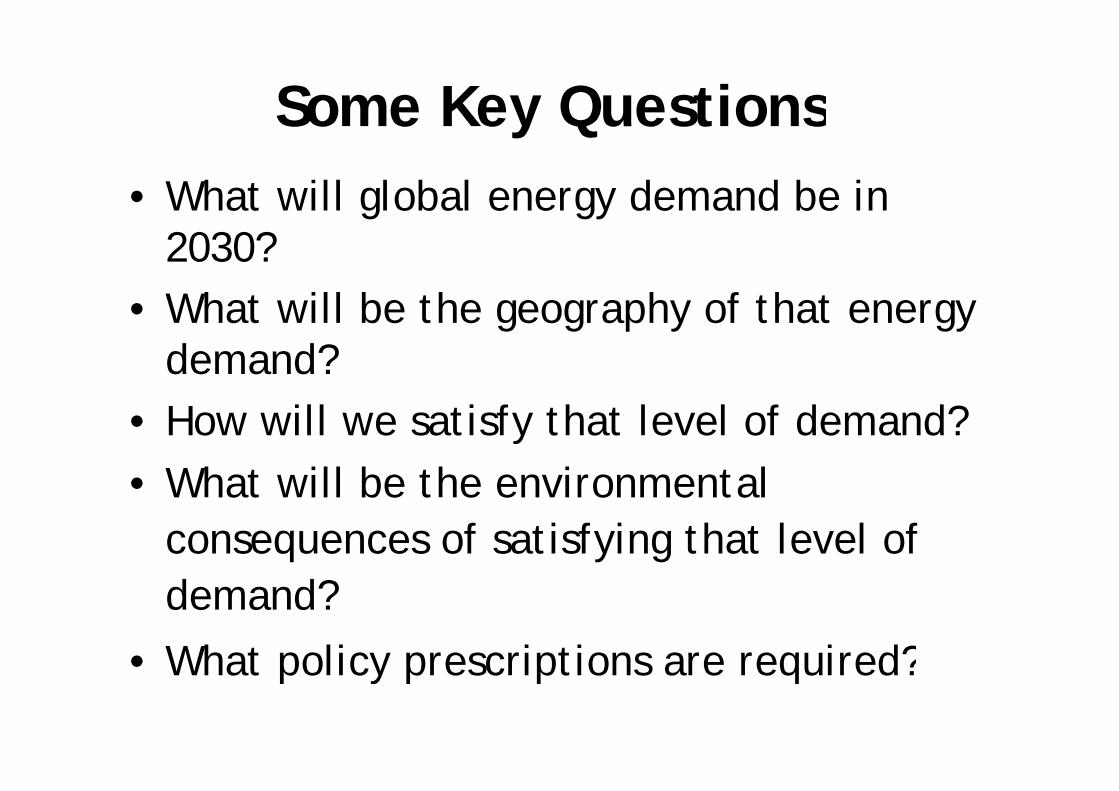
Some Key QuestionsSo e ey Quest o s• What will global energy demand be in g gy
2030?• What will be the geography of that energy • What will be the geography of that energy
demand?• How will we satisfy that level of demand?• What will be the environmental • What will be the environmental
consequences of satisfying that level of demand?
• What policy prescriptions are required?• What policy prescriptions are required?
The Kaya ENVIRONMENT The Kaya Identity
ENVIRONMENTECONOMY
ENERGY
http://www.wired.com/wired/st_formula.html
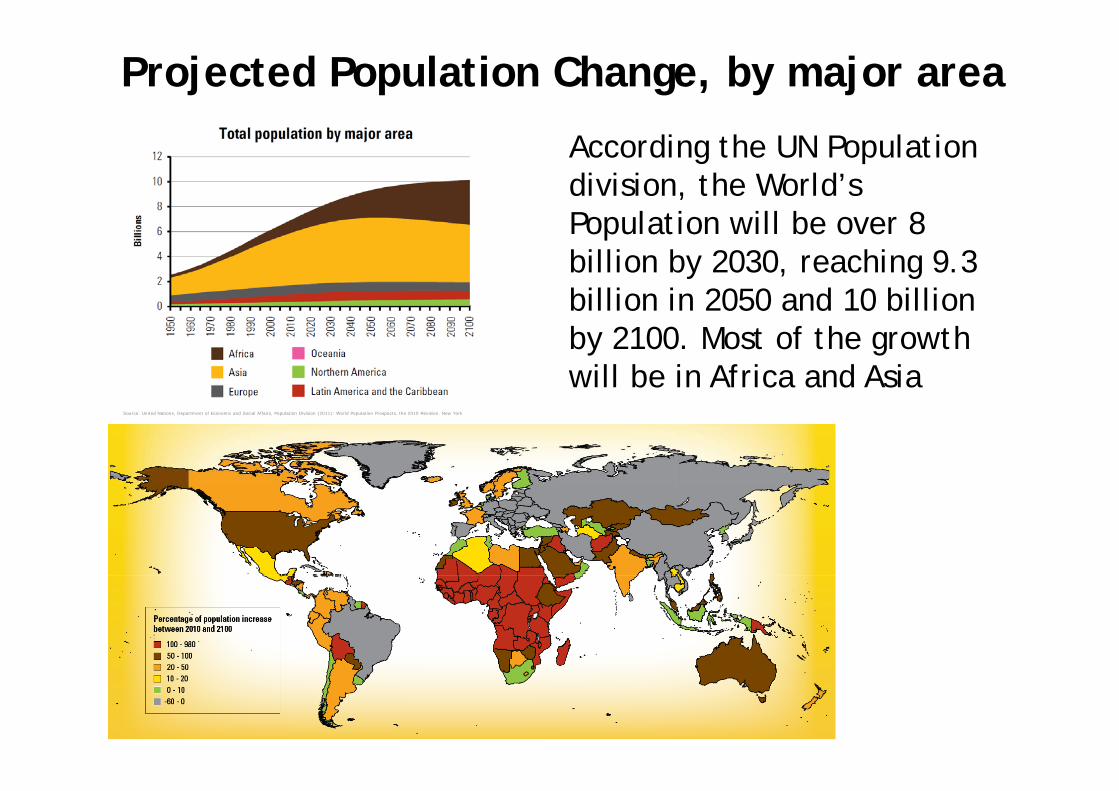
Projected Population Change, by major area
According the UN Population division, the World’s P l ti ill b 8 Population will be over 8 billion by 2030, reaching 9.3 billion in 2050 and 10 billion billion in 2050 and 10 billion by 2100. Most of the growth will be in Africa and Asia
Source: United Nations, Department of Economic and Social Affairs, Population Division (2011): World Population Prospects, the 2010 Revision. New York
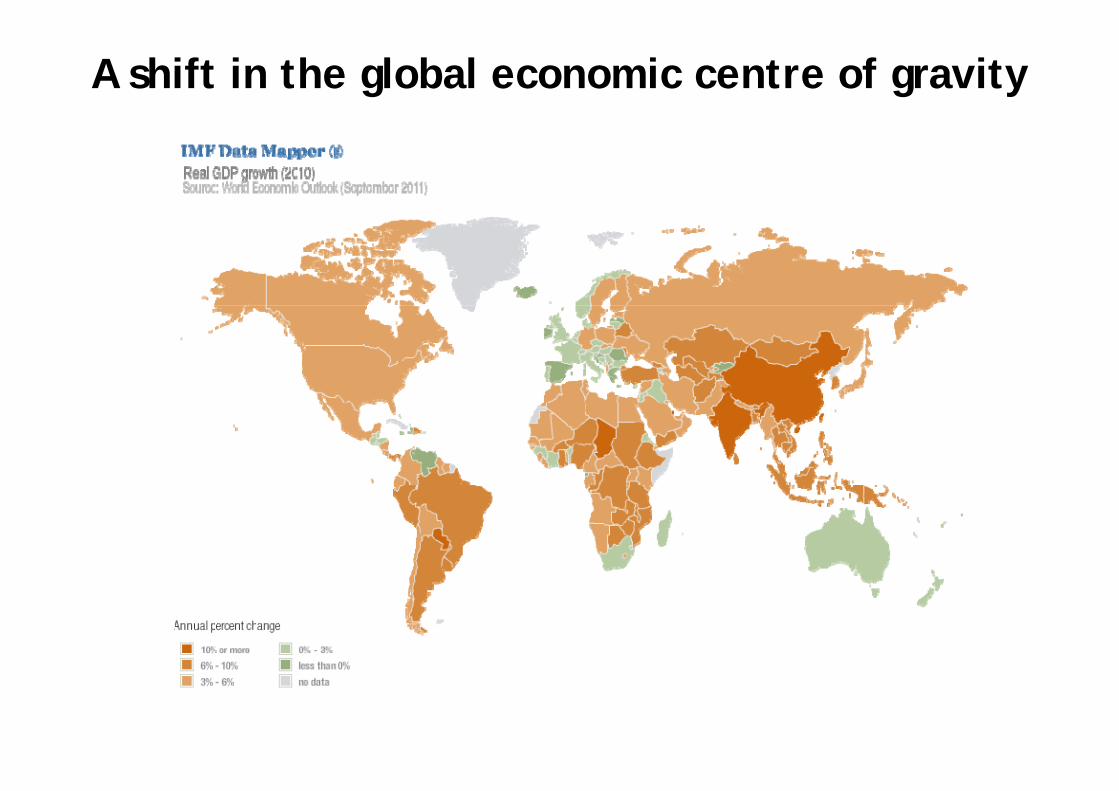
A shift in the global economic centre of gravity
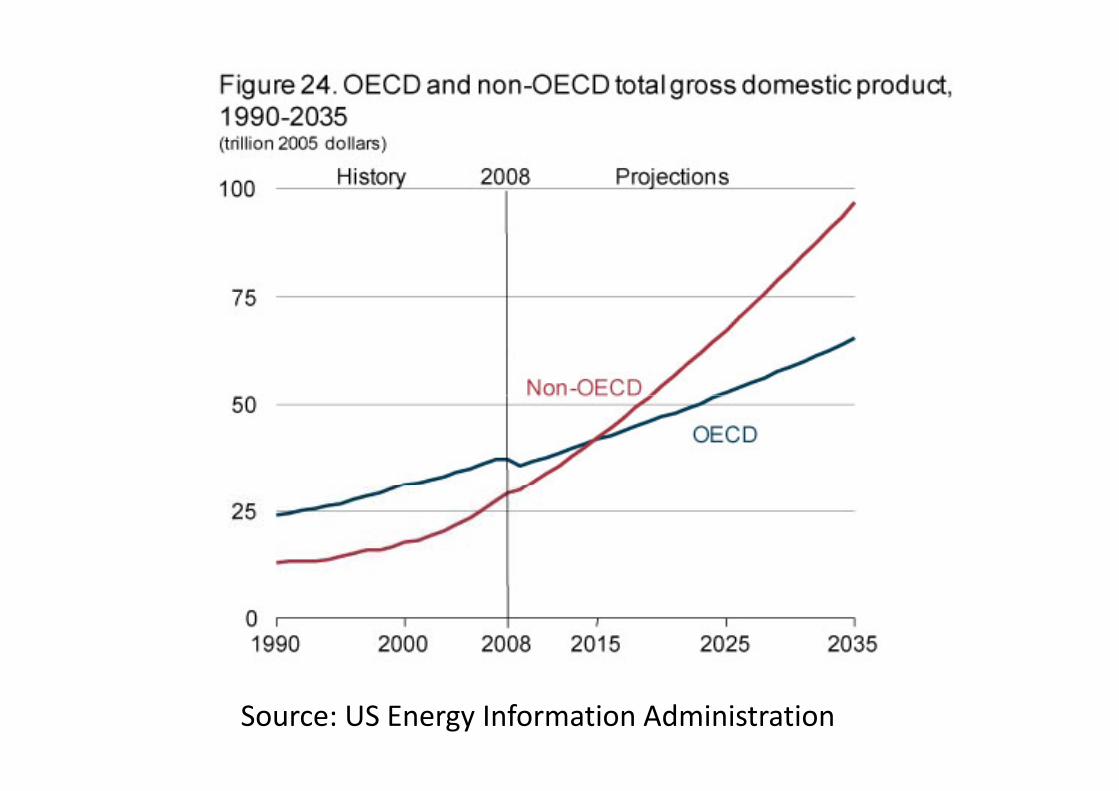
Source: US Energy Information Administration
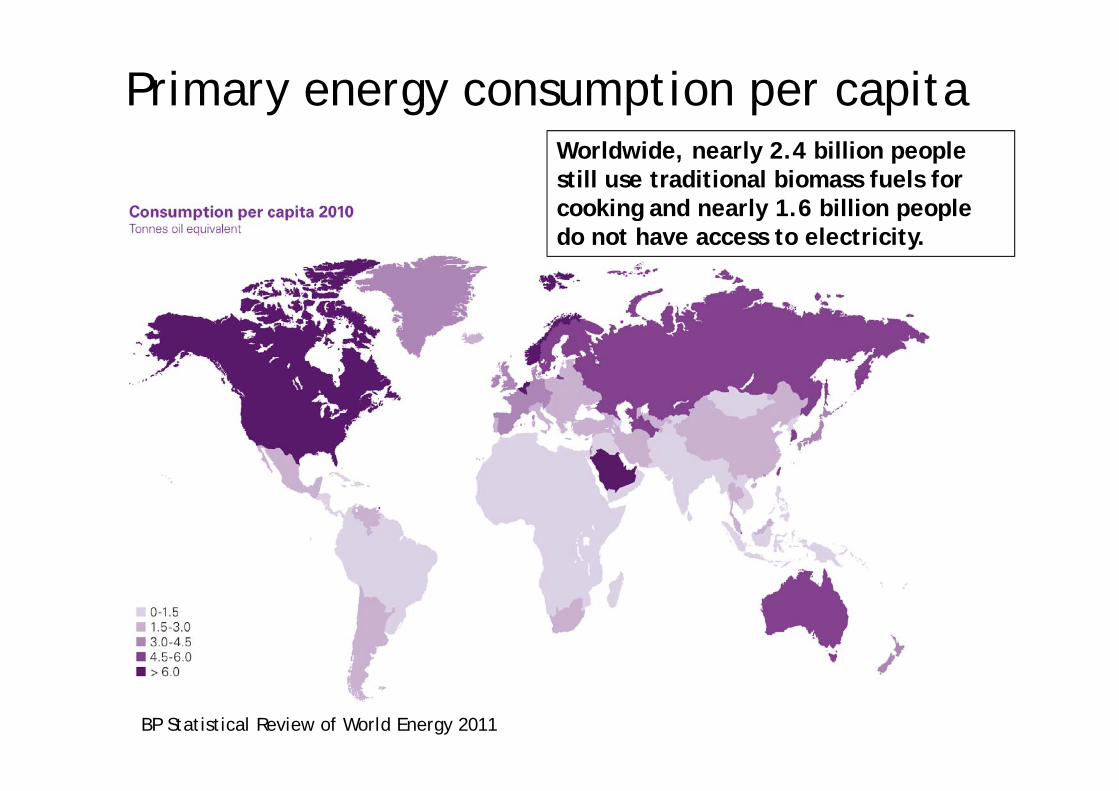
Primary energy consumption per capitaWorldwide, nearly 2.4 billion people still use traditional biomass fuels for cooking and nearly 1.6 billion people cooking and nearly 1.6 billion people do not have access to electricity.
BP Statistical Review of World Energy 2011
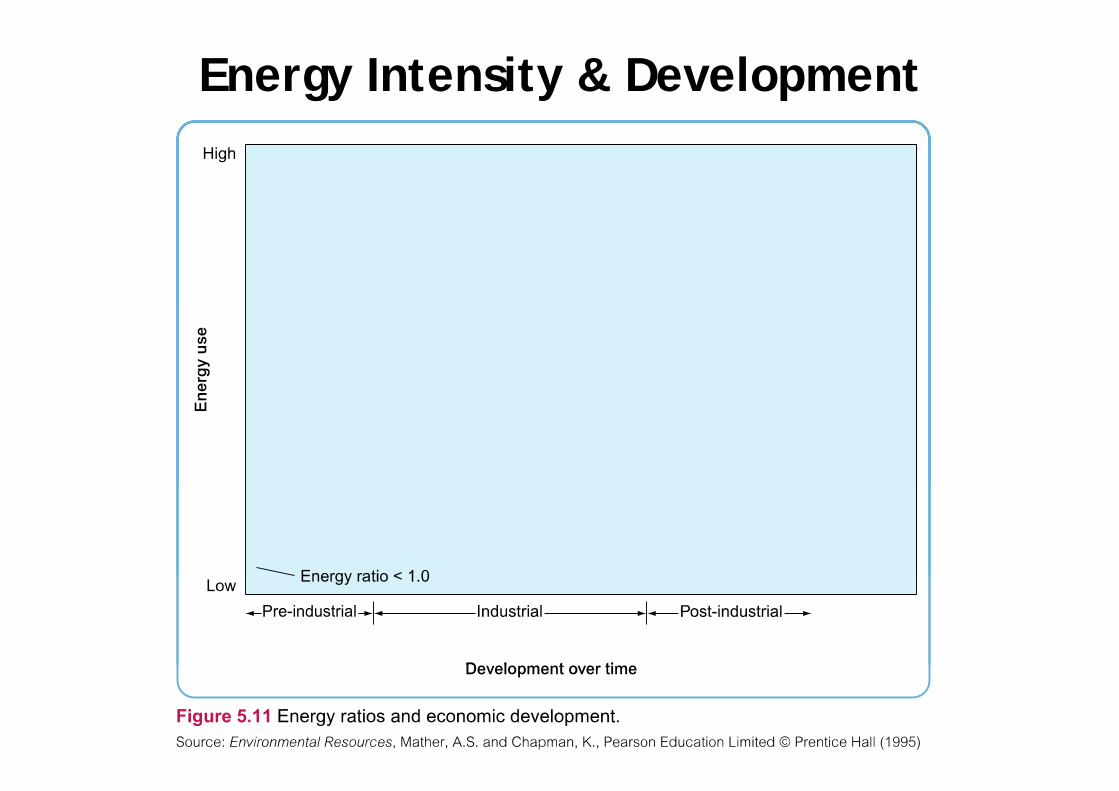
Energy Intensity & Development
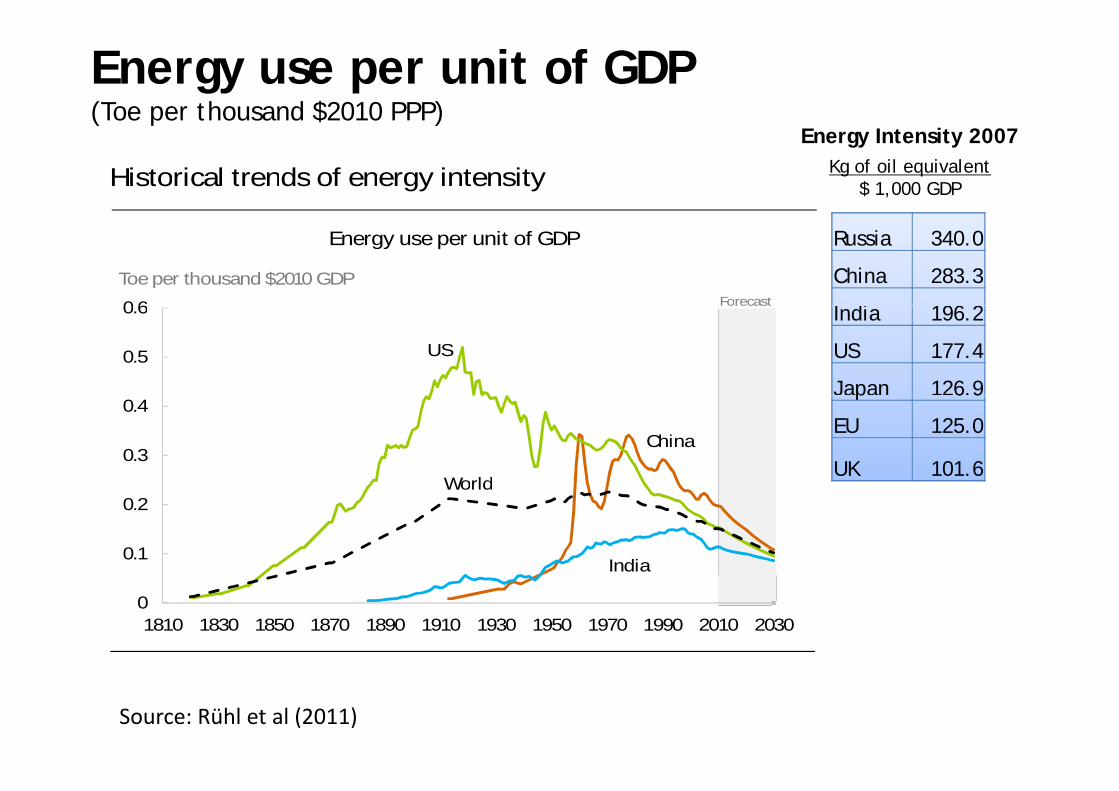
Energy use per unit of GDP(Toe per thousand $2010 PPP)
Energy Intensity 2007Kg of oil equivalent
$ 1,000 GDPHistorical trends of energy intensity
Russia 340.0
China 283.3
I di 196 20 6
Energy use per unit of GDP
Toe per thousand $2010 GDPForecast
India 196.2
US 177.4
Japan 126.9
0.5
0.6
US
p 6 9
EU 125.0
UK 101.60.3
0.4
China
World
0.1
0.2World
India
01810 1830 1850 1870 1890 1910 1930 1950 1970 1990 2010 2030
Source: Rühl et al (2011)
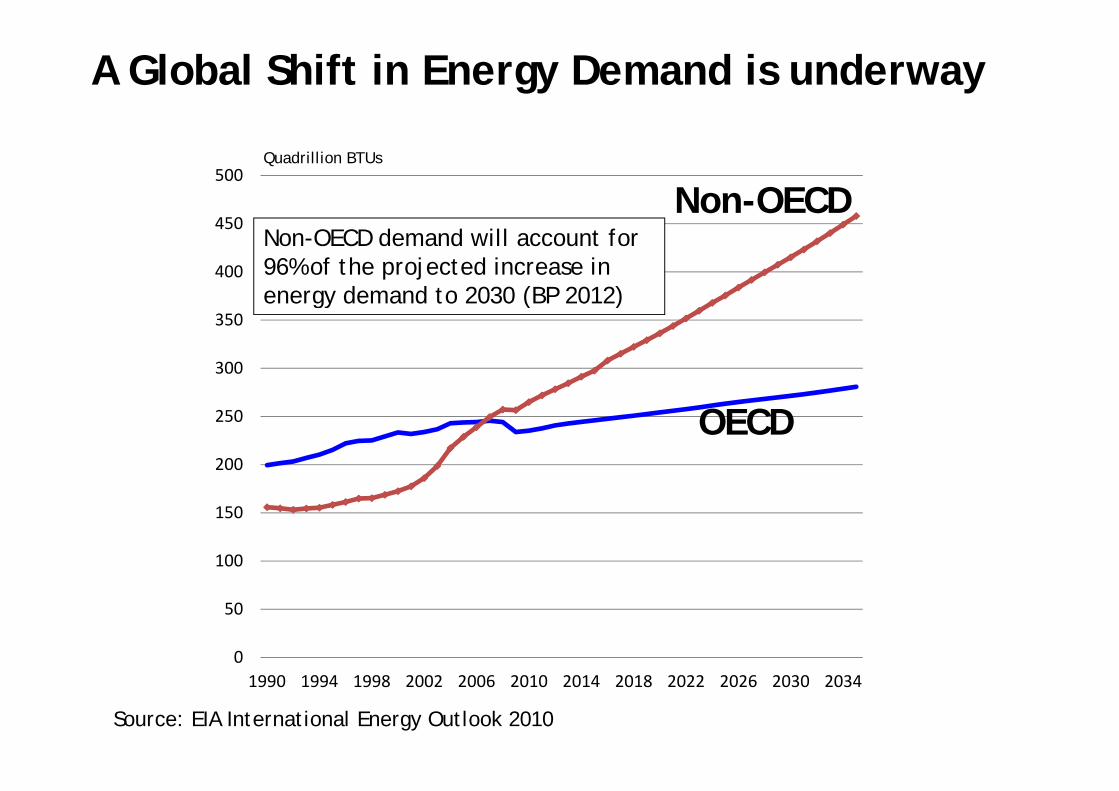
A Global Shift in Energy Demand is underway
500
Non-OECDQuadrillion BTUs
400
450Non-OECD demand will account for 96% of the projected increase in energy demand to 2030 (BP 2012)
300
350gy ( )
200
250 OECD
100
150
0
50
Source: EIA International Energy Outlook 2010
1990 1994 1998 2002 2006 2010 2014 2018 2022 2026 2030 2034
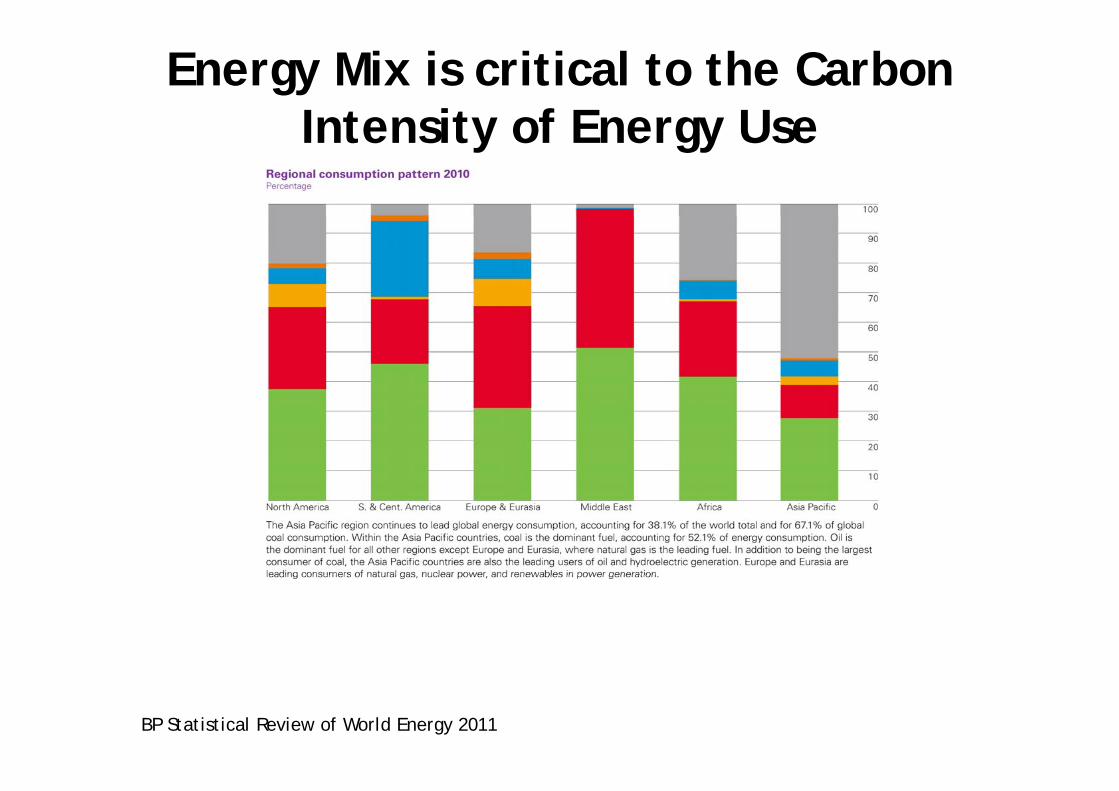
Energy Mix is critical to the Carbon Intensity of Energy UseIntensity of Energy Use
BP Statistical Review of World Energy 2011
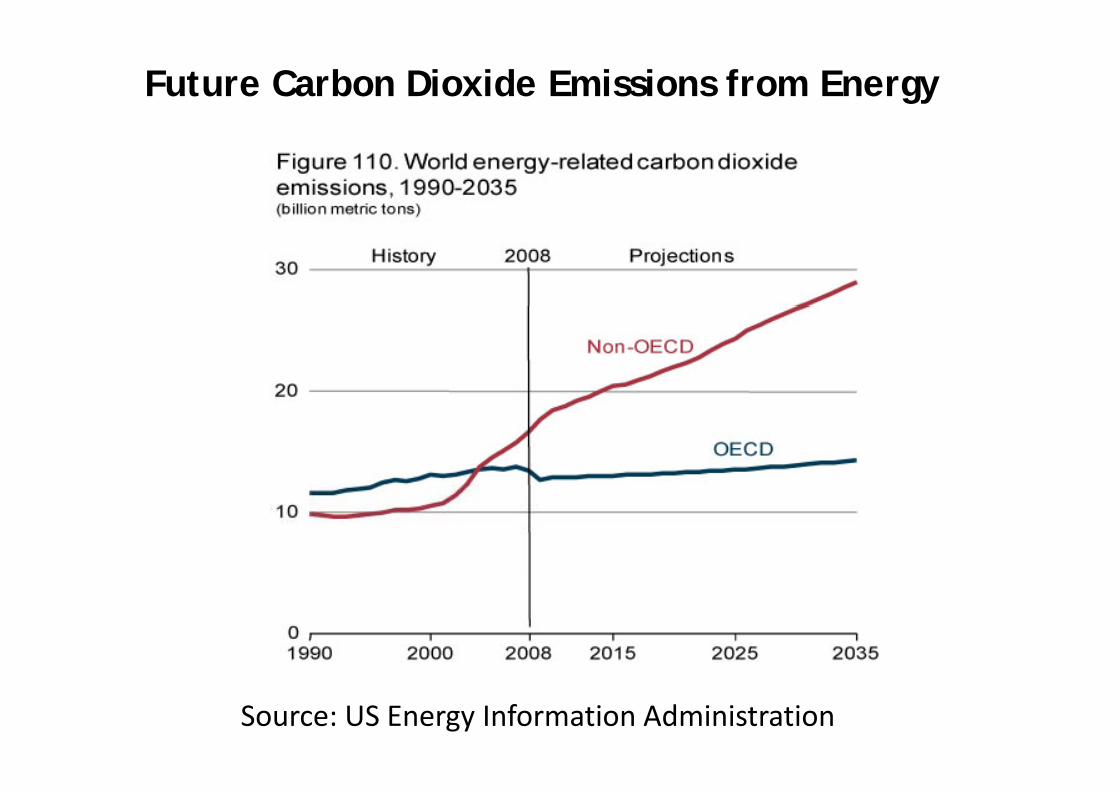
Future Carbon Dioxide Emissions from Energy
Source: US Energy Information Administration
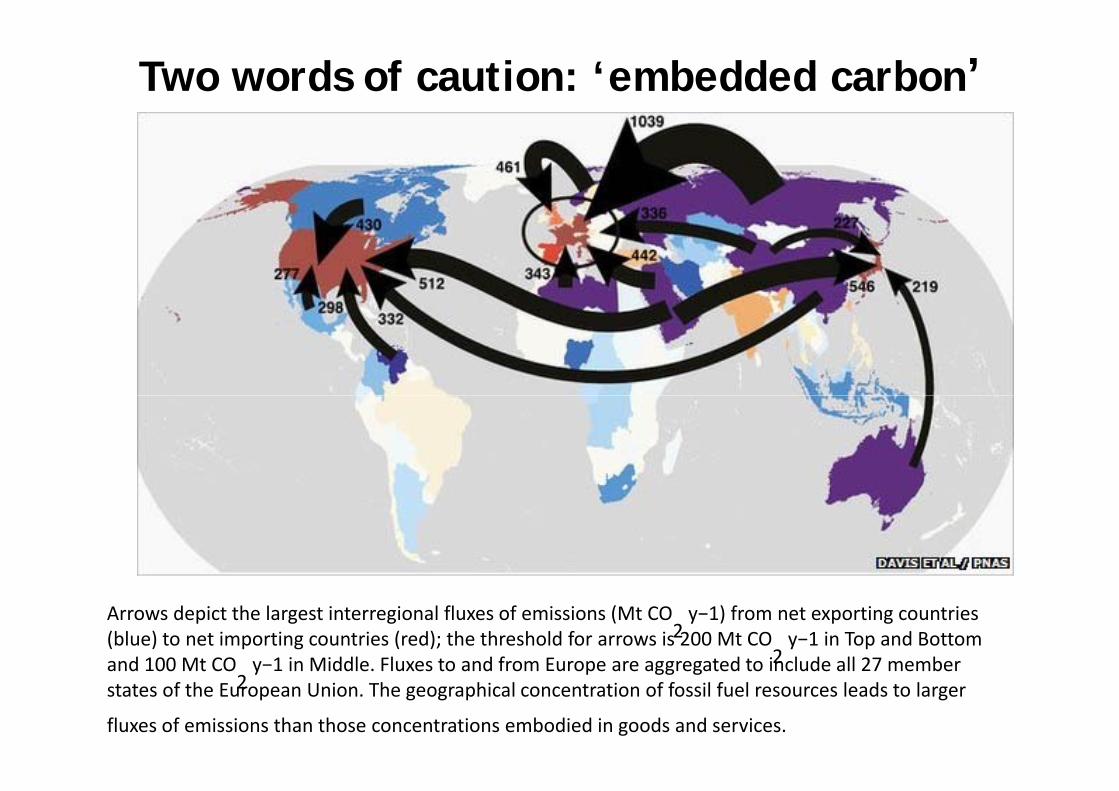
Two words of caution: ‘embedded carbon’
Arrows depict the largest interregional fluxes of emissions (Mt CO2 y−1) from net exporting countries
(blue) to net importing countries (red); the threshold for arrows is 200 Mt CO2 y−1 in Top and Bottom
and 100 Mt CO y−1 in Middle Fluxes to and from Europe are aggregated to include all 27 memberand 100 Mt CO2 y−1 in Middle. Fluxes to and from Europe are aggregated to include all 27 member
states of the European Union. The geographical concentration of fossil fuel resources leads to larger
fluxes of emissions than those concentrations embodied in goods and services.
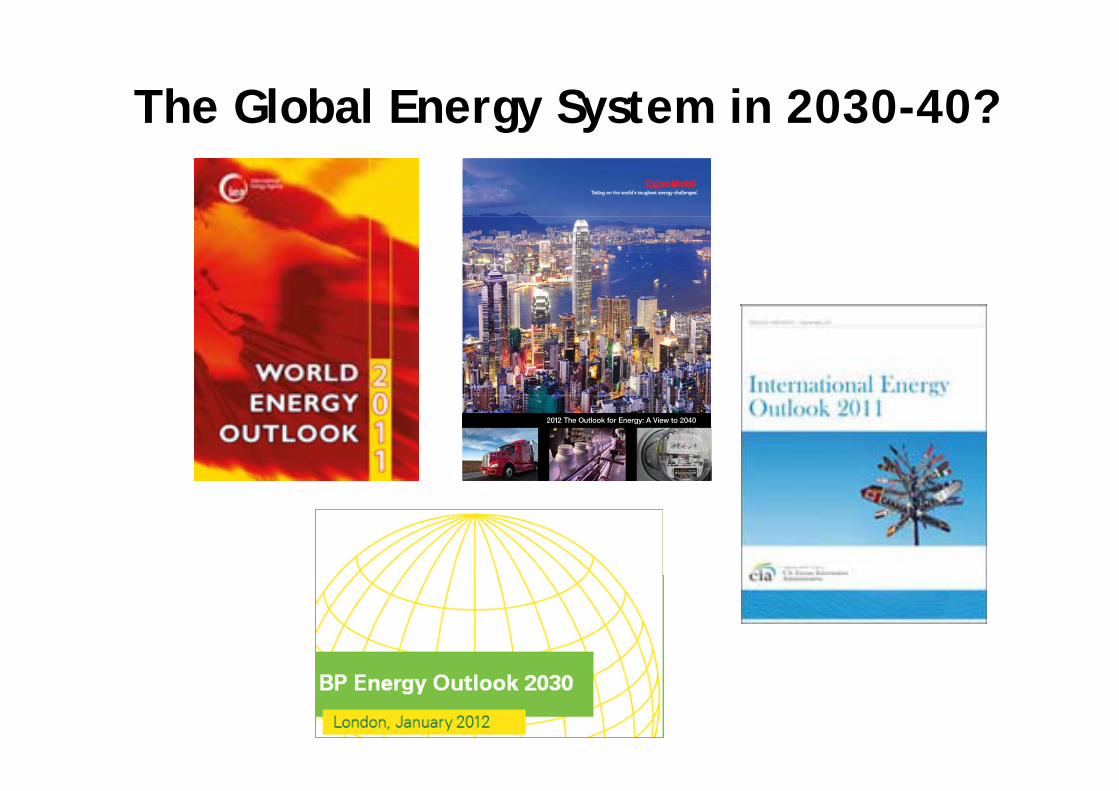
The Global Energy System in 2030-40?gy y
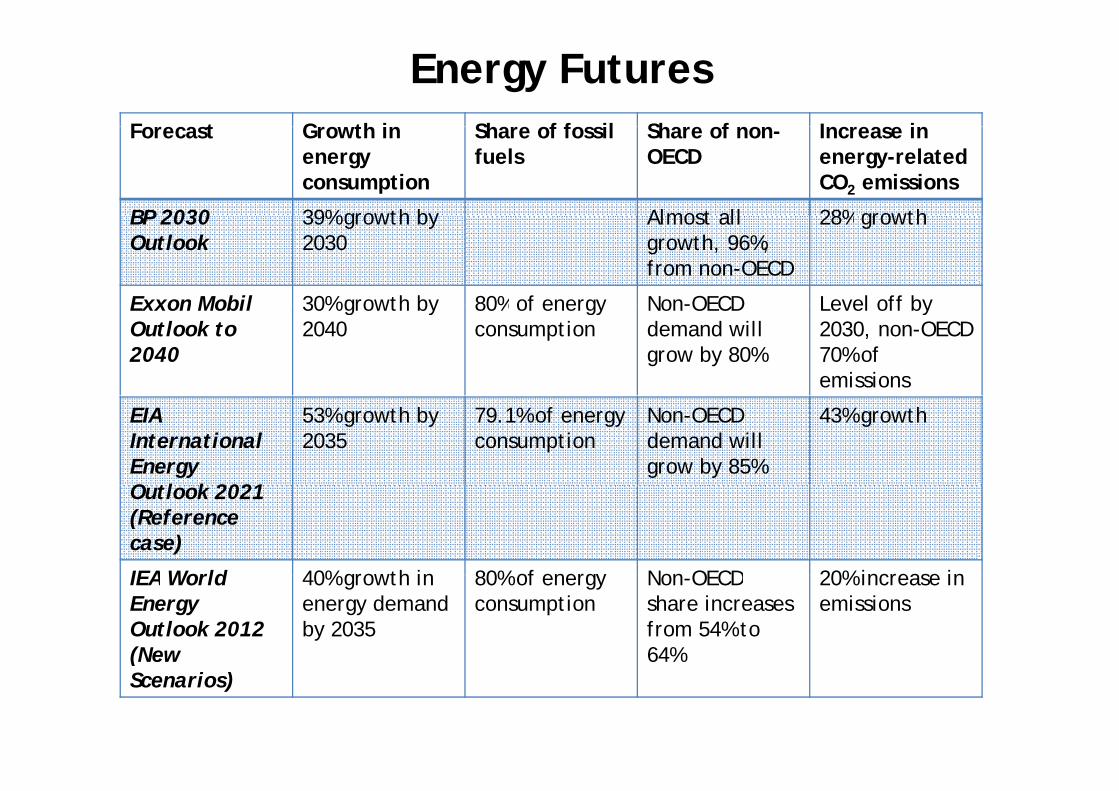
Energy FuturesF t G th i Sh f f il Sh f I i Forecast Growth in
energy consumption
Share of fossil fuels
Share of non-OECD
Increase in energy-relatedCO2 emissions
BP 2030 39% growth by Almost all 28% growthBP 2030 Outlook
39% growth by 2030
Almost all growth, 96%, from non-OECD
28% growth
Exxon Mobil 30% growth by 80% of energy Non-OECD Level off by Exxon MobilOutlook to 2040
30% growth by 2040
80% of energy consumption
Non OECD demand will grow by 80%
Level off by 2030, non-OECD70% of emissions
EIAInternational Energy O tl k 2021
53% growth by 2035
79.1% of energy consumption
Non-OECD demand will grow by 85%
43% growth
Outlook 2021 (Reference case)
IEA World 40% growth in 80% of energy Non OECD 20% increase in IEA World Energy Outlook 2012 (New
40% growth in energy demand by 2035
80% of energy consumption
Non-OECDshare increases from 54% to 64%
20% increase in emissions
(Scenarios)
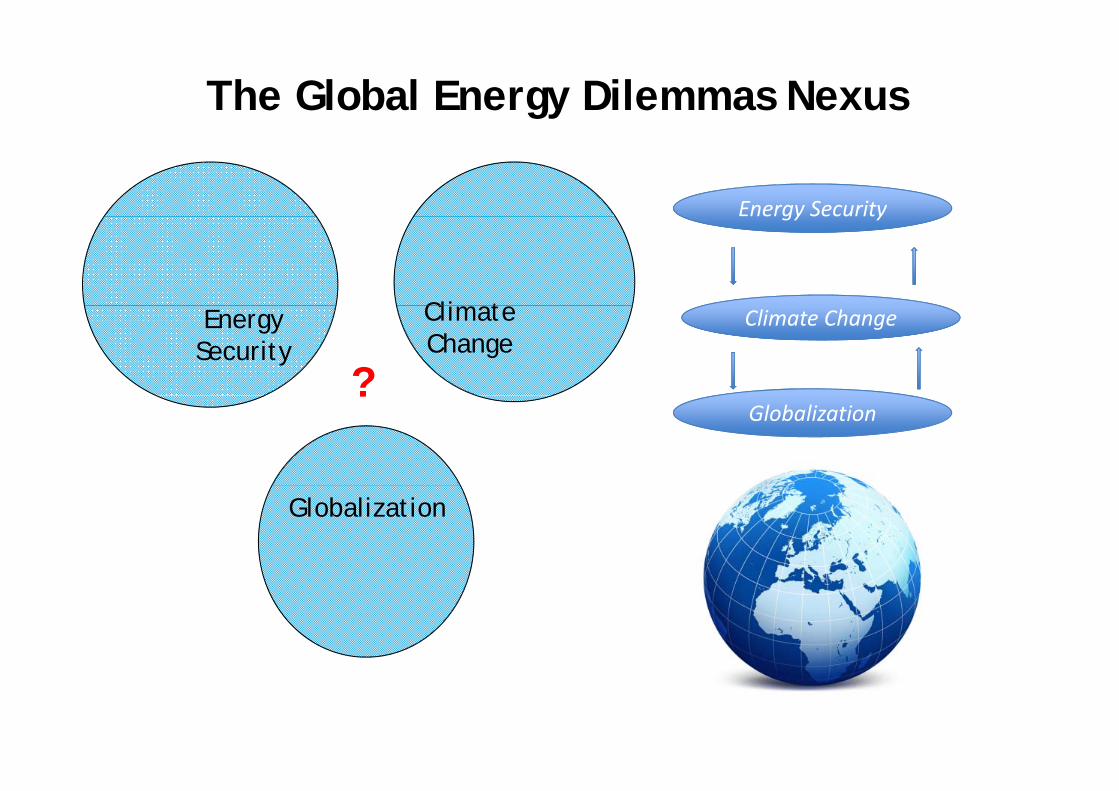
The Global Energy Dilemmas Nexus
Energy Security
Cli t
Energy Security
Energy Security
ClimateChange
Climate Change
?Globalization
?
Globalization
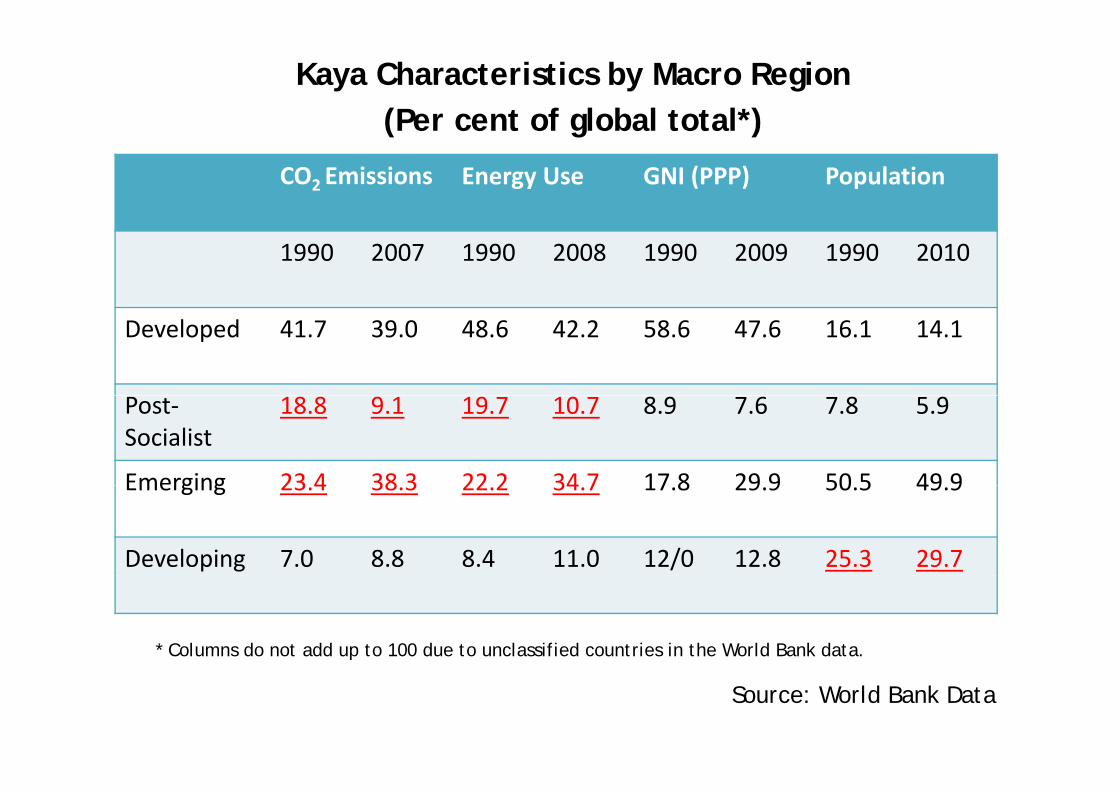
Kaya Characteristics by Macro Region(Per cent of global total*)
CO2 Emissions Energy Use GNI (PPP) Population
(Per cent of global total )
1990 2007 1990 2008 1990 2009 1990 2010
Developed 41.7 39.0 48.6 42.2 58.6 47.6 16.1 14.1
Post‐Socialist
18.8 9.1 19.7 10.7 8.9 7.6 7.8 5.9
Emerging 23 4 38 3 22 2 34 7 17 8 29 9 50 5 49 9Emerging 23.4 38.3 22.2 34.7 17.8 29.9 50.5 49.9
Developing 7.0 8.8 8.4 11.0 12/0 12.8 25.3 29.7
* Columns do not add up to 100 due to unclassified countries in the World Bank data.
Source: World Bank Data
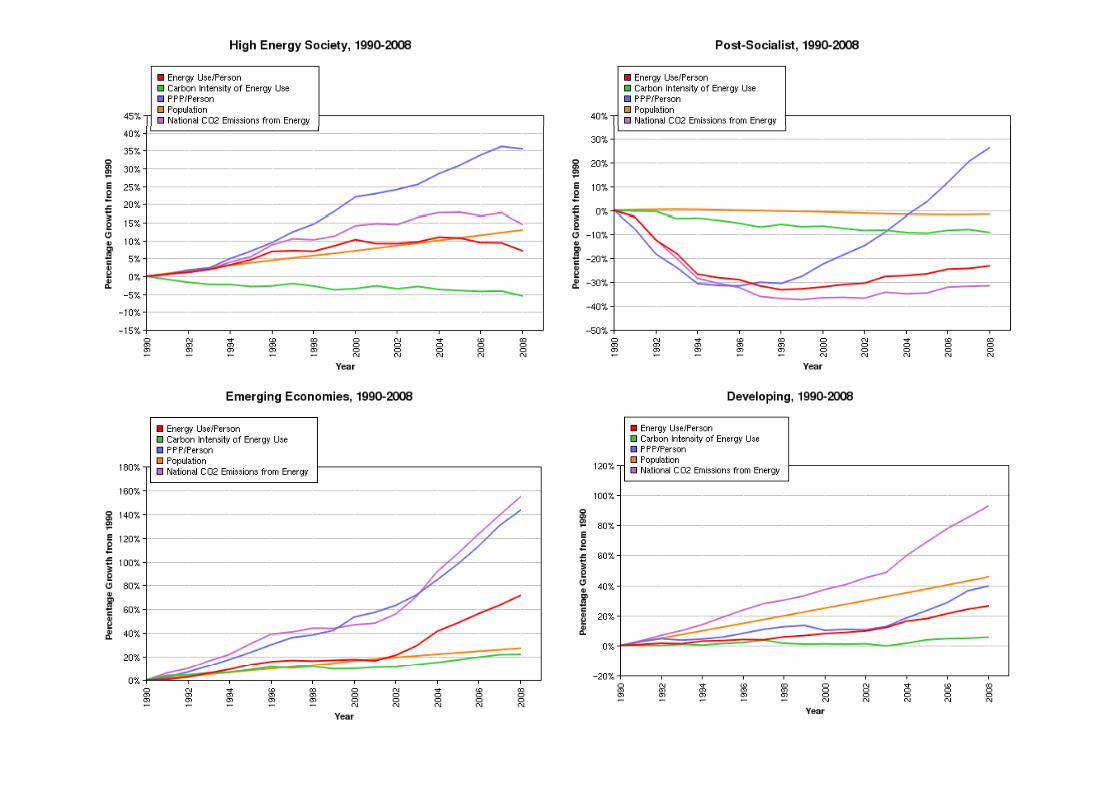
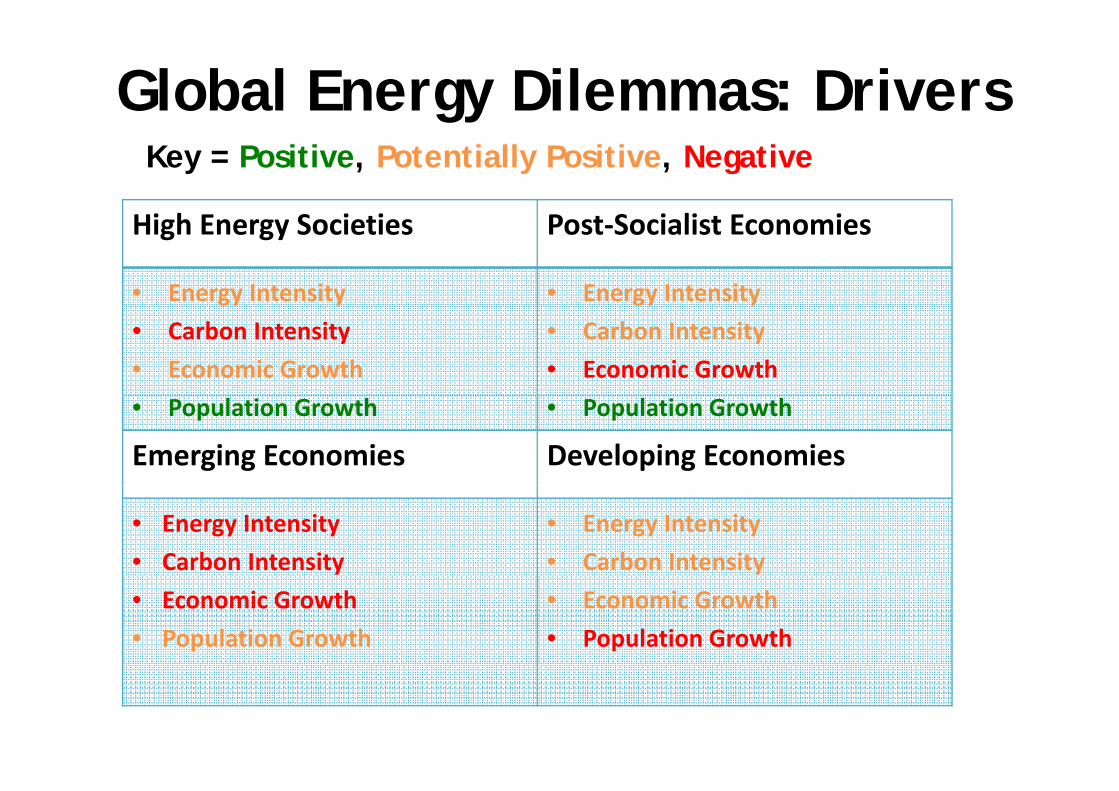
Global Energy Dilemmas: Drivers
Hi h E S i ti P t S i li t E i
Key = Positive, Potentially Positive, Negative
High Energy Societies Post‐Socialist Economies
• Energy Intensity • Energy Intensity
• Carbon Intensity
• Economic Growth
• Carbon Intensity
• Economic Growth
• Population Growth • Population Growth
Emerging Economies Developing Economies
• Energy Intensity
• Carbon Intensity
• Energy Intensity
• Carbon Intensity
• Economic Growth
• Population Growth
• Economic Growth
• Population Growth
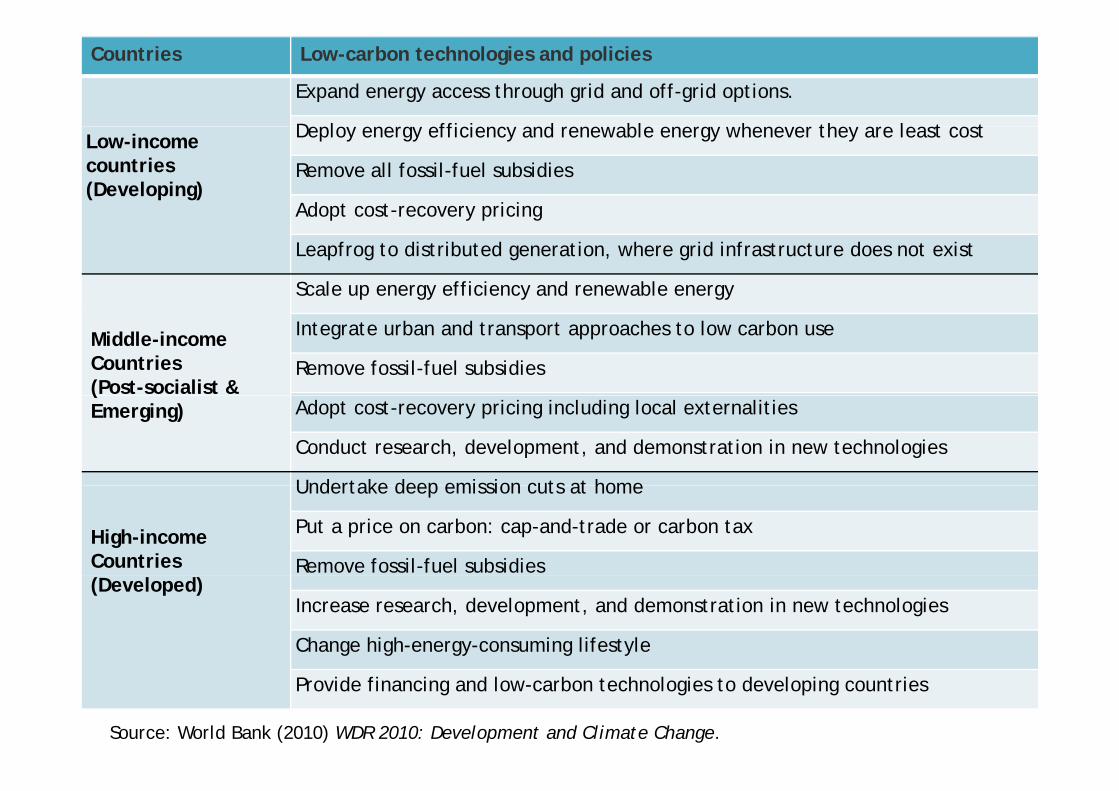
Countries Low-carbon technologies and policies
Expand energy access through grid and off-grid options.
D l g ffi i d bl g h th l t tLow-incomecountries(Developing)
Deploy energy efficiency and renewable energy whenever they are least cost
Remove all fossil-fuel subsidies
Adopt cost-recovery pricingAdopt cost recovery pricing
Leapfrog to distributed generation, where grid infrastructure does not exist
Scale up energy efficiency and renewable energy
Middle-incomeCountries(Post-socialist &
Integrate urban and transport approaches to low carbon use
Remove fossil-fuel subsidies(Emerging) Adopt cost-recovery pricing including local externalities
Conduct research, development, and demonstration in new technologies
Undertake deep emission cuts at home
High-incomeCountries
Undertake deep emission cuts at home
Put a price on carbon: cap-and-trade or carbon tax
Remove fossil-fuel subsidies(Developed)
Increase research, development, and demonstration in new technologies
Change high-energy-consuming lifestyle
Provide financing and low-carbon technologies to developing countries
Source: World Bank (2010) WDR 2010: Development and Climate Change.
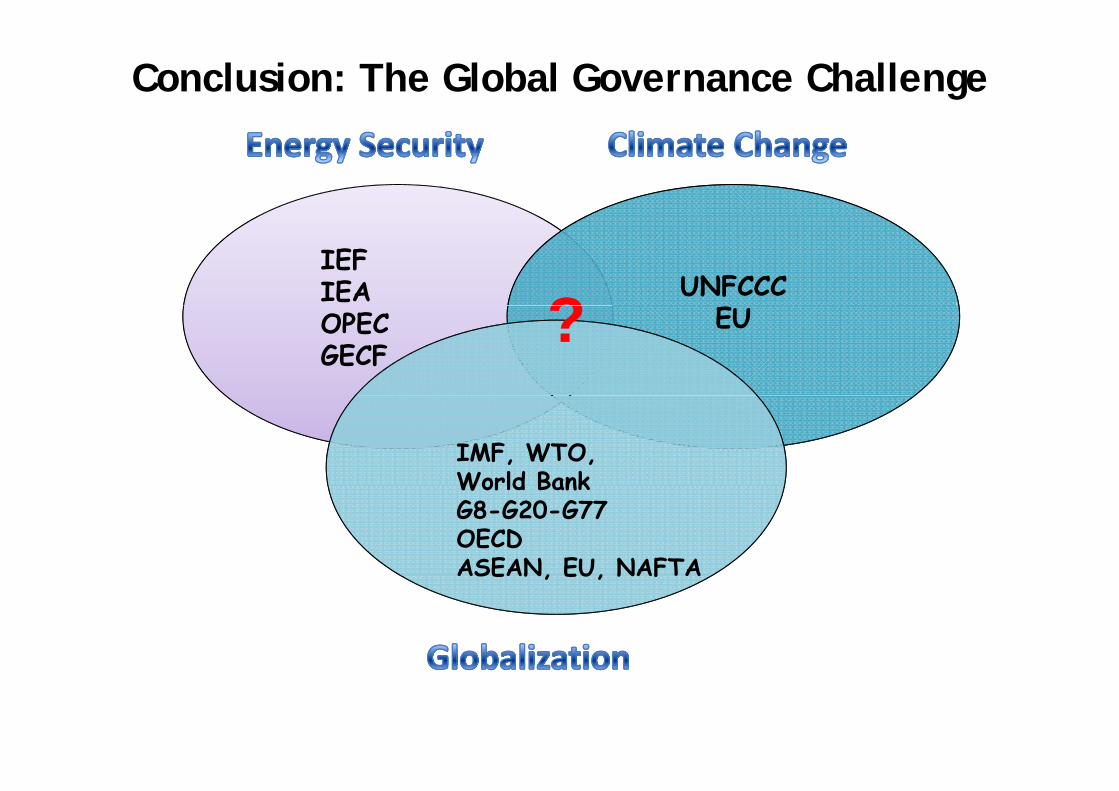
Conclusion: The Global Governance Challenge
UNFCCCUNFCCCIEFIEA ? EUEUOPECGECF
?
IMF, WTO,World BankWorld BankG8-G20-G77OECDASEAN, EU, NAFTAASEAN, EU, NAFTA
Thank youThank you