Embed Size (px)
Citation preview
___________________________________________________
DEPARTMENT OF HEALTH AND MENTAL HYGIENE
MENTAL HYGIENE ADMINISTRATION
MARYLAND’S PUBLIC MENTAL HEALTH SYSTEM
2011 PROVIDER SURVEY
___________________________________________________
EXECUTIVE SUMMARY
Page 1
Maryland’s PMHS: 2011 Provider Survey – Executive Summary
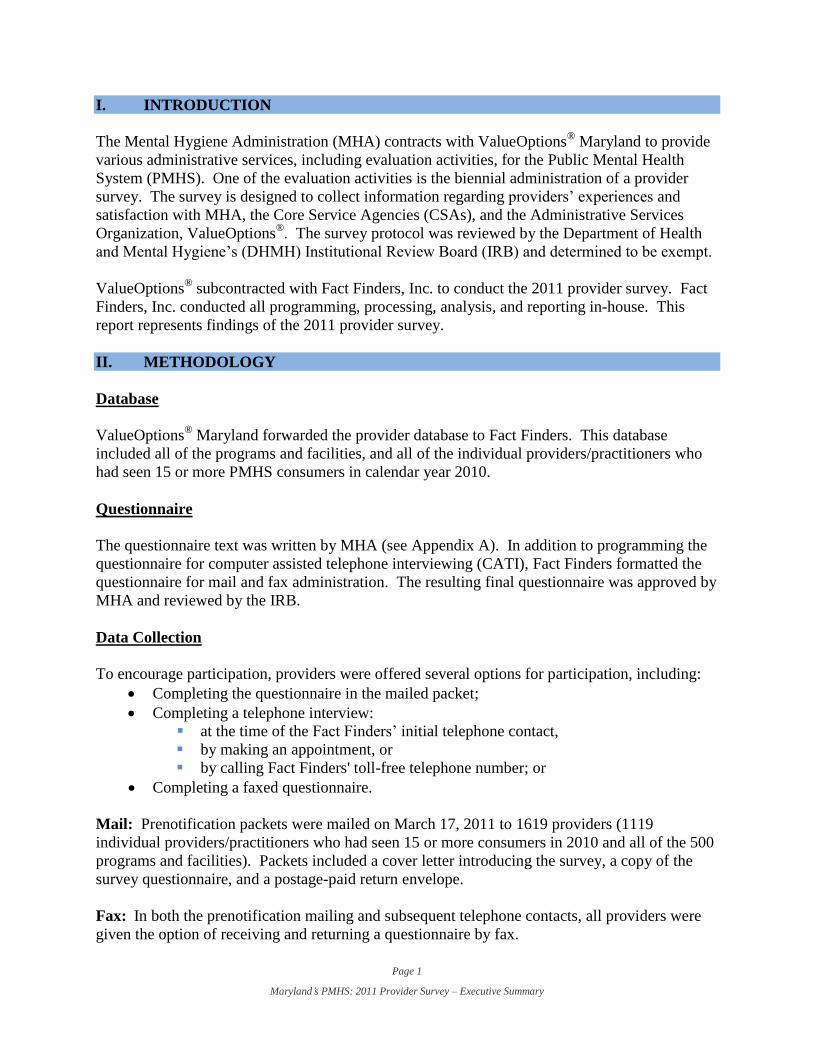
I. INTRODUCTION
The Mental Hygiene Administration (MHA) contracts with ValueOptions®
Maryland to provide
various administrative services, including evaluation activities, for the Public Mental Health
System (PMHS). One of the evaluation activities is the biennial administration of a provider
survey. The survey is designed to collect information regarding providers’ experiences and
satisfaction with MHA, the Core Service Agencies (CSAs), and the Administrative Services
Organization, ValueOptions®. The survey protocol was reviewed by the Department of Health
and Mental Hygiene’s (DHMH) Institutional Review Board (IRB) and determined to be exempt.
ValueOptions® subcontracted with Fact Finders, Inc. to conduct the 2011 provider survey. Fact
Finders, Inc. conducted all programming, processing, analysis, and reporting in-house. This
report represents findings of the 2011 provider survey.
II. METHODOLOGY
Database
ValueOptions® Maryland forwarded the provider database to Fact Finders. This database
included all of the programs and facilities, and all of the individual providers/practitioners who
had seen 15 or more PMHS consumers in calendar year 2010.
Questionnaire
The questionnaire text was written by MHA (see Appendix A). In addition to programming the
questionnaire for computer assisted telephone interviewing (CATI), Fact Finders formatted the
questionnaire for mail and fax administration. The resulting final questionnaire was approved by
MHA and reviewed by the IRB.
Data Collection
To encourage participation, providers were offered several options for participation, including:
Completing the questionnaire in the mailed packet;
Completing a telephone interview:
at the time of the Fact Finders’ initial telephone contact,
by making an appointment, or
by calling Fact Finders' toll-free telephone number; or
Completing a faxed questionnaire.
Mail: Prenotification packets were mailed on March 17, 2011 to 1619 providers (1119
individual providers/practitioners who had seen 15 or more consumers in 2010 and all of the 500
programs and facilities). Packets included a cover letter introducing the survey, a copy of the
survey questionnaire, and a postage-paid return envelope.
Fax: In both the prenotification mailing and subsequent telephone contacts, all providers were
given the option of receiving and returning a questionnaire by fax.
Page 2
Maryland’s PMHS: 2011 Provider Survey – Executive Summary
Toll-free telephone number: All providers were given the option of calling Fact Finders' toll-
free telephone number (800-895-FACT) at any time between 9 a.m. and 9 p.m. EST. Fact
Finders supports this number with an immediate warm transfer to an interviewer.
Telephone: All interviews were conducted in-house by Fact Finders' skilled staff interviewers
using a CATI system. Two weeks following the prenotification mailing, an initial call to
provider offices was made to reference the survey and schedule an appointment for an interview
between 9 a.m. and 9 p.m. local time on weekdays; an interviewer then called at the appointed
date and time. Commonly, repeated phone calls were required before the provider's schedule
permitted completion of the interview, and as many as 8 repeat phone calls were made before a
final disposition was assigned. All of the telephone interviews were conducted between March
30 and May 12, 2011.
Response
The total number of providers who participated in this survey is 293; the modes of participation
were as follows:
Telephone interview by appointment/outbound call: 64
Inbound calls to Fact Finders' toll-free telephone number: 36
Mailed back completed questionnaire: 127
Faxed back completed questionnaire: 66
Programs/Facilities Individual Providers/Practitioners
Initial Sample/
Mailed
Questionnaires
Completed
by Phone,
Fax, or Mail
Percentage
Completed
Initial Sample/
Mailed
Questionnaires
Completed
by Phone,
Fax, or Mail
Percentage
Completed
500 149 29.8% 1119 144 12.9%
III. SURVEY RESULTS: PROGRAMS/FACILITIES
Satisfaction with the Mental Hygiene Administration (MHA)
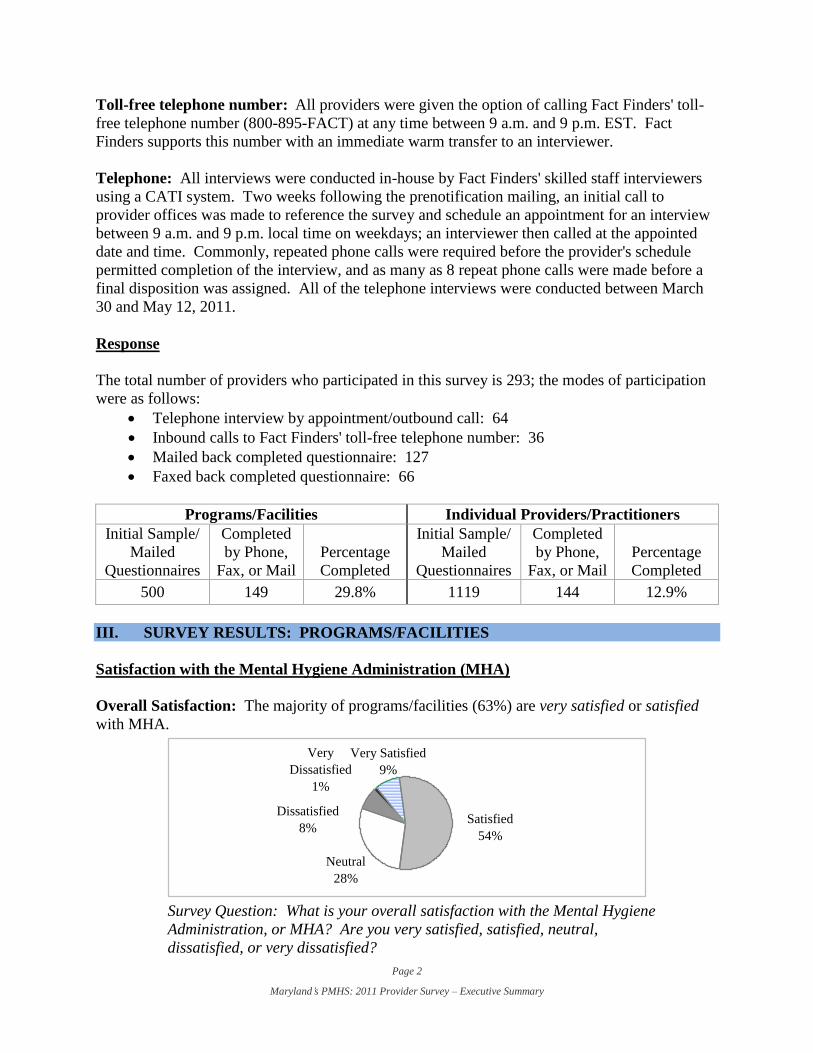
Overall Satisfaction: The majority of programs/facilities (63%) are very satisfied or satisfied
with MHA.
Very
Dissatisfied
1%
Satisfied
54%
Neutral
28%
Very Satisfied
9%
Dissatisfied
8%
Survey Question: What is your overall satisfaction with the Mental Hygiene
Administration, or MHA? Are you very satisfied, satisfied, neutral,
dissatisfied, or very dissatisfied?
Page 3
Maryland’s PMHS: 2011 Provider Survey – Executive Summary
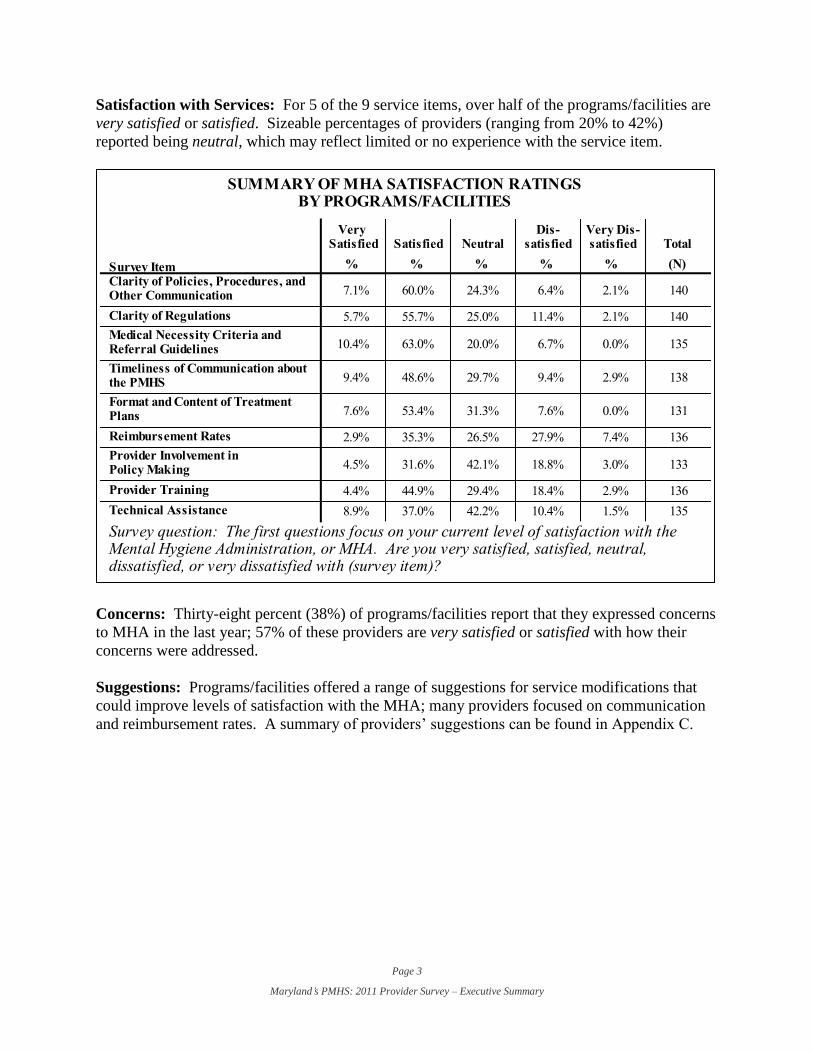
Satisfaction with Services: For 5 of the 9 service items, over half of the programs/facilities are
very satisfied or satisfied. Sizeable percentages of providers (ranging from 20% to 42%)
reported being neutral, which may reflect limited or no experience with the service item.
Concerns: Thirty-eight percent (38%) of programs/facilities report that they expressed concerns
to MHA in the last year; 57% of these providers are very satisfied or satisfied with how their
concerns were addressed.
Suggestions: Programs/facilities offered a range of suggestions for service modifications that
could improve levels of satisfaction with the MHA; many providers focused on communication
and reimbursement rates. A summary of providers’ suggestions can be found in Appendix C.
Page 4
Maryland’s PMHS: 2011 Provider Survey – Executive Summary
Satisfaction with the Core Service Agencies (CSAs)
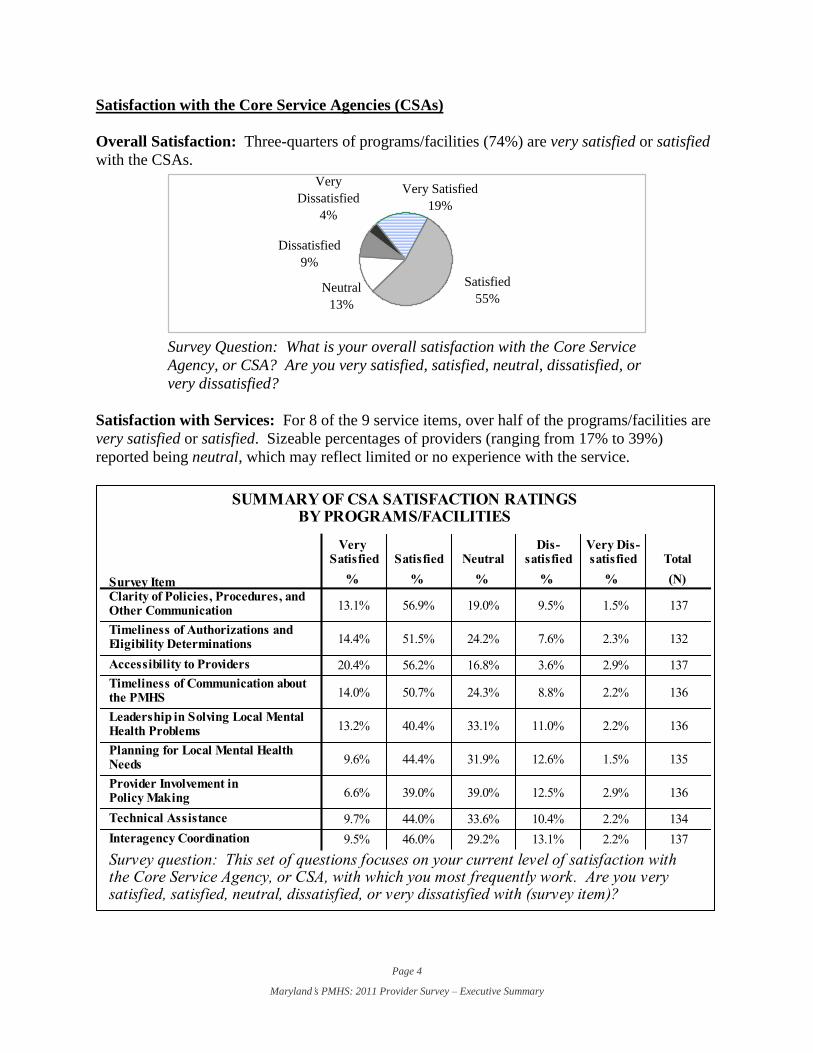
Overall Satisfaction: Three-quarters of programs/facilities (74%) are very satisfied or satisfied
with the CSAs.
Very
Dissatisfied
4%
Satisfied
55%Neutral
13%
Very Satisfied
19%
Dissatisfied
9%
Survey Question: What is your overall satisfaction with the Core Service
Agency, or CSA? Are you very satisfied, satisfied, neutral, dissatisfied, or
very dissatisfied?
Satisfaction with Services: For 8 of the 9 service items, over half of the programs/facilities are
very satisfied or satisfied. Sizeable percentages of providers (ranging from 17% to 39%)
reported being neutral, which may reflect limited or no experience with the service.
Page 5
Maryland’s PMHS: 2011 Provider Survey – Executive Summary
Concerns: Forty-four percent (44%) of programs/facilities report that they expressed concerns
to the CSA in the last year; 58% of these providers are very satisfied or satisfied with how their
concerns were addressed.
Suggestions: Programs/facilities offered a range of suggestions for service modifications that
could improve levels of satisfaction with the CSA; many providers focused on timeliness and
communication. A summary of providers’ suggestions can be found in Appendix C.
Satisfaction with ValueOptions® Maryland
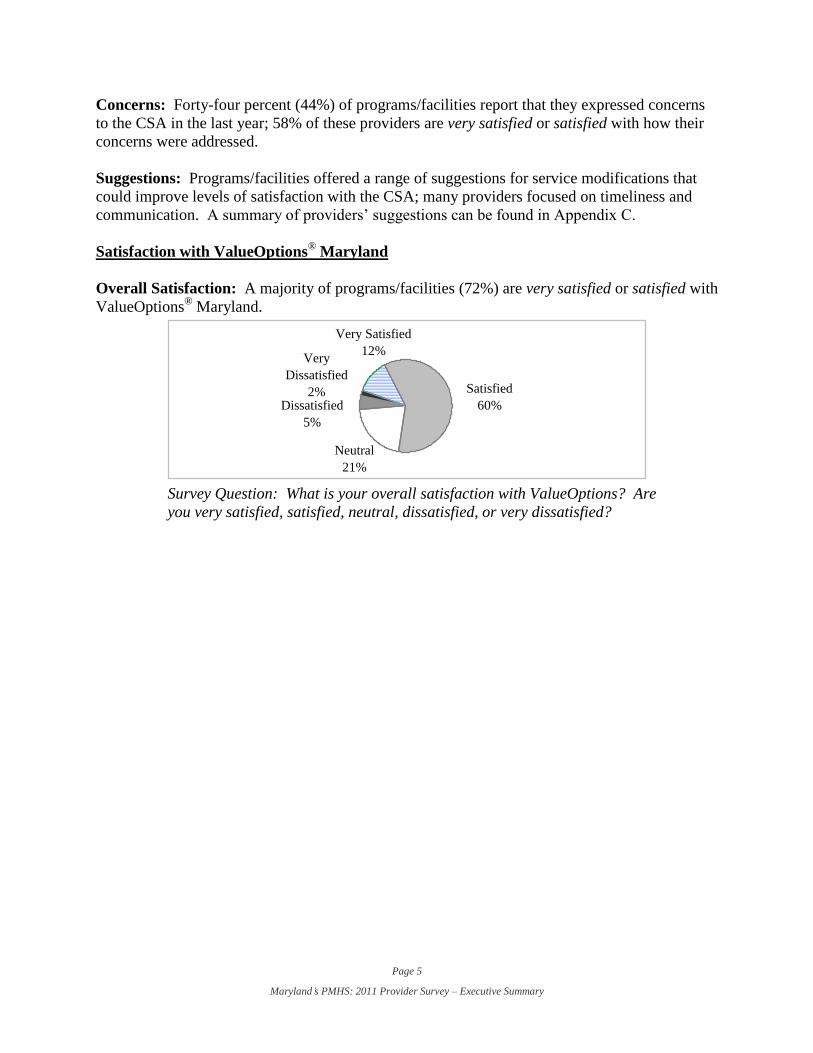
Overall Satisfaction: A majority of programs/facilities (72%) are very satisfied or satisfied with
ValueOptions® Maryland.
Very
Dissatisfied
2% Satisfied
60%
Neutral
21%
Very Satisfied
12%
Dissatisfied
5%
Survey Question: What is your overall satisfaction with ValueOptions? Are
you very satisfied, satisfied, neutral, dissatisfied, or very dissatisfied?
Page 6
Maryland’s PMHS: 2011 Provider Survey – Executive Summary
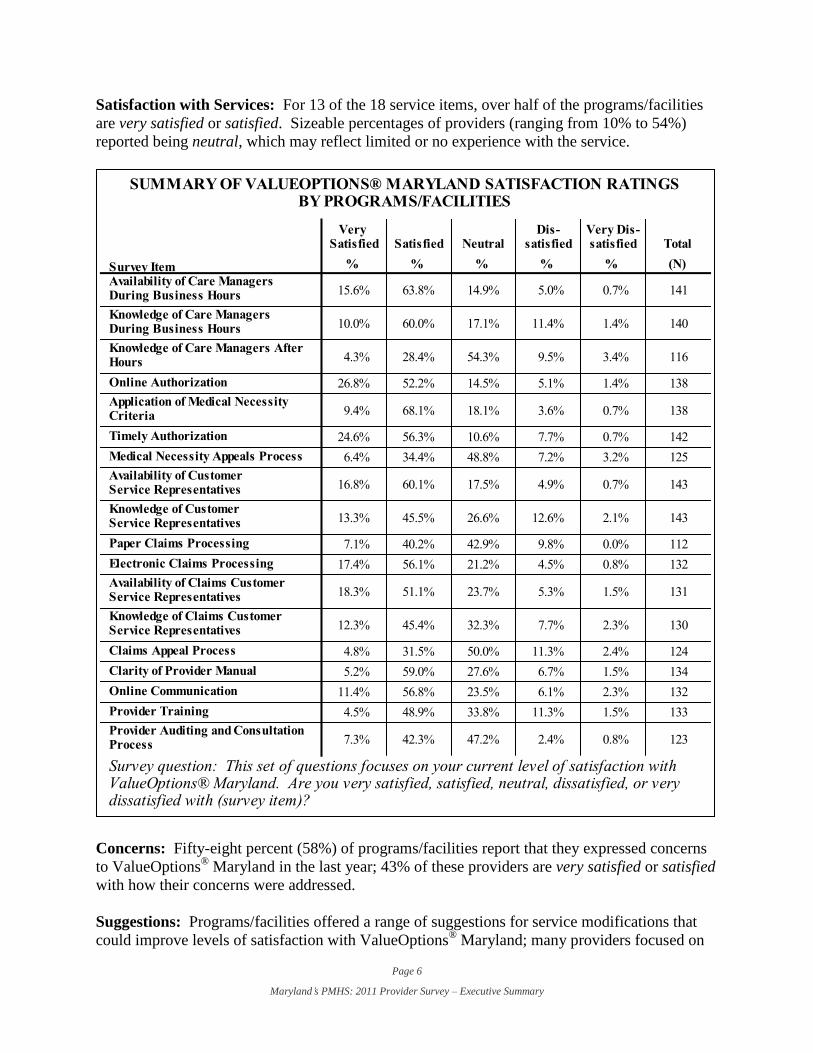
Satisfaction with Services: For 13 of the 18 service items, over half of the programs/facilities
are very satisfied or satisfied. Sizeable percentages of providers (ranging from 10% to 54%)
reported being neutral, which may reflect limited or no experience with the service.
Concerns: Fifty-eight percent (58%) of programs/facilities report that they expressed concerns
to ValueOptions® Maryland in the last year; 43% of these providers are very satisfied or satisfied
with how their concerns were addressed.
Suggestions: Programs/facilities offered a range of suggestions for service modifications that
could improve levels of satisfaction with ValueOptions® Maryland; many providers focused on
Page 7
Maryland’s PMHS: 2011 Provider Survey – Executive Summary
communication, authorization of care, and claims processing. A summary of providers’
suggestions can be found in Appendix C.
Ability to Meet Clinical Needs
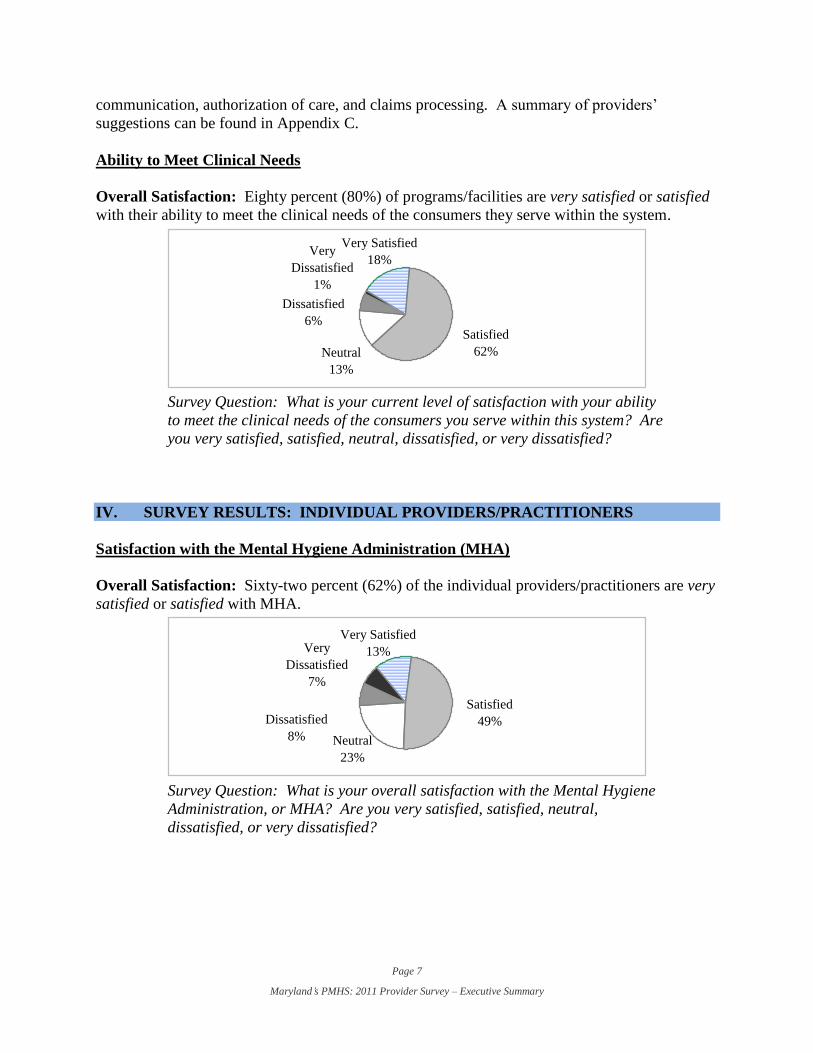
Overall Satisfaction: Eighty percent (80%) of programs/facilities are very satisfied or satisfied
with their ability to meet the clinical needs of the consumers they serve within the system.
Very
Dissatisfied
1%
Satisfied
62%Neutral
13%
Very Satisfied
18%
Dissatisfied
6%
Survey Question: What is your current level of satisfaction with your ability
to meet the clinical needs of the consumers you serve within this system? Are
you very satisfied, satisfied, neutral, dissatisfied, or very dissatisfied?
IV. SURVEY RESULTS: INDIVIDUAL PROVIDERS/PRACTITIONERS
Satisfaction with the Mental Hygiene Administration (MHA)
Overall Satisfaction: Sixty-two percent (62%) of the individual providers/practitioners are very
satisfied or satisfied with MHA.
Very
Dissatisfied
7%
Satisfied
49%
Neutral
23%
Very Satisfied
13%
Dissatisfied
8%
Survey Question: What is your overall satisfaction with the Mental Hygiene
Administration, or MHA? Are you very satisfied, satisfied, neutral,
dissatisfied, or very dissatisfied?
Page 8
Maryland’s PMHS: 2011 Provider Survey – Executive Summary
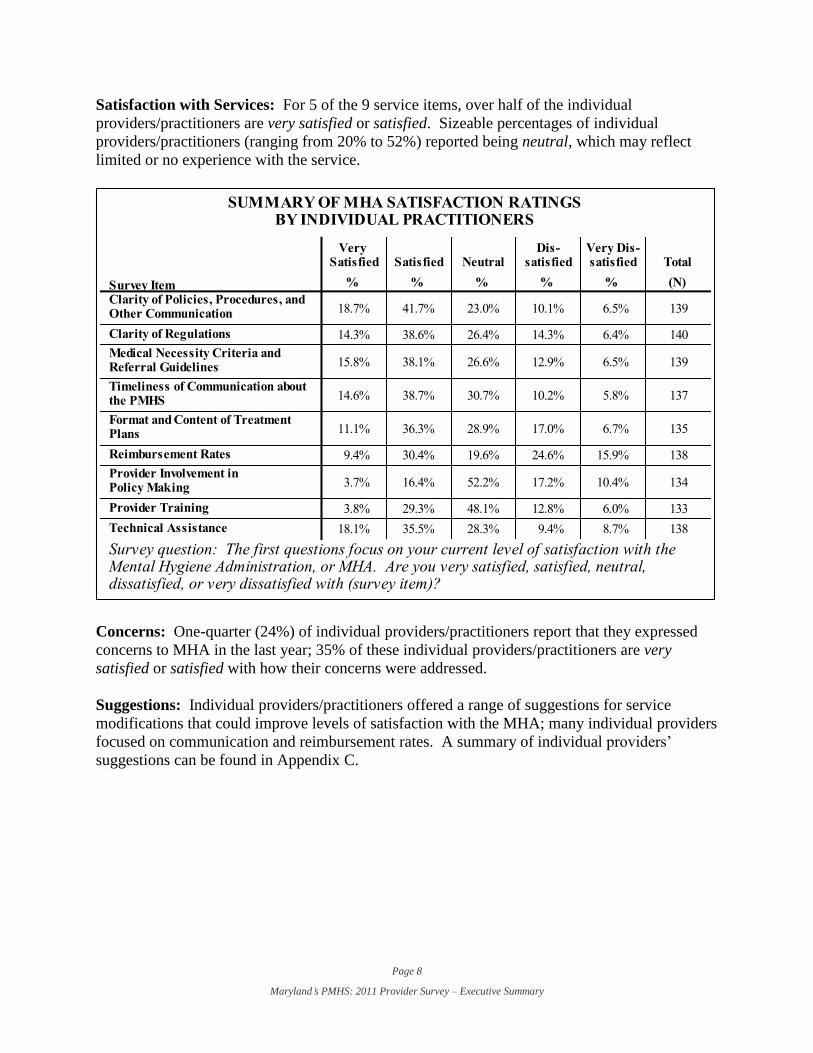
Satisfaction with Services: For 5 of the 9 service items, over half of the individual
providers/practitioners are very satisfied or satisfied. Sizeable percentages of individual
providers/practitioners (ranging from 20% to 52%) reported being neutral, which may reflect
limited or no experience with the service.
Concerns: One-quarter (24%) of individual providers/practitioners report that they expressed
concerns to MHA in the last year; 35% of these individual providers/practitioners are very
satisfied or satisfied with how their concerns were addressed.
Suggestions: Individual providers/practitioners offered a range of suggestions for service
modifications that could improve levels of satisfaction with the MHA; many individual providers
focused on communication and reimbursement rates. A summary of individual providers’
suggestions can be found in Appendix C.
Page 9
Maryland’s PMHS: 2011 Provider Survey – Executive Summary
Satisfaction with the Core Service Agencies (CSAs)
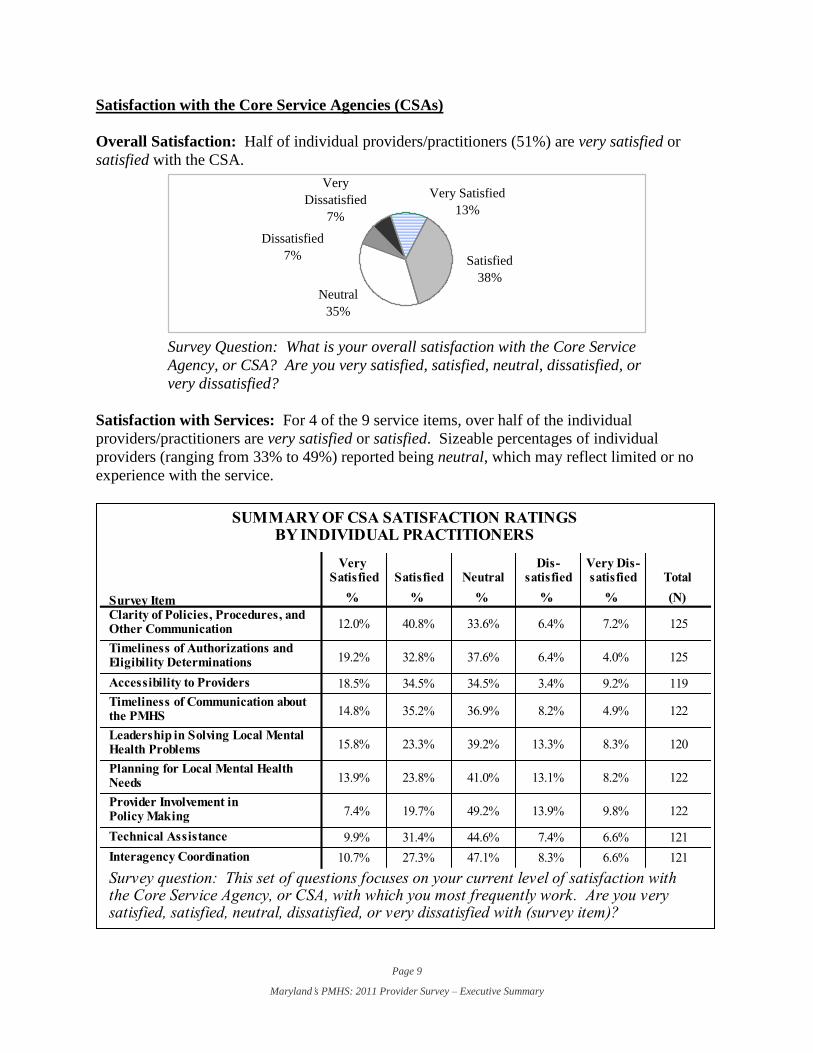
Overall Satisfaction: Half of individual providers/practitioners (51%) are very satisfied or
satisfied with the CSA.
Very
Dissatisfied
7%
Satisfied
38%
Neutral
35%
Very Satisfied
13%
Dissatisfied
7%
Survey Question: What is your overall satisfaction with the Core Service
Agency, or CSA? Are you very satisfied, satisfied, neutral, dissatisfied, or
very dissatisfied?
Satisfaction with Services: For 4 of the 9 service items, over half of the individual
providers/practitioners are very satisfied or satisfied. Sizeable percentages of individual
providers (ranging from 33% to 49%) reported being neutral, which may reflect limited or no
experience with the service.
Page 10
Maryland’s PMHS: 2011 Provider Survey – Executive Summary
Concerns: Twenty-one percent (21%) of individual providers/practitioners report that they
expressed concerns to the CSA in the last year; 38% of these individual providers are very
satisfied or satisfied with how their concerns were addressed.
Suggestions: Individual providers/practitioners offered a range of suggestions for service
modifications that could improve levels of satisfaction with the CSA; many individual providers
focused on timeliness and communication. A summary of individual providers’ suggestions can
be found in Appendix C.
Satisfaction with ValueOptions® Maryland
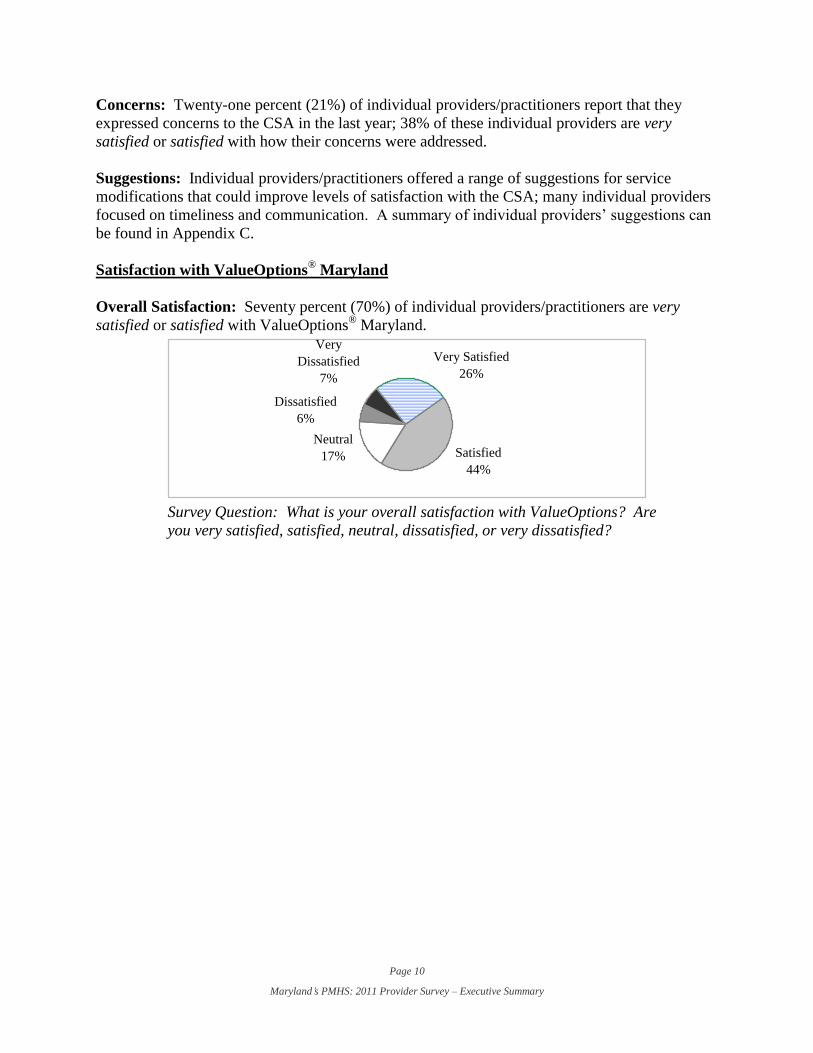
Overall Satisfaction: Seventy percent (70%) of individual providers/practitioners are very
satisfied or satisfied with ValueOptions® Maryland.
Very
Dissatisfied
7%
Satisfied
44%
Neutral
17%
Very Satisfied
26%
Dissatisfied
6%
Survey Question: What is your overall satisfaction with ValueOptions? Are
you very satisfied, satisfied, neutral, dissatisfied, or very dissatisfied?
Page 11
Maryland’s PMHS: 2011 Provider Survey – Executive Summary
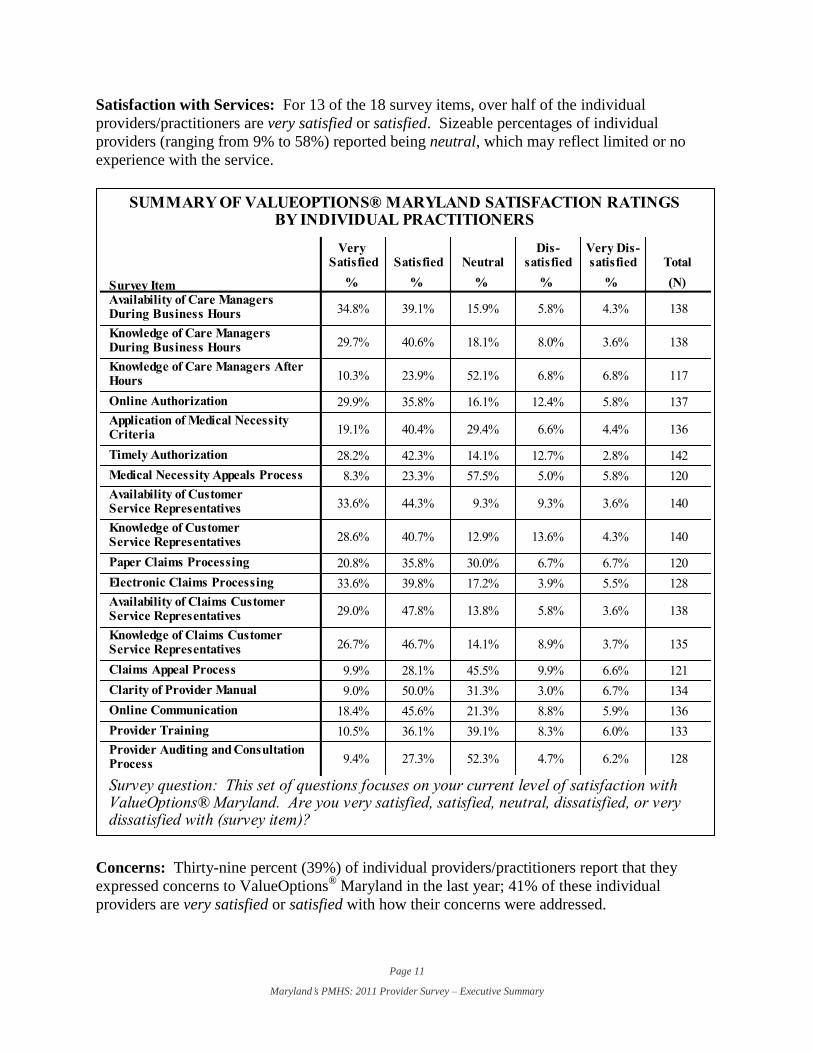
Satisfaction with Services: For 13 of the 18 survey items, over half of the individual
providers/practitioners are very satisfied or satisfied. Sizeable percentages of individual
providers (ranging from 9% to 58%) reported being neutral, which may reflect limited or no
experience with the service.
Concerns: Thirty-nine percent (39%) of individual providers/practitioners report that they
expressed concerns to ValueOptions® Maryland in the last year; 41% of these individual
providers are very satisfied or satisfied with how their concerns were addressed.
Page 12
Maryland’s PMHS: 2011 Provider Survey – Executive Summary
Suggestions: Individual providers/practitioners offered a range of suggestions for service
modifications that could improve levels of satisfaction with ValueOptions® Maryland; many
individual providers focused on communication, authorization of care, and claims processing. A
summary of individual providers’ suggestions can be found in Appendix C.
Ability to Meet Clinical Needs
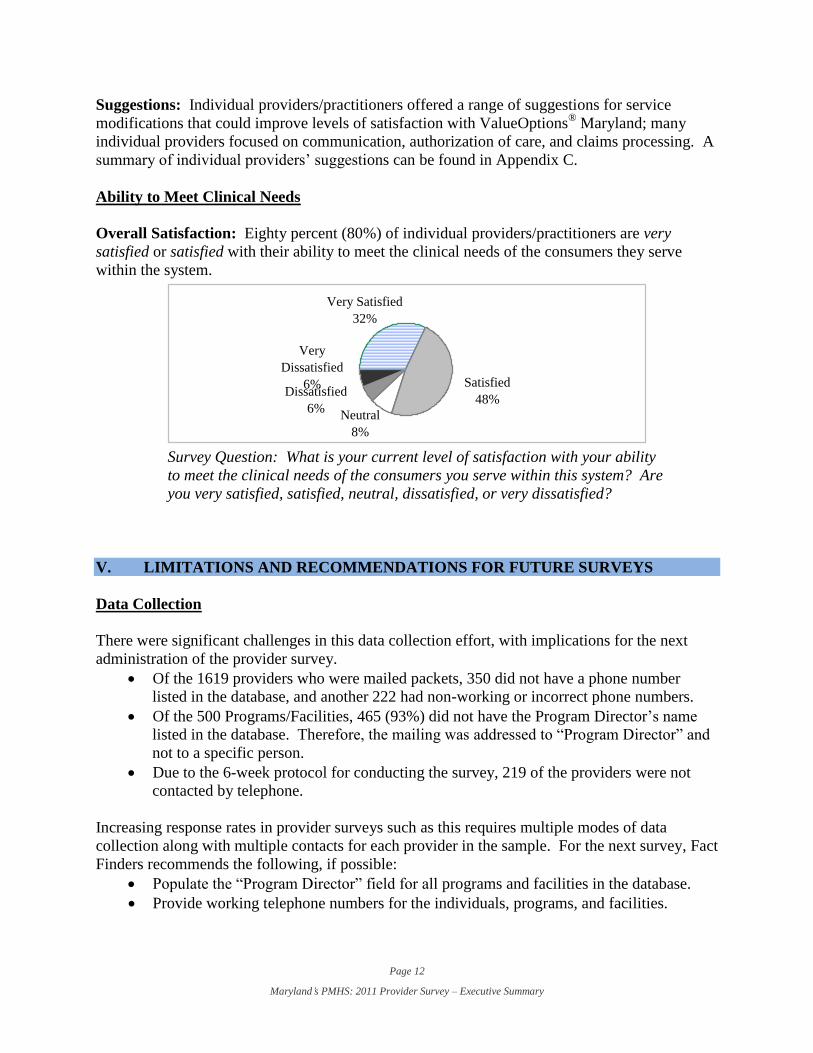
Overall Satisfaction: Eighty percent (80%) of individual providers/practitioners are very
satisfied or satisfied with their ability to meet the clinical needs of the consumers they serve
within the system.
Very
Dissatisfied
6% Satisfied
48%
Neutral
8%
Very Satisfied
32%
Dissatisfied
6%
Survey Question: What is your current level of satisfaction with your ability
to meet the clinical needs of the consumers you serve within this system? Are
you very satisfied, satisfied, neutral, dissatisfied, or very dissatisfied?
V. LIMITATIONS AND RECOMMENDATIONS FOR FUTURE SURVEYS
Data Collection
There were significant challenges in this data collection effort, with implications for the next
administration of the provider survey.
Of the 1619 providers who were mailed packets, 350 did not have a phone number
listed in the database, and another 222 had non-working or incorrect phone numbers.
Of the 500 Programs/Facilities, 465 (93%) did not have the Program Director’s name
listed in the database. Therefore, the mailing was addressed to “Program Director” and
not to a specific person.
Due to the 6-week protocol for conducting the survey, 219 of the providers were not
contacted by telephone.
Increasing response rates in provider surveys such as this requires multiple modes of data
collection along with multiple contacts for each provider in the sample. For the next survey, Fact
Finders recommends the following, if possible:
Populate the “Program Director” field for all programs and facilities in the database.
Provide working telephone numbers for the individuals, programs, and facilities.
Page 13
Maryland’s PMHS: 2011 Provider Survey – Executive Summary
Allow 2 months for conducting the telephone data collection. This would give adequate
time to follow-up on messages and busy signals, offer appointment dates and times, and
give every provider ample opportunity to participate by phone.
Consider adding an online survey component to the other data collection modes, as
another option for survey participation.
Questionnaire
Prior to fielding the next provider survey (in 2013), Fact Finders recommends:
Reviewing the responses to this survey, procedures that may have changed, suspected
weaknesses in service, and terminology to ensure that the survey is sufficiently updated
to best meet management and tracking needs.
Considering elimination of the “Neutral” response category. As noted above, large
percentages of providers selected the response option “Neutral.” The response
categories did not include an explicit response option for “Not Applicable,” “Did Not
Use,” or “Do Not Know.” Therefore, it is not possible to determine whether the
response “Neutral” means a neutral rating (neither positive nor negative), or whether it
reflects a lack of experience with or knowledge of the service item. Additionally,
including the “Neutral” responses in the analysis makes comparison between survey
items difficult. In using the survey data for management purposes, readers may want to
understand which items are viewed most negatively or most positively. The large and
varying proportions of “Neutral” responses may obscure the relative ranks of items,
making such comparative analysis difficult.
Providing greater clarity in the final section of the survey, so that providers can
correctly identify their provider type and professional affiliation (see Appendix A,
Survey Questionnaire). This would allow better analysis of survey responses by
provider discipline or program type.
VI. APPENDICES
Appendices to this report are posted on the Mental Hygiene Administration and ValueOptions®
Maryland Websites (www.dhmh.state.md.us/mha and http://maryland.valueoptions.com).
Appendix A: Provider Survey Letter and Questionnaire
Appendix B: Additional Survey Analyses
Appendix C: Summary of Provider Suggestions for Improvement
Martin O’Malley, Governor
Anthony G. Brown, Lt. Governor
Joshua M. Sharfstein, M.D., Secretary,
Department of Health and Mental Hygiene
Renata J. Henry, Deputy Secretary,
Behavioral Health and Disabilities
Brian Hepburn, M.D., Executive Director,
Mental Hygiene Administration
Contact Information
Mental Hygiene Administration
Spring Grove Hospital Center
Dix Building - Public Relations
55 Wade Avenue
Catonsville, Maryland 21228
410-402-8300
www.dhmh.state.md.us/mha
The services and facilities of the Maryland Department of Health and Mental Hygiene (DHMH)
are operated on a non-discriminatory basis. This policy prohibits discrimination on the basis of
race, color, sex, or national origin and applies to the provisions of employment and granting of
advantages, privileges, and accommodations.
The Department, in compliance with the Americans with Disabilities Act, ensures that qualified
individuals with disabilities are given an opportunity to participate in and benefit from DHMH
services, programs, benefits, and employment opportunities.