Embed Size (px)
Citation preview

A STUDY CONDUCTED ON CUSTOMER RELATIONSHIP MANAGEMENT
VISVESVARAYA TECHNOLOGICAL UNIVERSITY, BELGAUM
In partial fulfilment
MASTER OF
INTERNAL GUIDE
MR. MANJUNATHA S.
Department of MBA
CMR INSTITUTE OF TECHNOLOGY
#132, AECS Layout, IT Park Road, Bangalore
CUSTOMER RELATIONSHIP MANAGEMENT
FORD MOTORS
BY
MUBEEN AHMED
1CR18MBA26
Submitted to
VISVESVARAYA TECHNOLOGICAL UNIVERSITY, BELGAUM
fulfilment of the requirements for the award of the degree of
MASTER OF BUSINESS ADMINISTRATION
Under the guidance of
INTERNAL GUIDE EXTERNAL GUIDE
Mrs. MANISHA HERUR
Department of MBA
CMR INSTITUTE OF TECHNOLOGY
#132, AECS Layout, IT Park Road, Bangalore-560037
Batch-2018-20
CUSTOMER RELATIONSHIP MANAGEMENT ATCAUVERY
VISVESVARAYA TECHNOLOGICAL UNIVERSITY, BELGAUM
of the requirements for the award of the degree of
EXTERNAL GUIDE
s. MANISHA HERUR
CMR INSTITUTE OF TECHNOLOGY

A STUDY CONDUCTED ON CUSTOMER RELATIONSHIP MANAGEMENT ATCAUVERY
FORD MOTORS
BY
MUBEEN AHMED
1CR18MBA26
Submitted to
VISVESVARAYA TECHNOLOGICAL UNIVERSITY, BELGAUM
In partial fulfilment of the requirements for the award of the degree of
MASTER OF BUSINESS ADMINISTRATION
Under the guidance of
INTERNAL GUIDE EXTERNAL GUIDE
MR. MANJUNATHA S. Mrs. MANISHA HERUR
Department of MBA
CMR INSTITUTE OF TECHNOLOGY
#132, AECS Layout, IT Park Road, Bangalore-560037
Batch-2018-20


CMR INSTITUTE OF TECHNOLOGY
Department of Management Studies & Research Centre
132, AECS Layout, IT Park Road
Bangalore – 560037.
DECLARATION
I, MUBEEN AHMED here-by declare that the Project report on “A STUDY CONDUCTED ON
CUSTOMER RELATIONSHIP MANAGEMENT AT CAUVERY FORD MOTORS ” is prepared by
me under the guidance of MR. MANJUNATHA S., Assistant Professor of Department of Management
Studies, CMR Institute of Technology and with assistance of Mrs.Manisha Herur.
I also declare that this project work is towards the partial fulfilment of the university regulations for the
award of degree of Master of Business Administration by Visvesvaraya Technological University, Belagavi.
I have undergone a winter internship for a period of six weeks. I further declare that this report is based on
the original study undertaken by me and has not been submitted for the award of any degree/diploma from
any other University / Institution.
Place:-Bangalore
Signature of the student

ACKNOWLEDGEMENT
At the very outset of engaging myself in to the Project Report. I would like to express my sincere gratitude
to all those who extended their not only to convey their best wishes but also to give me support on this hi-
undertone path. This Project Report on my six weeks practical training at “CAUVERY FORD MOTORS.”
as a part of my course curriculum of my MBA. This project could not have been completed without timely
suggestion advice and co-operation of a lot of persons.
I record indebtedness to our principal Dr. Sanjay Jain, for his guidance and sustained encouragement for
the successful completion of the project.
I am highly grateful to Prof.SANDEEP KUMAR, Head of the Department of management studies and
research for the support and timely assistance rendered for the internship to come out with flying colours.
I am extremely thankful and pay my gratitude to Mr.Manjunatha S., Assistant Professor -Department of
Management Studies,CMRIT, Bangalore. For his valuable guidance and support on completion of this
project in its presently.
I am greatly obliged toby Mrs.ManishaHerur (HR, Cauvery Ford Motors.) who accommodated me for
training in this esteemed organization.
I am highly thankful to Mrs. Shanti Priya(Marketing manager,Cauvery Ford Motors.) who provided me an
opportunity to work and also guided me at every stage on my project. Her proper direction and consult
inspiration proved to be an asset for this project.
I am also equally thankful to Mr.Abhishek Kumar (Sales Head, Cauvery Ford Motors.) who taught me
every minute aspect of sales and marketing.
A special appreciative “Thank you” in accorded to all staff of “Cauvery Ford Motors”,Bangalore, for their
positive support.
I also acknowledge with a deep sense of reverence, my gratitude towards my parents and member of my
family, who have always supported me morally as well as economically.
MUBEEN AHMED

TABLE OF CONTENTS
SL NO. CHAPTERS PAGE NO.
EXECUTIVE SUMMARY 1
1
CHAPTER 1 – INTRODUCTION
1.1 Introduction
1.2 Industry Profile
1.3 Company Profile
1.4 Product Profile
1.5 Infrastructure facilities
1.6 Competitor’s information
1.7 SWOT analysis
1.8Financial statements
2-14
2
2
4
7
9
10
11
13
2 CHAPTER 2 – CONCEPTUAL BACKGROUND AND
LITERATURE REVIEW
2.1 Theoretical Background of Study
2.2 Literature Review
15 – 21
16
19
3
CHAPTER 3 – RESEARCH DESIGN
3.1 Statement of the problem
3.2 Need of the study
3.3 Objective for the study
3.4 Scope of the study
3.5 Research design
3.6 Data collection
3.7 Data analysis
3.8 Limitations of the study
21-34
22
22
23
24
24
26
26
26
4 CHAPTER 4 – ANALYSIS AND INTERPRETATION 27-60
5 CHAPTER 5 – FINDINGS, SUGGESTIONS AND
CONCLUSIONS
61-63
6 Bibliography 64-66

LIST OF TABLES
TABLE NO. PARTICULARS PAGE NO.
1 Table showing customers educated about the vehicles 33
2 Table showing employees are well dressed and neat in
appearance
34
3 Table showing awareness of customer requirement by the
employees
35
4 Table showingsincere interest in solving customers
problems
36
5 Table showing mode of purchase was convenient 37
6 Table showing provides services at the time promised 38
7 Table showing delivery time offered to customers was
satisfactory
39
8 Table showing offers prompt services to customers 40
9 Table showingambience of the showroom was good 41
10 Table showingattitude of sales person was good 42
11 Table showing complaints noted and improvement done 43
12 Table showing customers feel safe in their transactions 44
13 Table showing employees are courteous at all times 45
14 Table showing have the knowledge to answer customers
questions
46
15 Table showing overall customers experience of the
dealers was satisfactory
47

LIST OF GRAPHS
CHART NO. PARTICULARS PAGE NO.
1 Graph showing customers educated about the vehicles 34
2 Graph showing employees are well dressed and neat in
appearance
35
3 Graph showing awareness of customer requirement by
the employees
36
4 Graph showing sincere interest in solving customers
problems
37
5 Graph showing mode of purchase was convenient 38
6 Graph showing provides services at the time promised 39
7 Graph showing delivery time offered to customers was
satisfactory
40
8 Graph showing offers prompt services to customers 41
9 Graph showing ambience of the showroom was good 42
10 Graph showing attitude of sales person was good 43
11 Graph showing complaints noted and improvement done 44
12 Graph showing customers feel safe in their transactions 45
13 Graph showing employees are courteous at all times 46
14 Graph showing have the knowledge to answer customers
questions
46
15 Graph showing overall customers experience of the
dealers was satisfactory
47

1
EXECUTIVE SUMMARY
A report on Customer Relationship Management (CRM) of sales process and aftersales
service for Ford’s products was conducted in Bangalore on behalf of Cauvery Ford. The
study was undertaken to understand CRM of sales process & after sales. And to ascertain
different perceptions of customers regarding atmosphere of showroom, salesperson’s
behavior and the monetary aids to improve the service it provides and make it more aligned
to the customer’s needs.
Survey method was used and non-disguised questionnaire was designed to carry out the
research. The customers of ford car were traced & requested to answer the questionnaire at
diff places at diff parts of Bangalore city. During the survey of four week a total sample size
of 157 were collected. The questions asked in the questionnaire were related to the period of
purchase, how they came to know about this bike, buying criteria (cash/credit), their
understanding of the atmosphere of the show room, salesperson’s behaviour, product
briefing. The five important reasons for considering Ford car are the importance given to the
different features of the Ford car like- mileage, low maintenance, brand loyalty, ease of
handling, power, style, engine performance etc. An effort was also made to know about the
most popular competitor brand in the mind of the Ford customers.
On the basis of the response given by the customer in a questionnaire the data was
processed, classified, tabulated, analyzed, & interpreted & the final conclusion was drawn &
recommendations were given to the company to improve the customer service.

2
CHAPTER 1
Introduction:
Ford, a USA-based multinational automaker, manufactures automobile and engines
produced at its manufacturing facilities in Chennai and Sanand. From the initiation of its
operations in India in 1995, Ford has spent over 2 billion USD in an attempt to further
enlarge its operations to fulfil the surging demand in India. Ford’s factory outlet in
Maraimalai Nagar, near Chennai, manufactures and produces a lot of cars including the
award-winning Ford EcoSport and Ford Endeavour. Later in 2015, Ford inaugurated its
1billion USD manufacturing facility in Sanand, Gujarat. Now, Ford has doubled its annual
production capacity.
Ford India’s largest product line-up for the India offers a car that fits the requirements of
each individual. Later in 2016, Ford gave its consumer-base in India their first-ever chance
to own the Ford Mustang.
Ford is also continuing to make India a hub for production of small-sized cars and low-
displacement engines. Ford has now begun an aggressive export plan and currently, sends
Figo, Aspire & EcoSport to 40+ markets across the globe.
.
INDUSTRY PROFILE
BIRTH OF CARS
The evolution of cars took place over years and in late 1800s.
In 1769, first steam-propelled car was designed and constructed by Nicolas Cugnot with a
top speed of 6 kms/hr. He once again designed another steam-propelled engine in 1771
which was way faster than its predecessor.
In late 1886, the car was rolled down in the streets and the experiments continued, and in
USA, Ford began working on a concept, during which achieved major breakthroughs were
achieved by him. In l896 he completed his first car- the Ouadricycle, a car run by a twin-
cylinder gasoline engine.
3
THE HISTORY OF CARS
The two pioneers, Gottlieb Damlier and Karl Benz, who invented the only cars to be
powered by the IC engine in 1885. As time went on, the petrol engine came into the
picture, which transformed cars into a practical commute option.
EVENTS AND MILESTONE
Below is a sneak-peak of India's most successful industries.
1928- First ever imported car was in India
1942- Hindustan Motors g o t incorporated
1944- Premier automobiles was instituted
1948- First car was manufactured in India
1953- The India Government declared that only the organization with a
manufacturing program should be allowed to operate within the confines of India.
1955. Back then only HM, API, ALL, SMPIL, PAL, M& M and TELCO- received
approval from the Govt. of India
1960 - 1970 - The two, three wheeler had set a firm grip in the India.
1980s- After liberalization was declared by the Indian Government, the liberty enjoyed by
the car manufacturers in India until then slowly began to wane. This epoch was also saw the
arrival of a large numerous organizations in India
The Government also formed coalition with Japan’s Suzuki, which resulted in the formation
of India's most profitable car brand- the Maruti Suzuki.
1991 – According to the Government's new policies, license-raj was dispensed with, and the
automobile sector was permitted to grow quite freely. In 1993, with liberalization, many
MNCs like Peugeot, GM, Mercedes Benz and Fiat entered India.
1997 - The Government of India also formed new laws for emission norms to be met by
companies in India. These new rules were based on similar policies adopted across Europe.

4
COMPANY PROFILE
Ford entered the car-making world in June of 1903. With around $30,000, the industrialists
had just partnered to create one of the world's car making companies. Only a handful of
automakers are as widely, and perhaps as closely, identified with the progression of
automobile industry as Ford.
Mass Production on the Line
One of Ford’s most historic achievements to automotive manufacturing was its dynamic
assembly line. After being implemented in 1913, the novel technique allowed workers to
stay in on the same task again and again on numerous cars that were passed by them. This
method proved to be very effective, helping Ford in surpassing the manufacturing rates of
other players.
The First Vehicles
Henry Ford came to the conclusion that the organization's future lies in the production of
affordable cars that the average man can buy. Since its inception in 1903, Ford began using
the English alphabet for the nomenclature of new models. In 1908, the Model T was
released, and for was well on its way to becoming a global giant in automaking. Ford bought
the Lincoln Motor Company in 1925 to enter the luxury niche.
Becoming a Global Company
In 1956, the company went public and the opportunity to buy shares of Ford was available,
and the company recorded around 300,000 new shareholders. Henry Ford II's astute
understanding of the upcoming trends in the 1950's resulted in the growth of Ford globally.
In 1967, ford of Europe was formed.
Ford started off with one man’s dream of meeting the needs of people around the globe, now
the company begun its second century of existence with the motto of retaining and
expanding.
Ford Vision
To become the world's leading Consumer Company for automotive products and services.

5
Ford Mission
We are a global family with a proud heritage passionately committed to providing personal
mobility for people around the world. We anticipate consumer need and deliver outstanding
products and services that improve people's lives.
Ford Values
Our business is driven by our consumer focus, creativity, resourcefulness, and
entrepreneurial spirit. We are an inspired, diverse team. We respect and value everyone's
contribution. The health and safety of our people are paramount. We are a leader in
environmental responsibility. Our integrity is never compromised and we make a positive
contribution to society. We constantly strive to improve in everything we do.
Ford’s Journey in India
Ford began its services in India in 1907 when the country imported Ford’s first Model A. In
1926, Ford India was instituted, but due to unforeseen complications, operations were halted
in 1954. Ford re-entered the Indian market in 1969, manufacturing tractors in collaboration
with Escorts Ltd., until 1991.
Ford, in 1995, India Govt. of India’s approval to bring in place Mahindra Ford India,
Limited (MFIL), a coalition with Mahindra & Mahindra Ltd. Within 10 months after
government approval, Mahindra Ford launched European Escort- the then best-selling
model.
Noteworthy milestones
In 1996, the maiden Indian-built Ford Escort rolled off the plant.
Its operational efficiencies and customer-centricity saw Ford’s rise in
popularity in the Indian car, following which it delivered Ford Escort
across India
In 1997, the launch of SVP program, a successful marketing strategy of Ford,
implemented in automobile markets worldwide.
in 1997 and 1998, Ford also topped the Customer Satisfaction Index (CSI)
ratings for two consecutive years.
One of Ford's branded service initiatives includes Quality Care, which provides car owners a
better service experience at its dealerships across India.

6
DEALER PROFILE
Cauvery Ford, formed in late 1996, is an authorized dealer for Ford India Ltd.
It was three entrepreneurs, namely M/s. M.P. Shyam, A.C. Krishna Raju and S.V.S.
Subramanya Gupta.
Cauvery Ford markets the popular Ford Ikon, through its service outlets in Bangalore,
Mysore, Mangalore and Shimoga. The outlets are located at strategic places in the cities.
Cauvery Ford’s sales team is packed with skilled professionals mentored by Ford India Ltd.
The service centers are furnished with modern equipment and is aligned with Ford's
international standards.
Facilities
Cauvery Ford provides world-class facilities to ensure all customers get the best experience
from of their cars.
Service Centre
Test Drive Body
Shop Service
Booking
Insurance
Auto Finance
7
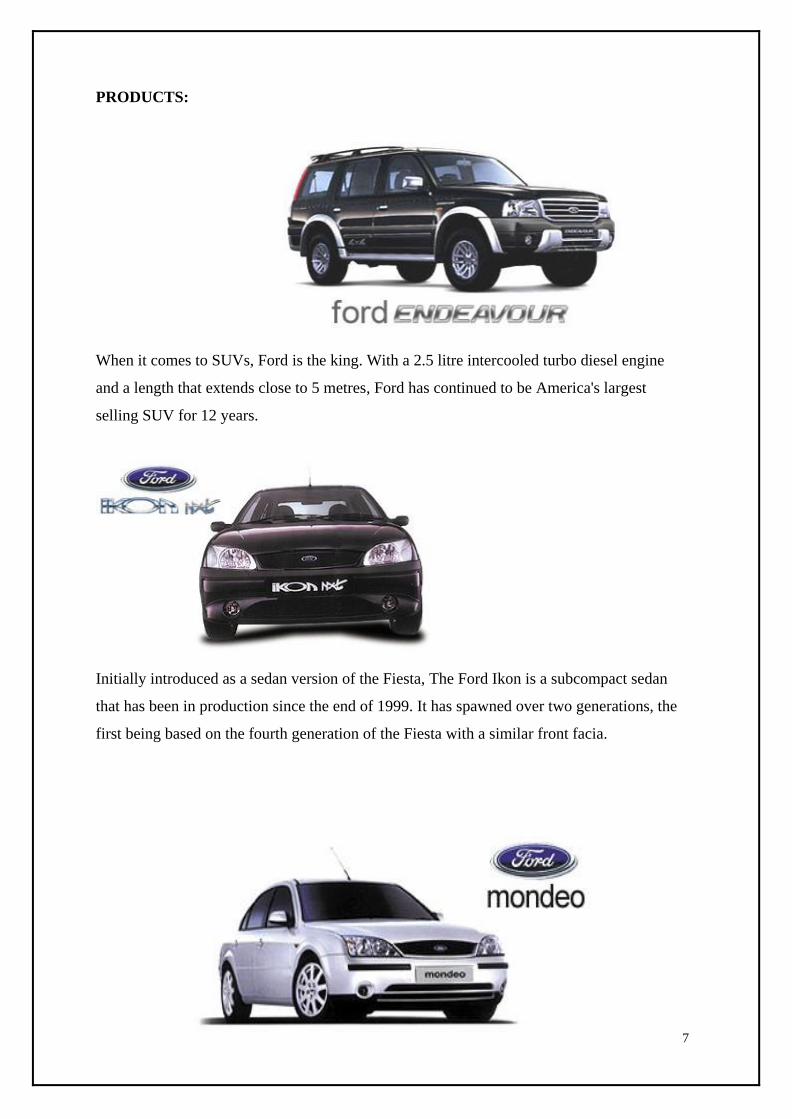
PRODUCTS:
When it comes to SUVs, Ford is the king. With a 2.5 litre intercooled turbo diesel engine
and a length that extends close to 5 metres, Ford has continued to be America's largest
selling SUV for 12 years.
Initially introduced as a sedan version of the Fiesta, The Ford Ikon is a subcompact sedan
that has been in production since the end of 1999. It has spawned over two generations, the
first being based on the fourth generation of the Fiesta with a similar front facia.

8
The brand new Mondeo is one of the best cars in its category, with almost an endless list of
strengths. It offers a beautiful co-ordination of handling and stability. Ford Mondeo's
modern protection system activates safety mechanism in split-second to provide complete
protection against accidents. The brilliant performance of the 145 PS engine allows
seamless overtaking insinuations where others fear to tread.
FORD FIESTA
Designed specifically to adapt to Indian road conditions, the Fiesta offer exceptional driving
comfort. The high-end suspension is specially made to better absorb road surface
disturbances. Optimised steel strength in key parts along with chassis reinforcement,
ensures occupants are provided with maximum protection.
FUS ION
Robust and agile, Ford Fusion is second to none. Inspired by the latest designs, it introduces
a refreshing new dimension to urban commute. With a seating capacity of up to five adults,
the 60:40 split rear seats is its USP, and not to mention its head, shoulder and leg room
ensures a comfortable journey- long or short.

9
INFRASTRUCTURE FACILITIES :
Branches
1. Bangalore
2. Mangalore
3. Shimoga
4. Mysore
Below are some of the facilities provided by Cauvery Ford to all of its
esteemed customers:
24 hours Service.
The Ford Extended Warranty,
Pickup and Drop facilities.
Minimum downtime of cars.
Free check-ups for corporate customers.
Customer Care
24 hours Emergency Roadside Assistance.
The owners of Ford’s Ikon and Escort can get their cars serviced at any Cauvery Ford
Service Centre. It boasts the modern equipment and is operated by Ford-trained mechanics.
Its employees emphasize quality of work and can attend to 50-60 daily.
Service Centre
The service station is fully equipped
Emission check and certification
A distinct customer reception bay for joint inspection
Appointment system for personalised reception
Extended working hours from 7.00 am - 9.00 pm.
Certified trained mechanics by Ford.
Upgraded refrigerant management systems.
Computerized wheel alignment and engine analyzer.
Hi-tech jig to correct deformities of body and chassis
Advanced paint booth
Head light-beam aligner and key cutting machines.

10
Auto-colour paint mixing system.
COMPETITORS:
Brigade Honda
Anant Cars Auto
Kalyani Motors
Blue Hyundai
Nexa
Sireesh Auto

11
Strengths :
SWOT ANALYSIS
1. Ford is amongst the earliest car manufacturers
2. It offers an exhaustive range of cars to its customers to choose from
3. Ford invested in the go green initiative in order to help the environment
4. Ford is a global brand with over 190,000 employees globally
5. It has a global footprint
6. Ford is an active participant in motorsports like Formula One, Rally, Sport cars, etc.
7. Ford also produces high quality buses, trucks and more.
Weaknesses:
1. High brand switching as a result of a lot of options available
2. Intense competition from other manufacturers has resulted in limited market share growth for
Ford

12
Opportunities:
1. The ever-expanding automobile sector’s potential can be tapped by Ford
2. Improving business stability and growth because of expansion of consumer base
3. Capitalizing on market opportunities with cars exclusively designed for different regions
Threats:
1. Competition from other automakers like Maruti and Hyundai can reduce Ford's market share
2. Ford, owing to its global presence, it is bound to be affected by global economic crisis
13
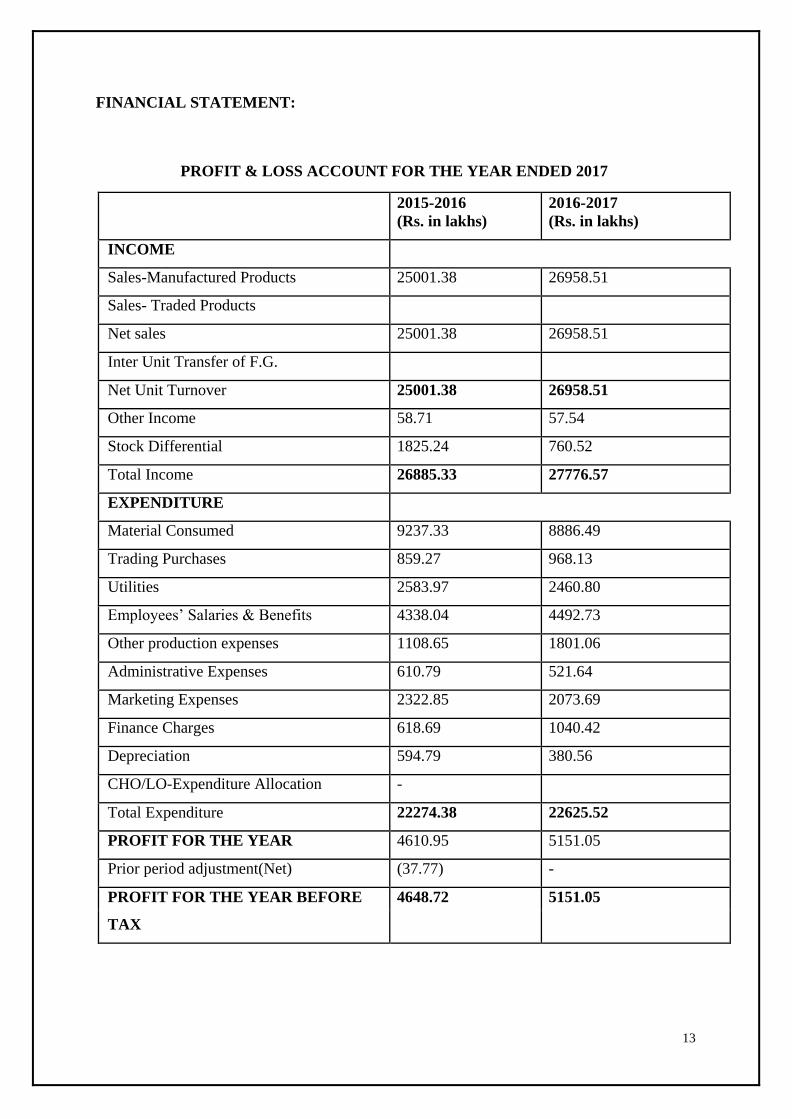
FINANCIAL STATEMENT:
PROFIT & LOSS ACCOUNT FOR THE YEAR ENDED 2017
2015-2016
(Rs. in lakhs)
2016-2017
(Rs. in lakhs)
INCOME
Sales-Manufactured Products 25001.38 26958.51
Sales- Traded Products
Net sales 25001.38 26958.51
Inter Unit Transfer of F.G.
Net Unit Turnover 25001.38 26958.51
Other Income 58.71 57.54
Stock Differential 1825.24 760.52
Total Income 26885.33 27776.57
EXPENDITURE
Material Consumed 9237.33 8886.49
Trading Purchases 859.27 968.13
Utilities 2583.97 2460.80
Employees’ Salaries & Benefits 4338.04 4492.73
Other production expenses 1108.65 1801.06
Administrative Expenses 610.79 521.64
Marketing Expenses 2322.85 2073.69
Finance Charges 618.69 1040.42
Depreciation 594.79 380.56
CHO/LO-Expenditure Allocation -
Total Expenditure 22274.38 22625.52
PROFIT FOR THE YEAR 4610.95 5151.05
Prior period adjustment(Net) (37.77) -
PROFIT FOR THE YEAR BEFORE 4648.72 5151.05
TAX

14
BALANCE SHEET FOR THE YEAR ENDED 2017
2015-2016
Lakhs)
(Rs in 2016-2017 (Rs in Lakhs)
SOURCES OF FUNDS
SHAREHOLDER FUNDS
Share Capital 37003.24 40502.77
Reserves & Surplus 4648.72 515105
Secured Loans 1085.08 191.85
TOTAL 42737.04 45845.68
APPLICATION OF FUNDS FIXED
ASSETS
Gross Block 10583.68 11348.79
Less: Depreciation 5802.79 6156.75
Net Block 4780.89 5192.04
Capital Work-in-progress 992.85 0.00
TOTAL 5773.74 5192.04
CURRENT ASSETS, LOANS &
ADVANCES
Inventories 4192.68 2603.24
Sundry Debtors 8254.86 16451.70
Cash & Bank Balance 12512.47 50525.15
Other Current Assets 0.00 61.28
Loan & Advances 496.51 534.42
TOTAL 25456.52 70175.79
Less: CURRENT LIABILITIES &
PROVISIONS
Liabilities -25247.91 6118.63
Provisions 363.65 692.44
Total (24884.26) 6811.07
Net current assets 50340.78 63364.72
NET WORTH 56114.51 68556.76
Other units Control A/C -13377.47 -8235.67
TOTAL 42737.04 60321.08
14475.40

15
CHAPTER 2
CONCEPTUAL BACKGROUND AND LITERATURE REVIEW:
CUSTOMER RELATIONSHIP MANAGEMENT (CRM)

16
EVOLUTION OF CRM
"CRM is the process of acquiring, developing, and retaining satisfied customers, and thereof
increasing profitability and adding economic value in a company's brand".
Today, with easy access to information because of internet, when the customers go to a
showroom or visit a website, majority of them are already aware of what they want and how
much they would pay.
Till date, there were three waves of CRM technology that have been deployed to give
premium services to customers in order to boost profit. But, according to the very definition
of Customer Relationship Management, maximizing all contact points with customers on a
consistent basis across all channels and identifying the most profitable customers is still
deficient today. While some changes have been seen, Customer Relationship Management
has failed to delivered its ultimate aim- the improved customer experience. As of now, the
main challenge is building on lasting and profitable customer interactions.
The coming changes in CRM will result in the revolution of customer experience, not
restricted to fortifying sales and service but also in creating a series of engaging dialogues
that evolve into meaningful relations.
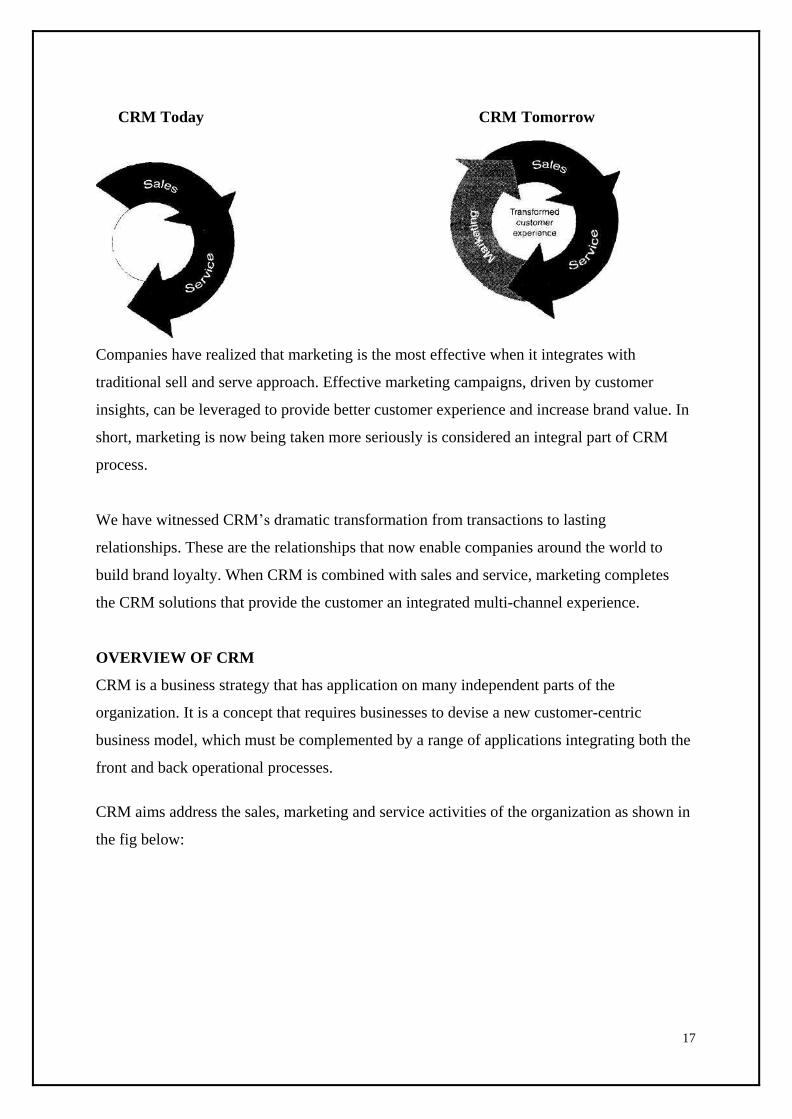
17
CRM Today CRM Tomorrow
Companies have realized that marketing is the most effective when it integrates with
traditional sell and serve approach. Effective marketing campaigns, driven by customer
insights, can be leveraged to provide better customer experience and increase brand value. In
short, marketing is now being taken more seriously is considered an integral part of CRM
process.
We have witnessed CRM’s dramatic transformation from transactions to lasting
relationships. These are the relationships that now enable companies around the world to
build brand loyalty. When CRM is combined with sales and service, marketing completes
the CRM solutions that provide the customer an integrated multi-channel experience.
OVERVIEW OF CRM
CRM is a business strategy that has application on many independent parts of the
organization. It is a concept that requires businesses to devise a new customer-centric
business model, which must be complemented by a range of applications integrating both the
front and back operational processes.
CRM aims address the sales, marketing and service activities of the organization as shown in
the fig below:

18
A CRM strategy is a win-win situation for the customer and the enterprise. The end user receiver
gets increased value while the enterprise gains constant information regarding the organization’s
operation relative to its customer. Experts predict that CRM will become the largest application area
of all time and therefore must be levaraged by every organization.
MARKETING
CRM
SALES SERVICE

19
LITERATURE REVIEW
Mueller, in 2010 typifies CRM approach of the business as very active, and says that
businesses should implement a more dynamic method in devising relevant CRM strategies to
gain advantage.
Sinkovics and Ghauri, in (2009), explore the necessity of having a robust CRM strategy to
higher price of sales, increasing levels of competition at an international scale, and the
neccesity for info about the different verticles of the business.
According to Peppers and Rogers (2011), there propensity in CRM related to the shift
from transactional model to the link model. To put it simply, they opine that meeting
customer’s wants as a results of on time delivery isn't ample nowadays to confirm the
semipermanent growth of the organizations.
Instead, businesses should struggle to form meaningful relationships with customers so as to
leverage some flexibility and to adopt their growing expectations and in turn winning
customer loyalty.
Perhaps, one of the most important resources for the study on “Relationship Marketing and
Customer Relationship Management” was a book written by Brink and Berndt in 2009, in
which, the authors dive deep into the concept of Customer Touch Map and also discuss the
role of IT in forming meaningful relationships with customers.
In 2010, Mathur authored a book in which is another significant contribution to be used in
the study. Mathur offers exhaustive CRM techniques and principles levaraged by MNCs
across the globe.
In 2010, Khurana addressed the idea of CRM during a nice detail, and also states the pros and cons
of relevant package applications.
Pradan’s (2009) book- “Retailing Management”- is another significant resource that was
referred to in the study below. Pradan’s book identifies CRM as a developing proposition of
marketing and states its necessity for ensuring long-term growth for retail businesses.

20
Academic models related to CRM are going to be understood in this project. The most
important model to be used in the study is The Gap Model of Service Quality which states
that “A model of service quality called the gap model identifies five gaps that can cause
problems in service delivery and influence customer evaluations of service quality” (Lamb
et al, 2011, p.189).
These are the five gaps i) the gap of customer’s wants and the management’s perception of
customer’s wants; ii) the gap of the management’s understanding of customer needs and the
type of service developed; iii) the gap of the service required and the service provided; vi)
the gap of the quality of service assured and the quality of service being provided, and lastly
v) the gap of expected service and perceived service on behalf of the customer.
One more model to be verified in this study is the Relationship Model of CRM offered by
Peppers and Rogers (2011). The model advices implementing a proactive approach in
maintaining customer relationships and advices a bunch of very precise principles that will
achieve this.
In 2011, Renavikar & Joshi declared that nearly 64% of financial institutions have not
been successful in recieving benefits from investments in Customer Relationship
Management strategies.
Sarlaki & Fard in 2009 carry out a detailed survey to study how CRM can boost customer
satisfaction. The study, conducted on agriculture banks in QOM Providence, declared that
CRM is directly proportional to customer satisfaction.
The discoveries suggest that the aforementioned Greek bank fully recognized the
importance of Customer Relationship Management system for its development and
success in the market.
Panda (2003) stated that CRM is related to a very basic concept of marketing i.e. to gratify
customers and provide the best alternative through exchange processes.
In 2005, Lindgreen addressed CRM by workin on a case study on a European bank recently
designed and developed the empirical evidence to what qualifies as a good CRM practice.
Berndt et ali in 2005 stated that CRM is extremely important to attain a competitive edge in
any marketplace.

21
CHAPTER 3
Research Design:

22
STATEMENT OF THE PROBLEM
The success and profit of an organization depends on the level of the customer
satisfaction attained. Hence, it is imperative to make the customers feel satisfied by offering
quality services. As Cauvery Motors Pvt. Ltd is amongst the major players in the Karnataka
market, it is therefore important to have a detailed feedback from all its customer. It also
endeavors to discover the customers satisfaction level and other alternate facilities. At
present, the Cauvery Ford wants to determine the metrics that result in higher customer
satisfaction which will translate into retention of its existing customers.
Need for the study
1. Better service to customers:
Effective Customer Relationship Management allows customers to convey their
requirements and need to the organization through contact points. Customers get better
service and a feeling of being wanted as a result of the personalization of services offered.
2. Customization of market offerings:
Companies can personalize the service they offer based on the data available. The company
can also facilitate customer-company communication with company contact channels and
website, which help in creating products and services.
3. Reduced customer defection rate:
Customer Relationship Management concentrates on the training and development of the
trainees to become more customer-centric. As a result of CRM training and development,
employees care for their valuable customers, thereby reducing the defection rate.
4. Increase and improvement in long-term relationships:
A few organizations consider their customers to be their partners, while some organizations
request the assistance of their most loyal customers to come up with new products/services.
If a customer works with an organization, then it is highly likely that the customer will stay
with the firm for a long time.

23
5. Rise in customer equity:
Customer Relationship Management boosts customer equity. As a matter of fact, the main
aim of CRM is to boost customer equity. Due to this, oraganizations focus their marketing
strategies more on the most valuable customers. Customer equity is equal to lifetime values
of all customers.
6. Competitive advantage in the market:
Organizations that are implementing an effective CRM strategy have an advantage in the
market. And since they are backed up by their customers, which helps in generating greater
ROI, they can face their competitors with an advantage.
7. Building corporate image:
Through CRM, the reputation of the organization gets a boost, and their most loyal
customers become evangelists, who market the brand through word of mouth. This allows an
organization to get add more customers to its base.
8. Higher ROI:
Because of CRM, an organization places itself in a better position and generates greater ROI.
This is as a result of repeated purchases from their loyal customers. The organization also
gets huge returns through cross-selling of products/services.
AIM OF THE STUDY
Below are the aims of the study that were defined to research the various aspects of CRM in
regard to sales process, product & after sales process.
To find out:
Most effective and efficient tool of communication.
Understanding of show room ambiance.
Sales person's attitude and behavior towards customers.
The importance given to financial schemes provided.
Important metrics considered by the customer with respect to Ford car.

24
Service offered by dealers to aftersales service.
The speed with which complaints were dealt by service persons.
To gauge and analyze the customer satisfaction.
To discover new methodologies to boost the level of customer satisfaction.
SCOPE OF THE STUDY
The following is the scope of the study:
As the survey was conducted in Bangalore, it gives a good generalization on the
appropriateness of Ford car for its urban customer-base.
The method used in this study can also be used by other researchers to conduct the
customer satisfaction studies elsewhere.
The study sheds detailed insights of industrial and company profile, the data of
which can be used for further researches.
The research gives a detailed insight into the pros & cons of the product to the
organization.
Conclusion & suggestions have been given at the end of the research, which can be
used by the company to improve its service.
METHODOLOGY
The important considerations which are required for making decision result in a plan of
study. The aim of the study is to discover the Customer relationship management with sales
process, product & after sales service of Cauvery Ford in Bangalore city. The study is
descriptive in nature. Surveys are the best suited methods for descriptive research, so survey
method is used for the study.
Taking into account the time factor, a survey was planned in the city of Bangalore. In this
city there are substantial number of customers for Ford car by which we can get the idea
about the customer psychology, perception and customer satisfaction.

25
A systematic non-disguised survey was created for the respondents. The question asked was
in a pre-arranged order and the object of the quesionnire was revealed to the respondents.
Mainly, four types of questions were included in the survey. They are:
Dichotomous questions
Multiple-choice questions
Open ended questions
Ranking questions
157 customers of Cauvery Ford were surveyed across Bangalore, in a time frame of four
weeks of fieldwork.
Sampling technique:
The probability sampling technique and type adopted here is the random sampling technique
as sample of which respondents are selected.
Sample Size:
Sample size is the number of elements to be part of the study. Qualitative factors which were
considered in deciding the sample size are:
Vitality of the decision, the nature of the research, the amo variables, and the scope of
analysis, sample sizes used in the related researches, incidence rates, completion rates, and
resource constraints.
Sample Description:
No study can be completed that doesn’t have the cooperation of the participants, who were
interviewed. Hence, participants play a critical role in these types of researches. The data
regarding suggestions were through general talk.
26
Instrumentation Techniques:
To collect primary data, questionnaire method was selected by the researcher. And, the same has
been gathered from 157 respondents, through the questionnaire.
It was found that in the study, secondary data was collected from various magazines, and text
books were referred to get an insight into the subject matter of customer satisfaction.
Information was gathered from various websites on Ford motors CRM. All the sources of
information are cited in the bibliography section.
Actual Collection of Data:
The research work is descriptive, and the main mode of collecting the data was mainly
through questionnaire. The questionnaire has been designed carefully for Cauvery Ford
customers those who had bought Ford cars. These responses were very helpful during the
analysis.
Other Softwares that were used for Analysis was IBM SPSS and ANOVA
HYPOTHESIS :
Is generated from the questionnaire and literature review and the analysis was done using
IBM’s SPSS software.
LIMITATIONS OF THE STUDY
To begin with, the sample size was limited to 157 customers.
The study was constrained only to Bangalore city, out of the many cities available.
The study was limited only to Cauvery Ford.
The time frame was merely four weeks due to which each and every respondent
could not be covered.
The survey mainly included the urban customers i.e., the response of the rural
customers was not included.
There were some signs of the interview results getting adversely affected by the
interviewer's mode of asking questions.

27
CHAPTER 4:
Analysis and Interpretation

28
Table 4.1: Gender of the respondents:
Frequency Percentage
Male 94 59.9
Female 63 40.1
Total 157 100
Figure 4.1 : Graph showing gender of the respondents
Interpretation: As the above pie chart suggests, out of 157 respondents, 59.9 % of them are
male and 40.1% of them are female.
Table 4.2 : Age of the respondents:
Frequency Percentage
>25 24 15.3
25-35 20 12.7
Gender 157 responses
Male
Female

29
35-45 29 18.5
45-55 37 23.6
55-65 33 21.0
<65 14 8.9
Total 157 100
Figure 4.2: Graph shows age of the respondents AGE
Interpretation: Based on the above shown chart, <25 age of the respondents are 19.2%.
The age group between 25 to 35 respondents is 12.7%, age group between 35 to 45
respondents is 18.5%, the age group between 45 to 55 respondents is 23.6, age group
between 55 to 65 respondents is 21.0%, age group between >65 respondents is 8.9%. We
can conclude that maximum number of customers who visit the Cauvery ford fall between
the age group 45-55.
<65 55-65 45-55 35-45 25-35 >25
0
5
Series 1
Series 2
Series 3
Series 4
Series 5
Series 6
15
10
20
25

30
Table 4.3: Number ofimembers in the family:
Frequency Percentage
2-4 members 68 43.3
4-6 members 89 56.7
Total 157 100
Figure 4.3: Above graph shows number of members in family of the p a r t i c i p a n t s
Interpretation: Based on the above chart, we can construe that family size of 2 to 4 member
is 43.3% and the family size of 4 to 6 members is 56.7%. These group of people are more
loyal to the Dealers products and services and are comfortable making purchase at the
Dealer’s Showroom.
Table 4.4: Educational qualification:
Frequency Percentage
Graduation 49 31.2
Post graduation 32 20.4
Diploma 33 21.0
Other 43 27.4
4-6 members 2-4 members
0
10
20
series 1
Series 2
30
40
50
60

31
Total 157 100
Figure 4.4: Graph showing educational qualification of the respondents
Interpretation: Based on the above chart, we can see that the participant’s educational
qualification is 31.2%, in the graduation level, 20.4% in post-graduation level, 21.0% in
diploma level and 27.4% in the different category of respondents.
.
Table 4.5: Profession:
Frequency Percentage
IT 56 35.7
Government 44 28.0
Other Pvt sector 15 9.6
Own business 42 26.8
Total 157 100
Other Diploma Post graduation Graduation
0
5
10
Series 1
Series 2
Series 3
Series 4
20
15
25
30
35

32
Figure 4.5: Graph shows profession of the respondents
Interpretation: Based on the above chart, we can see that the respondents in IT
sector is 35.7%, the respondents in government sector is 28%, the respondents in
other Pvt sector is 9.6% and the respondents in own business sector is 26.8%.
Table 4.6: Income (in lakhs)
Frequency Percentage
2-3 31 19.7
3-4 47 29.9
4-5 79 50.3
Total 157 100
Own business Other Pvt sector Government IT
10
5
0
Series 1
Series 2
Series 3
Series 4
40
35
30
25
20
15

33
Figure 4.6: Graph showing income of the respondents
Interpretation: Based on the above chart, we can witness that the income of the
respondents who are earning between 2 to 3 lakhs is 19.7%, the respondents who are
earning 3 to 4 lakhs is 29.9%, and the respondents who are earning 4 to 5 lakhs is 50.3%.
1. CUSTOMERS EDUCATED ABOUT THE VEHICLES
Frequency
Percent
Valid Percent
Cumulative Perc
ent
Valid Neither agree nor disagree 24 15.3 15.3 15.3
Agree 76 48.4 48.4 63.7
Strongly agree 57 36.3 36.3 100.0
Total 157 100.0 100.0
Income
B/w 2-3
B/w 3-4
B/w 4-5

34
Interpretation: As shown in the above chart, we see that 48.4% respondents agree for being
educated about the vehicles.
2. Employees are well dressed and neat in appearance
Frequency
Percent
Valid Percent
Cumulative Perc
ent
Valid Neither agree nor disagree 39 24.8 24.8 24.8
Agree 67 42.7 42.7 67.5
Strongly agree 51 32.5 32.5 100.0
Total 157 100.0 100.0

35
Interpretation: As shown in the above chart, we see that 42.7% of the respondents agree
for employees being well-dressed .
3. AWARENESS OF CUSTOMER REQUIREMENTBY THE EMPLOYEES
Frequency
Percent
Valid Percent
Cumulative Perc
ent
Valid Disagree 1 .6 .6 .6
Neither agree nor disagree 30 19.1 19.1 19.7
Agree 73 46.5 46.5 66.2
Strongly agree 53 33.8 33.8 100.0
Total 157 100.0 100.0

36
Interpretation: As shown in the above chart, we see that 46.5% of the respondents agree
for awareness of customer requirement by the employees.
4. Show sincere interest in solving customers’ problems
Frequency
Percent
Valid Percent
Cumulative Perc
ent
Valid Neither agree nor disagree 33 21.0 21.0 21.0
Agree 66 42.0 42.0 63.1
Strongly agree 58 36.9 36.9 100.0
Total 157 100.0 100.0

37
Interpretation: As shown in the above chart, we see that 42% of the respondents agree for
Show sincere interest in solving customers’ problems.
5. MODE OF PURCHASE WAS CONVENIENT
Frequency
Percent
Valid Percent
Cumulative Perc
ent
Valid Disagree 2 1.3 1.3 1.3
Neither agree nor disagree 31 19.7 19.7 21.0
Agree 70 44.6 44.6 65.6
Strongly agree 54 34.4 34.4 100.0
Total 157 100.0 100.0

38
Interpretation: As shown in the above chart, we see that 44.6% of the respondents agree
for mode of purchase was convenient.
6. Provides services at the time promised
Frequency
Percent
Valid Percent
Cumulative Perc
ent
Valid Disagree 1 .6 .6 .6
Neither agree nor disagree 37 23.6 23.6 24.2
Agree 74 47.1 47.1 71.3
Strongly agree 45 28.7 28.7 100.0
Total 157 100.0 100.0

39
Interpretation: As shown in the above chart, we see that 47.1% of the respondents agree
for provides services at the time promised.
7. DELIVERY TIME OFFERED TO CUSTOMERS WAS SATISFACTORY
Frequency
Percent
Valid Percent
Cumulative Perc
ent
Valid Disagree 2 1.3 1.3 1.3
Neither agree nor disagree 30 19.1 19.1 20.4
Agree 75 47.8 47.8 68.2
Strongly agree 50 31.8 31.8 100.0
Total 157 100.0 100.0

40
Interpretation: As shown in the above chart, we see that 47.8% of the respondents agree
for delivery time offered to customers was satisfactory.
8. Offers prompt services to customers
Frequency
Percent
Valid Percent
Cumulative Perc
ent
Valid Strongly disagree 1 .6 .6 .6
Disagree 2 1.3 1.3 1.9
Neither agree nor disagree 32 20.4 20.4 22.3
Agree 81 51.6 51.6 73.9
Strongly agree 41 26.1 26.1 100.0
Total 157 100.0 100.0

41
Interpretation: As shown in the above chart, we see that 51.6% of the respondents agree
for Offering prompt services to customers.
9. AMBIENCE OF THE SHOWROOM WAS GOOD
Frequency
Percent
Valid Percent
Cumulative Perc
ent
Valid Disagree 2 1.3 1.3 1.3
Neither agree nor disagree 32 20.4 20.4 21.7
Agree 75 47.8 47.8 69.4
Strongly agree 48 30.6 30.6 100.0
Total 157 100.0 100.0

42
Interpretation: As shown in the above chart, we see that 47.8% of the respondents agree
for ambience of the showroom was good.
10. ATTITUDE OF SALES PERSON WAS GOOD
Frequency
Percent
Valid Percent
Cumulative Perc
ent
Valid Strongly disagree 1 .6 .6 .6
Disagree 1 .6 .6 1.3
Neither agree nor disagree 35 22.3 22.3 23.6
Agree 62 39.5 39.5 63.1
Strongly agree 58 36.9 36.9 100.0
Total 157 100.0 100.0

43
Interpretation: As shown in the above chart, we see that 39.5% of the respondents agree
for attitude of sales person was good.
11. COMPLAINTS NOTED AND IMPROVEMENT DONE
Frequency
Percent
Valid Percent
Cumulative Perc
ent
Valid Strongly disagree 1 .6 .6 .6
Neither agree nor disagree 27 17.2 17.2 17.8
Agree 77 49.0 49.0 66.9
Strongly agree 52 33.1 33.1 100.0
Total 157 100.0 100.0
44
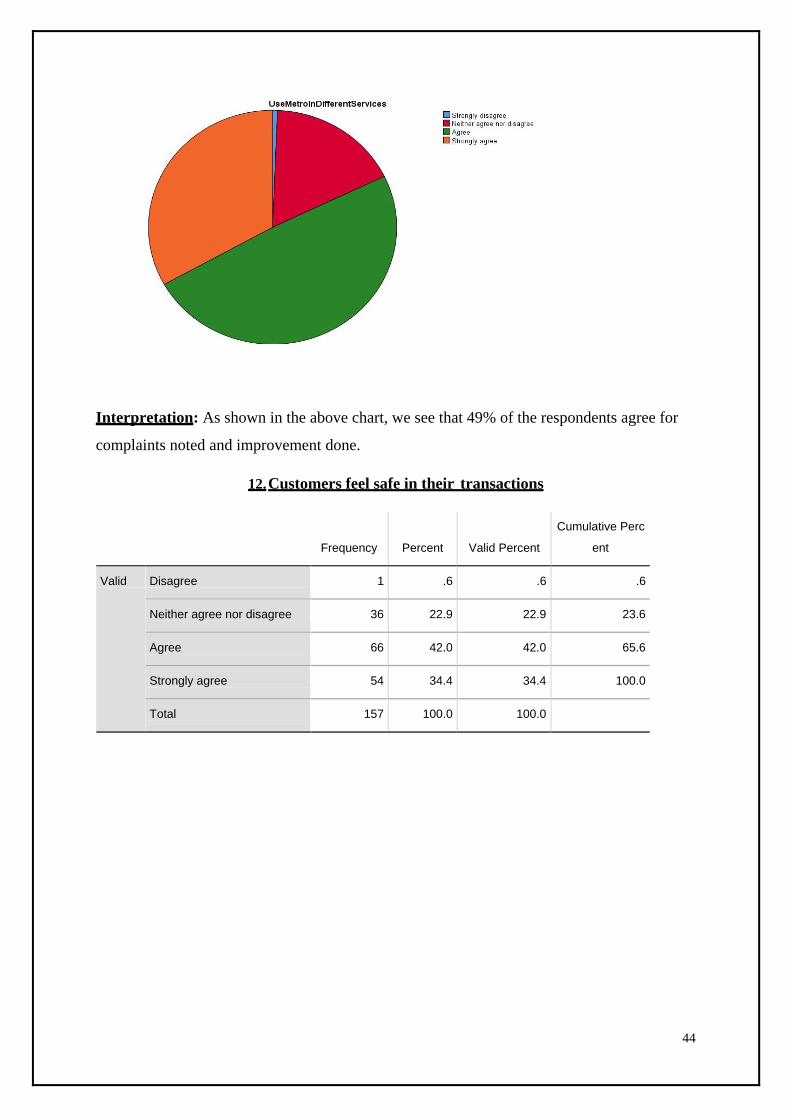
Interpretation: As shown in the above chart, we see that 49% of the respondents agree for
complaints noted and improvement done.
12. Customers feel safe in their transactions
Frequency
Percent
Valid Percent
Cumulative Perc
ent
Valid Disagree 1 .6 .6 .6
Neither agree nor disagree 36 22.9 22.9 23.6
Agree 66 42.0 42.0 65.6
Strongly agree 54 34.4 34.4 100.0
Total 157 100.0 100.0

45
Interpretation: As shown in the above chart, we see that 42% of the respondents agree for
Customers feel safe in their transactions.
13. Employees are courteous at all times
Frequency
Percent
Valid Percent
Cumulative Perc
ent
Valid Disagree 1 .6 .6 .6
Neither agree nor disagree 28 17.8 17.8 18.5
Agree 78 49.7 49.7 68.2
Strongly agree 50 31.8 31.8 100.0
Total 157 100.0 100.0

46
Interpretation: As shown in the above chart, we see that 49.7% of the respondents agree
for employees are courteous at all times .
14. Have the knowledge to answer customers' questions
Frequency
Percent
Valid Percent
Cumulative Perc
ent
Valid Neither agree nor disagree 30 19.1 19.1 19.1
Agree 70 44.6 44.6 63.7
Strongly agree 57 36.3 36.3 100.0
Total 157 100.0 100.0

47
Interpretation: As shown in the above chart, we see that 44.6% of the respondents agree
for Have the knowledge to answer customers' questions.
15. OVERALL CUSTOMER EXPERIENCE OF THE DEALERS WAS SATISFACTO
RY
Frequency
Percent
Valid Percent
Cumulative Perc
ent
Valid Disagree 1 .6 .6 .6
Neither agree nor disagree 27 17.2 17.2 17.8
Agree 76 48.4 48.4 66.2
Strongly agree 53 33.8 33.8 100.0
Total 157 100.0 100.0
Interpretation: As shown in the above chart, we see that 48.4% of the respondents agree
for overall customer experience of the dealers was satisfactory.

48
ANALYSIS OF VARIANCE (ANOVA)
Table 4.11: Table showing one way ANOVA for age of the respondents.
There is no significant difference between the various metrics of the study and the age of the
respondents.
ANOVA
Sum of Square
s
df
Mean Square
F
Sig.
CUSTOMERS
EDUCATED ABOUT THE
VEHICLES
Between Groups 3.587 5 .717 1.537 .182
Within Groups 70.477 151 .467
Total 74.064 156
EMPLOYEES ARE WELL
DRESSED AND NEAT IN
APPEARANCE
Between Groups 1.329 5 .266 .459 .806
Within Groups 87.372 151 .579
Total 88.701 156
AWARENESS OF
CUSTOMER
REQUIREMENTS BY
THE EMPLOYEES
Between Groups 6.967 5 1.393 2.562 .029
Within Groups 82.116 151 .544
Total 89.083 156
SHOW SINCERE
INTEREST IN SOLVING
CUSTOMERS
PROBLEMS
Between Groups 3.081 5 .616 1.147 .338
Within Groups 81.110 151 .537
Total 84.191 156
MODE OF PURCHASE
WAS CONVINIENT
Between Groups 6.750 5 1.350 2.540 .031
Within Groups 80.269 151 .532
Total 87.019 156
PROVIDES SERVICES AT
THE TIME PROMISED
Between Groups 2.623 5 .525 .899 .483
Within Groups 88.078 151 .583
Total 90.701 156

49
DELIVERY TIME
OFFERED TO
CUSTOMERS WAS
SATISFACTORY
Between Groups 2.458 5 .492 .891 .489
Within Groups 83.313 151 .552
Total 85.771 156
OFFERS PROMPT
SERVICES TO
CUSTOMERS
Between Groups 3.453 5 .691 1.258 .285
Within Groups 82.917 151 .549
Total 86.369 156
AMBIENCE OF THE
SHOWROOM WAS
GOOD
Between Groups 2.050 5 .410 .704 .621
Within Groups 87.925 151 .582
Total 89.975 156
ATTITUDE OF THE
SALES PERSON WAS
GOOD
Between Groups 2.443 5 .489 .872 .502
Within Groups 84.640 151 .561
Total 87.083 156
COMPLAINTS NOTED
AND IMPROVEMENTS
DONE
Between Groups 6.483 5 1.297 2.009 .080
Within Groups 97.453 151 .645
Total 103.936 156
CUSTOMERS FEEL
SAFE IN THEIR
TRANSACTIONS
Between Groups 5.746 5 1.149 2.192 .058
Within Groups 79.171 151 .524
Total 84.917 156
EMPLOYEES ARE
COURTEOUS AT ALL
TIMES
Between Groups 6.788 5 1.358 2.395 .040
Within Groups 85.582 151 .567
Total 92.369 156
HAVE THE KNOWLEDGE
TO ANSWER
CUSTOMER’S
QUESTIONS
Between Groups 3.469 5 .694 1.379 .235
Within Groups 75.983 151 .503
Total 79.452 156
OVERALL CUSTOMER
EXPERIENCE OF THE
DEALER WAS
SATISFACTORY
Between Groups 1.929 5 .386 .724 .606
Within Groups 80.428 151 .533
Total 82.357 156

50
Interpretation: From the above table, we conclude that the reliability of the brand, meeting
the requirements and quality of product/service is significant under the metrics of the age of
the respondents. Dealer offering good service and using the dealer in different services, are
significant at 0.1 or 10% significance level. The rest of the metrics are not important with
respect to age of the respondents.
Table 4.12: Table showing one way ANOVA for gender of the respondents.
There is not much difference between the various metrics of the study with respect to gender
of the respondents.
ANOVA
Sum of Square
Df
Mean Square
F
Sig.
CUSTOMERS
EDUCATED ABOUT THE
VEHICLES
Between Groups .279 1 .279 .585 .445
Within Groups 73.785 155 .476
Total 74.064 156
EMPLOYEES ARE WELL
DRESSED AND NEAT IN
APPEARANCE
Between Groups .150 1 .150 .262 .610
Within Groups 88.551 155 .571
Total 88.701 156
AWARENESS OF
CUSTOMER
REQUIREMENTS BY
THE EMPLOYEES
Between Groups .210 1 .210 .366 .546
Within Groups 88.873 155 .573
Total 89.083 156
SHOW SINCERE
INTEREST IN SOLVING
CUSTOMERS
PROBLEMS
Between Groups .005 1 .005 .009 .925
Within Groups 84.186 155 .543
Total 84.191 156
MODE OF PURCHASE
WAS CONVINIENT
Between Groups .103 1 .103 .183 .669
Within Groups 86.916 155 .561
Total 87.019 156

51
PROVIDES SERVICES AT
THE TIME PROMISED
Between Groups .508 1 .508 .872 .352
Within Groups 90.193 155 .582
Total 90.701 156
DELIVERY TIME
OFFERED TO
CUSTOMERS WAS
SATISFACTORY
Between Groups .178 1 .178 .323 .571
Within Groups 85.593 155 .552
Total 85.771 156
OFFERS PROMPT
SERVICES TO
CUSTOMERS
Between Groups .825 1 .825 1.495 .223
Within Groups 85.544 155 .552
Total 86.369 156
AMBIENCE OF THE
SHOWROOM WAS
GOOD
Between Groups .038 1 .038 .066 .798
Within Groups 89.937 155 .580
Total 89.975 156
ATTITUDE OF THE
SALES PERSON WAS
GOOD
Between Groups .127 1 .127 .226 .636
Within Groups 86.956 155 .561
Total 87.083 156
COMPLAINTS NOTED
AND IMPROVEMENTS
DONE
Between Groups .605 1 .605 .908 .342
Within Groups 103.331 155 .667
Total 103.936 156
CUSTOMERS FEEL
SAFE IN THEIR
TRANSACTIONS
Between Groups 1.364 1 1.364 2.530 .114
Within Groups 83.554 155 .539
Total 84.917 156
EMPLOYEES ARE
COURTEOUS AT ALL
TIMES
Between Groups 1.148 1 1.148 1.950 .165
Within Groups 91.222 155 .589
Total 92.369 156

52
HAVE THE KNOWLEDGE
TO ANSWER
CUSTOMER’S
QUESTIONS
Between Groups .235 1 .235 .459 .499
Within Groups 79.218 155 .511
Total 79.452 156
OVERALL CUSTOMER
EXPERIENCE OF THE
DEALER WAS
SATISFACTORY
Between Groups .036 1 .036 .068 .795
Within Groups 82.321 155 .531
Total 82.357 156
Dealers products, which are innovative and new is relevant at 0.1 or 10% significance level.
Table 4.13: Table showing one way ANOVA for educational qualification of the respon
dents.
There is not much difference between the various metrics of the study in regard to
educational qualification of the respondents.
ANOVA
Sum of Square
df
Mean Square
F
Sig.
Need Product Between Groups 1.748 3 .583 1.233 .300
Within Groups 72.315 153 .473
Total 74.064 156
Need Satisfaction Between Groups 6.084 3 2.028 3.756 .012
Within Groups 82.616 153 .540
Total 88.701 156
AWARENESS OF
CUSTOMER
REQUIREMENTS BY
THE EMPLOYEES
Between Groups 1.460 3 .487 .850 .469
Within Groups 87.622 153 .573
Total 89.083 156
SHOW SINCERE
INTEREST IN SOLVING
CUSTOMERS
PROBLEMS
Between Groups .077 3 .026 .047 .986
Within Groups 84.114 153 .550
Total 84.191 156

53
MODE OF PURCHASE
WAS CONVINIENT
Between Groups 1.200 3 .400 .713 .546
Within Groups 85.820 153 .561
Total 87.019 156
OVERALL CUSTOMER EXPERIENCE OF THE DEALER WAS SATISFACTORY
Between Groups 5.097 3 1.699 3.365 .020
Within Groups 77.259 153 .505
Total 82.357 156
PROVIDES SERVICES AT
THE TIME PROMISED
Between Groups 3.077 3 1.026 1.791 .151
Within Groups 87.624 153 .573
Total 90.701 156
DELIVERY TIME
OFFERED TO
CUSTOMERS WAS
SATISFACTORY
Between Groups 2.012 3 .671 1.225 .303
Within Groups 83.759 153 .547
Total 85.771 156
OFFERS PROMPT
SERVICES TO
CUSTOMERS
Between Groups 1.870 3 .623 1.128 .339
Within Groups 84.500 153 .552
Total 86.369 156
AMBIENCE OF THE
SHOWROOM WAS
GOOD
Between Groups 1.760 3 .587 1.017 .387
Within Groups 88.215 153 .577
Total 89.975 156
ATTITUDE OF THE
SALES PERSON WAS
GOOD
Between Groups 2.895 3 .965 1.754 .158
Within Groups 84.188 153 .550
Total 87.083 156
COMPLAINTS NOTED
AND IMPROVEMENTS
DONE
Between Groups 2.206 3 .735 1.106 .349
Within Groups 101.730 153 .665
Total 103.936 156
CUSTOMERS FEEL
SAFE IN THEIR
TRANSACTIONS
Between Groups .927 3 .309 .563 .640
Within Groups 83.991 153 .549
Total 84.917 156

54
Interpretation: As shown in the above table, we see that the reliability of the brand,
satisfying wants and products are of good value are significant under the metrics of the
educational qualification of the respondents.
Table 4.14: Table showing one way ANOVA for profession of the respondents.
There is no noticeable difference between the various metrics of the study with respect to
profession of the respondents.
ANOVA
Sum of square
Df
Mean Square
F
Sig.
Need Product Between Groups 4.088 3 1.363 2.979 .033
Within Groups 69.976 153 .457
Total 74.064 156
Need Satisfaction Between Groups 3.817 3 1.272 2.293 .080
Within Groups 84.884 153 .555
Total 88.701 156
AWARENESS OF
CUSTOMER
REQUIREMENTS BY
THE EMPLOYEES
Between Groups 5.137 3 1.712 3.121 .028
Within Groups 83.946 153 .549
Total 89.083 156
SHOW SINCERE
INTEREST IN SOLVING
CUSTOMERS
PROBLEMS
Between Groups 5.651 3 1.884 3.670 .014
Within Groups 78.540 153 .513
Total 84.191 156
MODE OF PURCHASE
WAS CONVINIENT
Between Groups 3.593 3 1.198 2.197 .091
Within Groups 83.426 153 .545
Total 87.019 156
EMPLOYEES ARE
COURTEOUS AT ALL
TIMES
Between Groups .533 3 .178 .296 .828
Within Groups 91.837 153 .600
Total 92.369 156
HAVE THE KNOWLEDGE
TO ANSWER
CUSTOMER’S
QUESTIONS
Between Groups .360 3 .120 .232 .874
Within Groups 79.092 153 .517
Total 79.452 156

55
PROVIDES SERVICES AT
THE TIME PROMISED
Between Groups 2.726 3 .909 1.580 .196
Within Groups 87.975 153 .575
Total 90.701 156
DELIVERY TIME
OFFERED TO
CUSTOMERS WAS
SATISFACTORY
Between Groups 3.435 3 1.145 2.128 .099
Within Groups 82.336 153 .538
Total 85.771 156
OFFERS PROMPT
SERVICES TO
CUSTOMERS
Between Groups 3.777 3 1.259 2.332 .076
Within Groups 82.592 153 .540
Total 86.369 156
AMBIENCE OF THE
SHOWROOM WAS
GOOD
Between Groups .674 3 .225 .385 .764
Within Groups 89.301 153 .584
Total 89.975 156
ATTITUDE OF THE
SALES PERSON WAS
GOOD
Between Groups 1.250 3 .417 .743 .528
Within Groups 85.832 153 .561
Total 87.083 156
COMPLAINTS NOTED
AND IMPROVEMENTS
DONE
Between Groups 5.353 3 1.784 2.769 .044
Within Groups 98.583 153 .644
Total 103.936 156
CUSTOMERS FEEL
SAFE IN THEIR
TRANSACTIONS
Between Groups 3.585 3 1.195 2.248 .085
Within Groups 81.332 153 .532
Total 84.917 156
EMPLOYEES ARE
COURTEOUS AT ALL
TIMES
Between Groups 4.563 3 1.521 2.650 .051
Within Groups 87.807 153 .574
Total 92.369 156
HAVE THE
KNOWLEDGE TO
ANSWER
CUSTOMER’S
QUESTION
Between Groups 3.374 3 1.125 2.262 .084
Within Groups 76.078 153 .497
Total 79.452 156
OVERALL CUSTOMER
EXPERIENCE OF THE
DEALER WAS
SATISFACTORY
Between Groups 3.738 3 1.246 2.425 .068
Within Groups 78.619 153 .514
Total 82.357 156

56
Interpretation: With reference to the above table, we see that the reliability of the brand,
product needs, durable and sustainable products, giving good customer service, trusting the
dealer’s products and innovative products are extremely significant under the metrics of
profession of the respondents. Satisfying wants, courteous & helpful, reasonable prices,
using the dealers in different services, quality of products, satisfying different product wants
and products that are of good value are which are significant at 0.1 or 10% significance
level. The rest of the metrics are not significant with respect to profession of the respondents.
Table 4.15: Table showing one way ANOVA of number of members in the family.
H5: There is no significance difference between the various metrics of the study with respect
to no. of family members of the participants.
ANOVA
Sum of Square
df
Mean Square
F
Sig.
Need Product Between Groups .478 1 .478 1.007 .317
Within Groups 73.586 155 .475
Total 74.064 156
Need Satisfaction Between Groups .271 1 .271 .474 .492
Within Groups 88.430 155 .571
Total 88.701 156
AWARENESS OF
CUSTOMER
REQUIREMENTS BY
THE EMPLOYEES
Between Groups .265 1 .265 .463 .497
Within Groups 88.818 155 .573
Total 89.083 156

57
SHOW SINCERE
INTEREST IN SOLVING
CUSTOMERS
PROBLEMS
Between Groups 2.146 1 2.146 4.055 .046
Within Groups 82.045 155 .529
Total 84.191 156
MODE OF PURCHASE
WAS CONVINIENT
Between Groups .001 1 .001 .001 .971
Within Groups 87.018 155 .561
Total 87.019 156
PROVIDES SERVICES AT
THE TIME PROMISED
Between Groups .709 1 .709 1.222 .271
Within Groups 89.991 155 .581
Total 90.701 156
DELIVERY TIME
OFFERED TO
CUSTOMERS WAS
SATISFACTORY
Between Groups .757 1 .757 1.380 .242
Within Groups 85.014 155 .548
Total 85.771 156
OFFERS PROMPT
SERVICES TO
CUSTOMERS
Between Groups .912 1 .912 1.655 .200
Within Groups 85.457 155 .551
Total 86.369 156
AMBIENCE OF THE
SHOWROOM WAS
GOOD
Between Groups .893 1 .893 1.553 .215
Within Groups 89.082 155 .575
Total 89.975 156
ATTITUDE OF THE
SALES PERSON WAS
GOOD
Between Groups .001 1 .001 .002 .966
Within Groups 87.082 155 .562
Total 87.083 156
COMPLAINTS NOTED
AND IMPROVEMENTS
DONE
Between Groups .126 1 .126 .188 .665
Within Groups 103.810 155 .670
Total 103.936 156
CUSTOMERS FEEL SAFE
IN THEIR
TRANSACTIONS
Between Groups .323 1 .323 .592 .443
Within Groups 84.594 155 .546
Total 84.917 156

58
EMPLOYEES ARE
COURTEOUS AT ALL
TIMES
Between Groups .223 1 .223 .375 .541
Within Groups 92.147 155 .594
Total 92.369 156
HAVE THE KNOWLEDGE
TO ANSWER
CUSTOMER’S
QUESTIONS
Between Groups .142 1 .142 .277 .599
Within Groups 79.310 155 .512
Total 79.452 156
OVERALL CUSTOMER
EXPERIENCE OF THE
DEALER WAS
SATISFACTORY
Between Groups .074 1 .074 .140 .709
Within Groups 82.282 155 .531
Total 82.357 156
Interpretation: With reference to the above table, we discover that the durability of the
products is significant under the metrics of members in the family of the respondents. Rest
of the metrics are not very significant with respect to number of members in the family of
the respondents.
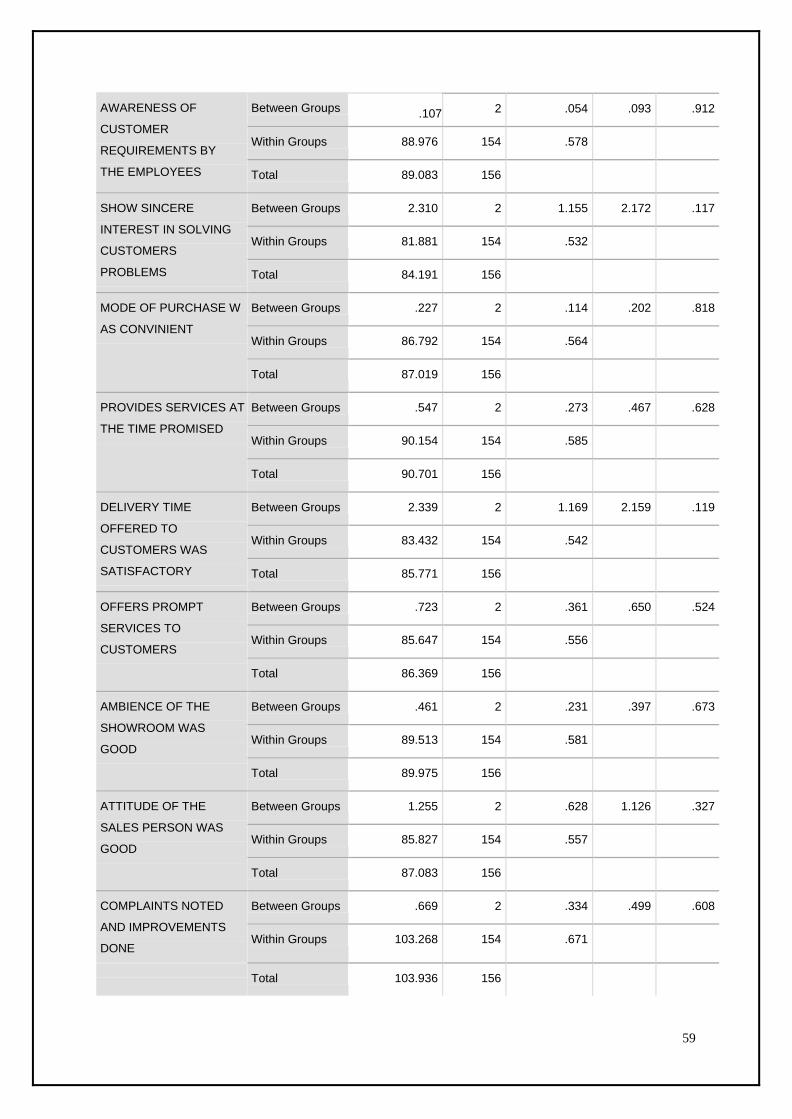
Table 4.16: Table showing one way ANOVA for income of the respondents.
There is no significance difference between the various metrics of the study with respect to
income of the respondents.
ANOVA
Sum of Square
df
Mean Square
F
Sig.
Need Product Between Groups 3.260 2 1.630 3.545 .031
Within Groups 70.804 154 .460
Total 74.064 156
Need Satisfaction Between Groups 5.561 2 2.781 5.150 .007
Within Groups 83.139 154 .540
Total 88.701 156
59
AWARENESS OF
CUSTOMER
REQUIREMENTS BY
THE EMPLOYEES
Between Groups .107 2 .054 .093 .912
Within Groups 88.976 154 .578
Total 89.083 156
SHOW SINCERE
INTEREST IN SOLVING
CUSTOMERS
PROBLEMS
Between Groups 2.310 2 1.155 2.172 .117
Within Groups 81.881 154 .532
Total 84.191 156
MODE OF PURCHASE W
AS CONVINIENT
Between Groups .227 2 .114 .202 .818
Within Groups 86.792 154 .564
Total 87.019 156
PROVIDES SERVICES AT
THE TIME PROMISED
Between Groups .547 2 .273 .467 .628
Within Groups 90.154 154 .585
Total 90.701 156
DELIVERY TIME
OFFERED TO
CUSTOMERS WAS
SATISFACTORY
Between Groups 2.339 2 1.169 2.159 .119
Within Groups 83.432 154 .542
Total 85.771 156
OFFERS PROMPT
SERVICES TO
CUSTOMERS
Between Groups .723 2 .361 .650 .524
Within Groups 85.647 154 .556
Total 86.369 156
AMBIENCE OF THE
SHOWROOM WAS
GOOD
Between Groups .461 2 .231 .397 .673
Within Groups 89.513 154 .581
Total 89.975 156
ATTITUDE OF THE
SALES PERSON WAS
GOOD
Between Groups 1.255 2 .628 1.126 .327
Within Groups 85.827 154 .557
Total 87.083 156
COMPLAINTS NOTED
AND IMPROVEMENTS
DONE
Between Groups .669 2 .334 .499 .608
Within Groups 103.268 154 .671
Total 103.936 156

60
CUSTOMERS FEEL
SAFE IN THEIR
TRANSACTIONS
Between Groups 2.008 2 1.004 1.865 .158
Within Groups 82.909 154 .538
Total 84.917 156
EMPLOYEES ARE
COURTEOUS AT ALL
TIMES
Between Groups 2.686 2 1.343 2.306 .103
Within Groups 89.684 154 .582
Total 92.369 156
HAVE THE KNOWLEDGE
TO ANSWER
CUSTOMER’S
QUESTIONS
Between Groups 3.684 2 1.842 3.744 .026
Within Groups 75.768 154 .492
Total 79.452 156
OVERALL CUSTOMER
EXPERIENCE OF THE
DEALER WAS
SATISFACTORY
Between Groups .924 2 .462 .874 .420
Within Groups 81.433 154 .529
Total 82.357 156
Interpretation: As shown in the above table, we discover that the product needs, satisfying
need, satisfying different product needs, trusting products, Dealer having best interest and
suggesting the dealer to others are significant under the metrics of income of the
respondents. The rest of the metrics are not significant with respect to income of the
respondents.
.

61
CHAPTER 5
FINDINGS , CONCLUSIONS AND SUGGESTIONS
62
FINDINGS
From the conducted survey, we discover that dealer meets customer’s basic needs in
terms of the products they wish to buy.
Customers like the fast and responsive service provided by dealer.
The prices are expected to be low according to the survey conducted.
From the survey, the customers are comfortable buying products under different
situations from dealer.
Customers feel that their needs are met when they think about dealer services.
We discover that the customers trust the dealer brand.
The customers of dealer are expected and willing to recommend dealer’s products
and services to people known to them.
Suggestions:
From the survey, we discover that the brand suggestions and recommendations to
other customers from the regular customer is comparatively fewer when compared
to other aspects.
Brand resonance, image and judgment are comparatively better than brand
performance.
According to the conducted survey, age group between 20 to 30 years is the most
loyal customer and vehicles related to other age group customers also should be
focused more.
The dealer should meet the needs and requirements of the customers to be considered
courteous.
The dealer should offer prompt and honest services to meet the needs of the
customers in order to recommend the dealer to others .

63
CONCLUSION
Most of the customers who took test drive were satisfied with the Test Drive Process.
Almost half of the customers were availing Bank Loan to purchase a Ford car.
Most of the customer’s car was delivered within one - three weeks of booking.
Majority of the customers liked the ambience of the show room.
Majority of the customers were satisfied with the sales person’s behavior.
Majority of the customer’s complaints were attended properly.
Majority of the customers were satisfied with the service recieved.
Majority of the customers were purchasing their vehicle service from the dealership.
Majority of the customers were very satisfied with overall experience and also
would like to Recommend the Ford’s car to others.

64
BIBLIOGRAPHY

65
Books Referred:
Marketing Research – Naresh Malhotra Marketing Management – Philip Kotler
Strategic Marketing Management – Richard MS Wilson
Consumer behavior - Blackwell, RD, Miniard, PW and Engel, 10thEd (2006)
Marketing - Dhrur Grewal and Michael Levy McGraw Hill Publishers Company(2012)
ARTICLES REFERED:
Brink, A. & Berndt, A. (2009) “Relationship Marketing and Customer Relationship
Management” Juta Publications
Goldenberg, B.J. (2008) “CRM in Real Time: Empowering Customer Relationships”
Information Today, Inc.
Khurana, M. (2010) “Information Technology for Retailing” Tata McGraw-Hill
Education
Lamb, C.W., Hair, J.F. & McDaniel, C. (2011) “Marketing: Student Edition” Cengage
Learning
Mathur, U.C. (2010) “Retail Management: Text and Cases” I.K. International Pvt Ltd
Mueller, B. (2010) “Dynamics of International Advertising: Theoretical and Practical
Perspectives” Peter Lang
Peppers, D. & Rogers, M. (2011) “Managing Customer Relationships: A Strategic
Framework” John Miley & Sons
Pradan, S. (2009) “Retailing Management: Text & Cases”, 3rd edition, Tata McGraw-
Hill Education
Raab, G., Ajami, R.A., Gargeya V. & Goddard, G.J. (2008) “Customer relationship
management: a global perspective” Gower Publishing

66
Sinkovics, R.R & Ghauri, P.N. (2009) “New Challenges to International
Marketing” Emerald Group Publishing
Berndt et al (2005)
2005 Lindgreen
Panda (2003)
Blery & Michalakopoulos (2006)
Parvatiyar & Sheth (2001)
Payne & Frow 2006
Sarlak & Fard in 2009
Kim & Kim in 2007
(Lamb et al, 2011, p.189)
Sarlak & Fard in 2009
Websites Referred:
Google.com
En.wikipedia.org
www.ache-houston.org
Greenchef.in
www.emarketing.net