Embed Size (px)
Citation preview

Department of Petroleum Engineering
Tulsa University Paraffin Deposition Projects
Report Type: Final Technical Report
Reporting Period:
April 2001 – March 31, 2004
Principal Authors: Cem Sarica
Michael Volk
Date Issued: June, 2004
DOE Award Number: DE-FC26-01BC15150
Paraffin Deposition Research and Model Development
Address: The University of Tulsa
600 South College Avenue Tulsa, Oklahoma 74104


i
Disclaimer This report was prepared as an account of work sponsored by an agency of the United States Government. Neither the United States Government nor any agency thereof, nor any of their employees, makes any warranty, express or implied, or assumes any legal liability or responsibility for the accuracy, completeness, or usefulness of any information, apparatus, product, or process disclosed, or represents that its use would not infringe privately owned rights. Reference herein to any specific commercial product, process, or service by trade name, trademark, manufacturer, or otherwise does not necessarily constitute or imply its endorsement, recommendation, or favoring by the United States Government or any agency thereof. The views and opinions of authors expressed herein do not necessarily state or reflect those of the United States Government or any agency thereof.

ii

iii
Table of Contents Disclaimer .................................................................................................................................... i
Abstract...................................................................................................................................... xi
Introduction.............................................................................................................................. xii
Executive Summary....................................................................................................................1
Literature Review .......................................................................................................................3 Single-Phase Studies ..........................................................................................................................3 Molecular Diffusion .................................................................................................................................... 3 Film Mass Transfer ..................................................................................................................................... 4 Deposit Aging ............................................................................................................................................. 4 Shear Stripping............................................................................................................................................ 5 Oil-Water Studies........................................................................................................................................ 5
Multiphase Studies .............................................................................................................................6 Two-Phase Flow Hydrodynamics ............................................................................................................... 6 Two-Phase Gas-Oil Wax Deposition .......................................................................................................... 6 Heat Transfer............................................................................................................................................... 7
Facilities .......................................................................................................................................9 Small Scale Facility ............................................................................................................................9
Oil System ............................................................................................................................................... 9 Test Sections ............................................................................................................................................... 9 Glycol System ........................................................................................................................................... 10 Control and Data Acquisition.................................................................................................................... 10
Single-Phase Flow Loop ..................................................................................................................13 Oil System ............................................................................................................................................. 13 Test Section ............................................................................................................................................. 13 Glycol System ........................................................................................................................................... 14 Hot Glycol System .................................................................................................................................... 14 Heat Tracing System ................................................................................................................................. 14 Data Acquisition System........................................................................................................................... 15 Special Modifications................................................................................................................................ 15
Multiphase Flow Loop .....................................................................................................................16 Oil System ............................................................................................................................................. 16 Gas System ............................................................................................................................................. 17 Glycol Systems.......................................................................................................................................... 17 Test Section ............................................................................................................................................. 17 Data Acquisition System........................................................................................................................... 17 Special Modifications................................................................................................................................ 17
Cold Finger Apparatus.....................................................................................................................18 Deposit Thickness Estimation ................................................................................................................... 19 Boroscope Measurement .................................................................................................................... 19 Wax Content Measurement ....................................................................................................................... 19

iv
Test Fluids..................................................................................................................................21 South Pelto Crude Oil ......................................................................................................................21 Garden Banks Condensate...............................................................................................................21 Cote Blanche Island (CBI) Crude Oil .............................................................................................22 Caratinga Fluid Properties ..............................................................................................................23 Experimental Studies................................................................................................................25 Deposition Physics Studies...............................................................................................................25 Small Scale Studies ................................................................................................................................... 25 Experimental Program ....................................................................................................................... 25 Experimental Results ......................................................................................................................... 25 Shakedown Tests ........................................................................................................................ 25 Shakedown Test No. 1 ......................................................................................................... 25 Shakedown Test No. 2 ......................................................................................................... 25 Deposition Tests with Same Reynolds Number.......................................................................... 26 Test WAX2003-010............................................................................................................. 26 Test WAX2003-017............................................................................................................. 26 Test WAX2003-019............................................................................................................. 27 Modification of Facility and Repeat Tests .................................................................................. 27 Test WAX2003-046............................................................................................................. 28 Test WAX2003-032............................................................................................................. 28 Test WAX2003-031............................................................................................................. 28 Deposition Tests with Same Fluid Velocity................................................................................ 29 Test WAX2003-049............................................................................................................. 29 Test WAX2003-050............................................................................................................. 29 Deposition Tests with Same Shear Stress ................................................................................... 30 Test WAX2003-052............................................................................................................. 30 Test WAX2003-051............................................................................................................. 31 Oil-Water Tests ........................................................................................................................... 32 Test WAX2003-043............................................................................................................. 32 Test WAX2003-044............................................................................................................. 32 Test WAX2003-045............................................................................................................. 33 Conclusions................................................................................................................................. 34 Cold Finger Studies................................................................................................................................... 34 Experimental Program ....................................................................................................................... 34 Experimental Procedure.............................................................................................................. 35 Experimental Results ......................................................................................................................... 35 South Pelto Tests......................................................................................................................... 35 Test Period: 24 Hours .......................................................................................................... 35 Test Period: 6 Hours ............................................................................................................ 42 Cote Blanch Island (CBI) Tests .................................................................................................. 48 Conclusions................................................................................................................................. 50 South Pelto........................................................................................................................... 50 Cote Blanche Island ............................................................................................................. 50 Pigging Studies.......................................................................................................................................... 51 Single-Phase Studies ........................................................................................................................53 Investigation of Single-Phase Paraffin Deposition Characteristics ........................................................... 53 Operational Procedure........................................................................................................................ 53 Startup Procedure........................................................................................................................ 53 Steady-State ................................................................................................................................ 53 Shutdown .................................................................................................................................... 53 Deposit Thickness Determination ...................................................................................................... 54 Pressure Drop Method ................................................................................................................ 54 Heat Transfer Method ................................................................................................................. 55

v
Liquid Displacement – Level Detection (LD-LD) Method......................................................... 57 Spool Piece LD-LD ............................................................................................................. 57 Online LD-LD (Multiphase Flow Loop).............................................................................. 58 Experimental Results ......................................................................................................................... 59 South Pelto Tests......................................................................................................................... 59 Effect of ∆T ......................................................................................................................... 59 Effect of Flow Rate.............................................................................................................. 60 Garden Banks Condensate .......................................................................................................... 63 Effect of ∆T ......................................................................................................................... 64 Effect of Flow Rate.............................................................................................................. 69 Effect of Shear Stripping ..................................................................................................... 70 Comparison between South Pelto and Garden Banks Tests........................................................ 75 Conclusions........................................................................................................................................ 75 Effect of ∆T................................................................................................................................. 76 Effect of Flow Rate ..................................................................................................................... 76 Turbulent Tests .................................................................................................................... 76 Laminar and Transition Tests (South Pelto) ........................................................................ 76 Shear Stripping Effect (Garden Banks)....................................................................................... 77 General........................................................................................................................................ 77 Investigation of Heavy Oil Single-Phase Paraffin Deposition Characteristics.......................................... 77 Introduction........................................................................................................................................ 77 Experimental Results ......................................................................................................................... 77 Test Matrices............................................................................................................................... 77 Cote Blanche Island (CBI) Tests................................................................................................. 78 Effect of ∆T ......................................................................................................................... 78 Effect of Flow Rate.............................................................................................................. 80 Effect of Deposition Time ................................................................................................... 81 Effect of Oil Inlet Temperature............................................................................................ 82 Conclusions........................................................................................................................................ 84 Model Validation....................................................................................................................................... 84 Test 1 ............................................................................................................................................. 84 Test 2 ............................................................................................................................................. 85 Test 3 ............................................................................................................................................. 85 Test 4 ............................................................................................................................................. 86 Multiphase Studies ...........................................................................................................................86 Heat Transfer Studies ................................................................................................................................ 86 Experimental Study............................................................................................................................ 86 Flow Pattern Validation at High Pressure Conditions (HPFP) Tests .......................................... 86 HPFP Test Results ............................................................................................................... 87 Two-Phase Heat Transfer Measurements ................................................................................... 91 Heat Transfer Measurement................................................................................................. 91 Test Program........................................................................................................................ 92 TPHT Test Results............................................................................................................... 92 Conclusions........................................................................................................................................ 97 Gas-Oil Water Studies............................................................................................................................... 98 Experimental Program ....................................................................................................................... 98 Deposition Thickness Determination ................................................................................................. 98 Online and Offline (Spool Piece) LD-LD................................................................................... 98 Pressure Drop and Heat Transfer Methods ................................................................................. 99 Experimental Results ......................................................................................................................... 99 Visual Observations .................................................................................................................. 102 Comparisons between Horizontal and Vertical Tests ........................................................ 102 Comparisons between Single-Phase and Multiphase Flow Tests ...................................... 103 Conclusions...................................................................................................................................... 103

vi
Modeling Studies .....................................................................................................................105 Investigation of Single-Phase Paraffin Deposition Characteristics ................................................................ 105 Software Modification............................................................................................................................. 105 Model Enhancement................................................................................................................................ 105 Mechanistic Heat Transfer Model .................................................................................................................. 106 Conclusions..............................................................................................................................107 Deposition Physics Studies.............................................................................................................107 Single-Phase Studies ......................................................................................................................108 Multiphase Studies .........................................................................................................................108 Nomenclature ..........................................................................................................................109 References................................................................................................................................111

vii
List of Tables Table 1 – Fluid Properties for CBI Crude Oil.......................................................................................................... 23 Table 2 – Test Conditions for Test WAX2002-019................................................................................................. 26 Table 3 – Test Conditions for Test WAX2003-017................................................................................................. 27 Table 4 – Test Conditions for Test WAX2003-019................................................................................................. 27 Table 5 – Summary of Test Conditions of Same Reynolds Number Tests.............................................................. 29 Table 6 – Test Conditions for Test WAX2003-049................................................................................................. 29 Table 7 – Test Conditions for Test WAX2003-050................................................................................................. 30 Table 8 – Summary of Test Conditions for Same Oil Velocity Tests ..................................................................... 30 Table 9 – Test Conditions for Test WAX2003-052................................................................................................. 31 Table 10 – Test Conditions for Test WAX2003-051............................................................................................... 31 Table 11 – Summary of Test Conditions for Same Shear Stress Tests.................................................................... 32 Table 12 – Test Conditions for Test WAX2003-043............................................................................................... 32 Table 13 – Test Conditions for Test WAX2003-044............................................................................................... 33 Table 14 – Test Conditions for Test WAX2003-045............................................................................................... 33 Table 15 – Results for 24 Hour Tests with Oil and Brine........................................................................................ 37 Table 16 – Effect of Test Duration .......................................................................................................................... 38 Table 17 – Test Matrix for 600 rpm ........................................................................................................................ 43 Table 18 – Test Matrix for 2000 rpm ...................................................................................................................... 43 Table 19 – Results for 24 hr Tests ........................................................................................................................... 44 Table 20 – Results for 6 hr Tests ............................................................................................................................. 44 Table 21 – Test Matrix for South Pelto Crude Oil................................................................................................... 59 Table 22 – Summary of Flow Rate Test Results ..................................................................................................... 63 Table 23 – Test Matrix for Garden Banks Condensate............................................................................................ 64 Table 24 – Test Conditions for Shear Stripping Tests ............................................................................................. 70 Table 25 – Test Matrix for Cote Blanch Island (CBI) Crude Oil ............................................................................ 78 Table 26 – Preliminary Analysis Based on Fick’s Law of Diffusion for ∆T Effects............................................... 79 Table 27 – LD-LD Measurements for ∆T Effect Tests ........................................................................................... 80 Table 28 – Deposit Wax Fraction for ∆T Effect Tests ............................................................................................ 80 Table 29 – LD-LD Measurements for Flow Rate Effect Tests................................................................................ 81 Table 30 – Preliminary Analysis Based on Fick’s Law of Diffusion for Deposition Time Effect Tests......................................................................................................................................................................... 82 Table 31 – LD-LD Measurements for Deposition Time Effect Tests ..................................................................... 82 Table 32 – Preliminary Analysis Based on Fick’s Law of Diffusion for Oil Inlet Temperature Effect Tests.............................................................................................................................................................. 83 Table 33 – LD-LD Measurements for Oil Inlet Temperature Effect Tests.............................................................. 83 Table 34 – Wax Fraction Measurements for Oil Inlet Temperature Effect Tests .................................................... 84 Table 35 – LD-LD Results for Test 1 ...................................................................................................................... 85 Table 36 – LD-LD Results for Test 2 ...................................................................................................................... 85 Table 37 – LD-LD Results for Test 3 ...................................................................................................................... 85 Table 38 – LD-LD Results for Test 4 ...................................................................................................................... 86 Table 39 – Summary of Multiphase Tests with Garden Banks Condensate .......................................................... 100 Table 40 – Horizontal Single-Phase Test in Multiphase Loop with Garden Banks Condensate (WAX2002-005).................................................................................................................................................... 103

viii

ix
List of Figures Figure 1 – Schematic Diagram of Oil System ......................................................................................................... 10 Figure 2 – Photograph of Oil System ...................................................................................................................... 11 Figure 3 – Schematic Diagram of Test Sections...................................................................................................... 11 Figure 4 – Schematic Diagram of Glycol System ................................................................................................... 12 Figure 5 – Photograph of Glycol System................................................................................................................. 12 Figure 6 – Schematic of the Single-Phase Flow Facility ......................................................................................... 15 Figure 7 – Schematic of Test Section ...................................................................................................................... 16 Figure 8 – Multiphase Flow Facility Diagram......................................................................................................... 18 Figure 9 – The Cold Finger Apparatus .................................................................................................................... 18 Figure 10 – Photograph of Boroscope ..................................................................................................................... 19 Figure 11 – DSC Instrument.................................................................................................................................... 20 Figure 12 – Comparison of South Pelto and Garden Banks Viscosities.................................................................. 22 Figure 13 – ExxonMobil Measurements of CBI Crude Oil Viscosity..................................................................... 23 Figure 14 – Cumulative Wax Percentage for Caratinga and CBI Oils .................................................................... 24 Figure 15 – Weight Profile as Function of ∆T for Each Cell................................................................................... 38 Figure 16 – Wax and Weight Profiles as Function of ∆T........................................................................................ 39 Figure 17 – Average Weight Profile of Deposits as Function of Water Cut ........................................................... 39 Figure 18 – Wax Profile as Function of Water Cut for Different ∆T ...................................................................... 40 Figure 19 – Weight Profile as Function of Water Cut for Brine and Fresh Water .................................................. 40 Figure 20 – Effect of Wax Deposition of the WAT of the Oil ................................................................................ 41 Figure 21 – Effect of Wax Deposition on the Wax Content of the Oil.................................................................... 41 Figure 22 – Weight Profile at Different Test Durations for Single-Phase Oil ......................................................... 42 Figure 23 – Effect of Test Duration......................................................................................................................... 44 Figure 24 – Effect of Salinity on Wax Deposition (Mixing Speed of 2000 rpm).................................................... 45 Figure 25 – Effect of Salinity on Wax Deposition (Mixing Speed of 600 rpm)...................................................... 46 Figure 26 – Effect of Emulsion Preparation (∆T: 30°F).......................................................................................... 47 Figure 27 – Effect of Emulsion Preparation (∆T: 15°F).......................................................................................... 47 Figure 28 – Effect of Emulsion Preparation (∆T: 45°F).......................................................................................... 48 Figure 29 – Effect of Temperature Difference for CBI ........................................................................................... 49 Figure 30 – Effect of Deposition Time for CBI....................................................................................................... 49 Figure 31 – The Pig ................................................................................................................................................. 51 Figure 32 – Pigging Results..................................................................................................................................... 52 Figure 33 – Wax Recovered from Pigging .............................................................................................................. 52 Figure 34 – Cross Section of Pipe Segment and Relevant Variables ...................................................................... 54 Figure 35 – Schematic of Online LD-LD Device (Multiphase Flow Loop)............................................................ 58 Figure 36 – View of Scrape on the Deposit Surface for Test WAX2001/006 (∆T = 30°F) .................................... 60 Figure 37 – View of Scrape on the Deposit Surface for Test WAX2001/007 (∆T = 15°F) .................................... 60 Figure 38 – Stereotype View of Deposit Surface after MEK Wash for Test WAX2001/008 (Qo = 450 BPD) ................................................................................................................................................................. 61 Figure 39 – Deposit on Spool Piece for Test WAX2001/010 (Qo = 2900 BPD) .................................................... 61 Figure 40 – Deposit on Spool Piece for Test WAX2001/016 (Qo = 1800 BPD) .................................................... 62 Figure 41 – Deposit on Spool Piece #1 for Test WAX2001/025 (Qo = 1500 BPD, ∆T = 30°F) ............................ 65 Figure 42 – Deposit on Spool Piece #2 for Test WAX2001/025 (Qo = 1500 BPD, ∆T = 30°F) ............................ 65 Figure 43 – Deposit on Spool Piece #1 for Test WAX2001/026 (Qo = 1500 BPD, ∆T = 15°F) ............................ 66 Figure 44 – Deposit on Spool Piece #2 for Test WAX2001/026 (Qo = 1500 BPD, ∆T = 15°F) ............................ 66 Figure 45 – Deposit on Spool Piece #1 for Test WAX2001/033 (Qo = 1000 BPD, ∆T = 30°F) ............................ 67 Figure 46 – Deposit on Spool Piece #2 for Test WAX2001/033 (Qo = 1000 BPD, ∆T = 30°F) ............................ 67 Figure 47 – Deposit on Spool Piece #1 for Test WAX2001/031 (Qo = 1000 BPD, ∆T = 15°F) ............................ 67 Figure 48 – Deposit on Spool Piece #2 for Test WAX2001/031 (Qo = 1000 BPD, ∆T = 15°F) ............................ 67 Figure 49 – Deposit on Spool Piece #1 for Test WAX2001/029 (Qo = 1800 BPD, ∆T = 15°F) ............................ 68 Figure 50 – Deposit on Spool Piece #2 for Test WAX2001/029 (Qo = 1800 BPD, ∆T = 15°F) ............................ 68
x
Figure 51 – Deposit on Spool Piece #1 for Test WAX2002/001 (Qo = 1800 BPD, ∆T = 15°F) ............................ 69 Figure 52 – Deposit on Spool Piece #2 for Test WAX2002/001 (Qo = 1800 BPD, ∆T = 15°F) ............................ 69 Figure 53 – Deposit on Spool Piece #1 for Test WAX2001/028 (Shear Stripping Test.......................................... 72 Figure 54 – Deposit on Spool Piece #2 for Test WAX2001/028 (Shear Stripping Test) ........................................ 72 Figure 55 – Deposit on Spool Piece #1 for Test WAX2002/002 (Shear Stripping) ................................................ 73 Figure 56 – Deposit on Spool Piece #2 for Test WAX2002/002 (Shear Stripping) ................................................ 73 Figure 57 – Deposit on Spool Piece #1 for Test WAX2002/003............................................................................. 75 Figure 58 – Deposit on Spool Piece #2 for Test WAX2002/003............................................................................. 75 Figure 59 – Cw and dCw/dT vs. T for Cote Blanch Island (CBI) Crude Oil ............................................................ 80 Figure 60 – Flow Pattern Map for Horizontal Flow (θ = 0.01°) at 213.4 psia......................................................... 87 Figure 61 – Flow Pattern Map for Horizontal Flow (θ = 0.00°) at 464.8 psia......................................................... 88 Figure 62 – Flow Pattern Map for Upward 1° Flow (θ = 0.03°) at 209.3 psia ........................................................ 88 Figure 63 – Flow Pattern Map for Upward 1° Flow (θ = 0.03°) at 460.7 psia ........................................................ 89 Figure 64 – Flow Pattern Map for Upward Vertical Flow (θ = 90.00°) at 211.4 psia ............................................. 90 Figure 65 – Flow Pattern Map for Upward Vertical Flow (θ = 90.00°) at 465.3 psia ............................................. 90 Figure 66 – Schematic Diagram of Heat Transfer Measurement Section................................................................ 91 Figure 67 – Experimental Convective Heat Transfer Coefficient vs. Superficial Liquid Velocity for Single-Phase Liquid Flow.................................................................................................................................. 92 Figure 68 – Comparison between Predicted and Experimental Convective Heat Transfer Coefficients for Single-Phase Liquid Flow ............................................................................................................. 93 Figure 69 – Experimental Convective Heat Transfer Coefficient vs. Superficial Gas Velocity for Single-Phase Gas Flow............................................................................................................................................ 93 Figure 70 – Comparison between Predicted and Experimental Convective Heat Transfer Coefficients for Single-Phase Gas Flow.................................................................................................................. 94 Figure 71 – Experimental Convective Heat Transfer Coefficients vs. Superficial Gas Velocity for Vertical Two-Phase Flow ........................................................................................................................................ 95 Figure 72 – Enhancement of Convective Heat Transfer Coefficient vs. Superficial Gas/Liquid Velocity Ratio for Vertical Two-Phase Flow .......................................................................................................... 95 Figure 73 – Convective Heat Transfer Coefficient vs. Superficial Gas Velocity for Horizontal Two-Phase Flow...................................................................................................................................................... 96 Figure 74 – Enhancement of Convective Heat Transfer Coefficient vs. Superficial Gas/Liquid Velocity Ratio for Horizontal Two-Phase Flow ...................................................................................................... 97 Figure 75 – Wax Deposit Thicknesses for Garden Banks Condensate (350 psi, 85°F, Horizontal 2-in Diameter Pipe .................................................................................................................................................... 101 Figure 76 – Wax Deposit Thicknesses for Garden Banks Condensate (350 psi, 85°F, Vertical 2-in Diameter Pipe ........................................................................................................................................................ 101 Figure 77 – Views of Scrape and Gas Bubbles on Deposit Surface (WAX2002-009).......................................... 102

xi
Abstract As oil and gas production moves to deeper and colder water, subsea multiphase production systems become critical for economic feasibility. It will also become increasingly imperative to adequately identify the conditions for paraffin precipitation and predict paraffin deposition rates to optimize the design and operation of these multiphase production systems. Although several oil companies have paraffin deposition predictive capabilities for single-phase oil flow, these predictive capabilities are not suitable for the multiphase flow conditions encountered in most flowlines and wellbores. For deepwater applications in the Gulf of Mexico, it is likely that multiphase production streams consisting of crude oil, produced water and gas will be transported in a single multiphase pipeline to minimize capital cost and complexity at the mudline. Existing single-phase (crude oil) paraffin deposition predictive tools are clearly inadequate to accurately design these pipelines, because they do not account for the second and third phases, namely, produced water and gas.
The objective of this program is to utilize the current test facilities at The University of Tulsa, as well as member company expertise, to accomplish the following: enhance our understanding of paraffin deposition in single and two-phase (gas-oil) flows; conduct focused experiments to better understand various aspects of deposition physics; and, utilize knowledge gained from experimental modeling studies to enhance the computer programs developed in the previous JIP for predicting paraffin deposition in single and two-phase flow environments. These refined computer models will then be tested against field data from member company pipelines.
The following deliverables are scheduled during the first three projects of the program:
1. Single-Phase Studies, with three different black oils, which will yield an enhanced computer code for predicting paraffin deposition in deepwater and surface pipelines.
2. Two-Phase Studies, with a focus on heat transfer and paraffin deposition at various pipe inclinations, which will be used to enhance the paraffin deposition code for gas-liquid flow in pipes.
3. Deposition Physics and Water Impact Studies, which will address the aging process, improve our ability to characterize paraffin deposits and enhance our understanding of the role water plays in paraffin deposition in deepwater pipelines. As in the previous two studies, knowledge gained in this suite of studies will be integrated into a state-of-the-art three-phase paraffin deposition computer program.
Graduate students, post-Doctoral Research Associates and Visiting Scholars will primarily conduct the research in these projects. Knowledge will be transferred to the industry through semiannual Advisory Board Meetings, graduate education of one Ph.D. student and four M.S. students, and through the coordination of annual workshops for hands on

xii

xiii
Introduction The frontier for oil and gas exploration and production is deepwater; however, as oil and gas production moves to deeper and colder water, subsea multiphase production systems become critical for economic feasibility. It will also become increasingly imperative to adequately identify the conditions for paraffin precipitation and predict paraffin deposition rates to optimize the design and operation of these multiphase production systems. Accurate information about the potential for, and extent of, wax deposition is very critical, not only towards the operation and design of these systems, but also for assuring their economic feasibility. Although several oil companies have paraffin deposition predictive capabilities for single-phase oil flow, these predictive capabilities are not suitable for the multiphase flow conditions encountered in most flowlines and wellbores. DeepStar was formed to identify and develop the required technology. A $4.5 million JIP to investigate paraffin deposition at The University of Tulsa was formed in May 1995 and is a spin-off from DeepStar.
New petroleum production horizons at water depths greater than 500m have driven industry to develop new technologies for preventing and controlling the deposition of petroleum wax. Traditional methods of management, prevention, and remediation have been established for many years. The greater water depths mean lower temperatures, no fixed platforms (TLP's and FPSO's are expensive) and subsea wellheads. The longer and fewer production lines in deeper water make economic solutions to prevention, management, and remediation key to economic development of these new deepwater resources.
The cost of remediation due to pipeline blockage from paraffin deposition is on the order of $200,000 when the water depth is 100m, but on the order of $1,000,000 when the remediation occurs in water depths near 400m. The cost is proportionately greater as development depth increases.
Since its inception, the petroleum industry has been plagued by paraffin. Its long time nature as a nuisance, easily and inexpensively treated onshore with chemicals and scrappers, has resulted in a lack of basic research regarding the actual deposition phenomena. However, paraffin deposition can be the determining factor for not producing deepwater fields, many of which are tied to nearby platforms with subsea flowlines. These remote facilities at low temperatures are vulnerable to deposition of paraffin in tubulars, which could lead to a potentially expensive, catastrophic event in the history of a project.
This inherent engineering and economic challenge has led to a renewed interest in studying the problem within the petroleum industry. Many oil and gas related companies have studied paraffin deposition and have predictive capabilities for paraffin deposition during single-phase oil flow. However, these predictive capabilities are still unproved and not suitable for multiphase flow conditions encountered in most flowlines and wellbores. It is important to model the deposition rate to optimize pigging schedules, to design appropriate chemical treatments, or to design insulated systems to minimize or alleviate paraffin deposition in wellbores or flowlines.

xiv

1
Executive Summary Twenty companies were members of the consortium. These members include: Baker Petrolite,
BG International, BHP Billiton Petroleum, BP Exploration, Champion Technologies, ChevronTexaco Exploration and Production Technology Company, Conoco-Phillips, Department of Energy (DOE), ExxonMobil Upstream Research, Japan National Oil Corporation, Marathon Oil Company, Minerals Management Services, Nalco Energy Services, ONGC, Pemex, Petrobras, Shell E & P Technology Company, Statoil, Total and Unocal. Three companies participated as “in-kind” members: Alberta Research Council, Multiphase Solutions, Inc. and PetroCanada.
Two additional fluids were obtained for the study: one for the model validation study and one for the single-phase test program.
A new facility was constructed to investigate long term paraffin deposition behavior. Experimental data were gathered with South Pelto oil. Ten single-phase, long term deposition tests were completed in the three test sections with diameters of 0.5 in., 1.0 in. and 1.5 in. with testing durations ranging from 3 to 27 days. Tests were also conducted to investigate the effects of Reynolds number, velocity and shear stress. Three oil-water two phase tests with different water cuts of 25%, 40% and 75% were conducted in the 1.5-in. test section. A 27-day test was conducted to investigate aging phenomena. From the DSC analyses of the oil samples, the WAT began to drop after 4 days of testing, indicating depletion of the wax content in the oil. A special test designed to further investigate the plateau behavior confirmed depletion. The dimensionless deposit thickness versus time did not change very much for tests in the three test sections with the same Reynolds number, but changed significantly for tests with the same velocity and shear stress. Based on current test results, Reynolds number has the greatest impact on deposition thickness. Three oil-water two-phase tests were conducted in the 1.5-in. test section with different water cuts of 25%, 40% and 75%. The deposition rates were higher than those observed for single-phase cases. Moreover, for the test with 40% water cut, a peculiar pressure drop behavior was observed. Since the two-phase paraffin deposition behavior is directly related to the properties of the mixture, a detailed rheological analysis is recommended for future studies.
Two different crude oils were extensively studied under single-phase and two-phase oil-water conditions to assess their deposition tendencies using the cold finger device. The same oils were studied under similar conditions using the flow loop facilities. The results obtained from the flow loop for the oil-water tests differed from the results obtained from the cold finger device with respect to deposition tendencies. The deposition rates obtained from the flow loop for oil-water tests were higher than those seen for single-phase tests and kept increasing for increasing water cuts (Gao, 2003). The deposition tendencies were exactly the opposite for the cold finger device. The total amount of deposit at the end of the tests was higher for single-phase tests than for oil-water tests, and it decreased with increasing water cuts. The overall mass of deposit increased with increasing ∆Ts for all conditions tested. For single-phase tests, the average wax fraction in the deposits decreases with increasing ∆Ts, resulting in softer deposits. Similar trends were observed for single-phase tests at the flow loop. For the oil-water tests conducted with salt water, the wax fraction increased with water up to 60% and it seemed to plateau for higher water cuts. Four different water cuts were used for oil-water tests. The amount of deposit is higher for single-phase tests than for two-phase oil-water tests and it decreased almost exponentially with increasing water cuts. This behavior gets more accentuated as the ∆T increases. The presence of salt did not affect the deposition for all conditions tested. Nearly no difference could be seen when comparing the amount of deposits created with fresh water and brine.
A total of nineteen single-phase tests were successfully conducted using a condensate fluid in two different flow loops, with significantly different flow conditions and twelve tests with heavier oils. The tests were used to study the dependence of the paraffin deposition process on flow rate, flow regime,

2
∆T, shear stripping and fluid properties. The paraffin deposition process was highly dependant on the temperature difference between the oil and glycol inlet temperatures and the deposit thickness decreased significantly for the tests with lower ∆T. For the higher ∆T tests the deposit thickness changed significantly with flow rate. The deposit thickness increased as the oil flow rate decreased. For lower ∆T tests no definitive conclusions could be drawn because the deposit thicknesses were quite small. The flow rate affected the characteristics of the deposit, that is, the deposit was softer for the tests with lower oil velocities. Tests with the more viscous crude oils produced deposits with relatively high oil contents. The deposits were uniform across the pipe. The viscosity dependence on temperature had a significant impact on the diffusivity phenomena. Thickness calculations using the heat transfer method were found to apply better than the pressure drop method.
Experimental heat transfer data were acquired on flow pattern transitions for horizontal, upward 1o and upward vertical crude oil-natural gas two-phase flow at high-pressure conditions. Flow pattern transitions were found to be affected by pressure. Experimental data on convective heat transfer coefficients were acquired for single-phase liquid flow, single-phase gas flow, horizontal stratified flow, vertical bubbly flow, vertical intermittent flow and horizontal and vertical annular flow. These tests showed that the single-phase convective heat transfer coefficients for turbulent liquid flow could be predicted by the Petukhov-Kirillov correlation with slight underprediction at high liquid velocity, and single-phase convective heat transfer coefficients for turbulent gas flow could be predicted by the Dittus-Boelter correlation. The two-phase heat transfer test results showed larger hTP values were obtained at higher vSL for the same vSg, and in general, they increased with an increase of vSg at the same vSL.
A total of 23 multiphase (gas-oil) tests with a mixture of condensate and Tulsa City Natural Gas in horizontal and vertical pipes were conducted in a high-pressure state-of-the-art test facility to generate wax deposition data. Wax deposition was found to be a flow-pattern dependent phenomenon. For horizontal flow, annular flow produced the thickest deposits, intermittent and stratified smooth flow produced the thinnest deposits while stratified wavy flow produced thicker deposits than stratified smooth flow. For vertical flow, bubbly flow and annular flow tests with high superficial oil velocities produced the thinnest deposits; intermittent flow tests with low superficial oil velocities produced the thickest deposits while increasing oil superficial velocity resulted in thinner deposits.
The paraffin deposition program (TUWAX) was used to compare experimental results from the flow loop tests with model predictions. Modifications to this model were made throughout the study in order to improve the prediction of deposition rates.

3
Literature Review
Single-Phase Studies The paraffin deposition phenomenon in single-phase flow is not well understood. Lund (1998),
Matzain (1996, 1999) and Apte (1999) presented thorough literature reviews on paraffin deposition under single and multiphase conditions during the TU Paraffin Deposition JIP, completed in 1999. The precipitation of paraffin or wax occurs when the wall temperature of a pipe through which paraffinic oil is transported falls below the Wax Appearance Temperature, WAT (also called cloud point). Burger et al. (1981) identified four possible mechanisms for paraffin deposition: molecular diffusion, shear dispersion, Brownian diffusion and gravity settling. They found that gravity settling has no impact on the deposition process and that Brownian dispersion may be neglected. Several investigators (Bern et al. (1980), Burger et al. (1981) and Brown et al. (1993)) suggested that molecular diffusion is the primary mechanism for paraffin deposition.
MOLECULAR DIFFUSION The solubility of paraffin molecules is highly dependent on the fluid temperature; therefore,
whenever there is a radial temperature gradient in the pipe, a radial concentration gradient will also develop. This concentration gradient is the driving force for the dissolved paraffin molecules to be transported towards the pipe wall where the dissolved wax concentration is lower. Fick’s Law is used to describe the mass transfer rate due to molecular diffusion for binary mixtures, as follows:
rT
TwAD
rwAD
dtdm w
iwow
iwo ∂∂
∂∂ρ
∂∂ρ ==
.......................................................................................(1)
where Dwo is the diffusion coefficient of wax in oil, ww is the dissolved wax mass fraction, ρ is the fluid density and Ai is the interfacial area. The molecular diffusion coefficient, Dwo [m2/s] can be calculated by either the Wilke – Chang (1955) or the Hayduk – Minhas (1982) correlations, given by Eqs. 2 and 3, respectively.
Wilke-Chang (1955): ( )6.0
2/112104.7
AB
BBAB
VTMD
µϕ−⋅= ...............................................................(2)
Hayduk-Minhas (1982): 71.0
/2.1047.112
791.0
103.13A
VB
ABV
TDA−
−⋅=µ .................................................(3)
where ϕB is an association parameter for the solvent B (1 for benzene, ether, heptane and other unassociated solvents), MB is the solvent molecular weight, T is the fluid temperature (K), µB is the solvent viscosity (cP) and VA is the molar volume of solute A (cm3/gmol).
If experimental data are available, the diffusion coefficient can also be expressed as an experimental constant divided by the fluid viscosity. In order to use Eq. 1 to estimate the mass transfer rate, the dissolved paraffin is considered a pseudo component, when in fact it is a combination of many hydrocarbon compounds from C15 up to C70+.
In terms of the deposit thickness, Eq. 1 becomes:
rT
TwD
rwD
AV
dtd
dtd w
wax
wow
wax
wo
i ∂∂
∂∂
ρρ
∂∂
ρρδ
==⎟⎟⎠
⎞⎜⎜⎝
⎛= .............................................................................(4)
4
FILM MASS TRANSFER Fick’s law was developed for isothermal, quiescent processes where only the diffusion due to a
concentration gradient is considered; neglecting any mass diffusion from temperature gradient, pressure gradient or external forces (Incropera-DeWitt, 1996). Therefore, Eqs. 1 and 4 may not be applicable for the deposition process. Furthermore, the application of the chain rule in Eqs. 1 and 4 to obtain the radial mass fraction gradient implies a thermal equilibrium assumption, which may not be valid for the non-isothermal problem being studied.
Hensley (2000), proposed the use of a local mass transfer coefficient analogous to heat transfer problems, which does not imply the equilibrium assumption, as follows:
[ ])()( iwbwim TwTwAkdtdm
−= ρ .....................................................................................................(5)
where ww(Tb) is the wax mass fraction at the bulk temperature, and ww(Ti) is the wax mass fraction at the deposit interfacial temperature.
The mass transfer coefficient, km, can be obtained by using the Chilton-Colburn analogy, employing the same correlations as for heat transfer by substituting the Nusselt number for heat transfer
with the Nusselt number for mass transfer ⎟⎟⎠
⎞⎜⎜⎝
⎛=
AB
mm D
dkNu and the Prandtl number with the Schmidt number
⎟⎟⎠
⎞⎜⎜⎝
⎛=
ABDSc
ρµ . This analogy is valid for low mass transfer rate problems.
DEPOSIT AGING Wax deposits consist of very small wax crystals that tend to agglomerate and form granular
particles of wax about the size of the grains of ordinary table salt. Deposited wax contains gums, resins, asphaltic material, crude oil, sand silt, and in may instances water, in addition to the wax crystals. The deposit varies in consistency from a mushy liquid to a firm hard wax, depending primarily upon the amount of the oil present” (Reistle, 1932).
The trapped oil content in the deposit is a critical parameter to properly characterize the deposition process since it will affect the deposit nature. The deposit wax content changes significantly with flow conditions, particularly with flow rate. Lund (1998) found deposits with about 10% of wax content for laminar flow experiments, and up to 50% for turbulent flow conditions. However, in studies from previous investigators, including TUPDP studies, one of the assumptions for the developed models is that the deposit wax content is constant in time; this parameter is often used to match experimental data with model predictions, or was measured at the end of each test.
According to Singh et al. (2000), due to its crystal network structure, wax deposits behave as a porous medium in which wax molecules continue to diffuse due to the radial gradient of temperature across the deposit. They hypothesized that a counter diffusion phenomenon takes place at the deposit interface, where wax molecules diffuse into the crystal network, displacing the oil trapped in the deposit interstices, which causes an increase in the deposit wax content, e.g. aging. Singh et al. modeled the deposit growth as the radial convective flux of molecules from the bulk to the fluid – deposit interface minus the diffusive flux into the gel interface. This last term was modeled using Fick’s law (Eq. 1) with an effective diffusion coefficient for the mass transfer of wax molecules inside the deposit.
Cussler et al. (1998) developed an expression for the effective diffusivity for porous media of flake-like particles:

5
__
2__2
11
Fw
Fw
DD woe
−+
=
α
.......................................................................................................................(6)
where Dwo is the diffusion coefficient of wax in oil, α is the aspect ratio of the wax crystals, and __
wF is the average weight fraction of wax in the deposit.
SHEAR STRIPPING In previous studies during the TU – Paraffin deposition JIP, the deposit thickness under single-
phase flow conditions was significantly higher for laminar flow than for turbulent flow, and decreased with an increase in Reynolds number in turbulent flow. For these cases, the shear stress exerted by the fluid flow at the deposit interface may be sufficiently high to mechanically remove some of the deposit that has been formed by mass transfer. This process is called shear stripping. Other investigators have reported shear stripping of the deposit from the pipe wall. Burger et al. (1981) observed a reduction in deposition, possibly due to a sloughing mechanism. Hsu et al. (1994) concluded that the sloughing effect generated under turbulent flow conditions has a significant impact on the decrease of the wax deposition rate and cannot be neglected.
Few attempts have been found in the literature to properly model this shear stripping effect. Matzain (1999) modeled the change in the deposit thickness as:
⎥⎦
⎤⎢⎣
⎡Π+
Π=
drdT
dTdwD
dtd w
ow2
11
δ ........................................................................................................(7)
where Π1 is an empirical correlation for the rate of enhancement due to the occluded oil, and Π2 is an empirical correlation for the rate reduction due to shear stripping.
100/1
11
oilCC
−=Π ....................................................................................................................(8)
322 1 C
SRNC+=Π ..................................................................................................................(9) where C1, C2 and C3 are empirical constants, and NSR is a dimensionless variable depending on the flow pattern. For single-phase flow:
L
LLSR
vN
µδρ
= .........................................................................................................................(10)
where vL is the liquid velocity and µL is the liquid viscosity.
OIL-WATER STUDIES Very few studies have been conducted to investigate the effect of fresh water or brine on the
deposition process. This is primarily due to the higher complexity of the problem with the addition of the water phase and the difficulty to obtain consistent results with oil-water mixtures. Hsu and Santamaria (1994) conducted high pressure flow loop experiments with waxy crude oils to study the effect of water on paraffin deposition under turbulent flow conditions. The results showed that wax deposition was significantly reduced with the addition of water. Cole and Jessen (1960) conducted a series of laboratory experiments using a deposition cell consisting of a cold plate through which the oil-water solution could flow and where the paraffin deposition would occur. The study was, among others, on the effect of wettability characteristics of pipe wall upon paraffin deposition. The wettability of the deposition surface

6
was altered through the use of different substances. The results showed that, with the presence of water, paraffin deposition on the more water wet surface was significantly reduced, while no difference in deposition was found for the oil-wet surfaces. The tests were all in laminar conditions.
Multiphase Studies Multiphase paraffin deposition occurs when the pipe wall temperature falls below the wax
appearance temperature (WAT) or cloud point of the flowing oil and gas mixtures during the transportation process. The WAT can be defined as the temperature at which paraffin particles or crystals first begin to precipitate from a hydrocarbon liquid solution.
TWO-PHASE FLOW HYDRODYNAMICS Brill et al. (1998, 1999) gave a comprehensive description of multiphase flow in pipes and the
available methods for predicting multiphase flow parameters, e.g., flow patterns, pressure gradients and liquid holdups. Flow pattern prediction depends primarily on flow rates, pipe dimensions and inclination angle and fluid densities. Multiphase mixtures flowing in horizontal and near-horizontal flowlines can be grouped into four different flow patterns: stratified (smooth and wavy), intermittent (slug and elongated bubble), annular, and dispersed bubble. Flow patterns of multiphase mixtures flowing in a vertical/near-vertical pipe are also grouped into four categories: bubbly, dispersed bubble, intermittent (slug and churn) and annular.
TWO-PHASE GAS-OIL WAX DEPOSITION Rygg et al. (1998) assumed that the radial temperature gradient in a two-phase flow mixture
makes dissolved wax diffuse from the bulk oil towards the wall. In his approach, the wetted inner surface perimeter was dependent on the local flow pattern and the liquid holdup. The entire perimeter is assumed to be wetted for annular, dispersed bubble, bubbly and intermittent and churn flow patterns. The paraffin buildup rate expression becomes heavily dependent upon the concentration gradient, which is dependent upon the radial temperature gradient between the bulk two-phase flow mixture and the pipe wall.
Dawson (1995) presented the rate of paraffin deposition in a multiphase flow environment by applying a local mass transfer coefficient to describe the interfacial mass transfer of dissolved paraffin in a closed channel with known interfacial area as a result of a concentration difference. Interfacial mass transfer coefficients from the liquid to the wall were determined for each pipe segment depending on the local flowing conditions and fluid properties.
Matzain (1996), Apte (1999), Dawson (1995) and Forsdyke (1995) proposed that the same methods for predicting single-phase paraffin deposition can be applied to multiphase flow conditions by including the effects of fluid compositions, flow pattern and the extent of liquid phase contact with the pipe wall in the deposition mechanisms. They assumed that a modified pseudo-single-phase method can be used for all flow patterns, and the deposition rate can be modeled in a similar way to single-phase flow. In single-phase liquid flow, molecular diffusion is generally considered to be the dominant mechanism, while shear dispersion effects are considered negligible.
Matzain (1999) addressed the nature of wax deposition in each individual flow pattern. The flow pattern dependent deposit behavior has been observed for South Pelto oil in multiphase deposition experiments.

7
HEAT TRANSFER Wax deposition has been described as a non-isothermal phenomenon that appears to be driven by
the heat flux between the flowing fluids and the surroundings. Consequently, success in predicting wax deposition rates in single-phase and multiphase flow environments depends on how accurately heat transfer characteristics are evaluated. These characteristics include the forced convective film heat transfer coefficient, bulk and wall temperatures, and local heat flux across the pipe wall.
Kim et al. (1999) proposed that a generalized single heat transfer correlation could be applied to all turbulent gas-liquid two-phase flow patterns in vertical pipes. Approaches adopted by previous investigators fall into three categories: empirical - particularly for intermittent flow (Kudirka et al., 1965, Rezkallah and Sims, 1987, and Shah, 1981); modified single-phase flow methods - particularly for bubbly, dispersed bubble and intermittent flow (Fried, 1954, Knot et al., 1959, and Oliver and Wright, 1962); and, momentum transfer - heat transfer analogies - particularly for stratified and annular flows (Davis et al., 1975, Davis et al., 1976, Hughmark, 1963, and Pletcher and McManus, 1972). The local heat flux and temperatures are usually derived from a thermal balance.
Shoham et al. (1982), Barnea et al. (1983), and Hetsroni et al. (1999) studied heat transfer characteristics for two-phase intermittent flow and reported that the time variation of temperature, heat transfer coefficients, and heat flux are very different in different zones of a slug unit. Substantial differences in heat transfer coefficient were found between the bottom and top of the slug.
Kaminsky (1999) proposed a new heat transfer estimation method for non-boiling gas-liquid flow in pipes of high Prandtl number liquids, such as crude oil. The approach mathematically separates the heat transfer physics from the flow behavior. The method is used in conjunction with existing prediction methods for two-phase flow pressure drop and liquid holdup, and is divided in two categories: heat transfer in gas-liquid flow with turbulent liquid flow; and, heat transfer in gas-liquid flow with laminar liquid flow. The method is valid for all flow patterns except annular-mist flow.

8
9
Facilities Three facilities were used to conduct paraffin deposition experiments: a 150-ft long flow loop for
single phase oil deposition, a high-pressure multiphase flow facility and a 10-ft long small scale flow loop. In addition, a cold finger apparatus was used for deposition physics studies and preliminary oil-water studies. This section describes the facilities.
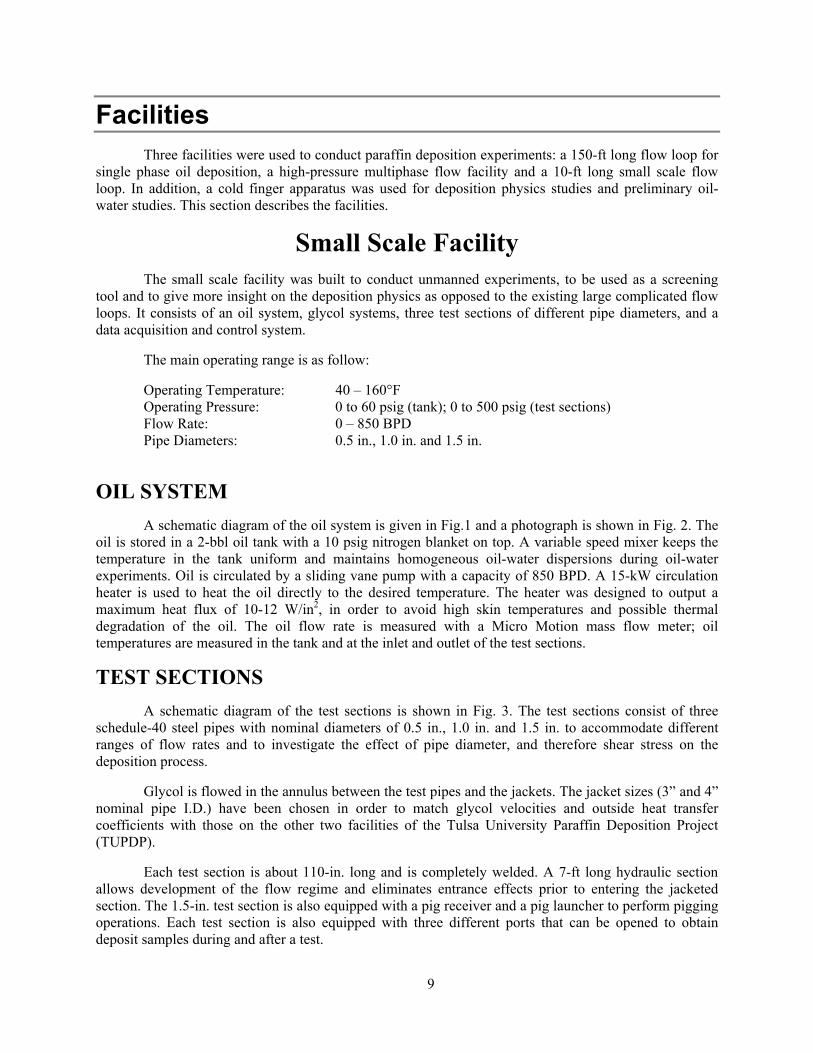
Small Scale Facility The small scale facility was built to conduct unmanned experiments, to be used as a screening
tool and to give more insight on the deposition physics as opposed to the existing large complicated flow loops. It consists of an oil system, glycol systems, three test sections of different pipe diameters, and a data acquisition and control system.
The main operating range is as follow:
Operating Temperature: 40 – 160°F Operating Pressure: 0 to 60 psig (tank); 0 to 500 psig (test sections) Flow Rate: 0 – 850 BPD Pipe Diameters: 0.5 in., 1.0 in. and 1.5 in.
OIL SYSTEM A schematic diagram of the oil system is given in Fig.1 and a photograph is shown in Fig. 2. The
oil is stored in a 2-bbl oil tank with a 10 psig nitrogen blanket on top. A variable speed mixer keeps the temperature in the tank uniform and maintains homogeneous oil-water dispersions during oil-water experiments. Oil is circulated by a sliding vane pump with a capacity of 850 BPD. A 15-kW circulation heater is used to heat the oil directly to the desired temperature. The heater was designed to output a maximum heat flux of 10-12 W/in2, in order to avoid high skin temperatures and possible thermal degradation of the oil. The oil flow rate is measured with a Micro Motion mass flow meter; oil temperatures are measured in the tank and at the inlet and outlet of the test sections.
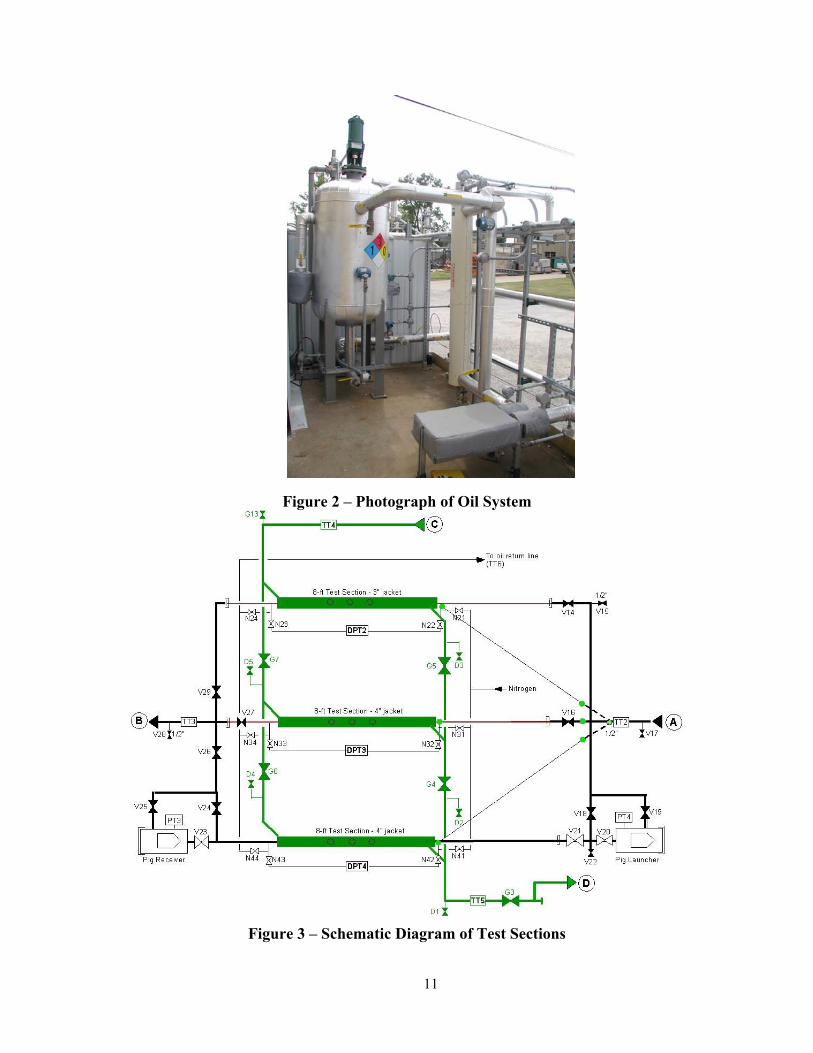
TEST SECTIONS A schematic diagram of the test sections is shown in Fig. 3. The test sections consist of three
schedule-40 steel pipes with nominal diameters of 0.5 in., 1.0 in. and 1.5 in. to accommodate different ranges of flow rates and to investigate the effect of pipe diameter, and therefore shear stress on the deposition process.
Glycol is flowed in the annulus between the test pipes and the jackets. The jacket sizes (3” and 4” nominal pipe I.D.) have been chosen in order to match glycol velocities and outside heat transfer coefficients with those on the other two facilities of the Tulsa University Paraffin Deposition Project (TUPDP).
Each test section is about 110-in. long and is completely welded. A 7-ft long hydraulic section allows development of the flow regime and eliminates entrance effects prior to entering the jacketed section. The 1.5-in. test section is also equipped with a pig receiver and a pig launcher to perform pigging operations. Each test section is also equipped with three different ports that can be opened to obtain deposit samples during and after a test.

10
Temperature transducers are used to monitor inlet and outlet oil temperatures, as well as glycol inlet and outlet temperatures. Pressure drop transducers are mounted on each test section to monitor the paraffin buildup.
Finally, a three-way valve manifold in the glycol system is used to allow co-current flow as well as counter-current flow.
GLYCOL SYSTEM A schematic diagram and a photograph of the glycol system are presented in Figs. 4 and 5,
respectively. Two separate glycol circulation loops are used. The cold glycol loop circulates a 50% water-glycol solution through a tube-shell heat exchanger and into a 10-ton chiller. The other glycol loop circulates the main glycol through the heat exchanger and into the test section. This loop consists of a pump, a tank and a Micro Motion flow meter. A three-way control valve facilitates the temperature control by diverting only part of the main glycol flow through the heat exchanger for cooling. The glycol flow rate is controlled by a bypass control valve using feedback coming from the Micro Motion flow meter. Temperature transducers are used to monitor the glycol temperatures in the tanks, as well as on the test sections.
CONTROL AND DATA ACQUISITION SYSTEM The data acquisition system (DAQ) is LabView TM based. The DAQ was programmed to facilitate
long-term operation with minimum supervision. All the pumps, chiller, heater, and automatic control valves can be operated from the DAQ computer interface. The DAQ interface allows monitoring and recording of test parameters. The operator may also set alarms for controlling parameters and safety concerns. The control system was programmed to control oil and glycol flow rates, and oil and glycol inlet temperatures automatically, as well as ensure a safe operation.
Figure 1 – Schematic Diagram of Oil System
11
Figure 2 – Photograph of Oil System
Figure 3 – Schematic Diagram of Test Sections

12
Figure 4 – Schematic Diagram of Glycol System
Figure 5 – Photograph of Glycol System

13
Single-Phase Flow Loop The single-phase flow loop was obtained from the Alberta Research Council (Canada) and Petro
Canada in 1995 and was modified for the studies at the TU – Paraffin Deposition Projects. The flow loop consists of a U-shaped test section. The test fluid is circulated in the inner pipe of the test section while a coolant mixture (50% by weight glycol and water) is flowing countercurrent in the annulus, simulating deep water conditions in the field. Pumping, heating and cooling systems ensure control of flow rates and temperatures. Two impedance heating sections ensure precise control of glycol and oil inlet temperatures in the test section. A heat-tracing system prevents paraffin deposition outside the test section.
Flow rates, densities, temperatures and pressure drops are recorded on an Intellution-based data acquisition system.
A schematic of the single-phase flow facility is given in Fig. 6. The operating ranges of the facility are:
Oil Temperature: 40 – 160°F, Glycol Temperature: 40 – 160°F, Oil Flow Rate: 0 – 2,000 BPD, Coolant Flow Rate: 0 – 2,000 BPD, Pipe Diameter : 1.715 in.
OIL SYSTEM The oil is circulated using a variable speed progressive cavity pump at a rate up to 2,000 BPD.
Prior to circulating into the test section, the test fluid is flowed to the first reference section in the test section, which can be used as a pipe viscometer. Oil returning from the test section passes through the second reference section, a heat exchanger to control the temperature and a Micro Motion mass flow meter before returning to the oil tanks.
The reference sections have an ID of 1.62 in and are 10-ft long. The pressure drops across the reference section are measured; therefore, they can be used as pipe viscometers to verify Newtonian behavior or determine the apparent viscosity of non-Newtonian fluids. The reference sections are located upstream and downstream from the test section.
The volumes of the tanks are approximately 5 bbl each, and are heat traced to prevent deposition in their bottoms and side walls. Both tanks are fully insulated. An air driven mixer is installed in tank #1 to ensure the fluid properties in the tank are homogenous. A small pump is used to re-circulate the fluid in tank #2, also for mixing purposes.
An impedance heater located after reference section #1 is used to fine tune the oil inlet temperature to the desired value by passing a high current to the pipe wall, and thus heating the test fluid flowing inside. The oil flow rate is controlled by adjusting the pump speed.
TEST SECTION The U-shaped test section is 164-ft long. A schematic of the test section is given in Fig. 7. The
inner pipe is made of carbon steel and has an internal diameter of 1.715 in. The annulus is made of PVC and has an inner diameter of 3.826 in. The PVC pipe is insulated on the outside to minimize heat transfer to the surroundings. Static mixers are installed at the oil inlet and outlets of the test section to ensure

14
proper mixing of the test fluid in the test section and temperature homogeneity over the pipe cross section for accurate temperature measurements.
The test section is divided into nine segments (approximately 16-ft long). Inlet and outlet temperatures for both oil and glycol, outside wall temperatures of the inside pipe, and oil pressure drops are recorded by the data acquisition system for each segment. The pressure drop can also be measured between the first and last pressure tap, which corresponds to the overall pressure drop in the test section. The pressure lines can be filled with a heavy oil and are also heat traced to avoid paraffin blockages hindering the pressure transmission to the transducers.
Two removable spool pieces are installed in the test section to allow visual inspection and measurements at the end of the tests.
GLYCOL SYSTEM For deposition to occur, the pipe wall has to be at a lower temperature than the bulk fluid and
below the wax appearance temperature of the fluid. In order to achieve this, a 50 % weight glycol-water mixture is circulated through the annulus of the test section with a flow rate of approximately 2,000 BPD.
In the primary glycol system, the glycol-water mixture is pumped from the glycol tank, through the trimming section, where an impedance heater is used to fine tune the glycol inlet temperature into the test section (analogous to the one used for the oil system). The cooling mixture is then flowed to the annulus of the test section and passes through a Micro Motion mass flow meter. The glycol flow rate is controlled with the glycol bypass valve. The glycol mixture receives the heat transferred from the test fluid in the test section; therefore, it must be cooled down continuously to maintain its temperature. Since the glycol mixture temperature is occasionally too warm to enter directly into the chiller, a secondary glycol (cold glycol) system must be used. The cold glycol is pumped from the tank into a 40-ton chiller, and then flows through the heat exchanger to cool down the primary glycol mixture. The glycol temperature is controlled by adjusting the flow of glycol to the heat exchanger with a 3-way control valve CV6 and by controlling the amount of heat to the impedance heater.
HOT GLYCOL SYSTEM The hot glycol system is required to heat up the test fluid during a test, since the oil cools down
while it flows through the test section. It is also used for the wax melting procedure prior to a test to re-dissolve the deposit from a previous test. The hot glycol-water mixture is pumped from its tank to the shell side of the heat exchanger, while the test fluid circulates through the tube. The hot glycol flow through the heat exchanger is controlled by a three-way valve to adjust the oil temperature. The glycol is then sent to a boiler where it is heated up, and then returns to the hot glycol tank.
HEAT TRACING SYSTEM The heat tracing system is used to prevent paraffin deposition outside the test section. This
system consists of 0.25 in diameter copper tubing wrapped around the test fluid pipes, and then covered with insulation. A hot glycol-water mixture is pumped through this tubing to keep the pipe wall at a warmer temperature than the test fluid inlet temperature. Both oil tanks and fluid lines in the oil circulating system and heat exchanger are heat traced, as well as the two reference sections.

15
DATA ACQUISITION SYSTEM The software used for the data acquisition system is Intellution FIX32, which allows recording
the data and facilitates the flow loop operation. All control valves, pumps, boilers, and impedance heaters can be operated from the computer interface. The interface allows monitoring important variables during a test. The user may set alarms for when control parameters are out of specification, or for safety reasons. Control logics were programmed to automatically control oil and glycol flow rates and inlet temperatures, as well as to insure a safe operation of the flow loop.
SPECIAL MODIFICATIONS In an attempt to collect samples during a test, a special assembly was designed and built on each
spool piece on the test section. These assemblies allow flush-mounted corrosion coupons to be retracted while under pressure and samples of wax to be taken while flowing. Even though the assemblies were working satisfactorily, it was found thereafter that disturbance of the heat transfer around the assemblies led to unrepresentative samples of wax.
ColdGlycolTank Chiller
HeatTracing
Tank
Boiler
HotGlycolTank
GlycolTank
CV5
OilTank
#1Oil
Tank#2
CV1
3-way valves manifold
OIL HEAT EXCHANGER
Oil Flow Meter
CV6
CV4
Glycol Flow Meter
GlycolImpedanceHeater
OilImpedanceHeater
TEST SECTION
CV2
HeatTracingBoiler
HEAT TRACING SYSTEM
OIL SYSTEM
HOT GLYCOL SYSTEM
COLD GLYCOL SYSTEMGLYCOL SYSTEM
Figure 6 – Schematic of the Single-Phase Flow Facility

16
Figure 7 – Schematic of the Test Section
Multiphase Flow Loop This loop has the capability of conducting paraffin deposition tests for both single-phase oil and
two-phase mixtures of natural gas and crude oil flowing in horizontal, near-horizontal, and vertical pipes. An overall schematic of the multiphase paraffin deposition flow loop is shown in Fig. 8.
The test facility mainly consists of oil, gas, and glycol systems, a test section and a data acquisition system. The operating conditions are:
Operating Temperature: 40 – 160 F Operating Pressure: 0 – 500 psig Oil Flow Rate: 0 – 4,500 BPD Gas Flow Rate: 0 – 2 MMscfd Glycol Flow Rate: 0 – 2,000 BPD Pipe Diameter: 2 in.
OIL SYSTEM The oil system consists of five main components: oil tank, oil pump, pipe viscometer, metering
section and heat exchanger. The oil tank has a volume capacity of 25 bbl. Oil is circulated with a Moyno progressing cavity pump, which has a capacity of 4,500 BPD and can provide 200 psi increase in pressure. The oil flow rate and density are measured in the metering section, which consists of two Micro Motion mass flow meters used for different flow ranges. The oil flow rate is controlled by the pump speed.
A 15-ft long pipe viscometer is 15-ft long is used as a reference section to measure apparent viscosity. After the oil is metered, it flows through a shell-tube heat exchanger to control its temperature, then through the mixing tee where it is mixed with natural gas for the two-phase flow experiments. Then oil or gas-oil mixture flows through a heat trimming section where an electric current is used to heat the

17
pipe wall and fine tune the temperature of the fluids. The oil tank and flow lines in this system are insulated and electrically heat traced by wrapping electric heating coils underneath the insulation to avoid paraffin deposition outside the test section.
GAS SYSTEM The facility is pressurized with city natural gas. The gas is circulated with a two-stage
reciprocating compressor through a cooler, into a discharge receiver then metered with Micro Motion mass flow meters. After being metered, the gas flows to the mixing tee where it mixes with the oil phase and circulates through the test section. The gas is then separated in a gas-liquid separator and returns to the compressor suction receiver.
GLYCOL SYSTEMS The glycol systems are similar to the single phase flow loop. The main glycol is circulated into
the annulus of the test section, while the cold glycol system and hot glycol systems are used to control the fluids temperature. The main glycol flow rate is metered with a Micro Motion mass flow meter and its temperature is controlled by a heat exchanger with the cold glycol system. The cold glycol temperature is usually kept constant at 40ºF and the cold glycol is circulated through a chiller and heat exchanger back to the cold glycol tank. Similarly the hot glycol circulates through the oil heat exchanger to control the oil temperature and back to the boiler and hot glycol tank.
TEST SECTION The test section consists of a 75-ft 2 in. diameter stainless steel pipe and mounted on a boom that
can be raised to 90° from the horizontal to investigate different inclination angles. A 10-ft hydrodynamic section allows for development of fully developed flow prior to entering a 25-ft thermal developing section jacketed with a 4 in. CPVC pipe in which glycol is circulated. The deposition measurement section consists of a 25-ft long section over which temperature profile and pressure drops are measured and followed by a 5-ft long spool piece that can be removed at the end of each test for sampling and visual inspection. A reference drum of the same dimensions as the measurement section is mounted parallel to the test section and is used for the on-line volumetric measurements of the deposit thickness.
DATA ACQUISITION SYSTEM The data acquisition system is an Intellution-based distributed system. All important variables are
recorded with this system, as well as important control features for the system. The flow loop can be operated almost entirely from the computer interface, and control logics are in place for oil and glycol flow rate and inlet temperatures, as well as for safety concerns.
SPECIAL MODIFICATIONS In order to gather flow pattern and heat transfer data for the Garden Banks condensate, the
multiphase flow facility has been equipped with a high-pressure capacitance sensor and additional temperature measurements. The capacitance sensor was used to measure average liquid holdup in the cross section while a capacitance probe was used to detect the liquid film on top of the pipe. The temperature measurements were mounted inside the pipe at different distances from the pipe wall in order to obtain reliable temperature measurements for each flow pattern.

18
Figure 8 – Multiphase Flow Facility Diagram
Cold Finger Apparatus In order to conduct preliminary oil-water deposition tests and have a quick screening tool for
deposition physics studies, a cold finger apparatus donated by Nalco Energy Services was used in these studies. The cold finger probe consists of a 0.687 in. diameter steel cylinder in which cold glycol circulates. The probe is immersed in a beaker of hot oil maintained at a constant temperature during the test. The temperatures of the oil and cold glycol are controlled with temperature baths. The apparatus allows us to conduct four experiments simultaneously under the same temperature conditions. In order to ensure the glycol flows are equal through all cells, flow meters have been installed on each cell. Figure 9 shows the cold finger device.
Figure 9 – The Cold Finger Apparatus

19
DEPOSIT THICKNESS ESTIMATION Two different techniques based on pressure drop and optical measurement were used in this study
to measure the deposit thickness for the different test conditions. Pressure drop data provide an indirect deposit thickness measurement continuously for the duration of the test. Optical measurement gives a direct measure of the deposit thickness at the end of the test.
Boroscope Measurement A boroscope was used to measure the wax thickness directly. The instrument is shown in Fig. 10.
After shutdown, the test section is drained, and the sampling holes are opened. The lens of the boroscope is attached to a steel tube with three scale marks of length, with an interval of 1.0 mm. This tube is inserted into the sampling hole, and held against the pipe wall. A certain length of the tube is penetrated into the deposit on the opposite pipe wall. The position of the lens can be monitored by the screen and can be adjusted by the controls of the boroscope.
Figure 10 - Photograph of Boroscope
WAX CONTENT MEASUREMENT After the wax samples are taken, they are analyzed for their wax content. Differential Scanning
Calorimetry (DSC) is used to determine the wax content of the samples. The DSC instrument is shown in Fig. 11.
DSC measures the heat released by wax crystallization. Since this heat increase is very small at the onset of wax crystallization, special care was taken to obtain a stable baseline and to use as large a sample as possible without distorting the DSC signal. Lower cooling rates were needed to minimize super-cooling. Shifts due to super-cooling were useful for wax verification. Preferred operating conditions were a 90 mg sealed sample pre-heated to 180ºF then cooled at a rate of less than 1ºF/min. The cooling rate would be increased if no identifiable wax crystallization peak was observed, and 3.6ºF/min was used for initial screening.

20
Figure 11 - DSC Instrument

21
Test Fluids
South Pelto Crude Oil This crude was obtained from Mobil Oil Corporation’s South Pelto Field, Well 10E in the Gulf of
Mexico. The oil was characterized by Marathon Oil Company in 1999.
The oil has an API gravity of 35° and a Wax Appearance Temperature of approximately 51°C (124°F) measured by Fourier Transform Infrared Spectroscopy at 34.5 MPa (5000 psig). The wax content is approximately 6.6 % by weight of C17 to C80 fractions of n-paraffin components. The weight percent of n-paraffin carbon number distribution and the extended Nenniger analysis on n-paraffin for South Pelto flow loop oil are provided in the JIP Techical Report (1999).
Transport and physical properties (except density and viscosity) for South Pelto crude oil at various temperatures and pressures were obtained by using the Multiphase Solutions Inc. (MSI) thermodynamic module, part of the paraffin deposition prediction program used at TUPDP. Composition data from JIP Technical Report (1999) are used to generate the properties tables. These properties are tabulated (Appendix B) for interpolation at desired pressure and temperature conditions. South Pelto oil density was measured with a Micro Motion meter for each test.
Oil viscosity was calculated from an experimental correlation as a function of the oil temperature provided by Creek (1998), given by:
2
)(1000533129.2
)(1000906456.11023469.14)(ln ⎟⎟
⎠
⎞⎜⎜⎝
⎛+−=
KTKTcPµ .........................................................(11)
where µ: fluid viscosity (cP)
T: fluid temperature (K)
Garden Banks Condensate Shell Oil Company provided Garden Banks condensate, coming from Block 426, Well A-14 in
the Gulf of Mexico. This fluid has an API gravity of 42° and has approximately 0.5 % weight of wax, significantly lower than South Pelto crude oil. The Wax Appearance Temperature measured with Digital Scanning Calorimeter (DSC) by TotalFinaElf was 34.44 °C (94 °F) at atmospheric conditions. The weight percent of n-paraffin carbon number distribution and the results from the extended Nenniger Analysis for n-paraffins for Garden Banks flow loop oil are presented in the JIP Technical Report (1999).
Graden Banks condensate oil compositions provided in the JIP Technical Report (1999) were used to generate transport and physical properties of Garden Banks condensate with the MSI thermodynamic module. The only properties not used from the properties tables were the fluid density, measured with a Micro Motion mass flow meter, and fluid viscosity, which was calculated from an experimental correlation provided by Broze (2001), given by:
⎟⎠⎞⎜
⎝⎛ −= 7.01010a
γµ ..............................................................................................................(12)
where: 7408.10))((9932.3 10 +−= RTLoga
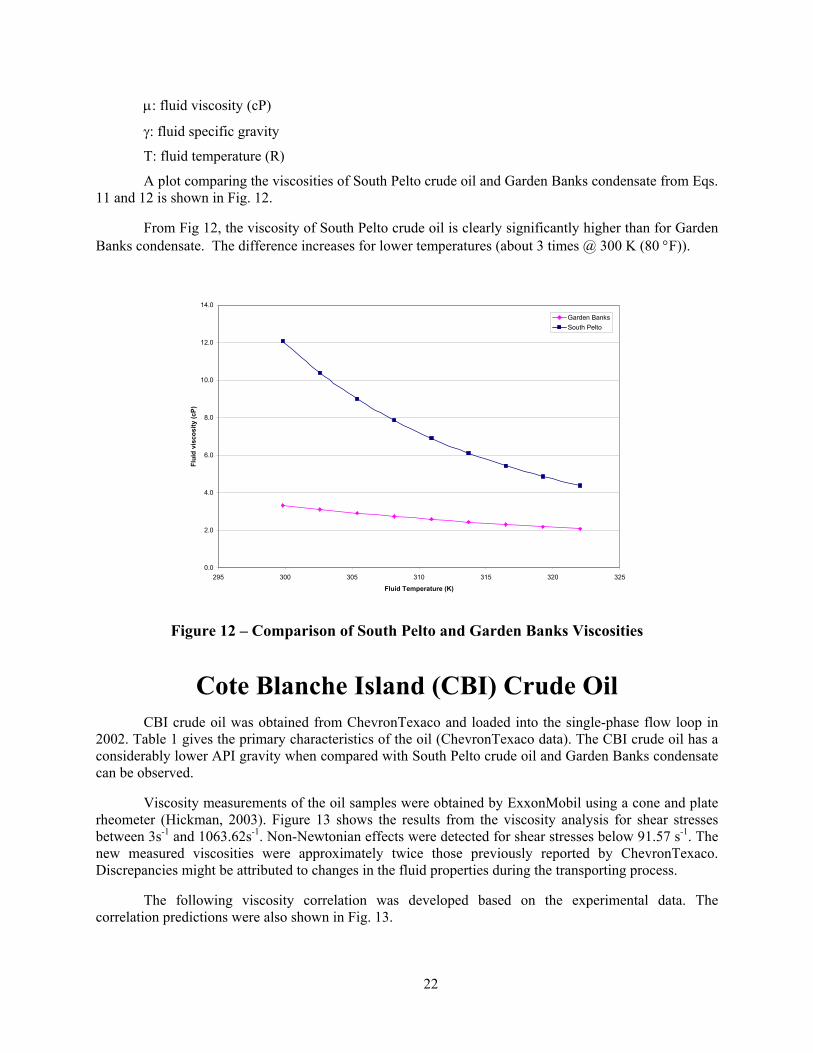
22
µ: fluid viscosity (cP)
γ: fluid specific gravity
T: fluid temperature (R)
A plot comparing the viscosities of South Pelto crude oil and Garden Banks condensate from Eqs. 11 and 12 is shown in Fig. 12.
From Fig 12, the viscosity of South Pelto crude oil is clearly significantly higher than for Garden Banks condensate. The difference increases for lower temperatures (about 3 times @ 300 K (80 °F)).
0.0
2.0
4.0
6.0
8.0
10.0
12.0
14.0
295 300 305 310 315 320 325
Fluid Temperature (K)
Flui
d vi
scos
ity (c
P)
Garden BanksSouth Pelto
Figure 12 – Comparison of South Pelto and Garden Banks Viscosities
Cote Blanche Island (CBI) Crude Oil CBI crude oil was obtained from ChevronTexaco and loaded into the single-phase flow loop in
2002. Table 1 gives the primary characteristics of the oil (ChevronTexaco data). The CBI crude oil has a considerably lower API gravity when compared with South Pelto crude oil and Garden Banks condensate can be observed.
Viscosity measurements of the oil samples were obtained by ExxonMobil using a cone and plate rheometer (Hickman, 2003). Figure 13 shows the results from the viscosity analysis for shear stresses between 3s-1 and 1063.62s-1. Non-Newtonian effects were detected for shear stresses below 91.57 s-1. The new measured viscosities were approximately twice those previously reported by ChevronTexaco. Discrepancies might be attributed to changes in the fluid properties during the transporting process.
The following viscosity correlation was developed based on the experimental data. The correlation predictions were also shown in Fig. 13.
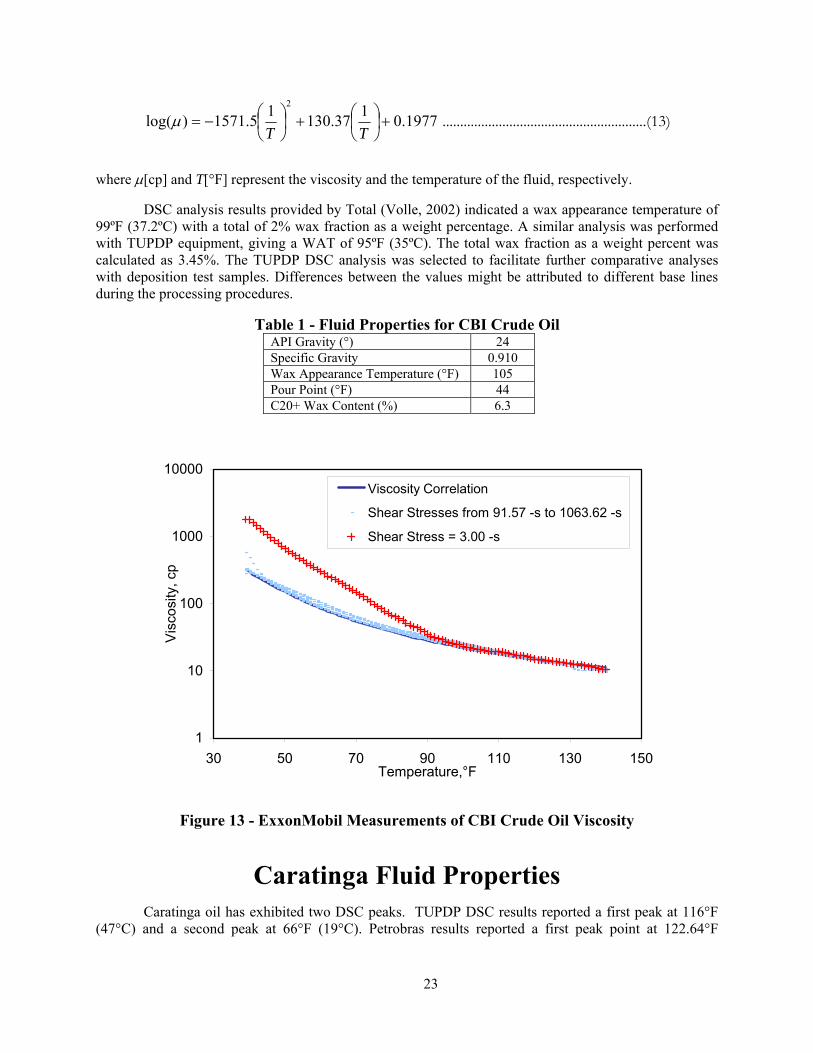
23
1977.0137.13015.1571)log(2
+⎟⎠⎞
⎜⎝⎛+⎟
⎠⎞
⎜⎝⎛−=
TTµ ..........................................................(13)
where µ[cp] and T[°F] represent the viscosity and the temperature of the fluid, respectively.
DSC analysis results provided by Total (Volle, 2002) indicated a wax appearance temperature of 99ºF (37.2ºC) with a total of 2% wax fraction as a weight percentage. A similar analysis was performed with TUPDP equipment, giving a WAT of 95ºF (35ºC). The total wax fraction as a weight percent was calculated as 3.45%. The TUPDP DSC analysis was selected to facilitate further comparative analyses with deposition test samples. Differences between the values might be attributed to different base lines during the processing procedures.
Table 1 - Fluid Properties for CBI Crude Oil API Gravity (°) 24 Specific Gravity 0.910 Wax Appearance Temperature (°F) 105 Pour Point (°F) 44 C20+ Wax Content (%) 6.3
1
10
100
1000
10000
30 50 70 90 110 130 150Temperature,°F
Vis
cosi
ty, c
p
Viscosity Correlation
Shear Stresses from 91.57 -s to 1063.62 -s
Shear Stress = 3.00 -s
Figure 13 - ExxonMobil Measurements of CBI Crude Oil Viscosity
Caratinga Fluid Properties Caratinga oil has exhibited two DSC peaks. TUPDP DSC results reported a first peak at 116°F
(47°C) and a second peak at 66°F (19°C). Petrobras results reported a first peak point at 122.64°F

24
(50.36°C) and a second peak at 66.5°F (19.17°C). Differences can be attributed to the different cooling rates. Petrobras tests used a 0.2°C/min cooling rate while TUPDP tests used 2°C/min.
The total wax fraction as a weight percentage from Fig. 14 is seen to be 3.85. Solubility curves for both Caratinga oil and CBI oil are presented in Fig. 14. Similarities in the cumulative wax percentages of both Caratinga oil and CBI oil are evident.
The variation of Caratinga oil viscosity with temperature was determined experimentally by Petrobras. The correlation given by Eq. 14 was developed to predict the viscosity as a function of temperature, where µ represents Caratinga oil viscosity (cP) and T is the temperature of the oil (°K).
( )( ) ( )Tlog8375.38342.97.0loglog −=+µ .................................................................(14)
Due to the viscosity range (from 13 cP to 700 cP for temperatures between 175°F and 40°F), the discharge pressure of the oil pump for Caratinga oil will be much higher than observed during CBI oil tests. Experimentally, flow rates up to 700 BPD can be achieved with oil temperatures around 70°F (laminar cases) due to pressure limitations in the system.
0.0
0.5
1.0
1.5
2.0
2.5
3.0
3.5
4.0
4.5
20 30 40 50 60 70 80 90 100 110 120 130 140 150
Temperature, F
% W
eigh
t sol
ids
CBI Crude Oil Caratinga Crude Oil
Figure 14 - Cumulative Wax Percentage for Caratinga and CBI Oils

25
Experimental Studies
Deposition Physics Studies SMALL SCALE STUDIES
Experimental Program The main objective of this study was to investigate long-term paraffin deposition and aging
phenomena. A new facility was designed and constructed to conduct the experimental part of this study. South Pelto crude oil was used as the testing fluid.
Experimental Results After the facility was commissioned, shakedown tests were performed to test both hardware and
the control and data acquisition system. Afterwards, several long term paraffin deposition tests were conducted in the 1.5-in., 1.0-in. and 0.5-in. test sections to investigate the long term deposition process and aging phenomena. Some preliminary oil-water tests were conducted in the 1.5-in. test section to investigate the impact of water on paraffin deposition.
Shakedown Tests
Shakedown Test No.1
The test conditions are given in Table 2. These test conditions were chosen to generate a thick and medium hard deposit which is comparable with Test #12 by Lund (1998) conducted in the single-phase flow facility.
The oil velocity in the Small Scale Loop was about 2/3 of that in Test #12, and the Reynolds number was about half that of Test #12.
While the oil flow rate and temperatures were fairly stable, the glycol temperature and flow rate controls were unstable and interacted with each other. As a result, the P&ID control parameters needed to be re-tuned.
The pressure drop behavior was directly affected by the unstable control of the loop. Therefore, the deposit thickness estimates from these data were incorrect. A significant amount of wax was found on the test section after 24 hours of testing. The boroscope measurements showed that the wax thickness was 0.8 mm.
Shakedown Test No. 2
After the P&ID parameters were re-tuned, a repeat of Test WAX2002-019 was conducted with the same test conditions. The fluctuations were dramatically lowered. Small fluctuations still remained in the glycol flow rate and glycol temperatures. However, they were not expected to affect the stability and reliability of the deposition tests.
The final thickness was estimated as 0.8 mm.

26
Table 2 - Test Conditions for Test WAX2002-019 Parameter Value
Oil Temperature 105ºF Oil Flow Rate 850 BPD Oil Velocity 3.9 ft/sec Oil Reynolds Number 6300 Glycol Temperature 75ºF Glycol Flow Rate 1600 BPD Facility 1.5-in. Test Section Flow Direction Co-current Flow Shear stress (Pa) 5.5 Startup Time 10 AM, 12/12/2002 Duration 24 hours
Deposition Tests with Same Reynolds Number
Long-term deposition tests were conducted in the 1.5, 1.0 and 0.5-in. test sections with the same Reynolds number of 6300. Slight facility modifications were required, and some tests were repeated.
Test WAX2003-010
This 27-day test was to investigate the long-term paraffin deposition process and aging phenomena. The test conditions from startup to the 20th day were identical to the conditions of the two previous shake-down tests, with the exception of glycol flow rate. From the 20th day to the 27th day, the ∆T was set to 45ºF.
From startup to the 4th day, the pressure drop increased rapidly and then began to plateau. This indicates a fast paraffin buildup during the first 4 days, and deposition slow down and stoppage afterwards. This can be explained by either the insulation effect from the deposit, or the depletion of the wax, or a combination of both.
On the 20th day, the ∆T was changed from 30ºF to 45ºF, and the pressure drop began to increase again, showing that the potential for more deposition still existed at lower temperatures.
Test WAX2003-017
This 7-day test was conducted in the 1.0-in. test section. The test conditions are given in Table 3. The controlled oil and glycol inlet temperatures were fairly stable, but the oil flow rate was not sufficiently stable, and resulted in non-continuous DP data. The buildup of the wax deposit can be divided into three phases. For the first three days, a rapid buildup was observed and deposit thickness reached about 0.8 mm. During the next day, the thickness dropped to 0.6 mm and then began to buildup again until it reached 0.8 mm. During the last two days, the thickness stabilized at 0.8 mm.

27
Table 3 - Test Conditions for Test WAX2003-017 Parameter Value
Oil Temperature 105ºF Oil Flow Rate 570 BPD Oil Velocity 6 ft/sec Oil Reynolds Number 6300 Glycol Temperature 75ºF Glycol Flow Rate 1600 BPD Facility 1.0-in. Diameter Test SectionFlow Direction Co-current Flow Shear Stress 14 Pa Startup Time 10AM, 03/24/2003 Duration 7 days
Test WAX2003-019
The test conditions are given in Table 4. The oil flow rate, glycol flow rate and glycol temperatures were fairly stable. Oil temperature control was achieved in manual mode, and resulted in oil temperature control of +2°F. The buildup of the wax deposit can be divided into two phases. For the first day, a continuous buildup was observed and the deposit thickness reached about 0.25 mm. Over the next five days, a stair-step growth was observed, and the thickness eventually stabilized at 0.35 mm.
Table 4 - Test Conditions for Test WAX2003-019 Parameter Value
Oil Temperature 105ºF Oil Flow Rate 333 BPD Oil Velocity 10.3 ft/sec Oil Reynolds Number 6300 Glycol Temperature 75ºF Glycol Flow Rate 1600 BPD Facility 0.5-in Diameter Test Section Flow Direction Co-current Flow Shear Stress 43 Pa Startup Time 1 0AM, 4/06/2003 Duration 6 days
Modification of Facility and Repeat Tests
The previous tests showed that the oil outlet temperature oscillated with ambient temperature. A possible reason is that the oil absorbs heat while it flows through the developing section and before it enters the test section. In an attempt to eliminate this oscillation, a temperature transducer, TT2 was moved to the front of the test section. TT2 was also changed to a thermocouple from an RTD. The probes were connected to the front of the test sections through the DP ports. TT2 now measures the oil temperature as the oil enters the jacketed section rather than before the developing section.
Deposition tests in the 1.5-in., 1.0-in., and 0.5-in. diameter test sections were repeated after the modifications to see if the data were repeatable.

28
Test WAX2003-046
Prior test results implied that deposit growth ceased after 4 days of testing. This warranted further investigation to understand whether this phenomenon was related to depletion of wax in the oil, insulation effect or shear prevention. Therefore, a special test was designed. The oil tank was first loaded with approximately 1 bbl of oil. The test was run until the thickness plateau was reached, and then another 1 bbl of fluid was loaded in the oil tank. If the deposit thickness increased again, the occurrence of wax depletion could be claimed.
Even though the procedures were not exactly the same, this 23-day test can be regarded as a repeat test of the previous 27-day test (WAX2003-010). The deposit thicknesses from these two tests are expected to be similar at the end of the tests.
The initial test conditions were the same as those of Test WAX2003-010. The oscillations in the oil outlet temperatures were eliminated. There was an increase in the glycol flow rate from about 1500 BPD to 1600 BPD due to an unexpected restart. However, calculation of the heat transfer showed that this small change in glycol flow rate is not large enough to influence the deposition process.
There was a gradual increase in DP, indicating additional wax deposition after the addition of the fresh oil. Therefore, it is believed that depletion of wax in the oil is an issue to be addressed in future studies. For subsequent tests, the durations were much shorter.
The thickness calculations showed that these tests produced very similar deposit thickness values after 20 days of testing. At shutdown, the boroscope measurement gave a deposit thickness of 1.5 mm which agreed well with the thickness calculated from pressure drop.
Test WAX2003-032
This was a repeat test in the 1.0-in. test section. The test conditions were the same as WAX2003-017. The oscillations in the oil outlet temperature were eliminated. All the controls are now fairly stable, resulting in better pressure drop response.
Since WAX2003-32 was a repeat of Test WAX2003-17, comparisons of the deposit thicknesses showed that the data did not match exactly, but the behaviors were very similar.
Test WAX2003-031
This was a repeat test in the 0.5-in. test section. The test conditions were the same as for Test WAX2003-019. All of the controls were fairly stable. This test (WAX2003-31) was a repeat of Test WAX2003-19. Comparable thicknesses were obtained for the repeat test.
Comparative Analysis of Same Reynolds Number Tests
Tests WAX2003-031, WAX2003-032 and WAX 2003-046 were selected for this analysis. The test conditions for these tests are summarized in Table 5. Results show that the deposit thickness decreases with decreasing pipe diameter. Since the deposition area varies with the size of the pipe, a dimensionless deposit thickness, δ/d is believed to be a better indication of deposition phenomenon. The dimensionless thickness for the 1.5-in. and 1.0-in. test sections were very close to each other and that of the 0.5-in. test section is somewhat lower. It is likely that the higher shear stress is the cause of the lower dimensionless deposit thickness.
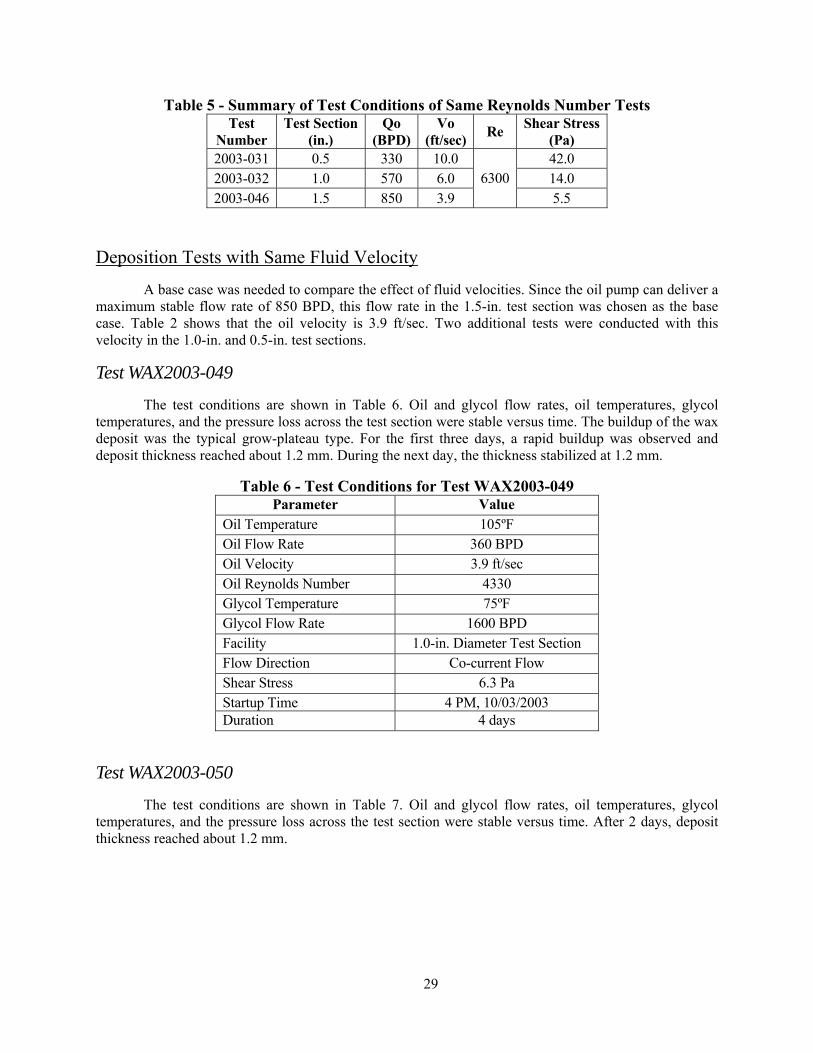
29
Table 5 - Summary of Test Conditions of Same Reynolds Number Tests Test
Number Test Section
(in.) Qo
(BPD)Vo
(ft/sec) Re Shear Stress (Pa)
2003-031 0.5 330 10.0 42.0 2003-032 1.0 570 6.0 14.0 2003-046 1.5 850 3.9
63005.5
Deposition Tests with Same Fluid Velocity
A base case was needed to compare the effect of fluid velocities. Since the oil pump can deliver a maximum stable flow rate of 850 BPD, this flow rate in the 1.5-in. test section was chosen as the base case. Table 2 shows that the oil velocity is 3.9 ft/sec. Two additional tests were conducted with this velocity in the 1.0-in. and 0.5-in. test sections.
Test WAX2003-049
The test conditions are shown in Table 6. Oil and glycol flow rates, oil temperatures, glycol temperatures, and the pressure loss across the test section were stable versus time. The buildup of the wax deposit was the typical grow-plateau type. For the first three days, a rapid buildup was observed and deposit thickness reached about 1.2 mm. During the next day, the thickness stabilized at 1.2 mm.
Table 6 - Test Conditions for Test WAX2003-049 Parameter Value
Oil Temperature 105ºF Oil Flow Rate 360 BPD Oil Velocity 3.9 ft/sec Oil Reynolds Number 4330 Glycol Temperature 75ºF Glycol Flow Rate 1600 BPD Facility 1.0-in. Diameter Test Section Flow Direction Co-current Flow Shear Stress 6.3 Pa Startup Time 4 PM, 10/03/2003 Duration 4 days
Test WAX2003-050
The test conditions are shown in Table 7. Oil and glycol flow rates, oil temperatures, glycol temperatures, and the pressure loss across the test section were stable versus time. After 2 days, deposit thickness reached about 1.2 mm.

30
Table 7 - Test Conditions for Test WAX2003-050 Parameter Value
Oil Temperature 105ºF Oil Flow Rate 127 BPD Oil Velocity 3.9 ft/sec Oil Reynolds Number 2575 Glycol Temperature 75ºF Glycol Flow Rate 1600 BPD Facility 0.5-in. Diameter Test Section Flow Direction Co-current Flow Shear Stress 7.5 Pa Startup Time 9:30 AM, 10/09/2003 Duration 2 days
Comparative Analysis of Same Fluid Velocity Tests
Tests WAX2003-050, WAX2003-049 and WAX2003-046 are used for this analysis. The test conditions for these tests are summarized in Table 8. The actual deposit thicknesses were very close for the three tests. It was observed that the dimensionless thickness increases with decreasing pipe diameters. Since the shear stress can be considered constant, this behavior can be attributed to the fact that Reynolds number increases significantly from 2575 to 6300 covering flow regimes of transition and turbulent flows.
Table 8 - Summary of Test Conditions for Same Oil Velocity Tests Test
Number Test Section
(in.) Qo
(BPD)Vo
(ft/sec)Re
Shear Stress (Pa)
2003-050 0.5 127 2575 7.5 2003-049 1.0 360 4330 6.3 2003-010 1.5 850
3.9 6300 5.5
Deposition Tests with Same Shear Stress
Two tests were conducted with this shear stress in the 1.0-in. and 0.5-in. test sections.
Test WAX2003-052
The test conditions are shown in Table 9.
Oil and glycol flow rates, oil temperatures, glycol temperatures, and the pressure loss across the test section were stable versus time. After 3 days, deposit thickness reached about 1.4 mm.

31
Table 9 - Test Conditions for Test WAX2003-052 Parameter Value
Oil Temperature 105ºF Oil Flow Rate 333 BPD Oil Velocity 3.6 ft/sec Oil Reynolds Number 4003 Glycol Temperature 75ºF Glycol Flow Rate 1600 BPD Facility 1.0-in. Diameter Test Section Flow Direction Co-current Flow Shear Stress 5.5 Pa Startup Time 8 AM, 10/23/2003 Duration 3 days
Test WAX2003-051
The test conditions are shown in Table 10. Oil and glycol flow rates, oil temperatures, glycol temperatures, and the pressure loss across the test section were fairly stable. After 3 days, deposit thickness reached about 1.7 mm.
Table 10 - Test Conditions for Test WAX2003-051 Parameter Value
Oil Temperature 105ºF Oil Flow Rate 110 BPD Oil Velocity 3.3 ft/sec Oil Reynolds Number 2200 Glycol Temperature 75ºF Glycol Flow Rate 1600 BPD Facility 0.5-in. Diameter Test Section Flow Direction Co-current Flow Shear Stress 5.5 Pa Startup Time 10 AM, 10/16/2003 Duration 4.5 days
Comparative Analysis of Same Shear Stress Tests
The test conditions for these tests are summarized in Table 11. The deposit thickness versus time showed that the thicknesses values are very close to each other for the three cases. This behavior can be mostly attributed to the variation in the Reynolds numbers (2200, 4000 and 6300 for 0.5, 1.0 and 1.5-in. pipes, respectively) since the oil velocities do not vary much.

32
Table 11 - Summary of Test Conditions for Same Shear Stress Tests Test
Number
Test Section
(in.)
Qo (BPD)
Vo (ft/sec) Re Shear Stress
(Pa)
2003-051 0.5 108 3.3 22002003-052 1.0 333 3.6 40002003-010 1.5 850 3.9 6300
5.5
Oil-Water Tests
Oil-water two-phase tests with water cuts of 25%, 40% and 75% were conducted in the 1.5-in. diameter test section with a mixture flow rate of 850 BPD, which is the maximum stable flow rate generated by the pump.
Test WAX2003-043
The test conditions are given in Table 12. The oil-water mixture was flowed through the 1.5-in. diameter test section at 105ºF at different flow rates to determine the apparent viscosity of the oil-water mixture for the deposit thickness calculations. The apparent viscosity for 25% water cut was found to be only 1.05 times the South Pelto crude oil viscosity.
Oil and glycol flow rates, oil temperatures, glycol temperatures, and the pressure loss across the test section were fairly stable. The growth of the deposit is quite similar to that of single-phase flow, and can be clearly divided into two phases. For the first 1.5 days, the deposit increased rapidly and reached 1.2 mm. For the next 1.5 days, the deposit thickness stabilized at 1.2 mm.
Table 12 - Tests Conditions for Test WAX2003-043 Parameter Value
Water Cut 25% Mixture Temperature 105ºF Mixture Flow Rate 850 BPD Mixture Velocity 3.9 ft/sec Mixture Reynolds Number about 6000 Glycol Temperature 75ºF Glycol Flow Rate 1600 BPD Facility 1.5-in. Diameter Test Section Flow Direction Co-current Flow Startup Time 2 PM, 7/31/2003 Duration 4 days
Test WAX2003-044
The test conditions are given in Table 13. Using the same method as for the 25% water cut case, the apparent viscosity with a water cut of 40% was again found to be 1.05 times the South Pelto crude oil viscosity. Oil and glycol flow rates, oil temperatures, glycol temperatures, and the pressure loss across the test section were fairly stable.

33
The pressure drop performance is very different from the previous 25% water cut test. Significant abrupt fluctuations were observed in DP measurements. No reasonable explanation exists for the fluctuations. The thickness can be divided into two trends, an upper level and a lower level. The sudden high growth rates calculated from pressure drop data are very unlikely; therefore, the behavior cannot be attributed to the deposition phenomena.
The measurement showed a thickness of 2.0 mm, which agreed with the results of the upper trend of the thickness values.
Table 13 - Test Conditions for Test WAX2003-044 Parameter Value
Water Cut 40% Mixture Temperature 105ºF Mixture Flow Rate 850 BPD Mixture Velocity 3.9 ft/sec Mixture Reynolds Number about 6000 Glycol Temperature 75ºF Glycol Flow Rate 1600 BPD Facility 1.5-in. Diameter Test Section Flow Direction Co-current Flow Startup Time 2 PM, 8/06/2003 Duration 3 days
Test WAX2003-045
The test conditions are shown in Table 14. The apparent viscosity of this mixture was found to be 13.3 times that of single-phase South Pelto crude oil using the procedure described in the 25% water cut test. This lowered the Reynolds number to 550, making the flow laminar. It is possible that for these conditions the oil-water mixture will act as a non Newtonian fluid.
Oil and glycol flow rates, oil temperatures, glycol temperatures, and the pressure loss across the test section were fairly stable. The growth of the deposit was continuous and similar to that for single-phase oil.
Table 14 - Test Conditions for Test WAX2003-045 Parameter Value
Water Cut 75% Mixture Temperature 105ºF Mixture Flow Rate 850 BPD Mixture Velocity 3.9 ft/sec Mixture Reynolds Number about 550 Glycol Temperature 75ºF Glycol Flow Rate 1600 BPD Facility 1.5-in. Test SectionFlow Direction Co-current Flow Startup Time 3 PM,8/15/2003 Duration 3 days

34
Conclusions A new facility was constructed to investigate long term paraffin deposition behavior.
Experimental data were gathered with South Pelto oil. Ten single-phase, long term deposition tests were completed in the three test sections with diameters of 0.5 in., 1.0 in. and 1.5 in. with testing durations ranging from 3 to 27 days. Tests were also conducted to investigate the effects of Reynolds number, velocity and shear stress. Three oil-water two phase tests with different water cuts of 25%, 40% and 75% were conducted in the 1.5-in. test section.
1. Aging A 27-day test was conducted to investigate aging phenomena. DSC analyses of the wax samples showed that the wax content of the deposits increased from 42% on the 1st day to 67% on the 12th day and stayed the same until shutdown. From the DSC analyses of the oil samples, the WAT began to drop after 4 days of testing, indicating depletion of the wax content in the oil. A special test designed to further investigate the plateau behavior confirmed depletion. Therefore, a larger oil charge is recommended for future long term testing.
2. Effects of Reynolds Number, Oil Velocity and Shear Stress on Deposition
Tests. The dimensionless deposit thickness versus time does not change very much for tests in the three test sections with the same Reynolds number, but changes significantly for tests with the same velocity and shear stress.
For tests with the same oil velocity, shear stresses can be considered as constant, but the Reynolds number ranges from 2575 to 6300. For tests with same shear stress, oil velocities can be considered constant, but the Reynolds number varies from 2200 to 6300. Based on current test results, Reynolds number has the greatest impact on deposition thickness.
3. Impact of water on paraffin deposition Three oil-water two-phase tests were conducted in the 1.5-in. test section with different water cuts of 25%, 40% and 75%. The deposition rates were higher than those observed for single-phase cases. Moreover, for the test with 40% water cut, a peculiar pressure drop behavior was observed. Since the two-phase paraffin deposition behavior is directly related to the properties of the mixture, a detailed rheological analysis is recommended for future studies.
COLD FINGER STUDIES
Experimental Program South Pelto crude oil and Cote Blanche Island crude oil (CBI) were used. These fluids have been
extensively studied during single-phase flow loop tests in the past to assess their deposition tendencies. The effects of temperature gradient, deposition time, water cut, water salinity and emulsion characteristics were investigated in this study. Only three tests were conducted with South Pelto oil under two-phase oil-water conditions in the small scale loop. Several oil-water deposition tests were conducted with South Pelto and CBI oils using the cold finger device at different conditions.

35
Experimental Procedure
The bath temperatures are set according to the test condition. The hot bath is set to 15°F below the cloud point of the oil, while the cold bath is set to the desired ∆T for the test. The oil is heated overnight to approximately 194°F (90°C) to melt any wax crystal possibly present. For single-phase tests, when the baths reach the desired temperatures, the oil that had been heated overnight is poured into beakers which are already in the cold finger bath. The cold finger probes are then placed in the beakers and the rotational stirrer is set to the desired speed. After a test is finished, the probes are removed from the bath and allowed to dry for approximately thirty minutes. Three wax samples are then taken directly from each probe, weighed and later analyzed by the DSC. The deposited wax is then collected on paper towels and weighed.
With this procedure, the trapped oil in the deposit can be absorbed by the paper towels and bias the DSC results. Therefore, another procedure proposed by Spratt (2003) has been used from test 2003-CF-17 onwards. This procedure consists of setting the temperature of the glycol to about 30°F above the cloud point of the oil and have it circulated through the cold finger probes for a few hours. The wax is melted, collected in small cups, weighed and sampled for DSC analyses. Any remaining wax on the probes is then removed with a paper towel and weighed as before. For two-phase tests, the same procedure is used, with the exception that the emulsions are prepared in separate beakers before transferring them to the test beakers. The oil and water phases are added to a pre-heated beaker and the emulsions are prepared. Fresh water and brine were used to prepare the test solutions. The salt water was prepared by dissolving 35 grams of sodium chloride (NaCl) per liter of fresh water, yielding a salinity close to the sea water. Two different mixing speeds, 600 rpm and 2000 rpm, for a period of 2 minutes are used to prepare the emulsions. For low mixing speeds and high water cuts, the amount of free water after the emulsions are made can be considerably high, leading to a loss of part of this water when the fluid is transferred. Besides, the shear provided by the cold finger rotational device is probably not enough to keep the emulsion stable, resulting in a separation of the water from the oil, which can be noticed by a thin film of water at the bottom of the beaker around the rotating cell during the cold finger tests.
Experimental Results
South Pelto Tests
A total of 56 tests were conducted with South Pelto, including: commissioning and calibration tests, to verify the operation of the device and repeatability of the results; single-phase tests with a focus on the effect of ∆T; and oil-water tests using fresh water and brine to investigate the effect of water.
For all the tests, the oil temperature was set to 105°F (40.6°C), corresponding to 15°F (8.3°C) below the Wax Appearance Temperature of the oil, which is 120°F (49°C). The rotational speed used to homogenize the oil temperature inside the beakers during a test was set between 450 and 500 rpm.
Test Period: 24 Hours
For the single-phase tests, the deposits were all very soft, similar to a gelled oil, for the three temperature differences tested. The overall mass of deposits increases with increases in the temperature difference between the oil and the cold finger probes, while the average wax fraction decreases with increase in the ∆T. This results in softer deposits as the temperature difference increases, which could be also verified by the melting procedure used to collect the deposits.
Figure 15 shows the plots of deposit mass in terms of the temperature difference between the oil and the cold finger probes for the single-phase tests. A clear trend can be verified for the three tests,

36
where the weight of the deposits increases as the temperature difference increases for each cell. The sloughing of the deposits, which occurred in test 2003-CF-015 (∆T = 30°F), can be visualized on this plot by the sudden drop in weight between cells B and C, compared to the other two tests.
Wax samples collected from the probes were analyzed using the Differential Scanning Calorimeter. Figure 16 shows the average deposit weight profile and the average wax content between the cells as function of the temperature difference for the same single-phase tests. The results indicate an increase in the average weight of the deposits as the temperature difference increases, while the wax content decreases with increase in ∆T. Results from Hernandez (2002) and Lund (1998) showed similar trends for flow loop tests. The higher oil contents associated with the higher weight of the deposits is an explanation for the sloughing of the deposits at higher ∆T.
For the two-phase tests, the deposits were also soft, similar to the deposits at single-phase conditions, for the three temperature differences tested. This first set of 24-hour tests consisted of six tests with four different water cuts: 20%, 40%, 60% and 80% brine.
During each test, two different water cuts were tested simultaneously: either 20% and 40% water cuts or 60% and 80% water cuts. Two additional tests with fresh water were conducted with ∆T of 30°F and the same water cuts to compare with the tests conducted using brine.
Table 15 summarizes the results for the 24 hour deposition tests. The higher wax contents for test 2003-CF-025 is believed to be due to the procedure adopted to collect the deposits, where the paper towel was used instead of melting, resulting in absorption of the oil and consequently, a lower oil content for the deposits collected.
Figure 17 depicts the change in average weight of deposits for each water cut as function of ∆T. It can be seen that the average amount of deposits increases with increase in ∆T and decreases almost exponentially as the water cut increases for the same ∆T. For a ∆T of 15°F, the average weight of deposits at 20% water cut is more than twice that at 80% water cut. For a ∆T of 30°F, the average weight of deposits at 20% water cut is more than three times higher than at 80% water cut. For 45°F, this difference goes up to 6 times higher. Nearly no difference in the mass of the deposits can be seen for water cuts higher than 40%.
Figure 18 depicts the wax fraction of the deposits as function of water cut for the three different ∆Ts tested using brine. For single-phase conditions, the wax fraction decreases as the temperature difference between the cold finger probes and the bulk increases. As the water phase is added, the wax content in the deposits starts to increase and it seems to plateau around 60% or 50% water cut for the conditions tested. Insulation effects can not be attributed as being the cause for such behavior. Since the amount of deposits decrease with increasing water cuts, the insulation effect should also decrease, resulting in continuous increase in the wax content of the deposits. Depletion of the wax in the oil is speculated to be the reason for this behavior.
Tests with fresh water have also been conducted for periods of 24 hours. Figure 19 summarizes the results obtained with fresh water and brine for two-phase oil-water tests conducted at ∆T of 30°F. It can be verified that the presence of salt did not affect the mass of deposits for the experiments and nearly no difference can be seen when compared to fresh water, at the conditions tested.
The 24-hour two-phase tests presented differences in the WAT of the oil before and after the tests up to 17°F, with wax fractions in the oil ranging from 4.5% to 1.0% by weight, indicating depletion of the wax in the oil, which explains the plateauing of the wax content around 60% water cut. Short term deposition tests were conducted with different time periods of 1, 3 and 6 hours to determine an optimum

37
duration for the tests without significant depletion of the wax. DSC analyses showed that no significant depletion was taking place neither for single-phase nor two-phase tests for the three testing periods.
Figures 20 and 21 show the DSC analyses for the effect of deposition on the WAT and wax content of the oil, respectively, for the three periods of time tested. The results shown are for single-phase tests with two different ∆Ts: tests 2003-CF-026 (∆T = 30°F) and 2003-CF-027 (∆T = 45°F). The differences in WATs are all within the measurement uncertainty of the DSC software and, for 6 hours of test, the difference is only 2.5°F at a ∆T of 45°F. For a ∆T of 30°F, the WATs are identical before and after the test. The same applies for the wax content of the oil before and after the tests. Table 16 shows the results obtained for wax deposition at different test durations.
Figure 22 summarizes the results. It can be seen that the mass of deposit increases linearly with the test duration. These results indicate that at 24 hours, the rate of deposition does not decrease, i.e. no depletion effect can be seen at 24 hours for single-phase South Pelto tests in the cold finger. Another interesting result is that the wax content measurements in the deposits were nearly the same for all the tests, lower at higher ∆T. This result suggests that the wax deposit keeps growing, but that little or no aging is taking place in these tests. This result is different than what was observed in the flow loop tests, where typically the deposit growth plateaus while the wax content simultaneously increases. Based on the results obtained and the conclusion that 24-hour oil-water tests led to depletion problems, a new set of oil-water tests with a time period of 6 hours was prepared.
Table 15 – Results for 24 Hour Tests with Oil and Brine Test # Water Cut % ∆T (°F) Weight (g) Wax content (% wt.)
2003-CF-014 0 15 1.3 21 2003-CF-015 0 30 3.2 9 2003-CF-016 0 45 5.4 8 2003-CF-017 20 15 0.8 14 2003-CF-019 20 30 1.8 14 2003-CF-022 20 45 2.3 9 2003-CF-017 40 15 0.6 7 2003-CF-019 40 30 1.2 22 2003-CF-022 40 45 1.3 17 2003-CF-018 60 15 0.4 25 2003-CF-025 60 30 0.9 60 2003-CF-020 60 30 0.7 22 2003-CF-021 60 45 1.4 40 2003-CF-018 80 15 0.3 19 2003-CF-020 80 30 0.6 24 2003-CF-025 80 30 0.5 70 2003-CF-021 80 45 0.9 33

38
Table 16 – Effect of Test Duration Test # Time (hrs) ∆T (°F) Weight (g) Wax content (% wt.) 2003-CF-026 1 30 0.8 8 2003-CF-026 3 30 0.7 11 2003-CF-026 6 30 1.2 9 2003-CF-015 24 30 3.2 9 2003-CF-027 1 45 1.1 4 2003-CF-027 3 45 1.6 3 2003-CF-027 6 45 2.2 6 2003-CF-016 24 45 5.4 8
0
1
2
3
4
5
6
0 1 2 3 4 5
Dep
osit
Mas
s (g
)
DT = 15
DT = 30
DT = 45
Cell A Cell B Cell C Cell D
Figure 15 – Weight Profile as Function of ∆T for Each Cell

39
Figure 16 – Wax and Weight Profiles as Function of ∆T
Figure 17 – Average Weight Profile of Deposits as Function of Water Cut

40
Figure 18 – Wax Profile as Function of Water Cut for Different ∆T
Figure 19 – Weight Profile as Function of Water Cut for Brine and Fresh Water

41
109
110
111
112
113
114
115
116
117
118
0 1 2 3 4 5 6 7Time (hr)
WA
T (F
)Before - 2003-CF-026 Before - 2003-CF-027
After - 2003-CF-026 After - 2003-CF-027
Figure 20 – Effect of Wax Deposition of the WAT of the Oil
0
1
2
3
4
5
6
0 1 2 3 4 5 6 7Time (hr)
Wax
(% w
eigh
t)
Before - 2003-CF-026 After - 2003-CF-026
Before - 2003-CF-027 After - 2003-CF-027
2003-CF-026
2003-CF-027
2003-CF-0262003-CF-026
2003-CF-0272003-CF-027
Figure 21 – Effect of Wax Deposition on the Wax Content of the Oil

42
0
1
2
3
4
5
6
0 5 10 15 20 25Time (hrs)
Dep
osit
Mas
s (g
)
0
2
4
6
8
10
12
Wax
Con
tent
(% w
eigh
t)
∆T=30ºF (W eight) ∆T=45ºF (W eight)
∆T=30ºF (W ax%) ∆T=45ºF (W ax%)
Figure 22 – Weight Profile at Different Test Durations for Single-Phase Oil
Test Period: 6 hours
Tests were conducted to investigate the effects of parameters such as water salinity and mixing speed with a new time period of 6 hours. Table 17 presents the test matrix for the 6 hour tests where the emulsions were prepared with a mixing speed of 600 rpm. Table 18 presents the tests where the emulsions were created at 2000 rpm. Both fresh water and brine were tested. The same water cuts and ∆Ts as for the 24 hour tests were used.
The deposits were very similar to the ones obtained for 24 hour tests. Visually, no distinction could be made between the 24-hour and 6-hour testing period results, regarding the color, softness and thickness.
Effect of Test Durat ion on Two-Phase Oil-Water Deposit ion
The effect of test duration has been previously analyzed for single-phase tests and the results are shown in Figure 23. For those conditions, the amount of deposits linearly increases with time. The effect of test duration for oil-water conditions is analyzed by comparing the tests run for 24 hours with the tests run for 6 hours at same conditions. Tables 19 and 20 present the results obtained for two-phase oil-water tests run with ∆T of 30°F and different water cuts for 24 and 6 hours, respectively.
It can be noticed that nearly all deposition takes place within the first 6 hours of test (about 70% of the deposit, in average), with either fresh water or brine, for the conditions tested. According to DSC analyses presented in Tables 19 and 20, nearly no aging of the deposits is taking place after 6 hours of test. The wax content of the deposits is practically the same when comparing same water cuts at both test periods.

43
Table 17 – Test Matrix for 600 rpm
Test # Water Cut % Type of water γ (1/s) ∆T 2003-CF-070 20 Salt 90 15 40 Salt 90 15 2003-CF-071 60 Salt 90 15 80 Salt 90 15 2003-CF-066 20 Salt 90 30 40 Salt 90 30 2003-CF-067 60 Salt 90 30 80 Salt 90 30 2003-CF-072 20 Fresh 90 15 40 Fresh 90 15 2003-CF-073 60 Fresh 90 15 80 Fresh 90 15 2003-CF-068 20 Fresh 90 30 40 Fresh 90 30 2003-CF-069 60 Fresh 90 30 80 Fresh 90 30
Table 18 – Test Matrix for 2000 rpm Test # Water Cut % Type of water γ (1/s) ∆T 2003-CF-033 20 Salt 296 15 40 Salt 296 15 2003-CF-034 60 Salt 296 15 80 Salt 296 15 2003-CF-035 20 Salt 296 30 40 Salt 296 30 2003-CF-036 60 Salt 296 30 80 Salt 296 30 2003-CF-037 20 Salt 296 45 40 Salt 296 45 2003-CF-038 60 Salt 296 45 80 Salt 296 45 2003-CF-051 20 Fresh 296 15 40 Fresh 296 15 2003-CF-052 60 Fresh 296 15 80 Fresh 296 15 2003-CF-053 20 Fresh 296 30 40 Fresh 296 30 2003-CF-054 60 Fresh 296 30 80 Fresh 296 30 2003-CF-055 20 Fresh 296 45 40 Fresh 296 45 2003-CF-056 60 Fresh 296 45 80 Fresh 296 45

44
Table 19 – Results for 24 hr Tests Test # Type of water Water Cut % Weight (g) Wax Content (% wt.) 2003-CF-019 Salt 20 1.7 14 2003-CF-019 Salt 40 1.2 22 2003-CF-020 Salt 60 0.7 22 2003-CF-020 Salt 80 0.6 24 2003-CF-029 Fresh 20 1.5 18 2003-CF-029 Fresh 40 1.2 23 2003-CF-028 Fresh 60 0.8 27 2003-CF-028 Fresh 80 0.4 28
Table 20 - Results for 6 hr Tests Test # Type of water Water Cut % Weight (g) Wax Content (% wt.) 2003-CF-066 Salt 20 1.3 14 2003-CF-066 Salt 40 1.0 29 2003-CF-067-Re Salt 60 0.8 27 2003-CF-067-Re Salt 80 0.7 20 2003-CF-068 Fresh 20 1.2 13 2003-CF-068 Fresh 40 0.8 26 2003-CF-069-Re Fresh 60 0.6 29 2003-CF-069-Re Fresh 80 0.5 25
Figure 23 – Effect of Test Duration

45
Effect of Sal inity
Salinity, along with temperature and pressure, dictates the physical characteristics of water. The specific heat capacity of water increases with temperature and, unlike density, decreases with salinity. If considering only the salinity dependency effect, the decrease in the overall heat capacity with brine should lead to a lower temperature of the solution at the cold finger probe compared to fresh water, resulting in higher ∆Ts between the probe and the bulk, thus, enhancing the driving forces for wax deposition.
South Pelto oil was tested with fresh water and brine to assess deposition tendencies when changing the water salinity.
The deposits were all very similar when comparing the characteristics at same water cuts and salinity. Figure 24 summarizes the results for both fresh water and brine. The emulsions were prepared with a mixing speed of 2000 rpm. Nearly no difference was found in deposit mass between brine and fresh water at the conditions tested. As noticed in 24-hour tests where the emulsions were prepared with a lower mixing speed of 600 rpm. The 6-hour tests were then repeated with the same conditions as before, but using a lower mixing speed of 600 rpm to prepare the emulsions. The results are summarized in Figure 25 and it also shows no difference between the deposit mass between fresh water and brine. The analyses of results for all conditions tested shows that the effect of salinity on paraffin deposition can be neglected. The difference in deposition between water salinities gets more accentuated with higher water cuts at higher ∆Ts, as can be observed for the two tests with 60% and 80% water cuts at a ∆T of 45°F, where deposition is higher with fresh water than with brine. Based on these results, in determining the amount of paraffin deposited, temperature has a much higher influence on the overall specific heat capacity of the solution than its salinity.
0
1
2
3
4
5
6
0 20 40 60 80 100Water Cut (% vol.)
Dep
osit
Mas
s (g
)
Brine ∆T 15 °F Brine ∆T 30 °F
Brine ∆T 45 °F Fresh ∆T 15 °F
Fresh ∆T 30 °F Fresh ∆T 45 °F
Figure 24 – Effect of Salinity on Wax Deposition (Mixing Speed of 2000 rpm)

46
0
1
2
3
4
5
6
0 20 40 60 80 100
Water Cut (% vol.)
Dep
osit
Mas
s (g
)
Brine ∆T 15 °F Brine ∆T 30 °F
Fresh ∆T 15 °F Fresh ∆T 30 °F
Figure 25 – Effect of Salinity on Wax Deposition (Mixing Speed of 600 rpm)
Effect of Emulsion Preparation
Two types of typical emulsions can be encountered in oil-water flow: O/W (oil in water) and W/O (water in oil). Depending on the shear, emulsions can have droplets with very different sizes. The emulsions for the tests were prepared with brine and fresh water with two different mixing speeds: 600 and 2000 rpm.
Figure 26 summarizes the results for these tests. The differences in the deposit mass observed for 600 and 2000 rpm are within the uncertainty of the measurements. This means either the emulsions prepared at 600 and 2000 rpm have comparable properties or the differences in the emulsions characteristics do not affect the deposition process for the range of parameters tested. No significant effect on the wax content could be seen from these tests.
Similar tests were conducted with ∆Ts of 15°F and 45°F. Figures 27 and 28 summarize the results for ∆T = 15°F and ∆T = 45°F. As in the 30°F ∆T case, the amount of deposit is the same regardless of the mixing speeds.
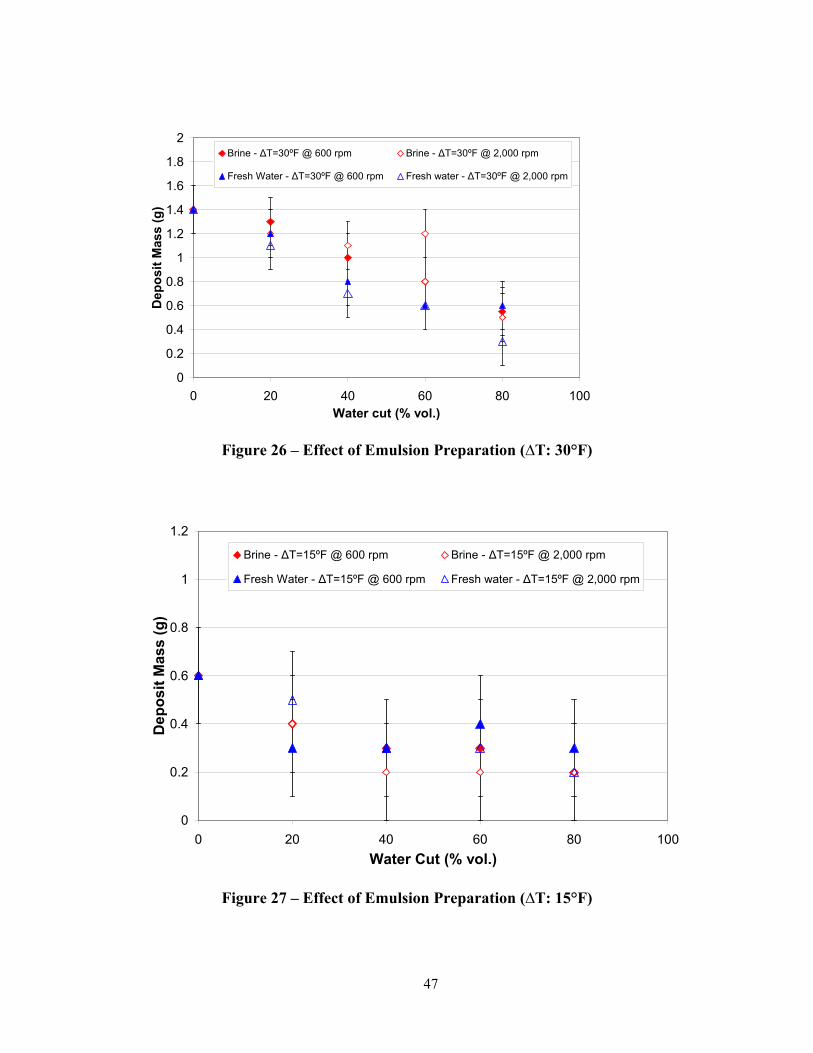
47
0
0.2
0.4
0.6
0.8
1
1.2
1.4
1.6
1.8
2
0 20 40 60 80 100Water cut (% vol.)
Dep
osit
Mas
s (g
)Brine - ∆T=30ºF @ 600 rpm Brine - ∆T=30ºF @ 2,000 rpm
Fresh Water - ∆T=30ºF @ 600 rpm Fresh water - ∆T=30ºF @ 2,000 rpm
Figure 26 – Effect of Emulsion Preparation (∆T: 30°F)
0
0.2
0.4
0.6
0.8
1
1.2
0 20 40 60 80 100Water Cut (% vol.)
Dep
osit
Mas
s (g
)
Brine - ∆T=15ºF @ 600 rpm Brine - ∆T=15ºF @ 2,000 rpm
Fresh Water - ∆T=15ºF @ 600 rpm Fresh water - ∆T=15ºF @ 2,000 rpm
Figure 27 – Effect of Emulsion Preparation (∆T: 15°F)

48
0
0.5
1
1.5
2
2.5
3
0 20 40 60 80 100Water Cut (% vol.)
Dep
osit
Mas
s (g
)
Brine - ∆T = 45°F @ 2000 rpm Fresh water - ∆T = 45°F @ 2000 rpm
Brine - ∆T = 45°F @ 600 rpm Fresh water - ∆T = 45°F @ 600 rpm
Figure 28 – Effect of Emulsion Preparation (∆T: 45°F)
Cote Blanche Island (CBI) Tests
Six single-phase tests were conducted with CBI to study the effects of temperature difference and deposition time. Two-phase oil-water tests were not conducted with CBI oil, since no definitive explanation could be given to the different deposition behaviors between the cold finger device and the flow loop for the tests with South Pelto and water.
The effect of ∆T could be investigated from both deposition periods tested. For all tests, three different ∆Ts between the bulk and the probes were used: 15°F, 30°F and 45°F, the same ones used for the tests with South Pelto. Figure 29 summarizes the results. It is noticed that the deposit mass is slightly higher for 30°F than for 15°F and 45°F ∆T tests for both deposition periods tested. This behavior is different than the observed at tests with South Pelto, where the mass of deposits increased with increasing temperature differences. This is, however, in agreement to what was observed by Alaña (2003). Cold finger tests with CBI presented a depositional behavior similar to what was observed at the flow loop.
The deposition time effect was studied by conducting tests with same ∆Ts for two different deposition times: 24 and 48 hours. Figure 30 summarizes these results. As expected, the amount of deposit increases with deposition time. DSC results show an increase in the wax content of the deposits with increasing deposition time. No significant depletion of the wax in the oil could be seen for any deposition period tested.

49
0
0.2
0.4
0.6
0.8
1
1.2
1.4
1.6
1.8
2
0 15 30 45 60DT (F)
Dep
osit
Mas
s (g
)
0
5
10
15
20
25
30
Wax
(% w
t.)
Weight 24 hr Weight 48 hr
Wax 24 hr Wax 48 hr
Figure 29 – Effect of Temperature Difference for CBI
0
0.2
0.4
0.6
0.8
1
1.2
0 10 20 30 40 50 60Deposition Time (hrs)
Dep
osit
Mas
s (g
)
0
5
10
15
20
25
30
Wax
Con
tent
(% w
eigh
t)
W eight - ∆T 15°F W eight - ∆T 30°F
W eight - ∆T 45°F W ax - ∆T 15 °F
W ax - ∆T 30 °F W ax - ∆T 45 °F
Figure 30 – Effect of Deposition Time for CBI
50
Conclusions Two different crude oils, South Pelto and Cote Blanche Island, have been extensively studied to
assess their deposition tendencies using the cold finger device. The same oils were studied under similar conditions at the flow loop facilities. The results from the flow loop for oil-water tests differed from the results from the cold finger device with respect to deposition tendencies. The deposition rates obtained from the flow loop for oil-water tests were higher than those seen for single-phase tests and kept increasing for increasing water cuts (Gao, 2003). The deposition tendencies were exactly the opposite for the cold finger device. The total amount of deposit at the end of the tests was higher for single-phase tests than for oil-water tests, and it decreased with increasing water cuts.
South Pelto
Single-phase and two-phase tests presented soft deposits, similar to a gelled oil, for all ∆Ts tested.
The overall mass of deposit increases with increasing ∆Ts for all conditions tested. For single-phase tests, the average wax fraction in the deposits decreases with increasing ∆Ts, resulting in softer deposits. Similar trends were observed for single-phase tests at the flow loop. For the oil-water tests conducted with salt water, the wax fraction increased with water up to 60% and it seemed to plateau for higher water cuts.
Four different water cuts were used for oil-water tests. The amount of deposits is higher for single-phase tests than for two-phase oil-water tests and it decreases almost exponentially with increasing water cuts. This behavior becomes more pronounced as the ∆T increases.
Possible reasons for the decreasing amount of deposits as the water cuts increase are: the limited volume of solution, the increase in the heat capacity of the solution due to the water phase, a continuous increase in the viscosity of the solution and the weakening of the wax structures due to the presence of water.
For South Pelto, 24-hour oil-water tests led to significant depletion of the wax in the oil. The optimum time period for the tests with South Pelto is set to be 6 hours for the existing cold finger device.
The presence of salt did not affect the deposition for all conditions tested. Nearly no difference could be seen when comparing the amount of deposits created with fresh water and brine.
For South Pelto crude oil, nearly all deposition takes place within the first 6 hours of test (about 70% of the deposit), for both fresh water and brine. The wax content practically does not change with time after 6 hours.
Two different mixing speeds were used to prepare the emulsions: 600 rpm ( =γ 90 1−s ) and 2000 rpm ( =γ 296 1−s ). No difference was seen between the deposits created with both conditions, which implies either emulsions have comparable properties or their characteristics do not affect the deposition process for the range of parameters tested.
Cote Blanche Island
Single-phase tests with CBI yielded results similar to the flow loop results. The deposits were softer than with South Pelto for all conditions tested. Aging of the deposits can be verified for the tests conducted up to 48 hours, and no significant depletion of the wax in the oil could be detected.
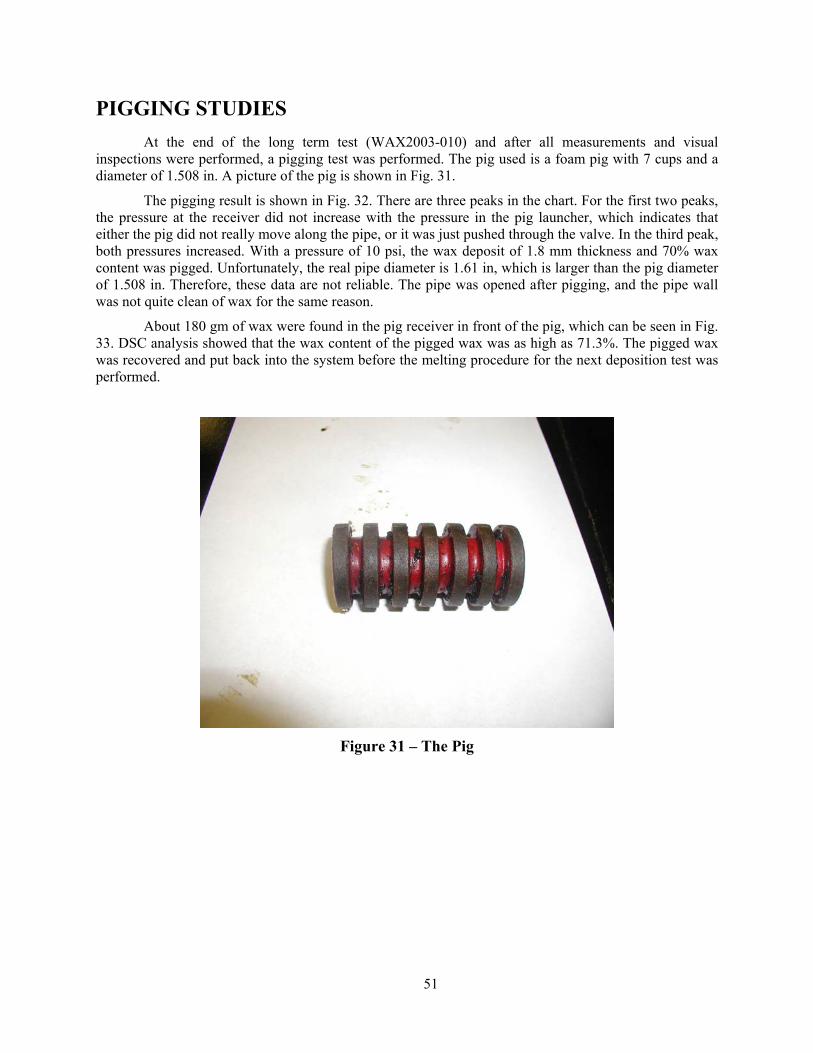
51
PIGGING STUDIES At the end of the long term test (WAX2003-010) and after all measurements and visual
inspections were performed, a pigging test was performed. The pig used is a foam pig with 7 cups and a diameter of 1.508 in. A picture of the pig is shown in Fig. 31.
The pigging result is shown in Fig. 32. There are three peaks in the chart. For the first two peaks, the pressure at the receiver did not increase with the pressure in the pig launcher, which indicates that either the pig did not really move along the pipe, or it was just pushed through the valve. In the third peak, both pressures increased. With a pressure of 10 psi, the wax deposit of 1.8 mm thickness and 70% wax content was pigged. Unfortunately, the real pipe diameter is 1.61 in, which is larger than the pig diameter of 1.508 in. Therefore, these data are not reliable. The pipe was opened after pigging, and the pipe wall was not quite clean of wax for the same reason.
About 180 gm of wax were found in the pig receiver in front of the pig, which can be seen in Fig. 33. DSC analysis showed that the wax content of the pigged wax was as high as 71.3%. The pigged wax was recovered and put back into the system before the melting procedure for the next deposition test was performed.
Figure 31 – The Pig

52
Figure 32 - Pigging Result
Figure 33 - Wax Recovered from Pigging
53
Single-Phase Studies INVESTIGATION OF SINGLE-PHASE PARAFFIN DEPOSITION CHARACTERISTICS
Operational Procedure
Startup Procedure
The first step of the startup procedure is to melt any deposit left on the pipe wall from a previous test, as well as wax solids that may have settled in the bottom of the oil tanks. This also ensures that the test fluid in the system is properly mixed. In order to achieve this, the test fluid temperature is raised about 17°C (30°F) or more above the fluid WAT. The oil temperature is raised by operating the hot glycol system, and flowing oil and hot glycol through the heat exchanger. Oil is then flowed through the test section at a relatively high flow rate (typically 1500 ~ 1800 BPD) in order to aid the deposit removal. The melting procedure lasts from 6 ~ 8 hours to ensure that the pipe wall is clean.
After the melting procedure, it is necessary to lower the oil temperature to the desired test temperature, typically about 5 ~ 8°C (10 ~ 15°F) below the WAT. This is done in two steps: first, the oil temperature is lowered to the WAT and then to the desired temperature. The oil is cooled through the test section. The glycol temperature is raised to the WAT of the oil using the boiler in the hot glycol system, and then it is flowed in the test section at 2000 BPD. After the oil reaches the WAT, the glycol temperature is lowered to the desired temperature using the cold glycol system. While the glycol is cooled to the desired temperature, the desired oil temperature is also achieved (the oil trimmer needs to be set to avoid cooling the oil more than necessary). This last step typically takes about two hours, and some deposition may occur. For a turbulent test, it is recommended to set the oil flow rate at this point, and open the pressure ports in the single-phase flow loop, since it is possible to calculate the deposit thickness at this stage. For a laminar test, the flow rate at this step needs to be high to have lower deposition rates until the desired conditions are reached.
Steady–State
Once the desired start-up conditions are reached, they need to be maintained for the duration of the test. This is easily achieved by setting the automatic controls in the Data Acquisition (DAQ) computer interface and with some occasional manual adjustments. Oil and wax samples need to be taken for future analysis. Oil samples were taken every six hours from the sampling port at the bend of the test section for the single-phase flow loop, and from a sampling port at the oil metering section for the multiphase flow loop. Wax samples were taken during the test for the single-phase flow loop with the coupon samplers. For a 24-hour test, samples were taken at 3, 6 and 12 hours from startup. However, it is believed that conduction from the surroundings takes place in the stainless steel rod; therefore, the samples taken with this device may not be representative of the deposition process. In some of the tests, no wax was deposited on the coupons. Wax samples are taken also from the pipe and spool pieces at the end of each test from both flow loops.
Shutdown
After the test has been completed, all equipment items in the flow loops (trimmers, boilers, chillers, pumps, heat tracing) are stopped.

54
It is then required to empty the test section in order to remove the spool pieces from the flow loops. The oil from the test section is pushed back to the tank(s) with Nitrogen (single-phase) or Natural Gas (multiphase). For the single-phase flow loop it is recommended to close the pressure taps prior to this step, in order to avoid damages in the DP meters, and leaving nitrogen bubbles in the pressure conduit. The glycol is displaced back to the respective tank by blowing compressed air in the annulus. After the test section is empty, it is isolated from the rest of the systems and the spool pieces are removed for visual inspection and thickness measurements of the wax deposit.
Deposit Thickness Determination Three different techniques were used in this study to estimate the deposit thickness for the
different test conditions. Figure 34 shows a cross section of a pipe segment with the required variables for thickness calculations.
Figure 34 - Cross Section of Pipe Segment and Relevant Variables
Pressure Drop Method
As a result of the deposit formation on the pipe wall, the hydraulic diameter available for flow is reduced, thus increasing the frictional pressure drop.
The pressure gradient in a pipe segment for steady – state conditions is calculated by applying a momentum balance, as follows:
dLdg
Ad
dLdP
dLdP
dLdP
dLdP
accgf
νρνθρπ
τ −−−=++= sin ..............................................................(15)
Equation 15 states that the total pressure gradient is equal to the sum of frictional, gravitational and accelerational pressure gradients. All the tests in this study were horizontal or near-horizontal; therefore the gravitational pressure gradient is negligible. Also, for incompressible flow, the accelerational pressure gradient is neglected. Then equation 15 becomes:
dvf
Ad
dLdP
dLdP
f 2
2ρπτ −=−== ...............................................................................................(16)
where f is the Moody friction factor. For laminar flow conditions:
Re
64N
f = ................................................................................................................................(17)

55
Several empirical correlations are used to calculate the Moody friction factor for turbulent flow conditions. For smooth pipes, the Blasius equation can be used for 3,000 < NRe < 105, as follows:
25.0Re316.0 −= Nf ......................................................................................................................(18)
while for rough pipes, the Colebrook equation is commonly used, as follows:
⎟⎟
⎠
⎞
⎜⎜
⎝
⎛+−=
fNdf Re10
7.182log274.11 ε ...........................................................................................(19)
where ε is the pipe roughness. For stainless steel (multiphase flow loop) the pipe roughness is about 1.5⋅10-5 m, while for carbon steel (single-phase flow loop) it is 5⋅10-5 m.
The deposit surface may not be the same as the bare pipe roughness, as reported by Bern et al. (1980). However, for the range of Reynolds number studied in this thesis (NRe < 3⋅104) the effect of this variable is not significant.
The Colebrook equation was used in this study for thickness calculations to have a more general approach, and assuming that the deposit roughness would be the same as the bare pipe roughness. The thickness calculations then require an iterative process. A Fortran code was developed in order to carry out this iterative procedure. For each time step, the pressure drop across each segment, oil flow rate, density and inlet and outlet temperature are measured.
The above calculations assume that the fluid behaves as a Newtonian fluid. This might not be the case for a waxy crude oil; however, for oils with low wax content (< 5 % by weight) at temperatures well above the pour point, non-Newtonian behavior is not appreciable and the fluid can be treated as a Newtonian fluid. Other assumptions made in the above calculations are: the deposit is uniformly distributed in the radial and axial directions; the deposit is immobile; fluid viscosity is calculated at average bulk oil temperature in spite of the radial temperature gradient (both assumptions are reasonable for turbulent flow); for single-phase flow loop, the U-shaped bend is not considered for overall calculations or for segment #4 and # 5.
An error analysis conducted by Zhang (1999) shows that the pressure drop method is reliable for higher flow rates, but is not sufficiently accurate for low flow rate conditions.
Heat Transfer Method
The formation of a wax layer in the pipe creates a thermal resistance due to the heat conduction through the deposit. This added thermal resistance is related to the layer thickness and thermal conductivity; therefore, by measuring the oil and glycol temperatures and performing a heat balance it is possible to estimate the layer’s thickness.
The total heat transfer rate in the test section is given by:
lmTUAQ ∆= .........................................................................................................................(20) where U is the overall heat transfer coefficient, A is the heat exchange area and ∆Tlm is the log mean temperature difference in the heat exchange region. For a counter-current heat exchanger, this log mean temperature is written as:
⎟⎟⎠
⎞⎜⎜⎝
⎛
−−
−−−=∆
inout
outin
inoutoutinlm
TglToilTglToil
TglToilTglToilTln
)()( ....................................................................................(21)

56
The product UA in Eq. 20 is equal for the oil and glycol side (UoilAoil = UglAgl). The overall heat transfer coefficient can then be calculated as:
glw
i
w
o
i
o
p
o
oilw
o
gl hdd
kd
dd
kd
hdd
U1ln
2ln
211
+⎟⎟⎠
⎞⎜⎜⎝
⎛+⎟⎟
⎠
⎞⎜⎜⎝
⎛+= ........................................................................(22)
where dw is the diameter of the pipe open to flow, kw is the deposit thermal conductivity, hoil is the oil convective heat transfer coefficient, and hgl is the glycol convective heat transfer coefficient.
Equation 20 can be written as:
lmglgl TAUQ ∆= ...................................................................................................................(23)
where LdA ogl π=
The heat transfer rate can also be calculated by:
)( outinoiloil ToilToilCpmQ −= ...............................................................................................(24) The overall heat transfer coefficient is calculated by equating Eqs. 23 and 24, as follows:
lmgl
outinoiloilgl TA
ToilToilCpmU
∆
−=
)(...............................................................................................(25)
The inside convective heat transfer coefficient, hoil, is obtained by the Hausen correlation (1973) for laminar flow conditions, and by the Sieder and Tate correlation (1936) for turbulent flow:
Hausen (1973): 467.0
8.0
117.01
19.066.3
⎟⎠⎞
⎜⎝⎛+
⎟⎠⎞
⎜⎝⎛
+=
LdN
LdN
Nw
Pe
wPe
Nu .............................................................(26)
Sieder and Tate (1936): 14.0
,
,3/1Pr
8.0Re023.0 ⎟
⎟⎠
⎞⎜⎜⎝
⎛=
wo
boNu NNN
µµ
..................................................(27)
where oil
woilNu k
dhN = ,
oil
oilo
k
CpN
µ=Pr , PrReNNNPe =
The outside (glycol) heat transfer coefficient, hgl, is calculated using the Petukhov correlation (1970), as follows:
( )η
µµ
⎟⎟⎠
⎞⎜⎜⎝
⎛
−+
⎟⎠
⎞⎜⎝
⎛
=wgl
bglNu
Nf
NNf
Ngl
,
,
3/2Pr
PrRe
18
7.1207.1
8 ...............................................................................(28)
where f is the friction factor, η=0.25 for cooling purposes, and the ratio of viscosities is assumed to be equal to 1.25. The friction factor for Eq. 28 is calculated by:
( ) 2Re10 64.1log82.1 −−= Nf ......................................................................................................(29)
Finally, hgl is obtained by:
dodi
kNh
gl
glNugl
gl
−= ........................................................................................................................(30)

57
Similar to the pressure drop calculations, this method also requires an iterative procedure in order to obtain the deposit thickness.
The inside convective heat transfer coefficient, hoil, was adjusted by a factor when the heat balance at the beginning of a test (δ=0) was not satisfied. This factor was used for the rest of the calculations.
For this method, it is also assumed that the deposit is distributed uniformly in the pipe (in the axial and radial directions).
According to previous error analysis this method has an error margin for the thickness calculations of ± 0.11 mm for an oil temperature difference between inlet and outlet of 2.2°C (4°F), and the error increases as the temperature difference is smaller.
In addition, the deposit thermal conductivity is not known, and it may change significantly during a test for different conditions since it depends on the deposit wax content, which is not known a priori. Previous experimental results showed that the deposit thermal conductivity varies from one to two times the oil thermal conductivity. The uncertainties on this variable may cause additional errors in the calculations.
Liquid Displacement – Level Detection (LD-LD) Method
This technique is based on the comparison of a liquid volume in a pipe segment with wax and a reference drum with the same dimensions. A portable device was built for the spool pieces of the two flow loops, and the multiphase flow loop is also equipped with valves and a reference drum to perform “online LD-LD” measurements.
Spool Piece LD-LD
These measurements were conducted at the end of each test after emptying the test section. The procedure to measure the thickness with this method is the same for both flow loops; the only difference is in the dimensions of the spool pieces. The measurement devices are equipped with a vertical reference drum, spool piece holders and sight glasses to measure the liquid levels in the spool piece and reference drum. The measurement procedure for each spool piece is summarized as follows:
1. Place the spool piece vertically on its holder, parallel to the reference drum.
2. Fill the reference drum with water.
3. Displace water from the drum to the spool piece with compressed air until the initial level is seen in the spool piece sight glass. Record the water column heights for both the spool piece and the reference drum.
4. Continue to displace water into the spool piece until it is completely full and record the height of the column of water for both the spool piece and the reference drum.
5. Compute deposit thickness as:
⎟⎟
⎠
⎞
⎜⎜
⎝
⎛
∆∆
−=piece spool
drumH
Hdi 15.0δ ..................................................................................................(31)
For these measurements, it is assumed that the deposit thickness is uniform (radially and axially). Calibration results show that this method has an error margin of about ± 0.05 mm.

58
Online LD-LD (Multiphase Flow Loop)
Online LD-LD measurements were conducted at the end of each test, prior to shutting down the facility (measurements can also be made during a test, but this may perturb the steady-state conditions). The principle of the measurement is the same as for the spool piece LD-LD. A schematic of the online LD in the multiphase flow loop is shown in Fig. 35.
Prior to conducting the measurements, the test section is by-passed by operating the quick closing valves from the computer interface, and the inclinable test section is raised to a fully vertical position. For a single-phase test, the test section should be full with oil. This oil is displaced from the test section to the reference drum by introducing nitrogen into the top of the test section (for multiphase tests the natural gas in the system is used), manipulating the proper valves of the device. If required, oil from the tank is sent to the reference drum in order to fill it completely. Then, nitrogen was send to the top of the reference drum to displace the oil back to the test section in a stepwise manner, recording the pressure drop in the pipe and reference drum (DP6 and DP7) at the end of each step after they were stable. After all the oil was displaced to the test section, the test section was put back in the horizontal position and flow was restarted.
The deposit thickness is calculated as:
⎟⎟⎠
⎞⎜⎜⎝
⎛
∆∆
−=⎟⎟
⎠
⎞
⎜⎜
⎝
⎛
∆∆
−=6piece spool
drumPPd
PPd ii
715.015.0δ .....................................................................(32)
Calibration of the measurements shows that the results are repeatable within ± 0.2 mm of accuracy.
For soft deposits (typical of laminar flow tests), some of the wax deposit may drain down when the spool pieces or the test section are put in a vertical position, causing errors in the measurements. Additional errors may be produced in the spool piece LD-LD measurements for soft deposits, since the blow-down procedure may affect the deposit thickness.
Figure 35 - Schematic of Online LD-LD Device (Multiphase Flow Loop)

59
EXPERIMENTAL RESULTS
South Pelto Tests
South Pelto crude oil was studied under single-phase flow conditions in order to continue the data gathering and analysis for the effect of flow regime and temperature difference between oil and glycol inlets that was started during the Paraffin Deposition Joint Industry Project.
A total of 10 tests were completed for South Pelto crude oil. For all these tests, the oil inlet temperature was set at 40.6°C (105°F), which corresponds to 8.3°C (15°F) below the Wax Appearance Temperature of the oil (48.9°C (120°F)). The test matrix showing the experimental conditions studied is given in Table 21.
Table 21 - Test Matrix for South Pelto Crude Oil
Qo Flow Toil in ∆T = Toin - Tgin Test Reference Number (BPD) Regime ºC (ºF) ºC (ºF)
WAX2001/006 1546 Turbulent 40.6 (105) 16.7 (30) WAX2001/007 1546 Turbulent 40.6 (105) 8.3 (15) WAX2001/008 4500 Turbulent 40.6 (105) 25 (45) WAX2001/010 2900 Turbulent 40.6 (105) 25 (45) WAX2001/011 1000 Turbulent 40.6 (105) 25 (45) WAX2001/012 650 Turbulent 40.6 (105) 25 (45) WAX2001/013 400 Transition 40.6 (105) 25 (45) WAX2001/014 250 Laminar 40.6 (105) 25 (45) WAX2001/015 80 Laminar 40.6 (105) 25 (45) WAX2001/016 1800 Turbulent 40.6 (105) 25 (45)
Effect of ∆T
Tests WAX2001/006 and WAX2001/007 were used to study the effect of the temperature difference between oil and glycol inlet temperatures on the paraffin deposition process. Significant amounts of data were gathered in the single-phase flow loop during the WAX JIP, but most of the data gathered on the multiphase flow loop were for a ∆T of 25°C (45°F). Test 2M had a ∆T of 8.3°C (15°F), with no significant amount of deposit was found after 24 hours for an oil velocity of 1.3 m/s (4.3 ft/s). Test WAX2001/007 is a repeat of test 2M to corroborate these results.
The wax deposits for tests WAX2001/006 and WAX2001/007 were very similar: dark, medium hard, very smooth, and uniformly distributed along the pipe wall (radially and axially). The main difference between them was the deposit thickness. For the test with ∆T = 30°F (WAX2001/006) the deposit thickness from the online LD-LD measurement wax 0.73 mm. For ∆T = 15°F (WAX2001/007) the measured LD-LD thickness was below the detectable limit of 0.2 mm.
The spool piece available in the loop was removed after the shutdown of the tests and was inspected using a Boroscope. Figures 36 and 37 are pictures taken with this device after 24 hours of deposition. From these pictures it is clear that the deposit thickness for Test WAX2001/006 is significantly greater than for WAX2001/007. The wax deposit for the latter is almost like a film around the pipe wall. The thickness from Test WAX2001/007 was lower than the accuracy range of any of the thickness measurement methods available. These results are consistent with observations from test 2M. The deposit could only be observed using the Boroscope.

60
Wax samples from the spool piece for both tests were sent to Chevron Petroleum Technology Center for HTGC (High Temperature Gas Chromatography) analysis. The wax content* from this analysis was 28.2% for Test WAX2001/006 and 44% for Test WAX2001/007, indicating higher wax content for the test with lower ∆T. Results from Lund (1998) showed the same trend for turbulent cases.
Figure 36 - View of Scrape on the Deposit Surface for Test WAX2001/006 (∆T = 30°F)
Figure 37 - View of Scrape on the Deposit Surface for Test WAX2001/007 (∆T = 15°F)
Effect of Flow Rate
A total of eight (8) tests were conducted to complete the study of flow regime dependence on the paraffin deposition process for South Pelto crude oil. The oil flow rate was varied from 4500 BPD to 80 BPD, covering turbulent, transition and laminar flow regimes. For all these tests, the difference between the oil and glycol inlet temperatures was 25°C (45°F), and all tests had a duration of 24 hours.
Turbulent Tests:
Test WAX2001/008 (Qo = 4500 BPD):
Test WAX2001/008 had a flow rate of 4500 BPD, close to the maximum flow rate that can be measured in the multiphase flow loop. This high flow rate could not be studied in the past.
Visual observations for Test WAX2001/008 showed a very hard, brown colored deposit. The deposit was not uniformly distributed in the pipeline and some signs of sloughing were observed. The deposit thickness from LD-LD measurements was 0.35 mm. Since the deposit was so hard, it was also possible to measure its thickness with a vernier caliper. The resulting thickness was 0.36 mm. The deposit was easily removed by slightly touching it with a spoon.
Figure 38 shows a stereotype videoscope picture of the deposit in the spool piece after an MEK wash. Layers of different thickness are observed, indicating sloughing of the deposit. For this test, the deposit thickness was 0.35 mm.
* Wax content = 100 % - measured oil wt % in the sample. Accuracy of the method is about ± 10 % of the result.

61
Figure 38 - Stereotype View of Deposit Surface after MEK Wash for Test WAX2001/008 (Qo=450 BPD)
Test WAX2001/010 (Qo = 2900 BPD):
Test WAX2001/010 was also a turbulent test, with an oil flow rate of 2900 BPD. The shear stress at the wall for this test before deposition is about 18 Pa, similar to what is often encountered during field operations.
The result from this test was a thick, very hard and dark deposit on the spool piece wall after 24 hrs. As observed in Fig. 39, the deposit was rough and distributed uniformly along the pipe (radially and axially). No signs of sloughing were observed on the deposit surface.
From the online LD–LD measurement, the wax deposit thickness at the end of the test was 0.98 mm, and from the spool piece LD–LD it was 0.81 mm.
The deposit thickness is greater for this test than for the test with a higher flow rate (Test WAX2001/008).
Figure 39 - Deposit on Spool Piece for Test WAX2001/010 (Qo = 2900 BPD)

62
Test WAX2001/016 (Qo = 1800 BPD):
For this test with a lower flow rate the deposit observed at the end of the test was similar to Test WAX2001/010: rough, hard and uniform, as can be seen in Fig. 40.
The thickness of the deposit from this test was 0.96 mm according to the online LD–LD measurement, and 1.37 mm from the spool piece LD–LD.
The wax content for this test was 35.8%.This test is comparable to a test conducted by Lund (1998) in the single-phase flow loop with the same fluid (Reynolds number is comparable, and same ∆T was studied). For that particular test (14R), the deposit thickness on spool piece #1 was 1 mm, which is located approximately at the same distance from the inlet as the spool piece in the multiphase flow loop. Results are similar to the online LD-LD, DP4 and DP5, while the spool piece LD-LD gave higher deposit thickness. The wax content measurements are in good agreement as well (for test 14R the wax content was 35% for spool piece 1).
Figure 40 - Deposit on Spool Piece for Test WAX2001/016 (Qo = 1800 BPD)
Transition and Laminar Tests:
For the last three tests (WAX2001/013, 014, 015) the flow rate was low, corresponding to laminar or transition regions. From visual observations, the deposit was very soft, but contrary to most turbulent cases, it was not uniform and waves were observed on the deposit surface. Since these tests had low flow rates, the waves could not be due to the shear force exerted by the oil flow (sloughing or shear stripping effects). Most likely the observed phenomenon is a result of the blow down procedure where the gas used to push the oil from the test section to the oil tank may have affected the deposit surface.
For Test WAX2001/011 (Qo = 1000 BPD) the measurements from both LD-LD devices agree very well with a deposit thickness of about 1.2 mm. However, as the flow rate is decreased there is more difference between LD-LD measurements. The big discrepancy for the lower flow rate cases may also be a consequence of the blow down procedure where the gas used to displace the oil in the test section may have removed some of the very soft deposit formed after these tests. It is recommended that the blow down procedure be revised, especially for low flow rate tests, in order to avoid affecting the deposit.
Another important observation is that Test WAX2001/013 (Qo = 450 BPD), which had a Reynolds number about 2500, was the test that produced the highest deposit thickness from the online LD-LD method, whereas the thickness for the two tests in the laminar region were very close. From the
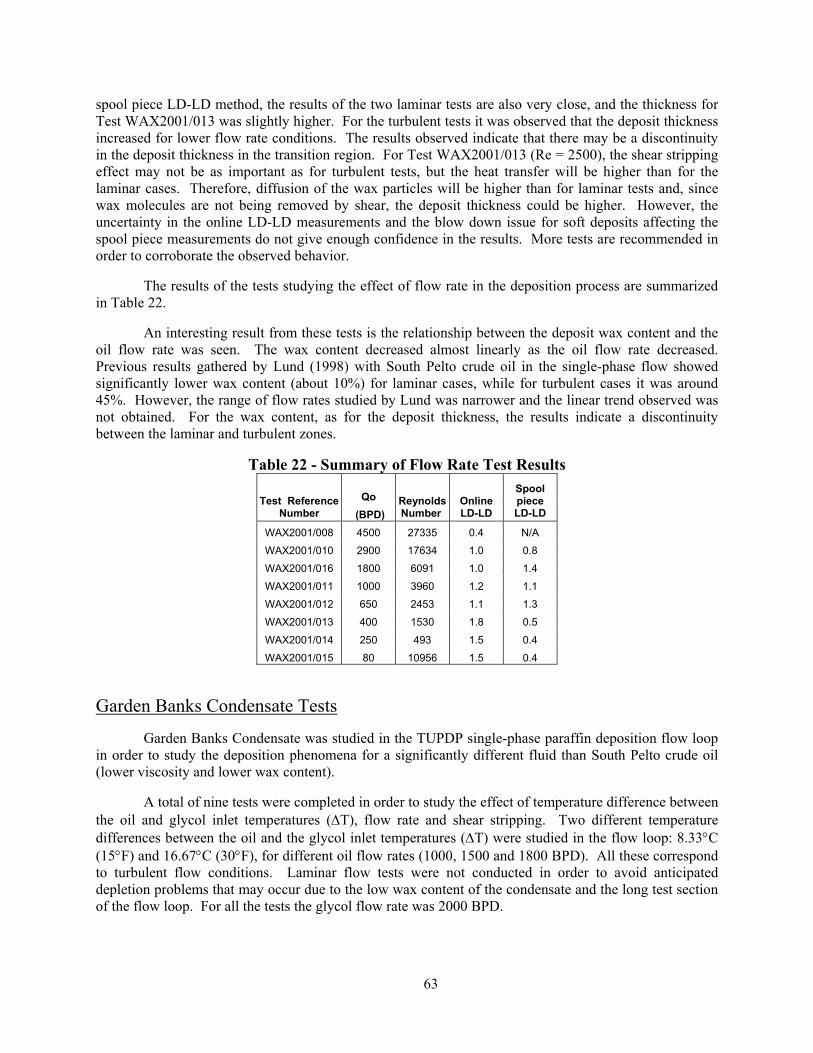
63
spool piece LD-LD method, the results of the two laminar tests are also very close, and the thickness for Test WAX2001/013 was slightly higher. For the turbulent tests it was observed that the deposit thickness increased for lower flow rate conditions. The results observed indicate that there may be a discontinuity in the deposit thickness in the transition region. For Test WAX2001/013 (Re = 2500), the shear stripping effect may not be as important as for turbulent tests, but the heat transfer will be higher than for the laminar cases. Therefore, diffusion of the wax particles will be higher than for laminar tests and, since wax molecules are not being removed by shear, the deposit thickness could be higher. However, the uncertainty in the online LD-LD measurements and the blow down issue for soft deposits affecting the spool piece measurements do not give enough confidence in the results. More tests are recommended in order to corroborate the observed behavior.
The results of the tests studying the effect of flow rate in the deposition process are summarized in Table 22.
An interesting result from these tests is the relationship between the deposit wax content and the oil flow rate was seen. The wax content decreased almost linearly as the oil flow rate decreased. Previous results gathered by Lund (1998) with South Pelto crude oil in the single-phase flow showed significantly lower wax content (about 10%) for laminar cases, while for turbulent cases it was around 45%. However, the range of flow rates studied by Lund was narrower and the linear trend observed was not obtained. For the wax content, as for the deposit thickness, the results indicate a discontinuity between the laminar and turbulent zones.
Table 22 - Summary of Flow Rate Test Results
Qo Test Reference Number (BPD)
Reynolds Number
Online LD-LD
Spool piece LD-LD
WAX2001/008 4500 27335 0.4 N/A
WAX2001/010 2900 17634 1.0 0.8
WAX2001/016 1800 6091 1.0 1.4
WAX2001/011 1000 3960 1.2 1.1
WAX2001/012 650 2453 1.1 1.3
WAX2001/013 400 1530 1.8 0.5
WAX2001/014 250 493 1.5 0.4
WAX2001/015 80 10956 1.5 0.4
Garden Banks Condensate Tests
Garden Banks Condensate was studied in the TUPDP single-phase paraffin deposition flow loop in order to study the deposition phenomena for a significantly different fluid than South Pelto crude oil (lower viscosity and lower wax content).
A total of nine tests were completed in order to study the effect of temperature difference between the oil and glycol inlet temperatures (∆T), flow rate and shear stripping. Two different temperature differences between the oil and the glycol inlet temperatures (∆T) were studied in the flow loop: 8.33°C (15°F) and 16.67°C (30°F), for different oil flow rates (1000, 1500 and 1800 BPD). All these correspond to turbulent flow conditions. Laminar flow tests were not conducted in order to avoid anticipated depletion problems that may occur due to the low wax content of the condensate and the long test section of the flow loop. For all the tests the glycol flow rate was 2000 BPD.

64
The test matrix is shown in Table 23.
Table 23 - Test Matrix for Garden Banks Condensate
Test # Objective Toil (°F)
∆T (°F)
Flow Rate (BPD)
Reynolds Number Duration
WAX2001-033 Flow Rate, ∆T 85 30 1000 14206 24 hrs WAX2001-025 Flow Rate, ∆T 85 30 1500 21309 24 hrs WAX2001-029 Flow Rate, ∆T 85 30 1800 25571 24 hrs WAX2001-031 Flow Rate, ∆T 85 15 1000 14206 24 hrs WAX2001-026 Flow Rate, ∆T 85 15 1500 21309 24 hrs WAX2002-001 Flow Rate, ∆T 85 15 1800 25571 24 hrs WAX2001-028 Shear Stripping 85 ~ 55 30 ~ 0 1800 25571 48 hrs WAX2002-002 Shear Stripping 85 ~ 55 30 ~ 0 1800 25571 80 hrs WAX2002-003 Shear Stripping 85 ~ 55 30 ~ 0 1000 ~ 1800 14206 24 hrs
Effect of ∆T
Test WAX2001/025 (Qo = 1500 BPD, ∆T = 30°F):
This was the first test conducted in the flow loop after about three years of no operation. This test has the same operational conditions as test 22 conducted by Lund in 1998.
After 24 hours, a significant amount of wax was deposited on the pipe. The deposit was thicker at the end of the test section (spool piece #2) than before the bend (spool piece #1). The deposit was yellow, hard* and uniformly distributed along the spool pieces (axially and circumferentially). Boroscope pictures of the deposits in both spool pieces taken at the end of the tests are shown in Figs. 41 - 42. The deposit was quite rough, and some particles were seen on the surface. The deposit on spool piece #1 seemed to have less oil content than on spool piece #2.
The LD-LD technique was used to measure the deposit thickness on each spool piece. For spool piece #1 the thickness was 0.28 mm and for spool piece #2 the thickness was 0.38 mm.
Wax content measurements were also conducted on samples taken at the end of the test. An HTGC analysis of a sample taken from the pipe upstream from spool piece #2 showed a wax content of 39.1%. A similar analysis from a sample taken from spool piece #2 in test 22 (Lund, 1998) reported a wax content of 44.6%. The slight difference in the results is within the accuracy range of the method.
* Hardness of the deposit is based on visual observations. No actual measurements were conducted. Relative comparisons between tests are based on deposits found in this facility.

65
Figure 41 - Deposit on Spool Piece #1 for Test WAX2001/025
(Qo=1500 BPD, ∆T = 30°F)
Figure 42 - Deposit on Spool Piece #2 for Test WAX2001/025
(Qo=1500 BPD, ∆T = 30°F)
Test WAX2001/026 (Qo = 1500 BPD, ∆T = 15°F):
This test was conducted with the same flow rate as WAX2001/025, but with half the temperature difference between the oil and glycol inlet temperatures (∆T = 15°F).
After 24 hours of testing, a deposit similar to the one for Test WAX2001/025 was found on the spool pieces, but the deposit thickness was significantly smaller. In fact, for spool piece #1 the deposit could only be observed with the boroscope (see Fig. 43). The deposit on spool piece #2 was uniformly distributed around the pipe, and no signs of sloughing were observed.
Figure 44 shows that the deposit on spool piece #2 was different at the bottom and at the top of the pipe, and the interface can clearly be observed with the boroscope. There seems to be more oil at the bottom of the pipe. The wax content from an HTGC analysis for a sample taken from the pipe upstream from spool piece #2 was 35.1%, which is slightly lower than the result for Test WAX2001/025 (39.1 %), but within the accuracy range of the measurement. From visual observations, there was not a significant difference in the deposit characteristics for different ∆T.
An LD-LD measurement was made only on spool piece #2, since the deposit thickness was too small on spool piece #1. The measured thickness was 0.17 mm for spool piece #2.
The deposit thickness for this test was quite low, about 0.15 mm, and close to the accuracy range of the methods. A similar trend as for Test WAX2001/025 was found for this test, with higher deposit rates at the beginning of the test.
The deposit thickness is significantly higher for higher ∆T. This result is expected, since a greater temperature gradient between the bulk and the wall temperatures will result in a greater concentration gradient, which is the driving force for mass transfer from the bulk to the wall of the pipe.

66
Figure 43 - Deposit on Spool Piece #1 for Test WAX2001/026
(Qo=1500 BPD, ∆T = 15°F)
Figure 44 - Deposit on Spool Piece #2 for Test WAX2001/026
(Qo=1500 BPD, ∆T = 15°F)
Qo = 1000 BPD (Test WAX2001/033 and WAX2001/031):
Similar results were found for tests using a lower flow rate of 1000 BPD. For Test WAX2001/033 (∆T = 30°F) a significant amount of deposit was found on the spool pieces after 24 hours, and the deposit was the thickest of all the tests studied. Pictures taken with the boroscope at the end of the test are shown in Figs. 45 and 46.
The deposit was softer in this test than for the tests with Qo = 1500 BPD. As shown in the pictures, the deposit was yellow, rough and uniformly distributed in the spool pieces (axially and circumferentially). From the LD-LD technique, the deposit thickness for spool piece #1 for Test WAX2001/033 was 0.34 mm, and for spool piece #2 was 0.76 mm. The wax content measured from HTGC analysis for a sample taken from the pipe upstream from spool piece #2 was 39.6%.
Figures 47 and 48 show that a similar type of deposit was found in the spool pieces for Test WAX2001/031, which had an oil flow rate of 1000 BPD, and ∆T = 15°F. However, the deposit thickness is significantly smaller than for the test with ∆T = 30°F. The wax content from HTGC analysis for this test was 52.3 %, higher than for Test WAX2001/033.
For this test, the deposit thickness from LD-LD measurements was 0.15 mm and 0.25 mm for spool pieces 1 and 2, respectively, which is almost three times smaller than for Test WAX2001/033.
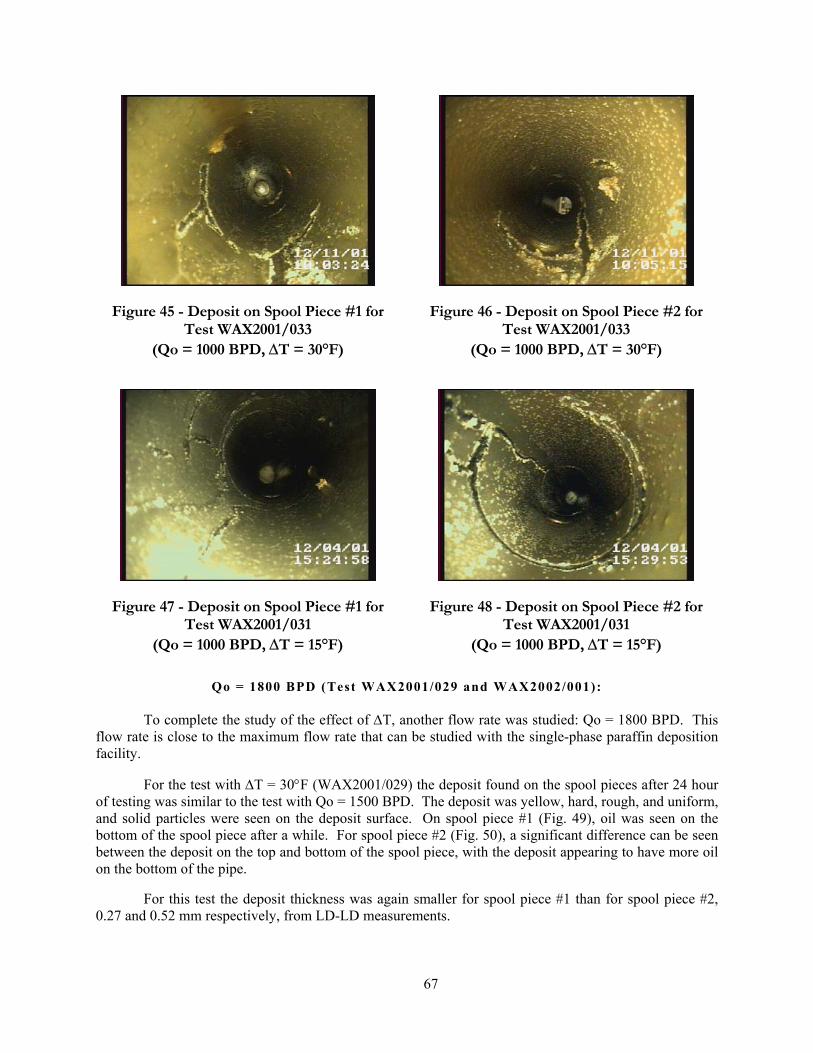
67
Figure 45 - Deposit on Spool Piece #1 for Test WAX2001/033
(Qo = 1000 BPD, ∆T = 30°F)
Figure 46 - Deposit on Spool Piece #2 for Test WAX2001/033
(Qo = 1000 BPD, ∆T = 30°F)
Figure 47 - Deposit on Spool Piece #1 for Test WAX2001/031
(Qo = 1000 BPD, ∆T = 15°F)
Figure 48 - Deposit on Spool Piece #2 for Test WAX2001/031
(Qo = 1000 BPD, ∆T = 15°F)
Qo = 1800 BPD (Test WAX2001/029 and WAX2002/001):
To complete the study of the effect of ∆T, another flow rate was studied: Qo = 1800 BPD. This flow rate is close to the maximum flow rate that can be studied with the single-phase paraffin deposition facility.
For the test with ∆T = 30°F (WAX2001/029) the deposit found on the spool pieces after 24 hour of testing was similar to the test with Qo = 1500 BPD. The deposit was yellow, hard, rough, and uniform, and solid particles were seen on the deposit surface. On spool piece #1 (Fig. 49), oil was seen on the bottom of the spool piece after a while. For spool piece #2 (Fig. 50), a significant difference can be seen between the deposit on the top and bottom of the spool piece, with the deposit appearing to have more oil on the bottom of the pipe.
For this test the deposit thickness was again smaller for spool piece #1 than for spool piece #2, 0.27 and 0.52 mm respectively, from LD-LD measurements.

68
The HTGC analysis for a sample taken from the pipe upstream from spool piece #2 showed a wax content of 35.4 %.
For Test WAX2002/001 (∆T = 15°F), a problem in the operation of the flow loop resulted in an increase in the glycol temperature to the oil temperature for the last 5 hours of the test. As a result of this problem, most of the wax deposit on the pipe was re-dissolved into the mixture or sloughed from the pipe due to the high oil velocities. The boroscope picture from spool piece #1 after shutdown showed no deposit, and strips of empty pipe were observed for spool piece #2, as can be seen in Figs. 51 and 52.
The wax content from HTGC analysis for a sample close to spool piece #2 was 44.2 %, higher than for the case with ∆T = 30 °F. However, the sample is not representative of the deposition process since the increase in the wall temperature may have altered the deposit characteristics.
The LD-LD method was only used for spool piece #2, since there was no wax on spool piece #1. The deposit thickness for spool piece #2 was 0.1 mm. The thickness was also measured from pressure drop calculations.
The thickness from pressure drop calculations for Test WAX2002/001 (∆T = 15 °F) show a decrease. According to these results, about half of the deposit was sloughed from the pipe after 25 hours. In any case, it is clear that the deposit thickness is smaller for smaller ∆T, which is in agreement with results from the rest of the tests. For this higher flow rate, the difference between the two ∆Ts studied is smaller than for the lower flow rates studied.
Figure 49 - Deposit on Spool Piece #1 for Test WAX2001/029
(Qo = 1800 BPD, ∆T = 15°F)
Figure 50 - Deposit on Spool Piece #2 for Test WAX2001/029
(Qo = 1800 BPD, ∆T = 30°F)
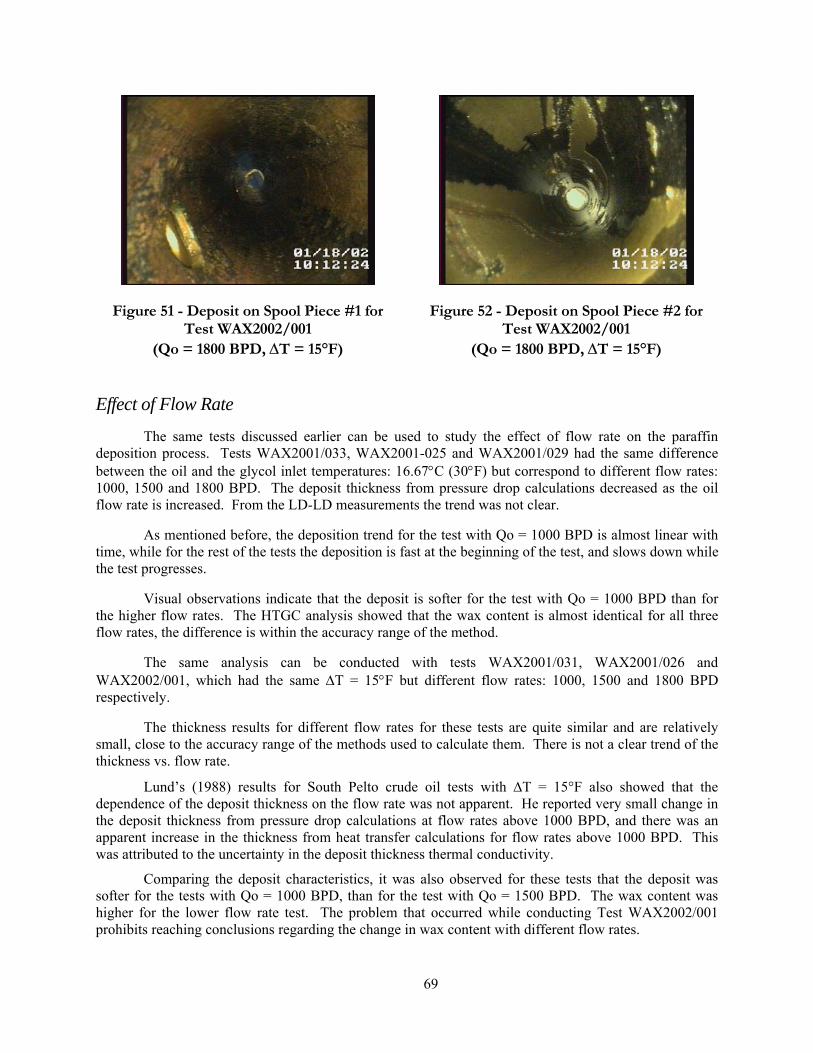
69
Figure 51 - Deposit on Spool Piece #1 for Test WAX2002/001
(Qo = 1800 BPD, ∆T = 15°F)
Figure 52 - Deposit on Spool Piece #2 for Test WAX2002/001
(Qo = 1800 BPD, ∆T = 15°F)
Effect of Flow Rate
The same tests discussed earlier can be used to study the effect of flow rate on the paraffin deposition process. Tests WAX2001/033, WAX2001-025 and WAX2001/029 had the same difference between the oil and the glycol inlet temperatures: 16.67°C (30°F) but correspond to different flow rates: 1000, 1500 and 1800 BPD. The deposit thickness from pressure drop calculations decreased as the oil flow rate is increased. From the LD-LD measurements the trend was not clear.
As mentioned before, the deposition trend for the test with Qo = 1000 BPD is almost linear with time, while for the rest of the tests the deposition is fast at the beginning of the test, and slows down while the test progresses.
Visual observations indicate that the deposit is softer for the test with Qo = 1000 BPD than for the higher flow rates. The HTGC analysis showed that the wax content is almost identical for all three flow rates, the difference is within the accuracy range of the method.
The same analysis can be conducted with tests WAX2001/031, WAX2001/026 and WAX2002/001, which had the same ∆T = 15°F but different flow rates: 1000, 1500 and 1800 BPD respectively.
The thickness results for different flow rates for these tests are quite similar and are relatively small, close to the accuracy range of the methods used to calculate them. There is not a clear trend of the thickness vs. flow rate.
Lund’s (1988) results for South Pelto crude oil tests with ∆T = 15°F also showed that the dependence of the deposit thickness on the flow rate was not apparent. He reported very small change in the deposit thickness from pressure drop calculations at flow rates above 1000 BPD, and there was an apparent increase in the thickness from heat transfer calculations for flow rates above 1000 BPD. This was attributed to the uncertainty in the deposit thickness thermal conductivity.
Comparing the deposit characteristics, it was also observed for these tests that the deposit was softer for the tests with Qo = 1000 BPD, than for the test with Qo = 1500 BPD. The wax content was higher for the lower flow rate test. The problem that occurred while conducting Test WAX2002/001 prohibits reaching conclusions regarding the change in wax content with different flow rates.

70
Effect of Shear Stripping
In addition to the effects of flow rate and ∆T, three tests were conducted to study the shear stripping effect that may occur under high flow rate conditions. For these tests, a 24-hour deposition period was followed by an “isothermal” period in which no further deposition is expected to occur. Therefore, any change in the deposit thickness and/or characteristics could be attributed to the shear stripping effect. The objective of these tests was to isolate the deposition phenomena from any other effects that may be taking place. Table 24 summarizes the test conditions for the tests used to study the shear stripping effect. Each test is explained in detail in following paragraphs.
Table 24 - Test Conditions for Shear Stripping Tests WAX2001/028 WAX2002/002 WAX2002/003Qo = 1800 BPD Qo = 1800 BPD Qo = 1000 BPD
Toil = 85 ºF Toil = 85 ºF Toil = 85 ºFTgl = 55 ºF Tgl = 57 ºF Tgl = 55 ºF∆T = 30 ºF ∆T = 28 ºF ∆T = 30 ºF
Time = 24 hours Time = 24 hours Time = 24 hours(WAX2001/029) (WAX2001/029) (WAX2001/033)
Qo = 1800 BPD Qo = 1800 BPD Qo = 1000 BPDToil = 56 ºF Toil = 59 ºF Toil = 57 ºFTgl = 55 ºF Tgl = 57 ºF Tgl = 55 ºF∆T = 1 ºF ∆T = 2 ºF ∆T = 2 ºF
Time = 24 hours Time = 48 hours Time = 24 hours
Qo = 1500 BPDToil = 57 ºFTgl = 55 ºF∆T = 2 ºF
Time = 24 hours
Qo = 1800 BPDToil = 57 ºFTgl = 55 ºF∆T = 2 ºF
Time = 24 hours
Dep
ositi
on p
erio
dIs
othe
rmal
per
iod
WAX2001/028 WAX2002/002 WAX2002/003Qo = 1800 BPD Qo = 1800 BPD Qo = 1000 BPD
Toil = 85 ºF Toil = 85 ºF Toil = 85 ºFTgl = 55 ºF Tgl = 57 ºF Tgl = 55 ºF∆T = 30 ºF ∆T = 28 ºF ∆T = 30 ºF
Time = 24 hours Time = 24 hours Time = 24 hours(WAX2001/029) (WAX2001/029) (WAX2001/033)
Qo = 1800 BPD Qo = 1800 BPD Qo = 1000 BPDToil = 56 ºF Toil = 59 ºF Toil = 57 ºFTgl = 55 ºF Tgl = 57 ºF Tgl = 55 ºF∆T = 1 ºF ∆T = 2 ºF ∆T = 2 ºF
Time = 24 hours Time = 48 hours Time = 24 hours
Qo = 1500 BPDToil = 57 ºFTgl = 55 ºF∆T = 2 ºF
Time = 24 hours
Qo = 1800 BPDToil = 57 ºFTgl = 55 ºF∆T = 2 ºF
Time = 24 hours
Dep
ositi
on p
erio
dIs
othe
rmal
per
iod
Test WAX2001/028
The test conditions for the deposition period were the same as for Test WAX2001/029, e.g. Qo = 1800 BPD, ∆T = 30°F. The oil inlet temperature (Oil Temperature #1) was constant at 85°F for the first 24 hours of the test. After 24 hours, the oil temperature was dropped from 85°F to very near the glycol temperature, maintaining the same flow rate for another 24-hour period. Experimentally, it is impossible to achieve perfectly isothermal conditions in the flow loop; therefore, the oil was always slightly hotter than the glycol, but the difference for most of the period was less than 2°F. With this small ∆T, some deposition may still occur, but is expected to be negligible in comparison with other phenomena.
The temperatures at different locations in the test section increased slightly for the first 24-hours of the test, especially at the end of the test section, indicating the deposition phenomena.
The increase in the pressure drop for the first 24 hours was clearly seen for the individual segments, and especially for the overall measurements. The increase in the pressure drop immediately after the first 24-hours was due to the increase in the oil viscosity resulting from the decrease in the oil

71
temperature. After a few hours, the pressure drop started to decrease slowly during the nearly isothermal period of the test. This decrease was especially apparent in the overall measurements, but also in some of the segments of the test section. The rate of decrease was fairly constant with time. If the deposition process is related only to mass transfer from the bulk to the pipe wall, then minimizing the temperature gradient would result in a decrease of the deposition rate. However, some deposition would still take place, and the observed result in the pressure drop would not occur.
The decrease in the pressure drop cannot be attributed to changes in fluid properties resulting from changes in the oil temperature, since the density is almost constant throughout the test and the oil viscosity is increasing during this time. An increasing oil viscosity would result in an increase in the pressure drop, opposite to the trend observed.
The observed behavior could also be a result of a change in the deposit roughness. The shear force from the fluid flow could erode the deposit, making it more smooth, resulting in the pressure drop decrease observed. In any case, this type of erosion mechanism could also be considered a shear stripping effect.
Another reason for the decrease in pressure drop could be the change in the oil content of the deposit. Pictures of the deposit at the end of the test are presented in Figs. 53 and 54. The deposit did not seem much different than that for Test WAX2001/029. A wax sample taken at the end of the test from the pipe upstream from spool piece #2 was analyzed by HTGC analysis. The result of this analysis showed a wax content of 40.3 %, which was slightly higher than the wax content reported for Test WAX2001/029 (35.4%), but the difference is close to the accuracy range of the measurement. Comparison of the two wax contents may not be appropriate, since the deposit characteristic may not be exactly the same, even though the experimental conditions are similar. However, the slight increase in the wax content for this test may be an indication of aging of the deposit. If oil diffuses out of the deposit, and no further wax diffusion into the deposit takes place, the wax content in the deposit would increase and the deposit thickness would be reduced due to the loss of solvent. This deposit “shrinkage” would produce the decrease in the pressure drop readings.
Finally, another possible explanation for the decrease in the pressure drop would be a change in the deposit thickness due to shear stripping. The deposit thickness from the LD-LD measurements was 0.36 mm for spool piece #1 and 0.44 mm for spool piece #2.
For the overall calculations, the deposit thickness reaches a maximum of about 0.36 mm. After this, the deposit thickness decreases linearly, reaching a deposit thickness of about 0.29 mm. The decrease in thickness is also seen in the individual segments calculations, especially for the segments downstream from the U-bend of the test section (segments 7 – 9). No change in roughness is considered in the pressure drop calculations and the deposit roughness is assumed to be the same as the pipe roughness. Therefore, any change in the pressure drop measurements will directly result in a change in the calculated thickness.
Two tests showed that there was good repeatability between the deposition periods of Test WAX2001/028 and Test WAX2001/029. Also, the LD-LD measurements are compared in the plot. For spool piece #2, the deposit thickness is lower for the shear stripping test (WAX2001/028) than for WAX2001/029, in agreement with the results observed from the pressure drop calculations. However, the same trend is not found for spool piece #1. The changes in the deposit thickness are small and comparable to the accuracy range of the methods used to estimate the deposit thickness. Therefore, the results are inconclusive.

72
Figure 53 - Deposit on Spool Piece #1 for Test WAX2001/028 (Shear Stripping Test)
Figure 54 - Deposit on Spool Piece #2 for Test WAX2001/028 (Shear Stripping Test)
Test WAX2002/002:
In order to test the repeatability of the results of Test WAX2001/028, Test WAX2002/002 was conducted. For this test, the “isothermal period” was kept longer (48-hours) with the anticipation that the change in the thickness would be more significant and the LD-LD results would be more conclusive. The oil temperature was decreased to 2°F higher than the glycol temperature, rather than trying to achieve fully isothermal conditions to avoid any effect of the change in this parameter or the oil properties in the comparison.
The glycol temperature of 55°F could not be achieved and the test was run with a glycol inlet temperature of 57°F.
The oil inlet temperature was held constant at 85°F for the first 24 hours of the test. The rest of the temperatures in the test section increase during the first 24 hours, especially for the segments closer to the end of the test section, indicating the formation of the wax deposit. Around 18 hours from the startup, a problem in the operation of the flow loop caused a loss of the steady-state conditions for about 40 min. Hopefully, the unstable conditions did not last long enough to affect the test results. After 24-hours, it was desired to cool down the oil to 59°F (2°F warmer than the glycol). However, the heat tracing system was still on during this period, and it was not possible to reach this temperature. The oil inlet temperature was almost constant at 72°F for about 3 hours. Finally, the heat tracing system was shut down and the desired temperature was reached. The “isothermal” period lasted for about 50 hours. After 54 hours from startup, it was attempted to lower the temperature difference between the oil and glycol. However, during the day, when the ambient temperature rose, it was impossible to maintain that lower temperature. The oil flow rate was maintained constant at 1800 BPD.
For the first 24-hours of testing, the pressure drop measurements increased with time as expected, due to the reduction of the pipe diameter resulting from the deposition process. Between 24 and 30 hours, the pressure drop increased suddenly due to the increase in the oil viscosity when the oil temperature was dropped from 85°F to 72°F. The pressure drop then increased slightly for about 2 hours, indicating further deposition during this period when the ∆T between the glycol and the oil was about 15°F.

73
Finally, around 30 hours, the oil was cooled down to 59°F. The pressure drop increased suddenly again because of the change in viscosity, and then the pressure drop decreased slightly for the rest of the test during the “isothermal” period.
During the nearly isothermal period, the decreasing rate for Test WAX2001/028 seems to be slightly higher than for Test WAX2002/002. Reasons for this may be that the ∆T during this period is higher for the Test WAX2002/002 (2°F), which would result in a higher deposition rate. Another factor might be that the small pump used to circulate the fluid in oil tank #2 and the mixer in oil tank #1 were stopped at the 3rd day of the test to avoid heat transfer with the ambient (ambient temperature was 60 ~ 65°F during the day) and maintain the low temperatures. This may have caused wax crystals to settle in the tanks rather than flowing in the test section and the solids may influence the shear stripping/erosion phenomena. The small pump was later restarted.
After shutdown of the facility, both spool pieces were inspected. The deposit was similar to Test WAX2001/029. However, from the boroscope pictures shown in Figs. 55 and 56, the deposit was observed to be more smooth than the deposit of Test WAX2001/029.
A wax sample was taken from the pipe downstream of spool piece #2 for HTGC analysis. The measured wax content for this sample was 30.5%, which is slightly lower than the value for the regular deposition test, Test WAX2001/029 (35.4%), the difference is close to the accuracy range of the method. For this test, there is a decrease in the wax content measurements contrary to Test WAX2001/028. Proper conclusions regarding deposit aging may not be made due to the uncertainties in the measurements.
The deposit thickness for the two spool pieces was measured with the LD-LD technique. For spool piece #1 the measured thickness was 0.39 mm, and was 0.53 mm for spool piece #2.
From the pressure drop calculations, a small decrease in the deposit thickness is seen for the overall calculations and for some of the segments, especially the ones downstream from the bend in the test section. For the overall calculations, the deposit thickness reaches a maximum of about 0.34 mm at 30 hours, and then decreases almost linearly to 0.28 mm at the end of the test.
The LD-LD measurement for spool piece #2 for Test WAX2002/002 is very similar to the one for Test WAX2001/029. The LD-LD measurement for spool piece #1 shows an increase in the deposit thickness. Therefore, the deposit thickness decrease estimated from pressure drop calculations cannot be confirmed with the LD-LD measurements.
The shear stripping effect could probably be better understood if an oil with higher viscosity is studied. For Garden Banks condensate, the viscosity is low, and therefore the shear stress at the wall is small (13.85 Pa for Qo=1800 and 85°F).
Figure 55 - Deposit on Spool Piece #1 for Test WAX2002/002 (Shear Stripping)
Figure 56 - Deposit on Spool Piece #2 for Test WAX2002/002 (Shear Stripping)

74
Test WAX2002/003:
The conditions of this test were based on Test WAX2001/033, e.g. Qo = 1000 BPD, ∆T = 30°F. The facility was operated under those conditions for 24 hours. The oil inlet temperature was then dropped from 85°F to 57°F (2°F above glycol inlet temperature), and was kept at that value for the duration of the test. After 24 hours of “isothermal” conditions, the oil flow rate was increased from 1000 BPD to 1500 BPD, and maintained for another 24 hours. Finally, the flow rate was increased to 1800 BPD and the test continued for another 24 hours. The objective of the test was to see if the shear stripping effect would change with the different flow rates.
As for the other shear stripping tests, during the first 24 hours of testing the increase in the pressure drop and temperatures are a result of the deposit buildup. Then, when “isothermal” conditions are achieved, there is a small increase in the pressure drop due to the change in the oil viscosity and there is almost no change in pressure drop and temperatures for the subsequent 24 hours. At 50 hours, the oil flow rate was increased from 1000 BPD to 1500 BPD (200 to 300 lb/min). The pressure drops in the test section increase suddenly, and are then almost constant for the next 24 hours. Finally, the last step increase in the oil flow rate is from 1500 BPD to 1800 BPD. Again, there is a proportional step increase in the pressure drop and for the rest of the test there is almost no change in the pressure drop measurements.
At the end of the test, the deposit observed on the spool pieces was yellow, medium hard uniform, and not as rough as the deposit for Test WAX2001/033. No signs of sloughing were observed. The deposit on spool piece #2 was thicker, slightly softer, and seemed to include more oil than the deposit for spool piece #1. Pictures from both spool pieces are shown in Figs. 57 and 58.
The wax content measured from HTGC analysis for a sample close to spool piece #2 was 23.9 %, which is lower than for Test WAX2001/033 (39.6 %).
The deposit thickness measured with the LD-LD device was 0.34 mm for spool piece #1 and 0.62 mm for spool piece #2.
From the pressure drop calculations a slight decrease is observed in the deposit thickness for most of the segments in this test. For higher flow rates, greater shear stripping was expected. However, the decreasing trend does not seem to be affected by the change in flow rate. The slope of the decreasing trend is lower than for the other shear stripping tests.
The deposition trend for tests WAX2001/033 and WAX2002/003 was repeatable; however, the thickness for Test WAX2001/033 was significantly higher. From the LD-LD measurements, there was a significant reduction in deposit thickness for spool piece #2 between Test WAX2001/033 and Test WAX2002/003. This trend was not observed in the measurements for spool piece #1. It is not possible to conclude if the change in the deposit thickness is due to shear stripping, or a difference in the deposition period.
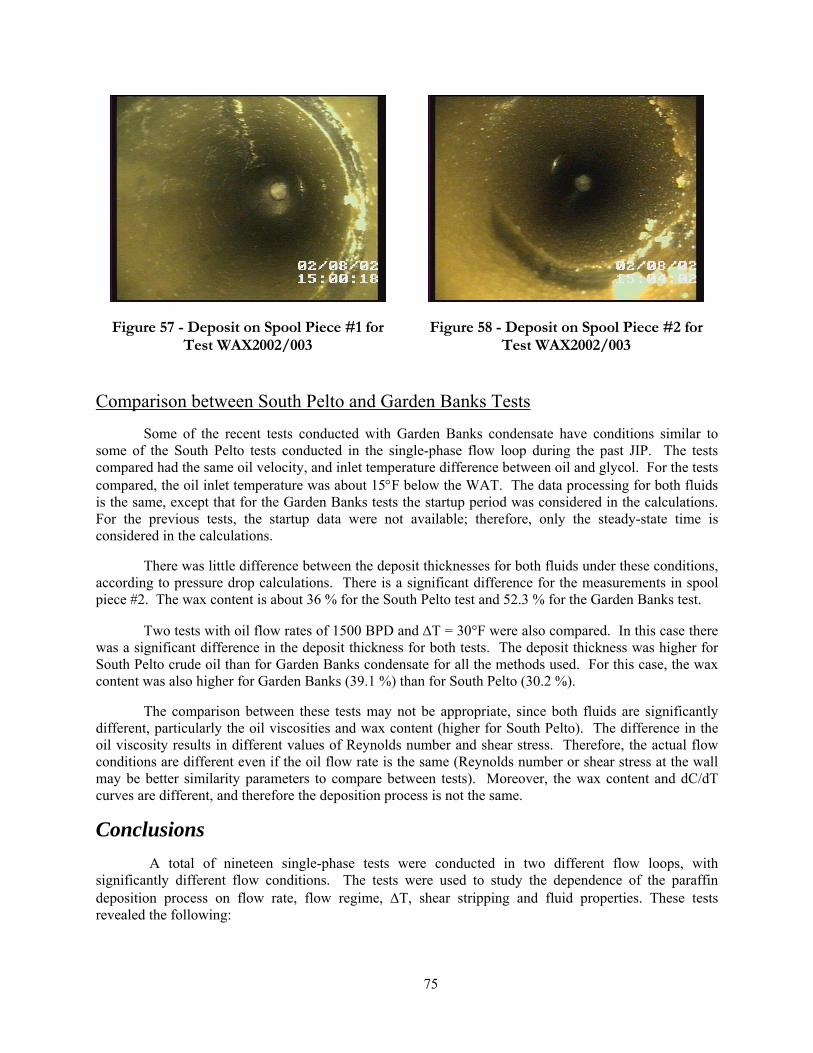
75
Figure 57 - Deposit on Spool Piece #1 for Test WAX2002/003
Figure 58 - Deposit on Spool Piece #2 for Test WAX2002/003
Comparison between South Pelto and Garden Banks Tests
Some of the recent tests conducted with Garden Banks condensate have conditions similar to some of the South Pelto tests conducted in the single-phase flow loop during the past JIP. The tests compared had the same oil velocity, and inlet temperature difference between oil and glycol. For the tests compared, the oil inlet temperature was about 15°F below the WAT. The data processing for both fluids is the same, except that for the Garden Banks tests the startup period was considered in the calculations. For the previous tests, the startup data were not available; therefore, only the steady-state time is considered in the calculations.
There was little difference between the deposit thicknesses for both fluids under these conditions, according to pressure drop calculations. There is a significant difference for the measurements in spool piece #2. The wax content is about 36 % for the South Pelto test and 52.3 % for the Garden Banks test.
Two tests with oil flow rates of 1500 BPD and ∆T = 30°F were also compared. In this case there was a significant difference in the deposit thickness for both tests. The deposit thickness was higher for South Pelto crude oil than for Garden Banks condensate for all the methods used. For this case, the wax content was also higher for Garden Banks (39.1 %) than for South Pelto (30.2 %).
The comparison between these tests may not be appropriate, since both fluids are significantly different, particularly the oil viscosities and wax content (higher for South Pelto). The difference in the oil viscosity results in different values of Reynolds number and shear stress. Therefore, the actual flow conditions are different even if the oil flow rate is the same (Reynolds number or shear stress at the wall may be better similarity parameters to compare between tests). Moreover, the wax content and dC/dT curves are different, and therefore the deposition process is not the same.
Conclusions A total of nineteen single-phase tests were conducted in two different flow loops, with
significantly different flow conditions. The tests were used to study the dependence of the paraffin deposition process on flow rate, flow regime, ∆T, shear stripping and fluid properties. These tests revealed the following:

76
Effect of ∆T
• The paraffin deposition process is highly dependant on the temperature difference between the oil and glycol inlet temperatures.
• The deposit thickness decreases significantly for the tests with lower ∆T, as expected from previous results reported by Lund (1998). The difference in the deposit thickness was more significant for lower flow rates.
• No significant difference in the deposit characteristics with ∆T was observed on the spool pieces after shutdown. The wax content was higher for most of the tests with lower ∆T.
Effect of Flow Rate
Turbulent Tests:
• For the tests with ∆T = 30°F and ∆T = 45°F, the deposit thickness changes significantly with flow rate. The deposit thickness increases as the oil flow rate decreases.
• For the Garden Banks tests with ∆T = 15°F, no definitive conclusions could be drawn because the deposit thicknesses were quite small (0.2 mm). Lund (1998) reported very little change in the deposit thickness for South Pelto crude oil (∆T=15°F) for flow rates above 1000 BPD from pressure drop data.
• The flow rate seems to affect the characteristics of the deposit; the deposit was softer for the tests with lower oil velocities. For the South Pelto tests, the wax content of the deposit increased linearly with an increase of flow rate. However, there was no significant change in the wax content analysis for the Garden Banks tests with different flow rates.
• The deposit thickness for the South Pelto test with the highest flow rate (4500 BPD) was significantly smaller than other South Pelto turbulent flow tests. This was the only test where clear signs of sloughing were seen in the spool piece.
Laminar and Transition Tests (South Pelto):
• Deposits from laminar and transition tests in the multiphase flow loop using South Pelto crude oil were very soft and oily.
• The deposit thickness was considerably higher from online LD-LD measurements than from spool piece LD-LD measurements. Discontinuities on the deposit surface indicate that the blow down procedure may have affected the deposit on the spool piece.
• The wax content for these tests was less than 20%, but increased for higher flow rates in the transition and low Reynolds number turbulent region.
• Discontinuities in the deposit thickness and wax content were observed for the test in the transition region between laminar and turbulent flow regimes. This result needs to be confirmed by more experimental data.

77
Shear Stripping Effect (Garden Banks)
• For Test WAX2001/028, there is a constant decrease in the pressure drop readings for the isothermal period of the test. This trend could be results of a decrease in the deposit thickness, or a change in the deposit roughness, both consequences of high shear forces on the deposit surface which cause shear stripping; or by deposit shrinkage due to loss of solvent (aging). From visual observations, the deposit seems smoother than for Test WAX2001/029 (base case). LD-LD measurements showed inconclusive results. Similar results were observed for WAX2002/002, a repeat test for a longer period of time. No definitive conclusions could be drawn because of the uncertainties of the methods used to estimate the deposit thickness and wax content.
• The shear stripping test with different flow rates did not show appreciable pressure drop change for the isothermal period. However, the deposit observed seems smoother than that of the base test (WAX2001/033).
General
• Results from both the single-phase and multiphase flow loops are comparable to previous tests conducted by other investigators.
• The deposit thickness results with the different methods used are in agreement for most of the tests, especially for the tests conducted on the single-phase flow loop. For turbulent tests, the heat balance technique is the less accurate, and usually under predicts the deposit thickness. The LD-LD technique is the most accurate, but seems inconsistent in some of the tests.
• Comparing the Garden Banks test to the South Pelto test with the same Qo=1500 BPD and ∆T=30°F shows that the deposit thickness is higher for South Pelto crude oil. There is no significant difference for the tests with Qo = 1000 BPD and ∆T = 15°F. The wax content in the deposit is higher for the Garden Banks tests. Fluid properties are significantly different between Garden Banks condensate and South Pelto crude oil and therefore the actual deposition conditions are different.
INVESTIGATION OF HEAVY OIL SINGLE-PHASE PARAFFIN DEPOSITION CHARACTERISTICS
Introduction The objective of this study is to investigate paraffin deposition phenomena for single-phase
flowing conditions with a heavy oil and compare its deposition characteristics with other fluids. The study includes experimental data gathering for a heavy fluid, data processing, modeling, and comparison of predictive models for deposition rates in single-phase conditions.
Experimental Results
Test Matrices
Cote Blanche Island (CBI) crude oil was used to study the effect of heavy oils on paraffin deposition. Based on the fluid properties, a test matrix was designed with a total of 13 tests to study the following:

78
• Effect of ∆T • Effect of flow rate • Effect of oil inlet temperature • Effect of deposition time
Table 25 shows the resulting test matrix.
Table 25 - Test Matrix for Cote Blanche Island (CBI) Crude Oil Test Number Test Code Variable
∆T Effect Qoil = 1500 BPD, Toil = 85°F, Qgl = 2000 BPD, 24 hrs
3 WAX2003-012 15°F ∆T 4 WAX2003-011 30°F ∆T 5 WAX2003-008 45°F ∆T
Flow Rate Effect Toil = 85°F, ∆T = 30°F, Qgl = 2000 BPD, 24 hrs
6 WAX2003-016 200 BPD 7 WAX2003-013 600 BPD 8 WAX2003-025 900 BPD 9 WAX2002-040 1200 BPD 4 WAX2003-011 1500 BPD
10 WAX2003-029 1650 BPD Deposition Time Effect
Qoil = 1500 BPD, Toil = 85°F, Qgl = 2000 BPD, ∆T = 30°F 11 WAX2003-026 3 hrs 12 WAX2003-027 12 hrs 4 WAX2003-011 24 hrs
4R WAX2003-041 24 hrs 13 WAX2003-022 96 hrs
Deposition Time Effect Qoil = 1500 BPD, Toil = 85°F, Qgl = 2000 BPD, ∆T = 40°F
14 WAX2003-053 3 hrs 5 WAX2003-008 24 hrs
15 WAX2003-033 96 hrs Qoil = 1500 BPD, ∆T = 30°F , Qgl = 2000 BPD, 24 hrs
16 WAX2003-037 75°F 4 WAX2003-011 85°F
17 WAX2003-038 95°F
Cote Blanche Island (CBI) Tests
Effect of ∆T
Three tests were run to study the effect of ∆T (see Table 29, Tests 3, 4, 4R, 5). The ∆T effect, based on Fick’s law of diffusion can be observed in Table 26. The following assumptions were made: the wall temperature is equal to the glycol temperature; the diffusion coefficient is a constant (fluid dependent) over the oil viscosity (Hernandez 2002); and, the temperature gradient (dT/dr) is proportional to ∆T.
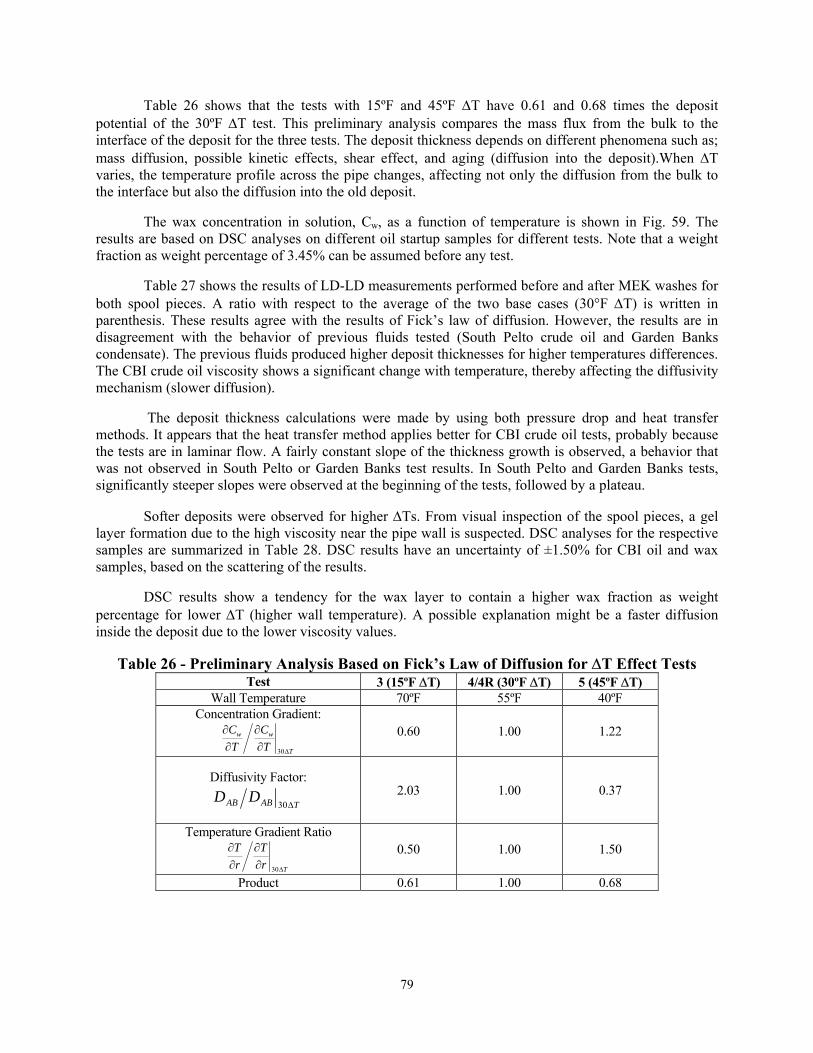
79
Table 26 shows that the tests with 15ºF and 45ºF ∆T have 0.61 and 0.68 times the deposit potential of the 30ºF ∆T test. This preliminary analysis compares the mass flux from the bulk to the interface of the deposit for the three tests. The deposit thickness depends on different phenomena such as; mass diffusion, possible kinetic effects, shear effect, and aging (diffusion into the deposit).When ∆T varies, the temperature profile across the pipe changes, affecting not only the diffusion from the bulk to the interface but also the diffusion into the old deposit.
The wax concentration in solution, Cw, as a function of temperature is shown in Fig. 59. The results are based on DSC analyses on different oil startup samples for different tests. Note that a weight fraction as weight percentage of 3.45% can be assumed before any test.
Table 27 shows the results of LD-LD measurements performed before and after MEK washes for both spool pieces. A ratio with respect to the average of the two base cases (30°F ∆T) is written in parenthesis. These results agree with the results of Fick’s law of diffusion. However, the results are in disagreement with the behavior of previous fluids tested (South Pelto crude oil and Garden Banks condensate). The previous fluids produced higher deposit thicknesses for higher temperatures differences. The CBI crude oil viscosity shows a significant change with temperature, thereby affecting the diffusivity mechanism (slower diffusion).
The deposit thickness calculations were made by using both pressure drop and heat transfer methods. It appears that the heat transfer method applies better for CBI crude oil tests, probably because the tests are in laminar flow. A fairly constant slope of the thickness growth is observed, a behavior that was not observed in South Pelto or Garden Banks test results. In South Pelto and Garden Banks tests, significantly steeper slopes were observed at the beginning of the tests, followed by a plateau.
Softer deposits were observed for higher ∆Ts. From visual inspection of the spool pieces, a gel layer formation due to the high viscosity near the pipe wall is suspected. DSC analyses for the respective samples are summarized in Table 28. DSC results have an uncertainty of ±1.50% for CBI oil and wax samples, based on the scattering of the results.
DSC results show a tendency for the wax layer to contain a higher wax fraction as weight percentage for lower ∆T (higher wall temperature). A possible explanation might be a faster diffusion inside the deposit due to the lower viscosity values.
Table 26 - Preliminary Analysis Based on Fick’s Law of Diffusion for ∆T Effect Tests Test 3 (15ºF ∆T) 4/4R (30ºF ∆T) 5 (45ºF ∆T)
Wall Temperature 70ºF 55ºF 40ºF Concentration Gradient:
T
ww
TC
TC
∆∂∂
∂∂
30
0.60 1.00 1.22
Diffusivity Factor:
TABAB DD∆30
2.03 1.00 0.37
Temperature Gradient Ratio
TrT
rT
∆∂∂
∂∂
30
0.50 1.00 1.50
Product 0.61 1.00 0.68

80
Table 27 - LD-LD Measurements for ∆T Effect Tests Test 3 (15ºF ∆T) (mm) 4 / 4R (30ºF ∆T) (mm) 5 (45ºF ∆T) (mm) Spool Piece 1 0.50 (0.76) 0.70 / 0.62 0.37 (0.56) Spool Piece 2 0.19 (0.53) 0.43 / 0.29 0.26 (0.72) Average 0.35 (0.69) 0.56 / 0.45 0.31 (0.61) Spool Piece 1 After MEK 0.50 (0.96) 0.58 / 0.46 0.19 (0.37) Spool Piece 2 After MEK 0.19 (1.65) 0.12 / 0.11 0.06 (0.52) Average After MEK 0.34 (1.08) 0.35 / 0.28 0.12 (0.38)
Table 28 - Deposit Wax Fraction Measurements for ∆T Effect Tests Test 3 (%)
(15ºF ∆T) 4/4R (%) (30ºF ∆T)
5 (%) (45ºF ∆T)
Spool Piece 1 Wax Fraction as Weight Percentage 33.77 7.93 6.19 Spool Piece 2 Wax Fraction as Weight Percentage 27.41 5.32 5.79 Average Wax Fraction as Weight Percentage 30.59 6.63 5.99
0.0
0.5
1.0
1.5
2.0
2.5
3.0
3.5
4.0
20 40 60 80 100 120 140Temperature, °F
Wax
frac
tion
as W
eigh
t Per
cent
age
(Cw),
%
0
0.01
0.02
0.03
0.04
0.05
0.06
0.07
0.08
0.09
0.1
dCw/d
T
Cw dCw/dT
Figure 59 - Cw and dCw/dT vs. T for Cote Blanch Island (CBI) Crude Oil
Effect of Flow Rate
The flow rate effect on paraffin deposition was studied with tests 6, 7, 8, 9, 4, 4R, and 10 (see Table 25). ∆T and oil inlet temperature were fixed, while the flow rate was varied within the laminar region. Based on Fick’s Law, the main difference between the tests comes from the different temperature gradients inside the pipe, assuming the same viscosity for all the tests. LD-LD results from the different tests are shown in Table 29, versus flow rate for measurements before and after MEK washes.
The effect of flow rate on the deposition was not evident based on LD-LD measurements. Previous results with South Pelto crude oil in laminar flow showed a similar trend (Hernandez 2002).

81
Results before and after the MEK wash, together with DSC analyses on the samples, confirm the previous statement for the laminar flow region. A slight increase in the wax fraction as weight percentage seems to occur in the transition region.
Table 29 - LD-LD Measurements for Flow Rate Effect Tests Test 6 (mm)
(200 BPD) 7 (mm)
(600 BPD) 8 (mm)
(900 BPD) 9 (mm)
(1200 BPD) 4 / 4R (mm) (1500 BPD)
10 (mm) (1650 BPD)
Spool Piece 1 0.71 0.53 0.52 0.71 0.35 / 0.28 0.43 Spool Piece 2 0.37 0.23 0.23 0.30 0.12 / 0.11 0.16 Average 0.54 0.38 0.38 0.50 0.58 / 0.46 0.30 Spool Piece 1 After MEK 0.52 0.46 0.26 0.44 0.56 / 0.45 0.31 Spool Piece 2 After MEK 0.23 0.25 0.00 0.17 0.43 / 0.29 0.08 Average After MEK 0.37 0.35 0.44 0.31 0.70 / 0.62 0.20 Effect of Deposition Time
The deposition time effect was studied by completing five tests with the same conditions but different deposition times varying from 3 hours to 96 hours (tests 11, 11R, 12, 4, 4R, 13, 14, 5 and 15). Two ∆Ts, 30ºF and 40ºF, were chosen for comparison purposes.
An analysis based on Fick’s Law was performed to compare the deposit potential of the different tests. The 30ºF ∆T test was taken as the reference. Results are shown in Table 30. According to the analysis, lower flow rates are expected with 40ºF ∆T by a factor of 0.60 compared to those with 30ºF ∆T due to the lower viscosity at the lower wall temperature. However, due to the lower diffusion inside the deposit, higher fraction of the flux will contribute to deposit growth.
The LD-LD results are shown in Table 31. A change in the slope seems to occur between 24 and 96 hours. Different phenomena may contribute to the deposit growth decrease, including: insulation effect (smaller temperature gradient at the interface) due to a thicker deposit and/or increment of wax fraction inside the deposit; shear effect, as a mechanical removal mechanism due to a hydraulic diameter reduction; or, depletion problems due to the reduced amount of wax crystals available for deposit at the test conditions.
A comparison of the results between 30ºF ∆T and 40ºF ∆T was made. Although the measured differences are appreciable, they do not reflect the predictions expected, based on the Fick’s law (see Table 34). This suggests that other phenomena may be playing important roles during deposition, such as aging, shear, kinetics, etc. Only the result after 24 hours follows the analysis where measurements for the 40ºF ∆T represent approximately 0.6 times the value of the 30ºF ∆T test.
As expected, an increase in deposit wax fraction as weight percentage occurred with increasing deposition time. The data have the same characteristics as the deposit thickness, where different slopes were observed between the first 24 hours and after. The values after 3 hours, before and after MEK wash, indicate the existence of a high oil content layer at the pipe wall, possibly due to the temperature gradient. This layer seems to enrich itself with wax over time. Values after 3 hours with 40°F ∆T are missing due to the quality of the sample. The depletion effect was considered by measuring the wax content in the oil after shutdown. Wax content values of 2.72% were encountered, representing a reduction of 20% from the original oil.

82
Table 30 - Preliminary Analysis Based on Fick’s Law of Diffusion for Deposition Time Effect Tests
11 / 11R(3 hrs)
12 (12 hrs)
4 / 4R (24 hrs)
13 (96 hrs)
14 (3 hrs)
5 (24 hrs)
15 (96 hrs) Tests
Tests at 30°F ∆T Tests at 40°F ∆T Wall Temperature 55ºF 55ºF 55ºF 55ºF 45ºF 45ºF 45ºF Concentration gradient:
T
ww
TC
TC
∆∂∂
∂∂
30
1.00 1.00 1.00 1.00 1.22 1.22 1.22
Diffusivity Factor:
TABAB DD∆30
1.00 1.00 1.00 1.00 0.37 0.37 0.37
Temperature Gradient Ratio
TrT
rT
∆∂∂
∂∂
30
1.00 1.00 1.00 1.00 1.33 1.33 1.33
Product 1.00 1.00 1.00 1.00 0.60 0.60 0.60
Table 31 - LD-LD Measurements for Deposition Time Effect Tests 11 / 11R (mm)
(3 hrs) 12 (mm) (12 hrs)
4 / 4R (mm) (24 hrs)
13 (mm) (96 hrs)
14 (mm) (3 hrs)
5 (mm) (24 hrs)
15 (mm) (96 hrs) Test
Tests at 30°F ∆T Tests at 40°F ∆T Spool Piece 1 0.46/0.37 0.36 0.70/0.62 0.94 0.38 0.37 1.31 Spool Piece 2 0.13/0.10 0.32 0.43/0.29 0.75 0.18 0.33 0.50
Average 0.30/0.23 0.34 0.56/0.45 0.84 0.28 0.35 0.91 Spool Piece 1 After MEK 0.00/0.12 0.33 0.58/0.46 0.70 0.09 0.60 1.15
Spool Piece 2 After MEK 0.00/0.00 0.00 0.12/0.11 0.71 0.00 0.06 0.29
Average After MEK 0.00/0.06 0.17 0.35/0.28 0.70 0.05 0.33 0.72
Effect of Oil Inlet Temperature
The effect of oil inlet temperature on deposition was studied with Tests 16, 4, 4R and 17. The flow rate and ∆T were constant, while the oil inlet temperature varied. The deposition potential was compared with a base case according to Fick’s law of diffusion. The results are summarized in Table 32.
Higher deposition rates are expected as the oil inlet temperature increases compared to the reference case (85°F oil inlet temperature) due to the higher difference between bulk and wall viscosities, which affects the diffusion phenomena. However, faster diffusion inside the deposit takes place due to the lower viscosity (higher temperature) resulting in higher wax fractions in the deposits. LD-LD results in Table 33 shows thicker deposits for the base case, suggesting an important effect of phenomena such as aging on the deposition process as explained in previous analyses. Numbers in parenthesis represent the ratio between the base case and the studied test.
Comparing measurements before and after the MEK wash, higher oil contents were observed at lower temperatures. For the 75ºF oil inlet temperature test, nearly 50% of the deposit was removed with the MEK wash, compared with 20% removed for the 85ºF oil inlet temperature case. For the third case, the deposit thickness measurement remained within the error band of the measurement before the MEK wash. These results were confirmed with DSC analyses of the samples.

83
The different deposit thicknesses observed show a dependence on the oil inlet temperature. This phenomenon was not clearly observed during the South Pelto oil tests (Lund 1998) where no significant differences in the thickness were measured among tests at 125, 105 and 85ºF. Same characteristics for deposit growth as in previous tests were observed such as constant slope and near horizontal curves.
The wax content of the deposit samples, based on DSC analyses, is shown in Table 34, and show tendencies for higher wax fractions as weight percentage at higher oil inlet temperatures. The results confirm the hypothesis of higher wax fractions in the deposits at higher temperatures, possibly due to the lower viscosities.
Table 32 - Preliminary Analysis Based on Fick’s Law of Diffusion for Oil Inlet Temperature Effect Tests
Test 16 (Toil = 75ºF ) 4 / 4R (Toil = 85ºF ) 17 (Toil = 95ºF ) Wall Temperature 45ºF 55ºF 65ºF
Concentration gradient:
T
ww
TC
TC
∆∂∂
∂∂
30
1.16 1.00 0.74
Diffusivity Factor:
TABAB DD∆30
0.53 1.00 1.64
Temperature Gradient Ratio
TrT
rT
∆∂∂
∂∂
30 1.00 1.00 1.00
Product 0.61 1.00 1.21
Table 33 - LD-LD Measurements for Oil Inlet Temperature Effect Tests Test
16 (mm) (75ºF Toil)
4 / 4R (mm) (85ºF Toil)
17 (mm) (95ºF Toil)
Spool Piece 1 0.49 (0.75) 0.70 / 0.62 0.35 (0.54)
Spool Piece 2 0.06 (0.17) 0.43 / 0.29 0.05 (0.13)
Average 0.28 (0.54) 0.56 / 0.45 0.20 (0.39)
Spool Piece 1 After MEK 0.24 (0.47) 0.58 / 0.46 0.30 (0.59)
Spool Piece 2 After MEK 0.00 (0.00) 0.12 / 0.11 0.04 (0.31)
Average After MEK 0.12 (0.38) 0.35 / 0.28 0.17 (0.54)

84
Table 34 - Wax Fraction Measurements for Oil Inlet Temperature Effect Tests Test
16 (mm) (75ºF Toil)
4 / 4R (mm) (85ºF Toil)
17 (mm) (95ºF Toil)
Spool Piece 1 4.82 7.93 21.22
Spool Piece 2 4.65 5.32 14.77 Average 4.74 6.63 18.00
Conclusions • CBI crude oil produced deposits with relatively high oil contents. The deposit was uniform across
the pipe.
• Thickness calculations using the heat transfer method were found to apply better than the pressure drop method for CBI crude oil in the laminar regime.
• The viscosity dependence on temperature has a significant impact on the diffusivity phenomena for CBI crude oil when compared with Garden Banks condensate and South Pelto crude oil.
• Wax deposition is confirmed to be highly dependent on the temperature difference between the bulk and the pipe wall.
• Oil inlet temperature affects oil fluid properties such as viscosity and thermal conductivity. The effect of oil temperature on the paraffin deposition is evidenced in the diffusivity coefficient.
• No evidence of significant depletion with CBI crude oil was detected up to 96 hours of testing.
• No significant effect of flow rate in the laminar regime was observed on the deposition phenomena. The deposit thickness and wax fraction remained within the 0.15 mm and 8% range, respectively.
• Wax content was highly dependent on fluid temperature during the tests. Higher wax fractions were measured for higher temperatures.
MODEL VALIDATION Caratinga oil is used as the model validation oil. Four different tests were performed. These tests
are discussed below.
Test 1 The objective of this test was to study paraffin deposition phenomena near the first DSC peak
(116°F (47°C)). Due to the oil and glycol inlet temperatures, the viscosity of the oil varied over a range of 40-80 cP.
The oil outlet temperature remained constant, indicating zero deposit build up. A constant pressure drop was measured for each segment, as well as overall, again indicating that no deposition was taking place inside the pipe.
LD-LD results for Test 1 are summarized in Table 35. Considerably lower values for deposit thickness were measured when compared with the results for the previous oils (CBI oil, South Pelto oil

85
and Garden Banks condensate). Most of the measurements were within the uncertainty range of the device.
From visual inspection, a uniform-black-thin gel was observed on the pipe wall. Analyses of DSC tests for the oil and wax samples are not yet available.
Table 35 - LD-LD Results for Test 1 Measurement 1 (mm) Measurement 2 (mm) Average (mm)
Spool Piece 1 0.05 0.06 0.055 Spool Piece 2 0.17 0.06 0.115
Test 2 The objective of this test was to study paraffin deposition phenomena in the temperature range
between the DSC peaks. Viscosities between 35cP and 225cP were expected for the oil based on the oil inlet and glycol temperatures.
The same behavior as in Test 1 was observed during Test 2. Oil outlet temperatures and pressure drops remained constant during the testing period. A black-uniform-thin layer was observed on the pipe wall when the spool pieces were removed. The layer was soft and very similar to the oil. Results from the DSC analyses are not yet available.
LD-LD results are summarized in Table 36. Small thicknesses of the deposit within the uncertainty range of the device were measured.
Table 36 - LD-LD Results for Test 2 Measurement 1 (mm) Measurement 2 (mm) Average (mm)
Spool Piece 1 0.12 0.15 0.135 Spool Piece 2 0.02 0.02 0.020
Test 3 The objective of this test was to study paraffin deposition phenomena near the second DSC peak.
Due to the temperature range of the oil (between the oil inlet temperature and the glycol temperature), oil viscosities between 189 cP and 740 cP were expected.
The outlet temperature remained stable through the entire testing period, indicating no deposition inside the test section. However, a slight increase of 10-in. H2O was observed in the overall pressure drop.
Visual inspection of the spool pieces showed a soft, thin oil layer on the pipe wall. LD-LD measurements in both spool pieces indicate a deposit thickness less than 0.3 mm. The results are summarized in Table 37. DSC analyses are still in progress for the oil and wax samples.
Table 37 - LD-LD Results for Test 3 Measurement
1 (mm) Measurement
2 (mm) Measurement
3 (mm) Measurement
4 (mm) Average
(mm) Spool Piece 1 0.21 0.21 0.52 0.23 0.293 Spool Piece 2 0.12 0.12 0.17 --- 0.137
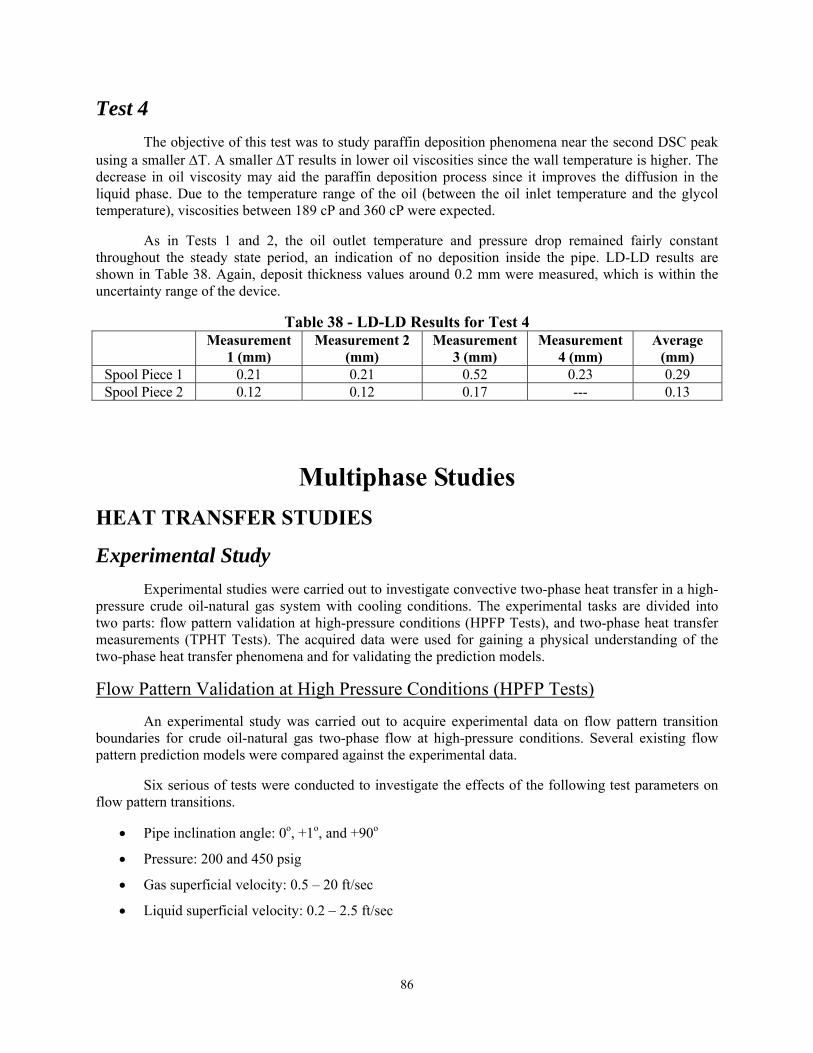
86
Test 4 The objective of this test was to study paraffin deposition phenomena near the second DSC peak
using a smaller ∆T. A smaller ∆T results in lower oil viscosities since the wall temperature is higher. The decrease in oil viscosity may aid the paraffin deposition process since it improves the diffusion in the liquid phase. Due to the temperature range of the oil (between the oil inlet temperature and the glycol temperature), viscosities between 189 cP and 360 cP were expected.
As in Tests 1 and 2, the oil outlet temperature and pressure drop remained fairly constant throughout the steady state period, an indication of no deposition inside the pipe. LD-LD results are shown in Table 38. Again, deposit thickness values around 0.2 mm were measured, which is within the uncertainty range of the device.
Table 38 - LD-LD Results for Test 4 Measurement
1 (mm) Measurement 2
(mm) Measurement
3 (mm) Measurement
4 (mm) Average
(mm) Spool Piece 1 0.21 0.21 0.52 0.23 0.29 Spool Piece 2 0.12 0.12 0.17 --- 0.13
Multiphase Studies HEAT TRANSFER STUDIES
Experimental Study Experimental studies were carried out to investigate convective two-phase heat transfer in a high-
pressure crude oil-natural gas system with cooling conditions. The experimental tasks are divided into two parts: flow pattern validation at high-pressure conditions (HPFP Tests), and two-phase heat transfer measurements (TPHT Tests). The acquired data were used for gaining a physical understanding of the two-phase heat transfer phenomena and for validating the prediction models.
Flow Pattern Validation at High Pressure Conditions (HPFP Tests)
An experimental study was carried out to acquire experimental data on flow pattern transition boundaries for crude oil-natural gas two-phase flow at high-pressure conditions. Several existing flow pattern prediction models were compared against the experimental data.
Six serious of tests were conducted to investigate the effects of the following test parameters on flow pattern transitions.
• Pipe inclination angle: 0o, +1o, and +90o
• Pressure: 200 and 450 psig
• Gas superficial velocity: 0.5 – 20 ft/sec
• Liquid superficial velocity: 0.2 – 2.5 ft/sec
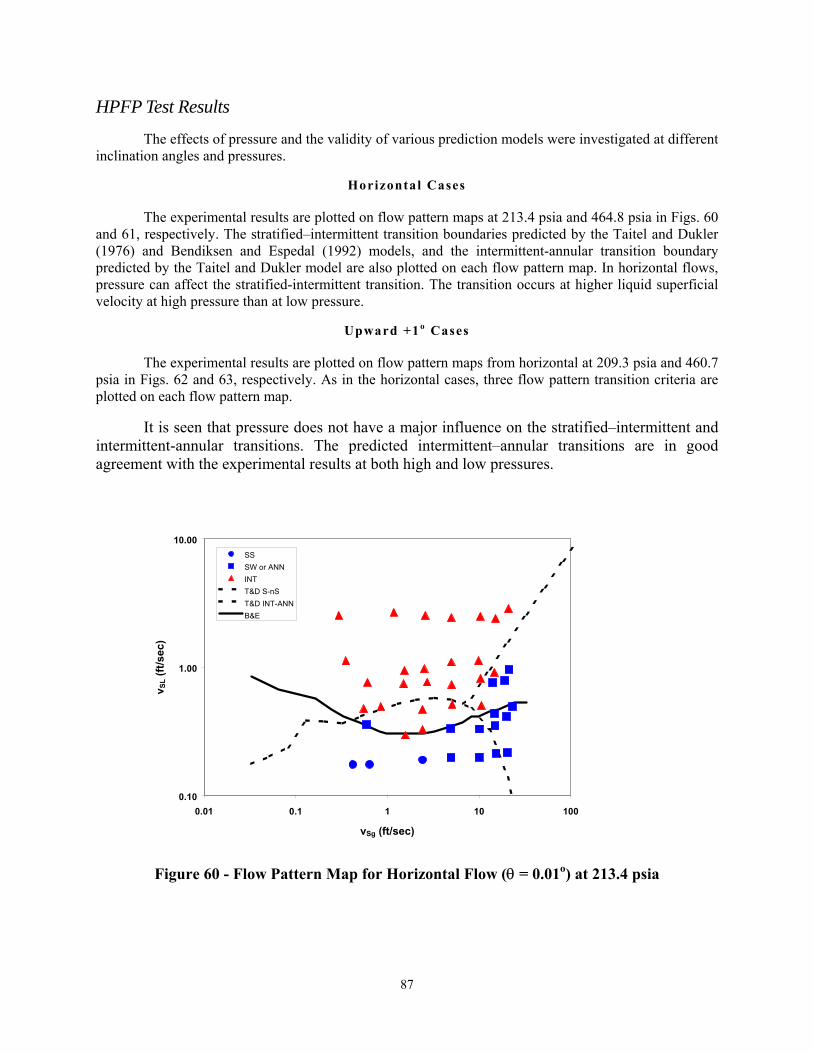
87
HPFP Test Results
The effects of pressure and the validity of various prediction models were investigated at different inclination angles and pressures.
Horizontal Cases
The experimental results are plotted on flow pattern maps at 213.4 psia and 464.8 psia in Figs. 60 and 61, respectively. The stratified–intermittent transition boundaries predicted by the Taitel and Dukler (1976) and Bendiksen and Espedal (1992) models, and the intermittent-annular transition boundary predicted by the Taitel and Dukler model are also plotted on each flow pattern map. In horizontal flows, pressure can affect the stratified-intermittent transition. The transition occurs at higher liquid superficial velocity at high pressure than at low pressure.
Upward +1o Cases
The experimental results are plotted on flow pattern maps from horizontal at 209.3 psia and 460.7 psia in Figs. 62 and 63, respectively. As in the horizontal cases, three flow pattern transition criteria are plotted on each flow pattern map.
It is seen that pressure does not have a major influence on the stratified–intermittent and intermittent-annular transitions. The predicted intermittent–annular transitions are in good agreement with the experimental results at both high and low pressures.
0.10
1.00
10.00
0.01 0.1 1 10 100
vSg (ft/sec)
v SL (
ft/se
c)
SSSW or ANNINTT&D S-nST&D INT-ANNB&E
Figure 60 - Flow Pattern Map for Horizontal Flow (θ = 0.01o) at 213.4 psia
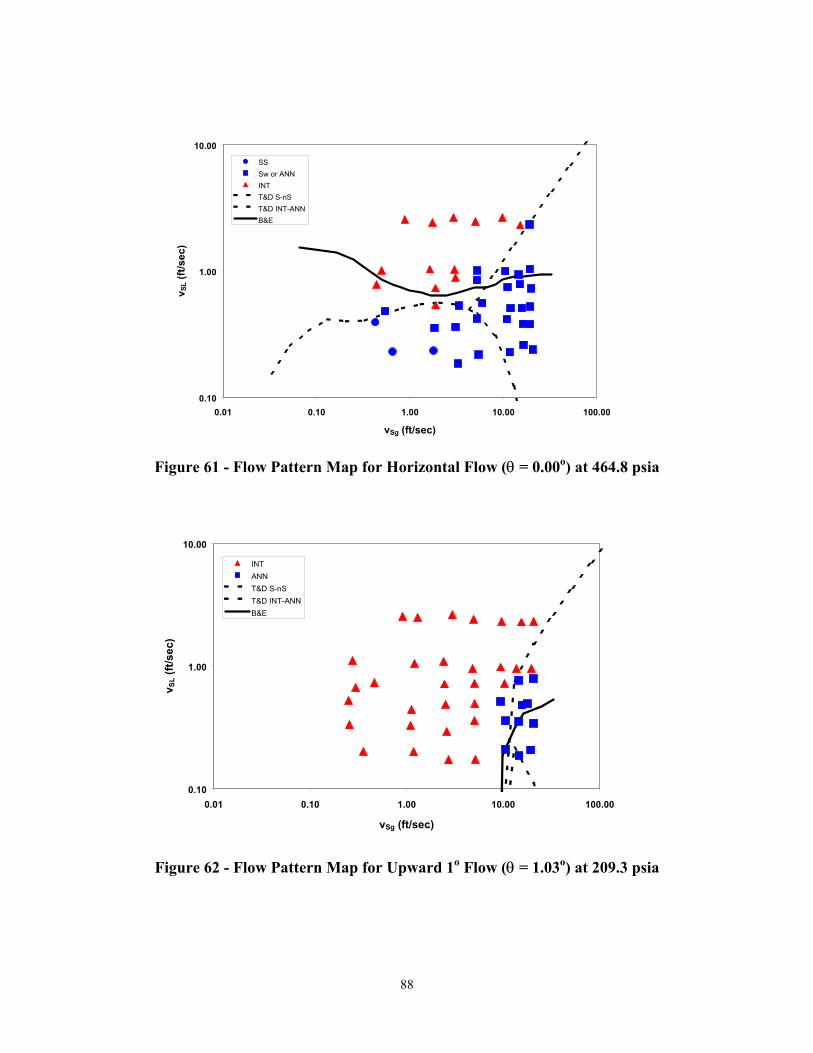
88
0.10
1.00
10.00
0.01 0.10 1.00 10.00 100.00
vSg (ft/sec)
v SL (
ft/se
c)
SSSw or ANNINTT&D S-nST&D INT-ANNB&E
Figure 61 - Flow Pattern Map for Horizontal Flow (θ = 0.00o) at 464.8 psia
0.10
1.00
10.00
0.01 0.10 1.00 10.00 100.00
vSg (ft/sec)
v SL (
ft/se
c)
INTANNT&D S-nST&D INT-ANNB&E
Figure 62 - Flow Pattern Map for Upward 1o Flow (θ = 1.03o) at 209.3 psia

89
0.10
1.00
10.00
0.01 0.10 1.00 10.00 100.00
vSg (ft/sec)
v SL (
ft/se
c)INT
ANN
T&DS-nS
T&D INT-ANN
B&E
Figure 63 - Flow Pattern Map for Upward 1o Flow (θ = 1.03o) at 460.7 psia
Upward Vert ical Cases
The experimental results are plotted on flow pattern maps at 211.4 psia and 465.3 psia in Figs. 64 and 65, respectively. Three criteria for the intermittent-annular flow transition, Taitel et al. (1980), Barnea (1987) film instability, and Barnea (1987) bridging, are plotted on each flow pattern map. The transition occurs at slightly lower gas superficial velocity at high-pressure conditions than at low pressure. The combined Barnea criteria, based on instability of the liquid film and critical liquid holdup, predict the transition boundary at both pressures.

90
0.10
1.00
10.00
0.01 0.10 1.00 10.00 100.00
vSg (ft/sec)
v SL (
ft/se
c)SLUGANNTaitelBarnea Wave GrowthBarnea Film Stability
Figure 64 - Flow Pattern Map for Upward Vertical Flow (θ = 90.00o) at 211.4 psia
0.10
1.00
10.00
0.01 0.10 1.00 10.00 100.00
vSg (ft/sec)
v SL (
ft/se
c)
INTANNTaitelBarnea Wave GrowthBarnea Film Stability
Figure 65 - Flow Pattern Map for Upward Vertical Flow (θ = 90.00o) at 465.3 psia

91
Two-Phase Heat Transfer Measurements
Time and space averaged two-phase convective heat transfer coefficients were measured for crude oil-natural gas systems at high-pressure with cooling conditions. The acquired experimental data were used for gaining physical understanding of the phenomena and evaluating the newly developed mechanistic heat transfer models.
Heat Transfer Measurement
Average convective heat transfer coefficients are determined by a heat balance based on heat flux measurements Manabe (2001).
A hot crude oil-natural gas mixture (about 140oF) flows in the internal pipe of the jacketed test section, and chilled glycol mixture (120oF) flows counter current in the jacket to maintain a cold pipe wall temperature. The inlet and outlet temperatures for both the two-phase mixture and glycol mixture were measured during the test duration (10 min) after the flow became steady hydrodynamically and thermally.
The heat transfer measurements section is specially designed to measure the bulk temperature of the two-phase mixture. This is because of non-uniform phase distribution and the existence of temperature differences between the two phases. In order to obtain accurate bulk temperatures for each flow pattern, the measurements include eight two-phase mixture temperature measurements (TF1, TF2, TF3, TT29, TT34, TT39, TT44 and TT49), five glycol temperature measurements (TT30, TT35, TT40, TT4 and TT50), and five outside wall temperature measurements (TW1, TW2, TW3, TW and TW5). A schematic diagram of the heat transfer measurement section is given in Fig. 66.
TT30TT35TT40TT45TT50
TT29
TT34
TT39
TT44TF1
TF2
TF3
TW1
TW2
TW3
TW4
TW5
TT49
5.0197 ft(1.53 m)
1/2
1/2
Glycol
5.0197 ft(1.53 m)
5.0197 ft(1.53 m)
5.0197 ft(1.53 m)
0.197 ft(0.06 m)
0.20 in.
0.69 in.
1.38 in.
2.00 in.
45o
Figure 66 - Schematic Diagram of Heat Transfer Measurement Section
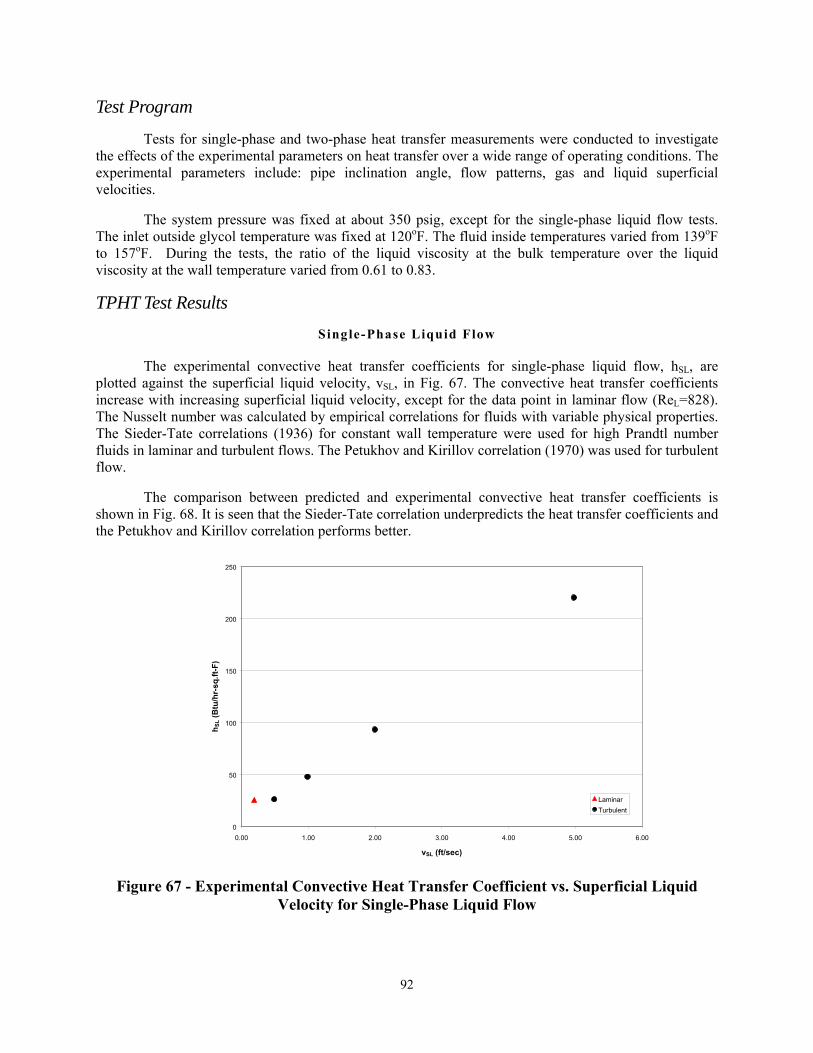
92
Test Program
Tests for single-phase and two-phase heat transfer measurements were conducted to investigate the effects of the experimental parameters on heat transfer over a wide range of operating conditions. The experimental parameters include: pipe inclination angle, flow patterns, gas and liquid superficial velocities.
The system pressure was fixed at about 350 psig, except for the single-phase liquid flow tests. The inlet outside glycol temperature was fixed at 120oF. The fluid inside temperatures varied from 139oF to 157oF. During the tests, the ratio of the liquid viscosity at the bulk temperature over the liquid viscosity at the wall temperature varied from 0.61 to 0.83.
TPHT Test Results Single-Phase Liquid Flow
The experimental convective heat transfer coefficients for single-phase liquid flow, hSL, are plotted against the superficial liquid velocity, vSL, in Fig. 67. The convective heat transfer coefficients increase with increasing superficial liquid velocity, except for the data point in laminar flow (ReL=828). The Nusselt number was calculated by empirical correlations for fluids with variable physical properties. The Sieder-Tate correlations (1936) for constant wall temperature were used for high Prandtl number fluids in laminar and turbulent flows. The Petukhov and Kirillov correlation (1970) was used for turbulent flow.
The comparison between predicted and experimental convective heat transfer coefficients is shown in Fig. 68. It is seen that the Sieder-Tate correlation underpredicts the heat transfer coefficients and the Petukhov and Kirillov correlation performs better.
0
50
100
150
200
250
0.00 1.00 2.00 3.00 4.00 5.00 6.00
vSL (ft/sec)
h SL (
Btu
/hr-
sq.ft
-F)
LaminarTurbulent
Figure 67 - Experimental Convective Heat Transfer Coefficient vs. Superficial Liquid
Velocity for Single-Phase Liquid Flow

93
0
50
100
150
200
250
0 50 100 150 200 250
Experimental hSL (Btu/hr-ft2-oF)
Pred
icte
d h S
L (B
tu/h
r-ft2 -o F)
Laminar - Sieder-TateTurbulent - Petukhov-KirillovTurbulent - Sieder-Tate0%-10%10%
Figure 68 - Comparison between Predicted and Experimental Convective Heat Transfer Coefficients for Single-Phase Liquid Flow
Single-Phase Gas Flow
The experimental convective heat transfer coefficients for single-phase turbulent gas flow (Reg>40664), hSg, are presented in Fig. 69. hSg increase with increasing superficial gas velocity. The Nusselt number is calculated using the Dittus-Boelter (1930) correlation for turbulent flow with constant fluid properties. A good agreement between the predicted and experimental convective heat transfer coefficients is observed (Fig. 70).
0.00
20.00
40.00
60.00
80.00
100.00
120.00
140.00
160.00
0.00 5.00 10.00 15.00 20.00 25.00 30.00 35.00
vSg (ft/sec)
h Sg (
Btu
/hr-
sq.ft
-F)
Figure 69 - Experimental Convective Heat Transfer Coefficient vs. Superficial Gas Velocity for Single-Phase Gas Flow

94
0
30
60
90
120
150
0 30 60 90 120 150
Experimental hTP (Btu/hr-ft2-oF)
Pred
icte
d h T
P (B
tu/h
r-ft2 -o F)
+10%
-10%
Figure 70 - Comparison between Predicted and Experimental Convective Heat Transfer Coefficients for Single-Phase Gas Flow
Vertical Two-Phase Flow
Experimental convective two-phase heat transfer coefficients, hTP, are plotted against superficial gas velocities at fixed superficial liquid velocity in Fig. 71 for vertical two-phase flow. In general, higher hTP values are obtained for higher vSL values at the same vSg. In the bubbly flow region, hTP increases slightly with increasing vSg at fixed vSL. In the intermittent flow region, however, hTP remains almost constant as vSg increases until the intermittent-annular transition boundary is reached. At the intermittent-annular transition boundary, hTP increases at relatively low vSL and decreases for relatively high vSL. In the annular flow region, hTP increases again as vSg increases at fixed vSL.
The enhancements of convective heat transfer coefficient in two-phase flow due to the addition of a gas phase, defined as hTP/hSL, are plotted against the gas-liquid superficial velocity ratio, vSg/vSL in Fig. 72. hTP/hSL values increase slightly from bubbly to intermittent flow and increase significantly in the annular flow region.

95
0.00
50.00
100.00
150.00
200.00
250.00
300.00
350.00
0.10 1.00 10.00 100.00
vSg (ft/sec)
h TP
VSL=O,2VSL=0.5VSL=1.0VSL=2.0VSL=2.5VSL=4.0VSL=5.0
AnnularBubbly Intermittent
Figure 71 - Experimental Convective Heat Transfer Coefficients vs. Superficial Gas Velocity for Vertical Two-Phase Flow
1.00
10.00
100.00
0.01 0.10 1.00 10.00 100.00 1000.00
vSg/vSL
h TP/
h SL
VSL=O,2VSL=0.5VSL=1.0VSL=2.0VSL=2.5VSL=4.0VSL=5.0
Figure 72 - Enhancement of Convective Heat Transfer Coefficient vs. Superficial Gas/Liquid Velocity Ratio for Vertical Two-Phase Flow

96
Horizontal Two-Phase Flow
Experimental convective two-phase heat transfer coefficients are plotted against superficial gas velocities at fixed superficial liquid velocities in Fig. 73 for horizontal two-phase flow. The experimental data for horizontal intermittent flow are not available due to inaccurate temperature measurements of TT34 and TT39. In the stratified flow region, hTP increases slightly as vSg increases at a fixed vSL. Similar to vertical annular flow, hTP increases as vSg increases at a fixed vSL for horizontal annular flow.
The enhancements of convective heat transfer coefficient in two-phase flow are plotted against the gas-liquid superficial velocity ratio in Fig. 74. For stratified flow with relatively low vSg/vSL, hTP/hSL is almost constant. For stratified flow with relatively high vSg/vSL, hTP/hSL slightly increases with increasing vSg/vSL. The hTP/hSL increases significantly in the annular flow region (high vSg).
0
50
100
150
200
250
0.10 1.00 10.00 100.00
vSg (ft/sec)
Expe
rimen
tal h
TP (B
tu/h
r-ft2 -o F)
vSL=0.20vSL=0.30vSL=0.50vSL=0.75vSL=1.00vSL=2.00
AnnularStratified
Figure 73 - Convective Heat Transfer Coefficient vs. Superficial Gas Velocity for Horizontal Two-Phase Flow

97
1
10
100
0.10 1.00 10.00 100.00 1,000.00
vSg/vSL
h TP/
h SL
vSL=0.20vSL=0.30vSL=0.50vSL=0.75vSL=1.00vSL=2.00
Figure 74 - Enhancement of Convective Heat Transfer Coefficient vs. Superficial Gas/Liquid Velocity Ratio for Horizontal Two-Phase Flow
Conclusions 1. Experimental data were acquired on flow pattern transitions for horizontal, upward 1o and upward
vertical crude oil-natural gas two-phase flow at high-pressure conditions. Flow pattern transitions are found to be affected by pressure
2. Experimental data on convective heat transfer coefficients were acquired for single-phase liquid flow, single-phase gas flow, horizontal stratified flow, vertical bubbly flow, vertical intermittent flow and horizontal and vertical annular flow.
3. Based on the single-phase heat transfer test results: Single-phase convective heat transfer coefficients for turbulent liquid flow can be predicted by the Petukhov-Kirillov correlation with slight underprediction at high liquid velocity, and single-phase convective heat transfer coefficients for turbulent gas flow can be predicted by the Dittus-Boelter correlation.
4. Based on the vertical two-phase heat transfer test results, the following was found.
a. Larger hTP values are obtained at higher vSL for the same vSg.
b. hTP, in general, increases with increase of vSg at the same vSL.
c. For vertical bubbly flow, hTP slightly increases with increase of vSg at the same vSL.
d. For vertical annular flow, hTP significantly increases with increase of vSg at the same vSL.
e. For vertical intermittent flow, hTP is maintained almost constant with increasing vSg at the same vSL until the intermittent-annular transition.

98
5. Based on the horizontal two-phase heat transfer test results, the following was found.
a. Larger hTP values are obtained at higher vSL for the same vSg.
b. hTP, in general, increases with increasing vSg at the same vSL.
c. For stratified flow, hTP slightly increases with increase of vSg for the same vSL.
d. For annular flow, hTP significantly increases with increase of vSg for the same vSL.
GAS-OIL WATER STUDIES
Experimental Program A total of 23 multiphase tests were conducted on the multiphase flow loop. The multiphase
testing procedure consists of four steps: melting; start-up; steady state; and, shut down.
Twelve tests were run with the old start-up procedure, in which the oil was cooled to the desired test temperature inside the test section. Using this procedure, the gas-oil mixture was sent to the test section at 30 – 40°F above the cloud point temperature (120 – 125°F), and was cooled using coolant glycol until the inlet mixture temperature of 85°F was reached. After 12 experiments, the start-up procedure was changed in order to reduce possible early deposition. In the new start-up procedure (also used by Matzain, 1999), the gas was cooled and then mixed with the oil. After the gas-oil mixture temperature reached the test temperature of 85°F, the mixture was allowed to flow through the test section. Once the test conditions and steady state were achieved, the inlet conditions were maintained for 24 hours. Oil samples were taken every 8 hours for future analysis.
After the test was complete, online LD-LD measurements were performed. Then, the test was shut-down, and the test section was drained with natural gas. Glycol in the annulus was displaced using air. The spool piece was removed, samples taken, and thickness measurements performed using offline LD-LD. At the end of a test, the Garden Banks condensate was heated to a temperature approximately 30°F above the wax appearance temperature (WAT) using the hot glycol system. The condensate was circulated at about 1,500 BPD for approximately 8 hours to melt the deposit.
Deposit Thickness Determination The deposit thickness can be determined by using four different methods. These methods are:
Online and Offline (Spool Piece) LD–LD
One of the most reliable methods used in the multiphase flow loop to determine deposit thickness is the online Liquid Displacement – Level Detection (LD–LD) method. This method is based on the comparison of volumes in the test section and an identical (clean) reference drum, when both are raised to the vertical position. The deposit thickness in the test section is assumed to be uniform both axially and radially. This method has been used in the past and was found to be repeatable within ± 0.2 mm.
A portable LD – LD device allows reliable thickness measurements after shutdown. The principle of the measurement is the same as the online LD–LD, but is applied to the spool piece. The uncertainty of the offline LD-LD is ± 0.05 mm.
The details of both online and offline LD-LD are provided under Single-Phase Studies.

99
Pressure Drop and Heat Transfer Methods
Pressure drop and heat transfer methods were successfully employed to determine the average thickness of the wax layer deposited on the pipe inside wall in single-phase (oil) wax deposition tests. These measurements are useful to demonstrate the growth of the wax layer with time. These techniques were thought to be inadequate for determination of wax thickness under multiphase flow conditions due to the increased inaccuracy of predicting multiphase flow pressure gradients and heat transfer.
Experimental Results A total of 23 multiphase tests (9 horizontal and 14 vertical) were conducted with the multiphase
flow loop with Garden Banks condensate. These 23 tests included 13 original tests, 8 repeat tests and 2 additional high oil flow rate tests. The repeat tests were performed to improve data quality (more stable glycol temperature and gas flow rate), as well as to avoid wax deposition during the start-up phase. The additional two tests were conducted to investigate the effect of high oil superficial velocities on deposit thicknesses in vertical flow. The test conditions involved flowing Tulsa City natural gas and Garden Banks condensate in the test section at horizontal and vertical positions for up to 24 hours. The inlet oil-gas mixture temperature was 85°F for all tests and the inlet glycol-water mixture temperature was 40°F (∆T of 45°F) for 12 tests but 43°F (∆T of 42°F) for the other tests. For the repeat tests, the ∆T had to be slightly reduced to eliminate some temperature fluctuations. The system was under a pressure of 350 psig during all these tests.
The multiphase tests covered a wide range of operating conditions and flow patterns often encountered in multiphase pipelines and wellbores, including stratified-smooth, stratified-wavy, slug and annular flows for horizontal pipes, and intermittent and annular flows for vertical pipes with oil superficial velocities ranging from 0.2 ft/s to 4 ft/s, and gas superficial velocities ranging from 0.5 ft/s to 30 ft/s. The glycol-water mixture flow rate was maintained at 2,000 BPD in all tests.
Results are summarized in Table 39. The multiphase tests showed that the deposit thicknesses are flow pattern dependent. Figures 75 and 76 show all deposit thicknesses from online LD-LD and offline LD-LD devices on horizontal and vertical flow pattern maps.
For horizontal flow, the thickest deposits were produced from the annular flow tests. An average deposit thickness of about 0.3 mm was obtained from both online and offline LD-LD measurements for three intermittent flow tests and one stratified smooth test. The stratified smooth and stratified wavy flow patterns gave soft deposits. Stratified wavy flow deposits were thicker than for stratified smooth flow.

100
Table 39 – Summary of Multiphase Tests with Garden Banks Condensate Test # Vsl
ft/s (m/s)
Vsg ft/s
(m/s)
∆T (ºF)
ReL Reg Inclination Flow Pattern
Online LD-LD (mm)
Offline LD-LD (mm)
WAX2002-008 4 (1.22)
5 (4.57)
45
15945 98723 HORIZ INT - 0.5
WAX2002-009 4 (1.22)
15 (4.57)
45 15945 296186 HORIZ INT 0.3 0.3
WAX2002-010 0.2 (0.06)
30 (9.14)
45 797 592373 HORIZ ANN 0.3 0.9
WAX2002-011 0.2 (0.06)
7 (2.13)
45 797 138220 HORIZ SW 0.6 0.4
WAX2002-012 0.2 (0.06)
1 (0.31)
45 797 19746 HORIZ SS 0.3 0.2
WAX2002-013 4 (1.22)
1 (0.31)
45 15945 19746 HORIZ INT 0.3 0.4
WAX2002-014 2 (0.61)
3 (0.91)
45 7973 59237 VERT INT 0.3 0.5
WAX2002-015 4 (1.22)
30 (9.14)
45 15945 592373 VERT ANN 0.2 0.3
WAX2002-018 0.5 (0.15)
20 (6.10)
45 1993 394915 VERT ANN - 0.9
WAX2003-003 4 (1.22)
0.5 (0.15)
45 15945 9873 VERT BUB
0.3 0.4
WAX2003-006 0.5 (0.15)
1 (0.31)
45 1993 19746 VERT INT 1.1 1.9
WAX2003-007 0.5 (0.15)
4 (1.22)
45 1993 78983 VERT INT 1.2 1.5
WAX2003-014 (REPEAT WAX2003-007)
0.5 (0.15)
4 (1.22)
42 1993 78983 VERT INT 1.1 1.6
WAX2003-015 (REPEAT WAX2002-008)
4 (1.22)
5 (4.57)
42 15945 98723 HORIZ INT 0.3 0.3
WAX2003-018 (REPEAT WAX2002-010)
0.2 (0.06)
30 (9.14)
42 797 592373 HORIZ ANN 0.5 0.8
WAX2003-039 (REPEAT WAX2003-018)
0.2 (0.06)
30 (9.14)
42 797 592373 HORIZ ANN 0.5 1.3
WAX2003-020 (REPEAT WAX2003-006)
0.5 (0.15)
1 (0.31)
42 1993 19746 VERT INT 1.6 1.6
WAX2003-023 (REPEAT WAX2002-014)
2 (0.61)
3 (0.91)
42 7973 59237 VERT INT - 0.6
WAX2003-034 (REPEAT WAX2002-018)
0.5 (0.15)
20 (6.10)
42 1993 394915 VERT ANN 0.9 1.4
WAX2003-035 0.5 (0.15)
30 (9.14)
42 1993 592373 VERT ANN 0.8 1.0
WAX2003-036 (REPEAT WAX2002-015)
4 (1.22)
30 (9.14)
42 15945 592373 VERT ANN 0.2 0.3
WAX2003-047 1 (0.31)
4 (1.22)
42 3986 78983 VERT INT 0.9 1.0
WAX2003-048 2 (0.61)
1 (0.31)
42 7973 19746 VERT INT 0.6 0.7
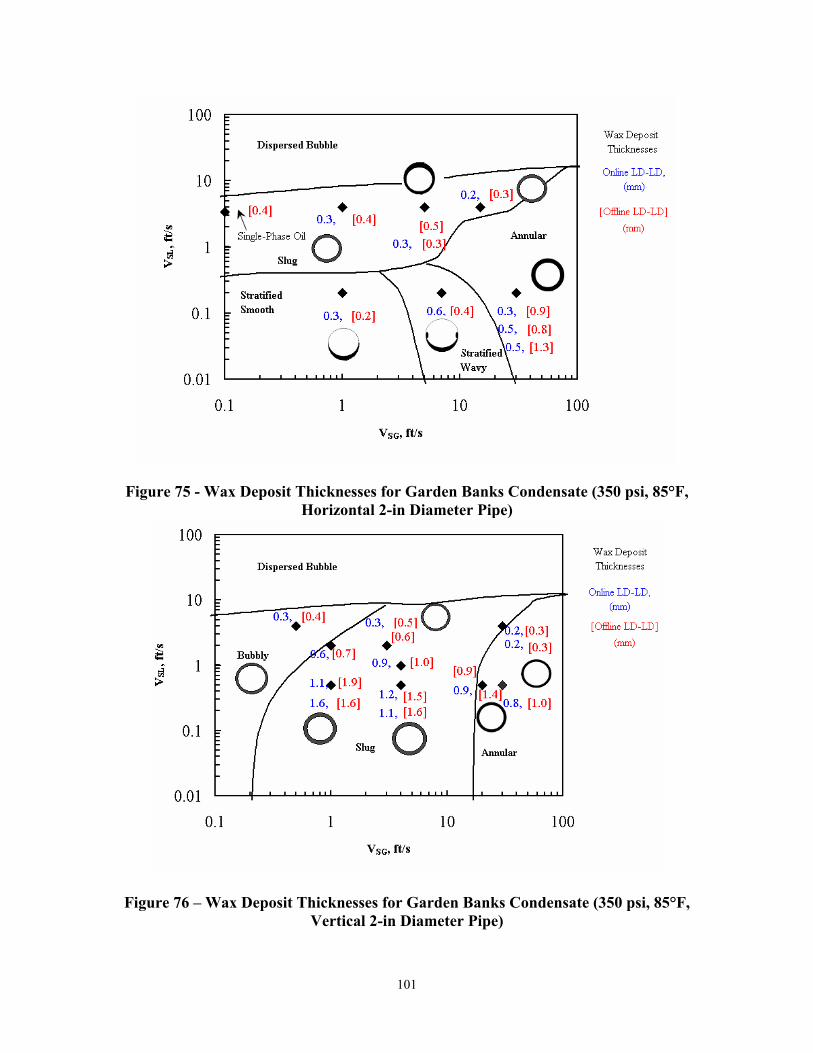
101
Figure 75 - Wax Deposit Thicknesses for Garden Banks Condensate (350 psi, 85°F, Horizontal 2-in Diameter Pipe)
Figure 76 – Wax Deposit Thicknesses for Garden Banks Condensate (350 psi, 85°F, Vertical 2-in Diameter Pipe)

102
Visual Observations
Boroscope pictures of the deposits were taken to qualitatively characterize the deposits. A sample boroscope picture is given in Figure 77 for Test WAX2002-009 showing both a scrape and gas bubbles in the deposit.
For vertical flow, high superficial oil velocities gave lower deposit thicknesses. Bubbly flow and one of the annular flow tests with a high superficial oil velocity produced the thinnest deposits. For intermittent vertical flow tests with lower oil superficial velocity, the deposit thicknesses were very high compared to the rest of the tests. Increasing oil superficial velocity resulted in lower deposit thicknesses for vertical flow. The reasons for these phenomena are still unknown.
The reason that Garden Banks condensate produced thinner deposits than South Pelto oil at the same test conditions can partially be explained by the effects of oil viscosity and wax content. The viscosities of Garden Banks condensate and South Pelto oil are 2.8 cp and 6.8 cp, respectively at 85 ºF. If the viscosity is low, molecular diffusion of high molecular constituents towards the pipe wall is increased, and the deposition rate is expected to be enhanced. The Reynolds number for the Garden Banks condensate is higher than for South Pelto oil. Also, the Prandtl number has an impact on the wax thickness in the boundary layer region. Wax thickness in this region is inversely proportional to both Reynolds and Prandtl numbers. From this aspect, wax thickness values for Garden Banks condensate are expected to be lower than for South Pelto oil. Finally, the wax content of Garden Banks condensate is lower than for South Pelto oil, which would tend to make deposit thickness less for Garden Banks condensate.
Figure 77 – Views of Scrape and Gas Bubbles on Deposit Surface (WAX2002-009)
Comparisons between Horizontal and Vertical Tests
Most horizontal flow tests yielded deposits around 0.2 to 0.4 mm. Horizontal annular flow tests with oil velocites below 1 ft/s gave deposits around 0.8-1.3 mm. Higher oil velocities in vertical flow resulted in a thinner deposit in annular flow (0.2-0.3mm).
Similarly, vertical intermittent flow tests with oil velocities below 1 ft/s yielded large deposits (≥ 1 mm). Higher oil velocities (above 1 ft/s) in vertical intermittent flow yielded much thinner deposits, similar to those obtained in horizontal flow with oil velocities above 1 ft/s.

103
Comparison between Single-Phase and Multiphase Flow Tests
Four horizontal single-phase tests were run in the multiphase loop with Garden Banks condensate: three with a ∆T of 30 ºF and one with a ∆T of 45 ºF. Only the ∆T = 45 ºF test was used for comparison purposes. WAX2002-005 was a 48-hr test with a superficial oil velocity of 3.4 ft/s and a ∆T of 45ºF. Table 40 presents a summary of Test WAX 2002-005.
Table 40 – Horizontal Single-Phase Test in Multiphase Loop with Garden Banks Condensate (WAX2002-005)
Horizontal multiphase tests with a superficial oil velocity of 4 ft/s yielded the deposit thickness around 0.3 mm. This is comparable with the horizontal single-phase Test WAX2002-005 which produced a deposit thickness of 0.4 mm (Hernandez, 2002). All horizontal intermittent multiphase flow tests with a superficial oil velocity of 4 ft/s produced a deposit thickness around 0.3 mm for a wide range of superficial gas velocities.
CONCLUSIONS 1. A total of 23 multiphase tests with a mixture of Garden Banks Condensate and Tulsa City Natural
Gas in horizontal and vertical pipes were conducted in a high-pressure state-of-the-art test facility to generate wax deposition data.
2. Wax deposition is a flow-pattern dependent phenomenon.
3. Garden Banks condensate horizontal flow tests: a. Annular flow produced the thickest deposits. b. Intermittent and stratified smooth flow produced the thinnest deposits of comparable
values. c. Stratified wavy flow produced thicker deposits than stratified smooth flow.
4. Garden Banks condensate vertical flow tests: a. Bubbly flow and annular flow tests with high superficial oil velocities produced the
thinnest deposits. b. Intermittent flow tests with low superficial oil velocities produced the thickest deposit
thickness. c. Increasing in oil superficial velocity results in thinner deposits.
5. South Pelto oil deposition tests run under similar conditions produced thicker deposits than Garden Banks condensate tests, except for intermittent vertical flow.
Test# To (ºF)
∆T (ºF)
Duration
VSL (ft/s)
Qo (BPD)
Re Type of wax
Online LD-LD
Offline LD-LD
WAX2002-005
85 45 48 3.36 1210 13395 Med-hard
- 0.4

104

105
Modeling Studies
Investigation of Single-Phase Paraffin Deposition Characteristics
During the past Paraffin Deposition JIP, a computer program named TUWAX initially written by MSI/Conoco (1998) was used to compare experimental results from the flow loop with model predictions. The program has been modified in order to improve the prediction of deposition rates.
In this program, pseudo-steady state, one-dimensional flow calculations are performed in four basic modules: hydrodynamic, heat transfer, thermodynamic and deposition rate. Basic single-phase flow calculations are performed in the hydrodynamic module to estimate pressure drops in a pipe segment. In the heat transfer module, heat transfer calculations are performed to estimate the temperature profile and heat transfer rate in a pipe segment. The thermodynamic module is used to estimate fluid properties based on given pressure and temperature data. Finally, the deposition module is used to estimate the deposition rate and build-up for the next time step.
SOFTWARE MODIFICATION In the previous computer program, molecular diffusion was considered as the primary mechanism
for paraffin deposition to calculate deposition rates. The deposition module was modified in order to incorporate the film mass transfer approach explained in literature review. The user can select which model to use, molecular diffusion, film mass transfer or some average between the two, depending on the user’s experience with similar field conditions.
Another modification made is to allow the user to specify multiple pipe segments, which can have different specifications, such as inner and outer diameters, length, inclination angle, insulation characteristics, roughness and ambient temperature. Prior to this study, the user could only run simulations over one single pipe segment with constant specifications.
MODEL ENHANCEMENT One of the main limitations in the previous single-phase paraffin deposition model is the
assumption of constant oil fraction in the deposit that the user is required to specify as an input parameter. It is also assumed that all the mass flux from the bulk fluid contributes to deposit growth, and no diffusion into the deposit is considered. The previous model does not consider the aging effect on the deposition process.
Singh et al. (2002) proposed a model that considers the diffusion of wax into the existing deposit. The boundary condition used in this model at the deposit fluid interface was that the wax concentration at the interface is equal to the equilibrium concentration at the interface temperature. In this thin film model, the wax fraction in the deposit changes with time but is uniform across the deposit. Also, Singh et al. did not consider any shear stripping effects, since all of their tests were conducted under laminar flow conditions.
A new model has been developed. The model is analogous to the Singh et al. model in the sense that it also considers that part of the bulk flux will contribute to new deposit growth and the rest will be diffused into the existing deposit. The model considers a kinetic resistance for the diffusion into the deposit; therefore, the interfacial concentration might be different from the equilibrium concentration at

106
the interface temperature. The kinetic resistance would be different for different oils. Also, the proposed model assumes that the deposit layer is immobile. Stripping effects are considered in the proposed model as well.
In spite of the addition of empirical parameters to predict deposition rates under field conditions, the proposed model has a more fundamental basis than the previous TUWAX program, and agrees fairly well with experimental data. Descriptions of the proposed model and model comparison with experimental data were presented in detail in Hernandez2.
Mechanistic Heat Transfer Model Previous numerical and experimental studies (Ghajar et al. (1997a), Ghajar et al. (1997b),
Dougherty et al. (1997), Apte (1999) and Matzain (1999)) in JIP project of “Paraffin Deposition Prediction in Multiphase Flowlines and Wellbores” show that wax deposition is sensitive to convective heat transfer in the flow so that it is required to develop a robust prediction method for all possible operating conditions in petroleum multiphase systems.
Convective heat transfer in gas-liquid two-phase flow clearly depends on the resulting flow patterns under given operating conditions. Therefore, the prediction models must be able to predict the resulting flow pattern first, and then predict the hydrodynamics and heat transfer for the specific flow pattern. Mechanistic models for prediction of two-phase convective heat transfer must eventually be developed with significant improvement in accuracy. The models should be applicable over a wide operational range.
A comprehensive two-phase heat transfer model has been developed based on a mechanistic approach. The model consists of a flow pattern prediction model and a set of individual mechanistic models for predicting hydrodynamics and heat transfer. Existing mechanistic models are used to predict the flow pattern and hydrodynamics. The flow pattern dependent mechanistic heat transfer models are newly developed.
The model was evaluated by a sensitivity analysis and comparison with experimental data. The sensitivity analysis shows that sensitivities of the model prediction to both superficial velocity of gas and liquid agree with experimental observations, except for horizontal and vertical annular flow. Based on comparison with experimental data, the model can predict convective heat transfer coefficient within a 20% error for vertical bubbly and annular flows, 40% error for vertical intermittent flow, 30% error for horizontal stratified flow with some exceptions, and 25% error for horizontal annular flow. The model shows better overall performance than existing correlations, based on comparisons with experimental data, except for vertical annular flow. Detailed descriptions of model development and model validation were presented in Manabe (2000).

107
Conclusions
Deposition Physics Studies A new facility was constructed to investigate long term paraffin deposition behavior.
Experimental data were gathered with South Pelto oil. Ten single-phase, long term deposition tests were completed in the three test sections with diameters of 0.5 in., 1.0 in. and 1.5 in. with testing durations ranging from 3 to 27 days. Tests were also conducted to investigate the effects of Reynolds number, velocity and shear stress. Three oil-water two phase tests with different water cuts of 25%, 40% and 75% were conducted in the 1.5-in. test section.
A 27-day test was conducted to investigate aging phenomena. From the DSC analyses of the oil samples, the WAT began to drop after 4 days of testing, indicating depletion of the wax content in the oil. A special test designed to further investigate the plateau behavior confirmed depletion.
The dimensionless deposit thickness versus time did not change very much for tests in the three test sections with the same Reynolds number, but changed significantly for tests with the same velocity and shear stress. Based on current test results, Reynolds number has the greatest impact on deposition thickness.
Three oil-water two-phase tests were conducted in the 1.5-in. test section with different water cuts of 25%, 40% and 75%. The deposition rates were higher than those observed for single-phase cases. Moreover, for the test with 40% water cut, a peculiar pressure drop behavior was observed. Since the two-phase paraffin deposition behavior is directly related to the properties of the mixture, a detailed rheological analysis is recommended for future studies.
Two different crude oils were extensively studied under single-phase and two-phase oil-water conditions to assess their deposition tendencies using the cold finger device. The same oils were studied under similar conditions using the flow loop facilities. The results obtained from the flow loop for the oil-water tests differed from the results obtained from the cold finger device with respect to deposition tendencies. The deposition rates obtained from the flow loop for oil-water tests were higher than those seen for single-phase tests and kept increasing for increasing water cuts (Gao, 2003). The deposition tendencies were exactly the opposite for the cold finger device. The total amount of deposit at the end of the tests was higher for single-phase tests than for oil-water tests, and it decreased with increasing water cuts.
The overall mass of deposit increased with increasing ∆Ts for all conditions tested. For single-phase tests, the average wax fraction in the deposits decreases with increasing ∆Ts, resulting in softer deposits. Similar trends were observed for single-phase tests at the flow loop. For the oil-water tests conducted with salt water, the wax fraction increased with water up to 60% and it seemed to plateau for higher water cuts.
Four different water cuts were used for oil-water tests. The amount of deposit is higher for single-phase tests than for two-phase oil-water tests and it decreased almost exponentially with increasing water cuts. This behavior gets more accentuated as the ∆T increases.
The presence of salt did not affect the deposition for all conditions tested. Nearly no difference could be seen when comparing the amount of deposits created with fresh water and brine.

108
Single-Phase Studies A total of nineteen single-phase tests were successfully conducted using a condensate fluid in
two different flow loops, with significantly different flow conditions and twelve tests with heavier oils. The tests were used to study the dependence of the paraffin deposition process on flow rate, flow regime, ∆T, shear stripping and fluid properties.
The paraffin deposition process was highly dependant on the temperature difference between the oil and glycol inlet temperatures and the deposit thickness decreased significantly for the tests with lower ∆T.
For the higher ∆T tests the deposit thickness changed significantly with flow rate. The deposit thickness increased as the oil flow rate decreased. For lower ∆T tests no definitive conclusions could be drawn because the deposit thicknesses were quite small. The flow rate affected the characteristics of the deposit, that is, the deposit was softer for the tests with lower oil velocities.
Tests with the more viscous crude oils produced deposits with relatively high oil contents. The deposits were uniform across the pipe. The viscosity dependence on temperature had a significant impact on the diffusivity phenomena.
Multiphase Studies Experimental heat transfer data were acquired on flow pattern transitions for horizontal, upward
1o and upward vertical crude oil-natural gas two-phase flow at high-pressure conditions. Flow pattern transitions were found to be affected by pressure. Experimental data on convective heat transfer coefficients were acquired for single-phase liquid flow, single-phase gas flow, horizontal stratified flow, vertical bubbly flow, vertical intermittent flow and horizontal and vertical annular flow. These tests showed that the single-phase convective heat transfer coefficients for turbulent liquid flow could be predicted by the Petukhov-Kirillov correlation with slight underprediction at high liquid velocity, and single-phase convective heat transfer coefficients for turbulent gas flow could be predicted by the Dittus-Boelter correlation. The two-phase heat transfer test results showed larger hTP values were obtained at higher vSL for the same vSg, and in general, they increased with an increase of vSg at the same vSL.
A total of 23 multiphase (gas-oil) tests with a mixture of condensate and Tulsa City Natural Gas in horizontal and vertical pipes were conducted in a high-pressure state-of-the-art test facility to generate wax deposition data. Wax deposition was found to be a flow-pattern dependent phenomenon. For horizontal flow, annular flow produced the thickest deposits, intermittent and stratified smooth flow produced the thinnest deposits while stratified wavy flow produced thicker deposits than stratified smooth flow. For vertical flow, bubbly flow and annular flow tests with high superficial oil velocities produced the thinnest deposits; intermittent flow tests with low superficial oil velocities produced the thickest deposits while increasing oil superficial velocity resulted in thinner deposits.
109
Nomenclature SYMBOL A = area (m2) Ai = interfacial area (m2) Coil = trapped oil content in deposit (%) Cp = specific heat (J/kg K) Cw = wax concentration d = diameter (m) De = effective diffusion coefficient into deposit Dwo, DAB = diffusion coefficient of wax in oil (m2/s), of A in B (m2/s) f = Moody friction factor ( _ ) Fw = wax fraction in deposit h = heat transfer coefficient (W/m2 K) H = level (m) hSg = convective heat transfer coefficient for superficial gas flow (btu/hr.ft2 °F) hSL = convective heat transfer coefficient for superficial liquid flow (btu/hr.ft2 °F) hTP = convective heat transfer coefficient for two-phase flow (btu/hr.ft2 °F) HLF = liquid film holdup HLLS = liquid holdup in liquid slug body HLTB = liquid holdup in Taylor bubble region k = thermal conductivity (W/mK) km = mass transfer coefficient (kg/m2 s) L = length (m) M = molecular weight (kg/kgmol) m = mass (kg) NNu = Nusselt number NPe = Pecklet number ( _ ) NPr = Prandtl number ( _ ) NRe, Re = Reynolds number ( _ ) Num = Nusselt number for mass transfer ( _ ) P = pressure (Pa) Q = heat transfer rate (W) Qo = oil flow rate (m3/s) r = radius (m) rw = radius to deposit surface (m) Sc = Schmidt number ( _ ) T = temperature (K) t = time (s) U = overall heat transfer coefficient (W / m2 K) v = velocity (m/s) vSg = superficial gas velocity (ft/s) vSL = superficial liquid velocity (ft/s) VA = molar volume of solute A (m3/kgmol) Vs = superficial velocity (m/s) w = weight mass fraction z = axial distance (m)

110
GREEK LETTERS α = aspect ratio of wax crystals ( _ ) δ = deposit thickness (m) ∆ = difference ∆Τlm = log mean temperature difference (K) ε = roughness (m) γ = specific gravity ( _ ) ϕ = association parameter ( _ ) µ = fluid viscosity (cP) θ = Inclination angle (deg) ρ = fluid density (kg/m3) τ = shear stress (Pa) γ = shear rate (i/s) SUBSCRIPTS acc = accelerational b = bulk f = frictional, fluid g = gravitational gl = glycol phase i = interface, inner in = inlet L = liquid phase o = oil, outer out = outlet p = pipe w = wall w, wax = wax phase
111
References Apte, M: “Investigation of Paraffin Deposition in Multiphase Flow,” MS Thesis, The University of Tulsa, Tulsa, Oklahoma (1999).
Barnea, D., Yacoub, N.: "Heat Transfer in Vertical Upwards Gas-Liquid Slug Flow”, Intl. J. Heat & Mass Transfer, Vol. 26, No. 9, pp. 1365 (1983).
Barnea, D.: “A Unified Model for Predicting Flow Pattern Transitions for the Whole Range of Pipe Inclinations,” Int. J. Multiphase Flow, 13, 1-12 (1987).
Bendiksen, K.H. and Espedal, M.: "Onset of Slugging in Horizontal Gas-Liquid Pipe Flow," Int. J. Multiphase Flow, 18, 237-247 (1992).
Bern, P. A., Withers, V. R. and Cairns, R. J. R.: “Wax Deposition in Crude Oil Pipelines”, EUR 206, 1980 European Offshore Petroleum Conference and Exhibition, London, England (October 21-24, 1980).
Brill, J. P. and Beggs, H. D.: “Two-Phase Flow in Pipes”, The University of Tulsa, Tulsa, Oklahoma, 6th Ed. (January 1998)
Brill, J. P. and Mukerjee, H.: “Multiphase Flow in Wells”, SPE Monograph Volume 17 (1999).
Brown, T. B., Niesen, V. G. and Erickson, D. D.: “Measurement and Prediction of the Kinetics of Paraffin Deposition”, paper SPE 26548 presented at the 68th SPE Annual Technical Conference and Exhibition, Houston, TX (October 3-6 1993).
Burger, E. D., Perkins, T. K. and Striegler, J. H.: “Studies of Wax Deposition in the Trans Alaska Pipeline”, SPE J. Petroleum Technology, pp. 1075 (June 1981).
Cole, R. J., Jessen, F. W.: “Paraffin Deposition”, Oil and Gas Journal, Vol. 58, pp 87-99 (September 19, 1960).
Cussler, E.L., Hughes, S.E., Ward, W.J. and Aris, R.: “Barrier Membranes,” J. Memb. Sci., Vol. 38, p. 161 (1988).
Davis, E.J., Hung, S.C., and Arciero, S.: "An Analogy for Heat Transfer with Wavy/Stratified Gas-Liquid Flow”, AIChE J., 21(5), pp. 872-878 (1975).
Davis, E.J., Cheremisinoff, N.P, and Sambasivan, G.: "Heat and Momentum Transfer Analogies for Two-Phase Transfer Stratified and Annular Flows”, Proceedings of Two-Phase Flow and Heat Transfer Symposium, Fort Lauderdale, FL, pp. 577-608 (1976).
Dawson, S.: Simulation of Wax Deposition Case Study”, paper presented at 1995 IBC Advances in Multiphase Operation and Offshore Conference, London, England (November 29-30, 1995).
Dittus, F.W. and Boelter, L.M.K.: “Heat Transfer in Automobile Radiators of the Tubular Type”, Univ. Calif. Pub. Eng., 2, 443 (1930).
Dougherty, R.L., Ghajar, A.J., Kim, D., Kim J. and Ryali, V.K.: “Multiphase Heat Transfer in Flowlines and Wellbores Final Report –Interim Phase,” The University of Tulsa Paraffin Deposition JIP (1997).
Fried, L.: “Pressure Drop and Heat Transfer for Two-Phase, Two-Component Flow”, Chem. Eng. Progress Symp. Series, 50, pp. 47-51 (1954).

112
Forsdyke, I.: “Internal Report: British Petroleum” (1995).
Gao, C.: “Investigation of Long Term Paraffin Deposition Behavior for South Pelto Oil”, MS Thesis, The University of Tulsa, Tulsa, Oklahoma (2003).
Ghajar, A.J., Dougherty, R.L., Kim, D., Sofyan, Y. and Ryali, V.K.: “Multiphase Heat Transfer in Flowlines and Wellbores Final Report –Phase I,” The University of Tulsa Paraffin Deposition JIP (1997).
Ghajar, A.J., Dougherty, R.L., Kim, D., Sofyan, Y. and Ryali, V.K.: “Multiphase Heat Transfer in Flowlines and Wellbores Literature Survey –Part II,” The University of Tulsa Paraffin Deposition JIP (1997).
Hausen : “Z. Ver. deut. Beih. Verfahrenstech”, No 4, Vol 91, (1943), cited in “Chemical Engineers Handbook”, pp. 10-13 (1973).
Hensley H.: Personal Communication (2000 - 2002).
Hernandez, O.: “Investigation of Single-Phase Paraffin Deposition Characteristics”, MS Thesis, The University of Tulsa, Tulsa, Oklahoma (2002).
Hetsroni, G., Hu, B.G., Yi, J.H., Mosyak, A., Yarin, L.P., and Ziskin, G.: "Heat Transfer in Intermittent Air-Water Flows - Part 2 - Upward Inclined Tube”, Intl. J. Multiphase Flow, Vol. 24, No. 2 pp. 189-212 (1998).
Hickman, S. R.: Personal Communication (2001- 2003).
Hsu, J.J., Santamaria, M.M., and Brubaker, J.P.: “Wax Deposition of Waxy Live Crudes under Turbulent Flow Conditions”, SPE 28480 presented at SPE 69th Annual Technical Conference and Exhibition, New Orleans, LA (25-28 September 1994).
Hughmark, G.A.: "Heat Transfer in Horizontal Annular Gas-Liquid Flow”, Chem. Eng. Progress Symp. Series, 57, Vol. 61, pp. 176-178 (1963).
Incropera F., DeWitt D.: “Fundamentals of Heat and Mass Transfer”, John Wiley and Sons (1996).
Kakac, S. and Yener, Y.: Convective Heat Transfer, 2nd Edition, CRC Press (1995).
Kaminsky, R.,D.: “Estimation of Two-Phase Flow Heat Transfer in Pipes”, paper presented at ASME ETCE, Houston, TX (February 1999).
Kim, D., Ghajar, A.J., and Dougherty, R.L.: “Development of Improved Two-Phase Two-Component Pipe Flow Heat Transfer Correlations from Existing Correlations and Published Data,” presented at ASME/JSME Joint Thermal Engineering Conference (1999).
Knott, R.F., Anderson, R.N., Acrivos, A. and Petersen, E.E.: “An Experimental Study of Heat Transfer to Nitrogen-Oil Mixtures,” Ind. and Eng. Chem., 51, 1369-1372. (1959)
Kudirka, A.A., Grosh, R.J. and McFadden, P.W.: “Heat Transfer in Two-Phase Flow of Gas-Liquid Mixtures,” Ind. and Eng. Chem., Vol. 4, No. 3, pp. 339-344. (1965)
Lund, H.: “Investigation of Paraffin Deposition during Single-Phase Flow”, MS Thesis, The University of Tulsa, Tulsa, Oklahoma (1998).

113
Manabe, R.: “A Comprehensive Mechanistic Heat Transfer Model for Two-Phase Flow with High-Pressure Flow Pattern”, Ph. D. Dissertation, The University of Tulsa, Tulsa, Oklahoma (2000).
Matzain, A.: “Single-Phase Liquid Paraffin Deposition Modeling”, MS Thesis, The University of Tulsa, Tulsa, Oklahoma (1996).
Matzain, A.: “Multiphase Flow Paraffin Deposition Modeling,” Ph.D. Dissertation, The University of Tulsa, Tulsa, Oklahoma (1999).
Oliver, D. R. and Wright, S. J.: “Pressure Drop and Heat Transfer in Gas-Liquid Slug Flow in Horizontal Tubes”, British Chem. Eng., Vol. 9, pp. 590 – 596 (1962).
Petukhov, B.S.: “Heat Transfer and Friction in Turbulent Pipe Flow with Variable Physical Properties,” Advances in Heat Transfer, 6, 505-564 (1970).
Pletcher, R.H., and McManus, H.N.: "A Theory for Heat Transfer to Annular, Two-Component Flow”, Intl. J. Heat and Mass Transfer, 15, pp. 2091-2096 (1972).
Reistle, C.E. Jr.: “Paraffin and Congealing-Oil Problems”, Bull. 348, USBM (1932) cited in Burger, E. D., Perkins, T. K. and Striegler, J. H. (1981).
Rezkallah, K.S. and Sims, G.E.: “An Examination of Correlations of Mean Heat Transfer Coefficients in Two-Phase and Two-Component Flow in Vertical Tubes,” AIChE Symp. Series, 83, 109-114. (1987).
Rygg, O. B., Rydahl, A. K. and Ronnigsen, H. P.: “Wax Deposition in Offshore Pipelines Systems”, BHRG Multiophase Technology Conference, Banff, Alberta, Canada (June 9 – 11, 1998).
Shah, M.M.: “Generalized Prediction of Heat Transfer During Two-Component Gas-Liquid Flow in Tubes and Other Channels,” AIChE Symp. Series, 208, 140-151 (1981).
Shoham, O., Dukler, A.E., and Taitel, Y.: "Heat Transfer during Intermittent/Slug Flow in Horizontal Tubes”, Ind. Eng. Chem. Fund., 21, pp. 312-319 (1982).
Sieder, E.N. and Tate, G.E.: “Heat Transfer and Pressure Drop of Liquids in Tubes,” Ind. Eng. Chem, 28, 1429-1453. (1936).
Singh, P., Venkatesan, R. and Fogler, S.: “Formation and Aging of Incipient Thin Film Wax Oil Gels,” AIChE J., Vol. 46, No. 5, pp. 1059-1074 (2000).
Spratt, T.: Personal Communication – Nalco (2003).
Taitel, Y. and Dukler, A.E.: “A Model for Predicting Flow Regime Transition in Horizontal and near Horizontal Gas-Liquid Flow,” AIChE J., 22, 47-55 (1976).
Taitel, Y., Barnea, D. and Dukler, A.E.: “Modeling Flow Pattern Transition for Steady Upward Gas-Liquid Flow in Vertical Tubes,” AIChE J., 26, 345-354 (1980).
Volle, J. L.: Personal Communication (2001-2003).
Zhang, H.: “Error Analysis of Wax Thickness Measurement”, (1999).

114