Embed Size (px)
Citation preview

DEPARTMENT OF PLANNING AND ENVIRONMENTAL PROTECTION
TECHNICAL REPORT SERIES
TR:00-03
A SECOND SURVEY OF THE OCCURRENCE AND DISTRIBUTION OF VOLATILE ORGANIC COMPOUNDS
IN BROWARD COUNTY SURFACE WATERS
ENVIRONMENTAL MONITORING DIVISION
June 2000

Table of Contents
______________________________________________________________________________
TABLE OF CONTENTS..................................................................................................................... i
LIST OF FIGURES............................................................................................................................ ii
LIST OF TABLES.............................................................................................................................. ii
EXECUTIVE SUMMARY.................................................................................................................. iii
1. INTRODUCTION....................................................................................................................1
2. METHODOLOGY................................................................................................................... 12.1 Sample Collection Procedures.....................................................................................12.2 Sample Analysis Procedure........................................................................................ 42.3 Detection Criteria.........................................................................................................4
3. RESULTS...............................................................................................................................63.1 Petroleum Hydrocarbons.............................................................................................63.2 Chlorinated Hydrocarbons...........................................................................................93.3 Naturally-Occurring Volatile Organic Compounds......................................................11
4. DISCUSSION....................................................................................................................... 134.1 Petroleum Hydrocarbons...........................................................................................134.2 Chlorinated
Hydrocarbon..............................................................................................................164.3 Naturally-Occurring Volatile Organic Compounds......................................................16
5. CONCLUSIONS....................................................................................................................175.1 Petroleum Hydrocarbons............................................................................................175.2 Chlorinated Hydrocarbons..........................................................................................175.3 Naturally-Occurring Volatile Organic Compounds......................................................17
6. LITERATURE CITED............................................................................................................18
APPENDIXParameter List and Data Quality Objectives.........................................................................19Data Table.............................................................................................................................20Sample Site Descriptions..................................................................................................... 28
i

List of Figures______________________________________________________________________________1. Broward County Surface Water Quality Monitoring Network..................................................3
2. Petroleum Hydrocarbons in Broward County Surface Waters................................................8
3. Chlorinated Hydrocarbons in Broward County Surface Waters............................................10
4. Naturally-Occurring VOCs in Broward County Surface Waters.............................................12
5. Methyltertbutylether in Broward County Surface Waters.......................................................15
List of Tables______________________________________________________________________________1. Sample Times and Tide of 1998 and 1999 Surveys...............................................................4
2. Minimum Detection Criteria....................................................................................................5
3. VOC Detection Statistics........................................................................................................6
ii

EXECUTIVE SUMMARY
Broward County surface waters were tested on July 20 & 21, 1999 to assess the occurrence anddistribution of volatile organic compounds (VOCs). VOCs are light molecular weight organicchemicals that include components of fuels, solvents and de-greasers. This testing wasperformed to confirm the findings of an initial survey of County surface waters performed July 28 &29, 1998 when a variety of VOCs were detected. In general, the VOCs detected in both surveysfell into 3 groups: 1) petroleum hydrocarbons, 2) chlorinated hydrocarbons and 3) naturally-occurring VOCs.
Petroleum hydrocarbon VOCs detected in this survey are common components of motor fuels. Atotal of 104 VOC detections were recorded in the 1999 survey as compared to 42 detections in the1998 survey. Improved analytical sensitivity was believed to partially account for the increasedrate of detection. The tidal stage at the time of sampling may also have affected the detectionrate.
One of the petroleum hydrocarbons detected in the survey, methyltertbutylether (MTBE), hasrecently been the subject of attention because of its detection in the drinking water supplies ofcommunities across the nation. MTBE is added to gasoline to improve its octane rating. Thesources of MTBE include gasoline-contaminated storm water runoff, 2-cycle recreational watercraft and leaking underground storage tanks. The risk of MTBE contamination of Broward Countydrinking water supplies, however, is minimal because of regulatory and operational safeguardsthat have been in place for several years.
Chlorinated hydrocarbons were also detected in both surveys. While the range of concentrationsfound in both surveys were similar, the frequency of their detection was greater in the currentstudy and may also be a result of improved analytical sensitivity. The chlorinated hydrocarbonsincluded decomposition products which result from anaerobic bacterial reduction of parentcompounds such as tri- and tetrachloroethene in ground water. They enter the surface watersthrough recharge from ground water. This mechanism was particularly evident in the vicinity ofthe business and industrial area on the periphery of the Fort Lauderdale-Hollywood InternationalAirport where wide-spread contamination of ground water by vinyl chloride has been documented. However, detections in other areas suggest additional sources. Seepage of septic tank effluentcontaminated with chlorinated hydrocarbons is a possibility.
The naturally-occurring VOC detected in this survey was bromoform. While it was detected lessoften in the 1999 study, its distribution was restricted to the Intracoastal Waterway as was thecase in the 1998 survey. The results of the 1999 survey supported the proposition thatbromoform, produced by marine algae in the ocean, entered the inland waters through tidalaction. The reduced frequency of detection is believed to be due to the fact that samplingoccurred at an earlier stage of the incoming tide than the 1998 survey, resulting in greater dilutionby the inland water.
iii

1
1.0 INTRODUCTIONThis report summarizes the findings of a second survey of the occurrence of volatile organiccompounds (VOCs) in Broward County surface waters.
The original survey was conducted on July 28-29, 1998 (DPEP, 1999). The VOCs detectedduring the 1998 survey were members of 3 general groups: petroleum hydrocarbons, chlorinatedhydrocarbon decomposition products, and naturally-occurring VOCs.
The petroleum hydrocarbons included compounds commonly associated with fuels and includedcompounds such as benzene and toluene. Methyltertbutylether (MTBE), an octane enhanceradded to gasoline, was also commonly detected. The sources of the MTBE were proposed to beoutboard motor-powered vessels and storm water runoff.
The chlorinated hydrocarbon decomposition products included cis-1,2-dichloroethene and vinylchloride. Septic tanks may have been a source of the parent compounds (e.g., trichloroetheneand tetrachloroethene) of these compounds.
The naturally-occurring VOC was bromoform. It was found exclusively in the IntracoastalWaterway (ICW). Since bromoform is known to be produced by marine algae and that samplingoccurred during the later stages of the incoming tide when the ICW was flooded with ocean water,the bromoform was proposed to have originated in the offshore waters.
This follow-up survey was performed to verify these initial findings.
2.0 METHODOLOGYThe protocols used in this survey were essentially the same as used in the 1998 survey. The onlydifference was in the sample introduction technique; automated in the 1998 survey and manual inthe 1999 survey. All sampling and analyses were performed according to EPA-approvedprotocols as specified in the Environmental Monitoring Division’s (EMD) Comprehensive QualityAssurance Plan (FDEP, 1992). Statistical analyses were performed using SigmaStat computersoftware (Jandel,1992-95).
Weather conditions during the sampling periods were generally sunny with less than ½" of rainfallrecorded at any station during the 48 hour period prior to sampling. As a result, the datarepresent “ambient” water quality, essentially unimpacted by storm water runoff.
2.1 Sample Collection ProceduresThe collection of samples for this study occurred during the sampling of DPEP’s 44-station surfacewater quality monitoring network (see Figure 1) on July 20 and 21, 1999. The times and dates ofsampling coincided with the early stages of an incoming tide. All samples except those on theIntracoastal Waterway (ICW) were collected from bridges at approximately ½ meter below thesurface of the water using a 2 liter Kemmerer sampling bottle. After sampling, water was carefullydrained from the Kemmerer without aeration into pairs of 40 ml glass vials and sealed without airbubbles using Teflon-lined silicone septum caps. Samples collected from the ICW were collectedfrom the side of a boat by dipping the 40 ml vials directly into the water. After collection, the vialswere stored on ice for transport to the lab and were analyzed within 7 days.

2
Since the samples were collected near the surface, the reported values likely represent thehighest levels in the water column. All of the VOCs tested in this survey, are immiscible with waterso that any free product would float on the water surface, resulting in higher concentrations nearthe surface. MTBE, although immiscible with water, does have considerable solubility in water(50,000 mg/L). Thus in fresh water areas, concentrations at depth may be higher or lower thanthe surface. In marine water areas, the MTBE concentrations would likely be higher at the surfacebecause fresh water would float on the surface of the more-dense salt water. Also, the solubilityof MTBE in salt water is lower due to generally higher dissolved solids in marine water.

x
xxx
x
x
x
x
x
xx
xx
x
x
x
x
x
x
x
x
x
xx
x x
x
x
x
x
x
x
x
x
x
x
xx
x
x
x
x
x
x
x x109 110
40
34
37
32
41
90
23
35
39
31
12
89
36
3821
22
4729
1113
14
24
33
26
25
20
27
17
19
1018
28
491516
9 8
4
2
75
3 1
6
Broward CountyDepartment of Planning & Environmental Protection
Geographic Information Systems
Figure 1
1 0 1 2 3 4 5 Miles
N
July 20-21, 1999
BROWARD COUNTY SURFACE WATER
QUALITY MONITORING NETWORK
RS_PC;RSOODEEN:C;\GISDATA\MTBE_W PZ1a.APR

4
For comparison purposes, the tides and sampling periods for both the 1998 and 1999 events aresummarized in Table 1 below.
Table 1Sample Times and Tides for 1998 and 1999 Surveys
(Nautical Software, 1996)
Hillsboro Inlet SamplingPeriods
Port Everglades
Low High Begin-End Low High
July 28, 1998 0620 1225 0910-1405 0607 1217
July 29, 1998 0704 1312 0945-1420 0651 1304
July 20, 1999 0930 1536 0955-1415 0845 1503
July 21, 1999 1023 1634 0910-1345 0936 1601
2.2 Sample Analysis ProceduresThe samples were analyzed according to EPA Method 8260 following purge and trap extraction byEPA Method 5030 (USEPA, 1986). A gas-tight syringe was used to deliver a 25 ml sample aliquotto a Tekmar LSC 2000 purge and trap sampler. This is in contrast to the 1998 study when anauto-sampler was used to deliver samples to the trap. Because the analyst is better able tocontrol delivery of the sample and other shortcomings of the auto-sampler design, precision wasimproved with manual sample delivery. Since the formula for computing the method detection limit(Federal Register, 1984) is directly related to analytical precision, the improved precision resultedin better detection limits.
The sample was purged with inert gas for 11 minutes. The purged VOCs were trapped on a 25cm trap containing OV-1, charcoal, Tenax, and silica gel. The trapped VOCs were then de-sorbedfor 4 minutes at 180 degrees Celsius (C).
The de-sorbed VOCs were then separated on a 75 m, 0.53 mm I.D. DB-624 fused-silica capillarycolumn with a 3.0 µ film thickness contained in the oven of a Hewlett-Packard 5890 Series II gaschromatograph (GC). The GC was programmed to hold an initial temperature of 35E C for 8minutes, ramped at 4E C/min. to 150EC and held for 5 minutes. The VOCs eluted from the columnwere introduced via jet separator into a Hewlett-Packard 5971 Series mass-selective detectorprogrammed to delay 1 minute then to scan from 45-260 m/z at approximately 2 scans per second.
This system was calibrated for 61 environmentally-significant VOCs. A listing of these VOCs andassociated precision, accuracy and detection limit data are listed in the appendix.
2.3 Detection CriteriaBecause of the high sensitivity of the instrumentation used in this study, contamination of samplesduring sampling and analysis was a concern, particularly for common laboratory solvents that mayalso be target analytes. In order to assess the potential for contamination, blanks consisting of

5
reagent water were processed along with the actual samples. The results of these analyses werethen used to identify those VOCs and concentrations that may be artifacts of the sample handlingprocess. For each compound that was detected in the blanks, a range of concentrations (95%confidence interval) was determined that must be exceeded in the actual samples before it couldbe attributed to the sample. If only a single detection of a specific VOC was found, that level wasused as the criteria. The compounds that were detected in the blanks and the values that must beexceeded in order to ensure that the compound was actually present in the samples appear inTable 2.
Table 2Minimum Detection Criteria
Compound # of detections Criteria (singledetection), ug/L
Criteria (95% confidenceinterval), ug/l
1,2,4-trimethylbenzene
1 0-0.105 NA
1,4-dichlorobenzene 3 NA 0-0.177
benzene 2 NA 0-0.530
chloroform (1 outlier) 4 NA 0-0.274
ethylbenzene 1 0-0.050 NA
m+p-xylene 2 NA 0-0.394
methylene chloride 5 NA 0-2.986
o-xylene 2 NA 0-0.300
styrene 1 0-0.750 NA
toluene 4 NA 0-0.316
The data were further screened to eliminate those concentrations that are below the minimumdetection limit (MDL) of the system. The MDL is defined as the minimum concentration of asubstance that can be measured and reported with 99% confidence that the analyte concentrationis greater than zero (Federal Register, 1984). For this report, only those compounds atconcentrations that exceeded both the MDL and the detection criteria for the blanks will bediscussed.

6
3.0 RESULTSTable 2 below provides statistics on those detections that met the above criteria.
Table 3VOC Detection Statistics
Compound nMean,ug/L
Std Dev,ug/L
Median, ug/L
Min.,ug/L
Max.,ug/L
Freq., %
MDL,ug/L
Methyltertbutylether 23 0.978 0.568 0.970 0.250 1.990 52.3% 0.0748
Ethylbenzene 15 0.279 0.278 0.130 0.070 0.950 34.1% 0.0336
135 Trimethylbenzene 11 0.185 0.134 0.170 0.060 0.440 25.0% 0.0527
Toluene 11 0.953 0.503 0.850 0.370 1.980 25.0% 0.0783
Cis12Dichloroethene 10 0.147 0.150 0.095 0.040 0.530 22.7% 0.0320
124-Trimethylbenzene 10 0.635 0.461 0.520 0.180 1.580 22.7% 0.0370
N-Propylbenzene 9 0.107 0.064 0.080 0.040 0.220 20.5% 0.0354
Ortho Xylene 7 0.749 0.409 0.580 0.305 1.470 15.9% 0.0320
Meta/Para Xylene 6 0.832 0.360 0.800 0.410 1.380 13.6% 0.0500
Isopropyl Benzene 4 0.050 0.014 0.045 0.040 0.070 9.1% 0.0330
11 Dichloroethane 4 0.055 0.026 0.050 0.030 0.090 9.1% 0.0262
Naphthalene 4 0.442 0.050 0.460 0.370 0.480 9.1% 0.3050
Benzene 4 0.692 0.136 0.715 0.530 0.810 9.1% 0.0240
Vinyl Chloride 3 0.390 0.101 0.410 0.280 0.480 6.8% 0.0650
Bromoform 2 0.060 0.028 0.060 0.040 0.080 4.5% 0.0277
Tetrachloroethene 1 0.030 NA 0.030 0.030 0.030 2.3% 0.0220
13 Dichlorobenzene 1 0.050 NA 0.050 0.050 0.050 2.3% 0.0370
12 Dichlorobenzene 1 0.070 NA 0.070 0.070 0.070 2.3% 0.0466
Styrene 1 0.110 NA 0.110 0.110 0.110 2.3% 0.0400
Dichlorodifluoro-methane
1 0.230 NA 0.230 0.230 0.230 2.3% 0.0750
For comparison purposes, the VOCs detected in this study will be classified as in the previousstudy; petroleum hydrocarbons, chlorinated hydrocarbon decomposition products and naturally-occurring VOCs. Two additional VOCs were detected in this study, however, that don’t fit well intothe above classifications. For example, styrene was detected in one sample anddichlorodifluoromethane in another. The detections of these two compounds were not thought tobe remarkable and are not discussed further.
3.1 Petroleum HydrocarbonsThe VOCs detected in this survey that were classified as petroleum hydrocarbons were MTBE,ethylbenzene, 1,3,5-trimethylbenzene, toluene, 1,2,4-trimethylbenzene, N-propylbenzene,ortho/meta/para-xylene, isopropyl benzene, naphthalene, and benzene. A total of 32 (73%) sitescontained one of more of these compounds.

7
MTBE and ethylbenzene were the two most commonly detected petroleum hydrocarbonsdetected, occurring at 50% and 34% of the sites respectively. MTBE levels ranged from 0.25 to1.99 ug/L. Ethylbenzene ranged from 0.07 to 0.95 ug/L. Figure 2 depicts the distribution ofpetroleum hydrocarbons in Broward County surface waters.

Figure 2
Broward CountyDepartment of Planning & Environmental Protection
Geographic Information Systems
#0#0 #0
#0
0
00
#0
0
#0
0
0
0
#0
0
#0
0
0
#0
#0
0
#0
0
#0
0
#0
0#0
0
#0
0
#0
0
#0
0
0
#0
#0
0
0
0
#0
00 #
#
#
#
#
#
#
#
#
#
#
#
#
#
#
#
#
#
## #
#
#
##
#
#
# #
#
#
#
#
#
#
#
#
#
6
13
57
2
4
89
1615 49
28
18 10
19
17
27
20
25
26
33
24
14
13 11
2947
22
2138
36
89
12
31
39
35
23
90
41
32
37
34
40
109 110
PETROLEUMHYDROCARBONS
IN BROWARD COUNTYSURFACE WATERS
July 20-21, 1999
Petroleum Hydrocarbons DetectedNo Petroleum Hydrocarbons Detected
##0
1 0 1 2 3 4 5 Miles
N
RS_PC;RSOODEEN:C;\GISDATA\MTBE_W PZ1a.APR

9
3.2 Chlorinated HydrocarbonsSix different chlorinated hydrocarbons, including related decomposition products, were detected inthis survey. Three of these six compounds, tetrachloroethene, 1,3-dichlorobenzene and 1,2-dichlorobenzene are considered “parent” compounds of the related decomposition products andwere only detected once each. The related decomposition product compounds, cis-1,2-dichloroethene, vinyl chloride and 1,1-dichloroethane, were detected with greater frequency.
Vinyl Chloride and cis-1,2-dichloroethene have been shown to be produced by bacterialdecomposition of the parent compounds under anaerobic conditions (Wood et al, 1981) in groundwater and are commonly detected in groundwater known to have been contaminated withtrichloroethene and/or tetrachloroethene. Vinyl chloride was detected at 3 sites withconcentrations ranging from 0.28 to 0.48 ug/L. Cis-1,2-dichloroethene was found at 10 sites atconcentrations of 0.04 to 0.53 ug/L. Cis-1,2-dichloroethene was always found in the samples thatcontained vinyl chloride. Four detections of 1,1-dichloroethane (0.03 to 0.09 ug/L) occurred.
Figure 3 depicts the distribution of chlorinated hydrocarbon compounds in County surface waters.

Figure 3
Broward CountyDepartment of Planning & Environmental Protection
Geographic Information Systems
#0#0 0
0
0
0#0
#0
0
0
0
#0
#0
0
#0
0
#0
0
0
0
0
0
0
0
#0
0
00
0
0
0
0
0
0
0
0
0
0
0
0
0
0
00 0
##
#
#
#
#
#
##
¢¢
¢
¢
¢¢
¢
¢
¢
¢
6
13
57
2
4
89
1615 49
28
18 10
19
17
27
20
25
26
33
24
14
13 11
2947
22
2138
36
89
12
31
39
35
23
90
41
32
37
34
40
109 110
CHLORINATED HYDROCARBONS
IN BROWARD COUNTYSURFACE WATERS
July 20-21, 1999
Chlorinated Organics & Decomposition Products DetectedChlorinated Decomposition Products DetectedNo Chlorinated Products Detected
##0
¢
¢
1 0 1 2 3 4 5 Miles
N
RS_PC;RSOODEEN:C;\GISDATA\MTBE_W PZ1a.APR

11
3.3 Naturally-Occurring VOCs
Brominated hydrocarbons can be produced naturally by macro algae in the marine environment(Manley, et al, 1992). Bromoform was detected in two samples with a range of concentration of0.04 to 0.08 ug/L. Both samples were collected in the Intracoastal Waterway. Figure 4 depictsthe distribution of naturally-occurring VOCs in County surface waters.

00 0
0
0
00
0
0
0
0
0
0
0
0
0
0
0
0
0
0
0
0
0
0
0
00
0
0
0
0
0
0
0
0
0
0
0
0
0
0
00
#
#
0 0
6
13
57
2
4
89
1615 49
28
1810
19
17
27
20
25
26
33
24
14
13 11
2947
22
2138
36
89
12
31
39
35
23
90
41
32
37
34
40
109
110
Broward CountyDepartment of Planning & Environmental Protection
Geographic Information Systems
Figure 4
1 0 1 2 3 4 5 Miles
N
#0# Bromoform Detected
No Bromoform Detected
July 20-21, 1999
NATURALLY-OCCURING VOCs
IN BROWARD COUNTY SURFACE WATERS
RS_PC;RSOODEEN:C;\GISDATA\MTBE_W PZ.APR

13
4.0 DISCUSSIONCompared to the 1998 survey, the 1999 survey found a much higher rate of petroleumhydrocarbon detections, slightly more chlorinated hydrocarbon detections and fewer naturally-occurring hydrocarbon detections.
4.1 Petroleum HydrocarbonsPetroleum hydrocarbon molecules typically contain from 1 to >40 carbon atoms and range fromhighly volatile to non-volatile. The analytical methodology applied in this study will detect onlythose compounds with significant volatility at standard temperature and pressure. Therefore,although there are many other potentially harmful petroleum hydrocarbons (e.g., polynucleararomatic hydrocarbons), discussion will be restricted to volatile organic compounds.
In general, many more petroleum hydrocarbon compound detections occurred during the 1999survey than 1998 (104 v. 42). This may be partially due to the fact that detection limits for thecurrent survey were typically 2-3 times lower than the original survey. However, this would onlyaccount for 12 of the additional detections because most of the detections in 1999 were above thedetection limits in effect in 1998.
Another explanation for the increased frequency of detection of petroleum hydrocarbons in the1999 survey may be that since sampling occurred at an earlier stage of the incoming tide in 1999as compared to the 1998 survey, there was less dilution of contaminated inland water with “clean”ocean water. If this mechanism was in effect, detections in marine water sites would be lessfrequent while the frequency in fresh water sites would be similar. In fact, this proposal is weaklysupported by the observation that one or more petroleum hydrocarbons were detected at 24marine water sites in 1999 versus 20 in 1998. In contrast, one or more petroleum hydrocarbonswere detected in 11 fresh water sites in 1999 versus 13 in 1998.
Benzene was the only petroleum hydrocarbon detected for which a surface water regulatorystandard exists (71 ug/L as an annual average). The standard is approximately 88 times higherthan the maximum benzene concentration detected (0.81 ug/L).
As was the case in the 1998 survey, MTBE was the most commonly detected petroleumhydrocarbon. The frequency of detection of MTBE during the 1999 survey was lower than 1998(52% v. 73%) although the median concentration was similar (0.97 v. 1.37 ug/L). MTBE is anoctane enhancer for fuels. It has a significant solubility in water and is believed to enter surfacewater from the exhaust of 2-cycle engines, storm water runoff and rainfall (Zogorski, 1998).
Figure 5 depicts the distribution of MTBE in surface waters. In general, MTBE was detected lessfrequently and at lower levels in the 1999 survey as compared to 1998. While higher levels weredetected in the ICW below Port Everglades, little to none was detected north of the Port. Thelower detection rate of MTBE of the 1999 survey compared to the 1998 survey is surprising sincethe 1999 survey was performed during a stage of the tide when dilution of inland waters byseawater would have been less as compared to the 1998 study. The increased frequency ofdetection of other petroleum hydrocarbons in this study as compared to the initial study is alsopeculiar. With lower levels of MTBE detected, the other less water-soluble petroleumhydrocarbons would be expected to be less common while in fact, the inverse was observed. Onepossible cause for this observation is that the water was more recently contaminated withpetroleum products which permitted detection of the less soluble compounds before they had anopportunity to evaporate from the surface of the water. The improved detection limits of this study

14
may also be a factor.
MTBE has come under increased scrutiny throughout the country, especially where surface waterreservoirs are used as potable water supplies. In these circumstances, rainfall, storm water runoffand 2-cycle outboard motors are thought to contribute to contamination of the drinking watersupply. Since Broward County relies exclusively on groundwater, such sources are less likelyhere although surface water and ground water are closely tied. However, underground petroleumstorage tanks do present potential risks.
Fortunately, Broward County has in place operational and regulatory safeguards to preventcontamination from underground storage tanks. The Broward County Department of Planning andEnvironmental Protection maintains an on-going inspection program where trained and certifiedinspectors examine facilities with hazardous materials or underground storage tanks. This helpsensure the potential for contamination is resolved before it occurs and focuses specifically on astorage tank’s release detection systems, designed to provide a clear warning if leaks occur.
Along with the inspection program, the Broward County Commission has passed one of the state’sfew ordinances developed to ensure protection of our drinking water. Promulgated more thanfifteen years ago, this ordinance is designed to prevent the release of contaminants into ourdrinking water, placing special restrictions on businesses near the County’s drinking watersupplies. As such, only certain types of businesses may operate close to wells and even thosebusinesses are automatically considered high risk and are inspected at least twice a year. Further, public drinking water utilities are required to sample their water supplies routinely. Inaddition, Broward County requires businesses located near utility wells to install groundwatermonitoring systems that are tested quarterly for the hazardous materials they use or generate.
Finally, Broward County maintains an aggressive contamination cleanup program designed first toprevent the magnification of any groundwater contamination and second to clean up existingcontamination.
Based upon the data collected during routine, quarterly sampling to date and in light of thepreemptive steps outlined above, MTBE is currently not a problem in Broward County’s drinkingwater.

Figure 5
Broward CountyDepartment of Planning & Environmental Protection
Geographic Information Systems
$
$ $$
$
$
$
$$
$$
$$
$
$
$
$
$
$
$
$
$
$$
# #
#
#
#
#
#
#
#
#
#
#
##
#
#
#
#
#
#
# #
6
13
57
2
4
89
1615 49
28
18 10
19
17
27
20
25
26
33
24
14
13 11
2947
22
2138
36
89
12
31
39
35
23
90
41
32
37
34
40
110109
MTBEIN BROWARD COUNTY
SURFACE WATERS
July 20-21, 1999
>1.0 ug/l MTBE<1.0 ug/l MTBENo MTBE Detected
##
1 0 1 2 3 4 5 Miles
N
$
RS_PC;RSOODEEN:C;\GISDATA\MTBE_W PZ1a.APR

16
4.2 Chlorinated HydrocarbonsCompared to 1998, these compounds were detected slightly more commonly in 1999 but therange of concentrations were very similar. The distribution pattern was also similar. Onedifference was the increased frequency of detection of the parent chlorinated hydrocarbons thatwas evident in the 1999 survey. The lower detection limits of the current study may explain thisobservation.
Tetrachloroethene was the only chlorinated hydrocarbon detected for which a surface waterregulatory standard exists (8.85 ug/L as an annual average). The standard is approximately 295times higher than the maximum tetrachloroethene concentration detected (0.03 ug/L).
We proposed in the 1998 survey report that the source of the chlorinated hydrocarbondecomposition products might be the result of precursors such as tri- and tetrachloroetheneentering the groundwater via seepage from septic tanks. Subsequent to the publication of thereport on the 1998 survey, it was revealed that these compounds are widely distributed in theground water under the business and industrial areas on the periphery of the Fort Lauderdale-Hollywood International Airport (Frearson, 1999). As can be seen in Figure 3, these compoundswere also seen in the waterways surrounding this area. Although the source of the compounds inthe groundwater has not been established, it is likely that chlorinated hydrocarbon-contaminatedgroundwater is entering the surface waters in this area.
The detection of chlorinated hydrocarbons and their decomposition products in areas to the north,however, cannot be easily attributed to the groundwater contamination to the south. Becausesites 15, 16 and 19 are downstream of surface waters and down-gradient of ground water ofunsewered areas to the west, the detection of chlorinated hydrocarbons at these sites may resultfrom seepage from septic tanks. The analysis of samples of shallow groundwater in this areawould be useful in determining if septic tanks could be a source. The source of the compounds atsites 10 and 110 is more mysterious because it is far from the airport and in an area served bysanitary sewers.
Dry cleaning facilities use tetrachloroethene which is known to decompose in ground water intovinyl chloride, cis-1,2-dichloroethene and trans-1,2-dichloroethene and thus are potential sourcesof these compounds.
4.3 Naturally-Occurring VOCsAs was the case in the 1998 survey, bromoform was detected in the ICW in 1999 but at a muchlower frequency; 2 sites in 1999 versus 6 in 1998. It was proposed in the report of the 1998survey that the bromoform was produced by macro algae in the open ocean and carried inland bythe tide (DPEP, 1999). The lower frequency of detection in the 1999 survey can be explained bythe difference in the time of sampling relative to tidal stage. Since sampling for the 1999 surveyoccurred at an earlier stage of the incoming tide, bromoform-laden seawater would not haveentered the ICW to the same extent as during the 1998 survey which was done at a later stage ofthe incoming tide.
The surface water regulatory standard for bromoform is 360 ug/L as an annual average. Thisconcentration is 4500 times higher than the maximum bromoform concentration detected in thesurvey.

17
5.0 CONCLUSIONSThe VOCs detected in this survey fell into 3 general categories; petroleum hydrocarbons,chlorinated hydrocarbons and naturally-occurring hydrocarbons. While the exquisite sensitivity ofthe instrumentation used for the analyses resulted in the common detection of a variety of VOCs,none of the VOCs were detected at concentration levels even close to surface water regulatorystandards.
5.1 Petroleum HydrocarbonsWhile the finding of this study that MTBE is more commonly detected and at higher levels in theeastern areas of the county supports the suggestion that outboard engines are a significantsource of this compound in county waterways, the lack of detection in areas north of PortEverglades was perplexing. Other factors, however, such as marine traffic, weather, and tidalstage during sampling may be factors.
The increased frequency of detection of other petroleum hydrocarbons in this study as comparedto the initial study is also peculiar. With lower levels of MTBE detected, the other less water-soluble petroleum hydrocarbons would be expected to be less common while in fact, the inversewas observed. One possible cause for this observation is that the water was more recentlycontaminated with petroleum products which permitted detection of the less soluble compoundsbefore they had an opportunity to evaporate from the surface of the water. Another explanationcould be that ambient surface water, contaminated with MTBE from outboard engines had begunto move out with the tide. Subsequently, surface water runoff, contaminated with additionalpetroleum hydrocarbons, moved east with the outgoing tide. This "older" outgoing tide water thenmight represent an integration of upland sources while the more saline "newer" water exhibited agreater impact from outboard engines. Additional testing of storm water for VOCs might shed lighton the viability of this mechanism
Because of Broward County’s pro-active stance on industries handling hazardous materials in thevicinity of drinking water well fields, MTBE is not currently a problem in the county’s drinking watersupply.
5.2 Chlorinated HydrocarbonsThe potential sources of the chlorinated hydrocarbon decomposition products detected in thissurvey include contaminated groundwater under the business and industrial areas on theperiphery of airport and septic tank seepage. However, the detection of these compounds in otherareas suggests an as yet unidentified source. The release of tetrachloroethene from dry cleaning facilities, presently or historically, is a possible source.
5.3 Naturally-Occurring VOCsAlthough bromoform was detected less frequently and at lower levels in the 1999 as compared to1998, the fact that sampling was performed earlier in the incoming tide provides a reasonableexplanation for the observation. The only samples that contained bromoform were collected in theIntracoastal Waterway. The results of this survey further support the hypothesis that bromoform,produced by marine algae, enters the Intracoastal Waterway from the ocean.

18
6.0 LITERATURE CITEDDPEP (Department of Planning and Environmental Protection), 1999. “ A Survey of theOccurrence and Distribution of Volatile Organic Compounds in Broward County Surface Waters.”Technical Report Series TR:99-01. Broward County Department of Planning and EnvironmentalProtection, Fort Lauderdale, FL.
Frearson, Guy, 1999. Groundwater Investigation I-95 / I-595 Broward County, Florida FDEP Site#299. Metcalf & Eddy, Miramar, FL
FDEP (Florida Department of Environmental Protection), 1992. “Standard Operating Proceduresfor Laboratory Operations and Sample Collection Activities”, DEP-QA-001/92, includingsupplements specific to the activities of the Broward County Department of Planning andEnvironmental Protection, Environmental Monitoring Division, Fort Lauderdale, FL.
Federal Register, 1984. “Guidelines Establishing Test Procedures for the Analysis of PollutantsUnder the Clean Water Act; Final Rule and Interim Final Rule and Proposed Rule”, Appendix B to40 CFR Part 136, October 26, 1984.
Jandel Corp., 1992-95. SigmaStat for Windows, Version 2.0.
Manley, S.L., K. Goodwin, and W.J. North 1992. “Laboratory Production of bromoform, methylenebromide, and methyl iodide by macro algae and distribution in near shore southern Californiawaters”. Limnology and Oceanography, vol. 37, no. 8, pp. 1650-1652, 1992.
Nautical Software, 1996. Tides and Currents for Windows, v 2.0, Nautical Software, Inc.,Beaverton, OR 97007
USEPA (United States Environmental Protection Agency), 1986. Test Methods for EvaluatingSolid Waste, SW-846, 3rd ed. USEPA, Office of Solid Waste and Emergency Response,Washington, D.C.
Wood, Paul, Frances Parsons, Jack DeMarco, Hunt Harween, Russell Lang, Iris Payan, andMarister Ruiz 1981. “Introductory Study of the Biodegradation of the Chlorinated Methane,Ethane, and Ethene Compounds”. Drinking Water Research Center, Florida InternationalUniversity, Miami, Florida.
Zogorski, John 1998. VOC National Synthesis, National Water Quality Assessment Program,U.S. Geological Survey, Rapid City, SD. as reported in USEPA Nonpoint News-Notes,July/August 1998, Issue #52.

19
APPENDIXParameter List and Data Quality Objectives
PARAMETER PRECISION, %RD ACCURACY, % REC. MDL UNITS
1,1-DICHLOROETHENE 0-7.1 75.1-112.9 0.064 UG/L1,1-DICHLOROPROPENE 0-7.85 71.9-124.1 0.050 UG/L1,1-DICHLOROETHANE 0-10.7 78.0-130.3 0.026 UG/L1,1,1-TRICHLOROETHANE 0 -7.0 74.3-121.7 0.099 UG/L1,1,1,2 TETRACHLOROETHANE 0-7.1 71.7-128.3 0.029 UG/L1,1,2-TRICHLOROETHANE 0-7.25 81.2-126.8 0.050 UG/L1,1,2,2 TETRACHLOROETHANE 0-10.8 73.9-108.1 0.103 UG/L1,2-DIBROMOETHANE(EDB) 0-7.60 90.0-114.0 0.024 UG/L1,2-DICHLOROPROPANE 0-7.3 79.3-114.7 0.017 UG/L1,2-DICHLOROBENZENE 0-8.5 75.6-110.4 0.047 UG/L1,2-DICHLOROETHANE 0-9.6 89.8-107.9 0.024 UG/L1,2-DIBROMO-3-CHLOROPROPANE 0-8.7 79.1-104.0 0.139 UG/L1,2,3-TRICHLOROBENZENE 0-12.7 80.8-137.2 0.087 UG/L 1,2,3-TRICHLOROPROPANE 0-8.8 78.0-138.0 0.270 UG/L1,2,4-TRICHLOROBENZENE 0-7.2 81.0-135.0 0.036 UG/L1,2,4-TRIMETHYLBENZENE 0-14.7 75.0-123.0 0.037 UG/L1,3-DICHLOROPROPANE 0-128 78.9-113.1 0.080 UG/L1,3-DICHLOROBENZENE 0-15.1 78.6-119.4 0.037 UG/L1,3,5-TRIMETHYLBENZENE 0-15.3 71.6-120.4 0.053 UG/L1,4-DICHLOROBENZENE 0-8.9 83.2-122.8 0.060 UG/L2-CHLOROTOLUENE 0-118 73.2-106.8 0.039 UG/L2-CHLOROETHYL VINYL ETHER 0-12.4 94.4-107.6 0.071 UG/L2,2-DICHLOROPROPANE 0-4.8 56.0-115.0 0.052 UG/L4-CHLOROTOLUENE 0-8.2 74.4-123.6 0.028 UG/LBENZENE 0-10.5 87.1-110.9 0.024 UG/LBROMOBENZENE 0-9.9 83.5-116.5 0.033 UG/LBROMOCHLOROMETHANE 0-7.2 72.9-107.1 0.031 UG/LBROMODICHLOROMETHANE 0-129 86.3-103.7 0.053 UG/LBROMOFORM 0-8.9 81.8-120.2 0.028 UG/LBROMOMETHANE 0-6.0 71.6-118.4 0.312 UG/LC-1,2-DICHLOROETHENE 0-5.2 80.9-121.1 0.032 UG/LC-1,3-DICHLOROPROPENE 0-6.00 89.0-106.9 0.031 UG/LCARBON TETRACHLORIDE 0-23.5 61.8-106.2 0.077 UG/LCHLOROBENZENE 0-6.30 80.6-115.4 0.026 UG/LCHLOROETHANE 0-10.4 65.0-113.0 0.101 UG/LCHLOROFORM 0 -1.77 73.5-106.5 0.067 UG/LCHLOROMETHANE 0-6.4 68.1-117.9 0.099 UG/LDIBROMOCHLOROMETHANE 0-9.80 72.5-111.5 0.047 UG/LDIBROMOMETHANE 0-7.8 83.2-116.8 0.026 UG/LDICHLORODIFLUOROMETHANE 0-14.8 69.3-110.7 0.075 UG/LETHYLBENZENE 0-8.0 73.8-124.2 0.034 UG/LHEXACHLOROBUTADIENE 0-15.9 79.6-120.4 0.073 UG/LISOPROPYL BENZENE 0-16.8 78.9-119.1 0.033 UG/LMETA/PARA XYLENE 0-37.7 80.0-128.0 0.050 UG/LMETHYLENE CHLORIDE(DICHLOROMETHANE) 0-8.9 80.0-110.0 0.686 UG/LMETHYLTERTBUTYLETHER 0-11.1 76.7-115.3 0.075 UG/LN-PROPYLBENZENE 0-15.9 82.6-117.4 0.035 UG/LN-BUTYL BENZENE 0-14.4 77.2-122.8 0.046 UG/LNAPHTHALENE 0-11.1 78.2-129.8 0.305 UG/LORTHO XYLENE 0-8.4 80.8-125.2 0.032 UG/LPARA-ISOPROPYL TOLUENE 0-9.3 78.9-119.1 0.047 UG/LSEC-BUTYLBENZENE 0-5.30 77.2-122.8 0.047 UG/LSTYRENE 0-6.1 80.1-123.9 0.040 UG/LT-1,3-DICHLOROPROPENE 0-7.1 89.4-106.2 0.026 UG/LT-1,2-DICHLOROETHENE 0-8.4 77.4-108.6 0.041 UG/LTERT-BUTYLBENZENE 0-15.7 79.8-124.2 0.044 UG/LTETRACHLOROETHENE 0-5.60 71.0-107.0 0.022 UG/LTOLUENE 0-8.0 77.7-126.3 0.078 UG/LTRICHLOROETHENE 0-4.1 70.5-109.5 0.021 UG/LTRICHLOROFLUOROMETHANE 0-14.5 67.4-110.6 0.042 UG/LVINYL CHLORIDE 0-7.0 78.5-117.5 0.065 UG/L

20
APPENDIXData Table
All Concentrations in Micrograms/Liter Site #>> Blank Blank Blank Blank Blank 1 2 3 4 5 6 7 7-DUP DetectionDate>>>> 990720 990720 990721 990721 990720 990720 990720 990720 990720 990720 990720 990720 990720 MDL Criteria Time>>>> 1022 1005 945 945 955 1100 1245 1315 1345 1100 1140 1325 1335 Lab ID#> 68196 68197 68198 68199 68200 68201 68202 68203 68204 68205 68206 68207 68251 1,1-dichloroethane 0.026 NA ND ND ND ND ND ND ND ND ND ND ND ND ND 1,1-dichloroethene 0.063 NA ND ND ND ND ND ND ND ND ND ND ND ND ND 1,1-dichloropropene 0.050 NA ND ND ND ND ND ND ND ND ND ND ND ND ND 1,1,1-trichloroethane 0.099 NA ND ND ND ND ND ND ND ND ND ND ND ND ND 1,1,1,2-tetrachloroethane 0.029 NA ND ND ND ND ND ND ND ND ND ND ND ND ND 1,1,2-trichloroethane 0.050 NA ND ND ND ND ND ND ND ND ND ND ND ND ND 1,1,2,2-tetrachloroethane 0.103 NA ND ND ND ND ND ND ND ND ND ND ND ND ND 1,2-dibromo-3-chloropropan 0.140 NA ND ND ND ND ND ND ND ND ND ND ND ND ND 1,2-dibromoethane 0.030 NA ND ND ND ND ND ND ND ND ND ND ND ND ND 1,2-dichlorobenzene 0.047 NA ND ND ND ND ND ND ND ND ND ND ND ND ND 1,2-dichloroethane 0.024 NA ND ND ND ND ND ND ND ND ND ND ND ND ND 1,2-dichloropropane 0.017 NA ND ND ND ND ND ND ND ND ND ND ND ND ND 1,2,3-trichlorobenzene 0.087 NA ND ND ND ND ND ND ND ND ND ND ND ND ND 1,2,3-trichloropropane 0.270 NA ND ND ND ND ND ND ND ND ND ND ND ND ND 1,2,4-trichlorobenzene 0.036 0.105 ND ND ND ND ND ND ND ND ND ND ND ND ND 1,2,4-trimethylbenzene 0.037 NA ND ND 0.105 ND ND 0.130 ND ND 0.070 1.120 ND ND ND 1,3-dichlorobenzene 0.037 NA ND ND ND ND ND ND ND ND ND ND ND ND ND 1,3-dichloropropane 0.080 NA ND ND ND ND ND ND ND ND ND ND ND ND ND 1,3,5-trimethylbenzene 0.053 NA ND ND ND ND ND ND ND ND ND 0.330 ND ND ND 1,4-dichlorobenzene 0.060 0.177 ND 0.090 0.115 ND 0.140 ND ND ND ND ND ND ND ND 2-chloroethylvinylether 0.071 NA ND ND ND ND ND ND ND ND ND ND ND ND ND 2-chlorotoluene 0.039 NA ND ND ND ND ND ND ND ND ND ND ND ND ND 2,2-dichloropropane 0.052 NA ND ND ND ND ND ND ND ND ND ND ND ND ND 4-chlorotoluene 0.028 NA ND ND ND ND ND ND ND ND ND ND ND ND ND benzene 0.024 0.530 0.050 ND 0.120 ND ND 0.100 ND ND 0.040 0.630 0.030 0.040 0.040 brombenzene 0.035 NA ND ND ND ND ND ND ND ND ND ND ND ND ND bromochloromethane 0.031 NA ND ND ND ND ND ND ND ND ND ND ND ND ND bromodichloromethane 0.053 NA ND ND ND ND ND ND ND ND ND ND ND ND ND bromoform 0.028 NA ND ND ND ND ND ND ND ND ND ND ND ND ND bromomethane 0.312 NA ND ND ND ND ND ND ND ND ND ND ND ND ND carbon tetrachloride 0.077 NA ND ND ND ND ND ND ND ND ND ND ND ND ND chlorobenzene 0.026 NA ND ND ND ND ND ND ND ND ND ND ND ND ND chloroethane 0.101 NA ND ND ND ND ND ND ND ND ND ND ND ND ND chloroform 0.067 0.274 0.270 0.300 0.215 0.230 0.210 ND ND ND 0.070 0.100 ND 0.080 0.080 chloromethane 0.099 NA ND ND ND ND ND ND ND ND ND ND ND ND ND cis-1,2-dichloroethene 0.032 NA ND ND ND ND ND ND ND ND ND ND ND ND ND cis-1,3-dichloropropene 0.031 NA ND ND ND ND ND ND ND ND ND ND ND ND ND dibromochloromethane 0.047 NA ND ND ND ND ND ND ND ND ND ND ND ND ND dibromomethane 0.026 NA ND ND ND ND ND ND ND ND ND ND ND ND ND dichlorodifluoromethane 0.075 NA ND ND ND ND ND ND ND ND ND ND ND ND ND ethylbenzene 0.034 0.050 ND ND 0.050 ND ND 0.050 ND ND ND 0.600 ND ND ND hexachloro-1,3-butadiene 0.073 NA ND ND ND ND ND ND ND ND ND ND ND ND ND isopropylbenzene 0.033 NA ND ND ND ND ND ND ND ND ND 0.040 ND ND ND meta/para-xylene 0.050 0.394 0.120 ND 0.160 ND ND 0.180 ND ND 0.090 2.210 ND ND ND methylene chloride 0.686 2.986 2.930 2.520 2.020 1.290 2.350 ND ND ND ND ND ND ND ND methyltertbutylether 0.075 NA ND ND ND ND ND 0.470 0.300 0.250 0.270 5.200 1.160 2.660 2.700

21
APPENDIXData Table
All Concentrations in Micrograms/Liter
Site #>> Blank Blank Blank Blank Blank 1 2 3 4 5 6 7 7-DUP DetectionDate>>>> 990720 990720 990721 990721 990720 990720 990720 990720 990720 990720 990720 990720 990720 MDL Criteria Time>>>> 1022 1005 945 945 955 1100 1245 1315 1345 1100 1140 1325 1335 Lab ID#> 68196 68197 68198 68199 68200 68201 68202 68203 68204 68205 68206 68207 68251 naphthalene 0.305 NA ND ND ND ND ND ND ND ND ND 0.370 ND ND ND n-butylbenzene 0.046 NA ND ND ND ND ND ND ND ND ND ND ND ND ND n-propylbenzene 0.035 NA ND ND ND ND ND ND ND ND ND 0.150 ND ND ND ortho-xylene 0.032 0.300 0.060 ND 0.095 ND ND 0.080 ND ND 0.040 0.920 ND ND ND para-isopropyltoluene 0.047 NA ND ND ND ND ND ND ND ND ND ND ND ND ND sec-butylbenzene 0.047 NA ND ND ND ND ND ND ND ND ND ND ND ND ND styrene 0.040 0.750 ND ND 0.075 ND ND ND ND ND ND 0.110 ND ND ND tert-butylbenzene 0.044 NA ND ND ND ND ND ND ND ND ND ND ND ND ND tetrachloroethene 0.022 NA ND ND ND ND ND ND ND ND ND ND ND ND ND toluene 0.078 0.316 0.220 0.270 0.395 0.080 0.090 0.300 ND ND 0.170 2.500 ND 0.530 0.380 trans-1,2-dichloroethene 0.041 NA ND ND ND ND ND ND ND ND ND ND ND ND ND trans-1,3-dichloropropene 0.026 NA ND ND ND ND ND ND ND ND ND ND ND ND ND trichloroethene 0.022 NA ND ND ND ND ND ND ND ND ND ND ND ND ND trichlorofluoromethane 0.042 NA ND ND ND ND ND ND ND ND ND ND ND ND ND vinyl chloride 0.065 NA ND ND ND ND ND ND ND ND ND ND ND ND ND
***
Site #>> 10 11 12 13 13-Dup. 14 15 16 16-DUP 17 18 19 20 DetectionDate>>>> 990720 990721 990721 990721 990721 990721 990721 990721 990721 990721 990721 990721 990721 MDL Criteria Time>>>> 1025 910 940 1010 1015 1100 1040 1115 1122 1155 1345 1055 1100 Lab ID#> 68210 68211 68212 68213 68252 68214 68215 68216 68254 68217 68218 68219 68220 1,1-dichloroethane 0.026 NA ND ND ND ND ND ND ND ND ND ND ND ND ND 1,1-dichloroethene 0.063 NA ND ND ND ND ND ND ND ND ND ND ND ND ND 1,1-dichloropropene 0.050 NA ND ND ND ND ND ND ND ND ND ND ND ND ND 1,1,1-trichloroethane 0.099 NA ND ND ND ND ND ND ND ND ND ND ND ND ND 1,1,1,2-tetrachloroethane 0.029 NA ND ND ND ND ND ND ND ND ND ND ND ND ND 1,1,2-trichloroethane 0.050 NA ND ND ND ND ND ND ND ND ND ND ND ND ND 1,1,2,2-tetrachloroethane 0.103 NA ND ND ND ND ND ND ND ND ND ND ND ND ND 1,2-dibromo-3-chloropropan 0.140 NA ND ND ND ND ND ND ND ND ND ND ND ND ND 1,2-dibromoethane 0.030 NA ND ND ND ND ND ND ND ND ND ND ND ND ND 1,2-dichlorobenzene 0.047 NA ND ND ND ND ND ND ND ND ND ND ND ND ND 1,2-dichloroethane 0.024 NA ND ND ND ND ND ND ND ND ND ND ND ND ND 1,2-dichloropropane 0.017 NA ND ND ND ND ND ND ND ND ND ND ND ND ND 1,2,3-trichlorobenzene 0.087 NA ND ND ND ND ND ND ND ND ND ND ND ND ND 1,2,3-trichloropropane 0.270 NA ND ND ND ND ND ND ND ND ND ND ND ND ND 1,2,4-trichlorobenzene 0.036 0.105 ND ND ND ND ND ND ND ND ND ND ND ND ND 1,2,4-trimethylbenzene 0.037 NA 0.230 0.040 ND ND ND 0.120 0.060 ND ND ND ND 0.040 ND 1,3-dichlorobenzene 0.037 NA ND ND ND ND ND ND ND ND ND ND ND ND ND 1,3-dichloropropane 0.080 NA ND ND ND ND ND ND ND ND ND ND ND ND ND 1,3,5-trimethylbenzene 0.053 NA 0.080 ND ND ND ND ND ND ND ND ND ND ND ND 1,4-dichlorobenzene 0.060 0.177 ND ND ND ND ND ND ND ND ND ND ND ND ND 2-chloroethylvinylether 0.071 NA ND ND ND ND ND ND ND ND ND ND ND ND ND 2-chlorotoluene 0.039 NA ND ND ND ND ND ND ND ND ND ND ND ND ND 2,2-dichloropropane 0.052 NA ND ND ND ND ND ND ND ND ND ND ND ND ND 4-chlorotoluene 0.028 NA ND ND ND ND ND ND ND ND ND ND ND ND ND benzene 0.024 0.530 0.150 ND ND 0.030 ND 0.110 0.140 ND ND ND ND 0.100 0.060 brombenzene 0.035 NA ND ND ND ND ND ND ND ND ND ND ND ND ND

22
APPENDIXData Table
All Concentrations in Micrograms/Liter
Site #>> 10 11 12 13 13-Dup. 14 15 16 16-DUP 17 18 19 20 DetectionDate>>>> 990720 990721 990721 990721 990721 990721 990721 990721 990721 990721 990721 990721 990721 MDL Criteria Time>>>> 1025 910 940 1010 1015 1100 1040 1115 1122 1155 1345 1055 1100 Lab ID#> 68210 68211 68212 68213 68252 68214 68215 68216 68254 68217 68218 68219 68220 bromochloromethane 0.031 NA ND ND ND ND ND ND ND ND ND ND ND ND ND bromodichloromethane 0.053 NA ND ND ND ND ND ND ND ND ND ND ND ND ND bromoform 0.028 NA ND ND ND ND ND ND ND ND ND ND ND ND ND bromomethane 0.312 NA ND ND ND ND ND ND ND ND ND ND ND ND ND carbon tetrachloride 0.077 NA ND ND ND ND ND ND ND ND ND ND ND ND ND chlorobenzene 0.026 NA ND ND ND ND ND ND ND ND ND ND ND ND ND chloroethane 0.101 NA ND ND ND ND ND ND ND ND ND ND ND ND ND chloroform 0.067 0.274 0.090 0.140 0.130 0.100 0.120 0.140 0.100 ND ND ND ND 0.100 ND chloromethane 0.099 NA ND ND ND ND ND ND ND ND ND ND ND ND ND cis-1,2-dichloroethene 0.032 NA 0.040 ND ND ND ND ND 0.040 0.200 0.200 ND ND 0.050 0.050 cis-1,3-dichloropropene 0.031 NA ND ND ND ND ND ND ND ND ND ND ND ND ND dibromochloromethane 0.047 NA ND ND ND ND ND ND ND ND ND ND ND ND ND dibromomethane 0.026 NA ND ND ND ND ND ND ND ND ND ND ND ND ND dichlorodifluoromethane 0.075 NA ND ND ND ND ND ND ND ND ND ND ND ND ND ethylbenzene 0.034 0.050 0.130 ND ND ND ND 0.070 0.050 ND ND ND ND ND ND hexachloro-1,3-butadiene 0.073 NA ND ND ND ND ND ND ND ND ND ND ND ND ND isopropylbenzene 0.033 NA ND ND ND ND ND ND ND ND ND ND ND ND ND meta/para-xylene 0.050 0.394 0.410 0.050 ND ND ND 0.230 0.160 ND ND ND ND 0.070 0.100 methylene chloride 0.686 2.986 ND ND ND ND ND ND ND ND ND ND ND ND ND methyltertbutylether 0.075 NA 2.310 0.480 0.630 1.370 0.970 1.050 1.530 0.270 0.280 ND ND 1.260 2.340 naphthalene 0.305 NA ND ND ND ND ND ND ND ND ND ND ND ND ND n-butylbenzene 0.046 NA ND ND ND ND ND ND ND ND ND ND ND ND ND n-propylbenzene 0.035 NA ND ND ND ND ND ND ND ND ND ND ND ND ND ortho-xylene 0.032 0.300 0.180 ND ND ND ND 0.100 0.070 ND ND ND ND ND 0.050 para-isopropyltoluene 0.047 NA ND ND ND ND ND ND ND ND ND ND ND ND ND sec-butylbenzene 0.047 NA ND ND ND ND ND ND ND ND ND ND ND ND ND styrene 0.040 0.750 ND ND ND ND ND ND ND ND ND ND ND ND ND tert-butylbenzene 0.044 NA ND ND ND ND ND ND ND ND ND ND ND ND ND tetrachloroethene 0.022 NA ND ND ND ND ND ND ND 0.030 0.030 ND ND ND ND toluene 0.078 0.316 1.240 0.100 ND ND ND 0.290 0.310 ND ND ND ND 0.150 0.150 trans-1,2-dichloroethene 0.041 NA ND ND ND ND ND ND ND ND ND ND ND ND ND trans-1,3-dichloropropene 0.026 NA ND ND ND ND ND ND ND ND ND ND ND ND ND trichloroethene 0.022 NA ND ND ND ND ND ND ND ND ND ND ND ND ND trichlorofluoromethane 0.042 NA ND ND ND ND ND ND ND ND ND ND ND ND ND vinyl chloride 0.065 NA ND ND ND ND ND ND ND ND ND ND ND ND 0.280
***
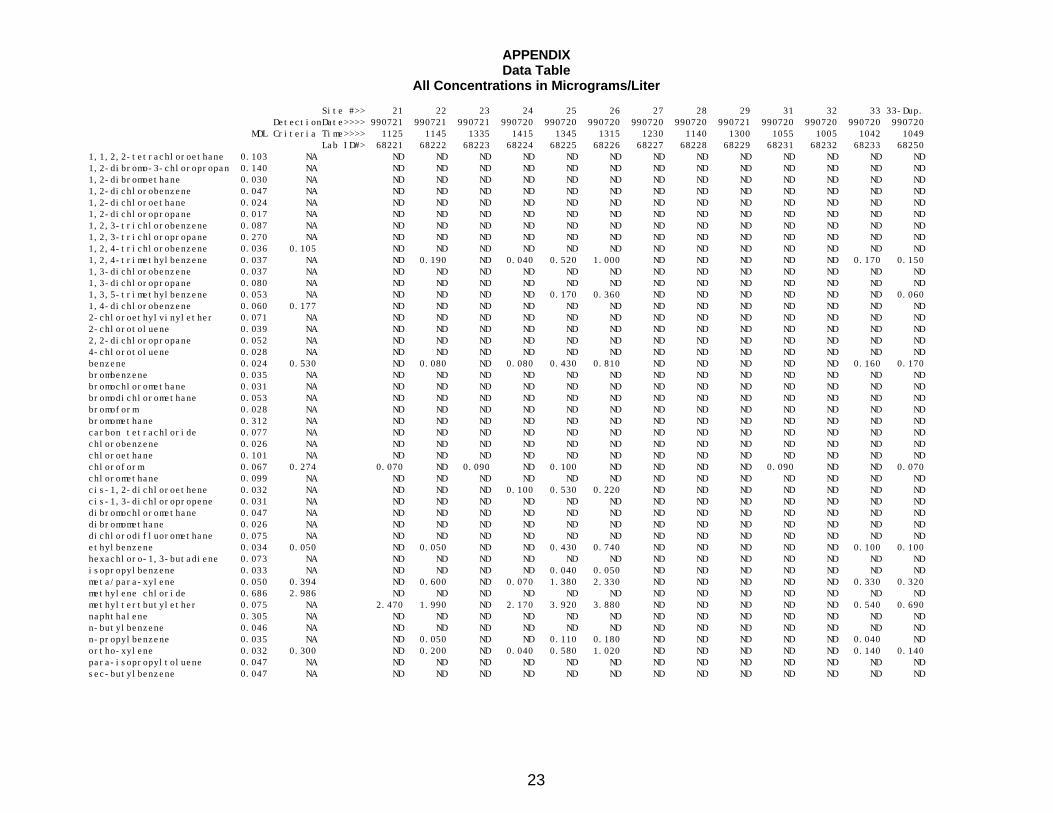
Site #>> 21 22 23 24 25 26 27 28 29 31 32 33 33-Dup. DetectionDate>>>> 990721 990721 990721 990720 990720 990720 990720 990720 990721 990720 990720 990720 990720 MDL Criteria Time>>>> 1125 1145 1335 1415 1345 1315 1230 1140 1300 1055 1005 1042 1049 Lab ID#> 68221 68222 68223 68224 68225 68226 68227 68228 68229 68231 68232 68233 68250 1,1-dichloroethane 0.026 NA ND ND ND 0.030 0.040 0.090 ND ND ND ND ND ND ND 1,1-dichloroethene 0.063 NA ND ND ND ND ND ND ND ND ND ND ND ND ND 1,1-dichloropropene 0.050 NA ND ND ND ND ND ND ND ND ND ND ND ND ND 1,1,1-trichloroethane 0.099 NA ND ND ND ND ND ND ND ND ND ND ND ND ND 1,1,1,2-tetrachloroethane 0.029 NA ND ND ND ND ND ND ND ND ND ND ND ND ND 1,1,2-trichloroethane 0.050 NA ND ND ND ND ND ND ND ND ND ND ND ND ND
23
APPENDIXData Table
All Concentrations in Micrograms/Liter
Site #>> 21 22 23 24 25 26 27 28 29 31 32 33 33-Dup. DetectionDate>>>> 990721 990721 990721 990720 990720 990720 990720 990720 990721 990720 990720 990720 990720 MDL Criteria Time>>>> 1125 1145 1335 1415 1345 1315 1230 1140 1300 1055 1005 1042 1049 Lab ID#> 68221 68222 68223 68224 68225 68226 68227 68228 68229 68231 68232 68233 68250 1,1,2,2-tetrachloroethane 0.103 NA ND ND ND ND ND ND ND ND ND ND ND ND ND 1,2-dibromo-3-chloropropan 0.140 NA ND ND ND ND ND ND ND ND ND ND ND ND ND 1,2-dibromoethane 0.030 NA ND ND ND ND ND ND ND ND ND ND ND ND ND 1,2-dichlorobenzene 0.047 NA ND ND ND ND ND ND ND ND ND ND ND ND ND 1,2-dichloroethane 0.024 NA ND ND ND ND ND ND ND ND ND ND ND ND ND 1,2-dichloropropane 0.017 NA ND ND ND ND ND ND ND ND ND ND ND ND ND 1,2,3-trichlorobenzene 0.087 NA ND ND ND ND ND ND ND ND ND ND ND ND ND 1,2,3-trichloropropane 0.270 NA ND ND ND ND ND ND ND ND ND ND ND ND ND 1,2,4-trichlorobenzene 0.036 0.105 ND ND ND ND ND ND ND ND ND ND ND ND ND 1,2,4-trimethylbenzene 0.037 NA ND 0.190 ND 0.040 0.520 1.000 ND ND ND ND ND 0.170 0.150 1,3-dichlorobenzene 0.037 NA ND ND ND ND ND ND ND ND ND ND ND ND ND 1,3-dichloropropane 0.080 NA ND ND ND ND ND ND ND ND ND ND ND ND ND 1,3,5-trimethylbenzene 0.053 NA ND ND ND ND 0.170 0.360 ND ND ND ND ND ND 0.060 1,4-dichlorobenzene 0.060 0.177 ND ND ND ND ND ND ND ND ND ND ND ND ND 2-chloroethylvinylether 0.071 NA ND ND ND ND ND ND ND ND ND ND ND ND ND 2-chlorotoluene 0.039 NA ND ND ND ND ND ND ND ND ND ND ND ND ND 2,2-dichloropropane 0.052 NA ND ND ND ND ND ND ND ND ND ND ND ND ND 4-chlorotoluene 0.028 NA ND ND ND ND ND ND ND ND ND ND ND ND ND benzene 0.024 0.530 ND 0.080 ND 0.080 0.430 0.810 ND ND ND ND ND 0.160 0.170 brombenzene 0.035 NA ND ND ND ND ND ND ND ND ND ND ND ND ND bromochloromethane 0.031 NA ND ND ND ND ND ND ND ND ND ND ND ND ND bromodichloromethane 0.053 NA ND ND ND ND ND ND ND ND ND ND ND ND ND bromoform 0.028 NA ND ND ND ND ND ND ND ND ND ND ND ND ND bromomethane 0.312 NA ND ND ND ND ND ND ND ND ND ND ND ND ND carbon tetrachloride 0.077 NA ND ND ND ND ND ND ND ND ND ND ND ND ND chlorobenzene 0.026 NA ND ND ND ND ND ND ND ND ND ND ND ND ND chloroethane 0.101 NA ND ND ND ND ND ND ND ND ND ND ND ND ND chloroform 0.067 0.274 0.070 ND 0.090 ND 0.100 ND ND ND ND 0.090 ND ND 0.070 chloromethane 0.099 NA ND ND ND ND ND ND ND ND ND ND ND ND ND cis-1,2-dichloroethene 0.032 NA ND ND ND 0.100 0.530 0.220 ND ND ND ND ND ND ND cis-1,3-dichloropropene 0.031 NA ND ND ND ND ND ND ND ND ND ND ND ND ND dibromochloromethane 0.047 NA ND ND ND ND ND ND ND ND ND ND ND ND ND dibromomethane 0.026 NA ND ND ND ND ND ND ND ND ND ND ND ND ND dichlorodifluoromethane 0.075 NA ND ND ND ND ND ND ND ND ND ND ND ND ND ethylbenzene 0.034 0.050 ND 0.050 ND ND 0.430 0.740 ND ND ND ND ND 0.100 0.100 hexachloro-1,3-butadiene 0.073 NA ND ND ND ND ND ND ND ND ND ND ND ND ND isopropylbenzene 0.033 NA ND ND ND ND 0.040 0.050 ND ND ND ND ND ND ND meta/para-xylene 0.050 0.394 ND 0.600 ND 0.070 1.380 2.330 ND ND ND ND ND 0.330 0.320 methylene chloride 0.686 2.986 ND ND ND ND ND ND ND ND ND ND ND ND ND methyltertbutylether 0.075 NA 2.470 1.990 ND 2.170 3.920 3.880 ND ND ND ND ND 0.540 0.690 naphthalene 0.305 NA ND ND ND ND ND ND ND ND ND ND ND ND ND n-butylbenzene 0.046 NA ND ND ND ND ND ND ND ND ND ND ND ND ND n-propylbenzene 0.035 NA ND 0.050 ND ND 0.110 0.180 ND ND ND ND ND 0.040 ND ortho-xylene 0.032 0.300 ND 0.200 ND 0.040 0.580 1.020 ND ND ND ND ND 0.140 0.140 para-isopropyltoluene 0.047 NA ND ND ND ND ND ND ND ND ND ND ND ND ND sec-butylbenzene 0.047 NA ND ND ND ND ND ND ND ND ND ND ND ND ND

24
APPENDIXData Table
All Concentrations in Micrograms/Liter
Site #>> 21 22 23 24 25 26 27 28 29 31 32 33 33-Dup. DetectionDate>>>> 990721 990721 990721 990720 990720 990720 990720 990720 990721 990720 990720 990720 990720 MDL Criteria Time>>>> 1125 1145 1335 1415 1345 1315 1230 1140 1300 1055 1005 1042 1049 Lab ID#> 68221 68222 68223 68224 68225 68226 68227 68228 68229 68231 68232 68233 68250 styrene 0.040 0.750 ND ND ND ND ND ND ND ND ND ND ND ND ND tert-butylbenzene 0.044 NA ND ND ND ND ND ND ND ND ND ND ND ND ND tetrachloroethene 0.022 NA ND ND ND ND ND ND ND ND ND ND ND ND ND toluene 0.078 0.316 ND ND ND 0.170 1.980 3.540 ND ND ND ND ND 1.040 0.820 trans-1,2-dichloroethene 0.041 NA ND ND ND ND ND ND ND ND ND ND ND ND ND trans-1,3-dichloropropene 0.026 NA ND ND ND ND ND ND ND ND ND ND ND ND ND trichloroethene 0.022 NA ND ND ND ND ND ND ND ND ND ND ND ND ND trichlorofluoromethane 0.042 NA ND ND ND ND ND ND ND ND ND ND ND ND ND vinyl chloride 0.065 NA ND ND ND ND 0.410 0.480 ND ND ND ND ND ND ND
***
Site #>> 34 35 36 37 38 39 40 41 41-Dup. 47 49 89 90 DetectionDate>>>> 990720 990720 990720 990720 990721 990721 990721 990721 990721 990721 990721 990721 990721 MDL Criteria Time>>>> 1155 1230 1320 1435 945 1030 1115 1245 1250 1037 1000 1135 1045 Lab ID#> 68234 68235 68236 68237 68238 68239 68240 68241 68253 68247 68249 68289 68290 1,1-dichloroethane 0.026 NA ND ND ND ND ND ND ND ND ND ND ND ND ND 1,1-dichloroethene 0.063 NA ND ND ND ND ND ND ND ND ND ND ND ND ND 1,1-dichloropropene 0.050 NA ND ND ND ND ND ND ND ND ND ND ND ND ND 1,1,1-trichloroethane 0.099 NA ND ND ND ND ND ND ND ND ND ND ND ND ND 1,1,1,2-tetrachloroethane 0.029 NA ND ND ND ND ND ND ND ND ND ND ND ND ND 1,1,2-trichloroethane 0.050 NA ND ND ND ND ND ND ND ND ND ND ND ND ND 1,1,2,2-tetrachloroethane 0.103 NA ND ND ND ND ND ND ND ND ND ND ND ND ND 1,2-dibromo-3-chloropropan 0.140 NA ND ND ND ND ND ND ND ND ND ND ND ND ND 1,2-dibromoethane 0.030 NA ND ND ND ND ND ND ND ND ND ND ND ND ND 1,2-dichlorobenzene 0.047 NA ND ND ND ND ND ND ND ND ND ND ND ND ND 1,2-dichloroethane 0.024 NA ND ND ND ND ND ND ND ND ND ND ND ND ND 1,2-dichloropropane 0.017 NA ND ND ND ND ND ND ND ND ND ND ND ND ND 1,2,3-trichlorobenzene 0.087 NA ND ND ND ND ND ND ND ND ND ND ND ND ND 1,2,3-trichloropropane 0.270 NA ND ND ND ND ND ND ND ND ND ND ND ND ND 1,2,4-trichlorobenzene 0.036 0.105 ND ND ND ND ND ND ND ND ND ND ND ND ND 1,2,4-trimethylbenzene 0.037 NA 0.180 0.150 0.600 0.060 0.130 ND ND 0.370 0.450 0.520 ND 1.580 ND 1,3-dichlorobenzene 0.037 NA ND ND ND ND ND ND ND ND ND ND ND ND ND 1,3-dichloropropane 0.080 NA ND ND ND ND ND ND ND ND ND ND ND ND ND 1,3,5-trimethylbenzene 0.053 NA 0.060 0.060 0.180 ND ND ND ND 0.110 0.120 0.180 ND 0.440 ND 1,4-dichlorobenzene 0.060 0.177 ND ND ND ND ND ND ND ND ND ND ND ND ND 2-chloroethylvinylether 0.071 NA ND ND ND ND ND ND ND ND ND ND ND ND ND 2-chlorotoluene 0.039 NA ND ND ND ND ND ND ND ND ND ND ND ND ND 2,2-dichloropropane 0.052 NA ND ND ND ND ND ND ND ND ND ND ND ND ND 4-chlorotoluene 0.028 NA ND ND ND ND ND ND ND ND ND ND ND ND ND benzene 0.024 0.530 0.130 0.180 0.530 0.080 0.110 0.130 ND 0.260 0.300 0.290 ND 0.800 0.040 brombenzene 0.035 NA ND ND ND ND ND ND ND ND ND ND ND ND ND bromochloromethane 0.031 NA ND ND ND ND ND ND ND ND ND ND ND ND ND bromodichloromethane 0.053 NA ND ND ND ND ND ND ND ND ND ND ND ND ND bromoform 0.028 NA ND ND ND ND 0.040 ND ND 0.040 0.120 ND ND ND ND bromomethane 0.312 NA ND ND ND ND ND ND ND ND ND ND ND ND ND carbon tetrachloride 0.077 NA ND ND ND ND ND ND ND ND ND ND ND ND ND chlorobenzene 0.026 NA ND ND ND ND ND ND ND ND ND ND ND ND ND

25
APPENDIXData Table
All Concentrations in Micrograms/Liter
Site #>> 34 35 36 37 38 39 40 41 41-Dup. 47 49 89 90 DetectionDate>>>> 990720 990720 990720 990720 990721 990721 990721 990721 990721 990721 990721 990721 990721 MDL Criteria Time>>>> 1155 1230 1320 1435 945 1030 1115 1245 1250 1037 1000 1135 1045 Lab ID#> 68234 68235 68236 68237 68238 68239 68240 68241 68253 68247 68249 68289 68290 chloroethane 0.101 NA ND ND ND ND ND ND ND ND ND ND ND ND ND chloroform 0.067 0.274 ND ND ND ND 0.080 ND ND ND 0.070 ND 0.070 0.160 ND chloromethane 0.099 NA ND ND ND ND ND ND ND ND ND ND ND ND ND cis-1,2-dichloroethene 0.032 NA ND ND ND ND ND ND ND ND ND 0.090 ND ND ND cis-1,3-dichloropropene 0.031 NA ND ND ND ND ND ND ND ND ND ND ND ND ND dibromochloromethane 0.047 NA ND ND ND ND ND ND ND ND ND ND ND ND ND dibromomethane 0.026 NA ND ND ND ND ND ND ND ND ND ND ND ND ND dichlorodifluoromethane 0.075 NA ND ND ND ND ND ND ND ND ND ND ND ND ND ethylbenzene 0.034 0.050 0.100 0.100 0.280 ND 0.080 0.080 ND 0.160 0.180 0.280 ND 0.950 ND hexachloro-1,3-butadiene 0.073 NA ND ND ND ND ND ND ND ND ND ND ND ND ND isopropylbenzene 0.033 NA ND ND ND ND ND ND ND ND ND ND ND 0.070 ND meta/para-xylene 0.050 0.394 0.370 0.350 1.010 0.110 0.260 0.280 ND 0.550 0.640 1.000 ND 3.280 ND methylene chloride 0.686 2.986 ND ND ND ND ND ND ND ND ND ND ND ND ND methyltertbutylether 0.075 NA 2.280 3.940 5.770 3.000 1.820 1.270 1.380 1.790 1.940 2.030 1.620 3.380 0.940 naphthalene 0.305 NA ND ND 0.450 ND ND ND ND ND 0.470 ND ND 0.480 ND n-butylbenzene 0.046 NA ND ND ND ND ND ND ND ND ND ND ND ND ND n-propylbenzene 0.035 NA ND ND 0.080 ND ND ND ND 0.050 0.050 0.080 ND 0.220 ND ortho-xylene 0.032 0.300 0.170 0.150 0.520 0.050 0.110 0.150 ND 0.270 0.340 0.430 ND 1.470 ND para-isopropyltoluene 0.047 NA ND ND ND ND ND ND ND ND ND ND ND ND ND sec-butylbenzene 0.047 NA ND ND ND ND ND ND ND ND ND ND ND ND ND styrene 0.040 0.750 ND ND ND ND ND ND ND ND ND ND ND ND ND tert-butylbenzene 0.044 NA ND ND ND ND ND ND ND ND ND ND ND ND ND tetrachloroethene 0.022 NA ND ND ND ND ND ND ND ND ND ND ND ND ND toluene 0.078 0.316 0.730 0.740 1.500 0.190 0.410 0.370 ND 0.780 0.920 1.280 ND 3.990 ND trans-1,2-dichloroethene 0.041 NA ND ND ND ND ND ND ND ND ND ND ND ND ND trans-1,3-dichloropropene 0.026 NA ND ND ND ND ND ND ND ND ND ND ND ND ND trichloroethene 0.022 NA ND ND ND ND ND ND ND ND ND ND ND ND ND trichlorofluoromethane 0.042 NA ND ND ND ND ND ND ND ND ND ND ND ND ND vinyl chloride 0.065 NA ND ND ND ND ND ND ND ND ND ND ND ND ND
***
Site #>> 109 110 DetectionDate>>>> 990720 990720 MDL Criteria Time>>>> 1425 1205 Lab ID#> 68309 68310 1,1-dichloroethane 0.026 NA ND 0.060 1,1-dichloroethene 0.063 NA ND ND 1,1-dichloropropene 0.050 NA ND ND 1,1,1-trichloroethane 0.099 NA ND ND 1,1,1,2-tetrachloroethane 0.029 NA ND ND 1,1,2-trichloroethane 0.050 NA ND ND 1,1,2,2-tetrachloroethane 0.103 NA ND ND 1,2-dibromo-3-chloropropan 0.140 NA ND ND 1,2-dibromoethane 0.030 NA ND ND 1,2-dichlorobenzene 0.047 NA ND 0.070 1,2-dichloroethane 0.024 NA ND ND 1,2-dichloropropane 0.017 NA ND ND

26
APPENDIXData Table
All Concentrations in Micrograms/Liter
Site #>> 109 110 DetectionDate>>>> 990720 990720 MDL Criteria Time>>>> 1425 1205 Lab ID#> 68309 68310 1,2,3-trichlorobenzene 0.087 NA ND ND 1,2,3-trichloropropane 0.270 NA ND ND 1,2,4-trichlorobenzene 0.036 0.105 ND ND 1,2,4-trimethylbenzene 0.037 NA 0.120 ND 1,3-dichlorobenzene 0.037 NA ND 0.050 1,3-dichloropropane 0.080 NA ND ND 1,3,5-trimethylbenzene 0.053 NA ND ND 1,4-dichlorobenzene 0.060 0.177 ND 0.120 2-chloroethylvinylether 0.071 NA ND ND 2-chlorotoluene 0.039 NA ND ND 2,2-dichloropropane 0.052 NA ND ND 4-chlorotoluene 0.028 NA ND ND benzene 0.024 0.530 0.090 ND brombenzene 0.035 NA ND ND bromochloromethane 0.031 NA ND ND bromodichloromethane 0.053 NA ND ND bromoform 0.028 NA ND ND bromomethane 0.312 NA ND ND carbon tetrachloride 0.077 NA ND ND chlorobenzene 0.026 NA ND ND chloroethane 0.101 NA ND ND chloroform 0.067 0.274 0.080 ND chloromethane 0.099 NA ND ND cis-1,2-dichloroethene 0.032 NA ND 0.150 cis-1,3-dichloropropene 0.031 NA ND ND dibromochloromethane 0.047 NA ND ND dibromomethane 0.026 NA ND ND dichlorodifluoromethane 0.075 NA ND 0.230 ethylbenzene 0.034 0.050 0.070 ND hexachloro-1,3-butadiene 0.073 NA ND ND isopropylbenzene 0.033 NA ND ND meta/para-xylene 0.050 0.394 0.200 ND methylene chloride 0.686 2.986 ND ND methyltertbutylether 0.075 NA 0.710 0.260 naphthalene 0.305 NA ND ND n-butylbenzene 0.046 NA ND ND n-propylbenzene 0.035 NA ND ND ortho-xylene 0.032 0.300 0.090 ND para-isopropyltoluene 0.047 NA ND ND sec-butylbenzene 0.047 NA ND ND styrene 0.040 0.750 ND ND tert-butylbenzene 0.044 NA ND ND tetrachloroethene 0.022 NA ND ND toluene 0.078 0.316 0.250 ND trans-1,2-dichloroethene 0.041 NA ND ND trans-1,3-dichloropropene 0.026 NA ND ND

27
APPENDIXData Table
All Concentrations in Micrograms/Liter
Site #>> 109 110 DetectionDate>>>> 990720 990720 MDL Criteria Time>>>> 1425 1205 Lab ID#> 68309 68310 trichloroethene 0.022 NA ND ND trichlorofluoromethane 0.042 NA ND ND vinyl chloride 0.065 NA ND ND

28
APPENDIXSample Site Descriptions
Site # Latitude Longitude Description 1 26 19 30.0 080 05 27.6 HILLSBORO CANAL; FEDERAL HIGHWAY (US 1) - HILLSBORO CANAL
2 26 19 40.8 080 07 51.6 HILLSBORO CANAL; W SIDE OF SALINITY CONTROL STRUCTURE - HILLSBOROCANAL
3 26 19 37.2 080 12 10.8 HILLSBORO CANAL; STATE RD. 7 (US 441) - HILLSBORO CANAL
4 26 21 10.8 080 17 24.0 HILLSBORO CANAL; BRIDGE TO SOUTHEAST GROWERS' ASSOCIATION-HILLSBORO CANAL
5 26 13 19.2 080 06 14.4 POMPANO CANAL; FEDERAL HIGHWAY (US 1) - POMPANO CANAL
6 26 12 21.6 080 07 58.8 CYPRESS CREEK CANAL; DIXIE HIGHWAY BRIDGE - CYPRESS CREEK CANAL
7 26 13 08.4 080 10 15.6 CYPRESS CREEK CANAL; SOUTH PALMAIRE DRIVE - CYPRESS CREEK CANAL
8 26 13 48.0 080 12 18.0 POMPANO CANAL; STATE RD 7 - POMPANO CANAL
9 26 13 48.0 080 15 10.8 POMPANO CANAL; UNIVERSITY DRIVE - POMPANO CANAL
10 26 08 16.8 080 07 04.8 MIDDLE RIVER; E SUNRISE BLVD - MIDDLE RIVER
11 26 10 22.8 080 10 15.6 MIDDLE RIVER; NW 21ST AVE BRIDGE - MIDDLE RIVER
12 26 10 22.8 080 11 13.2 MIDDLE RIVER; NW 31ST AVE - MIDDLE RIVER
13 26 10 22.8 080 13 15.6 MIDDLE RIVER; ROCK ISLAND RD - MIDDLE RIVER
14 26 09 00.4 080 15 25.2 MIDDLE RIVER; UNIVERSITY DRIVE - MIDDLE RIVER
15 26 07 04.8 080 08 38.4 NEW RIVER; ANDREWS AVE BRIDGE - NEW RIVER
16 26 07 15.6 080 09 46.8 NORTH FORK NEW RIVER; BROWARD BLVD - NORTH FORK NEW RIVER

29
APPENDIXSample Site Descriptions
Site # Latitude Longitude Description 17 26 08 06.0 080 11 42.0 PLANTATION CANAL; W SIDE OF SALINITY CONTROL STRUCTURE - PLANTATION
CANAL
18 26 08 06.0 080 12 46.8 PLANTATION CANAL; NW 9TH DRIVE - PLANTATION CANAL
19 26 06 32.4 080 09 32.4 S FORK NEW RIVER; RIVER REACH CONDO - SEAWALL E SIDE OF S FORK OFNEW RIVER
20 26 05 13.2 080 11 02.4 NORTH FORK NEW RIVER; BRADFORD MARINA DOCK - NORTH FORK NEW RIVER
21 26 05 49.2 080 14 16.8 NORTH NEW RIVER CANAL; W SIDE OF FLOOD CONTROL STRUCTURE ON THENORTH NEW RIVER CANAL 1/4 MI W OF TURNPIKE
22 26 06 57.6 080 19 01.2 NORTH NEW RIVER CANAL; SW 125TH AVE BRIDGE OVER NORTH NEW RIVERCANAL (C15)
23 26 07 19.2 080 20 34.8 NORTH NEW RIVER CANAL; US 27 AT NORTH NEW RIVER CANAL
24 26 03 32.4 080 08 38.4 DANIA CUTOFF CANAL; US 1 BRIDGE OVER DANIA CUTOFF CANAL
25 26 02 52.8 080 09 18.0 HOLLYWOOD CANAL; STIRLING ROAD BRIDGE OVER THE HOLLYWOOD CANAL (EOF BRYAN BLVD)
26 26 04 04.8 080 10 08.4 DANIA CUTOFF CANAL; RAVENSWOOD ROAD BRIDGE OVER THE DANIA CUTOFFCANAL
27 26 03 57.6 080 12 32.4 SOUTH NEW RIVER CANAL; WEST SIDE OF FLOOD CONTROL STRUCTURE ONSOUTH NEW RIVER CANAL
28 26 03 46.8 080 18 50.4 SOUTH NEW RIVER CANAL; FLAMINGO ROAD BRIDGE OVER THE SOUTH NEWRIVER CANAL
29 26 03 39.6 080 26 02.4 SOUTH NEW RIVER CANAL; US 27 BRIDGE OVER THE SOUTH NEW RIVER CANAL
31 25 57 50.4 080 18 43.2 SNAKE CREEK CANAL; FLAMINGO ROAD BRIDGE OVER THE SNAKE CREEK CANAL

30
32 25 57 25.2 080 25 55.2 SNAKE CREEK CANAL; US 27 BRIDGE OVER THE SNAKE CREEK CANAL
33 26 18 50.4 080 04 55.2 ICW; HILLSBORO BLVD BRIDGE OVER THE INTRACOASTAL WATERWAY
34 26 15 39.6 080 05 02.4 ICW; HILLSBORO INLET; 100' N OF MARKER 71; 50' W OF E BANK
35 26 15 00.0 080 05 27.6 ICW; 100' N OF NE 14TH STREET BRIDGE; E FENDER; 100' W OF EAST BANK
36 26 11 20.4 080 06 14.4 ICW; 100' N OF COMMERCIAL BLVD BRIDGE E FENDER; 100' W OF EAST BANK
37 26 08 16.8 080 06 32.4 ICW; 100' N OF SUNRISE BLVD BRIDGE E FENDER; 100' W OF E BANK
38 26 06 00.0 080 07 12.0 ICW; 100' N OF 17TH STREET CAUSEWAY BRIDGE E FENDER 100' W OF E BANK
39 26 03 57.6 080 06 54.0 ICW; 300' N OF MARKER #35; 50' W OF E BANK
40 26 02 02.4 080 07 04.8 ICW; 100' N OF SHERIDAN STREET BRIDGE E FENDER; 50' W OF E BANK; WESTLAKE PROJECT SITE #W-3.
41 25 59 09.6 080 07 15.6 ICW; 100' N OF HALLANDALE BEACH BLVD BRIDGE E FENDER; 50' W OF E BANK
47 26 03 46.8 080 07 04.8 DANIA CUTOFF CANAL; DANIA CUTOFF CANAL; 200' W OF ICW
49 26 07 12.0 080 07 19.2 SOSPIRO CANAL; LAS OLAS ISLE BRIDGE OVER SOSPIRO CANAL
89 26 05 06.0 080 10 55.2 POMPANO CANAL; CENTER OF CANAL W SIDE OF NOB HILL ROAD BRIDGE OVERPOMPANO CANAL N OF SOUTHGATE ROAD
90 26 13 44.4 080 16 55.2 S FORK NEW RIVER; E BANK OF S FORK NEW RIVER ABOUT 15 METERS N OFSERVICE ROAD
109 26 13 19.2 080 13 48.0 CANAL; POMPANO. AT ROCK ISLAND ROAD BRIDGE OVER THE POMPANO CANAL . SAMPLE FROM EAST SIDE OF BRIDGE.
110 26 13 52.0 080 07 38.0 CANAL; POMPANO. AT DIXIE HIGHWAY. SAMPLE FROM CULVERT WEST OF DIXIEHIGHWAY AT ATLANTIC BLVD.

1. TITLE AND SUBTITLE
A Second Survey of the Occurrence and Distribution of Volatile Organic Compounds inBroward County Surface Waters
2. REPORT DATE
April 2000
3. CONTRIBUTORS
Maria Fernandez, Russ Rand, Nancy Holsing, Aniel Pierre-Louis, Rob Jensen, andGeorge F. Riley
4. PERFORMING ORGANIZATION REPORT NO.
Technical Report SeriesTR:00-03
5. RESPONSIBLE DEPARTMENT AND DIVISION
Broward County Department of Planning and Environmental Protection218 SW 1st AvenueFort Lauderdale, Fl 33301
6. STRATEGIC ASSESSMENT PROGRAMELEMENT NO.
7. CONTRACT/GRANT NO.
8. SPONSORING AGENCY NAME AND ADDRESS
Broward County Department of Planning and Environmental Protection218 SW 1st AvenueFort Lauderdale, Fl 33301
9. TYPE OF REPORT AND PERIOD COVERED
Technical, July, 1999
10. SUPPLEMENTARY NOTES
11. ABSTRACT
Broward County surface waters were tested in 1999 to determine the occurrence and distribution of volatile organic compounds (VOCs). Thistesting was performed to confirm the findings of an initial survey performed in 1998 when a variety of VOCs were detected. In general, the VOCsdetected in both surveys fell into 3 groups: 1) petroleum hydrocarbons, 2) chlorinated hydrocarbons and their decomposition products and 3)naturally-occurring VOCs.
Petroleum hydrocarbon VOCs detected in the 1999 survey are common components of motor fuels. A total of 104 VOC detections were recordedin the 1999 survey as compared to 42 detections in the 1998 survey. The increased frequency of detection is believed to be due to an inprovementin the analytical methodology used in the 1999 survey.
One of the petroleum hydrocarbons detected in both surveys, methyl tert butyl ether (MTBE), has recently been the subject of attention because ofits detection in the drinking water supplies in communities across the nation. The risk of MTBE contamination of Broward County drinking watersupplies, however, is minimal because of safeguards that have been in place for several years.
Chlorinated hydrocarbons and their decomposition products were also detected in both surveys. While the range of concentrations found in bothsurveys were similarly, the frequency of their detection was greater in the 1999 study and is also believed to be the result of the improved analyticalmethodology. These VOCs enter surface water through recharge by contaminated ground water. This mechanism was particularly evident in thevicinity of the airport where wide-spread contmaination of ground water by vinyl chloride has been documented.
The naturally-occurring VOC was bromoform. While it was detected less often in the 1999 study, its distribution was restricted to the IntracoastalWaterway. The results of the current 1999 supported the proposition that bromoform, produced by marine algae in the ocean, entered the inlandwaters through tidal action.
12. KEY WORDS
Surface WaterPetroleum HydrocarbonsOutboard MotorsMethyltertbutyletherMTBE
13. DISTRIBUTION STATEMENT
Unlimited
14. NO. COPIES IN FIRSTPRINTING
15. NO. OF PAGES
31
16. COST PER UNIT