Embed Size (px)
Citation preview

Soil microbes in organic vegetable production: New insights from pyrosequencingThe response of soil microbial communities to organic and conventional fertilization
A final report to The Ceres Trust
Principal Investigators:
Dr. Karen GarrettDepartment of Plant PathologyKansas State UniversityManhattan, KS, [email protected]
Dr. An JumpponenDivision of BiologyKansas State UniversityManhattan, KS, [email protected]
Dr. Megan KennellyDepartment of Plant PathologyKansas State UniversityManhattan, KS, [email protected]
Collaborators:
Lorena Gomez-Montano, M.S.Department of Plant PathologyKansas State UniversityManhattan, KS, [email protected]
Funding provided by Ceres Trust
Project period: Spring 2010 to Summer 2012
Report submitted: November 2012
Ceres Trust report: Soil microbes in organic vegetable production: New insights from pyrosequencing

Project Summary
Technologies for studying the composition of microbial communities are developing at a veryrapid pace. A challenge for agriculture is how to use these technologies to support sustainableproduction. Soil microbial communities play fundamental roles in the productivity ofagricultural systems. Organic methods may foster more diverse soil microbial communitiesbeneficial for crop production that may reduce losses to pathogens and increase plantproductivity.
We evaluated bacterial and fungal community responses in an established long-termexperimental system comparing organic vs. conventional nutrient management for tomatoproduction. This experiment was designed in collaboration with organic growers to representcurrent management practices. We used 454 pyrosequencing to simultaneously evaluate DNAfrom hundreds of thousands of microbes in soil samples, including species that could not becultured using traditional techniques. We also compared the microbial communities recoveredfrom analysis of DNA, rapidly becoming a standard technique, and from RNA, a new approach.Comparing communities recovered through DNA and RNA allowed comparison of the generalpool of microbes (DNA) and the microbes that were actively metabolizing (RNA). Werecovered a large number of taxa known to have important agroecological roles, and other taxawhose roles are yet to be known.
Our first hypothesis was that microbial diversity would be higher in organic compared toconventional agriculture, and the results supported this hypothesis. Our second hypothesis wasthat microbial diversity would be higher in DNA than in RNA samples, but higher diversity wassometimes observed in RNA samples. This may have occurred because DNA samples weredominated by a smaller number of taxa with tough dormant structures.
We are building on these analyses in a second Ceres Trust project evaluating organicmanagement effects on microbial communities. Both these projects are the PhD research ofLorena Gomez-Montano, and the projects have also engaged two undergraduate students so far.In addition to a journal article we have published about new experiments that may contribute tounderstanding microbial community function (Garrett et al, 2012), the results presented in thisreport will be published in a peer-reviewed journal.
Introduction
Significance of the project to organic agricultureA central idea in organic agriculture is that crop management using organic approaches helps tomaintain and develop microbial communities that provide important ecosystem services. Theseservices may include biocontrol by microbes that compete with pathogens, microbialcontributions to nutrient cycling and plant nutrient uptake, or microbial contributions to soilorganic matter formation. An important stumbling block to understanding the effects of organicsystems on microbial communities has been the limitations of techniques available for studyingthese communities. New techniques, e.g., 454 sequencing (pyrosequencing), makeunprecedented environmental analyses affordable. Primers that are specific to a taxonomic group(Eubacteria, Fungi, Eukarya) can be used to generate lists of the relative frequencies of microbes
Ceres Trust report: Soil microbes in organic vegetable production: New insights from pyrosequencing - 2

across multiple levels of taxonomic hierarchy (e.g., Acosta-Martinez et al., 2008). Thecombination of these high throughput tools with DNA-tagging (see Dowd et al., 2008;Jumpponen and Jones, 2010) allows microbial community analyses with adequate replication toaddress novel and important questions in detail never before available. The taxonomic identity ofmicrobes can often be derived from public databases (GenBank) and used to infer functionalroles such as beneficial mycorrhizal associates or well-known pathogens or pathogenantagonists. This new type of information allows a much more complete definition of the natureof soil microbial resources, necessary for sustainable management.
Microbial communities in soil help to maintain the productivity and health of agriculturalsystems (Pankhurst et al., 1996). Soil microbiota play key roles in most of the functionalprocesses that support terrestrial ecosystems, including nutrient acquisition and recycling,degradation of agrochemicals, and nutrient cycling (Pankhurst et al., 1996; van der Heijden et al.,2008). This capacity of soil to function as a vital living system able to fulfill all these functionsdefines 'soil quality' (Karlen et al., 1997). Microbial diversity represents the repertoire of geneticdiversity that supports the health of soil (Jain et al., 2005). However, despite the importance ofsoil microorganisms, very little is known about their diversity and community structure (Fierer etal., 2007). In this regard, taxonomic approaches to estimating diversity of soil microbialcommunities have been limited by the traditional methods and the non-culturability of themajority of the microbial species present in soil (Fierer et al., 2007; Rondon et al., 2000).Extraction of the total RNA from soil has been used to quantify the abundance of Proteobacteria,Actinobacteria, Bacteria and Eukarya under different field management regimes (fertilization,tillage, and the effect of historical cultivation on microbial community) before pyrosequencingwas available for characterization (Buckley and Schmidt, 2001). Most recently, metagenomicand small subunit rRNA-based sequence analysis techniques have measured the genetic diversityof Bacteria, Archaea, Fungi and Viruses in soils collected from different ecosystems (prairie,desert and rainforest) (Fierer et al., 2007; Jumpponen, 2011). The use of 454-sequencingtechniques allows analysis of millions of microorganisms, bypassing culturing (Roesch et al.,2007), and the recent development of sample-specific sequence tags (DNA tagging) for thistechnique allows simultaneous analysis of large numbers of individual samples, making DNAsequencing and analysis more efficient (Acosta-Martinez et al., 2008; Jumpponen and Jones,2009; Lauber et al., 2009; Roesch et al., 2007).
Recently two studies used pyrosequencing to evaluate the effects of organic and conventionalmanagement on soil communities. Sugiyama et al. (2010) studied soil fungi and oomycetes inthree organic and three conventional potato fields in Colorado, concluding that taxa classified asAlternaria spp. and Ulocladium spp. were more common in conventional farms while Pythiumultimum was more common in organic farms. Sugiyama et al. (2010) also concluded thatmicrobial communities in the organic farms were both more diverse and had higher evenness,potentially because of added composts or lack of pesticide use. Chaudhry et al. (2012) studiedbacterial communities in a long-term organic field and a long-term conventional field inMaharashtra State, India, concluding that the organic field had higher bacterial diversity.
We studied the effects of organic and conventional soil fertilization in a long-term experiment inOlathe, Kansas. By using a designed experiment with replication we can draw more directinference about the effects of particular treatments, to complement observational studies of the
Ceres Trust report: Soil microbes in organic vegetable production: New insights from pyrosequencing -3
differences among organic and conventional farms. We characterized the soil bacterialcommunity composition in organic agriculture compared to conventional management, for twofertility levels (high and low) in a tomato crop. We also compared the microbial communitiesrecovered when sampling DNA (which may include dormant microbes) and the microbialcommunities recovered when sampling RNA, later processed as cDNA (which includes thosemicrobes that are more actively metabolizing).
Project Objectives
1. Characterize microbial communities in a long-term experiment with conventional andorganic management of fertility levels
2. Evaluate the differences in bacterial and fungal communities depending on whether they aresampled through DNA or RNA
3. Provide training for a graduate student and undergraduate students through these projects
Our hypotheses included:a. Organic management will result in higher microbial diversity than conventional managementb. Microbial communities detected through RNA (cDNA) will be less diverse than those
detected through DNA
Materials and Methods
Our project built on a long-term experiment addressing organic and conventional agriculture.This USDA-IOP research project, "Effects of organic fertility management on crop health andphytochemical content of vegetables under open field and high tunnel production," is managedunder the guidance of a grower advisory panel of organic farmers and grower educators. Fertilitytreatments under this project were planned in consultation with this group and were perceived tobe relevant to common current grower practices. The research plots, which have been undercontinuous organic management since 2002 were USDA certified in 2003 and each year since2006. Indiana Certified Organic is the inspector.
Study locationThe field study was at the K-State Horticulture Center in Olathe, KS, in an experimentcomparing organic (Indiana Organic Certification) and conventional fertilization. These fieldplots have been maintained in place for six years and consist of three replicate plots for eachcombination of management treatment (organic and conventional) and three levels offertilization (high, medium, and low nitrogen, with levels as identified by organic growers).Including the comparison of DNA and cDNA gives a split-split plot design with whole plots(organic vs. conventional treatment) in a randomized complete block design. Each subplot towhich fertilizer treatments were applied was 10.6 ft by 20 ft. Our analysis includes the threereplicate plots for two levels of fertilization (high and low nitrogen), for a total of 12experimental units. We have chosen the two extreme levels of fertilizer to compare the soilbacterial community responses, and to compare bacterial community DNA and cDNA. Wesampled during the tomato part of the crop rotation in the system, following pac choi 'Mei QingChoi'. Buckwheat was used as a cover crop between plantings in all plots.
Ceres Trust report: Soil microbes in organic vegetable production: New insights from pyrosequencing - 4

Fertilizer treatmentsHigh: Pre-plant fertilizer, and liquid fertilizer.• High conventional: soluble fertilizer of KNOs and Ca(NC>3)2 + inorganic pre-plant fertilizer• High organic: fish hydrolysate, and compost pre-plant fertilizerLow (or control): No added fertilizer, for either conventional or organic treatments.
Soil samplingSoil samples were collected September 23, 2010, after harvest of the tomato plants. From eachexperimental unit, four 15 cm deep 5 cm dia. cores were collected in a systematic samplingscheme that avoided the edges of the plots. The subsamples from within each experimental unitwere bulked, homogenized and stored on a cooler with blue -ice until 2.0g was transferred into a15 ml bead tube that had 1.5 g beads (these bead tubes are components of the kit: RNAPowerSoil, Total RNA Isolation, MoBio, Carlsbad, CA, USA), additionally we first added 5 mlof LifeGuard solution (LifeGuard Soil Preservation solution, Mo Bio, Carlsbad, CA, USA) intoeach bead tube to protect the RNA integrity while the samples were transported from the field tothe lab.
RNA and DNA isolation from the soil samplesRNA was isolated from the soil samples used the Total RNA Isolation kit (MoBio, Carlsbad,CA, USA), following the instructions from the manufacturer. DNA was isolated from the samesoil samples with the RNA PowerSoil DNA Elution Accessory kit (Mo Bio, Carlsbad, CA,USA), following the manufacturer's instructions. The extracted RNA samples were eluted in100 ul of solution SR7 (which is RNase/DNase free water and comes with the Total RNAIsolation kit) with 100 U of RNaseOUT (40 U/ul; Invitrogen, Carlsbad, CA, USA) to inhibitRNA degradation before reverse transcription. DNA contamination was removed from the RNAextracts using RQ1 RNase-free DNase (Promega, Madison, WI, USA) prior to first-strandcomplementary DNA (cDNA) synthesis. The extracted DNA samples were eluted in 100 ul ofsolution S5 (which is RNase/DNase free water and comes with the DNA Elution Accessory kit)To confirm the absence of contamination during the extraction a blank sample was carriedthrough the extraction protocol and downstream sample processing. The RNA extracts werestored in -80 C until further processed. The extracted DNA samples were eluted in 100 ul ofRNase/DNase free water, and stored in -80 C until further processed.
Reverse transcription of soil samplesThe extracted RNAs were quantified with an ND 1000 spectrometer (NanoDrop Technologies,Wilmington, DE, USA), and 100 ng for each extracted RNA sample along with the blankextraction control were reverse -transcribed using the Thermoscript reverse transcription PCR(RT-PCR) two-step system (Invitrogen, Carlsbad, CA, USA). Universal bacterial primers 27f(Lane, 1991) and 338R were used for PCR amplification of the VI-V2 hypervariable regions ofthe 16S rRNA genes. For fungi, the primers LROR and LR3 (Vilgalys and Hester 1994) wereused for PCR amplification of the D1-D2 divergent regions of the 28S rRNA genes.To denature the rRNAs before the cDNA synthesis, 100 ng of RNA for each one of the sampleswas combined with 1^1 of nuclease-free 10 uM 338R primer, 2 ul of 10 mM dNTPs, and thecorresponding volume (in ul) of nuclease free H2O for a 12 ul final volume. Samples wereincubated at 65 °C for 5 min in an Eppendorf Mastercycler (Eppendorf, Hamburg, Germany).The denatured RNAs were transferred to ice and combined with 4 ul of 5 x cDNA buffer, 1 ul of
Ceres Trust report: Soil microbes in organic vegetable production: New insights from pyrosequencing - 5

0.1 M DTT, 1 pi of RNaseOUT (Invitrogen, Carlsbad, CA, USA), 1 ul nuclease free H2O, and 1ul ThermoScript Reverse Transcriptase or Platinum Tag DNA Polymerase (Invitrogen, Carlsbad,CA, USA) which was used as the control for DNA contamination. The cDNAs were synthesizedin the Eppendorf Mastercycler at 50°C for 60 min, and the synthesized cDNAs were returned toice until PCR amplification.
PCR amplificationThe reverse-transcribed cDNAs were PCR-amplified with Amplitaq Gold 360 PCR Master Mix(Applied Biosystems, USA) with bacterial-specific primers (27F and 338R) that target a ca. 311bp region of the SSU, while GoTaq Hot Start DNA polymerase (Promega, Madison, WI, USA)was used with fungal-specific primers (LROR and LR3) that target a ca. 630 bp region of theLSU.
Bacteria. The PCR reactions were conducted in a 25 ul volume with 12.5 |j.l of Amplitaq Gold360 PCR Master Mix (Applied Biosystems, USA), 2.5 ul of 10 uM forward and reverse primers,and 2 u.1 of the cDNA template plus 5.5 ul of nuclease free water. The PCR reactions werecarried out with initial 10 min denaturation at 95 °C followed by 34 cycles of 1 min at 95 °C, 1min at 50 °C, 2 min at 72°C, and a terminal elongation at 72°C for 7 min. Longer extension stepswere chosen to minimized the chimeric PCR products (Jumpponen, 2007). After this firstamplification, a second PCR reaction was conducted to add the A and B adapters required fordirect 454 sequencing of the variable regions VI-V2 of the bacterial small subunit of theribosome (16S rRNA) amplicons using massively parallel sequencing (MPS) (Margulies et al.,2005). For this purpose, two new primer constructs were synthesized where the 454-sequencingprimer (A-primer) and the forward primer (27F) with a ten base pair (bp) DNA tag for post-sequencing sample identification in between, or the DNA capture bead anneal primer (B-primer)for the emulsion PCR (emPCR) and the reverse primer (338 R) to make the single strands onbeads as required for 454 pyrosequencing (Margulies et al., 2005). The resulting sequences wereas follows: 27 F-5'-CCATCTCATCCCTGCGTGTCTCCGACTCAGNNNNNNNNNNAGAGTTTGATCCTGGCTCAG-3', and338R-5'-CCTATCCCCTGTGTGCCTTGGCAGTCTCAGTGCTGCCTCCCGTAGGAGT-3'where the underlined sequences are the 454 primers A and B, respectively, and the bold lettersdenote the universal 16S rRNA primers 27 F and 338 R. The 10 bp barcode within primer 27 F isdenoted by 10 Ns. The second PCR reaction was carried out with initial 10 min denaturation at95 °C followed by 5 cycles of 1 min at 95 °C, 1 min at 50 °C, 2 min at 72°C, and a terminalelongation at 72°C for 7 min.Fungi The PCR reactions were conducted in a 25 u,l volume with 2.5 ul of 10 uM forward andreverse primers, 5 \i\f the cDNA template, 100 uM of each deoxynucleotide triphosphate, 2.5mM MgCb, 1 unit GoTaq Hot Start DNA polymerase (Promega, Madison, Wisconsin), 5 ulGreen Go Taq Flexi PCR buffer (Promega, Madison, Wisconsin) plus 4.8 ul of nuclease freewater. The PCR reactions were carried out with initial 10 min denaturation at 95 °C followed by34 cycles of 1 min at 95 °C, 1 min at 53 °C, 2 min at 72°C, and a terminal elongation at 72°C for7 min. After this first amplification, a second PCR reaction was conducted to add the A and Badapters required for direct 454 sequencing of the divergent regions D1-D2 of the fungal largesubunit of the ribosome (28S rRNA) amplicons using massively parallel sequencing (MPS)(Margulies et al., 2005). For this purpose, two new primer constructs were synthesized where the454-sequencing primer (A-primer) and the forward primer (LROR) with a ten base pair (bp)
Ceres Trust report: Soil microbes in organic vegetable production: New insights from pyrosequencing - 6

DNA tag for post-sequencing sample identification in between, or the DNA capture bead annealprimer (B-primer) for the emulsion PCR (emPCR) and the reverse primer (LR3) to make thesingle strands on beads as required for 454 pyrosequencing (Margulies et al., 2005). Theresulting sequences were as follows: LROR-5'-CCATCTCATCCCTGCGTGTCTCCGACTCAGNNNNNNNNNNCCGCTGAACTTAAGCATATCAATA-3', andLR3-5'-CCTATCCCCTGTGTGCCTTGGCAGTCTCAGCCGTGTTTCAAGACGGG-3'where the underlined sequences are the 454 primers A and B, respectively, and the bold lettersdenote the universal 28S rRNA primers LROR and LR3. The 10 bp barcode within primerLROR is denoted by 10 Ns. The second PCR reaction was carried out with initial 10 mindenaturation at 95 °C followed by 5 cycles of 1 min at 95 °C, 1 min at 53 °C, 2 min at 72°C, anda terminal elongation at 72°C for 7 min.
The amplification of target-sized amplicons for bacteria and fungi was confirmed by horizontalgel electrophoresis. The PCR products were purified with Agencourt AMPure PRC purificationsystem (AgenCourt Bioscience, Beverly, MA, USA) following the manufacturer's instructions.This clean-up system was selected because it discriminates against fragments of less than 100 bpin size, removes salts, enzymes and effectively eliminates dimers of the fusion primer constructsthat exceed 40 bp in size. The clean fungal and bacterial PCR products were again quantifiedwith the ND1000 spectrometer.
Control reactionsTo account for contaminating nucleic acids in the samples, three controls were included. First, toaccount for RNA/DNA contamination from the extraction system, a blank extraction withoutsample was carried through the extraction protocol. Second, to account for PCR reagent-bornecontaminants, a PCR control without template DNA was included in the PCR. Third, to accountfor DNA carryover through the RNA extraction, a control where Thermoscript reversetranscriptase was replaced with Platinum Taq polymerase was included. All these controlsremained free of contaminants and yielded no visible PCR amplicons.
Analysis of the sequence dataThe cDNA and DNA bacterial and fungal sequences were submitted to the computationalpipeline PyroTagger v. 1.0 (Kunin and Hugenholts, 2010). This pipeline removed low qualitybases and shorter sequences based on a quality filtering and length trimming. Using thealgorithm 'pyroclust', the sequences were grouped in clusters at 97% similarity. Thesequences were assigned to operational taxonomic units (OTUs) using RDP (RibosomalDatabase Project) tools (Cole et al., 2009).
Diversity indices, common taxa, and taxon responses to treatmentsFrom the derived OTU (Operational Taxonomic Unit) frequency data, we calculated Simpson'sdiversity index and Shannon's index for each plot. These diversity indices were used to testhypotheses about diversity responses among the treatments in an analysis of variance using SAS(SAS Institute Inc., Gary, NC). We also evaluated the most frequent taxa in the samples, andhow individual taxa responded to the experimental treatments in generalized linear mixedmodels.
Ceres Trust report: Soil microbes in organic vegetable production: New insights from pyrosequencing - 7
Results
Common taxa, and taxa responding to experimental treatments
Bacteria
The total number of bacterial sequences obtained in the field plots was 780,266. Morebacterial and archaeal phyla were found to be more frequent in soil samples when DNAwas extracted compared to RNA extraction (cDNA) (Figs. 1 and 2). The samples included twophyla (Crenarchaeota and Euryarchaeota) that are classified in the archaea domain. The phylumDictyoglomi, only present in the cDNA samples, usually grows at high temperatures (Euzeby,2011). A total of 991 genera of bacteria were obtained from the RDP classifier. Some of thegenera include taxa with important ecological roles in the nitrogen cycle or in theproduction of antibiotics (Figs. 3 and 4). Others contain taxa that are plant pathogens that cancause important losses in crops. We recovered a number of genera of bacteria that have knownroles in agroecological systems.
Some bacterial phyla and genera assignments responded to differences between organic andconventional management and to fertility treatments, and some were recovered in differentfrequencies from cDNA compared to DNA (Tables 1-4). Some of the observed managementeffects were on assignments to genera that are often important to plant health, such asPseudomonas. Other genus assignments included taxa important to nitrogen fixation, such asRhizobium, taxa important in nitrogen cycling, such as Azotobacter and Nitrospira, and taxaoften important in plant disease, such as Streptomyces and Erwinia.
Fungi
A smaller number of fungal sequences were obtained, but estimated fungal responses to fertilitytreatment were large. The Ascomycota dominated the fungi, particularly in the DNA samples(Figs. 5 and 6). The assignment of sequence clusters to genera also showed greater dominanceby a small number of genera for DNA samples (Figs 7 and 8). Common genus assignmentsincluded taxa often important to plant health, such as Olpidium (Fig. 7).
Most fungal phylum assignments and many genus assignments were recovered in differentfrequencies in cDNA and DNA samples (Tables 5 and 6). Significant differences in cDNA vs.DNA recovery were noted for genus assignments often important to plant health, includingAspergillus, Glomus, Colletotrichum, Eutypa, and Alternaria.
Diversity measures
The bacterial community exhibited higher diversity as measured by Simpson's diversity fororganic management-high fertility compared to the other treatments (p = 0.13, Fig. 9). There wassome evidence for a three-way interaction (management type * fertilizer level * DNA vs cDNA;p = 0.13, Fig. 9). The main difference in Simpson's diversity appears to be the higher levels ofdiversity for the organic high fertility treatment compared to other treatments. In an AOV,bacterial diversity in the conventional high fertility and organic high fertility treatments was
Ceres Trust report: Soil microbes in organic vegetable production: New insights from pyrosequencing - 8

different (p = 0.03, Fig .9), and there was also some evidence for differences between theconventional control and organic high fertility treatments (p = 0.06, Fig. 9), in both cases forboth DNA and cDNA. Differences in diversity between DNA and cDNA were observed only forthe organic control treatment (p = 0.03, Fig. 9).
Also for the bacterial community there was some evidence for a three-way interaction forShannon's index (management type * fertilizer level * DNA vs cDNA; p = 0.06, Fig. 10). Therewere statistical differences in Shannon's index between these DNA and cDNA for the organicmanagement-high fertility treatment combination (p = 0.01, Fig. 10), as well as some evidencefor differences between DNA vs cDNA for the conventional management-high fertilitycombination (p = 0.09, Fig. 10) and for the organic management-control combination (p = 0.06,Fig. 10).
For fungi, our initial estimate of the overall mean Simpson's diversity was 0.914, while the meanfor DNA samples was 0.874 and the mean for cDNA samples was 0.967. Fungal diversity waslower than bacterial diversity, as anticipated. We are continuing the analysis of the effects offertility treatments on soil fungal populations in our current Ceres Trust project.
Discussion and Conclusions
Common taxaThe analysis of soils in this experiment indicated a number of taxa known to have importantroles in agroecological systems (Tables 1 -6, Figs 1 -8), such as Rhizobium (nitrogen fixingbacteria), Glomus (mycorrhizal fungi), andAlternaria (often plant pathogens). This illustratesthe power of pyrosequencing to characterize a community broadly and provide insights about thewhole microbial community. Interpretation of this broad community has some limitations,however, in terms of the functional roles of taxa. While some taxa have very consistentfunctional roles, other groups, such as Pseudomonas spp., include important pathogens andimportant natural biocontrol agents. Another caveat for interpreting results is the uncertainty incategorizing taxonomic groups based on sequence databases, such that there may be errors inclassification, particularly for lower taxonomic levels such as genera and species. When thesetwo limitations are kept in mind, the exciting insights from these new sequencing techniques canbe evaluated with appropriate caution.
Fertility management and taxa frequencyMany taxa responded to the fertility management treatments in the long-term experiment (Tables1 and 3). For example, taxa classified as Pseudomonas exhibited a significant management(organic vs. conventional) by fertility level interaction. The frequency of Pseudomonasrecovered from DNA in high fertility organic management was twice the frequency in thecontrol, while it was lower in conventional treatments and did not shift as much withconventional fertility treatments. Evaluating cDNA captured this difference even morestrikingly, where the frequency in the high fertility organic management was six times that in thecontrol treatment. Sampling RNA (to yield cDNA) should give information about the mostactive taxa, and it appears that for taxa like Pseudomonas the effect of the fertility treatment wasmost detectable in this sample.
Ceres Trust report: Soil microbes in organic vegetable production: New insights from pyrosequencing - 9

Sampling DNA compared to RNAComparing evaluation of DNA samples to RNA samples (processed as cDNA) revealed somegeneral differences in the total microbe community (DNA) compared to the active microbecommunity (RNA, cDNA). Several taxa were recovered in different frequencies from DNAcompared to cDNA. There were broad differences at the level of bacterial phyla, where forexample Gemmatimonadetes were approximately twice as common in DNA samples than incDNA samples and several other phyla exhibited significant differences as well (Table 4).Fungal phyla also showed striking differences, where the strongly dominant Ascomycota becamesomewhat less common in cDNA samples, allowing other phyla to increase in frequency (Table6). A number of genera also differed, where for example Glomus, Olpidium, Alternaria, andEutypa were more frequent in cDNA samples while Aspergillus and Colletotrichum were morefrequent in DNA samples (Tables 2 and 5). Some of the differences between DNA and cDNAmay be due to the ability of some taxa to produce tough dormant (or dead) structures that canpersist and be accessed through DNA sampling while they are not found in cDNA sampling.Several taxa that have proven difficult to recover from soil in the past were recovered here incDNA samples, such as the Glomeromycota, an extremely important group for the properfunctioning of soil and plant health. Recovery of the Blastocladiomycota, many of which arepathogens, also suggests that this approach may be useful for evaluating biocontaminants. Therecovery of Neocallimastigomycota is interesting, because these are often symbiotic associates ofruminants. If this annotation is correct, it suggests that there may be a novel group of soil fungithat deserves further study.
Microbial diversityThe observations for microbial diversity support our initial hypotheses. Bacterial diversity asmeasured by Simpon's diversity was higher in organic than in conventional high fertility plots(Fig. 9). Interestingly, the diversity in the organic control plots was also relatively high in DNAsamples. This may have occurred because of interplot interference between the organic subplotsin the split plot experiment, perhaps if tillage between seasons moved soil among the subplotswithin a management treatment whole plot. For Shannon's index, cDNA samples from the highfertility organic treatments had the highest diversity. Fungi were less diverse than bacteria,which is a common result for soil. For fungi, greater evenness of taxonomic representation isapparent in the cDNA compared to DNA samples. Our initial hypothesis was that microbialcommunities detected through RNA (cDNA) would be less diverse than those detected throughDNA. In contrast, it appears that in this experiment cDNA samples may exhibit more diversityand evenness, perhaps because DNA samples can become loaded with those taxa with tougherdormant structures.
Translation of microbial community data for farm managementThere is strong interest among many organic farmers in using microbial community data to guidemanagement decisions on farms. A great deal of translation of fundamental scientific results toapplied technologies will be necessary to make the use of microbial profiles a reality for day-to-day decision making on farms. The huge steps in microbial ecology made possible by newsequencing techniques will need to be matched by new experimental techniques forunderstanding the functional roles of microbes, as we discuss in a synthesis paper (Garrett et al.,2012). The experiment and results supported by Ceres Trust benefit from and contribute to thegreat leap forward in characterizing microbial communities and their responses to management.
Ceres Trust report: Soil microbes in organic vegetable production: New insights from pyrosequencing - 10

The first step is to understand what taxa are present, and how they respond to management, asnew taxa will continue to be discovered in soil for some time to come. Adding informationabout the agroecological function of little-known taxa will be another important step.
Linking with our current Ceres Trust projectOur current 'Phase II' project supported by Ceres Trust also addresses organic managementeffects on soil microbial communities. We are continuing the analysis of bacteria and fungi inthese communities, building on the initial results reported here. A synthesis of both projects willbe presented at the end of the Phase II project.
Outreach
In addition to discussions at farmer field days, Lorena Gomez-Montano and other members ofour team have presented information about this project and the role of soil microbes in plantproductivity at the following meetings and seminars.
1. Midwest Organic & Sustainable Education Service (MOSES) 23rd annual meeting.February 23-25, 2012, La Crosse, WisconsinOral presentation: Soil Microbes in Organic Vegetable Production
2. American Phytopathological Society (APS).August 4-8, 2012, Providence, Rhode IslandPoster presentation: Soil fungal and bacterial communities in organic vs. conventional vegetableproduction: Capturing the active players through soil RNA analysisThis poster is included as Figure 11.
3. K-State Research and the State: Graduate Student Poster Session.November 6, 2012, K-State Student Union, KS Ballroom, Manhattan, KSTitle of the presentation: Soil fungal and bacterial communities in organic vs. conventionalvegetable production: Capturing the active players through soil RNA analysis
4. KSU Department of Plant Pathology student seminar series, November 7, 2012
Additional outreach activities for this project are planned in conjunction with our currentassociated Ceres Trust project.
Acknowledgements
We appreciate the support from the Ceres Trust that made this work possible. We alsoappreciate the USDA IOP grant that supported the long-term experiment in which we sampled,and the scientists who developed and supported the long-term experiment, including Ted Carey,Rhonda Janke, and May Altimimi. We appreciate field assistance from Kalen Menke, labassistance from Tennery Carttar, and helpful input on the project from Ana Stanescu, DoinaCaragea, Lianqing Zheng, Leigh Murray, and Chuck Rice.
Ceres Trust report: Soil microbes in organic vegetable production: New insights from pyrosequencing 1

References
Acosta-Martinez, V., Dowd, S., Sun, Y. and Allen, V., 2008. Tag-encoded pyrosequencinganalysis of bacterial diversity in a single soil type as affected by management and landuse. Soil Biology & Biochemistry, 40(11): 2762-2770.
Buckley, D.H. and Schmidt, T.M., 2001. The structure of microbial communities in soil and thelasting impact of cultivation. Microbial Ecology, 42(1): 11-21.
Chaudhry, V., Rehman, A., Mishra, A., Chauhan, P.S. and Nautiyal, C.S., 2012. Changes inbacterial community structure of agricultural land due to long-term organic and chemicalamendments. Microbial Ecology, 64(2): 450-460.
Cole, J.R. et al., 2009. The Ribosomal Database Project: improved alignments and new tools forrRNA analysis. Nucleic Acids Research, 37: D141-D145.
Drinkwater, L.E., Letourneau, D.K., Workneh, F., Vanbruggen, A.H.C. and Shennan, C., 1995.Fundamental differences between conventional and organic tomato agroecosystems inCalifornia Ecological Applications, 5(4): 1098-1112.
Euzeby, J., 2011. List of new names and new combinations previously effectively, but notvalidly, published. International Journal of Systematic and Evolutionary Microbiology,61: 1011-1013.
Fierer, N. et al., 2007. Metagenomic and small-subunit rRNA analyses reveal the geneticdiversity of bacteria, archaea, fungi, and viruses in soil. Applied and EnvironmentalMicrobiology, 73(21): 7059-7066.
Galloway, J.N. et al., 2004. Nitrogen cycles: past, present, and future. Biogeochemistry, 70(2):153-226.
Garrett, K.A., Jumpponen, A., Toomajian, C. and Gomez-Montano, L., 2012. Climate changeand plant health: designing research spillover from plant genomics for understanding therole of microbial communities. Canadian Journal of Plant Pathology-Revue CanadienneDe Phytopathologie, 34(3): 349-361.
Horrigan, L., Lawrence, R.S. and Walker, P., 2002. How sustainable agriculture can address theenvironmental and human health harms of industrial agriculture. Environmental HealthPerspectives, 110(5): 445-456.
Jain, R.K. et al., 2005. Microbial diversity: Application of microorganisms for thebiodegradation of xenobiotics. Current Science, 89(1): 101-112.
Jumpponen, A., 2007. Soil fungal communities underneath willow canopies on a primarysuccessional glacier forefront: rDNA sequence results can be affected by primer selectionand chimeric data. Microbial Ecology, 53(2): 233-246.
Jumpponen, A., 2011. Analysis of ribosomal RNA indicates seasonal fungal communitydynamics in Andropogon gerardii roots. Mycorrhiza, 21(6): 453-464.
Jumpponen, A. and Jones, K.L., 2009. Massively parallel 454 sequencing indicates hyperdiversefungal communities in temperate Quercus macrocarpa phyllosphere. New Phytologist,184(2): 438-448.
Jumpponen, A., Jones, K.L. and Blair, J., 2010. Vertical distribution of fungal communities intallgrass prairie soil. Mycologia, 102(5): 1027-1041.
Karlen, D.L. et al., 1997. Soil quality: A concept, definition, and framework for evaluation. SoilScience Society of America Journal, 61(1): 4-10.
Lane, D.J., 1991. 16S/23S rRNA sequencing. In: S.a.M. Goodfellow (Editor), Nucleic acidtechniques in bacterial systematics. John Wiley & Sons, New York, NY, pp. p. 115-147.
Ceres Trust report: Soil microbes in organic vegetable production: New insights from pyrosequencing - 12

Lauber, C.L., Hamady, M, Knight, R. and Fierer, N., 2009. Pyrosequencing-based assessment ofsoil pH as a predictor of soil bacterial community structure at the continental scale.Applied and Environmental Microbiology, 75(15): 5111-5120.
Logan, T.J., Lai, R. and Dick, W.A., 1991. Tillage systems and soil properties in North AmericaSoil & Tillage Research, 20(2-4): 241-270.
Margulies, M. et al., 2005. Genome sequencing in microfabricated high-density picolitrereactors. Nature, 437(7057): 376-380.
Pankhurst, C.E., OphelKeller, K., Doube, B.M. and Gupta, V., 1996. Biodiversity of soilmicrobial communities in agricultural systems. Biodiversity and Conservation, 5(2): 197-209.
Roesch, L.F. et al., 2007. Pyrosequencing enumerates and contrasts soil microbial diversity.ISME Journal, 1(4): 283-290.
Rondon, M.R. et al., 2000. Cloning the soil metagenome: a strategy for accessing the genetic andfunctional diversity of uncultured microorganisms. Applied and EnvironmentalMicrobiology, 66(6): 2541-2547.
Sugiyama, A., Vivanco, J.M., Jayanty, S.S. and Manter, O.K., 2010. Pyrosequencing assessmentof soil microbial communities in organic and conventional potato farms. Plant Disease,94(11): 1329-1335.
van der Heijden, M.G.A., Bardgett, R.D. and van Straalen, N.M., 2008. The unseen majority:soil microbes as drivers of plant diversity and productivity in terrestrial ecosystems.Ecology Letters, 11(3): 296-310.
van Groenigen, K.J. et al., 2010. Abundance, production and stabilization of microbial biomassunder conventional and reduced tillage. Soil Biology & Biochemistry, 42(1): 48-55.
Vilgalys, R. and Hester, M., 1990. Rapid genetic identification and mapping of enzimaticallyamplified ribosomal DNA from several Cryptococcus species Journal of Bacteriology,172(8): 4238-4246.
Yin, C.T. et al., 2010. Members of soil bacterial communities sensitive to tillage and croprotation. Soil Biology & Biochemistry, 42(12): 2111-2118.
Addenda
The following pages include tables, figures, and photos summarizing the project.
Ceres Trust report: Soil microbes in organic vegetable production: New insights from pyrosequencing - 13

Table 1. Bacterial genera that responded to the fertility treatment (high vs. control) or exhibited a significant management type(organic vs. conventional) interaction with fertility treatment. The q-values < 0.05 are in bold font, and those < 0.1 are in green font.
Genus
Acidisphaera
Amycolatopsis
Anaeromyxobacter
Arthrobacter
Bacillus
Balneimonas
Blastococcus
Brevibodllus
Byssovorax
Chitinophaga
Chloroflexus
Cobetia
Conexibacter
Croceicoccus
Cupriavidus
Desulfovirga
Flammeovirga
Flectobacillus
Geopsychrobacter
Geotoga
Mean frequency (proportion)
Organic management
DNA
Highfertility
0.000
0.000
0.028
0.004
0.022
0.008
0.003
0.001
0.007
0.001
0.004
0.000
0.013
0.002
0.001
0.001
0.000
0.001
0.022
0.000
Controlfertility
0.001
0.000
0.031
0.002
0.024
0.004
0.002
0.001
0.006
0.000
0.005
0.000
0.015
0.002
0.001
0.002
0.000
0.000
0.023
0.000
CDNA
Highfertility
0.001
0.000
0.025
0.008
0.018
0.005
0.004
0.001
0.019
0.001
0.005
0.000
0.016
0.001
0.002
0.002
0.000
0.000
0.021
0.000
Controlfertility
0.001
0.000
0.028
0.004
0.012
0.003
0.003
0.001
0.016
0.001
0.007
0.000
0.016
0.001
0.001
0.003
0.000
0.000
0.030
0.000
Conventional management
DNA
Highfertility
0.000
0.000
0.029
0.002
0.024
0.002
0.004
0.001
0.007
0.000
0.005
0.000
0.015
0.002
0.000
0.002
0.000
0.000
0.020
0.000
Controlfertility
0.000
0.001
0.027
0.001
0.023
0.003
0.003
0.001
0.006
0.001
0.004
0.000
0.014
0.002
0.001
0.002
0.000
0.000
0.022
0.001
CDNA
Highfertility
0.001
0.000
0.023
0.002
0.017
0.001
0.003
0.001
0.021
0.001
0.006
0.000
0.020
0.001
0.001
0.002
0.000
0.000
0.021
0.000
Controlfertility
0.001
0.001
0.027
0.002
0.016
0.002
0.004
0.001
0.018
0.001
0.005
0.000
0.021
0.002
0.001
0.002
0.000
0.000
0.024
0.001
q-value
DNA
Fertilityeffect
0.605
0.253
0.161
1.000
0.713
0.956
0.713
0.436
0.491
0.436
0.268
1.000
1.000
1.000
0.038
1.000
1.000
0.683
1.000
0.062
Fertility *managementinteraction
0.044
1.000
0.004
0.547
1.000
0.000
1.000
0.057
1.000
0.004
0.037
0.065
0.067
1.000
0.032
1.000
1.000
0.037
1.000
0.011
CDNA
Fertilityeffect
1.000
0.001
0.860
1.000
1.000
0.234
0.398
0.234
0.068
1.000
0.234
1.000
0.601
0.062
1.000
1.000
0.144
1.000
1.000
1.000
Fertility *managementinteraction
1.000
0.917
1.000
0.000
0.000
0.000
0.001
1.000
1.000
0.892
0.002
1.000
1.000
0.190
0.000
0.097
0.093
1.000
0.000
1.000
Ceres Trust Report: Tables - 1

Gpl
Gpl7
Gp2
Gp3
Gp4
GpS
Gp7
Herpetosiphon
Hydrocarboniphaga
Kaistella
Kofleria
Lysobacter
Marinithermus
Marmoricola
Moss/7/o
Meiothermus
Meiothermus
Methylibium
Methylovirgula
Microlunatus
Microvirga
Modestobacter
Niastella
Nitrosospira
Nocardioides
Nanomuraea
Novosphingobium
OP1 l_genera_incertae_sedis
Oxobacter
Persicirhobdus
0.004
0.007
0.001
0.010
0.042
0.004
0.007
0.004
0.001
0.000
0.007
0.002
0.002
0.005
0.001
0.001
0.001
0.004
0.009
0.009
0.002
0.004
0.001
0.001
0.005
0.000
0.005
0.001
0.002
0.000
0.006
0.008
0.001
0.011
0.056
0.006
0.009
0.005
0.000
0.000
0.008
0.001
0.002
0.004
0.000
0.004
0.004
0.003
0.008
0.008
0.002
0.004
0.001
0.002
0.003
0.000
0.004
0.001
0.002
0.000
0.003
0.004
0.000
0.015
0.040
0.010
0.001
0.005
0.000
0.000
0.019
0.001
0.001
0.018
0.001
0.000
0.000
0.013
0.011
0.008
0.002
0.006
0.001
0.002
0.009
0.000
0.002
0.000
0.001
0.000
0.003
0.004
0.001
0.021
0.053
0.012
0.002
0.007
0.001
0.000
0.021
0.000
0.001
0.014
0.000
0.003
0.003
0.011
0.012
0.008
0.002
0.006
0.001
0.001
0.007
0.000
0.003
0.000
0.001
0.000
0.019
0.004
0.002
0.019
0.068
0.006
0.012
0.006
0.000
0.001
0.010
0.001
0.004
0.008
0.001
0.000
0.000
0.004
0.010
0.004
0.001
0.003
0.001
0.003
0.003
0.000
0.004
0.001
0.002
0.001
0.018
0.007
0.001
0.017
0.067
0.006
0.009
0.006
0.001
0.001
0.008
0.001
0.003
0.006
0.000
0.002
0.002
0.004
0.010
0.006
0.001
0.003
0.001
0.002
0.002
0.000
0.005
0.002
0.004
0.000
0.012
0.004
0.002
0.038
0.057
0.014
0.003
0.007
0.000
0.000
0.019
0.001
0.001
0.019
0.001
0.000
0.000
0.010
0.014
0.005
0.001
0.005
0.001
0.003
0.004
0.000
0.002
0.000
0.002
0.000
0.011
0.004
0.001
0.036
0.057
0.012
0.003
0.006
0.000
0.001
0.021
0.000
0.001
0.018
0.001
0.001
0.001
0.010
0.013
0.005
0.001
0.005
0.001
0.001
0.004
0.001
0.002
0.000
0.001
0.000
1.000
0.007
0.038
0.220
1.000
1.000
0.253
1.000
0.994
0.038
0.113
1.000
0.014
0.831
0.436
0.000
0.000
1.000
1.000
0.292
1.000
1.000
1.000
0.014
1.000
1.000
0.378
0.007
0.000
0.014
0.020
0.991
0.027
0.217
0.000
0.119
0.000
0.753
0.067
0.184
0.058
1.000
0.412
1.000
1.000
0.021
0.021
1.000
1.000
0.043
1.000
1.000
1.000
0.006
0.262
1.000
0.007
0.044
1.000
0.828
1.000
1.000
1.000
1.000
1.000
0.084
1.000
1.000
0.458
1.000
1.000
1.000
1.000
0.820
1.000
0.000
0.000
1.000
1.000
0.630
0.820
0.675
1.000
0.000
1.000
0.018
0.943
1.000
1.000
1.000
1.000
0.430
0.703
0.000
0.000
0.011
0.182
0.026
1.000
1.000
0.726
0.032
1.000
0.002
0.071
0.856
0.856
0.018
0.001
1.000
0.083
0.078
0.018
0.260
0.000
0.033
0.215
1.000
1.000
1.000
Ceres Trust Report: Tables - 2

Phaselicystis
Phenylobacterium
Pseudomonas
Rudaea
Solirubrobacter
Sphingobium
Sphingomonas
Sphingopyxis
Sporichthya
Subdivision3_genera_incertae_sedis
Swaminathania
Varlovorax
Zavarzinella
0.004
0.001
0.005
0.003
0.017
0.001
0.013
0.005
0.001
0.004
0.004
0.001
0.003
0.005
0.001
0.002
0.002
0.017
0.000
0.009
0.006
0.001
0.005
0.003
0.000
0.003
0.019
0.002
0.013
0.001
0.024
0.001
0.006
0.002
0.001
0.018
0.003
0.001
0.005
0.021
0.002
0.002
0.001
0.023
0.000
0.003
0.002
0.001
0.025
0.005
0.000
0.007
0.004
0.001
0.001
0.002
0.017
0.001
0.006
0.008
0.002
0.005
0.003
0.000
0.003
0.005
0.002
0.001
0.001
0.019
0.000
0.007
0.011
0.001
0.006
0.003
0.000
0.004
0.020
0.003
0.001
0.000
0.027
0.001
0.002
0.003
0.001
0.023
0.004
0.001
0.007
0.018
0.003
0.001
0.001
0.027
0.001
0.003
0.003
0.001
0.024
0.003
0.001
0.006
1.000
0.045
1.000
0.268
0.045
0.527
1.000
0.001
1.000
1.000
1.000
0.527
0.956
1.000
1.000
0.022
1.000
0.161
1.000
0.020
0.612
1.000
1.000
1.000
O.OS8
1.000
0.001
0.597
0.518
0.062
1.000
1.000
0.011
0.665
0.068
1.000
0.366
1.000
1.000
0.001
0.537
0.000
0.071
0.508
0.002
0.000
1.000
0.188
0.000
0.000
0.190
0.08S
Ceres Trust Report: Tables - 3

Table 2. Bacterial genera that had different cDNA and DNA frequencies.
Genus
Gemmatimonas
Chondromyces
Kofleria
Conexibacter
Oceanibaculum
Haliangium
Byssovorax
Coraliomargarita
Gp6
Sphingopyxis
Ottowia
Meiothermus
Mycobacterium
Saccharococcus
Pseudolabrys
Gp3
Subdivision3_genera_incertae_sedis
Oxobacter
Marmoricola
Massilia
Acidisphaera
Mean frequency(proportion)
cDNA
0.022
0.008
0.020
0.018
0.002
0.005
0.019
0.001
0.046
0.003
0.008
0.001
0.003
0.001
0.002
0.028
0.023
0.001
0.017
0.001
0.001
DNA
0.042
0.002
0.008
0.014
0.002
0.001
0.007
0.002
0.062
0.007
0.015
0.002
0.005
0.002
0.010
0.014
0.005
0.002
0.006
0.001
0.000
q-value
0.000
0.000
0.001
0.001
0.004
0.004
0.026
0.038
0.039
0.039
0.043
0.060
0.060
0.060
0.063
0.064
0.077
0.078
0.087
0.087
0.087
Ceres Trust Report: Tables - 4

Table 3. Bacterial phyla that responded to the fertility treatment (high vs. control) or exhibited a significant management type (organicvs. conventional) interaction with fertility treatment. The q-values < 0.05 are in bold font, and those < 0.1 are in green font.
Phylum
Acidobacteria
Actinobacteria
Bacteroidetes
Chlorobi
Chloroflexi
Cyanobacteria
Deinococcus-Thermus
Firmicutes
Gemmatimonadetes
Nitrospira
OP10
OP11
Planctomycetes
Proteobacteria
Verrucomicrobia
Mean frequency (proportion)
Organic management
DNA
Highfertility
0.171
0.188
0.062
0.000
0.052
0.001
0.003
0.089
0.034
0.016
0.004
0.001
0.009
0.339
0.015
Controlfertility
0.189
0.174
0.052
0.000
0.058
0.001
0.006
0.093
0.040
0.017
0.005
0.001
0.010
0.319
0.019
cDNA
Highfertility
0.144
0.216
0.050
0.000
0.056
0.001
0.001
0.068
0.020
0.011
0.002
0.000
0.016
0.380
0.027
Controlfertility
0.168
0.192
0.047
0.000
0.063
0.000
0.004
0.066
0.023
0.008
0.002
0.000
0.018
0.366
0.034
Conventional management
DNA
Highfertility
0.215
0.173
0.043
0.001
0.045
0.001
0.004
0.090
0.046
0.018
0.005
0.001
0.010
0.310
0.023
Controlfertility
0.206
0.173
0.044
0.000
0.048
0.001
0.005
0.093
0.047
0.017
0.004
0.002
0.012
0.308
0.024
cDNA
Highfertility
0.186
0.199
0.038
0.000
0.058
0.000
0.001
0.070
0.024
0.008
0.003
0.000
0.020
0.342
0.033
Controlfertility
0.182
0.201
0.038
0.000
0.055
0.000
0.002
0.068
0.023
0.009
0.004
0.000
0.018
0.348
0.035
q-value
DNA
Fertilityeffect
0.115
0.385
1.000
0.039
1.000
1.000
0.543
0.005
0.119
0.026
0.543
0.001
0.245
0.162
1.000
Fertility *managementinteraction
0.000
0.000
0.000
0.268
0.268
1.000
0.067
0.401
0.268
0.072
0.268
0.006
1.000
0.072
0.006
cDNA
Fertilityeffect
0.452
0.306
0.452
0.452
0.031
0.306
0.004
0.432
0.445
0.432
0.031
0.766
0.432
0.445
0.432
Fertility *managementinteraction
0.000
0.000
0.075
1.000
0.000
0.006
0.000
0.960
0.052
0.090
0.960
1.000
0.006
0.090
0.000
Ceres Trust Report: Tables - 5

Table 4. Bacterial phyla that had different cDNA and DNA frequencies.
PhylumGemmatimonadetes
Actinobacteria
Firmicutes
Acidobacteria
Deinococcus-Thermus
Proteobacteria
Bacteroidetes
Spirochaetes
Mean frequency(proportion)
cDNA0.022
0.202
0.068
0.170
0.002
0.359
0.043
0.0002
DNA
0.042
0.177
0.091
0.195
0.005
0.319
0.050
0.0003
q-value0.000
0.000
0.001
0.031
0.041
0.056
0.086
0.093
Ceres Trust Report: Tables - 6

Table 5. Fungal genera that had different cDNA and DNA frequencies.
Genus
Chromocleista
Phaeoisaria
Catabotrys
Spizellomycete
Plectosphaera
Spizellomyces
Catenomyces
Spiromastix
Ascobolus
Cyllamyces
Neocallimastix
Karlingiomyces
Olpidium
Entrophospora
Zeloasperisporium
Kappamyces
Oedogoniomyces
Glomus
Corynascus
Catenophlyctis
Lasiobertia
Chaetomidium
Botryozyma
Triangularia
Sphaeriothyrium
Mean frequency(proportion)
cDNA
0.001
0.058
0.051
0.005
0.037
0.032
0.028
0.028
0.014
0.023
0.021
0.020
0.021
0.030
0.003
0.011
0.012
0.015
0.009
0.011
0.007
0.119
0.007
0.002
0.014
DNA
0.275
0.127
0.006
0.064
0.011
0.006
0.003
0.008
0.001
0.003
0.002
0.005
0.002
0.000
0.011
0.001
0.002
0.000
0.002
0.005
0.001
0.099
0.001
0.008
0.007
q-value
0.000
0.000
0.000
0.000
0.000
0.000
0.000
0.000
0.000
0.000
0.000
0.000
0.000
0.000
0.000
0.000
0.000
0.000
0.000
0.000
0.000
0.000
0.000
0.000
0.000
Ceres Trust Report: Tables - 7

Eichleriella
Coelomomyces
Poria
Coniochaeta
Piriformospora
Chaunopycnis
Powellomyces
Schizosaccharomyces
Cheilymenia
Saccharata
Paraglomus
Cercophora
Aspergillus
Scortechiniella
Troposporella
Fusculina
Batrachochytrium
Protodontia
Anungitopsis
Athelia
Doassansiopsis
Falcocladium
Rhizophydium
Albertiniella
Conoplea
Spinulosphaeria
Arthrocladiella
Chalastospora
Phlyctochytrium
Boothiomyces
0.004
0.007
0.000
0.025
0.004
0.002
0.004
0.005
0.004
0.006
0.006
0.026
0.008
0.008
0.004
0.008
0.003
0.003
0.002
0.002
0.000
0.003
0.003
0.001
0.002
0.006
0.000
0.005
0.077
0.002
0.001
0.002
0.012
0.037
0.000
0.008
0.001
0.001
0.001
0.000
0.001
0.023
0.012
0.013
0.000
0.000
0.000
0.000
0.000
0.000
0.003
0.000
0.001
0.000
0.000
0.002
0.002
0.003
0.085
0.003
0.000
0.000
0.000
0.000
0.000
0.000
0.000
0.000
0.000
0.000
0.000
0.000
0.000
0.000
0.000
0.000
0.000
0.001
0.001
0.001
0.001
0.001
0.002
0.002
0.002
0.002
0.003
0.004
0.005
0.005
Ceres Trust Report: Tables - 8

Cymatoderma
Peziza
Eutypa
Thelebolus
Stomiopeltis
Alternaria
Jugulospora
Rhizocladosporium
Lachnodadium
Dimargaris
Clitopilopsis
Colletotrichum
Pilidiella
Podospora
Chytridium
Phragmidium
Geosiphon
0.001
0.001
0.003
0.003
0.002
0.003
0.000
0.000
0.001
0.001
0.002
0.013
0.002
0.010
0.001
0.010
0.001
0.000
0.001
0.003
0.006
0.002
0.001
0.001
0.002
0.000
0.000
0.001
0.015
0.005
0.008
0.000
0.005
0.000
0.006
0.011
0.012
0.012
0.013
0.017
0.018
0.043
0.045
0.047
0.049
0.053
0.053
0.054
0.057
0.077
0.097
Ceres Trust Report: Tables - 9

Table 6. Fungal phyla that had different cDNA and DNA frequencies.
Phylum
Ascomycota
Blastocladiomycota
Glomeromycota
Neocallimastigomycota
Chytridiomycota
Basidiomycota
Zygomycota
Mean frequency(proportion)
cDNA
0.582
0.049
0.062
0.044
0.201
0.052
0.001
DNA
0.763
0.014
0.002
0.004
0.173
0.035
0.000
p-value
0.000
0.000
0.000
0.000
0.000
0.000
0.009
Ceres Trust Report: Tables - 10

Figure 1. Bacterial phyla recovered through cDNA.
Actinobacteria
Bacteroidetes
Chloroflexi
Firmicutes -
GemmatimonadetesPlanctomycetes
Acidobacteria
k Other
Verrucomicrobia
Proteobacteria
Ceres Trust Report: Figures - 1

Figure 2. Bacterial phyla recovered through DNA.
Actinobacteria.
Bacteroidetes
Chloroflexi
Firmicutes J
Gemmatimonadetes
Acidobacteria
u OtherVerrucomicrobia
Proteobacteria
Ceres Trust Report: Figures - 2

Figure 3. Bacterial genera recovered through cDNA (where genera present with frequency atleast 0.01 are designated).
SolirubrobacterSorangium
genera_incertae_sedis JTerrimonas -
.Gemmatimonas
CpnexibacterByssovorax
BellilineaBacillus
Y Anaeromyxobacter
Other
Ceres Trust Report: Figures - 3

Figure 4. Bacterial genera recovered through DNA (where genera present with frequency at least0.01 are designated).
o ,SolufubroDacterSqrangium
Terrimonas
opsychrobacterGemmatimonas
ConexibacterBellilineaBacillus
'- Anaeromyxobacter
Other
Ceres Trust Report: Figures - 4

Figure 5. Fungal phyla recovered through cDNA.
Ascomycota
Basidiomycota
Bl astocl ad io mycota
h Other
Neocallimas
Glomeromycota
Chytridiomycota
Ceres Trust Report: Figures - 5

Figure 6. Fungal phyla recovered through DNA.
Ascomycota
h Other
Chytridiomycota
Basidiomycota
Ceres Trust Report: Figures - 6

Figure 7. Fungal genera recovered through cDNA.
Nepcaljjrh'asfixOlpioium
Phaeoisaria
Phlyctochytrium
Plectosphaera -
Spiromastix
Spizellomyces
Coniochaeta
Chaetomidium
Cercophora
Catenomyces
Catabotrys
Other
Ceres Trust Report: Figures - 7

Figure 8. Fungal genera recovered through DNA.
Chromocleista
Coniochaeta
Phaeoisaria -
Phlyctochytrium
Chaetomidium
- Cercophora
OtherSpizellomycete
Ceres Trust Report: Figures - 8

Fig 9. Box plots showing Simpson's diversity for the bacterial cDNA/DNA communities in thefield plots under different treatment combinations. The orange dashed-line separates the resultsfor each management-fertility treatment combination. An AOV gives some evidence for a three-way interaction (P = 0.13).
oCOo>0>
9 fe«- o>
^ o|o^ p^
^ 03.OT Oco
IsE o)W °>
oCOO)O)
ConventionalControl
ConventionalHigh Fertility
OrganicControl
OrganicHigh Fertility
cDNA DNA cDNA DNA CDNA DNA
Treatm ent com binationscDNA DNA
Ceres Trust Report: Figures - 9

Figure 10. Box plots showing Shannon's index for the bacterial cDNA/DNA community in thefield plots under different treatment combinations. The green dashed-line separates the results foreach management-fertility treatment combination. An AOV gives some evidence for a three-wayinteraction (P = 0.06).
qod
coc ooj r^to
ConventionalControl
ConventionalHigh Fertility
OrganicControl
OrganicHigh Fertility
cDNA DNA cDNA DNA cDNA DNA
Treatment combinations
CDNA DNA
Ceres Trust Report: Figures - 10

Fig 11. Gomez-Montano et al. 2012 poster from the national meeting of the AmericanPhytopathological Society
Soil fungal and bacterial communities in organic vs. conventional" vegetable production: Capturing the active players; 1 through soil RNA analysis
.-'" lorena Gomez-Mpntano ([email protected])1, Ari Jumpponen2, Megan Kennelly1 and Karen A. Garret!1-v.-v ^__ j : '_ . : ;;.;' *Pepaiti
Introduction
Sot! microbes are fundamental to (he productivity ofagricultural systems. Organic management may foster morediverse sot) microbiat communities beneficial for cropproduction, with the potential to reduce kisses to pathogens.We evaluated active microbial community responses in asix-year field experiment with two-year rotation of tomatoand pac elm We compared microbtai communities inorganic vs. conventional nutnent management with low andhigh fertility levels We also wanted to understand the activemicrobial community, as opposed to the community sampledby ONA extraction, which may include dormant aridmoribund texa, A new frontier for microbiat ecology is thestudy of soil community RNA. We used 454pyrosequancing and DMA-tagging to compare iota! residentfungal, archaeal and bactenaf communities using extractedDNA and the actively metabolizing mtcrobial communitiesusing extracted RNA.
In this first phase of the project, we have analyzed soiiarchaeal and bacterial diversities, as reported here. In thenext phase of the project we will analyze fungal, archaealand bacterial communities in more detail in organic vs.conventional management.
Objectives
1. Characterize the soil bactenal community composition morganic agriculture compared to conventionalmanagement, for two fertility levels in a tomato crop.
2. Compare the active (cDNA pool) and the resident (DNApool) soil microbial communities m organic vs.conventional nutnent managements
1 The diversity of the soil bacterial community will be higherunder organic management compared to conventional
2 The DNA pool will have a more diverse bacterial communitycompared to the cDNA pool.
3. The cDNA pool will reveal some bactenal taxa that are notpresent in the DNA pool.
• Mothods .
•A total of twelve experimental units were sampled afterharvest of the tomato plants,
• RNA and DNA were isolated from the soi! samples usingTotal RNA Isolation kits and RNA PowerSoil DNA elutk>n kits,respectively.
• The extracted rRNAs were reverse transcribed and cDNAswere synthesized.
• A list of cDNA and DNA sequences was obtained using 454pyrosequencing.
• Diversity estimators such as Inverse Simpson's dominancewere used to estimate taxon diversity based on 97%similarity
• The diversity indices were used to test hypotheses aboutdiversity responses among the treatments in an ANOVAusing SAS.
Results
- Diversity responses among the treatments
MJ. Th« trwd bMimwi! ww «w lypo o( ONA. 0*W
Results cont.
Conclusions
• in the first phase of our research we found that thebacterial community showed higher diversity as measuredby Inverse Simpson's index for organic (O) managementcompared to conventional (C) management (Figure 2).
• There were higher levels of bacterial diversity for theorganic high fertility compared to the other treatments(Figure 2).
• A higher proportion of bacterial and archaeai phyla weremore common m ONA samples than m cDNA samples(Figure 3)
• This pyrosequencing approach allowed us to identify taxawith important ecological roles in the nitrogen cycle or inthe production of antibiotics. We recovered a number ofgenera of bactena that have roles m agroecotogicaisystems- These included Nitrosptra and Azotobscter, bothwith important roles in the nitrogen cycle, andPseixlomonas and Erwinia, often plant pathogens orantagonists of plant pathogens.
Future Perspectives
• In the next phase of our research we will evaluate fungal,archaeal and bactena! communities *n ihese agriculturalmanagements in more detail
Acknowledgments
KANSAS STATE
Ceres Trust Report: Figures - 1

Images of the experiment, sampling, team, and outreach
Plots early in the season
Ceres Trust Report - Photos - 1
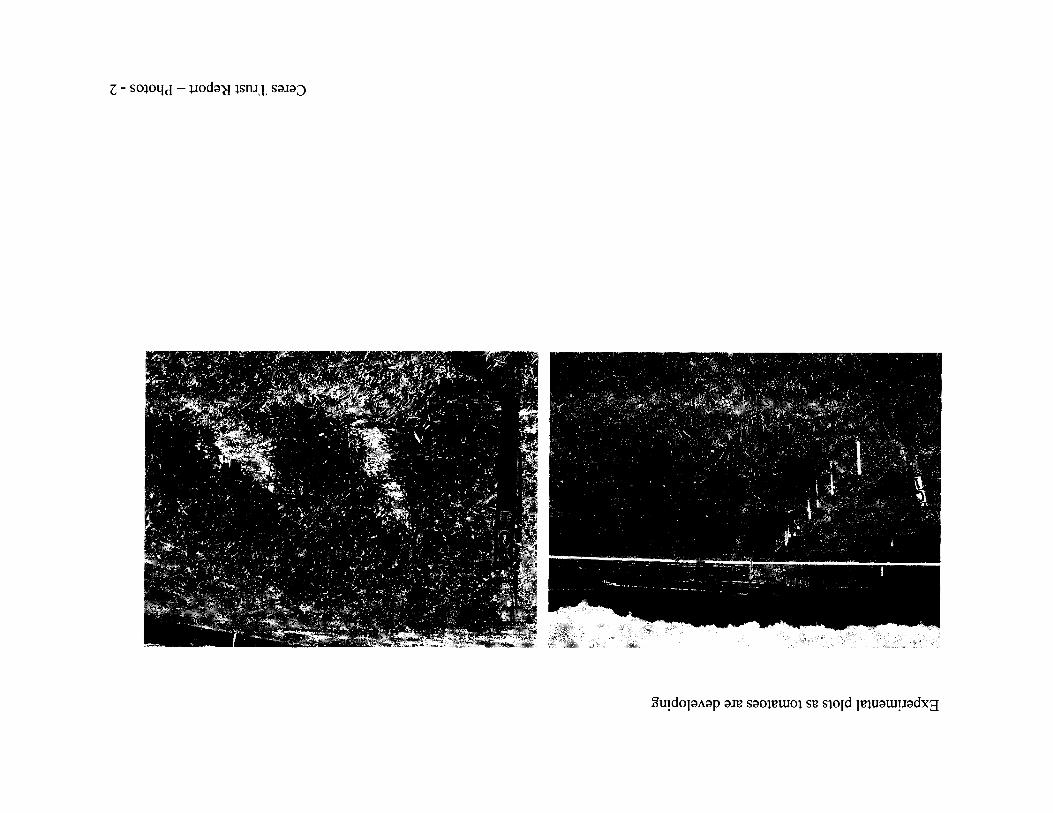
Experimental plots as tomatoes are developing
Ceres Trust Report - Photos - 2

Anita Stanescu and Lorena Gomez-Montano collecting soil cores for analysis of microbial communities. Lorena Gomez-Montano isdeveloping this project as her PhD thesis.
Ceres Trust Report - Photos - 3

Anita Stanescu, Kalen Menke, and Lorena Gomez-Montano at the research site
Ceres Trust Report - Photos - 4

A field day at Jill Elmer's farm, where we discussed this project and the follow-up project at Jill Baron and Tom Buller's farm.
Ceres Trust Report — Photos - 5