Embed Size (px)
Citation preview

DEPARTMENT OF THE INTERIOR U.S. GEOLOGICAL SURVEY
Temperatures and Natural Gamma-ray Logs Obtained in BoreholesMLGRAP # 1 and # 2, Mammoth Lakes, California:
Data and Preliminary Interpretations
by
W. H. Diment 1 and T. C. Urban1
Open-File Report 90-460
This report is preliminary and has not been reviewed for conformity with U.S. Greological Survey editorial standards and stratigraphic nomenclature. Any use of trade names is for descriptive purposes only and does not imply endorsement by the USGS.
1 U.S. Geological Survey, Denver, Colorado 80225

TABLE OF CONTENTS
ABSTRACT ................................. iINTRODUCTION .............................. 2DRILLING AND COMPLETION ........................ 3MEASUREMENTS/INSTRUMENTATION ..................... 10
Temperature .............................. 10Natural gamma-ray logs ......................... 11
TEMPERATURE ............................... 12Data ................................. 12Decay of drilling disturbance ....................... 12Aspect-ratio plots ........................... 13
GAMMA-RAY ................................ 20Data reduction and uncertainties ..................... 20Rock type and gamma-ray intensity .................... 23
HYDROLOGIC CONSIDERATIONS ....................... 27Liquid level in tubings .......................... 28Liquid levels in the open hole during drilling ................ 30Effects of borehole flows on shape of temperature profiles .......... 31
CONCLUSIONS ............................... 33ACKNOWLEDGEMENTS ........................... 35REFERENCES ............................... 36APPENDICES
Appendix I - Thermistor calibrations - index ................ 40Probe 500-02 July 11, 1989 .................... 41Probe 500-02 October 21, 1989 .................. 55
Appendix II - Temperature data - index .................. 69MLGRAP #1 ........................... 70MLGRAP #2 ........................... 79
Appendix III - Temperature plots - index ................. 90MLGRAP #1 ........................... 91MLGRAP #2 ........................... 96
Appendix IV - Natural Gamma-ray Data - index ............. 102MLGRAP #1 .......................... 103MLGRAP #2 .......................... 113
Appendix V - Natural Gamma-ray Plots - index ............. 125MLGRAP #1 .......................... 126MLGRAP #2 .......................... 128
Appendix VI - NIST traceable certifications - index ............ 130Guildline 9540 Platinum Thermometer ............... 131Fluke 8502A Digital Multimeter .................. 132
ILLUSTRATIONSFigure 1. Location Map ......................... 3Figure 2. Drilling History - MLGRAP # 1 ................. 5
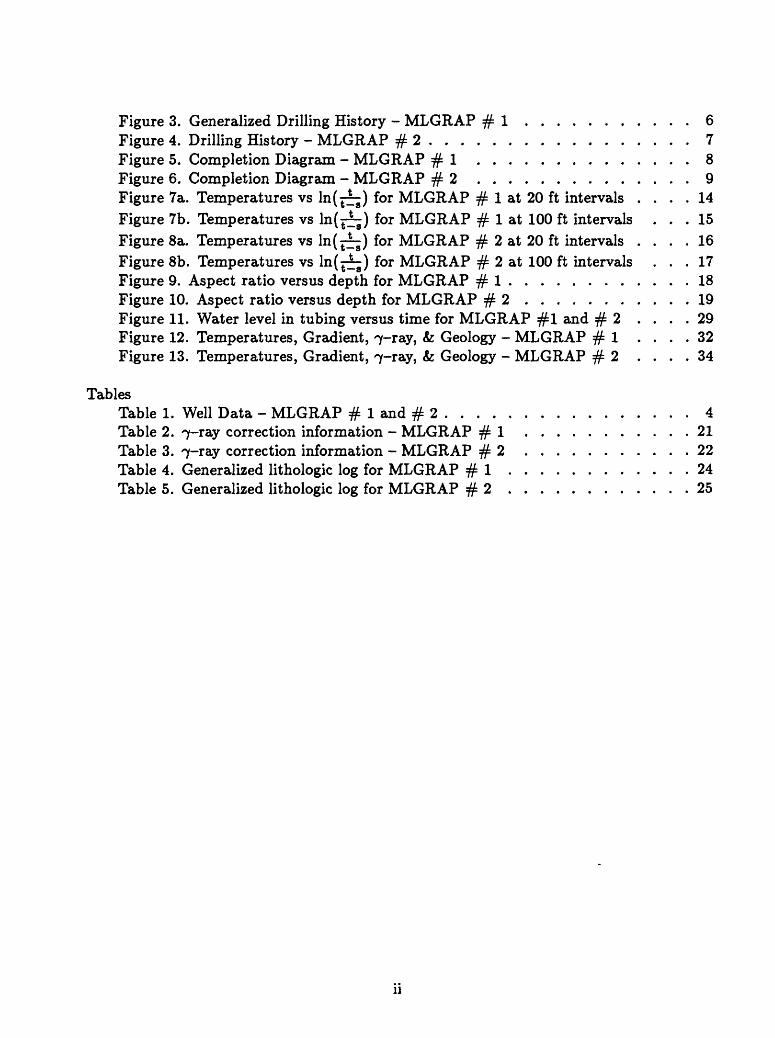
Figure 3. Generalized Drilling History - MLGRAP #1 ........... 6Figure 4. Drilling History - MLGRAP #2................. 7Figure 5. Completion Diagram - MLGRAP #1 .............. 8Figure 6. Completion Diagram - MLGRAP #2 ..............9Figure 7a. Temperatures vs ln(^~) for MLGRAP # 1 at 20 ft intervals .... 14Figure 7b. Temperatures vs In(^) for MLGRAP # 1 at 100 ft intervals ... 15 Figure 8a. Temperatures vs ln(^~) for MLGRAP # 2 at 20 ft intervals .... 16Figure 8b. Temperatures vs In(^) for MLGRAP # 2 at 100 ft intervals ... 17 Figure 9. Aspect ratio versus depth for MLGRAP # 1 ............ 18Figure 10. Aspect ratio versus depth for MLGRAP #2 ........... 19Figure 11. Water level in tubing versus time for MLGRAP #1 and #2 .... 29Figure 12. Temperatures, Gradient, "/-ray, & Geology - MLGRAP #1 .... 32Figure 13. Temperatures, Gradient, "/-ray, & Geology - MLGRAP #2 .... 34
TablesTable 1. Well Data - MLGRAP # 1 and # 2 ...... .......... 4Table 2. "/-ray correction information - MLGRAP #1 ...........21Table 3. "/-ray correction information - MLGRAP #2 ........... 22Table 4. Generalized lithologic log for MLGRAP #1 ............ 24Table 5. Generalized lithologic log for MLGRAP #2 ............ 25
11

Temperatures and Natural Gamma-ray Logs Obtained in Boreholes
MLGRAP # 1 and # 2, Mammoth Lakes, California:
Data and Preliminary Interpretations
by
W. H. Diment and T. C. Urban
ABSTRACTTwo 500-m holes were drilled within the Town of Mammoth Lakes during the Win
ter of 1987-88 in connection with the Mammoth Lakes Geothermal Assessment Project
(MLGRAP). We obtained precision temperature and natural gamma-ray logs in them
during July 1989 at 0.3-m (1 ft) intervals in tubing installed at completion of drilling.
These data are reported here in both graphical and numerical form as well as some data
obtained by others that are relevant to interpretation.
Both holes penetrate sequences of glacial tills and materials of basaltic and rhyolitic
composition of various textures as determined by examination of nearly continuous core
(Goodwin, 1988). Major units and many minor ones can be easily correlated with the
natural gamma-ray logs. However, detailed correlations between the two holes (2.0 km
apart) are not readily evident, either in the core or gamma-ray stratigraphies, although
this might be possible with further study.
Although the maximum temperatures in both holes are about the same (77 and 74 °C
near their bottoms), MLGRAP # 1 exhibits two maxima (52.4°C at 156 m = 512 ft and
77.0°C at 429 m = 1408 ft). The shallow maximum ("shallow geothermal aquifer") is in a
thick zone of basaltic cinders, presumably of high fluid permeability. The second maximum
("deep geothermal aquifer") is in a zone of fractured rhyolites with solution cavities, which
we also presume to be of high permeability. There are no temperature reversals with depth
in MLGRAP # 2 (2 km SE of MLGRAP # 1), and the stratigraphy is different in the
sense that there appear to be fewer strata of very high permeability.
Although tubing was installed in both holes to keep them open for repeated measure
ments, the annuli between hole and tubing were not effectively sealed (a near impossibility
in such lithology). Consequently, exchanges of water among aquifers plays a role in deter
mining the shapes of the temperature profiles.

INTRODUCTIONAlthough the geothermal potential of the Long Valley caldera has been studied since
the 1950's, little was known of the subsurface thermal regime of the southwest moat of
the caldera until boreholes PLV-1 (Benoit, 1984; Urban, et a/., 1988) and RDO-8 (Urban,
et a/., 1987a, 1987b) were drilled (locations shown in figure 1). The maximum temperatures
measured in these holes were 123°C at 712 m (2336 ft) and 202°C at 338 m (1109 ft),
respectively. These unexpectedly high temperatures led to the creation of the Mammoth
Lakes Geothermal Assessment Project (MLGRAP) and the drilling of the two exploration
holes which are the subject of this report.
Our primary objective is to report the temperature and gamma-ray data obtained in
July 1989 in sufficient detail so that they can be further processed and/or compared with
any future results that might be obtained. We also include the temperature data obtained
by Douglas Goodwin shortly after drilling, as well as generalized lithologic logs derived
from his logs of the core. Full information is contained in the "Well Summary Reports -
Geothermal" of the California Division of Oil and Gas which also contain the driller's logs
and the well completion reports. The API numbers are: 051-90120 (MLGRAP # 1) and
051-90121 (MLGRAP # 2).
DRILLING AND COMPLETIONBoth holes were drilled by Tonto Drilling Services at the locations given in table 1.
MLGRAP # 2 was relatively easy to drill (fig. 4). MLGRAP # 1 was not (figs. 2 and
3). Problems of lost circulation, caving, and stuck rods were severe. They are reminiscent
of those encountered in the drilling of PLV-1 (Benoit, 1984) and RDO8 (Urban, et a/.,
1987a, 1987b).
Hole completion diagrams are shown in figures 5 and 6. In MLGRAP # 1, an attempt
was made to cement the annulus between the hole and the upper casing by pumping 250
gallons (950 1) of cement down the casing and displacing it with 100 gallons (380 1) of water
behind a rubber plug. There was no cement return through the annulus to the surface, so
40 gallons (150 1) of cement were poured down the annulus to bring the cement level to
the surface. We doubt the annulus is completely filled with cement and suppose that fluid
may flow along the annulus in this interval. Moreover, no attempt was made to cement
the annulus between the hole/casing and the 2.75-in (7.0 cm) tubing. Because of a clogged
37°40'
1000 2000 3000MILES
4000 5000 6000 7000 8000 9000 10000
CONTOUR INTERVAL 10 METERS
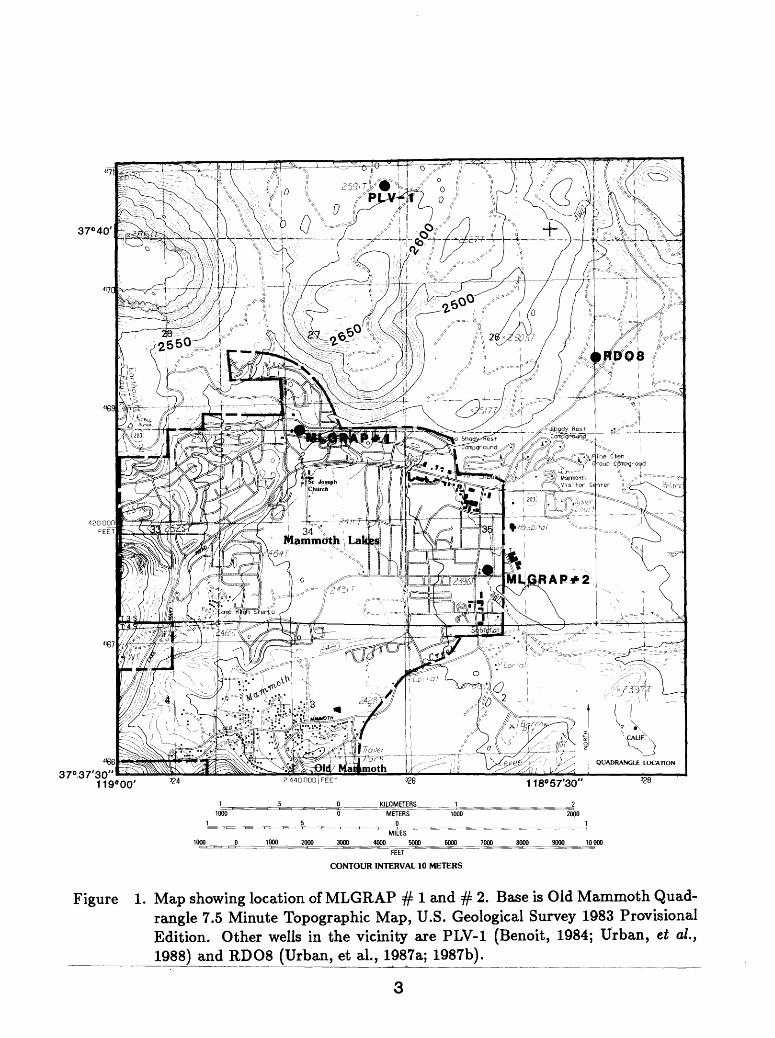
Figure 1. Map showing location of MLGRAP # 1 and # 2. Base is Old Mammoth Quad rangle 7.5 Minute Topographic Map, U.S. Geological Survey 1983 Provisional Edition. Other wells in the vicinity are PLV-1 (Benoit, 1984; Urban, et al.,
____ 1988) and RDO8 (Urban, et al., 1987a; 1987b).

Table 1. Location, elevation, depth, drilling history, and A.P.I. number for the MLGRAP holes in Mammoth Lakes, California.
Hole MLGRAP * 1 MLGRAP * 2
Latitude (N) 37°39.07' 37 e 38.44»
Longitude (W) 118'58.99' 118°57.84'
Elevation (GL,M) 2450 2396
Depth (M) 468 491
Drilling started 12/12/87 11/26/87
Drilling completed
A.P.I. No.
1/31/88
051-90120
12/11/87
051-90121

0
DRILLING DAY
10 20 30 40 50 60
100
200LJI- Us:
xa. 300LJ
400
500
i
t t i i i t t i i
Figure 2. Drilling history for MLGRAP # 1. Vertical bars indicate interval drilled each day. See table 1 for dates.

0
GENERALIZED DRILLING HISTORY
1 10 20 30 40 50 60
!00
£ 200LUI UJ
Ia. 300UJo
400
500
I.I I t I I I t I I
Figure 3. Generalized drilling history for MLGRAP # 1. Data from figure 2 was general ized by omitting the two week period when there was no circulation of drilling fluid in order to calculate time-history for figure 7. Day 1 corresponds to day 25 in figure 2. See text for discussion.
6

DRILLING DAY
1 10 20 30 40 50 600 ||iiiiii ii|in linn |iiin iniji i»iiiii|iiiiniii|ii linn
100
£200LJh- UJ
UJ300
400 h
500 t t t t | | ' ' t i t i t U
Figure 4. Drilling history for MLGRAP # 2. Vertical bars indicate interval drilled each day. See table 1 for dates.

MLGRAP*1 Well Profile
Ground\J
50
100
DC
H LU2 150
X H0.UJQ
2OO
i ̂PMM«
6 1/4"-- hole"0' to 280'
_ 3.85"hole
in cas sidetrac
i
i
"
-
(,,.<\;Q.;.'v-oc!:-
|o| \- '; :-': w '^
IsJV;.'-'.".v-:
1Junk
ing king
^
///
//''
/ ,
-"* ' Level
^4 1/2" -casing0' to280'
-225'
.1 Junk
-3 1/9" I / £
|| ̂ HQ rods 225'
to 535'
3.85"( ~ holen
L
241' to535'
-607'
u
100
200
300
400
PUJ
u.
500 Il-0.
Q
600
f
ff
400r
450
500L
2 3/4"
tubing 2 1/2'-
to 1464'
-3.05"hole
535' to1536'
-1464'
1536- u Total Depth
1300
1400
1500
Figure 5. Diagram illustrating drilling of MLGRAP # 1 and completion with casing and cement. Tubing and annulus (to 470 ft = 143 m) filled with mud.
8

Or
50
~ 10°
COOLUJH UJ2s-»
zH
S150
MILGRAP*2 Well Profile
Ground
5 5/8'>"hole0' to157' ;
_
5 1/4'^hole
157' to200'
-
3.85"hole
200' to1600'^
^
=^~ L«v«l
-
/'
;^4 1/2" casing
0' to200'-
-
2 3/4" _tubing0' to
^1602'
D
100
200
300
*~*HUl UJ
400 u.*^ZH0. UJD
\
400
450
500
1610^-' Total Depth
300
400
1500
1600
Figure 6. Diagram illustrating drilling of MLGRAP * 2 and completion wiping and cement. Top of lower section of cement uncertain (~ 380ft - 116mJ.
bit, both the tubing and the annulus were left filled with bentonite-gel-polymer mud, the
former to the surface and the latter to about 470 ft (143 m). We had no difficulty logging
through the mud in the tubing 1.5 yr after completion and suppose that the mixture was
rather dilute initially or that it has broken down with time. This would, of course, also
apply to the mixture in the annulus, and we suppose that fluids may flow along the annulus.
Cementing operations were more successful in MLGRAP # 2. Cement returns were
obtained through the annulus to the surface while installing the 4.5-in (11.4-cm) casing
(fig. 6). Attempts to seal the annulus between the hole/casing and the 2.75 in (7.0 cm)
tubing were not as successful. 350 gallons (1325 1) of cement were pumped followed by a
rubber plug and 400 gallons (1514 1) of water, but no returns were observed at the surface.
The top of the cement is thought to be at a depth of about 380 ft (116 m), but it could
be much deeper.
Both holes are thought to be nearly vertical, although there must be deviations at least
over a short interval where trouble was encountered in MLGRAP # 1 (fig. 5). We obtained
inclinations in each hole using acid-etch techniques with 16-mm glass tubes (Urban and
Diment, 1989a, 1989b): MLGRAP # 1 (0.25° at 426.7 m = 1400 ft) and MLGRAP # 2
(0° at 381.0 m = 1250 ft and 1.25° at 481.6 m = 1580 ft) where the angle is the deviation
from the vertical and the depth is measured from the surface.
MEASUREMENTS/ INSTRUMENTATIONTemperature. Precision temperature measurements were obtained in MLGRAP # 1
and # 2 on July 23 and July 24, 1989, respectively. Temperatures were measured with
a thermistor probe containing a single glass-encapsulated bead with a nominal resistance
at 25 °C of 500,000 ohms. Details of the construction of the probe and its calibration are
given in Urban and Diment (1990). The probe was lowered at a continuous rate of 3 m/min
(10 ft/min). In order to aid in lowering, two sinker bars were attached to the cable above
the cablehead to which the probe was mounted. The first bar above the cablehead had a
diameter of 2.5 cm (1 in) and the second one above that a diameter of 3.7 cm (1.5 in). Both
bars were 1.2 m (4 ft) long. As the probe was lowered, resistances were, measured by a
Fluke 8502A Digital Multimeter at 0.3 m (1 ft) intervals. In the field, the resistances were
converted, using a computer interfaced to the multimeter, to temperature by the equation
+ C2xln(R)C3 + ln(R)
10

where Cl, C2, and C3 are the calibration constants (calibration of July 11, 1989 in Ap
pendix V), In is the natural logarithm, R is the thermistor resistance in ohms, and T is
the temperature in degrees Celsius. Equation 1 is equation 4 of Robertson, et al. (1966)
in which we have solved for the temperature and combined some of the constants (Ur
ban and Diment, 1990). The resistance is measured using the 4-wire technique whereby a
known current is sent down two of the leads through the thermistor and the voltage drop
across the thermistor is measured with the other two leads. Since the current through the
thermistor and the voltage drop across the thermistor are known, the resistance can be
calculated by Ohm's law. This is done automatically by the 8502A. The output from the
multimeter to the computer is the resistance.
At the time the logs were obtained, the temperatures were printed, plotted, and
recorded on punch-paper tape for later processing. After a subsequent recalibration of
the probe on October 21, 1989, the temperatures were corrected for drift by a linear
interpolation between the two calibrations spanning the field measurements. The drift-
corrected temperatures are listed in Appendix II and plotted in figures 12 and 13 and in
Appendix III. No correction has been applied for the thermal inertia of the probe assembly
due to the slow logging rate (3 m/min = 10 ft/min) and short time constant (< 2s) of the
probe. All depth measurements are relative to the ground surface.
Natural Gamma-ray Logs. The natural gamma-ray logs were obtained with a scintil
lation tool with an outside diameter of 5 cm (2 in). This tool has a maximum operating
temperature of 85 °C. A single sinker bar (1.25 in x 4 ft = 13.2 cm x 1.2 m) was at
tached to the cable above the tool. The hole was logged downward at a rate of 6 m/min
(20 ft/min). The pulses from the tool were integrated by a rate meter with a filter time
constant of 3 s. This combination of logging speed and time constant generally yield ac
ceptable logs (Hilchie, 1978, p. 6-18). The output of the rate meter was recorded by a
strip-chart recorder set at 5 in/100 ft and 10 in/500 counts/s. The counts/s-calibration
on the recorder was set by calibration pulses from the rate meter. Before logging, the tool
was calibrated against a known source of 200 API units: A background level was recorded.
Then the source was attached and the background plus 200 API units was recorded. Fi
nally, another recording of the background was recorded. The time constant in the rate
meter was set at 10 s for the calibration recordings in order to minimize the fluctuations
in the background radiation. With the time constant set at 3 s during logging, the lag
11

or the apparent shift of an anomaly in the direction the tool is moving is 0.3 m (1 ft).
Since the depth-reference point was located at the bottom of the tool, this placed the bed
boundary anomaly a foot shallower than the logging depth. However, the crystal in the
scintillation tool is centered about 1 ft up from the bottom of the tool. Thus, the depths
listed in Appendix IV are effectively compensated for this lag.
Back in the office, the logs were digitized at 0.3 m (1 ft) intervals using a four-
button cursor and a digitizing tablet. The digitization was semi-automatic in that the
x and y scales were set, the operator traced the curves while the points were digitized
at a rate of 30/s, the computer selected the integer depth from the digitized points, and
the corresponding gamma-ray value was calculated from the scale factors. This data is
tabulated in Appendix IV and plotted in Appendix V and figures 12 and 13.
TEMPERATUREData. In the preliminary analyses which follow, we rely on the precision temperature
logs obtained in July 1989 as well as the measurements made by Goodwin (1988) at 20 ft
(6 m) intervals shortly after drilling. Both sets are tabulated in Appendix II and plotted
in Appendix III.
Goodwin made his measurements with an EnviroLabs Digital Thermometer (DT201B)
and recorded them to the nearest tenth of a degree Fahrenheit. We converted them to
degrees Celsius and tabulated them to the nearest 0.01 °C (Appendix II). We know nothing
of the system used by Goodwin or how it was calibrated. When comparing results obtained
in the same hole with different logging systems, differences are always found between the
data sets. Aside from equipment malfunction and changes with time, these differences can
usually be attributed to either a difference in calibrations or differences in cable stretch,
or both. Although Goodwin's data seem to fit reasonably well with ours, one is cautioned
about over interpretation.
Decay of drilling disturbance. Temperatures measured in boreholes shortly after
drilling are usually far from virgin rock temperatures because of the temperature pertur
bations imposed by the circulation of the drilling fluid. Lachenbruch and Brewer (1959)
introduced a useful way to study the decay of the drilling disturbance. We follow it here.
12

Temperatures at 20 ft (6 m) depth intervals are plotted against a function of time in
figures 7a and 8a. These plots are hard to decipher at this depth interval so they were
replotted as a series of graphs at 100 ft (30.5 m) depth intervals (figs. 7b and 8b). The
drilling histories used to determine s and t are shown in figures 2, 3, and 4. Note that
the drilling history of MLGRAP # 1 (fig. 2) has been generalized (fig. 3) to take account
of a 2-week period when there was no circulation of drilling fluid, t is the time difference
from when the drill bit first reached the depth in question and the time of temperature
measurement, s is the difference in time from when the drill bit first reached the depth
in question and the time when drilling ceased, i.e., the duration of the drilling/circulation
disturbance. As t > oo, ^~ -+ 1, and In f^r;) -* 0.
Using this time function, plots of temperature at a given depth tend to be linear,
provided that the virgin thermal regime is steady state and the decay of the drilling
disturbance is by conduction alone. The plots in figures 7a and 8a are quasi-linear. Some
departures from linearity are probably the result of the exchange of formation fluids along
unsealed sections of the annulus between the hole and casing.
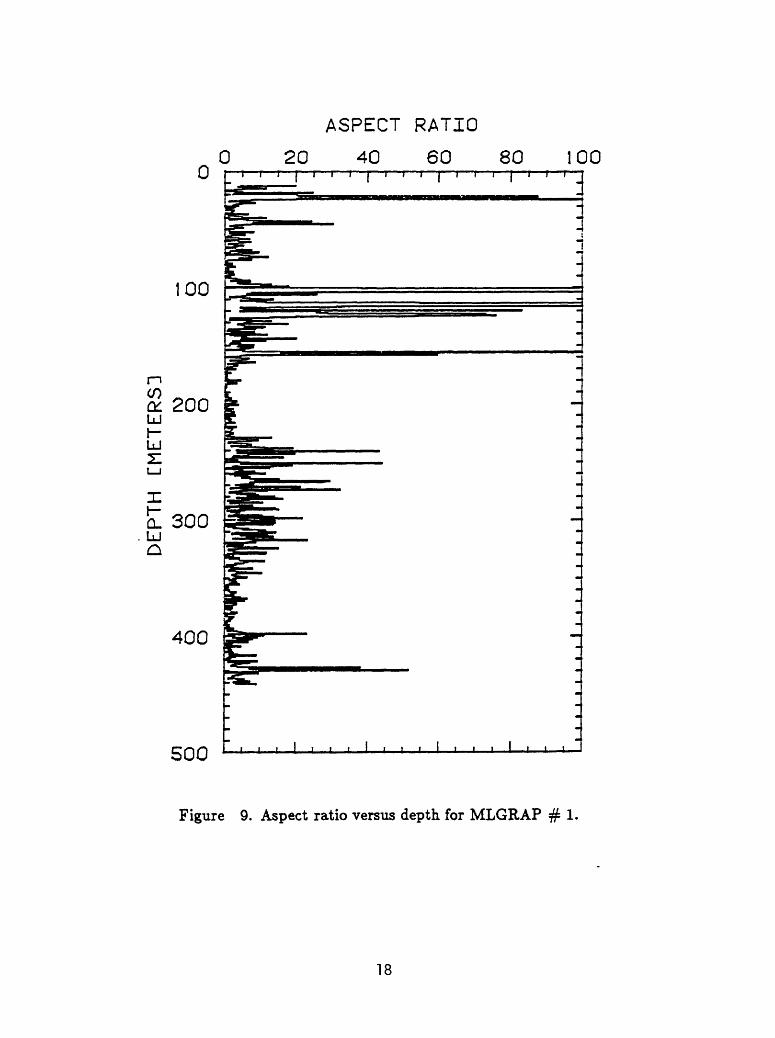
Aspect-ratio plots. When the thermal gradient is positive downward, the fluid in a
borehole will convect once a small critical gradient is exceeded. The aspect ratios (A =
h(height)/a(tubing I.D. radius)) usually have modal values between 6 and 9 as determined
from temperature-time records of 1 hr or so at fixed depths (Urban and Diment, 1985).
Aspect ratios can abo be obtained from a single precision temperature log by comparing
the temperature gradient over a short interval of depth (AZ) with that over a longer
spanning interval using the relation:
where G is the gradient over a short interval and G" is over the spanning interval (Urban
and Diment, 1985). In constructing the plots in figures 9 and 10, we have taken AZ =
2ft (0.61m) and the spanning interval as equal to 5*AZ. This method of determining
A does not take into account the effect of variations in the thermal conductivity of the
surrounding rocks, but these effects are usually small (Urban and Diment; 1985).
Aspect-ratios may be anomalously large when fluid is moving along the hole as in, or
between, perforated intervals, or when it is moving in the annulus between hole and casing
(Diment and Urban, 1983).
13

3.0 2.0 1.0 LNCT/(T-S)D
Figure 7a. Observed temperatures plotted against ln(^~) for MLGRAP # 1. Each line represents the set of temperatures with time at a specific depth. Depth interval 20 ft (6 m).
14

80
70
60
it50
i40
30
20
to
4.0 3.0 2.0 1.0 LNCT/CT-S33
60
70
60
r* O
5 40»-
2%30u»->
20
to
BO
4.0 3.0 2.0 1.0 LNCT/CT-S33
60
70
60
II
i 40
I30
i
20
to
mo
60
70
60
i i
ii *°
i
20
10
4.0 3.0 2.0 1.0 LNCT/CT-S53
60
70
60
20
10.
4.0 3.0 2.0 1.0 LNCT/CT-S53
Figure 7b. Same as figure 7a but with 100 ft (30.5 m) depth inter vals.
4.0 3.0 2.0 1.0 LNCT/CT-S33

1.5 1.0 0.5LNCT/cr-sn
0
Figure 8a. Observed temperatures plotted against ln(~^) for MLGRAP # 2. Each line represents the set of temperatures with time at a specific depth. Depth interval 20 ft (6 m).
16

I.S 1.0 0.5 LNCT/CT-S31
2.0 1.5 1.0 0.5 LNCT/CT-S33
I.S t.O O.S LNCT/CT-S33
2.0 t.S 1.0 O.S LNCT/CT-S33
Figure 8b. Same as figure 8a but with a 100 ft (30.5 m) depth interval.
17
ASPECT RATIO
0
500
Figure 9. Aspect ratio versus depth for MLGRAP # 1,
18

0
ASPECT RATIO
20 40 60 80 100
100 -
LJh- LJ
200
LJ300
400
500
Figure 10. Aspect ratio versus depth for MLGRAP # 2.
19
The A-plots mean nothing when derived from continuous temperature logs in air-
filled holes because the time response of the temperature sensor is too long to give accurate
temperatures at the logging rates employed (3 m/min = 10 ft/min). So we can discard
the anomalous results in the air column (132 m = 432 ft) in MLGRAP # 2. Once this is
done, the A-values are uniformly low in this hole. They are on the order of what we have
previously observed in other well-behaved holes. The implication is that there is little or
no anomalous flow of fluid along the borehole complex. However, slow steady flows cannot
be ruled out by this technique.
Now consider the A-plots for MLGRAP # 1. There are spikes at each temperature
reversal simply because as G" > 0, A > oo. A's tend to be very low where the thermal
gradient is negative because this is a stable thermal stratification. The small variation may
reflect changes in lithology or noise. The cause of the variations in the interval 100-130 m
(325-425 ft) is enigmatic. The temperature anomalies have persisted far longer than they
should have if they were due to conductive decay of the drilling disturbance. This zone is
well above a water table at about 143 m (470 ft). We conclude that there is flow of fluid
in the borehole complex and/or the surrounding rock, but the details are not clear. The
large values of the A's below about 230 m (755 ft) are attributed to fluid flow along the
uncemented annulus.
GAMMA-RAYData reduction and uncertainties. Natural gamma-ray logs are the most primative
of the arsenal of nuclear logs that can be run in boreholes. However, when constraints of
hole/tub ing diameter (< 2 in = 5cm), operating temperature, and cost are considered, we
are often left with a 7 ray log obtained with a scintillation crystal (< 80 °C) or a less
sensitive Geiger-Mueller tube (> 80°C). So it is here, and in RDO8 (Urban, et a/., 1987a,
1987b) and PLV-1 (unpublished).
Natural 7 rays sensed by a detector in a borehole originate from a volume of rock less
than a meter from the borehole (e.g., Belknap, et a/., 1978). They are attenuated by the
rock itself and by the casings, mud, and other fluids in and about the hole. Complete theory
is lacking, but it is clear that corrections for the effects are required. We used standard
nomograms (Schlumberger, 1975, diagram GR-2, p. 66). Our choice of corrections, for
the moment, are given in tables 2 and 3. The uncorrected and corrected 7 ray data are
tabulated in Appendix IV and plotted in Appendix V.
20

Table 2. Correction to natural y-ray log for casing and cement in MLGRAP # 1.
Depth From
To (ft)
0
30
30
225
225
241
241
470
470
535
535
1464
Hole DiameterContent
(in)
6.25
Cement
6.25
Cement
6.25
Cement
3.85
Air
3.85
Gel
3.05
Gel
Casing O.D.I.D.
Content
4.500
4.026
Air
4.500
4.026
Air
4.500
4.026
Air
-
-
-
-
-
.
Casing O.D.I.D.
Content
-
-
3.500
3.068
Air-
3.500
3.068
Air
3.500
3.068
Gel
-
-
Casing O.D.I.D.
Content
2.750
2.375
Air
2.750
2.375
Gel
2.750
2.375
Gel
2.750
2.375
Gel
2.750
2.375
Gel
2.750
2.375
Gel
Y-ray CorrectedApparent
1.17
1.23
1.65
1.00
1.02
0.82
21

Table 3. Correcti
Depth From
To (ft)
0
157
157
200
200
380
380
432
432
1602
on to natural y-ray
Hole DiameterContent
(in)
5.625
Cement
5.250
Cement
3.850
Air
3.850
Cement
3.850
Cement
log for casing and
Casing O.D.I.D.
Content
4.500
4.026
Air
4.500
4.026
Air
-
-
-
cement for MLGR
Casing O.D.I.D.
Content
2.750
2.375
Air
2.750
2.375
Air
2.750
2.375
Air
2.750
2.375
Air
2.750
2.375
Water
AP#2.
Y-ray CorrectedApparent
1.16
1.07
0.77
0.88
0.93
22
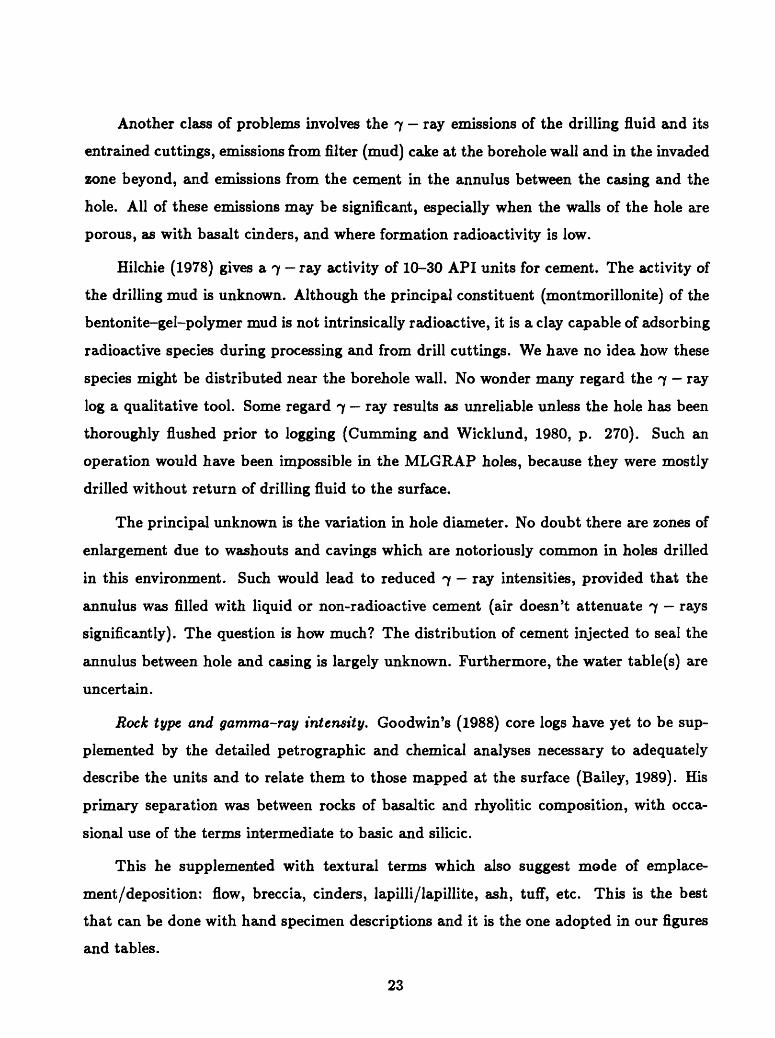
Another class of problems involves the 7 ray emissions of the drilling fluid and its
entrained cuttings, emissions from filter (mud) cake at the borehole wall and in the invaded
zone beyond, and emissions from the cement in the annulus between the casing and the
hole. All of these emissions may be significant, especially when the walls of the hole are
porous, as with basalt cinders, and where formation radioactivity is low.
Hilchie (1978) gives a 7 ray activity of 10-30 API units for cement. The activity of
the drilling mud is unknown. Although the principal constituent (montmorillonite) of the
bentonite-gel-polymer mud is not intrinsically radioactive, it is a clay capable of adsorbing
radioactive species during processing and from drill cuttings. We have no idea how these
species might be distributed near the borehole wall. No wonder many regard the 7 ray
log a qualitative tool. Some regard 7 ray results as unreliable unless the hole has been
thoroughly flushed prior to logging (Gumming and Wicklund, 1980, p. 270). Such an
operation would have been impossible in the MLGRAP holes, because they were mostly
drilled without return of drilling fluid to the surface.
The principal unknown is the variation in hole diameter. No doubt there are zones of
enlargement due to washouts and cavings which are notoriously common in holes drilled
in this environment. Such would lead to reduced 7 ray intensities, provided that the
annulus was filled with liquid or non-radioactive cement (air doesn't attenuate 7 rays
significantly). The question is how much? The distribution of cement injected to seal the
annulus between hole and casing is largely unknown. Furthermore, the water table(s) are
uncertain.
Rock type and gamma-ray intensity. Goodwin's (1988) core logs have yet to be sup
plemented by the detailed petrographic and chemical analyses necessary to adequately
describe the units and to relate them to those mapped at the surface (Bailey, 1989). His
primary separation was between rocks of basaltic and rhyolitic composition, with occa
sional use of the terms intermediate to basic and silicic.
This he supplemented with textural terms which also suggest mode of emplace
ment/deposition: flow, breccia, cinders, lapilli/lapillite, ash, tuff, etc. This is the best
that can be done with hand specimen descriptions and it is the one adopted in our figures
and tables.
23

Table 4. Generalized lithologic log of MLGRAP # 1. Goodwin (1988).
Depth in meters to:
Top of unit
0
6.1 (Est)
24.1 (Est.)
51.1
53.0
54.9
70.7
164.6
198.7
207.6
219.4
233.5
2383
244.7
2502
251.4
258.8
276.4
278.9
294.4
374.6
376.7
378.5
427.6
Bottom of unit
6.1 (Est.)
24.1 (Est.)
51.1
53.0
54.9
70.7
164.6
198.7
207.6
219.4
233.5
2383
244.7
2502
251.4
258.8
276.4
278.9
294.4
374.6
376.7
378J
427.6
468.1
Description
Glacial Till - unconsolidated
Rhyolite - colluvium or flow
Basalt (Lost circulation at 24.1 m - No sample 24.1 m to 30.5 m) - commonly rubbly
Rhyolite Tuff unconsolidated
Cinder-rich Tephra unconsolidated
Glacial Till - unconsolidated
Basalt Tephra - unconsolidated
Basalt
Intermediate to Basic Tuff/Breccia
Basalt Breccia
Intermediate to Basic Tuff/Breccia
Basalt
Intermediate to Basic Tuff/Breccia
Basalt
Basic Lapillite
Basalt
Silicic Lapillite/Tuff/Breccia
Basalt
Silicic Tuff w/Breccia
Basalt
Silicic Tuff
Basalt
Early Rhyolite Tuff
Early Rhyolite
24

Table 5. Generalized lithologic log of MLGRAP # 2. Goodwin (1988).
Depth in meters to:
Top of unit
0
42.4
61.1
64.9
73.8
92.7
100.7
106.8
110.3
114.0
161.9
170.1
206.7
210.9
246.6
248.7
271.0
294.6
3002
Bottom of unit
42.4
61.1
64.9
73.8
92.7
100.7
106.8
110.3
114.0
161.9
170.1
206.7
210.9
246.6
248.7
271.0
294.6
3002
490.7
Description
Glacial Till - unconsolidated
Basalt
Silicic Lapilli - Ash Tephra - unconsolidated
Basalt
Glacial Till - poorly consolidated
Silicic Lapilli - Ash Tephra - unconsolidated
Glacial Till?/Regolith/Sediments
Basalt Flows with rare Breccia and interflow Qnders/Tephra
Basalt Cinders
Basalt Flows with rare Breccia and interflow Qnders/Tephra
Basalt Cinders
Basalt Flows with rare Breccia and interflow Cinders/Tephra
Basalt Cinders
Basalt Flows with rare Breccia and interflow Cinders/Tephra
Basalt Cinders
Basalt Flows with rare Breccia and interflow Cinders/Tephra
Early Rhyolite Lapilli Tuff
Early Rhyolite Flow Breccia
Early Rhyolite Tuff, Tuff-Breccia, Lapilli Tuff - unconsolidated to moderately consolidated
25

The first order correlations of 7 ray intensities and rock type (figs. 12 and 13) is
between basalt (low in lithophile elements and radioactivity) and rhyolites (rich in the same
and high in radioactivity). The basalts owe their radioactivity largely to K40 , whereas the
rhyolites, in addition to higher K40 , are likely to have much higher concentrations of U238
and Th232 . Let us consider only K40 .
Bailey (1989) refers to voluminous flows of trachybasalts, trachyandesites, and quartz
latites in and about the southwest moat of the caldera. These are alkalic rocks which tend
to have highly variable K2 O concentrations roughly twice that of "normal" rocks (compare
tables 1-2 and 2-3 in Carmichael, et a/., 1974; see also Sorensen, 1974). Bailey, et al. (1976,
p. 729) tabulated the concentration of K2 O (wt %) for 40 whole-rock samples of basalt
and andesites from the caldera with the following results: Basalt, K2 O mean 1.80, range
1.63 to 2.26, n = 28. Andesite, K2 O mean 2.59, range 2.13 to 3.01, n = 12. Rinehart and
Ross (1964, table 9) present K2 O concentrations: Andesine basalt (1.0), trachyandesite
(2.2), olivine bearing quartz latite (4.8), quartz latite (3.9), younger rhyolite (4.5), and
older rhyolite (5.2). Now, an increase of one percent in K2 O (wt %) causes an increase of
15 API units in a 7 ray log (Schlumberger, 1975, p. 5) or 15/0.9 = 16.7 in our cps units.
Clearly the 7 ray intensities shown in figures 12 and 13 are in reasonable agreement with
the K2 O concentrations, and that the range in intensities for the "basaltic" rocks could be
attributed to variation in K2 O content. Additional K2 O analyses for the area have been
tabulated by Higgins, et al. (1985) who also present a variation diagram of major oxides
with SiO 2 . It is not clear, however, how far the correlation can be trusted, especially in view
of the uncertainties in the borehole corrections previously discussed. On the otherhand,
Anderson and Bartholomay (1990) have successfully used natural 7 ray logs in about 200
holes near the Idaho National Engineering Laboratory to study the distribution of basaltic
rocks and interbedded sediments. They found that 7 ray intensity correlates with K 2 O
content as determined by X-ray fluorescence analysis.
Within these contrasting compositional regimes, further differentiation may be pos
sible with the natural 7 ray logs. Interfaces between basaltic flows (as logged in the
core by Goodwin (1988)) are rather thin and sometimes mark the change between flows
of significantly different 7 ray intensity and, presumably of different rock composition.
These discontinuities tend to be composed of volcanic rubble. Moreover, the rubble/rock
tends to be more vesicular in these zones than in the interior of flows. So we enter the
26

realm where concentration of 7 ray emitters must be balanced against 7 ray absorp
tion. The problem isn't simple, and will not be addressed here. The rubble also tends
to be more hydro-thermally altered (Goodwin, 1988), which leaves open the possibility of
deposition or solution 7 ray emitters in these zones. It is certain, however, that "Two
formations having the same amount of radioactive material per unit volume but having
different densities will show, on the Gamma-Ray Log, different radioactivity levels; the
less dense formation will appear to be more radioactive." (Schlumberger, 1975, p. 3).
HYDROLOGIC CONSIDERATIONSA borehole is a zone of enhanced permeability and focused flow of water. Unless
the annulus between hole and casing is effectively sealed, water will flow along it until
hydrostatic equilibrium is achieved, if ever. So the temperatures measured in the casing
(assuming the casing itself does not leak) represent the result of heat exchange between
the surrounding rock and fluid flowing along the annulus. The size of the temperature per
turbation from virgin rock temperature depends on the initial conditions, the temperature
and rate of flow of the fluid, hole geometry and time (e.g., Birch, 1947; Beck and Shen,
1985).
The variation of pressure with depth is a poorly known parameter in many geothermal
systems. The Long Valley caldera is no exception. Some holes have been drilled blind (i.e.,
no return of drilling fluid to the surface), zones of water entry or loss may occur in the
same hole. The point is that complicated thermal profiles could be produced by exchange
of fluids along aquifers and produce a thermal picture that does not accurately reflect
virgin rock temperatures, even though the measurements were made years after drilling.
The annuli of most holes drilled in the Long Valley caldera are not effectively sealed
over their entire lengths, or even over major portions thereof. In some cases a tubing
was lowered into the hole to preserve it for further measurements, but no attempt was
made to cement the annulus. Attempts to cement the annuli usually failed partially or
completely. The reason is simple. There are many highly permeable formations that are
capable of accepting large quantities of cement. On the other hand, many of the rock types
are extremely friable and fragments of them could partially seal the annuli and impede the
flow of water along them. Moreover, many altered volcanic rocks are composed of plastic
clays which may squeeze in about the tubing thus preventing fluid flow along the annulus.
27

Fluid flow along the annulus is an important factor in determining the temperature-
depth profiles in some boreholes. Indeed, fluid flow may be controlling the shapes of some
characteristic profiles in the caldera. The size of the disturbance is difficult to quantify.
Temperature-gradient and aspect-ratio plots may call attention to anomalous conditions
but they give no notion as to the size of the thermal perturbations. Temperature-time
plots at fixed depths of the kind previously discussed could be more definitive indicators
of fluid flow along the annulus, but experimental uncertainties, especially when different
temperature logging systems are used over time, suggest caution. Water-levels in boreholes
as they are drilled give another clue, but they may be suspect because the liquid level is
measured inside the drill pipe with the assumption that the level in the drill pipe is that
in the surrounding annulus, which could be obviated by closure of the annulus by caving
of the borehole walls. Nonetheless, when all these uncertain measures seem to point in
the same direction, guesses can be made as to the effects of fluid flow along the annulus.
Now let us examine the data from the two MLGRAP holes, where similar procedures and
reporting add credence to comparisons.
Liquid level in tubings. After completion of drilling, tubings were installed in each
hole to preserve them for later measurements. The tubing was actually used NQ drill rod
(2.75 in = 7.0 cm O.D., 2.375 in = 6.0 cm I.D.) which, in our experience, may leak like a
sieve at the joints, because of minor knicks in the quick coupling threads. It is not known,
of course, which joints, if any, leak. But it is a possibility that should be kept in mind in
an environment where the pressure distribution with depth may be far from hydrostatic.
The fluid levels in the tubings of both holes are plotted as a function of the logarithm
of time after last circulation (MLGRAP # 1) or after cementing (MLGRAP # 2) in Figure
11 along with the approximate depth of the "shallow" water tables. Some of the depths are
plotted as 20 ft (6.1 m) long lines because they are based on Goodwin's (1988) temperature
measurements which were spaced at 20 ft (6.1 m) intervals. (It's easy to tell whether the
sensor is in air or water from the time response of the instrument as observed at the
surface.)
28

0
P 100UJ UJ
t-Q,
200
300
400 -
500
* *
\
MLGRAP * 1
MLGRAP # 2
10 100
TIME CDAYS1
- 0
n CO01 UJ
50 ujz:LJ
CL100
501000
Figure 11. Water level below ground surface in tubing versus time for MLGRAP # 1 and MLGRAP # 2. V indicates the approximate depths of the water table.
29

In MLGRAP # 1, both the tubing and the annulus (to 470 ft = 143 m) were left
filled with mud with a plugged bit at the bottom, as previously explained. For the first
few days, the liquid level remained at the top of the tubing which probably means that
there was a small overflow as the cold liquid column expanded as it was warmed by the
surrounding rocks. Thereafter, the liquid level slowly declined but to a level (32 ft = 10
m) far above the shallow water table (470 ft = 143 m). Does this mean that the tubing
doesn't leak much? It's filled with mud which may have a tendency to seal the joints in
the tubing. Or, does it mean that the tubing taps a super-hydrostatic aquifer at some
unknown depth?
Conditions for the completion of MLGRAP # 2 were different. An attempt was made
to cement the annulus between the hole and the tubing by pumping cement down the tubing
and then up the annulus. The attempt failed in the sense that no cement returned to the
surface through the annulus, which means that fluid flow is possible along at least part of
the annulus. Undoubtedly, the cement went into the first permeable beds it encountered on
its upward path. This condition is not unusual (e.g., Urban, et a/, 1987a, 1987b). Indeed,
it is probably impossible to fill annul! of holes in such stratigraphy, without inordinate
expense.
The liquid level dropped rapidly in MLGRAP # 2 after cementing (fig. 11), then
more slowly at a rate comparable to the decline in # 1. The last observation is about 60
ft (18.3 m) below the shallow water table (370 ft = 113 m). The most likely explanation
is that water in the tubing is leaking into the subhydrostatic aquifers.
Liquid levels in the open hole during drilling. The lower parts of both holes were
drilled blind (i.e., no mud returns to the surface): MLGRAP # 1 below 520 ft (158 m)
and MLGRAP # 2 below 350 ft (107 m). Thereafter the liquid levels in the drill rods were
periodically recorded as drilling progressed (Goodwin, 1988). The shallow water tables
(MLGRAP # 1, 470 ft = 143.3 m; MLGRAP # 2, 370 ft = 112.8 m) shown in figure 11
are probably accurate within a few meters.
Liquid level in the boreholes (as determined by measurements of the level in the
drill rods during the interruptions in drilling) usually remained within a few meters of
the shallow water tables. Noteable exceptions occurred at about 1235 ft (376.4 m) in
MLGRAP # 1 and at about 900 ft (274 m) in MLGRAP # 2, where transient increases
in liquid level of 10 and 30 m (30 and 100 ft), respectively, were noted (Goodwin, 1988).
These zones of water entry are close to the top of the "early rhyolite" (Bailey, 1989) in
both holes (tables 4 and 5, figs. 12 and 13).
30

Effects of borehole flows on shape of temperature profiles. Few temperature-depth
profiles in the Long Valley caldera reflect constant heat flow in the sense that the thermal
gradient is inversely proportional to the thermal conductivity of the surrounding rocks.
The thermal regime of the caldera is dominated by fluid flows in permeable rocks. The
actual temperature distribution in the rocks are clouded by fluid heat and salt transport
along the borehole complexes. In some cases this perturbation is obvious. For examples:
temperatures in holes that perennially boil at the surface follow the boiling-point-depth
curve for some depth below the surface (e.g., Diment, et a/., 1985; Urban, et a/., 1987).
Clearly, heat is transported up the hole/tubing and salt downward. In holes with alter
nating sections of perforated and unperforated casing exchange of fluids amoung aquifers
is clearly evident from precision temperature logs (e.g., UNOCAL IDFU 44-16, Suem-
nicht, 1987, Urban and Diment, 1988). In other cases the effects are far more subtle and
impossible to assess quantitatively.
This long preamble is necessary to illustrate some obvious phenomena, which may
appear in far more subtle forms in any hole drilled in the caldera.
In MLGRAP # 1, the high level of the liquid column, for whatever reason, should
allow a glimpse at conditions in the vadose (unsaturated) zone in a region of significant
precipitation. Unfortunately, this is not the case. The nearly isothermal zone above 74 m
(243 ft) (fig. 12) is probably a consequence of flow along the partially cemented annulus of
the 4.5 in (11.4 cm) casing. Hole construction (fig. 5) may permit alternate flow paths to
a depth of 185 m (bottom of the lost HQ rods). Erratic gradients, particularly from 100
to 140 m (33 to 460 ft), indicate a non-steady state regime. Therefore, the temperature-
time plots (fig. 7a,b), which are based on the assumption of conductive decay of the
drilling disturbance, are meaningless. These plots do, however, indicate a strong increase
of temperature with time and that the temperatures may continue to increase.
The fluctuations in the gradients (fig. 12) and aspect ratios (fig. 9) in the interval
from 250 to 350 m (820 to 1150 ft) are unusually large for reasons unknown to us. Note,
however, that a water entry was observed at 376 m (1234 ft). Possibly water is flowing
up the uncemented annulus. Note, also, that the temperature profile exhibits step-like
structures in the upper part of this interval. This raises the possibility of double diffusive
transport of heat and salt (e.g., Turner, 1973) along the borehole complex. The required
salinity gradients seem unaceptably large, however, if the mechanism is to be operative over
a significant length of the hole. The phenomenon has not been investigated in boreholes.
31

TEMPERATURE C°CD
20
40
60
GRADIENT C°C/KMD
GAMMA CCOUNTS/SD
-200
0 0
2000 0
50
100
150
200
CO ro
ML
GR
AP
+
1 JU
LY
23
, 1989
500
Fig
ure
12.
Tem
pera
ture
, te
mp
erat
ure
gra
dien
t, n
atura
l ga
mm
a-ra
y (c
orre
cted
) an
d ge
nera
lize
d li
thol
ogic
log
s fo
r M
LG
RA
P
#
1.
Goo
dwin
's
(198
8)
lith
olog
y ge
nera
lize
d as
fol
low
s:
Whi
te,
glac
ial
till
. D
ots,
ba
salt
ic r
ocks
. V
erti
cal
pat
tern
, rh
yoli
tic
rock
s.
See
tabl
e 4
to d
isti
ngui
sh f
low
s, t
uff,
cin
ders
, as
h, b
recc
ia,
lapi
lli,
and
teph
ra.
Oth
er
sym
bols
in
figu
re a
re:
WT
(
)
> w
ater
tab
le,
WL
(----),
wat
er l
evel
as
mea
sure
d in
tub
ing.
A
, B
l, B
2,
C (
.-.-
.-) t
op (
if n
ot s
urfa
ce)
and
bott
om
of
casi
ng s
trin
gs.
Tot
al d
epth
dri
lled
is t
he b
ott
om
of
the
lith
olog
ic
log.
Tem
pera
ture
s ab
ove
WL
are
ina
ccur
ate.

The deep temperature maximum at 430 m (1410 ft) occurs at a contact between a
rhyolite tuff and a rhyolite (fig. 12). Goodwin (1988) regards this contact as a fault. The
region immediately above it cooled slightly and that below warmed judging from the last
two sets of temperatures (fig. 7a,b). These are weak data, but the fact that the gradient
and aspect ratio plots are noteably irregular below the temperature maximum, especially
near the bottom of the hole, suggest an interval of instability, perhaps associated with the
fault. It is unusual to observe this degree of irregularity where the gradients are negative.
In MLGRAP # 2, there are no temperature reversals in the water column but the
gradients above 250 m (820 ft) are anomalously high with respect to those in the lower part
of the hole (fig. 13). A water entry was noted at about 277 m (910 ft) during drilling which
caused the liquid level to rise about 84 m (275 ft) above the ambient liquid level of about
114 m (375 ft). The zone of entry is near the top of the early rhyolite tuff. As previously
noted, a water entry also occurred near the same stratigraphic position in MLGRAP # 1,
but the head differential was much smaller. It is possible that the bulge in the temperature
profile in # 2 is caused by upward flow along the uncemented annulus from the zone of
water entry and possibly from undetected entries from below, where the hydrostatic head
seems to systematically increase with depth (weak data). The notion of upward flow is
also supported by the temperature-time plots at various depths (figs. 8a and 8b) where
the last point on many of the curves is high, particularly in the zone of the bulge as might
be expected if the postulated flow were present. Again, these are weak data for reasons
previously explained. Another possibility is that the bulge is due to upward flow through
surrounding formations by a mechanism offered by Bredehoeft and Papadopulos (1965),
but much additional data and analysis are required to test this hypothesis.
CONCLUSIONSSingle precision temperature logs in the two holes obtained 1.5 yr after drilling provide
a fairly accurate description of the subsurface thermal regime in the vicinity of each hole.
These logs coupled with those obtained by Goodwin (1988) at 6 m (20 ft) depth intervals
shortly after drilling provide an additional basis for identifying fluid-flow along the bore
hole complex, and show that segments of the annulus between hole and casing were not
effectively sealed (a nearly impossible operation in such lithology). This conclusion could
have been drawn from the precision temperature logs alone. However, the case is more
credible when the earlier data are incorporated in the analysis. Ideally, more numerous
sets of precision temperatures in each hole obtained with the same logging system would
have been desirable.
33

oo
TEMPERATURE C°CD
20
40
60
GRADIENT C°C/KMD
GAMMA CCOUNTS/SD
0 200
400
600 0
50
100
150
200
MLGRAP * 2
JULY 2
4, 1989
500
Fig
ure
13.
Tem
pera
ture
, te
mper
atu
re g
radi
ent,
nat
ura
l ga
mm
a-ra
y (c
orre
cted
) an
d ge
nera
lize
d li
thol
ogic
log
s fo
r M
LG
RA
P
$ 2
. G
oodw
in's
(19
88)
lith
olog
y ge
nera
lize
d as
fol
low
s: W
hite
, gl
acia
l ti
ll.
Dot
s, b
asal
tic
rock
s. V
erti
cal
pat
tern
, rh
yoH
tic r
ocks
. Se
e ta
ble
5 to
dis
ting
uish
flo
ws,
tuf
f, c
inde
rs,
ash,
bre
ccia
, la
pill
i, an
d te
phra
. O
ther
sym
bols
in
figu
re a
re:
WT
(
)
> w
ater
tab
le,
WL
(----),
wat
er l
evel
as
mea
sure
d in
tub
ing.
A
, B
( -
- -
) b
ott
om
of
cas
ing
stri
ngs.
Tot
al d
epth
dri
lled
is
the
bott
om
of
the
lith
olog
ic l
og.
Tem
pera
ture
s ab
ove
WL
are
ina
ccur
ate.

Additional precision temperature logging in these holes over a period of years might
prove rewarding. The flow of fluid through the vadose zone is not well understood. The
temperature log in MLGRAP # 1 above the water table is a clear indication of this (fig.
12). The area is tectonically unstable and some hydrothermal changes have been attributed
to recent earthquake shaking and deformation (e.g., Diment, et a/., 1985; Urban, et a/.,
1987a, 1987b). Indeed the July 1989 logs were obtained during a noteably prolonged (6
months) swarm of small earthquakes under Mammoth Mountain (Hill, et a/., 1990) a few
kilometers west of Mammoth Lakes. What effect such shaking has on the hydrothermal
regime is unknown, and shall remain so, unless efforts are made to monitor borehole
temperatures over time. The recent history of unrest in the Long Valley caldera, as well
as in other calderas, has been partly recorded by Newhall and Dzurisin (1988), who show
that unrest is often episodic.
The natural 7 ray logs nicely discriminate between rocks of basaltic and rhyolitic
composition, simply because their contrasts in radioactivity are so large that they partially
over-ride the effects of variations in hole diameter due to washouts. We think we see
further correlations, such as interfaces between basalt flows. The 7 ray anomalies are
real but whether they are due to contrasts in radioactivity or variations in hole diameter
or hydrothermal alteration remains to be investigated. This requires a far more detailed
examination than that presented here.
ACKNOWLEDGEMENTSWe thank George Fetzer of the Town of Mammoth Lakes for arranging access to the
wells and support at the sites, and for sharing his knowledge of the history of the wells.
Richard P. Thomas of the California Division of Oil and Gas provided copies of the driller's
logs, temperature logs, and Graphic Well Reports for MLGRAP # 1 and # 2. C.G. Bufe
and H.W. Olsen reviewed the manuscript and suggested many improvements.
35
REFERENCES
Anderson, S.R., and Bartholomay, R.C., 1990, Use of natural gamma logs correlated to
potassium-oxide content in determining the stratigraphy of basalt and sediment
at the Idaho National Engineering Laboratory: Geological Society of America,
Abstracts with Programs, v. 22(6), p. 1-2.
Bailey, R.A., 1989, Geologic map of the Long Valley caldera, Mono-Inyo craters volcanic
chain, eastern California: U.S. Geological Survey Map 1-1933, scale 1:62,500,
2 sheets and 11 p. text.
Bailey, R.A., Dalrymple, C.B., and Lanphere, M.A., 1976, Volcanism, structure and
geochronology of Long Valley caldera, Mono County, California: Journal of
Geophysical Research, v. 81(5), p. 725-744.
Beck, A.E. and Shen, P.Y., 1985, Temperature distribution in flowing liquid wells: Geo
physics, v. 50, p. 1113-1118.
Belkap, W.B., Dewan, J.J., Kirkpatrick, C.V., Mott, W.E., Pearson, A.J., and Rabson,
W.R., 1978, API calibration facility for nuclear logs: in SPWLA Reprint Vol
ume, Gamma Ray, Neutron and Density Logging, Society of Professional Well
Log Analysts, Paper E, p. 289-317.
Benoit, W.R. , 1984 , Initial results from drillholes PLV-1 and PLV-2 in the western moat
of the Long Valley caldera : Geothermal Resources Council, Transactions, v.8,
p. 397-402.
Birch, Francis, 1947, Temperature and heat flow in a well near Colorado Springs: American
Journal of Science, v. 245, p. 733-753.
Bredehoeft, J.D. and Papadopulos, I.S., 1965, Rates of vertical groundwater movement
estimated from the Earth's thermal profile: Water Resources Research, v. 1(2),
p. 325-328.
36

Carmichael, I.S.E., Turner, F.J., and Verhoogen, J., 1974, Igneous petrology: McGraw
Hill, New York, 739 p.
Gumming, J.D. and Wicklund, A.P., 1980, Diamond drill handbook: J.K. Smit, Toronto,
547 p.
Diment, W.H. and Urban, T.C., 1983, A simple method for detecting anomalous fluid
motions in boreholes from continuous temperature logs: Geothermal Resources
Council Transactions, v. 7, p. 485-490.
Diment, W.H., Urban, T.C., and Nathenson, Manuel, 1985, Temperature variations with
time in a perennially boiling well in the Long Valley caldera, Mono County,
California: Observations in Chance No. 1 (1976-1985): Geothermal Resources
Council Transactions, v. 9, pt. 1, p. 417-422.
Goodwin, Douglas, 1988, Graphic Well Report, Well Summary Report - Geothermal:
California Division of Oil and Gas, A.P.I. No. 051-90120 (MLGRAP # l) and
051-90121 (MLGRAP # 2).
Higgins, C.T., Flynn, Thomas, Chapman, R.H., Trexler, D.T., Chase, G.R., Bacon, C.F.,
and Ghusn, George, 1985, Geothermal systems of the Mono Basin-Long Val
ley region, eastern California and western Nevada: California Department of
Conservation, Division of Mines and Geology, Open-File Report 85-19 SAC,
159 p.
Hilchie, D. W., 1978, Applied openhole log interpretation (for geologists and petroleum
engineers): Douglas W. Hilchie, Inc., Golden, Colorado, 319 p.
Hill, D.P., Ellsworth, W.L., Johnston, M.J.S., Langbein, J.O., Oppenheimer, D.H., Reasen-
berg, P.A., Sorey, M.L., and McNutt, S.R., 1990, The 1989 earthquake swarm
beneath Mammoth Mountain, California: An initial look at the 4 May through
30 September activity: Seismological Society of America Bulletin, v. 80,
p. 325-339.
37

Lachenbruch, A.H. and Brewer, M.C., 1959, Dissipation of the temperature effect of drilling
a well in arctic Alaska: U.S. Geological Survey, Bulletin 1083-C, p. 73-109.
Newhall, C.G. and Dzurisin, D., 1988, Historical unrest at large calderas of the world: U.S.
Geological Survey Bulletin 1855, 1108 p.
Rinehart, C.D. and Ross, D.C., 1964, Geology and mineral deposits of the Mount Morrison
quadrangle Sierra Nevada, California: U.S. Geological Survey Professional Paper
385, 106 p.
Robertson, E.G., Raspet, R., Swartz, J.H., and Lillard, M.E., 1966, Preparation of thermis
tors used in geothermal investigations: U.S. Geological Survey Bulletin 1203-B,
34 p.
Schlumberger Well Services, 1975, Cased hole applications: Schlumberger Well Services,
Houston, Texas, 124 p.
Sorensen, H., ed., 1974, The alkaline rocks: John Wiley and Sons, New York, 622 p.
Suemnicht, G.A., 1987, Results of deep drilling in the west moat of Long Valley, California:
EOS, American Geophysical Union Transactions, v. 68(40), p. 785 and 789.
Suemnicht, G.A., and Varga, R.J., 1988, Basement structure and implications for hy-
drothermal circulation patterns in the western moat of Long Valley caldera,
California: Journal of Geophysical Research, v. 93(B11), p. 13,191-13,207.
Turner, J.S., 1973, Buoyancy effects in fluids: Cambridge University Press, Cambridge,
368 p.
Urban, T.C. and Diment, W.H., 1985, Convection in boreholes: Limits on interpreta
tion of temperature logs and methods for determining anomalous fluid-flow:
NWWA Conference on Surface and Borehole Geophysical Methods in Ground-
Water Investigations, February 12-14, 1985, National Water Well Association,
Worthington, Ohio, p. 399-414.
38

Urban, T.C. and Diment, W.H., 1988, Precision temperature log in the hottest well in the
Long Valley caldera - Implications as to hydrothermal conditions and fluid ex
change along the well: Geological Society of America Abstracts with Programs,
v. 20(7), p. A92.
Urban, T.C. and Diment, W.H., 1989a, Capillary corrections for acid-etch inclinometry in
boreholes for glass tubes ranging in diameter from 6-25 mm and over a tem
perature range of 4-80 °C: in Proceedings Third International Symposium on
Borehole Geophysics for Minerals, Geotechnical, and Ground-Water Applica
tions: Minerals and Geotechnical Logging Society, A Chapter-at-Large of the
Society of Professional Well-Log Analysts, October 2-5, Las Vegas, Nevada,
p. 233-260.
Urban, T.C. and Diment, W.H., 1989b, Capillary correction for acid-etch inclinometry
in boreholes for glass tubes ranging in diameter from 6-25 mm and over a
temperature range of 4-80 °C including statistical analysis of the data: U.S.
Geological Survey Open-File Report 89-632, 109 p.
Urban, T.C. and Diment, W.H., 1990, Thermistor calibrations, techniques, and computer
programs, 1968-1989: U.S. Geological Survey Open-File Report 90-216, 48 p.
Urban, T.C., Diment, W.H., and Moses, T.H., 1988, Heat transport mechanisms in the west
moat of the Long Valley caldera, California as revealed by precision temperature
logs in PLV-1 repeated over a 3-year interval: EOS, American Geophysical Union
Transactions, v. 69, p. 1187.
Urban, T.C., Diment, W.H., and Sorey, M.L., 1987a, Temperature and natural gamma-ray
logs obtained in 1986 from Shady Rest drill hole RDO8, Mammoth Lakes, Mono
County, California: U.S. Geological Survey Open-File Report 87-291, 102 p.
Urban, T.C., Diment, W.H., and Sorey, M.L., 1987b, Hydrothermal regime of the south
west moat of the Long Valley caldera, Mono County, California, and its relation
to seismicity - New evidence from the Shady Rest borehole (RDO8): Geother-
mal Resources Council Transactions, v. 11, p. 391-400.
39

APPENDIX I
Probe 500-02 - July 11, 1989 Thermistor Calibrations0 - 30°C ............................. 41
30 - 60°C ............................. 4360 - 90°C ............................. 4590 - 120°C ............................. 47
120 - 150°C ............................. 49150 - 180°C ............................. 51180 - 210°C ............................. 53
Probe 500-02 - October 21, 1989 Thermistor Calibrations0 - 30°C ............................. 55
30 - 60°C ............................. 5760 - 90°C ............................. 5990 - 120°C ............................. 61
120 - 150°C ............................. 63150 - 180°C ............................. 65180 - 210°C ............................. 67
40

THERMISTOR CALIBRATION: PROBE 500-02 - 11 July 1989
NOMINAL TEMPERATURE RANGE: 0 - 30 °C
CALIBRATION RESISTANCE RANGE: 425513 - 2107375 OHMS
THERMISTOR OBSERVEDRESISTANCE TEMPERATURE
(OHMS) (°C)
CALCULATED TEMPERATURE TEMPERATURE DIFFERENCE
21075802107508210745821074122107375210734221072942107273210726121072491192166119013811875751184098118004311756221170918116602011609661155882709960.0707600.0703157.0701021.0698926.0696881.0694860.0692858.0690871.0688118.0429471.0428700.0427917.0426323.0425513.0424720.0423932.0423149.0422351.0421568.0
0.0170.0170.0230.0230.0250.0270.0310.0330.0330.033
10.20910.24310.28310.33510.39810.46610.54210.61810.69610.77820.00320.06720.18820.25220.31020.36620.42420.47820.53220.61230.02030.06030.09830.17430.21230.25030.28630.32630.36430.400
0.0240.0250.0250.0260.0260.0260.0270.0270.0270.02710.21010.24210.28110.33510.39810.46710.54110.61910.69910.78020.00420.06820.19120.25020.30820.36520.42120.47720.53320.61130.02230.05930.09630.17330.21230.25030.28830.32630.36430.403
-0.007-0.008-0.002-0.003-0.0010.0010.0040.0060.0060.006
-0.0010.0010.0020.0000.000
-0.0010.001
-0.001-0.003-0.002-0.001-0.001-0.0030.0020.0020.0010.0030.001
-0.0010.001
-0.0020.0010.0020.0010.0000.000
-0.0020.0000.000
-0.003
41

THERMISTOR CALIBRATION: PROBE 500-02 - 11 July 1989
NOMINAL TEMPERATURE RANGE: 0 - 30 °C
CALIBRATION RESISTANCE RANGE: 425513 - 2107375 OHMS
T C1 + C2 x In(fl)THERMISTOR EQUATION: / - L-LC3 + In(fl)
Cl = 5111.5764 S. DEV. Cl = 9.0408
C2 = -351.0106 S. DEV. C3 = 0.6215
C3 = 5.6447 S. DEV. C3 = 0.0329
42
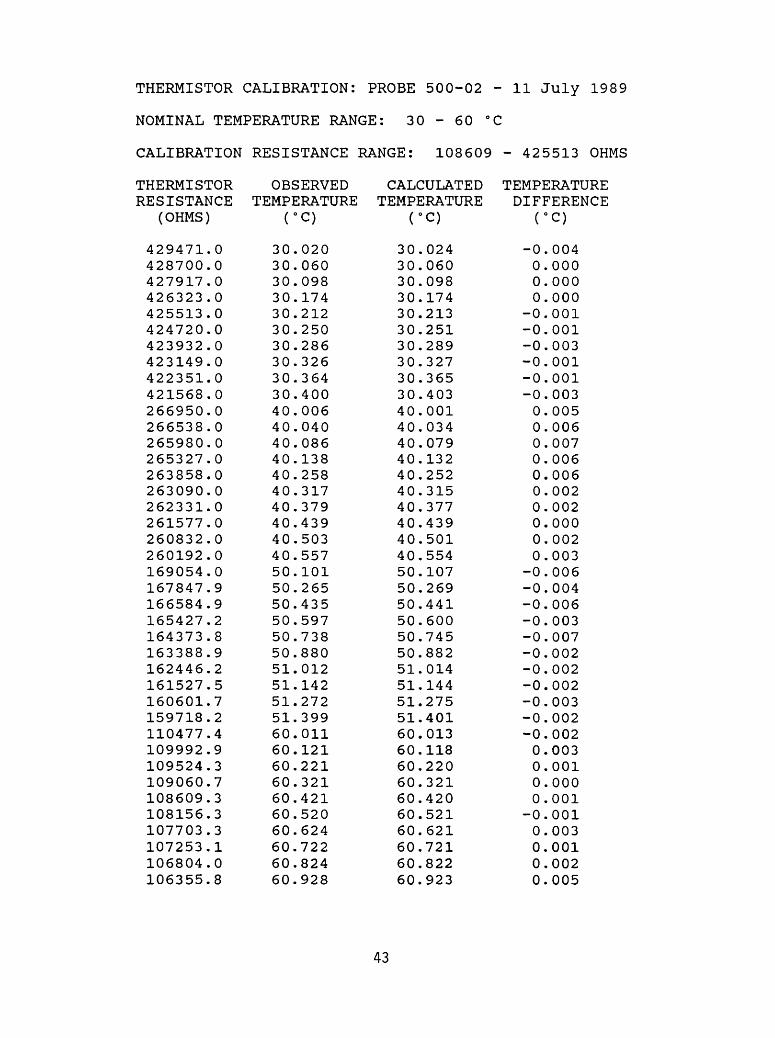
THERMISTOR CALIBRATION: PROBE 500-02 - 11 July 1989
NOMINAL TEMPERATURE RANGE: 30 - 60 °C
CALIBRATION RESISTANCE RANGE: 108609 - 425513 OHMS
THERMISTOR OBSERVEDRESISTANCE TEMPERATURE
(OHMS) (°C)
CALCULATED TEMPERATURE
TEMPERATURE DIFFERENCE
429471.0428700.0427917.0426323.0425513.0424720.0423932.0423149.0422351.0421568.0266950.0266538.0265980.0265327.0263858.0263090.0262331.0261577.0260832.0260192.0169054.0167847.9166584.9165427.2164373.8163388.9162446.2161527.5160601.7159718.2110477.4109992.9109524.3109060.7108609.3108156.3107703.3107253.1106804.0106355.8
30.02030.06030.09830.17430.21230.25030.28630.32630.36430.40040.00640.04040.08640.13840.25840.31740.37940.43940.50340.55750.10150.26550.43550.59750.73850.88051.01251.14251.27251.39960.01160.12160.22160.32160.42160.52060.62460.72260.82460.928
30.02430.06030.09830.17430.21330.25130.28930.32730.36530.40340.00140.03440.07940.13240.25240.31540.37740.43940.50140.55450.10750.26950.44150.60050.74550.88251.01451.14451.27551.40160.01360.11860.22060.32160.42060.52160.62160.72160.82260.923
-0.0040.0000.0000.000
-0.001-0.001-0.003-0.001-0.001-0.0030.0050.0060.0070.0060.0060.0020.0020.0000.0020.003
-0.006-0.004-0.006-0.003-0.007-0.002-0.002-0.002-0.003-0.002-0.0020.0030.0010.0000.001
-0.0010.0030.0010.0020.005
43

THERMISTOR CALIBRATION: PROBE 500-02 - 11 July 1989
NOMINAL TEMPERATURE RANGE: 30 - 60 °C
CALIBRATION RESISTANCE RANGE: 108609 - 425513 OHMS
C1 + C2 x \n(R\ THERMISTOR EQUATION: T - v '
C3 + In(fl)
Cl = 4955.0164 S. DEV. Cl = 11.9764
C2 = -340.0962 S. DEV. C3 = 0.8368
C3 = 5.1443 S. DEV. C3 = 0.0378
44
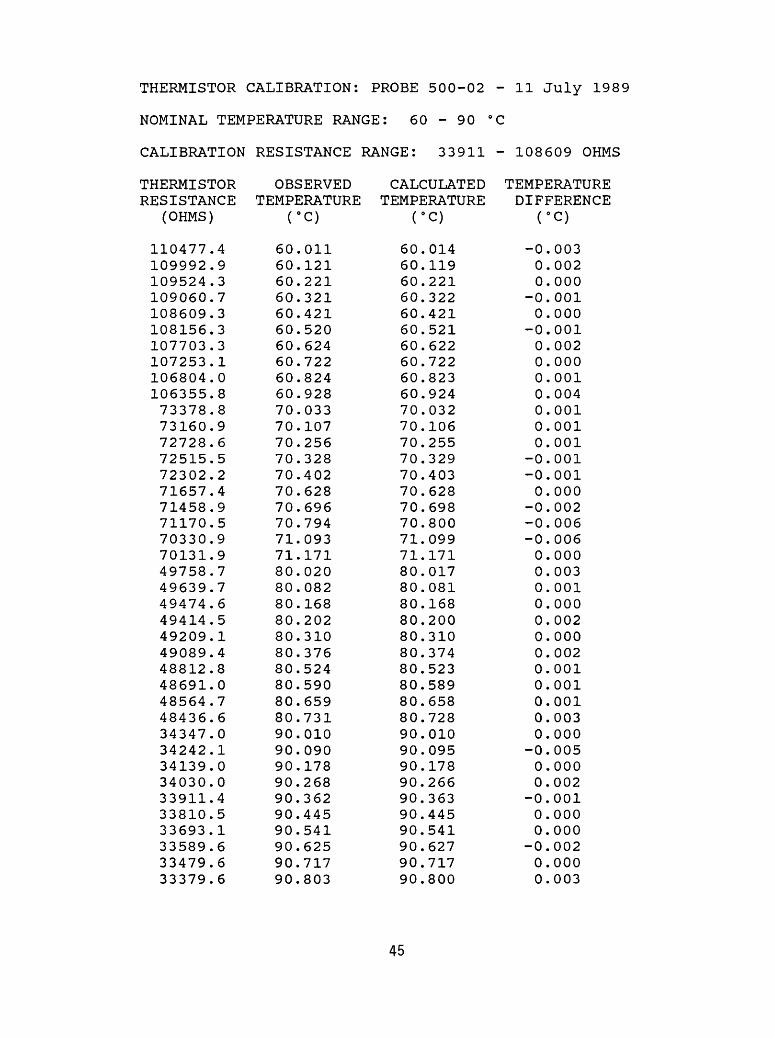
THERMISTOR CALIBRATION: PROBE 500-02 - 11 July 1989
NOMINAL TEMPERATURE RANGE: 60 - 90 °C
CALIBRATION RESISTANCE RANGE: 33911 - 108609 OHMS
THERMISTOR OBSERVED CALCULATED TEMPERATURERESISTANCE TEMPERATURE TEMPERATURE DIFFERENCE
(OHMS) (°C) (°C) (°C)
110477.4109992.9109524.3109060.7108609.3108156.3107703.3107253.1106804.0106355.873378.873160.972728.672515.572302.271657.471458.971170.570330.970131.949758.749639.749474.649414.549209.149089.448812.848691.048564.748436.634347.034242.134139.034030.033911.433810.533693.133589.633479.633379.6
60.01160.12160.22160.32160.42160.52060.62460.72260.82460.92870.03370.10770.25670.32870.40270.62870.69670.79471.09371.17180.02080.08280.16880.20280.31080.37680.52480.59080.65980.73190.01090.09090.17890.26890.36290.44590.54190.62590.71790.803
60.01460.11960.22160.32260.42160.52160.62260.72260.82360.92470.03270.10670.25570.32970.40370.62870.69870.80071.09971.17180.01780.08180.16880.20080.31080.37480.52380.58980.65880.72890.01090.09590.17890.26690.36390.44590.54190.62790.71790.800
-0.0030.0020.000
-0.0010.000
-0.0010.0020.0000.0010.0040.0010.0010.001
-0.001-0.0010.000
-0.002-0.006-0.0060.0000.0030.0010.0000.0020.0000.0020.0010.0010.0010.0030.000
-0.0050.0000.002
-0.0010.0000.000
-0.0020.0000.003
45

THERMISTOR CALIBRATION: PROBE 500-02 - 11 July 1989
NOMINAL TEMPERATURE RANGE: 60 - 90 °C
CALIBRATION RESISTANCE RANGE: 33911 - 108609 OHMS
C1 + C2 x \r\(R\ THERMISTOR EQUATION: T - v '
C3 + In(fl)
Cl = 4956.4810 S. DEV. Cl = 8.4205
C2 = -340.2229 S. DEV. C3 = 0.6044
C3 = 5.1440 S. DEV. C3 = 0.0235
46

THERMISTOR CALIBRATION: PROBE 500-02 - 11 July 1989
NOMINAL TEMPERATURE RANGE: 90 - 120 °C
CALIBRATION RESISTANCE RANGE: 12306 - 33911 OHMS
THERMISTOR OBSERVED CALCULATED TEMPERATURERESISTANCE TEMPERATURE TEMPERATURE DIFFERENCE
(OHMS) (°C) (°C) (°C)
34347.034242.134139.034030.033911.433810.533693.133589.633479.633379.624108.824039.223973.923897.423757.523688.123615.923545.723236.623114.217207.917164.317121.617076.017034.316987.516946.116901.016860.416817.812434.012401.912370.612338.212306.512274.912118.012087.412005.011971.9
90.01090.09090.17890.26890.36290.44590.54190.62590.71790.803100.018100.108100.181100.277100.447100.531100.617100.703101.086101.246110.011110.089110.167110.245110.319110.407110.481110.558110.630110.710120.089120.167120.247120.332120.414120.494120.908120.987121.207121.291
90.00990.09490.17790.26690.36290.44590.54190.62690.71790.800100.021100.104100.183100.276100.446100.531100.620100.706101.090101.244110.012110.089110.164110.245110.320110.403110.477110.558110.631110.708120.088120.170120.250120.333120.415120.496120.906120.986121.204121.292
0.001-0.0040.0010.0020.0000.0000.000
-0.0010.0000.003
-0.0030.004
-0.0020.0010.0010.000
-0.003-0.003-0.0040.002
-0.0010.0000.0030.000
-0.0010.0040.0040.000
-0.0010.0020.001
-0.003-0.003-0.001-0.001-0.0020.0020.0010.003
-0.001
47

THERMISTOR CALIBRATION: PROBE 500-02 - 11 July 1989
NOMINAL TEMPERATURE RANGE: 90 - 120 °C
CALIBRATION RESISTANCE RANGE: 12306 - 33911 OHMS
THERMISTOR EQUATION:C1 + C2 x In(fl)
C3 + In(fl)
Cl = 4831.0201
C2 = -331.1772
C3 = 4.7999
S. DEV. Cl =
S. DEV. C3 =
S. DEV. C3 =
8.8062
0.6539
0.0220
48

THERMISTOR CALIBRATION: PROBE 500-02 - 11 July 1989
NOMINAL TEMPERATURE RANGE: 120 - 150 °C
CALIBRATION RESISTANCE RANGE: 5082 - 12306 OHMS
THERMISTORRESISTANCE
(OHMS)
OBSERVED TEMPERATURE
CO
CALCULATED TEMPERATURE
CO
TEMPERATURE DIFFERENCECO
12434.012401.912370.612338.212306.512274.912118.012087.412005.011971.99135.29114.29091.59071.59046.69024.19001.48978.88956.38920.46811.96798.76784.66770.86757.96744.56730.56717.46703.66690.05138.65127.35105.15093.85082.75071.05059.85049.95038.44976.9
120.089120.167120.247120.332120.414120.494120.908120.987121.207121.291130.089130.164130.248130.320130.412130.494130.582130.662130.743130.881140.032140.104140.172140.242140.308140.376140.446140.515140.585140.659150.004150.084150.239150.319150.399150.481150.559150.631150.709151.162
120.087120.169120.250120.333120.415120.496120.906120.986121.204121.292130.088130.164130.247130.320130.412130.494130.578130.662130.745130.879140.033140.100140.172140.242140.309140.377140.449140.517140.588140.659150.002150.081150.238150.318150.397150.481150.561150.632150.714151.160
0.002-0.002-0.003-0.001-0.001-0.0020.0020.0010.003
-0.0010.0010.0000.0010.0000.0000.0000.0040.000
-0.0020.002
-0.0010.0040.0000.000
-0.001-0.001-0.003-0.002-0.0030.0000.0020.0030.0010.0010.0020.000
-0.002-0.001-0.0050.002
49

THERMISTOR CALIBRATION: PROBE 500-02 - 11 July 1989
NOMINAL TEMPERATURE RANGE: 120 - 150 °C
CALIBRATION RESISTANCE RANGE: 5082 - 12306 OHMS
THERMISTOR EQUATION: T - + C3
Cl = 4768.5045 S. DEV. Cl = 9.2358
C2 = -326.4932 S. DEV. C3 = 0.7128
C3 = 4.6471 S. DEV. C3 = 0.0210
50
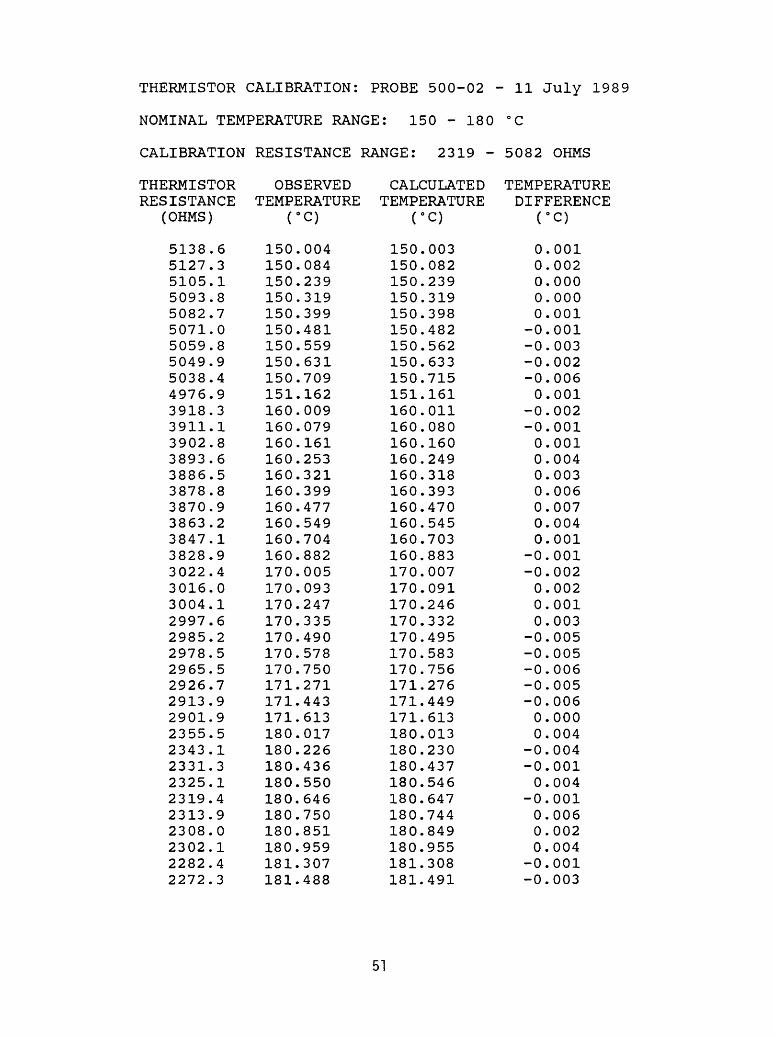
THERMISTOR CALIBRATION: PROBE 500-02 - 11 July 1989
NOMINAL TEMPERATURE RANGE: 150 - 180 °C
CALIBRATION RESISTANCE RANGE: 2319 - 5082 OHMS
THERMISTORRESISTANCE
(OHMS)
OBSERVED TEMPERATURE
CALCULATED TEMPERATURE
TEMPERATURE DIFFERENCE
5138.65127.35105.15093.85082.75071.05059.85049.95038.44976.93918.33911.13902.83893.63886.53878.83870.93863.23847.13828.93022.43016.03004.12997.62985.22978.52965.52926.72913.92901.92355.52343.12331.32325.12319.42313.92308.02302.12282.42272.3
150.004150.084150.239150.319150.399150.481150.559150.631150.709151.162160.009160.079160.161160.253160.321160.399160.477160.549160.704160.882170.005170.093170.247170.335170.490170.578170.750171.271171.443171.613180.017180.226180.436180.550180.646180.750180.851180.959181.307181.488
150.003150.082150.239150.319150.398150.482150.562150.633150.715151.161160.011160.080160.160160.249160.318160.393160.470160.545160.703160.883170.007170.091170.246170.332170.495170.583170.756171.276171.449171.613180.013180.230180.437180.546180.647180.744180.849180.955181.308181.491
0.0010.0020.0000.0000.001
-0.001-0.003-0.002-0.0060.001
-0.002-0.0010.0010.0040.0030.0060.0070.0040.001
-0.001-0.0020.0020.0010.003
-0.005-0.005-0.006-0.005-0.0060.0000.004
-0.004-0.0010.004
-0.0010.0060.0020.004
-0.001-0.003
51

THERMISTOR CALIBRATION: PROBE 500-02 - 11 July 1989
NOMINAL TEMPERATURE RANGE: 150 - 180 °C
CALIBRATION RESISTANCE RANGE: 2319 - 5082 OHMS
THERMISTOR EQUATION: T - - - C3
Cl = 4594.9168 S. DEV. Cl = 15.7163
C2 = -312.8635 S. DEV. C3 = 1.2647
C3 = 4.2662 S. DEV. C3 = 0.0328
52
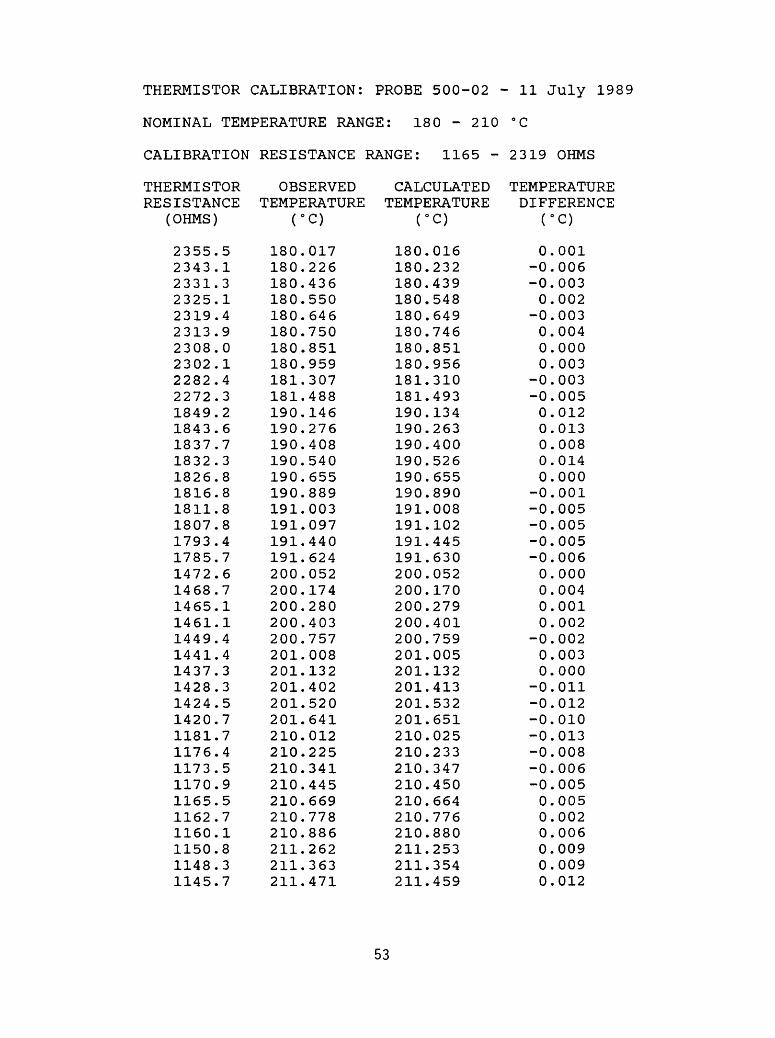
THERMISTOR CALIBRATION: PROBE 500-02 - 11 July 1989
NOMINAL TEMPERATURE RANGE: 180 - 210 °C
CALIBRATION RESISTANCE RANGE: 1165 - 2319 OHMS
THERMISTOR OBSERVEDRESISTANCE TEMPERATURE
(OHMS) (°C)
CALCULATED TEMPERATURE
TEMPERATURE DIFFERENCECO
2355.52343.12331.32325.12319.42313.92308.02302.12282.42272.31849.21843.61837.71832.31826.81816.81811.81807.81793.41785.71472.61468.71465.11461.11449.41441.41437.31428.31424.51420.71181.71176.41173.51170.91165.51162.71160.11150.81148.31145.7
180.017180.226180.436180.550180.646180.750180.851180.959181.307181.488190.146190.276190.408190.540190.655190.889191.003191.097191.440191.624200.052200.174200.280200.403200.757201.008201.132201.402201.520201.641210.012210.225210.341210.445210.669210.778210.886211.262211.363211.471
180.016180.232180.439180.548180.649180.746180.851180.956181.310181.493190.134190.263190.400190.526190.655190.890191.008191.102191.445191.630200.052200.170200.279200.401200.759201.005201.132201.413201.532201.651210.025210.233210.347210.450210.664210.776210.880211.253211.354211.459
0.001-0.006-0.0030.002
-0.0030.0040.0000.003
-0.003-0.0050.0120.0130.0080.0140.000
-0.001-0.005-0.005-0.005-0.0060.0000.0040.0010.002
-0.0020.0030.000
-0.011-0.012-0.010-0.013-0.008-0.006-0.0050.0050.0020.0060.0090.0090.012
53

THERMISTOR CALIBRATION: PROBE 500-02 - 11 July 1989
NOMINAL TEMPERATURE RANGE: 180 - 210 8 C
CALIBRATION RESISTANCE RANGE: 1165 - 2319 OHMS
THERMISTOR EQUATION: T - - - C3
Cl = 4447.3889 S. DEV. Cl = 32.0955
C2 = -300.6429 S. DEV. C3 = 2.6992
C3 = 3.9736 S. DEV. C3 = 0.0620
54
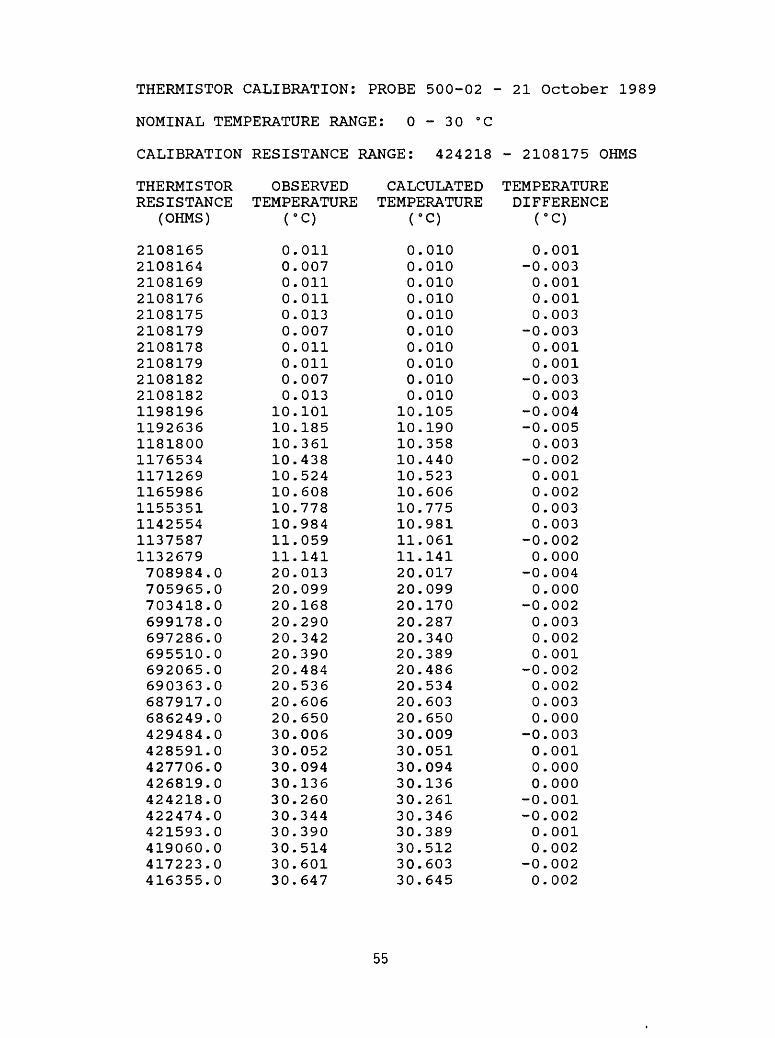
THERMISTOR CALIBRATION: PROBE 500-02 -21 October 1989
NOMINAL TEMPERATURE RANGE: 0 - 30 °C
CALIBRATION RESISTANCE RANGE: 424218 - 2108175 OHMS
THERMISTORRESISTANCE
(OHMS)
OBSERVED TEMPERATURE
CALCULATED TEMPERATURE
TEMPERATURE DIFFERENCE
21081652108164210816921081762108175210817921081782108179210818221081821198196119263611818001176534117126911659861155351114255411375871132679708984.0705965.0703418.0699178.0697286.0695510.0692065.0690363.0687917.0686249.0429484.0428591.0427706.0426819.0424218.0422474.0421593.0419060.0417223.0416355.0
0.0110.0070.0110.0110.0130.0070.0110.0110.0070.013
10.10110.18510.36110.43810.52410.60810.77810.98411.05911.14120.01320.09920.16820.29020.34220.39020.48420.53620.60620.65030.00630.05230.09430.13630.26030.34430.39030.51430.60130.647
0.0100.0100.0100.0100.0100.0100.0100.0100.0100.010
10.10510.19010.35810.44010.52310.60610.77510.98111.06111.14120.01720.09920.17020.28720.34020.38920.48620.53420.60320.65030.00930.05130.09430.13630.26130.34630.38930.51230.60330.645
0.001-0.0030.0010.0010.003
-0.0030.0010.001
-0.0030.003
-0.004-0.0050.003
-0.0020.0010.0020.0030.003
-0.0020.000
-0.0040.000
-0.0020.0030.0020.001
-0.0020.0020.0030.000
-0.0030.0010.0000.000
-0.001-0.0020.0010.002
-0.0020.002
55

THERMISTOR CALIBRATION: PROBE 500-02 - 21 October 1989
NOMINAL TEMPERATURE RANGE: 0 - 30 °C
CALIBRATION RESISTANCE RANGE: 424218 - 2108175 OHMS
THERMISTOR EQUATION: T -C3
Cl = 5090.1942 S. DEV. Cl = 6.9258
C2 = -349.5553 S. DEV. C3 = 0.4761
C3 = 5.5691 S. DEV. C3 = 0.0252
56

THERMISTOR CALIBRATION: PROBE 500-02 - 21 October 1989
NOMINAL TEMPERATURE RANGE: 30 - 60 °C
CALIBRATION RESISTANCE RANGE: 104443 - 424218 OHMS
THERMISTORRESISTANCE
(OHMS)
OBSERVED TEMPERATURE
CALCULATED TEMPERATURE
TEMPERATURE DIFFERENCE
429484.0428591.0427706.0426819.0424218.0422474.0421593.0419060.0417223.0416355.0257225.0256662.7256093.5255512.6253797.5253242.1251718.8251153.2250606.3250050.9168866.0168108.5166605.9165866.7165123.4164383.7163646.8162916.7161800.0161075.7108353.1106177.7105493.7104932.3104443.4103591.6103248.9102802.8102623.6
30.00630.05230.09430.13630.26030.34430.39030.51430.60130.64740.79140.83740.88540.92841.07641.12641.26041.30841.35441.40250.11750.21950.42550.53150.62950.73050.83850.93651.08851.19660.45160.95861.10561.23761.34761.53961.62361.73061.772
30.00930.05230.09430.13630.26130.34630.38830.51230.60230.64440.78940.83640.88440.93341.07941.12741.25741.30641.35441.40250.11950.22150.42550.52750.62950.73150.83350.93551.09251.19560.46560.95161.10661.23461.34661.54361.62361.72761.769
-0.0030.0000.0000.000
-0.001-0.0020.0020.002
-0.0010.0030.0020.0010.001
-0.005-0.003-0.0010.0030.0020.0000.000
-0.002-0.0020.0000.0040.000
-0.0010.0050.001
-0.0040.001
-0.0140.007
-0.0010.0030.001
-0.0040.0000.0030.003
57

THERMISTOR CALIBRATION: PROBE 500-02 - 21 October 1989
NOMINAL TEMPERATURE RANGE: 30 - 60 °C
CALIBRATION RESISTANCE RANGE: 104443 - 424218 OHMS
THERMISTOR EQUATION: T -Cl + C2 x
C3
Cl = 4954.0380
C2 = -340.0484
C3 = 5.1407
S. DEV. Cl
S. DEV. C3
S. DEV. C3
10.9306
0.7639
0.0344
58

THERMISTOR CALIBRATION: PROBE 500-02 - 21 October 1989
NOMINAL TEMPERATURE RANGE: 60 - 90 °C
CALIBRATION RESISTANCE RANGE: 34021 - 104443 OHMS
THERMISTOR OBSERVED CALCULATED TEMPERATURERESISTANCE TEMPERATURE TEMPERATURE DIFFERENCE
(OHMS) (°C) (°C) (°C)
108353.1106177.7105493.7104932.3104443.4103591.6103248.9102802.8102623.672954.772739.972525.172094.471881.771458.571083.170870.670452.170046.249746.449575.449403.749234.048731.248565.148236.247829.347651.047491.334350.234265.234181.734100.834021.633937.233854.933776.133611.633347.7
60.45160.95861.10561.23761.34761.53961.62361.73061.77270.16770.24270.31470.46670.53470.68870.81870.88771.03171.18180.01080.10480.19280.27880.55080.64580.81981.04381.14581.23290.00290.07490.13890.20890.26890.34090.40790.47190.60390.823
60.46660.95161.10661.23561.34761.54461.62361.72861.77070.16170.23570.30970.45970.53370.68270.81470.89071.03971.18580.01080.10180.19280.28380.55480.64480.82481.04881.14781.23690.00390.07190.13990.20490.26990.33890.40590.46990.60590.823
-0.0150.007
-0.0010.0020.000
-0.0050.0000.0020.0020.0060.0070.0050.0070.0010.0060.004
-0.003-0.008-0.0040.0000.0030.000
-0.005-0.0040.001
-0.005-0.005-0.002-0.004-0.0010.003
-0.0010.004
-0.0010.0020.0020.002
-0.0020.000
59

THERMISTOR CALIBRATION: PROBE 500-02 - 21 October 1989
NOMINAL TEMPERATURE RANGE: 60 - 90 °C
CALIBRATION RESISTANCE RANGE: 34021 - 104443 OHMS
THERMISTOR EQUATION: T - - - C3
Cl = 4877.0832 S. DEV. Cl = 18.6525
C2 = -334.5633 S. DEV. C3 = 1.3399
C3 = 4.9194 S. DEV. C3 = 0.0519
60

THERMISTOR CALIBRATION: PROBE 500-02 - 21 October 1989
NOMINAL TEMPERATURE RANGE: 90 - 120 °C
CALIBRATION RESISTANCE RANGE: 12375 - 34021 OHMS
THERMISTOR OBSERVED CALCULATED TEMPERATURERESISTANCE TEMPERATURE TEMPERATURE DIFFERENCE
(OHMS) (°C) (°C) (°C)
34350.234265.234181.734100.834021.633937.233854.933776.133611.633347.724062.823959.723909.523857.323808.823757.023705.023653.423565.523514.617175.417140.217106.417071.617035.516999.916963.916890.416839.816804.612462.212441.212418.912397.512375.012352.412331.512309.212285.012263. 1
90.00290.07490.13890.20890.26890.34090.40790.47190.60390.823100.070100.195100.257100.321100.381100.447100.509100.573100.683100.741110.063110.129110.189110.251110.317110.379110.441110.572110.666110.728120.013120.067120.123120.179120.239120.295120.352120.406120.468120.520
90.00490.07290.14090.20590.27090.33890.40690.47090.60590.824
100.073100.197100.258100.322100.381100.444100.507100.571100.679100.742110.066110.129110.189110.250110.315110.378110.443110.574110.666110.729120.014120.067120.124120.179120.236120.294120.348120.406120.468120.525
-0.0020.002
-0.0020.003
-0.0020.0020.0010.001
-0.002-0.001-0.003-0.002-0.001-0.0010.0000.0030.0020.0020.004
-0.001-0.0030.0000.0000.0010.0020.001
-0.002-0.0020.000
-0.001-0.0010.000
-0.0010.0000.0030.0010.0040.0000.000
-0.005
61

THERMISTOR CALIBRATION: PROBE 500-02 - 21 October 1989
NOMINAL TEMPERATURE RANGE: 90 - 120 °C
CALIBRATION RESISTANCE RANGE: 12375 - 34021 OHMS
THERMISTOR EQUATION: T - - - C3
Cl = 4824.9218 S. DEV. Cl = 8.4731
C2 = -330.7297 S. DEV. C3 = 0.6290
C3 = 4.7845 S. DEV. C3 = 0.0212
62

THERMISTOR CALIBRATION: PROBE 500-02 - 21 October 1989
NOMINAL TEMPERATURE RANGE: 120 - 150 °C
CALIBRATION RESISTANCE RANGE: 5099 - 12375 OHMS
THERMISTOR OBSERVEDRESISTANCE TEMPERATURE
(OHMS) (°C)
CALCULATED TEMPERATURE
TEMPERATURE DIFFERENCE
12462.212441.212418.912397.512375.012352.412331.512309.212285.012263.19155.69134.09114.59092.99072.39051.39028.69007.68985.48962.96815.36802.66790.06775.06760.56734.56721. 16707.46693.56673.25137.65127.75118.15108.55099.25089.25079.65070.15061.05051.2
120.013120.067120.123120.179120.239120.295120.352120.406120.468120.520130.009130.089130.158130.236130.312130.390130.474130.548130.634130.711140.008140.072140.140140.212140.288140.424140.491140.563140.631140.741150.008150.078150.142150.210150.275150.341150.407150.481150.543150.621
120.014120.067120.124120.179120.237120.295120.348120.406120.468120.525130.009130.087130.158130.237130.312130.389130.472130.550130.632130.715140.009140.073140.138140.214140.289140.422140.491140.562140.634140.740150.003150.073150.141150.209150.275150.346150.414150.482150.547150.617
-0.0010.000
-0.0010.0000.0020.0000.0040.0000.000
-0.0050.0000.0020.000
-0.0010.0000.0010.002
-0.0020.002
-0.004-0.001-0.0010.002
-0.002-0.0010.0020.0000.001
-0.0030.0010.0050.0050.0010.0010.000
-0.005-0.007-0.001-0.0040.004
63

THERMISTOR CALIBRATION: PROBE 500-02 - 21 October 1989
NOMINAL TEMPERATURE RANGE: 120 - 150 °C
CALIBRATION RESISTANCE RANGE: 5099 - 12375 OHMS
Cl + C2 THERMISTOR EQUATION: T -
C3
Cl = 4735.3079 S. DEV. Cl = 11.3454
C2 = -323.9212 S. DEV. C3 = 0.8752
C3 = 4.5728 S. DEV. C3 = 0.0258
64

THERMISTOR CALIBRATION: PROBE 500-02 - 21 October 1989
NOMINAL TEMPERATURE RANGE: 150 - 180 °C
CALIBRATION RESISTANCE RANGE: 2333 - 5099 OHMS
THERMISTORRESISTANCE
(OHMS)
OBSERVED TEMPERATURE
CALCULATED TEMPERATURE
TEMPERATURE DIFFERENCE
5137.65127.75118.15108.55099.25089.25079.65070.15061.05051.23918.43911.73904.23896.53882.83868.53861.53854.43844.63837.23020.93008.93003.32996.62972.62966.52954.72948.62940.62935.22354.72349.72344.92339.32333.92328.82323.42318.42313.62308.7
150.008150.078150.142150.210150.275150.341150.407150.481150.543150.621160.007160.073160.147160.221160.351160.491160.559160.628160.722160.796170.019170.177170.247170.335170.652170.728170.888170.968171.069171.147180.009180.099180.186180.282180.372180.458180.556180.646180.734180.815
150.004150.074150.142150.210150.275150.346150.415150.483150.548150.618160.005160.069160.142160.216160.349160.489160.557160.627160.723160.796170.018170.174170.248170.336170.652170.733170.890170.972171.079171.152180.009180.096180.180180.278180.372180.462180.557180.646180.731180.818
0.0040.0040.0000.0000.000
-0.005-0.008-0.002-0.0050.0030.0020.0040.0050.0050.0020.0020.0020.001
-0.0010.0000.0010.003
-0.001-0.0010.000
-0.005-0.002-0.004-0.010-0.0050.0000.0030.0060.0040.000
-0.004-0.0010.0000.003
-0.003
65

THERMISTOR CALIBRATION: PROBE 500-02 - 21 October 1989
NOMINAL TEMPERATURE RANGE: 150 - 180 °C
CALIBRATION RESISTANCE RANGE: 2333 - 5099 OHMS
THERMISTOR EQUATION: T - * C3
Cl = 4667.7623 S. DEV. Cl = 17.2459
C2 = -318.6637 S. DEV. C3 = 1.3872
C3 = 4.4219 S. DEV. C3 = 0.0360
66

THERMISTOR CALIBRATION: PROBE 500-02 - 21 October 1989
NOMINAL TEMPERATURE RANGE: 180 - 210 °C
CALIBRATION RESISTANCE RANGE: 1144 - 2333 OHMS
THERMISTOR OBSERVEDRESISTANCE TEMPERATURE
(OHMS) (°C)
CALCULATED TEMPERATURE
TEMPERATURE DIFFERENCE
2354.72349.72344.92339.32333.92328.82323.42318.42313.62308.71853.91849.11844.91840.31836.01827.51823.21818.91815.11807.71472.51468.71465.31462.51452.21448.51441.61436.11432.01428.21180.61172.61164.21151.61144.11140.71138.11135.91133.71131.3
180.009180.099180.186180.282180.372180.458180.556180.646180.734180.815190.008190.112190.218190.324190.428190.621190.719190.827190.913191.085200.012200.122200.226200.319200.637200.743200.962201.126201.252201.378210.012210.335210.671211.178211.475211.613211.717211.803211.909212.010
180.012180.099180.183180.281180.375180.465180.560180.649180.734180.821190.002190.112190.209190.316190.416190.614190.715190.816190.905191.080200.021200.136200.239200.324200.638200.751200.964201.134201.262201.380210.020210.334210.667211.171211.474211.612211.718211.808211.898211.996
-0.0030.0000.0030.001
-0.003-0.007-0.004-0.0030.000
-0.0060.0060.0000.0090.0080.0120.0070.0040.0110.0080.005
-0.009-0.014-0.013-0.005-0.001-0.008-0.002-0.008-0.010-0.002-0.0080.0010.0040.0070.0010.001
-0.001-0.0050.0110.014
67

THERMISTOR CALIBRATION: PROBE 500-02 - 21 October 1989
NOMINAL TEMPERATURE RANGE: 180 - 210 8 C
CALIBRATION RESISTANCE RANGE: 1144 - 2333 OHMS
THERMISTOR EQUATION: T - C1 + C2 xC3 + ln(tf)
Cl = 4506.2145 S. DEV. Cl = 31.6243
C2 = -305.4364 S. DEV. C3 = 2.6592
C3 = 4.0948 S. DEV. C3 = 0.0611
68

APPENDIX II 1
MLGRAP # 1 - Temperature dataJanury 31, 1988 ............................. 70February 1, 1988 ............................ 71February 4, 1988 ............................ 72February 14, 1988 ............................ 73July 23, 1989 .............................. 74
MLGRAP # 2 - Temperature dataDecember 10, 1987 ........................... 79December 12, 1987 ........................... 80December 16, 1987 ........................... 81January 9, 1988 ............................. 82January 29, 1988 ............................ 83July 24, 1989 .............................. 84
Temperatures on July 23 and July 24, 1989 were obtained by the authors. The remainder of the
temperatures for 1987 and 1988 were measured by D. Goodwin for the Town of Mammoth Lakes and were
obtained from the California Division of Oil and Gas Geothermal Reports 051-90120 and 051-90121. The
temperatures obtained by Goodwin were converted to degrees Celsius by the authors.
69

MLGRAP # 1 - Long Valley.Caldera, Mammoth Lakes, CA - January 31, 1988Temperatures measured by D. Goodwin for the Town of Mammoth Lakes.Data obtained from California Division of Oil and Gas Geothermal Report (A.P.I. No. 051-90120)
DEPTH(FT)
100200300400480500520540560580600620640660680700720740760780800820840860880900920940960980100010201040106010801100112011401160118012001220124012601280130013201340136013801400142014401460
TEMPERATURE(*C)
0.551.551.886.6118.4918.8819.6120.7724.2722.7224.2226.4926.3825.5025.7725.2224.2222.6121.6120.7220.2220.2721.2722.4923.7725.2727.1128.3829.7731.3833.6135.2736.9938.2240.2742.2243.8845.7247.8849.8851.6153.4953.9957.7760.3862.6165.2266.9968.3869.3869.7266.9969.3869.38
70

MLGRAP # 1 - Long Valley Caldera, Mammoth Lakes, CA - February 1, 1988Temperatures measured by D. Goodwin for the Town of Mammoth Lakes.Data obtained from California Division of Oil and Gas Geothermal Report (A.P.I. No. 051-90120)
DEPTH(FT)
2040608010012014016018020022024026028030032034036038040042044046048050052054056058060062064066068070072074076078080082084086088090092094096098010001020104010601080110011201140116011801200
TEMPERATURE DEPTH '(°C) (FT)
4.88 12204.38 12404.38 12604.77 12804.27 13003.88 13203.61 13403.49 13604.38 13804.77 14005.11 14205.11 14405.61 14605.616.227.389.2711.6113.8816.7718.2221.8824.4928.2729.1128.6126.9929.4928.7729.7732.2232.7228.6128.8828.0025.3822.3820.5019.7219.2220.7722.3823.4925.2226.8828.3829.6131.2732.7734.7235.9938.0039.2740.9943.3845.9447.2249.2750.9952.22
FEMPERATI(°C)
54.3855.6158.9961.9964.4966.7768.8870.2771.2771.9969.3871.1170.61
71
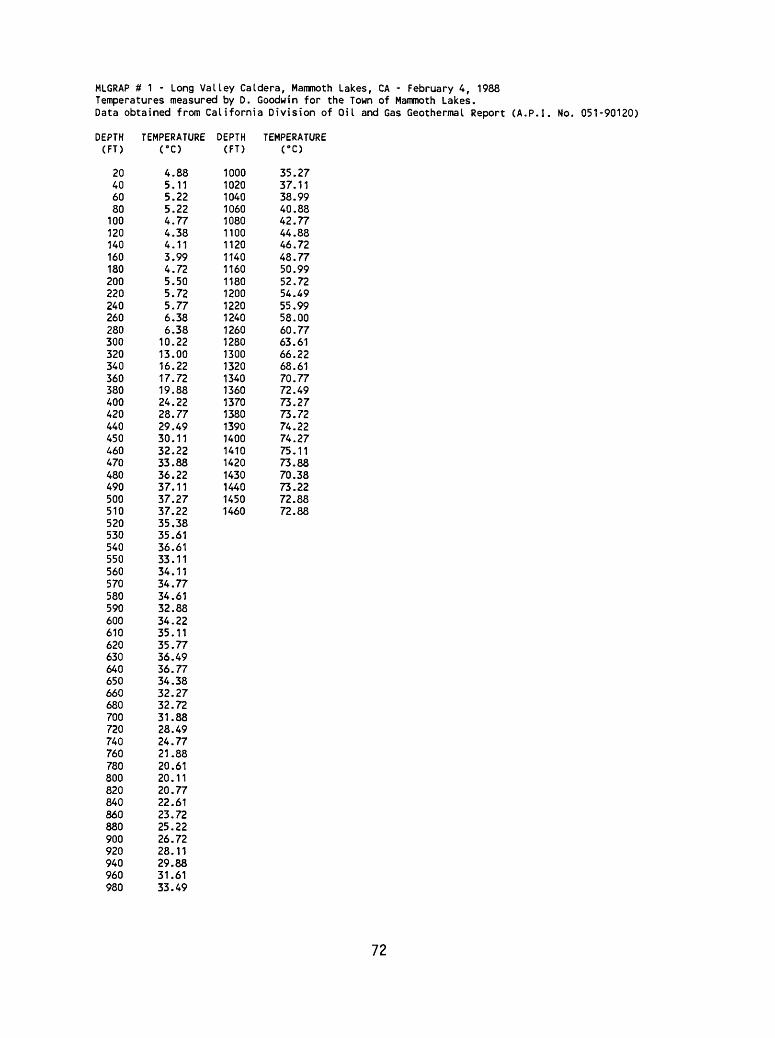
MLGRAP # 1 - Long Valley Caldera, Mammoth Lakes, CA - February 4, 1988Temperatures measured by D. Goodwin for the Town of Mammoth Lakes.Data obtained from California Division of Oil and Gas Geothermal Report (A.P.I. No. 051-90120)
DEPTH(FT)
20406080100120140160180200220240260280300320340360380400420440450460470480490500510520530540550560570580590600610620630640650660680700720740760780800820840860880900920940960980
TEMPERATURE(°C)
4.885.115.225.224.774.384.113.994.725.505.725.776.386.3810.2213.0016.2217.7219.8824.2228.7729.4930.1132.2233.8836.2237.1137.2737.2235.3835.6136.6133.1134.1134.7734.6132.8834.2235.1135.7736.4936.7734.3832.2732.7231.8828.4924.7721.8820.6120.1120.7722.6123.7225.2226.7228.1129.8831.6133.49
DEPTH(FT)
10001020104010601080110011201140116011801200122012401260128013001320134013601370138013901400141014201430144014501460
TEMPERATl(°C)
35.2737.1138.9940.8842.7744.8846.7248.7750.9952.7254.4955.9958.0060.7763.6166.2268.6170.7772.4973.2773.7274.2274.2775.1173.8870.3873.2272.8872.88
72

MLGRAP # 1 - Long Valley Caldera, Mammoth Lakes, CA - February 14, 1988Temperatures measured by D. Goodwin for the Town of Mammoth Lakes.Data obtained from California Division of Oil and Gas Geothermal Report (A.P.I. No. 051-90120)
DEPTH(FT)
2040608010012014016018020022024026028030032034036038040042044046048050052054056058060062064066068070072074076078080082084086088090092094096098010001020104010601080110011201140116011801200
TEMPERATURE DEPTH(°C) (FT)
5.50 12204.88 12405.11 12605.11 12804.61 13004.22 13203.88 13403.77 13604.77 13805.38 14005.61 14105.99 14206.61 14408.61 146014.2715.7218.0019.4924.2229.6136.1140.1141.7242.8843.7741.7241.3841.2239.1139.1140.2740.1136.2236.4934.2729.1124.8822.4921.6121.1122.4924.1125.1126.8828.3829.9931.4933.3835.3836.9938.3840.2742.1144.1146.2748.2250.6152.4954.8856.49
TEMPERATURECO
58.2760.2763.2265.7268.2270.7272.7775.5076.4977.1177.4975.7773.8874.38
73
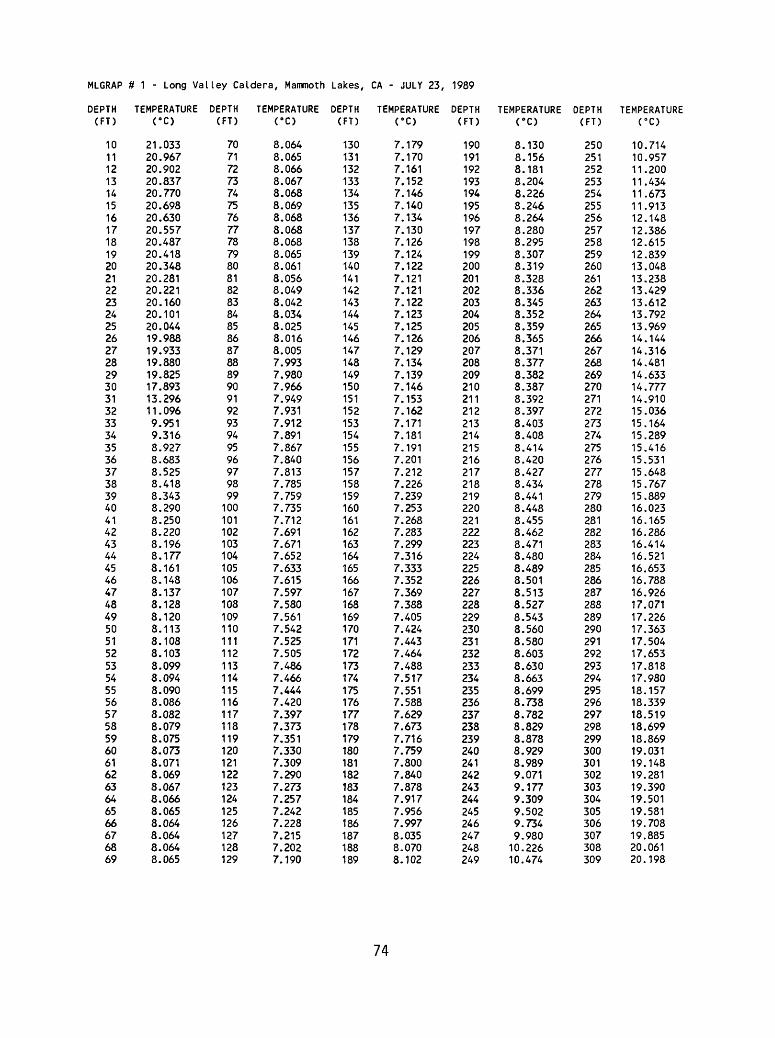
MLGRAP # 1 - Long Valley Caldera, Mammoth Lakes, CA - JULY 23, 1989
DEPTH TEMPERATURE DEPTH TEMPERATURE DEPTH TEMPERATURE DEPTH TEMPERATURE DEPTH TEMPERATURE(FT) (°C) (FT) (°C) (FT) (°C) (FT) (°C) (FT) (°C)
10 21.033 70 8.064 130 7.179 190 8.130 250 10.71411 20.967 71 8.065 131 7.170 191 8.156 251 10.95712 20.902 72 8.066 132 7.161 192 8.181 252 11.20013 20.837 73 8.067 133 7.152 193 8.204 253 11.43414 20.770 74 8.068 134 7.146 194 8.226 254 11.67315 20.698 75 8.069 135 7.140 195 8.246 255 11.91316 20.630 76 8.068 136 7.134 196 8.264 256 12.14817 20.557 77 8.068 137 7.130 197 8.280 257 12.38618 20.487 78 8.068 138 7.126 198 8.295 258 12.61519 20.418 79 8.065 139 7.124 199 8.307 259 12.83920 20.348 80 8.061 140 7.122 200 8.319 260 13.04821 20.281 81 8.056 141 7.121 201 8.328 261 13.23822 20.221 82 8.049 142 7.121 202 8.336 262 13.42923 20.160 83 8.042 143 7.122 203 8.345 263 13.61224 20.101 84 8.034 144 7.123 204 8.352 264 13.79225 20.044 85 8.025 145 7.125 205 8.359 265 13.96926 19.988 86 8.016 146 7.126 206 8.365 266 14.14427 19.933 87 8.005 147 7.129 207 8.371 267 14.31628 19.880 88 7.993 148 7.134 208 8.377 268 14.48129 19.825 89 7.980 149 7.139 209 8.382 269 14.63330 17.893 90 7.966 150 7.146 210 8.387 270 14.77731 13.296 91 7.949 151 7.153 211 8.392 271 14.91032 11.096 92 7.931 152 7.162 212 8.397 272 15.03633 9.951 93 7.912 153 7.171 213 8.403 273 15.16434 9.316 94 7.891 154 7.181 214 8.408 274 15.28935 8.927 95 7.867 155 7.191 215 8.414 275 15.41636 8.683 96 7.840 156 7.201 216 8.420 276 15.53137 8.525 97 7.813 157 7.212 217 8.427 277 15.64838 8.418 98 7.785 158 7.226 218 8.434 278 15.76739 8.343 99 7.759 159 7.239 219 8.441 279 15.88940 8.290 100 7.735 160 7.253 220 8.448 280 16.02341 8.250 101 7.712 161 7.268 221 8.455 281 16.16542 8.220 102 7.691 162 7.283 222 8.462 282 16.28643 8.196 103 7.671 163 7.299 223 8.471 283 16.41444 8.177 104 7.652 164 7.316 224 8.480 284 16.52145 8.161 105 7.633 165 7.333 225 8.489 285 16.65346 8.148 106 7.615 166 7.352 226 8.501 286 16.78847 8.137 107 7.597 167 7.369 227 8.513 287 16.92648 8.128 108 7.580 168 7.388 228 8.527 288 17.07149 8.120 109 7.561 169 7.405 229 8.543 289 17.22650 8.113 110 7.542 170 7.424 230 8.560 290 17.36351 8.108 111 7.525 171 7.443 231 8.580 291 17.50452 8.103 112 7.505 172 7.464 232 8.603 292 17.65353 8.099 113 7.486 173 7.488 233 8.630 293 17.81854 8.094 114 7.466 174 7.517 234 8.663 294 17.98055 8.090 115 7.444 175 7.551 235 8.699 295 18.15756 8.086 116 7.420 176 7.588 236 8.738 296 18.33957 8.082 117 7.397 177 7.629 237 8.782 297 18.51958 8.079 118 7.373 178 7.673 238 8.829 298 18.69959 8.075 119 7.351 179 7.716 239 8.878 299 18.86960 8.073 120 7.330 180 7.759 240 8.929 300 19.03161 8.071 121 7.309 181 7.800 241 8.989 301 19.14862 8.069 122 7.290 182 7.840 242 9.071 302 19.28163 8.067 123 7.273 183 7.878 243 9.177 303 19.39064 8.066 124 7.257 184 7.917 244 9.309 304 19.50165 8.065 125 7.242 185 7.956 245 9.502 305 19.58166 8.064 126 7.228 186 7.997 246 9.734 306 19.70867 8.064 127 7.215 187 8.035 247 9.980 307 19.88568 8.064 128 7.202 188 8.070 248 10.226 308 20.06169 8.065 129 7.190 189 8.102 249 10.474 309 20.198
74
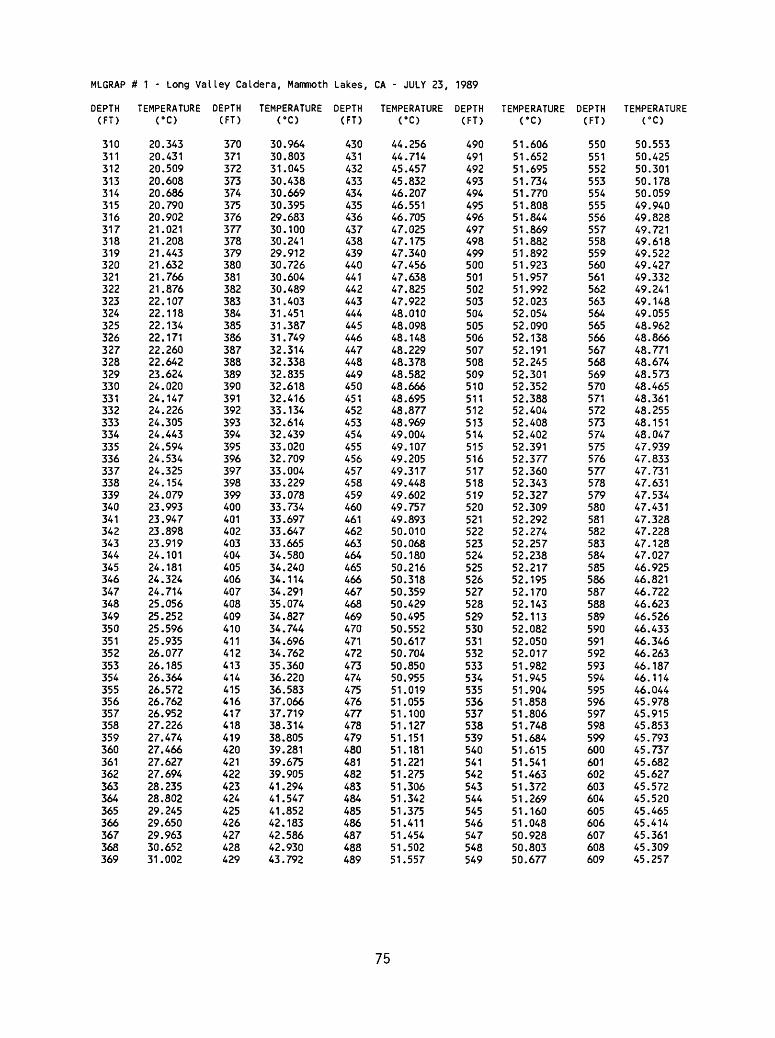
MLGRAP # 1 - Long Valley Caldera, Mammoth Lakes, CA - JULY 23, 1989
DEPTH(FT)
310311312313314315316317318319320321322323324325326327328329330331332333334335336337338339340341342343344345346347348349350351352353354355356357358359360361362363364365366367368369
TEMPERATURECO
20.34320.43120.50920.60820.68620.79020.90221.02121.20821.44321.63221.76621.87622.10722.11822.13422.17122.26022.64223.62424.02024.14724.22624.30524.44324.59424.53424.32524.15424.07923.99323.94723.89823.91924.10124.18124.32424.71425.05625.25225.59625.93526.07726.18526.36426.57226.76226.95227.22627.47427.46627.62727.69428.23528.80229.24529.65029.96330.65231.002
DEPTH(FT)
370371372373374375376377378379380381382383384385386387388389390391392393394395396397398399400401402403404405406407408409410411412413414415416417418419420421422423424425426427428429
TEMPERATURECO
30.96430.80331.04530.43830.66930.39529.68330.10030.24129.91230.72630.60430.48931.40331.45131.38731.74932.31432.33832.83532.61832.41633.13432.61432.43933.02032.70933.00433.22933.07833.73433.69733.64733.66534.58034.24034.11434.29135.07434.82734.74434.69634.76235.36036.22036.58337.06637.71938.31438.80539.28139.67539.90541.29441.54741.85242.18342.58642.93043.792
DEPTH(FT)
430431432433434435436437438439440441442443444445446447448449450451452453454455456457458459460461462463464465466467468469470471472473474475476477478479480481482483484485486487488489
TEMPERATURECO
44.25644.71445.45745.83246.20746.55146.70547.02547.17547.34047.45647.63847.82547.92248.01048.09848.14848.22948.37848.58248.66648.69548.87748.96949.00449.10749.20549.31749.44849.60249.75749.89350.01050.06850.18050.21650.31850.35950.42950.49550.55250.61750.70450.85050.95551.01951.05551.10051.12751.15151.18151.22151.27551.30651.34251.37551.41151.45451.50251.557
DEPTH(FT)
490491492493494495496497498499500501502503504505506507508509510511512513514515516517518519520521522523524525526527528529530531532533534535536537538539540541542543544545546547548549
TEMPERATURECO
51.60651.65251.69551.73451.77051.80851.84451.86951.88251.89251.92351.95751.99252.02352.05452.09052.13852.19152.24552.30152.35252.38852.40452.40852.40252.39152.37752.36052.34352.32752.30952.29252.27452.25752.23852.21752.19552.17052.14352.11352.08252.05052.01751.98251.94551.90451.85851.80651.74851.68451.61551.54151.46351.37251.26951.16051.04850.92850.80350.677
DEPTH(FT)
550551552553554555556557558559560561562563564565566567568569570571572573574575576577578579580581582583584585586587588589590591592593594595596597598599600601602603604605606607608609
TEMPERATURECO
50.55350.42550.30150.17850.05949.94049.82849.72149.61849.52249.42749.33249.24149.14849.05548.96248.86648.77148.67448.57348.46548.36148.25548.15148.04747.93947.83347.73147.63147.53447.43147.32847.22847.12847.02746.92546.82146.72246.62346.52646.43346.34646.26346.18746.11446.04445.97845.91545.85345.79345.73745.68245.62745.57245.52045.46545.41445.36145.30945.257
75
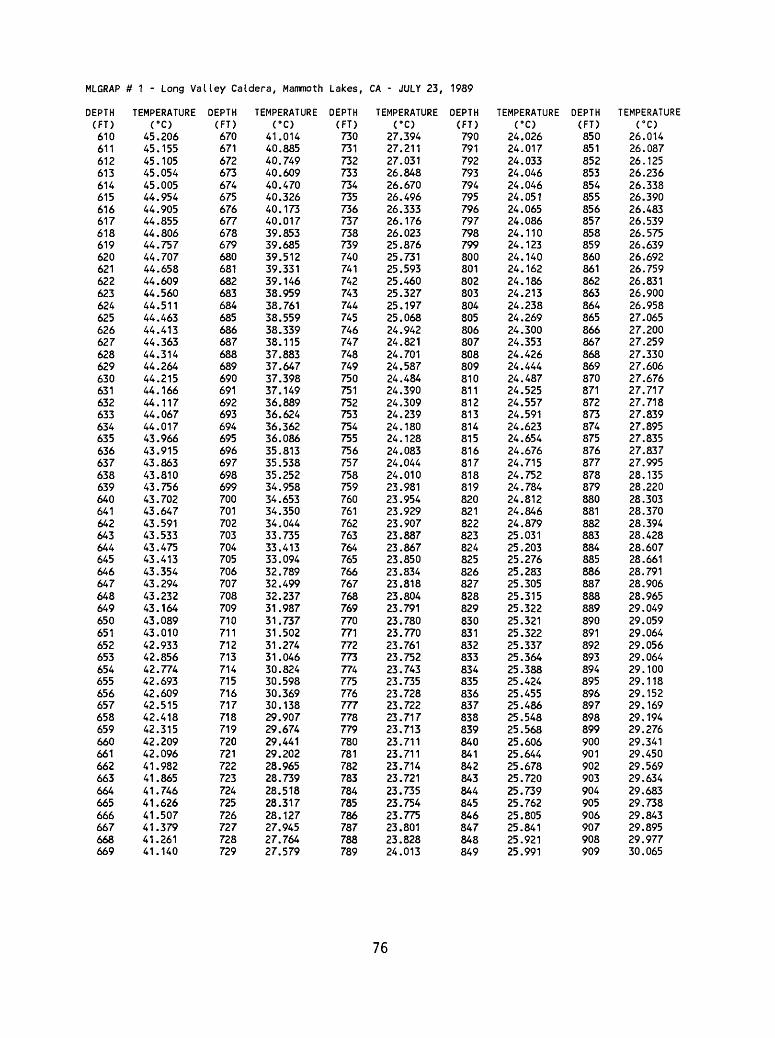
MLGRAP # 1 - Long Valley Caldera, Mammoth Lakes, CA - JULY 23, 1989
EPTH(FT)610611612613614615616617618619620621622623624625626627628629630631632633634635636637638639640641642643644645646647648649650651652653654655656657658659660661662663664665666667668669
TEMPERATURECC)
45.20645.15545.10545.05445.00544.95444.90544.85544.80644.75744.70744.65844.60944.56044.51144.46344.41344.36344.31444.26444.21544.16644.11744.06744.01743.96643.91543.86343.81043.75643.70243.64743.59143.53343.47543.41343.35443.29443.23243.16443.08943.01042.93342.85642.77442.69342.60942.51542.41842.31542.20942.09641.98241.86541.74641.62641.50741.37941.26141.140
DEPTH(FT)670671672673674675676677678679680681682683684685686687688689690691692693694695696697698699700701702703704705706707708709710711712713714715716717718719720721722723724725726727728729
TEMPERATURECO
41.01440.88540.74940.60940.47040.32640.17340.01739.85339.68539.51239.33139.14638.95938.76138.55938.33938.11537.88337.64737.39837.14936.88936.62436.36236.08635.81335.53835.25234.95834.65334.35034.04433.73533.41333.09432.78932.49932.23731.98731.73731.50231.27431.04630.82430.59830.36930.13829.90729.67429.44129.20228.96528.73928.51828.31728.12727.94527.76427.579
DEPTH(FT)730731732733734735736737738739740741742743744745746747748749750751752753754755756757758759760761762763764765766767768769770771772773774775776777778779780781782783784785786787788789
TEMPERATURECO
27.39427.21127.03126.84826.67026.49626.33326.17626.02325.87625.73125.59325.46025.32725.19725.06824.94224.82124.70124.58724.48424.39024.30924.23924.18024.12824.08324.04424.01023.98123.95423.92923.90723.88723.86723.85023.83423.81823.80423.79123.78023.77023.76123.75223.74323.73523.72823.72223.71723.71323.71123.71123.71423.72123.73523.75423.77523.80123.82824.013
DEPTH(FT)790791792793794795796797798799800801802803804805806807808809810811812813814815816817818819820821822823824825826827828829830831832833834835836837838839840841842843844845846847848849
TEMPERATURECO
24.02624.01724.03324.04624.04624.05124.06524.08624.11024.12324.14024.16224.18624.21324.23824.26924.30024.35324.42624.44424.48724.52524.55724.59124.62324.65424.67624.71524.75224.78424.81224.84624.87925.03125.20325.27625.28325.30525.31525.32225.32125.32225.33725.36425.38825.42425.45525.48625.54825.56825.60625.64425.67825.72025.73925.76225.80525.84125.92125.991
DEPTH(FT)850851852853854855856857858859860861862863864865866867868869870871872873874875876877878879880881882883884885886887888889890891892893894895896897898899900901902903904905906907908909
TEMPERATURECO
26.01426.08726.12526.23626.33826.39026.48326.53926.57526.63926.69226.75926.83126.90026.95827.06527.20027.25927.33027.60627.67627.71727.71827.83927.89527.83527.83727.99528.13528.22028.30328.37028.39428.42828.60728.66128.79128.90628.96529.04929.05929.06429.05629.06429.10029.11829.15229.16929.19429.27629.34129.45029.56929.63429.68329.73829.84329.89529.97730.065
76

MLGRAP # 1 - Long Valley Caldera, Mammoth Lakes, CA - JULY 23, 1989
DEPTH(FT)
910911912913914915916917918919920921922923924925926927928929930931932933934935936937938939940941942943944945946947948949950951952953954955956957958959960961962963964965966967968969
TEMPERATUREro
30.05930.21030.27030.41630.51730.61630.78530.85630.91330.97830.96831.02531.15931.24931.27431.27231.30031.33531.48431.60831.65231.74231.81231.87031.94432.15632.20132.24732.35632.48832.48932.52032.72232.79832.83932.94632.99633.08433.18733.34233.46033.51033.50033.58233.66233.68533.90033.99133.99834.08634.13834.17034.33334.46334.59234.80734.83934.92935.01835.146
DEPTH(FT)
970971972973974975976977978979980981982983984985986987988989990991992993994995996997998999100010011002100310041005100610071008100910101011101210131014101510161017101810191020102110221023102410251026102710281029
TEMPERATURE(°C)
35.20435.39535.52835.65635.75335.94136.11236.22436.28736.25336.27036.29536.32036.44836.44836.47636.58136.77236.85936.99937.08437.09337.13537.28437.33737.42637.51337.67337.80637.90837.95438.06238.13938.28938.32938.42038.53738.63138.74038.84938.86038.90238.97639.11639.21639.29139.29839.30739.36239.49939.62439.70939.87439.92740.07040.10640.15740.25340.42240.572
DEPTH(FT)
103010311032103310341035103610371038103910401041104210431044104510461047104810491050105110521053105410551056105710581059106010611062106310641065106610671068106910701071107210731074107510761077107810791080108110821083108410851086108710881089
TEMPERATURE(°C)
40.71240.78540.77340.87941.01741.11741.12741.23941.33841.52841.65741.64841.63441.70841.83341.86642.03142.13942.24342.34642.39242.48942.60542.68842.84742.89442.99943.10143.18443.26343.35243.40443.45143.61943.76743.85343.91444.00744.08544.15944.25544.42844.51744.59944.71844.90645.08045.15345.17845.25545.39845.47645.57145.60045.74145.85345.95846.04146.17446.251
DEPTH(FT)
109010911092109310941095109610971098109911001101110211031104110511061107110811091110111111121113111411151116111711181119112011211122112311241125112611271128112911301131113211331134113511361137113811391140114111421143114411451146114711481149
TEMPERATURE(°C)
46.36946.50346.62246.75246.81746.92447.06947.25247.32247.32647.41447.60247.67347.75247.81447.94648.06048.14648.22848.31548.39048.53948.62048.72448.86548.96449.05949.15749.26349.40249.50649.52449.63349.76749.86850.00950.09450.29450.31850.47350.56250.70850.82350.86150.91951.03951.15451.27151.38351.50451.56451.67851.76151.82551.97752.04152.09752.15852.24652.348
DEPTH(FT)
115011511152115311541155115611571158115911601161116211631164116511661167116811691170117111721173117411751176117711781179118011811182118311841185118611871188118911901191119211931194119511961197119811991200120112021203120412051206120712081209
TEMPERATUREro
52.44352.56552.66752.77352.83452.90853.01453.10353.17953.27653.40553.49153.58853.70053.77653.89954.02054.11054.21754.31854.41354.49254.60154.69254.77854.87254.97055.08255.15955.25555.35255.46955.55055.64855.77155.88255.99656.08756.17156.26956.39956.49556.57256.67656.78556.90057.00757.10657.20657.29157.37757.51057.62557.71657.80757.87857.94558.04358.15058.275
77

MLGRAP # 1 - Long Valley Caldera, Mammoth Lakes, CA - JULY 23, 1989
DEPTH(FT)
121012111212121312141215121612171218121912201221122212231224122512261227122812291230123112321233123412351236123712381239124012411242124312441245124612471248124912501251125212531254125512561257125812591260126112621263126412651266126712681269
TEMPERATURECO
58.38658.46158.53858.63858.74258.86358.98259.07759.19659.31459.44559.54359.62559.73359.86859.98660.08360.19560.29860.41860.52660.63560.73360.85860.96961.08961.21661.33361.43961.57661.69361.80761.91262.03462.17562.30562.46062.58362.66662.78862.90062.99863.14963.28463.40563.54263.65863.81163.95464.08664.19764.34164.49564.62264.74764.88165.02965.15365.27365.412
DEPTH(FT)
127012711272127312741275127612771278127912801281128212831284128512861287128812891290129112921293129412951296129712981299130013011302130313041305130613071308130913101311131213131314131513161317131813191320132113221323132413251326132713281329
TEMPERATURECO
65.53465.65865.77665.89766.00866.14166.22966.32766.45066.56866.68866.81166.94067.07567.19967.31767.43667.54267.66267.76867.90768.02268.13268.24068.33968.45368.54568.65368.73568.82068.89868.98069.06269.14069.21569.37269.67869.80269.88269.93669.97870.02270.09070.20670.34270.48370.63870.73970.81770.90570.98471.05671.12871.20471.29671.41671.54471.69271.86572.035
DEPTH(FT)
133013311332133313341335133613371338133913401341134213431344134513461347134813491350135113521353135413551356135713581359136013611362136313641365136613671368136913701371137213731374137513761377137813791380138113821383138413851386138713881389
TEMPERATURECO
72.18672.31872.44072.55072.66272.76772.86472.97173.08773.19573.32073.43673.54173.63273.71573.79973.88173.96274.04574.13374.21574.29874.37474.45474.52674.59474.66074.73074.80774.87574.93474.99875.07575.15475.22775.29375.35875.48475.59375.67975.74575.79875.85475.89875.93975.98376.03676.08276.12276.16776.21476.25676.30076.36276.41776.46576.50176.52876.55276.580
DEPTH(FT)
139013911392139313941395139613971398139914001401140214031404140514061407140814091410141114121413141414151416141714181419142014211422142314241425142614271428142914301431143214331434143514361437143814391440144114421443144414451446144714481449
TEMPERATlCC)
76.61376.64676.67676.70576.73776.77076.79776.82276.84276.86676.88776.91476.93976.96576.98577.00177.00977.01277.00576.99376.97776.95976.93676.90876.87776.84276.79876.74676.68176.62476.58276.54476.48476.42876.37976.32276.24276.16576.10176.03275.96475.90675.83875.74175.66775.61475.55675.50875.45775.37775.29675.23775.20275.16575.07374.96574.89574.83174.77174.719
1450 74.557
78

MLGRAP # 2 - Long Valley Caldera, Mammoth Lakes, CA - December 10, 1987Temperatures measured by D. Goodwin for the Town of Mammoth Lakes.Data obtained from California Division of Oil and Gas Geothermal Report (A.P.I. No. 051-90121)
DEPTH TEMPERATURE (FT) (°C)
1540 54.221560 55.271580 55.271600 55.27
DEPTH(FT)
340360380400420440460480500520540560580600620640660680700720740760780800820840860880900920940960980100010201040106010801100112011401160118012001220124012601280130013201340136013801400142014401460148015001520
TEMPERATl(°C)
8.889.3811.1112.4914.3816.3817.3817.8819.1120.2721.4922.6124.1125.5026.6127.6128.3829.2730.5031.3832.1133.0033.6134.2734.7736.1136.9937.6138.2239.1139.7239.9940.2740.7741.6142.2742.6142.8843.2243.7744.4944.4944.7744.1144.2744.8845.3845.7245.6145.7746.1146.4947.4948.1148.7249.4950.3851.1152.1152.49
79

MLGRAP # 2 - Long Valley Caldera, Mammoth Lakes, CA - December 12, 1987Temperatures measured by D. Goodwin for the Town of Mammoth Lakes.Data obtained from California Division of Oil and Gas Geothermal Report (A.P.I. No. 051-90121)
DEPTH TEMPERATURE(FT) CC)
1420 63.381440 64.991460 64.991480 65.221500 66.221520 67.111540 68.111560 69.111580 70.611600 71.49
DEPTH(FT)
220240260280300320340360380400420440460480500520540560580600620640660680700720740760780800820840860880900920940960980100010201040106010801100112011401160118012001220124012601280130013201340136013801400
TEMPERATl(°C)
6.166.617.278.118.498.778.999.1112.2715.2716.9917.4918.1118.7220.2722.7224.8826.6128.6131.1132.8834.4935.6136.3837.4939.1140.1140.9941.7242.3842.7743.6144.2244.7245.2745.7745.8846.2746.6147.6148.2749.2249.9950.7751.7752.2252.1153.1152.7753.1153.7254.4955.2256.4957.4958.4958.9959.9960.8861.99
80

MLGRAP # 2 - Long Valley Caldera, Mammoth Lakes, CA - December 16, 1987Temperatures measured by D. Goodwin for the Town of Mammoth Lakes.Data obtained from California Division of Oil and Gas Geothermal Report (A.P.I. No. 051-90121)
DEPTH TEMPERATURE (FT) (°C)
1580 72.721600 73.61
DEPTH(FT)
38040042044046048050052054056058060062064066068070072074076078080082084086088090092094096098010001020104010601080110011201140116011801200122012401260128013001320134013601380140014201440146014801500152015401560
TEMPERATlCC)
8.0016.2717.3817.8818.6119.2721.2724.1126.3828.6130.7733.3835.2736.6137.8838.6139.7741.2742.2743.0043.7244.2744.7745.5045.9946.4946.9947.3847.6148.1148.3849.2749.9950.7751.3852.1152.8853.4953.7254.6154.6155.2255.9956.7757.7258.7759.7260.7261.3862.4963.2764.2765.2766.6166.9967.7268.7269.6170.6171.72
81

MLGRAP # 2 - Long Valley Caldera, Mammoth Lakes, CA - January 9, 1988Temperatures measured by D. Goodwin for the Town of Mammoth Lakes.Data obtained from California Division of Oil and Gas Geothermal Report (A.P.I. No. 051-90121)
DEPTH(FT)
4204404604805005205405605806006206406606807007207407607808008208408608809009209409609801000102010401060108011001120114011601180120012201240126012801300132013401360138014001420144014601480150015201540156015801600
TEMPERATl(°C)
17.6118.2218.7219.6121.9925.2727.6130.3832.2234.8836.7738.1139.2740.5041.8843.0043.8844.6145.2245.8846.2746.9947.3847.7748.2248.2748.8849.2749.8850.7251.3851.9952.4953.1153.7754.4954.9955.6156.1156.7757.6158.3859.2760.2761.2262.1163.0063.8864.7265.6166.4967.3868.0068.7769.7770.7771.7272.7273.6174.22
82

MLGRAP # 2 - Long Valley Caldera, Mammoth Lakes, CA - January 29, 1988Temperatures measured by D. Goodwin for the Town of Mammoth Lakes.Data obtained from California Division of Oil and Gas Geothermal Report (A.P. I. No. 051-90121)
DEPTH TEMPERATURE(FT) <°C)
420 17.38460 18.72500 21.72550 29.11600 34.99650 38.88700 41.99750 44.38800 45.99850 47.38900 48.38950 49.271000 50.771050 52.491100 53.881150 55.501200 56.991250 59.111300 61.381350 63.611400 65.721450 67.771500 69.991550 72.381600 74.22
83

MLGRAP # 2 - Long Valley Caldera, Mammoth Lakes, CA - JULY 24, 1989
DEPTH TEMPERATURE DEPTH TEMPERATURE DEPTH TEMPERATURE DEPTH TEMPERATURE DEPTH TEMPERATURE(FT) <°C) (FT) (°C) (FT) ( e C) (FT) (°C) (FT) (°C)
101114151617181920212223242526273233343536373839404142434445464748495051525354555657585960616263646566676869707172737475
19.04519.01218.93318.88318.84918.81918.79018.75618.71118.67918.64918.61418.57418.52218.46618.43018.31118.18818.12218.08318.05318.02517.99717.97117.94517.92017.89517.87017.84517.82017.79517.77117.74717.72217.69717.67317.64917.62517.60117.57617.55217.52717.50217.47817.45217.42517.39817.37117.34417.31717.29017.26317.23517.20717.17717.14617.11217.07717.04317.011
767778798081828384858687888990919293949596979899100101102103104105106107108109110111112113114115116117118119120121122123124125126127128129130131132133134135
16.97716.94316.90916.87616.84216.80816.77416.74016.70616.67216.63916.60616.57216.53816.50316.46716.43316.39816.36416.33116.29816.26516.23116.19716.16316.12916.09416.05916.02615.99215.95715.92215.88715.85315.81915.78515.74915.71415.68015.64415.61115.57515.53915.50615.47115.43715.40215.36715.33215.29915.26415.22915.19515.16115.12715.09315.05915.02514.99214.958
136137138139140141142143144145146147148149150151152153154155156157158159160161162163164165166167168169170171172173174175176177178179180181182183184185186187188189190191192193194195
14.92514.89314.86114.82814.79614.76414.73414.70214.67214.64314.61314.58314.55514.52714.50014.47314.44814.42314.39814.37314.34914.32514.30114.27814.25414.23014.20614.18214.15814.13514.11314.09314.07214.05314.03414.01513.99713.97913.96113.94313.92613.91013.89313.87713.86113.84513.83013.81613.80113.78713.77313.76013.74713.73413.72113.70813.69613.68413.67213.660
196197198199200201202203204205206207208209210211212213214215216217218219220221222223224225226227228229230231232233234235236237238239240241242243244245246247248249250251252253254255
13.64913.63813.62713.61613.60513.59513.58413.57413.56313.55313.54313.53313.52313.51413.50513.49513.48613.47713.46813.45913.45013.44013.43113.42213.41313.40313.39413.38513.37613.36713.35813.35013.34013.33113.32213.31313.30313.29413.28413.27513.26613.25713.24813.23913.23113.22213.21313.20513.19613.18713.17813.17013.16113.15313.14413.13713.12913.12213.11613.109
256257258259260261262263264265266267268269270271272273274275276277278279280281282283284285286287288289290291292293V294295296297298299300301302303304305306307308309310311312313314315
13.10313.09713.09113.08513.07913.07413.06813.06313.05813.05313.04913.04313.03913.03413.02913.02513.02113.01613.01213.00813.00413.00112.99812.99412.99112.98712.98412.98112.97812.97512.97212.96912.96612.96312.96012.95712.95412.95112.94812.94512.94212.94012.93712.93512.92312.93212.93112.93012.93012.93112.93112.93112.93112.93212.93212.93212.93212.93212.93212.932
84

MLGRAP # 2 - Long Valley Caldera, Mammoth Lakes, CA - JULY 24, 1989
DEPTH(FT)
316317318319320321322323324325326327328329330331332333334335336337338339340341342343344345346347348349350351352353354355356357358359360361362363364365366367368369370371372373374375
TEMPERATURECO
12.93212.93212.93212.93312.93212.93212.93212.93212.93212.93212.93212.93112.93112.93112.93112.93112.93012.93012.92912.92912.92912.92812.92812.92812.92712.92712.92612.92612.92612.92512.92512.92412.92412.92312.92312.92212.92212.92112.92012.91912.91912.91812.91712.91612.91512.91412.91312.91212.91112.90912.90812.90712.90612.90612.90612.90612.90612.90612.90612.907
DEPTH(FT)
376377378379380381382383384385386387388389390391392393394395396397398399400401402403404405406407408409410411412413414415416417418419420421422423424425426427428429430431432433434435
TEMPERATURECO
12.90812.90912.91112.91212.91412.91612.91812.92112.92312.92612.92912.93312.93812.94212.94812.95412.96112.96812.97512.98212.99012.99813.00613.01313.02213.03013.04013.05113.06213.07513.08913.10413.12113.13813.15613.17413.19313.21313.23313.25313.27513.30013.32613.35613.38813.42213.45813.49713.53613.57713.62313.67113.72013.76913.82113.87615.47217.65318.45818.811
DEPTH(FT)
436437438439440441442443444445446447448449450451452453454455456457458459460461462463464465466467468469470471472473474475476477478479480481482483484485486487488489490491492493494495
TEMPERATURE(°C)
18.99019.13719.23119.31019.38419.46519.54219.61519.68019.72719.76919.79919.85819.90719.96020.00620.03620.10220.15520.20620.25220.29320.34720.40520.44920.49920.55020.61920.67120.72820.76320.80220.84820.89120.92220.97121.01721.05221.10921.15121.22021.26921.32221.35821.42021.47621.53921.58921.66421.72621.80021.90721.97722.07022.16722.26822.37622.49422.63722.793
DEPTH(FT)
496497498499500501502503504505506507508509510511512513514515516517518519520521522523524525526527528529530531532533534535536537538539540541542543544545546547548549550551552553554555
TEMPERATURECC)
22.91923.06123.19623.35323.52423.66923.86524.06524.25024.41724.54924.76124.88325.03225.17125.31225.47325.62625.79625.97126.14726.28126.45426.56926.74026.89127.02327.16527.31927.46827.64427.82527.96028.07828.19628.33428.48528.61628.74928.86728.97829.12229.20229.31329.44729.57229.67829.81729.92230.07330.22430.37130.51030.70630.88731.02931.16531.31331.46731.574
DEPTH(FT)
556557558559560561562563564565566567568569570571572573574575576577578579580581582583584585586587588589590591592593594595596597598599600601602603604605606607608609610611612613614615
TEMPERATURECC)
31.76331.93632.06832.19832.29932.38632.46932.53832.61332.71232.79332.90832.99433.08833.16533.24133.32233.40933.51433.64633.73733.83233.93534.04434.14234.26134.36434.46134.56734.66634.76934.85834.94935.04735.18135.34035.52135.73235.90336.09536.23536.35436.48336.60936.71336.83836.91137.02337.13937.23937.33137.40937.49837.58737.65737.75337.84337.91038.00038.090
85

MLGRAP # 2 - Long Valley Caldera, Mammoth Lakes, CA - JULY 24, 1989
DEPTH(FT)
616617618619620621622623624625626627628629630631632633634635636637638639640641642643644645646647648649650651652653654655656657658659660661662663664665666667668669670671672673674675
TEMPERATURErc>
38.16138.25238.32338.40438.48638.57938.67238.75338.82538.88838.93638.98639.03139.08439.14039.18239.24439.31839.38939.47339.54039.61639.70539.77039.83539.90239.95840.02940.10640.16140.22640.29040.35740.42940.48840.55340.60840.67240.73040.78240.84440.91040.97241.02441.08641.13841.19941.25341.31941.37941.43441.49541.56441.61041.65841.71441.77041.82841.89741.954
DEPTH(FT)
676677678679680681682683684685686687688689690691692693694695696697698699700701702703704705706707708709710711712713714715716717718719720721722723724725726727728729730731732733734735
TEMPERATURE< eo
42.01442.08542.15242.20542.27042.34342.41542.47542.55342.62242.69042.75742.83842.89442.96843.02543.11443.17743.23643.30543.37143.42843.50343.56643.62643.70043.76543.82743.89043.94944.00244.06444.12244.18044.23144.28044.33044.37144.41744.46944.51444.55744.60044.64444.67744.72144.76244.78944.83444.87544.91544.95444.99645.03945.08445.11645.14945.18545.22345.258
DEPTH(FT)
736737738739740741742743744745746747748749750751752753754755756757758759760761762763764765766767768769770771772773774775776777778779780781782783784785786787788789790791792793794795
TEMPERATURE(°C)
45.29445.33145.37045.41045.44245.48645.52045.56045.59945.63245.66645.69545.73245.76745.80345.84045.87545.90545.93945.97146.00446.03346.06746.10046.13746.16946.20646.23446.27346.30446.32146.35146.39146.42446.45746.48746.51746.55246.58246.61346.64446.66546.69146.72246.75346.78446.81546.85346.87946.90746.92846.95846.99147.01447.04247.06847.10547.13147.15947.187
DEPTH(FT)
796797798799800801802803804805806807808809810811812813814815816817818819820821822823824825826827828829830831832833834835836837838839840841842843844845846847848849850851852853854855
TEMPERATURECC)
47.21247.23647.26647.28747.31247.34647.37047.39947.43347.45747.48247.51047.53247.56047.59447.62347.65247.67847.70947.74147.77747.81247.84447.87647.90247.93447.96447.99548.03248.05548.08648.11148.14348.15948.18548.21648.23748.26248.28448.31348.33448.35848.38348.40748.43248.45648.47348.49948.51848.54548.56048.58648.61248.63148.65348.67948.69348.71448.73848.757
DEPTH(FT)
856857858859860861862863864865866867868869870871872873874875876877878879880881882883884885886887888889890891892893894895896897898899900901902903904905906907908909910911912913914915
TEMPERATURECC)
48.77648.79848.82048.83648.86048.87748.89648.91548.94248.96248.97948.99249.00549.02849.05049.07149.09149.10349.12049.13749.15849.18249.19849.21249.23349.25449.27149.28749.30149.32149.33949.35349.37149.39149.40949.42349.44249.46049.47949.49349.50949.52749.54649.55849.57149.58949.60749.62149.63349.65149.66449.67549.69449.70649.72149.73649.74549.75949.77849.798
86

MLGRAP # 2 - Long Valley Caldera, Mammoth Lakes, CA - JULY 24, 1989
DEPTH TEMPERATURE DEPTH TEMPERATURE DEPTH TEMPERATURE DEPTH TEMPERATURE DEPTH TEMPERATURE(FT) <°C) (FT) (°C) (FT) <°C) (FT) <°C) (FT) (°C)
916917918919920921922923924925926927928929930931932933934935936937938939940941942943944945946947948949950951952953954955956957958959960961962963964965966967968969970971972973974975
49.80849.82049.83349.84549.86049.87149.88449.90449.91449.93149.94649.96249.97749.99750.01550.03050.04150.06150.08550.10650.11950.14050.16050.17950.19950.22150.24450.26250.28250.30150.32450.34550.36650.38850.41250.42550.44750.47150.49150.51350.53150.55750.57750.60250.62550.64450.66850.69050.71650.74350.77150.79750.81850.84850.87850.90850.93950.97051.00051.037
976977978979980981982983984985986987988989990991992993994995996997998999100010011002100310041005100610071008100910101011101210131014101510161017101810191020102110221023102410251026102710281029103010311032103310341035
51.06851.09651.13251.16951.19751.23551.26951.29451.32851.37051.40351.43951.47751.51151.55151.58851.61951.65051.67751.71551.75451.78951.82351.85751.88651.92451.95851.99152.03252.06652.09452.13352.16552.19552.23152.26652.29652.33552.36652.39852.42452.45952.49552.52152.55452.58652.61652.64552.67752.70952.74352.76952.79652.82352.85852.88552.91452.93452.95852.997
103610371038103910401041104210431044104510461047104810491050105110521053105410551056105710581059106010611062106310641065106610671068106910701071107210731074107510761077107810791080108110821083108410851086108710881089109010911092109310941095
53.03253.05853.08853.12553.15453.18453.21353.23253.25553.27853.30553.33353.35353.37253.40153.42453.44353.46553.49553.52053.54453.56653.59153.61653.64253.66953.70053.72653.75353.78153.80253.83453.85753.88253.91953.94253.97553.99654.02154.04654.08054.10154.13354.16154.18954.22454.24654.27554.31154.33554.36954.39854.41754.45054.47854.51254.53954.56754.58954.623
109610971098109911001101110211031104110511061107110811091110111111121113111411151116111711181119112011211122112311241125112611271128112911301131113211331134113511361137113811391140114111421143114411451146114711481149115011511152115311541155
54.65754.68654.71454.74254.77054.80354.83254.86054.89654.92554.95954.98955.01855.04855.08055.11055.14755.17655.21155.23955.27755.30155.33055.37155.40555.43955.46655.49855.53555.56655.59955.62855.66055.69255.72255.75255.78355.80455.82755.85855.88655.91655.94355.97155.99456.01956.04656.08056.10656.12856.15956.18656.20656.23056.25656.28156.30356.32956.35256.375
115611571158115911601161116211631164116511661167116811691170117111721173117411751176117711781179118011811182118311841185118611871188118911901191119211931194119511961197119811991200120112021203120412051206120712081209121012111212121312141215
56.39756.42556.44656.47056.49656.52056.54856.57156.59656.62256.64856.67356.69756.72756.76056.78356.80756.83456.87056.89856.92656.95856.98757.02157.05357.07757.11057.14257.17357.20557.24157.27657.30357.34557.37757.41457.44957.48557.51657.55357.59457.63957.67257.71657.74957.78957.82857.86557.90157.94757.98258.01558.06858.10658.14358.18458.22458.26158.29858.333
87

MLGRAP # 2 - Long Valley Caldera, Mammoth Lakes, CA - JULY 1989
DEPTH(FT)
121612171218121912201221122212231224122512261227122812291230123112321233123412351236123712381239124012411242124312441245124612471248124912501251125212531254125512561257125812591260126112621263126412651266126712681269127012711272127312741275
TEMPERATURE<°C)
58.37758.42158.45758.50658.54758.58658.62858.66758.70858.75158.78458.82058.86058.90858.95158.98359.02159.06359.10659.14259.18259.21759.26559.30859.34759.38959.43359.47659.51959.55959.60659.64359.69259.73959.78259.82659.86359.91059.95259.99360.03560.07760.12960.16860.21560.25960.29560.34260.38960.42960.47860.52160.56760.60960.65760.70560.74760.78960.83360.871
DEPTH(FT)
127612771278127912801281128212831284128512861287128812891290129112921293129412951296129712981299130013011302130313041305130613071308130913101311131213131314131513161317131813191320132113221323132413251326132713281329133013311332133313341335
TEMPERATURE(°C)
60.91460.95961.00261.04761.08961.12961.17061.21061.24761.29361.33961.37661.42061.46361.50761.54361.58861.63361.67361.71361.75161.79461.84261.88061.92061 .95962.00162.04862.09262.13262.17562.22062.26762.30862.35262.39262.44062.48262.52162.56962.61262.65162.68862.73662.78362.81762.86162.90262.95162.98963.03463.07063.11363.15863.19963.24063.27763.31463.36063.412
DEPTH(FT)
133613371338133913401341134213431344134513461347134813491350135113521353135413551356135713581359136013611362136313641365136613671368136913701371137213731374137513761377137813791380138113821383138413851386138713881389139013911392139313941395
TEMPERATURE(°C)
63.45363.49563.53063.57263.61963.66363.70263.73563.78163.82363.87163.91463.95363.99064.02964.06264.11164.15864.19864.23864.28164.31864.36664.40364.44364.48164.52664.56564.60164.64164.67764.71564.75964.80364.84864.89264.92764.96864.99965.03865.07965.11665.15765.20165.23965.28065.32465.36765.40365.44065.48165.51865.56565.60965.64265.68565.72765.75865.79465.837
DEPTH(FT)
139613971398139914001401140214031404140514061407140814091410141114121413141414151416141714181419142014211422142314241425142614271428142914301431143214331434143514361437143814391440144114421443144414451446144714481449145014511452145314541455
TEMPERATURE(°C)
65.87665.91165.95465.99166.03066.07466.11466.15766.20066.23266.28166.32266.36466.40766.44966.49966.55066.58766.63466.68066.71666.75666.79966.84966.89066.93266.97467.00867.04967.08267.12567.16067.19667.22367.26467.29367.32267.35267.38667.41667.45467.48767.52367.56267.59667.62967.65767.68767.71667.74767.77867.80467.83867.86567.89667.93267.96267.99068.02868.066
DEPTH(FT)
145614571458145914601461146214631464146514661467146814691470147114721473147414751476147714781479148014811482148314841485148614871488148914901491149214931494149514961497149814991500150115021503150415051506150715081509151015111512151315141515
TEMPERATURETO
68.10268.14368.18468.21868.25368.29668.33268.37568.41368.45268.50468.54068.58168.62768.66968.71668.75768.79968.84068.88968.93468.97869.02469.06269.10969.15969.20269.24669.28869.33269.37769.42769.47469.51069.56169.60569.64669.69769.73669.78969.83269.87869.92269.96970.01670.06470.11170.15170.19470.24770.29170.33970.38770.43670.47770.51870.56470.60470.65270.700
88
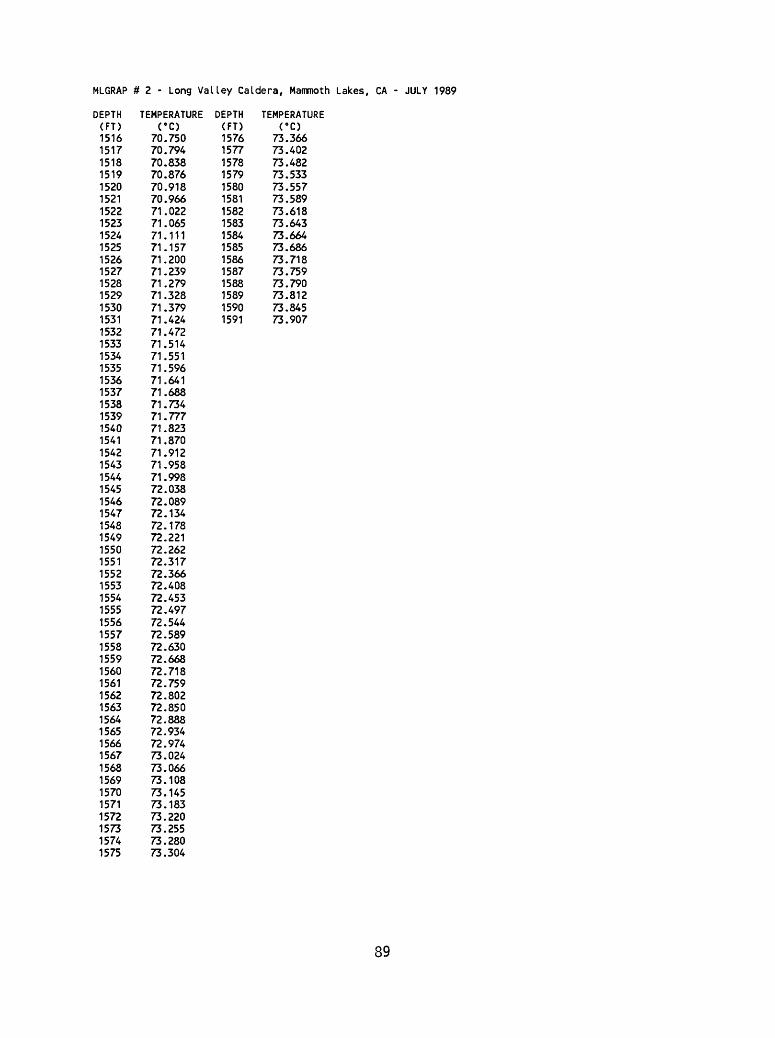
MLGRAP # 2 - Long Valley Caldera, Mammoth Lakes, CA - JULY 1989
DEPTH(FT)151615171518151915201521152215231524152515261527152815291530153115321533153415351536153715381539154015411542154315441545154615471548154915501551155215531554155515561557155815591560156115621563156415651566156715681569157015711572157315741575
TEMPERATURECC)
70.75070.79470.83870.87670.91870.96671.02271.06571.11171.15771.20071.23971.27971.32871.37971.42471.47271.51471.55171.59671.64171.68871.73471.77771 .82371.87071.91271.95871.99872.03872.08972.13472.17872.22172.26272.31772.36672.40872.45372.49772.54472.58972.63072.66872.71872.75972.80272.85072.88872.93472.97473.02473.06673.10873.14573.18373.22073.25573.28073.304
DEPTH(FT)1576157715781579158015811582158315841585158615871588158915901591
TEMPERATURECO
73.36673.40273.48273.53373.55773.58973.61873.64373.66473.68673.71873.75973.79073.81273.84573.907
89

APPENDIX III 1
MLGRAP # 1 - Temperature plotsJanury 31, 1988 ............................. 91February 1, 1988 ............................ 92February 4, 1988 ............................ 93February 14, 1988 ............................ 94July 23, 1989 .............................. 95
MLGRAP # 2 - Temperature plotsDecember 10, 1987 ........................... 96December 12, 1987 ........................... 97December 16, 1987 ........................... 98January 9, 1988 ............................. 99January 29, 1988 ........................... 100July 24, 1989 ............................. 101
Temperatures on July 23 and July 24, 1989 were obtained by the authors. The remainder of the
temperatures for 1987 and 1988 were measured by D. Goodwin for the Town of Mammoth Lakes and were
obtained from the California Division of Oil and Gas Geothermal Reports 051-90120 and 051-90121. The
temperatures obtained by Goodwin were converted to degrees Celsius by the authors.
90
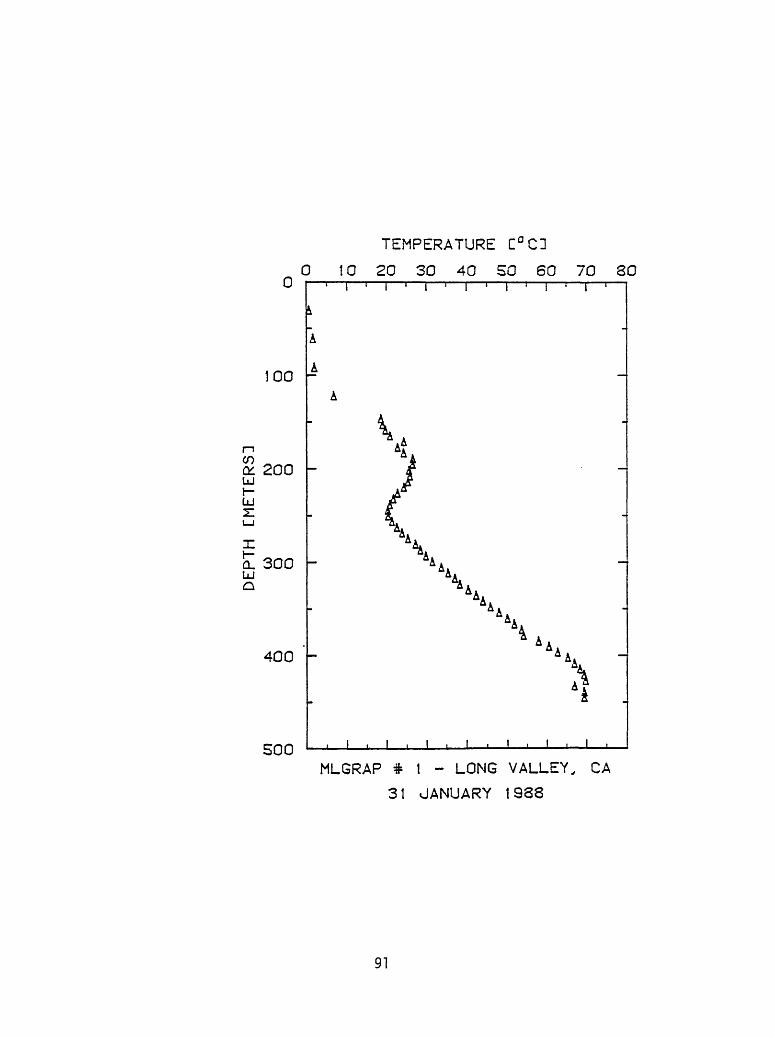
0
TEMPERATURE C°C1
10 20 30 40 50 60 70 30u
100
£200UJh-LUz:
n CL 300LU
400 '
cnn
I ' I i ' i ' i ' i ' i
A
A
A
AA»
£iAfr
*
\ \ AA
AA»*\.
^44&
4 4 .
1,1,1,1,1.!.!.
MLGRAP * 1 - LONG VALLEY, CA
31 JANUARY 1938
91

TEMPERATURE C°C1
0 10 20 30 40 50 60 70 80
100
LJI LU
200
0. 300LU
400
500MLGRAP * 1 - LONG VALLEY, CA
1 FEBRUARY 1988
92
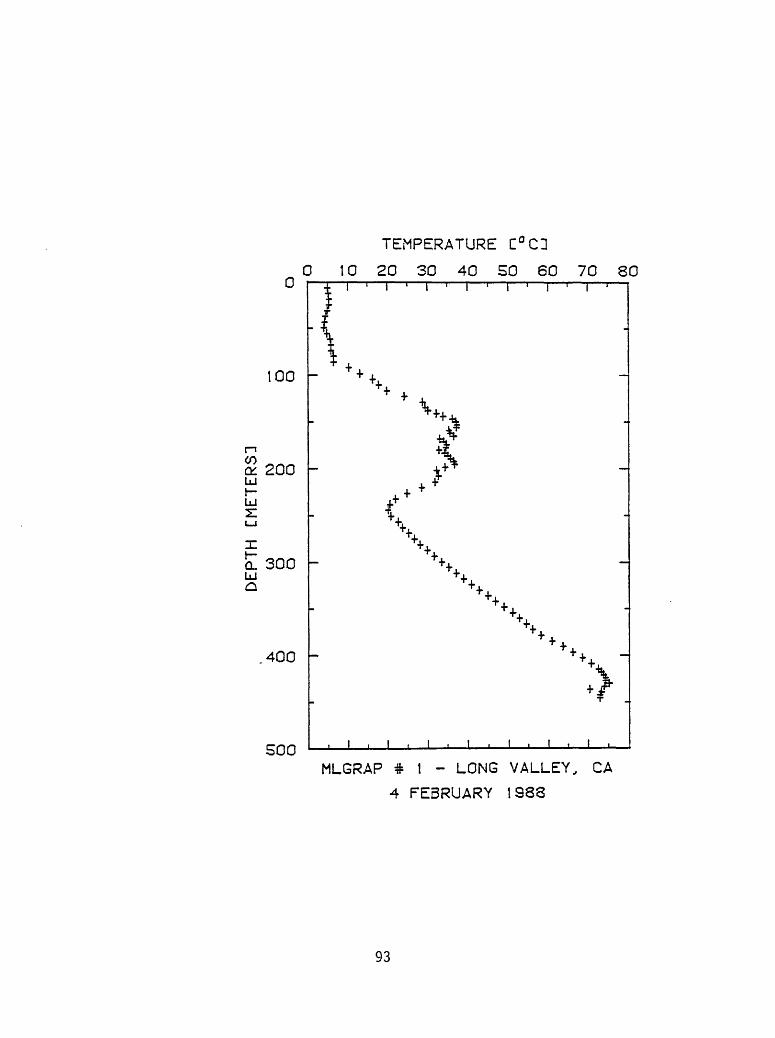
TEMPERATURE C°C1
0 tO 20 30 40 50 60 70 80
too -
S 200 bji bj
xo~ 300
.400
500
' <\ **
MLGRAP * t - LONG VALLEY, CA
4 FEBRUARY t983
93
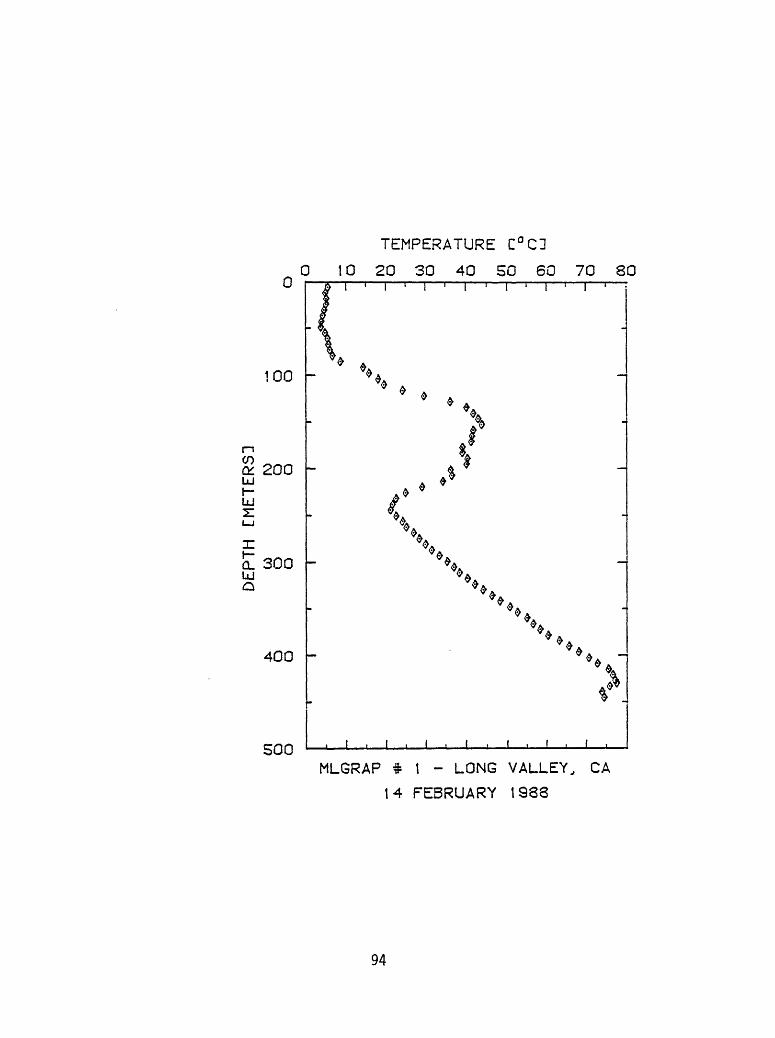
TEMPERATURE C°C1
0 10 20 30 40 50 60 70 80
100
£ 200bJh-LU
LU300
400
500
».MLGRAP * t - LONG VALLEY, CA
14 FEBRUARY 1988
94
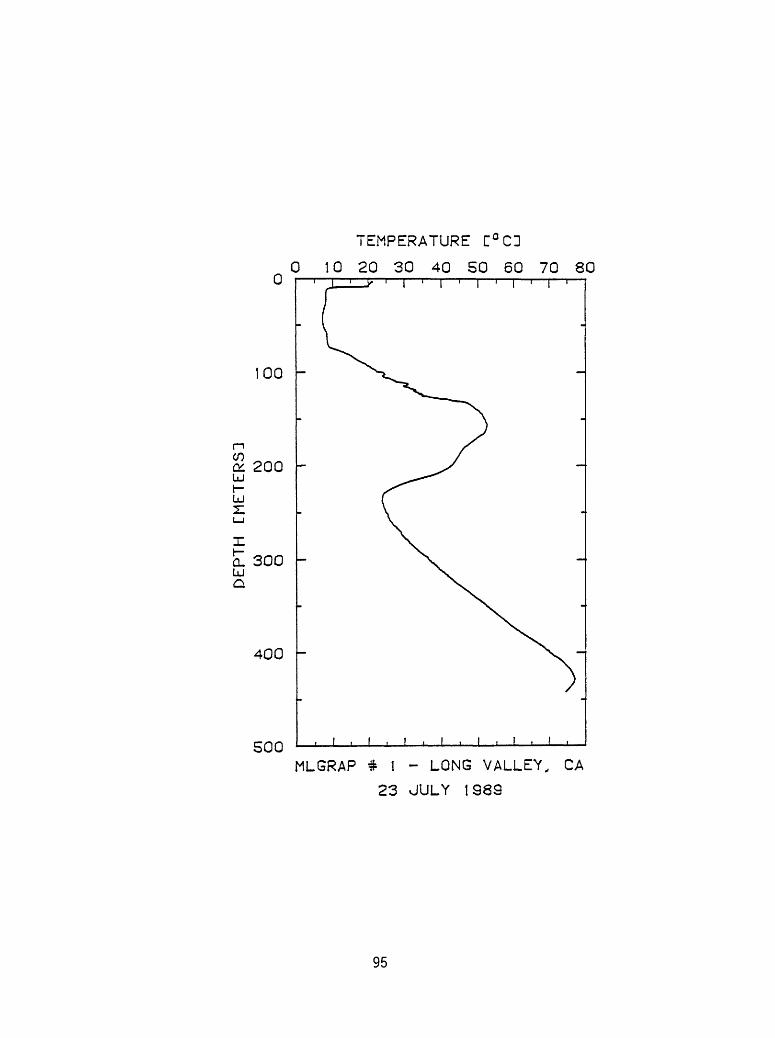
TEMPERATURE C°CD
0 10 20 30 40 50 60 70 80
100
n
2Idt- ld
200
0. 300UJ
400
500MLGRAP * 1 - LONG VALLEY, CA
23 JULY 1989
95

TEMPERATURE C°CD
0 10 20 30 40 50 60 70 80
00
200LJ h- LJ 2:
0. 300LJ
400
500MLGRAP * 2 - LONG VALLEY, CA
10 DECEMBER 1937
96

TEMPERATURE C°C1
0 10 20 30 40 50 60 70 80
100
£ 200i
z;t_iz:CL 300
400
500MLGRAP * 2 - LONG VALLEY, CA
12 DECEMBER 1987
97
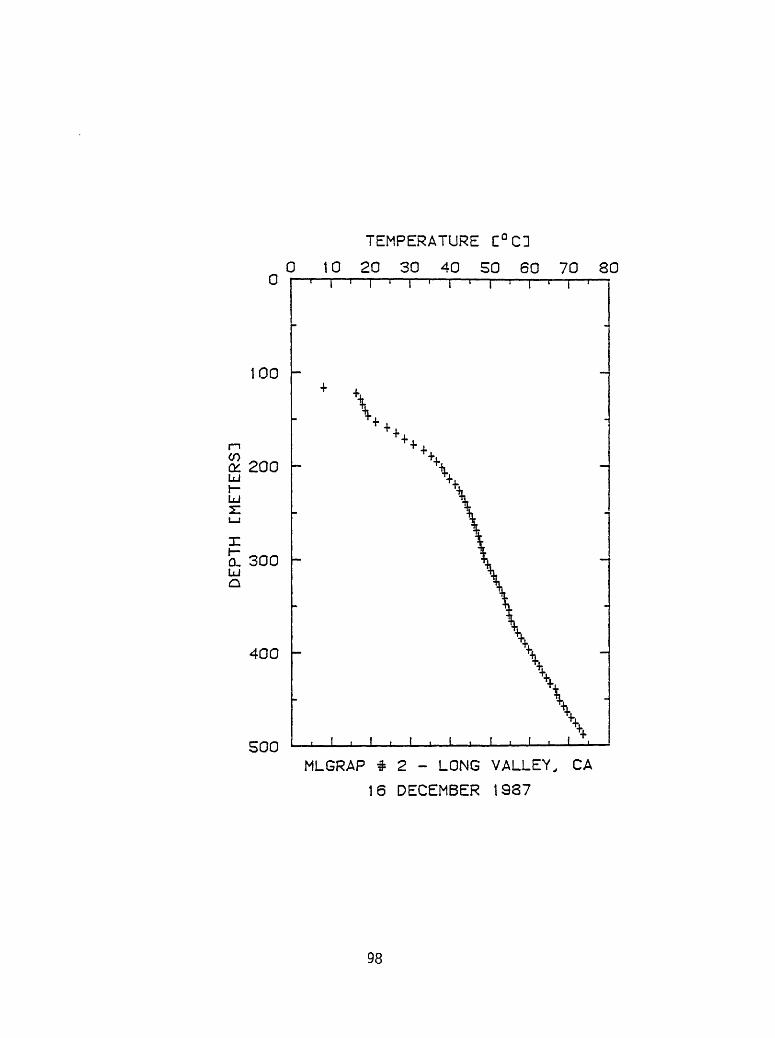
0
TEMPERATURE C°C1
0 10 20 30 40 SO 60 70 80
100
£ 200LJh-LJ
Si 300LJ
400
500MLGRAP * 2 - LONG VALLEY, CA
16 DECEMBER 1937
98

0
TEMPERATURE C°C1
0 10 20 30 40 50 60 70 80
100 -
£ 200UJ»-UJ
OL 300UJ
400 -
500MLGRAP * 2 - LONG VALLEY, CA
9 JANUARY 1988

TEMPERATURE C°C1
0 10 20 30 40 50 60 70 80
100
LJI LJ
LJ
200
300
400
500
M
M
! , 1__ I.I.I,
MLGRAP * 2 - LONG VALLEY, CA
29 JANUARY 1938
100

TEMPERATURE C°C1
0 10 20 30 40 50 60 70 80
100
£ 200LJt- LJ
0. 300 LJ
400
500MLGRAP * 2 - LONG VALLEY, CA
24 JULY 1989
101

APPENDIX IV
MLGRAP # 1 - Natural gamma-ray dataJuly 23, 1989 - uncorrected ........................ 103July 23, 1989 - corrected ........................ 108
MLGRAP # 2 - Natural gamma-ray dataJuly 24, 1989 - uncorrected ....................... 113July 24, 1989 - corrected ........................ 119
102

MLGRAP n 1 - Long Valley Caldera, Mammoth Lakes, CA - July 23, 1989 Measured with 2 in scintillation tool
DEPTH(FT)
101112131415161718192021222324252627282930313233343536373839404142434445464748495051525354555657585960616263646566676869
GAMMA RAY(COUNTS/S)
107.0106.0104.0104.099.095.093.096.0101.0104.097.095.095.092.090.0100.099.097.0100.0104.0104.0101.098.097.094.095.097.098.095.094.089.085.083.081.081.077.075.071.071.076.084.089.095.094.091.074.060.072.076.079.082.078.073.062.061.058.058.055.055.057.0
DEPTH(FT)
707172737475767778798081828384858687888990919293949596979899100101102103104105106107108109110111112113114115116117118119120121122123124125126127128129
GAMMA RAY(COUNTS/S)
57.055.055.052.049.049.047.046.042.042.040.039.038.038.038.039.040.040.040.040.040.038.037.039.044.043.042.040.038.038.038.037.037.036.035.035.036.038.039.041.043.047.046.046.048.047.048.050.049.047.047.048.045.043.044.047.050.049.048.046.0
DEPTH(FT)
130131132133134135136137138139140141142143144145146147148149150151152153154155156157158159160161162163164165166167168169170171172173174175176177178179180181182183184185186187188189
GAMMA RAY(COUNTS/S)
44.042.042.045.048.048.046.049.050.048.048.044.041.043.047.046.049.048.049.047.044.045.047.043.040.040.036.033.033.036.040.045.051.059.070.080.090.094.092.097.093.084.070.056.043.034.028.025.026.035.040.048.050.051.051.047.051.058.054.052.0
DEPTH(FT)
190191192193194195196197198199200201202203204205206207208209210211212213214215216217218219220221222223224225226227228229230231232233234235236237238239240241242243244245246247248249
GAMMA RAY(COUNTS/S)
51.051.051.052.049.047.048.049.051.052.050.050.054.053.055.056.055.056.051.053.055.059.060.060.061.061.064.062.061.065.068.081.088.080.081.070.062.056.056.051.050.045.036.032.028.024.022.022.023.022.020.022.023.024.025.028.041.054.052.037.0
DEPTH(FT)
250251252253254255256257258259260261262263264265266267268269270271272273274275276277278279280281282283284285286287288289290291292293294295296297298299300301302303304305306307308309
GAMMA RAY(COUNTS/S)
33.030.030.034.036.038.040.042.041.036.035.034.032.030.028.029.028.028.030.033.034.034.033.032.033.034.035.037.038.037.034.032.031.028.026.027.028.029.027.025.027.031.028.028.028.028.029.026.024.026.030.033.031.027.025.026.028.028.029.030.0
103

MLGRAP # 1 Long Valley Caldera, Mammoth Lakes, CA - July 23, 1989 Measured with 2 in scintillation tool
DEPTH(FT)
310311312313314315316317318319320321322323324325326327328329330331332333334335336337338339340341342343344345346347348349350351352353354355356357358359360361362363364365366367368369
GAMMA RAY(COUNTS/S)
30.030.031.032.033.033.033.033.032.032.032.030.029.031.032.031.031.030.031.031.031.032.032.031.030.030.029.029.028.028.031.033.032.033.031.031.030.030.031.032.032.032.033.034.035.035.034.034.032.030.031.032.032.032.032.030.027.028.029.031.0
DEPTH(FT)
370371372373374375376377378379380381382383384385386387388389390391392393394395396397398399400401402403404405406407408409410411412413414415416417418419420421422423424425426427428429
GAMMA RAY(COUNTS/S)
33.033.032.031.031.031.032.034.036.037.036.034.034.033.035.036.035.033.031.030.029.031.033.034.032.032.031.033.033.032.030.031.033.034.035.035.035.034.033.034.033.032.032.032.033.031.031.030.030.032.032.031.031.032.031.030.031.032.030.027.0
DEPTH(FT)
430431432433434435436437438439440441442443444445446447448449450451452453454455456457458459460461462463464465466467468469470471472473474475476477478479480481482483484485486487488489
GAMMA RAY(COUNTS/S)
25.022.018.015.015.015.015.015.014.014.014.014.014.014.014.015.015.015.014.014.014.015.016.015.014.014.015.015.014.015.016.016.017.016.015.018.018.021.020.019.018.018.018.016.016.019.022.023.022.022.022.021.022.022.022.024.023.022.021.020.0
DEPTH(FT)
490491492493494495496497498499500501502503504505506507508509510511512513514515516517518519520521522523524525526527528529530531532533534535536537538539540541542543544545546547548549
GAMMA RAY(COUNTS/S)
21.021.020.019.019.020.020.020.018.018.018.019.019.019.019.019.019.019.019.019.020.020.020.020.020.021.021.021.021.021.021.021.020.020.020.021.021.021.021.022.023.024.024.024.023.023.023.024.023.021.020.022.026.030.034.036.038.039.039.039.0
DEPTH(FT)
550551552553554555556557558559560561562563564565566567568569570571572573574575576577578579580581582583584585586587588589590591592593594595596597598599600601602603604605606607608609
GAMMA RAY(COUNTS/S)
0.042.043.044.045.045.046.046.047.047.047.044.043.044.043.041.039.039.039.039.038.038.038.042.045.043.042.043.046.045.043.041.043.042.042.042.042.040.041.039.039.040.041.043.045.047.046.044.045.047.047.048.048.048.048.047.043.042.043.045.0
104

MLGRAP # 1 - Long Valley Caldera, Mammoth Lakes, CA - July 23, 1989 Measured with 2 in scintillation tool
DEPTH(FT)
610611612613614615616617618619620621622623624625626627628629630631632633634635636637638639640641642643644645646647648649650651652653654655656657658659660661662663664665666667668669
GAMMA RAY(COUNTS/S)
46.046.045.045.046.047.048.049.048.047.045.043.042.042.043.044.046.048.042.042.041.041.043.044.044.045.046.044.044.041.039.041.042.042.043.046.047.044.040.036.036.036.036.036.038.037.035.035.037.037.036.033.030.026.024.030.038.040.031.028.0
DEPTH(FT)
670671672673674675676677678679680681682683684685686687688689690691692693694695696697698699700701702703704705706707708709710711712713714715716717718719720721722723724725726727728729
GAMMA RAY(COUNTS/S)
24.022.021.022.024.024.024.026.026.026.025.027.027.026.024.025.025.025.025.026.026.026.027.025.024.024.024.025.025.026.027.031.031.030.026.025.025.027.027.026.026.027.027.028.027.026.028.027.028.028.027.027.028.028.028.030.030.031.030.030.0
DEPTH(FT)
730731732733734735736737738739740741742743744745746747748749750751752753754755756757758759760761762763764765766767768769770771772773774775776777778779780781782783784785786787788789
GAMMA RAY(COUNTS/S)
30.030.030.029.028.026.028.030.029.029.030.030.033.030.029.029.032.031.029.027.027.028.029.030.031.031.032.030.032.032.030.032.032.034.037.041.041.043.042.040.037.038.038.037.036.035.035.037.040.040.040.040.040.040.041.040.037.036.037.036.0
DEPTH(FT)
790791792793794795796797798799800801802803804805806807808809810811812813814815816817818819820821822823824825826827828829830831832833834835836837838839840841842843844845846847848849
GAMMA RAY(COUNTS/S)
37.038.039.042.046.045.046.047.047.047.048.046.045.044.041.040.038.036.039.037.036.037.038.036.034.034.035.034.035.039.063.069.056.046.048.057.050.044.045.040.037.037.036.036.038.034.036.035.034.033.033.033.033.034.035.035.034.033.032.033.0
DEPTH(FT)
850851852853854855856857858859860861862863864865866867868869870871872873874875876877878879880881882883884885886887888889890891892893894895896897898899900901902903904905906907908909
GAMMA RAY(COUNTS/S)
53.061.073.077.086.094.099.094.090.085.087.085.080.085.092.093.092.083.071.079.084.085.085.094.0
100.0100.0112.0118.0109.0142.0150.0159.0163.0163.0157.0162.0163.0162.0159.0160.0151.0149.0157.0162.0167.0170.0172.0167.0169.0170.0174.0170.0170.0171.0171.0169.0152.0120.089.057.0
105

MLGRAP n 1 - Long Valley Caldera, Mammoth Lakes, CA - July 23, 1989 Measured with 2 in scintillation tool
DEPTH<FT)
910911912913914915916917918919920921922923924925926927928929930931932933934935936937938939940941942943944945946947948949950951952953954955956957958959960961962963964965966967968969
GAMMA RAY(COUNTS/S)
47.041.036.036.045.081.0125.0144.0146.0152.0158.0162.0161.0164.0158.0151.0151.0148.0148.0139.0138.0127.0118.0107.0104.0104.0102.0109.0109.0107.0106.0102.098.097.0103.0109.0109.0104.098.090.089.084.084.085.083.085.093.0104.0107.0109.0103.0104.098.093.090.085.080.064.048.041.0
DEPTH<FT)
970971972973974975976977978979980981982983984985986987988989990991992993994995996997998999100010011002100310041005100610071008100910101011101210131014101510161017101810191020102110221023102410251026102710281029
GAMMA RAY(COUNTS/S)
38.036.034.034.034.035.035.034.032.035.036.034.034.035.036.035.035.037.037.037.037.035.035.034.034.035.036.034.035.035.034.033.034.033.033.032.032.033.034.033.033.032.034.035.034.035.036.039.039.036.034.034.034.035.035.034.035.035.035.035.0
DEPTH(FT)
103010311032103310341035103610371038103910401041104210431044104510461047104810491050105110521053105410551056105710581059106010611062106310641065106610671068106910701071107210731074107510761077107810791080108110821083108410851086108710881089
GAMMA RAY(COUNTS/S)
35.034.035.035.034.034.035.036.036.034.035.038.038.037.036.036.035.034.032.034.033.034.037.038.038.035.034.036.036.037.036.036.035.035.035.033.034.039.042.041.040.039.037.034.035.035.034.034.034.034.034.033.032.033.037.037.034.036.038.038.0
DEPTH(FT)
109010911092109310941095109610971098109911001101110211031104110511061107110811091110111111121113111411151116111711181119112011211122112311241125112611271128112911301131113211331134113511361137113811391140114111421143114411451146114711481149
GAMMA RAY(COUNTS/S)
35.034.034.034.034.034.034.034.034.035.034.036.037.038.037.036.037.038.036.036.036.036.037.038.036.035.035.034.034.034.034.033.034.037.037.038.036.034.033.034.035.035.033.031.032.034.034.034.034.035.034.032.034.035.034.034.034.033.032.032.0
DEPTH(FT)
115011511152115311541155115611571158115911601161116211631164116511661167116811691170117111721173117411751176117711781179118011811182118311841185118611871188118911901191119211931194119511961197119811991200120112021203120412051206120712081209
GAMMA RAY(COUNTS/S)
34.034.034.034.034.036.036.035.034.035.036.035.035.034.033.032.033.033.035.037.038.037.035.035.031.031.031.032.034.034.032.032.032.032.036.037.037.036.036.035.034.033.034.034.034.033.034.034.035.035.034.034.035.035.035.035.031.034.035.038.0
106

MLGRAP # 1 - Long Valley Caldera, Mammoth Lakes, CA - July 23, 1989 Measured with 2 in scintillation tool
DEPTH(FT)
121012111212121312141215121612171218121912201221122212231224122512261227122812291230123112321233123412351236123712381239124012411242124312441245124612471248124912501251125212531254125512561257125812591260126112621263126412651266126712681269
GAMMA RAY(COUNTS/S)
37.036.034.034.034.035.036.036.037.037.038.037.036.035.034.034.035.034.034.035.037.041.048.054.054.052.057.050.042.040.037.037.037.042.045.046.053.058.064.066.071.074.072.070.086.098.097.094.096.0105.0109.0107.0103.0108.0122.0130.0134.0131.0123.0110.0
DEPTH(FT)
127012711272127312741275127612771278127912801281128212831284128512861287128812891290129112921293129412951296129712981299130013011302130313041305130613071308130913101311131213131314131513161317131813191320132113221323132413251326132713281329
GAMMA RAY(COUNTS/S)
106.096.092.095.099.0102.0105.0113.0116.0114.095.092.084.087.092.089.087.090.093.089.091.099.0106.0112.0116.0117.0117.0122.0130.0130.0120.0111.0107.0104.0101.098.099.0104.0111.0111.0108.0115.0115.0114.0125.0143.0144.0139.0133.0120.0118.0118.0120.0126.0125.0119.0117.0122.0123.0126.0
DEPTH(FT)
133013311332133313341335133613371338133913401341134213431344134513461347134813491350135113521353135413551356135713581359136013611362136313641365136613671368136913701371137213731374137513761377137813791380138113821383138413851386138713881389
GAMMA RAY(COUNTS/S)
121.0120.0116.0119.0120.0125.0127.0129.0143.0139.0139.0135.0131.0129.0127.0130.0133.0137.0141.0141.0138.0137,0139.0144.0147.0146.0143.0141.0141.0135.0137.0136.0135.0137.0143.0143.0139.0135.0130.0121.0109.0103.099.098.096.096.092.092.091.098.098.097.0111.0110.0104.099.092.089.088.091.0
DEPTH(FT)
139013911392139313941395139613971398139914001401140214031404140514061407140814091410141114121413141414151416141714181419142014211422142314241425142614271428142914301431143214331434143514361437143814391440144114421443144414451446144714481449
GAMMA RAY DEPTH GAMMA RAY(COUNTS/S) (FT) (COUNTS/S)
90.0 1450 171.086.080.080.084.082.081.077.080.085.091.097.0107.0118.0135.0159.0161.0164.0173.0178.0178.0178.0173.0173.0175.0169.0168.0174.0184.0187.0186.0186.0183.0185.0179.0175.0166.0177.0187.0194.0189.0184.0191.0190.0193.0195.0191.0187.0196.0198.0197.0193.0187.0183.0184.0184.0182.0182.0181.0171.0
107

MLGRAP # 1 - Long Valley Caldera, Mammoth Lakes, California - July 23, 1989 Measured with 2 in scintillation tool - corrected using Table 2
DEPTH(FT)
101112131415161718192021222324252627282930313233343536373839404142434445464748495051525354555657585960616263646566676869
GAMMA RAY(COUNTS/S)
125.2124.0121.7121.7115.8111.2108.8112.3118.2121.7113.5111.2111.2107.6105.3117.0115.8113.5117.0121.7127.9124.2120.5119.3115.6116.9119.3120.5116.9115.6109.5104.6102.199.699.694.792.287.387.393.5103.3109.5116.9115.6111.991.073.888.693.597.2100.995.989.876.375.071.371.367.767.770.1
DEPTH(FT)
707172737475767778798081828384858687888990919293949596979899100101102103104105106107108109110111112113114115116117118119120121122123124125126127128129
GAMMA RAY(COUNTS/S)
70.167.767.764.060.360.357.856.651.751.749.248.046.746.746.748.049.249.249.249.249.246.745.548.054.152.951.749.246.746.746.745.545.544.343.143.144.346.748.050.452.957.856.656.659.057.859.061.560.357.857.859.055.452.954.157.861.560.359.056.6
DEPTH(FT)
130131132133134135136137138139140141142143144145146147148149150151152153154155156157158159160161162163164165166167168169170171172173174175176177178179180181182183184185186187188189
GAMMA RAY(COUNTS/S)
54.151.751.755.459.059.056.660.361.559.059.054.150.452.957.856.660.359.060.357.854.155.457.852.949.249.244.340.640.644.349.255.462.772.686.198.4110.7115.6113.2119.3114.4103.386.168.952.941.834.430.832.043.149.259.061.562.762.757.862.771.366.464.0
DEPTH(FT)
190191192193194195196197198199200201202203204205206207208209210211212213214215216217218219220221222223224225226227228229230231232233234235236237238239240241242243244245246247248249
GAMMA RAY(COUNTS/S)
62.762.762.764.060.357.859.060.362,764.061.561.566.465.267.768.967.768.962.765.267.772.673.873.875.075.078.776.375.079.983.699.6108.298.499.6115.5102.392.492.484.182.574.259.452.846.239.636.336.338.036.333.022.023.024.025.028.041.054.052.037.0
DEPTH(FT)
250251252253254255256257258259260261262263264265266267268269270271272273274275276277278279280281282283284285286287288289290291292293294295296297298299300301302303304305306307308309
GAMMA RAY(COUNTS/S)
33.030.030.034.036.038.040.042.041.036.035.034.032.030.028.029.028.028.030.033.034.034.033.032.033.034.035.037.038.037.034.032.031.028.026.027.028.029.027.025.027.031.028.0
28.028.028.029.026.024.026.030.033.031.027.025.026.028.028.029.030.0
108

MLGRAP # 1 - Long Valley Caldera, Mairrooth Lakes, California - July 23, 1989 Measured with 2 in scintillation tool - corrected using Table 2
DEPTH(FT)
3103113123133U315316317318319320321322323324325326327328329330331332333334335336337338339340341342343344345346347348349350351352353354355356357358359360361362363364365366367368369
GAMMA RAY(COUNTS/S)
30.030.031.032.033.033.033.033.032.032.032.030.029.031.032.031.031.030.031.031.031.032.032.031.030.030.029.029.028.028.031.033.032.033.031.031.030.030.031.032.032.032.033.034.035.035.034.034.032.030.031.032.032.032.032.030.027.028.029.031.0
DEPTH(FT)
370371372373374375376377378379380381382383384385386387388389390391392393394395396397398399400401402403404405406407408409410411412413414415416417418419420421422423424425426427428429
GAMMA RAY(COUNTS/S)
33.033.032.031.031.031.032.034.036.037.036.034.034.033.035.036.035.033.031.030.029.031.033.034.032.032.031.033.033.032.030.031.033.034.035.035.035.034.033.034.033.032.032.032.033.031.031.030.030.032.032.031.031.032.031.030.031.032.030.027.0
DEPTH(FT)
430431432433434435436437438439440441442443444445446447448449450451452453454455456457458459460461462463464465466467468469470471472473474475476477478479480481482483484485486487488489
GAMMA RAY(COUNTS/S)
25.022.018.015.015.015.015.015.014.014.014.014.014.014.014.015.015.015.014.014.014.015.016.015.014.014.015.015.014.015.016.016.017.016.015.018.018.021.020.019.018.418.418.416.316.319.422.423.522.422.422.421.422.422.422.424.523.522.421.420.4
DEPTH(FT)
490491492493494495496497498499500501502503504505506507508509510511512513514515516517518519520521522523524525526527528529530531532533534535536537538539540541542543544545546547548549
GAMMA RAY(COUNTS/S)
21.421.420.419.419.420.420.420.418.418.418.419.419.419.419.419.419.419.419.419.420.420.420.420.420.421.421.421.421.421.421.421.420.420.420.421.421.421.421.422.423.524.524.524.523.518.918.919.718.917.216.418.021.324.627.929.531.232.032.032.0
DEPTH(FT)
550551552553554555556557558559560561562563564565566567568569570571572573574575576577578579580581582583584585586587588589590591592593594595596597598599600601602603604605606607608609
GAMMA RAY(COUNTS/S)
32.834.435.336.136.936.937.737.738.538.538.536.135.336.135.333.632.032.032.032.031.231.231.234.436.935.334.435.337.736.935.333.635.334.434.434.434.432.833.632.032.032.833.635.336.938.537.736.136.938.538.539.439.439.439.438.535.334.435.336.9
109
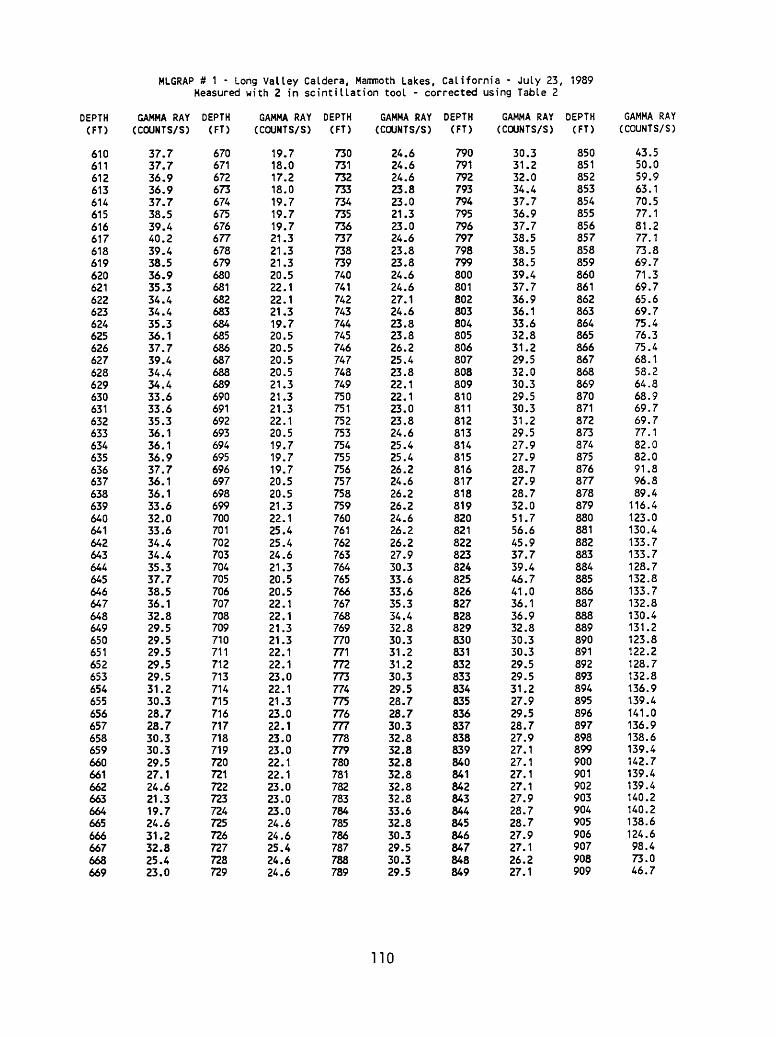
MLGRAP # 1 - Long Valley Caldera, Mammoth Lakes, California - July 23, 1989 Measured with 2 in scintillation tool - corrected using Table 2
DEPTH(FT)
610611612613614615616617618619620621622623624625626627628629630631632633634635636637638639640641642643644645646647648649650651652653654655656657658659660661662663664665666667668669
GAMMA RAY(COUNTS/S)
37.737.736.936.937.738.539.440.239.438.536.935.334.434.435.336.137.739.434.434.433.633.635.336.136.136.937.736.136.133.632.033.634.434.435.337.738.536.132.829.529.529.529.529.531.230.328.728.730.330.329.527.124.621.319.724.631.232.825.423.0
DEPTH(FT)
670671672673674675676677678679680681682683684685686687688689690691692693694695696697698699700701702703704705706707708709710711712713714715716717718719720721722723724725726727728729
GAMMA RAY(COUNTS/S)
19.718.017.218.019.719.719.721.321.321.320.522.122.121.319.720.520.520.520.521.321.321.322.120.519.719.719.720.520.521.322.125.425.424.621.320.520.522.122.121.321.322.122.123.022.121.323.022.123.023.022.122.123.023.023.024.624.625.424.624.6
DEPTH(FT)
730731732733734735736737738739740741742743744745746747748749750751752753754755756757758759760761762763764765766767768769770771772773774775776777778779780781782783784785786787788789
GAMMA RAY(COUNTS/S)
24.624.624.623.823.021.323.024.623.823.824.624.627.124.623.823.826.225.423.822.122.123.023.824.625.425.426.224.626.226.224.626.226.227.930.333.633.635.334.432.830.331.231.230.329.528.728.730.332.832.832.832.832.832.833.632.830.329.530.329.5
DEPTH(FT)
790791792793794795796797798799800801802803804805806807808809810811812813814815816817818819820821822823824825826827828829830831832833834835836837838839840841842843844845846847848849
GAMMA RAY(COUNTS/S)
30.331.232.034.437.736.937.738.538.538.539.437.736.936.133.632.831.229.532.030.329.530.331.229.527.927.928.727.928.732.051.756.645.937.739.446.741.036.136.932.830.330.329.529.531.227.929.528.727.927.127.127.127.127.928.728.727.927.126.227.1
DEPTH(FT)
850851852853854855856857858859860861862863864865866867868869870871872873374875876877878879880881882883884885886887888889890891892893894895896897898899900901902903904905906907908909
GAMMA RAY(COUNTS/S)
43.550.059.963.170.577.181.277.173.869.771.369.765.669.775.476.375.468.153.264.368.969.769.777.182.082.091.896.889.4
116.4123.0130.4133.7133.7128.7132.8133.7132.8130.4131.2123.8122.2128.7132.8136.9139.4141.0136.9138.6139.4142.7139.4139.4140.2140.2138.6124.698.473.046.7
110

MLGRAP # 1 - Long Valley Caldera, Mammoth Lakes, California - July 23, 1989 Measured with 2 in scintillation tool - corrected using Table 2
DEPTH(FT)
910911912913914915916917918919920921922923924925926927928929930931932933934935936937938939940941942943944945946947948949950951952953954955956957958959960961962963964965966967968969
GAMMA RAY(COUNTS/S)
38.533.629.529.536.966.4102.5118.1119.7124.6129.6132.8132.0134.5129.6123.8123.8121.4121.4114.0113.2104.196.887.785.385.383.689.489.487.786.983.680.479.584.589.489.485.380.473.873.068.968.969.768.169.776.385.387.789.484.585.380.476.373.869.765.652.539.433.6
DEPTH(FT)
970971972973974975976977978979980981982983984985986987988989990991992993994995996997998999100010011002100310041005100610071008100910101011101210131014101510161017101810191020102110221023102410251026102710281029
GAMMA RAY(COUNTS/S)
31.229.527.927.927.928.728.727.926.228.729.527.927.928.729.528.728.730.330.330.330.328.728.727.927.928.729.527.928.728.727.927.127.927.127.126.226.227.127.927.127.126.227.928.727.928.729.532.032.029.527.927.927.928.728.727.928.728.728.728.7
DEPTH(FT)
103010311032103310341035103610371038103910401041104210431044104510461047104810491050105110521053105410551056105710581059106010611062106310641065106610671068106910701071107210731074107510761077107810791080108110821083108410851086108710881089
GAMMA RAY(COUNTS/S)
28.727.928.728.727.927.928.729.529.527.928.731.231.230.329.529.528.727.926.227.927.127.930.331.231.228.727.929.529.530.329.529.528.728.728.727.127.932.034.433.632.832.030.327.928.728.727.927.927.927.927.927.126.227.130.330.327.929.531.231.2
DEPTH(FT)
109010911092109310941095109610971098109911001101110211031104110511061107110811091110111111121113111411151116111711181119112011211122112311241125112611271128112911301131113211331134113511361137113811391140114111421143114411451146114711481149
GAMMA RAY(COUNTS/S)
28.727.927.927.927.927.927.927.927.928.727.929.530.331.230.329.530.331.229.529.529.529.530.331.229.528.728.727.927.927.927.927.127.930.330.331.229.527.927.127.928.728.727.125.426.227.927.927.927.928.727.926.227.928.727.927.927.927.126.226.2
DEPTH(FT)
115011511152115311541155115611571158115911601161116211631164116511661167116811691170117111721173117411751176117711781179118011811182118311841185118611871188118911901191119211931194119511961197119811991200120112021203120412051206120712081209
GAMMA RAY(COUNTS/S)
27.927.927.927.927.929.529.528.727.928.729.528.728.727.927.126.227.127.128.730.331.230.328.728.725.425.425.426.227.927.926.226.226.226.229.530.330.329.529.528.727.927.127.927.927.927.127.927.928.728.727.927.928.728.728.728.725.427.928.731.2
111

HLGRAP # 1 - Long Valley Caldera, Mammoth Lakes, California - July 23, 1989 Measured with 2 in scintillation tool - corrected using Table 2
DEPTH(FT)
121012111212121312141215121612171218121912201221122212231224122512261227122812291230123112321233123412351236123712381239124012411242124312441245124612471248124912501251125212531254125512561257125812591260126112621263126412651266126712681269
GAMMA RAY(COUNTS/S)
30.329.527.927.927.928.729.529.530.330.331.230.329.528.727.927.928.727.927.928.730.333.639.444.344.342.646.741.034.432.830.330.330.334.436.937.743.547.652.554.158.260.759.057.470.580.479.577.178.786.189.487.784.588.6100.0106.6109.9107.4100.990.2
DEPTH(FT)
127012711272127312741275127612771278127912801281128212831284128512861287128812891290129112921293129412951296129712981299130013011302130313041305130613071308130913101311131213131314131513161317131813191320132113221323132413251326132713281329
GAMMA RAY(COUNTS/S)
86.978.775.477.981.283.686.192.795.193.577.975.468.971.375.473.071.373.876.373.074.681.286.991.895.195.995.9100.0106.6106.698.491.087.785.382.880.481.285.391.091.088.694.394.393.5102.5117.3118.1114.0109.198.496.896.898.4103.3102.597.695.9100.0100.9103.3
DEPTH(FT)
133013311332133313341335133613371338133913401341134213431344134513461347134813491350135113521353135413551356135713581359136013611362136313641365136613671368136913701371137213731374137513761377137813791380138113821383138413851386138713881389
GAMMA RAY(COUNTS/S)
99.298.495.197.698.4102.5104.1105.8117.3114.0114.0110.7107.4105.8104.1106.6109.1112.3115.6115.6113.2112.3114.0118.1120.5119.7117.3115.6115.6110.7112.3111.5110.7112.3117.3117.3114.0110.7106.699.289.484.581.280.478.778.775.475.474.680.480.479.591.090.285.381.275.473.072.274.6
DEPTH(FT)
139013911392139313941395139613971398139914001401140214031404140514061407140814091410141114121413141414151416141714181419142014211422142314241425142614271428142914301431143214331434143514361437143814391440144114421443144414451446144714481449
GAMMA RAY DEPTH GAMMA RAY(COUNTS/S) (FT) (COUNTS/S)
73.8 1450 140.270.565.665.668.967.266.463.165.669.774.679.587.796.8110.7130.4132.0134.5141.9146.0146.0146.0141.9141.9143.5138.6137.8142.7150.9153.3152.5152.5150.1151.7146.8143.5136.1145.1153.3159.1155.0150.9156.6155.8158.3159.9156.6153.3160.7162.4161.5158.3153.3150.1150.9150.9149.2149.2148.4140.2
112

MLGRAP # 2 - Long Valley Caldera, Mammoth Lakes, CA - July 24, 1989 Measured with 2 in scintillation tool
DEPTH(FT)
101112131415161718192021222324252627282930313233343536373839404142434445464748495051525354555657585960616263646566676869
GAMMA RAY(COUNTS/S)
74.073.071.071.071.076.077.077.073.072.073.070.075.074.068.069.072.073.078.072.072.074.069.070.069.068.069.074.077.079.075.073.066.064.062.063.062.059.057.055.056.056.062.070.073.073.066.067.066.065.067.068.064.062.060.060.062.062.060.060.0
DEPTH(FT)
707172737475767778798081828384858687888990919293949596979899100101102103104105106107108109110111112113114115116117118119120121122123124125126127128129
GAMMA RAY(COUNTS/S)
61.064.061.060.060.062.061.059.056.059.063.064.064.066.066.064.056.056.055.057.064.064.064.061.070.073.072.074.077.083.077.079.077.078.079.080.082.081.081.079.077.077.079.079.075.081.080.076.077.078.073.072.069.074.072.070.060.054.049.047.0
DEPTH(FT)
130131132133134135136137138139140141142143144145146147148149150151152153154155156157158159160161162163164165166167168169170171172173174175176177178179180181182183184185186187188189
GAMMA RAY(COUNTS/S)
43.044.047.042.040.038.035.034.033.035.034.034.034.034.035.035.034.034.034.035.038.038.035.034.031.030.033.034.033.035.036.035.038.037.036.032.034.035.035.037.036.034.036.037.036.034.037.039.041.040.037.038.037.036.038.038.037.035.038.040.0
DEPTH(FT)
190191192193194195196197198199200201202203204205206207208209210211212213214215216217218219220221222223224225226227228229230231232233234235236237238239240241242243244245246247248249
GAMMA RAY(COUNTS/S)
40.039.041.043.042.041.045.048.049.049.052.057.056.053.067.0116.0146.0158.0163.0164.0163.0140.095.083.077.069.064.062.055.051.045.038.035.033.033.033.033.033.034.035.034.034.035.034.035.036.034.031.029.028.029.031.034.034.036.038.046.069.077.082.0
DEPTH(FT)
250251252253254255256257258259260261262263264265266267268269270271272273274275276277278279280281282283284285286287288289290291292293294295296297298299300301302303304305306307308309
GAMMA RAY(COUNTS/S)
88.097.0102.098.091.092.090.090.089.086.087.079.075.071.076.084.087.088.090.092.099.093.093.092.091.094.089.086.090.090.083.083.083.080.079.079.084.092.098.095.092.081.087.084.088.094.099.088.084.088.090.093.098.0100.0102.0106.0110.0114.0128.0139.0
113

MLGRAP # 2 - Long Valley Caldera, Mammoth Lakes, CA - July 24, 1989 Measured with 2 in scintillation tool
DEPTH(FT)
310311312313314315316317318319320321322323324325326327328329330331332333334335336337338339340341342343344345346347348349350351352353354355356357358359360361362363364365366367368369
GAMMA RAY(COUNTS/S)
139.0143.0147.0149.0148.0149.0149.0147.0153.0160.0162.0163.0168.0155.0149.0147.0152.0156.0163.0164.0170.0169.0163.0160.0156.0149.0145.0147.0146.0140.0136.0134.0131.0123.0116.0103.086.075.067.072.075.066.066.069.070.062.057.056.058.050.047.045.040.035.036.041.047.043.040.037.0
DEPTH(FT)
370371372373374375376377378379380381382383384385386387388389390391392393394395396397398399400401402403404405406407408409410411412413414415416417418419420421422423424425426427428429
GAMMA RAY(COUNTS/S)
35.034.034.034.035.037.039.042.045.045.044.045.045.045.045.047.048.048.047.047.046.045.047.048.048.047.048.051.052.053.053.047.047.049.048.048.050.050.050.047.047.052.053.050.051.053.056.053.054.053.051.052.054.051.051.048.051.053.052.052.0
DEPTH(FT)
430431432433434435436437438439440441442443444445446447448449450451452453454455456457458459460461462463464465466467468469470471472473474475476477478479480481482483484485486487488489
GAMMA RAY(COUNTS/S)
52.052.052.052.052.050.051.050.049.049.048.050.054.052.052.050.051.052.050.048.049.049.053.051.053.054.052.052.051.050.049.050.050.048.055.056.053.051.049.051.053.053.048.048.054.055.050.049.050.051.053.052.049.050.050.049.048.050.053.052.0
DEPTH(FT)
490491492493494495496497498499500501502503504505506507508509510511512513514515516517518519520521522523524525526527528529530531532533534535536537538539540541542543544545546547548549
GAMMA RAY(COUNTS/S)
48.043.045.048.051.053.053.052.049.049.051.053.053.050.050.050.051.052.049.051.049.051.052.049.049.048.047.047.048.049.049.049.051.049.049.048.048.050.052.054.054.052.048.048.053.051.054.054.052.054.052.050.051.050.055.055.055.056.059.061.0
DEPTH(FT)
550551552553554555556557558559560561562563564565566567568569570571572573574575576577578579580581582583584585586587588589590591592593594595596597598599600601602603604605606607608609
GAMMA RAY(COUNTS/S)
64.065.064.060.057.063.064.061.061.053.045.041.036.035.032.031.031.031.031.032.032.030.030.030.031.033.035.034.031.034.035.034.034.035.032.031.031.036.036.035.036.034.033.035.035.035.034.033.035.035.034.035.035.036.035.034.035.033.031.033.0
114

MLGRAP # 2 - Long Valley Caldera, Mammoth Lakes, CA - July 24, 1989 Measured with 2 in scintillation tool
DEPTH(FT)
610611612613614615616617618619620621622623624625626627628629630631632633634635636637638639640641642643644645646647648649650651652653654655656657658659660661662663664665666667668669
GAMMA RAY(COUNTS/S)
35.035.034.034.035.037.037.036.039.040.039.038.036.035.034.034.034.034.034.034.033.035.035.036.034.037.037.036.034.035.035.036.035.034.035.033.033.033.034.036.037.035.034.035.034.034.036.037.036.036.035.035.033.032.031.033.035.035.036.039.0
DEPTH(FT)
670671672673674675676677678679680681682683684685686687688689690691692693694695696697698699700701702703704705706707708709710711712713714715716717718719720721722723724725726727728729
GAMMA RAY(COUNTS/S)
41.039.036.034.038.037.037.037.036.035.034.033.034.035.035.036.035.035.036.038.036.035.035.035.036.037.037.039.039.038.038.038.036.036.036.038.041.043.044.043.042.040.040.043.043.042.043.043.040.037.035.040.040.040.040.041.039.039.039.039.0
DEPTH(FT)
730731732733734735736737738739740741742743744745746747748749750751752753754755756757758759760761762763764765766767768769770771772773774775776777778779780781782783784785786787788789
GAMMA RAY(COUNTS/S)
40.040.043.044.040.040.039.039.039.042.041.039.038.037.038.039.038.039.040.041.043.042.040.040.040.040.039.038.039.038.039.041.043.044.043.041.040.041.041.040.037.037.039.040.041.042.043.039.038.038.038.039.040.041.041.040.039.040.039.040.0
DEPTH(FT)
790791792793794795796797798799800801802803804805806807808809810811812813814815816817818819820821822823824825826827828829830831832833834835836837838839840841842843844845846847848849
GAMMA RAY(COUNTS/S)
41.041.041.041.041.041.041.042.044.043.041.040.041.042.043.041.042.045.045.044.044.046.045.042.043.046.048.047.044.040.034.034.033.033.033.033.034.034.033.032.032.029.029.030.030.030.031.031.030.031.033.034.033.032.031.032.030.030.030.034.0
DEPTH(FT)
850851852853854855856857858859860861862863864865866867868869870871872873874875876877878879880881882883884885886887888889890891892893894895896897898899900901902903904905906907908909
GAMMA RAY(COUNTS/S)
35.035.033.032.031.032.032.033.035.034.033.031.032.032.032.033.034.034.035.037.037.035.034.033.033.033.033.031.031.032.033.034.034.034.034.033.033.034.034.033.031.029.032.040.052.078.0102.0106.0111.0117.0117.0117.0120.0119.0121.0121.0121.0117.0119.0118.0
115

MLGRAP # 2 - Long Valley Caldera, Mammoth Lakes, CA - July 24, 1989 Measured with 2 in scintillation tool
DEPTH(FT)
910911912913914915916917918919920921922923924925926927928929930931932933934935936937938939940941942943944945946947948949950951952953954955956957958959960961962963964965966967968969
GAMMA RAY(COUNTS/S)
116.0111.0118.0116.0116.0110.0107.0111.0117.0117.0118.0120.0114.0105.099.093.096.095.088.080.078.080.081.082.084.086.095.098.0100.0104.0107.0108.0106.0107.0101.0101.0106.0107.0108.0104.0104.0107.0108.0109.0107.0106.0104.0104.0111.0113.0112.0111.0109.0109.0109.0107.0113.0115.0115.0112.0
DEPTH(FT)
970971972973974975976977978979980981982983984985986987988989990991992993994995996997998999100010011002100310041005100610071008100910101011101210131014101510161017101810191020102110221023102410251026102710281029
GAMMA RAY(COUNTS/S)
112.0119.0125.0128.0135.0135.0139.0134.0132.0127.0129.0128.0125.0127.0128.0124.0123.0132.0130.0126.0131.0130.0133.0134.0131.0130.0130.0129.0135.0138.0142.0143.0140.0141.0141.0138.0140.0139.0141.0139.0140.0143.0142.0140.0136.0133.0130.0128.0131.0135.0135.0129.0131.0129.0129.0131.0128.0125.0128.0127.0
DEPTH(FT)
103010311032103310341035103610371038103910401041104210431044104510461047104810491050105110521053105410551056105710581059106010611062106310641065106610671068106910701071107210731074107510761077107810791080108110821083108410851086108710881089
GAMMA RAY(COUNTS/S)
126.0124.0124.0129.0132.0134.0139.0144.0144.0134.0133.0129.0129.0133.0130.0119.0101.088.082.084.080.080.082.083.084.082.082.081.082.084.086.091.091.089.088.090.088.089.086.084.088.089.089.091.092.093.092.088.088.087.090.090.088.087.089.096.097.098.095.093.0
DEPTH(FT)
109010911092109310941095109610971098109911001101110211031104110511061107110811091110111111121113111411151116111711181119112011211122112311241125112611271128112911301131113211331134113511361137113811391140114111421143114411451146114711481149
GAMMA RAY(COUNTS/S)
94.094.097.095.096.096.099.0100.0108.0111.0113.0112.0105.099.0100.0104.0103.0109.0107.0106.0102.099.098.099.097.0100.0102.0107.0115.0119.0125.0124.0116.0103.0102.0106.0101.099.096.095.098.0100.099.095.092.091.091.091.091.086.082.079.057.035.024.020.031.053.085.093.0
DEPTH(FT)
115011511152115311541155115611571158115911601161116211631164116511661167116811691170117111721173117411751176117711781179118011811182118311841185118611871188118911901191119211931194119511961197119811991200120112021203120412051206120712081209
GAMMA RAY(COUNTS/S)
100.0104.0110.0112.0116.0118.0117.0117.0120.0120.0115.0115.0117.0119.0117.0113.0110.0108.0114.0114.0111.0110.0103.091.090.096.0102.0110.0119.0136.0132.0120.0127.0139.0142.0141.0143.0139.0141.0145.0145.0140.0135.0124.0123.0121.0123.0121.0118.0117.0117.0116.0112.0109.0109.0109.0109.0108.0106.0107.0
116

MLGRAP # 2 - Long Valley Caldera, Mammoth Lakes, CA - July 24, 1989 Measured with 2 in scintillation tool
DEPTH(FT)
121012111212121312141215121612171218121912201221122212231224122512261227122812291230123112321233123412351236123712381239124012411242124312441245124612471248124912501251125212531254125512561257125812591260126112621263126412651266126712681269
GAMMA RAY(COUNTS/S)
107.0111.0117.0121.0117.0116.0118.0119.0118.0113.0108.0105.0103.0105.0103.0102.0114.0116.0116.0112.0104.0100.0114.0113.0110.0114.0126.0128.0120.0120.0119.0119.0119.0118.0120.0115.0119.0118.0115.0118.0120.0126.0127.0124.0120.0119.0115.0116.0113.0110.0109.0105.0109.0111.0114.0116.0120.0123.0125.0119.0
DEPTH(FT)
127012711272127312741275127612771278127912801281128212831284128512861287128812891290129112921293129412951296129712981299130013011302130313041305130613071308130913101311131213131314131513161317131813191320132113221323132413251326132713281329
GAMMA RAY(COUNTS/S)
126.0123.0117.0109.0107.0113.0112.0115.0111.0115.0111.0112.0111.0111.0114.0109.0113.0113.0114.0115.0120.0120.0118.0119.0118.0116.0118.0119.0124.0121.0122.0119.0118.0110.0109.0107.0105.0107.0106.0108.0111.0114.0114.0110.0113.0113.0108.0107.0111.0112.0114.0114.0113.0113.0116.0117.0116.0121.0120.0115.0
DEPTH(FT)
133013311332133313341335133613371338133913401341134213431344134513461347134813491350135113521353135413551356135713581359136013611362136313641365136613671368136913701371137213731374137513761377137813791380138113821383138413851386138713881389
GAMMA RAY(COUMTS/S)
117.0116.0117.0115.0113.0116.0113.0110.0110.0109.0114.0119.0117.0109.0111.0116.0119.0117.0120.0123.0125.0125.0119.0118.0120.0123.0128.0126.0119.0118.0121.0133.0136.0128.0124.0118.0116.0116.0112.0113.0115.0112.0119.0117.0116.0112.0114.0115.0113.0115.0117.0123.0128.0131.0126.0121.0118.0122.0121.0115.0
DEPTH(FT)
139013911392139313941395139613971398139914001401140214031404140514061407140814091410141114121413141414151416141714181419142014211422142314241425142614271428142914301431143214331434143514361437143814391440144114421443144414451446144714481449
GAMMA RAY(COUNTS/S)
116.0117.0119.0118.0110.0106.0107.0105.092.091.086.091.099.0103.0108.0120.0126.0126.0122.0118.0116.0117.0115.0112.0116.0121.0121.0120.0124.0123.0123.0119.0114.0117.0115.0110.0108.0110.0110.0110.0104.0101.0103.098.093.097.0108.0107.0107.088.095.0104.0118.0124.0117.0110.0108.0111.0110.0108.0
DEPTH(FT)
145014511452145314541455145614571458145914601461146214631464146514661467146814691470147114721473147414751476147714781479148014811482148314841485148614871488148914901491149214931494149514961497149814991500150115021503150415051506150715081509
GAMMA RAY(COUNTS/S)
109.0109.0105.0105.0101.096.092.089.088.091.091.091.095.0100.095.094.092.094.097.097.095.093.0100.0105.0107.0105.0106.0106.0110.0112.0111.0108.0105.0110.0116.0116.0118.0122.0120.0118.0120.0120.0120.0120.0119.0123.0125.0123.0120.0121.0121.0119.0117.0119.0118.0115.0110.0118.0124.0126.0
117
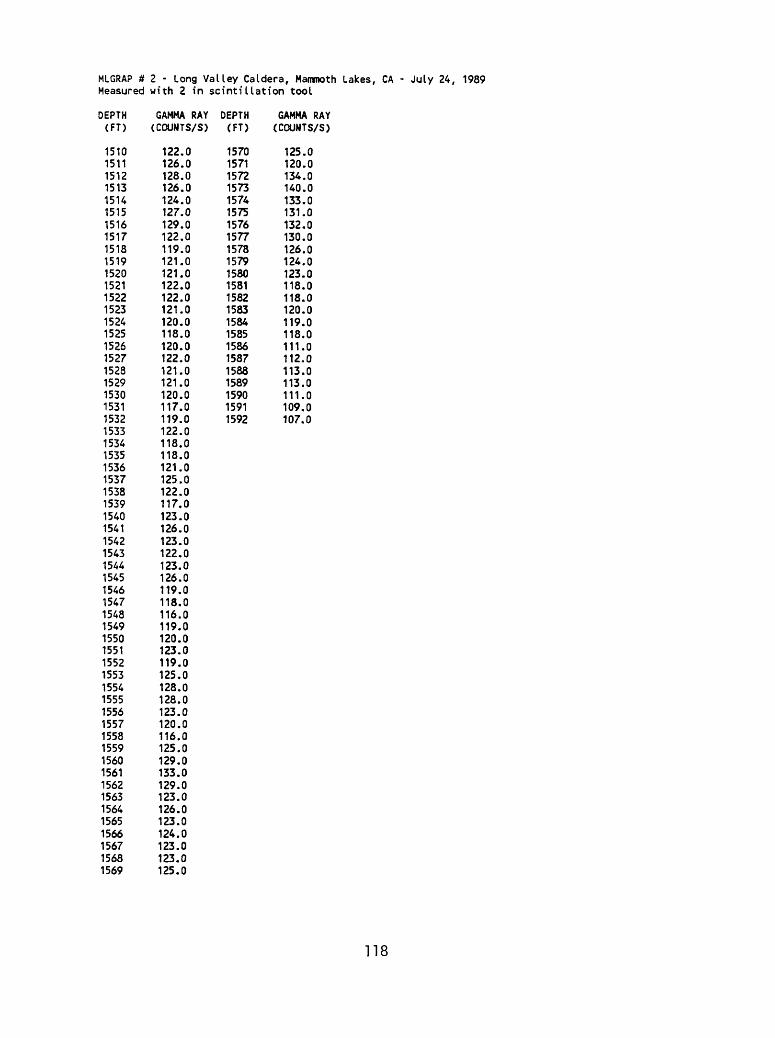
MLGRAP # 2 - Long Valley Caldera, Mammoth Lakes, CA - July 24, 1989 Measured with 2 in scintillation tool
DEPTH(FT)
151015111512151315141515151615171518151915201521152215231524152515261527152815291530153115321533153415351536153715381539154015411542154315441545154615471548154915501551155215531554155515561557155815591560156115621563156415651566156715681569
GAMMA RAY(COUNTS/S)
122.0126.0128.0126.0124.0127.0129.0122.0119.0121.0121.0122.0122.0121.0120.0118.0120.0122.0121.0121.0120.0117.0119.0122.0118.0118.0121.0125.0122.0117.0123.0126.0123.0122.0123.0126.0119.0118.0116.0119.0120.0123.0119.0125.0128.0128.0123.0120.0116.0125.0129.0133.0129.0123.0126.0123.0124.0123.0123.0125.0
DEPTH(FT)
15701571157215731574157515761577157815791580158115821583158415851586158715881589159015911592
GAMMA RAY(COUNTS/S)
125.0120.0134.0140.0133.0131.0132.0130.0126.0124.0123.0118.0118.0120.0119.0118.0111.0112.0113.0113.0111.0109.0107.0
118

MLGRAP # 2 - Long Valley Caldera, Mammoth Lakes, California - July 24, 1989 Measured with 2 in scintillation tool - corrected using Table 3.
DEPTH(FT)
101112131415161718192021222324252627282930313233343536373839404142434445464748495051525354555657585960616263646566676869
GAMMA RAY(COUNTS/S)
85.884.782.482.482.488.289.389.384.783.584.781.287.085.878.980.083.584.790.583.583.585.880.081.280.078.980.085.889.391.687.084.776.674.271.973.171.968.466.163.865.065.071.981.284.784.776.677.776.675.477.778.974.271.969.669.671.971.969.669.6
DEPTH(FT)
707172737475767778798081828384858687888990919293949596979899100101102103104105106107108109110111112113114115116117118119120121122123124125126127128129
GAMMA RAY(COUNTS/S)
70.874.270.869.669.671.970.868.465.068.473.174.274.276.676.674.265.065.063.866.174.274.274.270.881.284.783.585.889.396.389.391.689.390.591.692.895.194.094.091.689.389.391.691.687.094.092.888.289.390.584.783.580.085.883.581.269.662.656.854.5
DEPTH(FT)
130131132133134135136137138139140141142143144145146147148149150151152153154155156157158159160161162163164165166167168169170171172173174175176177178179180181182183184185186187188189
GAMMA RAY(COUNTS/S)
49.951.054.548.746.444.140.639.438.340.639.439.439.439.440.640.639.439.439.440.644.144.140.639.436.034.838.336.435.337.538.537.540.739.638.534.236.437.537.539.638.536.438.539.638.536.439.641.743.942.839.640.739.638.540.740.739.637.540.742.8
DEPTH(FT)
190191192193194195196197198199200201202203204205206207208209210211212213214215216217218219220221222223224225226227228229230231232233234235236237238239240241242243244245246247248249
GAMMA RAY(COUNTS/S)
42.841.743.946.044.943.948.251.452.452.440.043.943.140.851.689.3112.4121.7125.5126.3125.5107.873.163.959.353.149.347.742.439.334.729.327.025.425.425.425.425.426.227.026.226.227.026.227.027.726.223.922.321.622.323.926.226.227.729.335.453.159.363.1
DEPTH(FT)
250251252253254255256257258259260261262263264265266267268269270271272273274275276277278279280281282283284285286287288289290291292293294295296297298299300301302303304305306307308309
GAMMA RAY(COUNTS/S)
67.874.778.575.570.170.869.369.368.566.267.060.857.854.758.564.767.067.869.370.876.271.671.670.870.172.468.566.269.369.363.963.963.961.660.860.864.770.875.573.170.862.467.064.767.872.476.267.864.767.869.371.675.577.078.581.684.787.898.6107.0
119
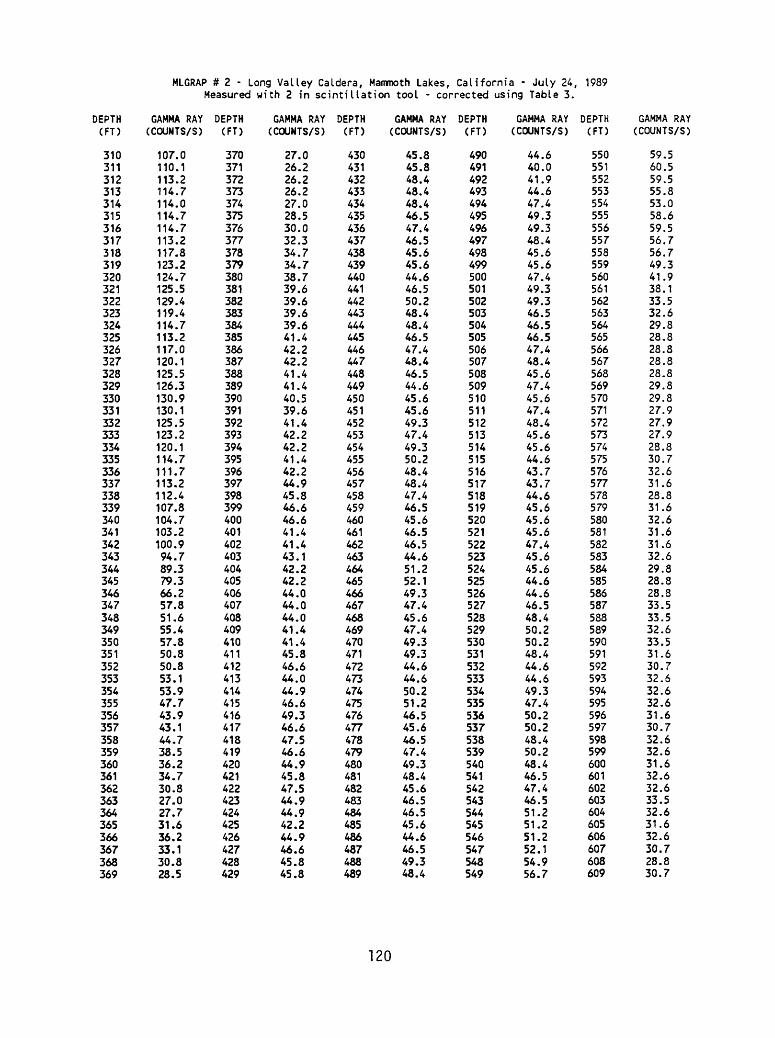
MLGRAP # 2 - Long Valley Caldera, Mammoth Lakes, California - July 24, 1989 Measured with 2 in scintillation tool - corrected using Table 3.
DEPTH(FT)
310311312313314315316317318319320321322323324325326327328329330331332333334335336337338339340341342343344345346347348349350351352353354355356357358359360361362363364365366367368369
GAMMA RAY(COUNTS/S)
107.0110.1113.2114.7114.0114.7114.7113.2117.8123.2124.7125.5129.4119.4114.7113.2117.0120.1125.5126.3130.9130.1125.5123.2120.1114.7111.7113.2112.4107.8104.7103.2100.994.789.379.366.257.851.655.457.850.850.853.153.947.743.943.144.738.536.234.730.827.027.731.636.233.130.828.5
DEPTH(FT)
370371372373374375376377378379380381382383384385386387388389390391392393394395396397398399400401402403404405406407408409410411412413414415416417418419420421422423424425426427428429
GAMMA RAY(COUNTS/S)
27.026.226.226.227.028.530.032.334.734.738.739.639.639.639.641.442.242.241.441.440.539.641.442.242.241.442.244.945.846.646.641.441.443.142.242.244.044.044.041.441.445.846.644.044.946.649.346.647.546.644.945.847.544.944.942.244.946.645.845.8
DEPTH(FT)
430431432433434435436437438439440441442443444445446447448449450451452453454455456457458459460461462463464465466467468469470471472473474475476477478479480481482483484485486487488489
GAMMA RAY(COUNTS/S)
45.845.848.448.448.446.547.446.545.645.644.646.550.248.448.446.547.448.446.544.645.645.649.347.449.350.248.448.447.446.545.646.546.544.651.252.149.347.445.647.449.349.344.644.650.251.246.545.646.547.449.348.445.646.546.545.644.646.549.348.4
DEPTH(FT)
490491492493494495496497498499500501502503504505506507508509510511512513514515516517518519520521522523524525526527528529530531532533534535536537538539540541542543544545546547548549
GAMMA RAY(COUNTS/S)
44.640.041.944.647.449.349.348.445.645.647.449.349.346.546.546.547.448.445.647.445.647.448.445.645.644.643.743.744.645.645.645.647.445.645.644.644.646.548.450.250.248.444.644.649.347.450.250.248.450.248.446.547.446.551.251.251.252.154.956.7
DEPTH(FT)
550551552553554555556557558559560561562563564565566567568569570571572573574575576577578579580581582583584585586587588589590591592593594595596597598599600601602603604605606607608609
GAMMA RAY(COUNTS/S)
59.560.559.555.853.058.659.556.756.749.341.938.133.532.629.828.828.828.828.829.829.827.927.927.928.830.732.631.628.831.632.631.631.632.629.828.828.833.533.532.633.531.630.732.632.632.631.630.732.632.631.632.632.633.532.631.632.630.728.830.7
120

MLGRAP # 2 - Long Valley Caldera, Mammoth Lakes, California - July 24, 1989 Measured with 2 in scintillation tool - corrected using Table 3.
DEPTH(FT)
610611612613614615616617618619620621622623624625626627628629630631632633634635636637638639640641642643644645646647648649650651652653654655656657658659660661662663664665666667668669
GAMMA RAY(COUNTS/S)
32.632.631.631.632.634.434.433.536.337.236.335.333.532.631.631.631.631.631.631.630.732.632.633.531.634.434.433.531.632.632.633.532.631.632.630.730.730.731.633.534.432.631.632.631.631.633.534.433.533.532.632.630.729.828.830.732.632.633.536.3
DEPTH(FT)
670671672673674675676677678679680681682683684685686687688689690691692693694695696697698699700701702703704705706707708709710711712713714715716717718719720721722723724725726727728729
GAMMA RAY(COUNTS/S)
38.136.333.531.635.334.434.434.433.532.631.630.731.632.632.633.532.632.633.535.333.532.632.632.633.534.434.436.336.335.335.335.333.533.533.535.338.140.040.940.039.137.237.240.040.039.140.040.037.234.432.637.237.237.237.238.136.336.336.336.3
DEPTH(FT)
730731732733734735736737738739740741742743744745746747748749750751752753754755756757758759760761762763764765766767768769770771772773774775776777778779780781782783784785786787788789
GAMMA RAY(COUNTS/S)
37.237.240.040.937.237.236.336.336.339.138.136.335.334.435.336.335.336.337.238.140.039.137.237.237.237.236.335.336.335.336.338.140.040.940.038.137.238.138.137.234.434.436.337.238.139.140.036.335.335.335.336.337.238.138.137.236.337.236.337.2
DEPTH(FT)
790791792793794795796797798799800801802803804805806807808809810811812813814815816817818819820821822823824825826827828829830831832833834835836837838839840841842843844845846847848849
GAMMA RAY(COUNTS/S)
38.138.138.138.138.138.138.139.140.940.038.137.238.139.140.038.139.141.941.940.940.942.841.939.140.042.844.643.740.937.231.631.630.730.730.730.731.631.630.729.829.827.027.027.927.927.928.828.827.928.830.731.630.729.828.829.827.927.927.931.6
DEPTH(FT)
850851852853854855856857858859860861862863864865866867868869870871872873874875876877878879880881882883884885886887888889890891892893894895896897898899900901902903904905906907908909
GAMMA RAY(COUNTS/S)
32.632.630.729.828.829.829.830.732.631.630.728.829.829.829.830.731.631.632.634.434.432.631.630.730.730.730.728.828.829.830.731.631.631.631.630.730.731.631.630.728.827.029.837.248.472.594.998.6
103.2108.8108.8108.8111.6110.7112.5112.5112.5108.8110.7109.7
121

MLGRAP # 2 - Long Valley Caldera, Mammoth Lakes, California - July 24, 1989 Measured with 2 in scintillation tool - corrected using Table 3.
DEPTH(FT)
910911912913914915916917918919920921922923924925926927928929930931932933934935936937938939940941942943944945946947948949950951952953954955956957958959960961962963964965966967968969
GAMMA RAY(COUNTS/S)
107.9103.2109.7107.9107.9102.399.5103.2108.8108.8109.7111.6106.097.792.186.589.388.481.874.472.574.475.376.378.180.088.491.193.096.799.5100.498.699.593.993.998.699.5100.496.796.799.5100.4101.499.598.696.796.7103.2105.1104.2103.2101.4101.4101.499.5105.1107.0107.0104.2
DEPTH(FT)
970971972973974975976977978979980981982983984985986987988989990991992993994995996997998999100010011002100310041005100610071008100910101011101210131014101510161017101810191020102110221023102410251026102710281029
GAMMA RAY(COUNTS/S)
104.2110.7116.3119.0125.6125.6129.3124.6122.8118.1120.0119.0116.3118.1119.0115.3114.4122.8120.9117.2121.8120.9123.7124.6121.8120.9120.9120.0125.6128.3132.1133.0130.2131.1131.1128.3130.2129.3131.1129.3130.2133.0132.1130.2126.5123.7120.9119.0121.8125.6125.6120.0121.8120.0120.0121.8119.0116.3119.0118.1
DEPTH(FT)
103010311032103310341035103610371038103910401041104210431044104510461047104810491050105110521053105410551056105710581059106010611062106310641065106610671068106910701071107210731074107510761077107810791080108110821083108410851086108710881089
GAMMA RAY(COUNTS/S)
117.2115.3115.3120.0122.8124.6129.3133.9133.9124.6123.7120.0120.0123.7120.9110.793.981.876.378.174.474.476.377.278.176.376.375.376.378.180.084.684.682.881.883.781.882.880.078.181.882.882.884.685.686.585.681.881.880.983.783.781.880.982.889.390.291.188.486.5
DEPTH(FT)
109010911092109310941095109610971098109911001101110211031104110511061107110811091110111111121113111411151116111711181119112011211122112311241125112611271128112911301131113211331134113511361137113811391140114111421143114411451146114711481149
GAMMA RAY(COUNTS/S)
87.487.490.288.489.389.392.193.0100.4103.2105.1104.297.792.193.096.795.8101.499.598.694.992.191.192.190.293.094.999.5107.0110.7116.3115.3107.995.894.998.693.992.189.388.491.193.092.188.485.684.684.684.684.680.076.373.553.032.622.318.628.849.379.186.5
DEPTH(FT)
115011511152115311541155115611571158115911601161116211631164116511661167116811691170117111721173117411751176117711781179118011811182118311841185118611871188118911901191119211931194119511961197119811991200120112021203120412051206120712081209
GAMMA RAY(COUNTS/S)
93.096.7102.3104.2107.9109.7108.8108.8111.6111.6107.0107.0108.8110.7108.8105.1102.3100.4106.0106.0103.2102.395.884.683.789.394.9102.3110.7126.5122.8111.6118.1129.3132.1131.1133.0129.3131.1134.9134.9130.2125.6115.3114.4112.5114.4112.5109.7108.8108.8107.9104.2101.4101.4101.4101.4100.498.699.5
122

MLGRAP # 2 - Long Valley Caldera, Mammoth Lakes, California - July 24, 1989 Measured with 2 in scintillation tool - corrected using Table 3.
DEPTH(FT)
121012111212121312141215121612171218121912201221122212231224122512261227122812291230123112321233123412351236123712381239124012411242124312441245124612471248124912501251125212531254125512561257125812591260126112621263126412651266126712681269
GAMMA RAY(COUNTS/S)
99.5103.2108.8112.5108.8107.9109.7110.7109.7105.1100.497.795.897.795.894.9106.0107.9107.9104.296.793.0106.0105.1102.3106.0117.2119.0111.6111.6110.7110.7110.7109.7111.6107.0110.7109.7107.0109.7111.6117.2118.1115.3111.6110.7107.0107.9105.1102.3101.497.7101.4103.2106.0107.9111.6114.4116.3110.7
DEPTH(FT)
127012711272127312741275127612771278127912801281128212831284128512861287128812891290129112921293129412951296129712981299130013011302130313041305130613071308130913101311131213131314131513161317131813191320132113221323132413251326132713281329
GAMMA RAY(COUNTS/S)
117.2114.4108.8101.499.5105.1104.2107.0103.2107.0103.2104.2103.2103.2106.0101.4105.1105.1106.0107.0111.6111.6109.7110.7109.7107.9109.7110.7115.3112.5113.5110.7109.7102.3101.499.597.799.598.6100.4103.2106.0106.0102.3105.1105.1100.499.5103.2104.2106.0106.0105.1105.1107.9108.8107.9112.5111.6107.0
DEPTH(FT)
133013311332133313341335133613371338133913401341134213431344134513461347134813491350135113521353135413551356135713581359136013611362136313641365136613671368136913701371137213731374137513761377137813791380138113821383138413851386138713881389
GAMMA RAY(COUNTS/S)
108.8107.9108.8107.0105.1107.9105.1102.3102.3101.4106.0110.7108.8101.4103.2107.9110.7108.8111.6114.4116.3116.3110.7109.7111.6114.4119.0117.2110.7109.7112.5123.7126.5119.0115.3109.7107.9107.9104.2105.1107.0104.2110.7108.8107.9104.2106.0107.0105.1107.0108.8114.4119.0121.8117.2112.5109.7113.5112.5107.0
DEPTH(FT)
139013911392139313941395139613971398139914001401140214031404140514061407140814091410141114121413141414151416141714181419142014211422142314241425142614271428142914301431143214331434143514361437143814391440144114421443144414451446144714481449
GAMMA RAY(COUNTS/S)
107.9108.8110.7109.7102.398.699.597.785.684.680.084.692.195.8100.4111.6117.2117.2113.5109.7107.9108.8107.0104.2107.9112.5112.5111.6115.3114.4114.4110.7106.0108.8107.0102.3100.4102.3102.3102.396.793.995.891.186.590.2100.499.599.581.888.496.7109.7115.3108.8102.3100.4103.2102.3100.4
DEPTH(FT)
145014511452145314541455145614571458145914601461146214631464146514661467146814691470147114721473147414751476147714781479148014811482148314841485148614871488148914901491149214931494149514961497149814991500150115021503150415051506150715081509
GAMMA RAY(COUNTS/S)
101.4101.497.797.793.989.385.682.881.884.684.684.688.493.088.487.485.687.490.290.288.486.593.097.799.597.798.698.6102.3104.2103.2100.497.7102.3107.9107.9109.7113.5111.6109.7111.6111.6111.6111.6110.7114.4116.3114.4111.6112.5112.5110.7108.8110.7109.7107.0102.3109.7115.3117.2
123

MLGRAP # 2 - Long Valley Caldera, Mammoth Lakes, California - July 24, 1989 Measured with 2 in scintillation tool - corrected using Table 3.
DEPTH(FT)
151015111512151315141515151615171518151915201521152215231524152515261527152815291530153115321533153415351536153715381539154015411542154315441545154615471548154915501551155215531554155515561557155815591560156115621563156415651566156715681569
GAMMA RAY(COUNTS/S)
113.5117.2119.0117.2115.3118.1120.0113.5110.7112.5112.5113.5113.5112.5111.6109.7111.6113.5112.5112.5111.6108.8110.7113.5109.7109.7112.5116.3113.5108.8114.4117.2114.4113.5114.4117.2110.7109.7107.9110.7111.6114.4110.7116.3119.0119.0114.4111.6107.9116.3120.0123.7120.0114.4117.2114.4115.3114.4114.4116.3
DEPTH(FT)
15701571157215731574157515761577157815791580158115821583158415851586158715881589159015911592
GAMMA RAY(COUNTS/S)
116.3111.6124.6130.2123.7121.8122.8120.9117.2115.3114.4109.7109.7111.6110.7109.7103.2104.2105.1105.1103.2101.499.5
124

APPENDIX V
MLGRAP # 1 - Natural gamma-ray plotsJuly 23, 1989 - uncorrected ....................... 126July 23, 1989 - corrected ........................ 127
MLGRAP # 2 - Natural gamma-ray plotsJuly 24, 1989 - uncorrected ....................... 128July 24, 1989 - corrected ........................ 129
125

00
GAMMA RAY CCOUNTS/SD
50 100 150 200
00
CO
2 200 h-LJ
£300LJ
400
500
W.L. HOLE?
Figure V-l. Plot of natural 7-ray in counts/s for MLGRAP # 1. Data digitized at 1 ft (0.3 m) intervals from a strip-chart recording. Symbols shown: W.L. (----) - water level (at 10 m) measured in 2.75 in outside diameter (O.D.) tubing; A (-.-.-)- bottom (at 86 m) of 4.50 in O.D. tubing; Bl and B2 (- - -)- top (at 68.6 m) and bottom (at 163 m) of 3.50 in O.D. tubing; C (-.-.-)- bottom (at 446 m) of 2.375 in O.D. tubing; W.L. HOLE? ( )- apparent water level (at 143 m) in uncased hole. Top of casings A and C at surface. Multiply counts/s by 0.9 to convert to API units. Data obtained July 23, 1989.
126

0
GAMMA CCOUNTS/S:
50 100 150
100 -
CO
£ 200I-LJ
£300UJ
400 -
W.L. HOLE?
200
500
Figure V-2. Plot of natural "/-ray in counts/s for MLGRAP # 1 from figure V-l cor rected for hole diameter, casing and cement (Schlumberger, 1975, p. 66). Parameters used to determine corrections listed in Table 2. Symbols as in figure V-l.
127

00
GAMMA RAY CCOUNTS/S:
50 100 150 200
100
CO
h-LJ
200
£300LJ
400
500
Figure V-3. Plot of natural 7-ray in counts/s for MLGRAP # 2. Data digitized at 1 ft (0.3 m) intervals from a strip-chart recording. Symbols shown: W.L. (----)- water level (at 132 m) measured in 2.75 in outside diameter (O.D.) tubing; A (-----)- bottom (at 61 m) of 4.50 in O.D. tubing; B (-.-.-). bottom (at 488 m) of 2.75 in O.D. tubing. Top of tubings A and B at surface. Multiply counts/s by 0.9 to convert to API units. Data obtained July 24, 1989.
128

00
GAMMA CCOUNTS/SH
50 100 150 200
100
CO
h- LJ
£LU Q
200
300
400
500
B
Figure V-4. Plot of natural "y-ray in counts/s for MLGRAP # 2 from figure V-3 cor rected for hole diameter, casing and cement (Schlumberger, 1975, p. 66). Parameters used to determine corrections listed in Table 3. Symbols as in figure V-3.
129

APPENDIX VI
National Institute of Standards and Technology (NIST) traceable certificationsGuildline 9540 Platinum Thermometer ................. 131Fluke 8502A Digital Multimeter .................... 132
130

GuJld//ne Calibration ServicesA Prime Standards Laboratory
CERTIFICATE OF CONFORMANCE
CUSTOMER NAME. ............. U.S. GEOLOGICAL SURVEYINSTRUMENT MANUFACTURER. . . . GUILDLINE INSTRUMENT INC.TYPE NUMBER. ............... 9540SERIAL NUMBER. ............. 53198
TEMPERATURE. ............... 23°C ± .5°CHUMIDITY................... 50% ±5%
INSTRUMENT RECEIVED........ IN TOLERANCE X OUT OF TOL.
GUILDLINE INSTRUMENTS INCORPORATED Certifies that the above listed instrument complies with the published Manufacturer's specifications and has been calibrated against standards maintained in Guildline's Orlando, Pi., Standards laboratory. These Standards are directly traceable to the U.S. DEPT. OF COMMERCE NATIONAL INSTITUTE OF STANDARDS AND TECHNOLOGY (NIST) and are used and maintained in accordance with MIL-STANDARD 45662A.
Methods of manufacture and test ensure conformity with the highest Quality Control Standards consistent with the operational requirements of the instrument. Test results are maintained on file and are available for inspections.
Applicable NBS Test numbers are :
DC VOLTAGE............521/243031 01/19/89AC VOLTAGE............521/240585 11/02/87RESISTANCE............521/242831 11/30/88TEMPERATURE...........521/241688 05/16/88
Out of tolerance data (if applicable) is shown on attached sheet.
DATE CALIBRATED............ FEB. 28, 1989DATE DUE. .................. FEB. 28, 1991)
CALIBRATED BY. ............. PCK
APPROVED BYlan King, Charif Metrologist.
REPORT # 018
Guildline Instruments Inc., 4403 Vineland Road, Suite B10. Orlando. Florida 32811-7335 (407) 423-8215 Telex: 856443 FAX (407) 422-5987
131

HONEYWELL INSTRUMENTATION SUPPORT
Certificate *: 8606055100001 PAGE 1 OF 1
CERTIFICATE OF CALIBRATIONSubmitted By: U.S. GEOLOGICAL SURVEY
GOLDEN, CO
Manufacturer FLUKE Nomenclature: DIGITAL MULTIMETER
Model Number: 85O2A Serial Number 2165006 Asset Number:
HONEYWELL INC certifies that this instrument has been calibrated using standards and instruments which are traceable to the (IS. National Bureau of Standards. The standards and instruments used in the calibration are supported by a system which meets or exceeds the requirements of MIL-STD-45662. Supporting documentation relative to traceability is on file at this office, and is available for examination upon request.
MANUFACTURER GOULD HONEYWELL
MODEL DE5C S/N9152A STD CELL ENCLOSURE21971119O STD RES 1. Ohm M3075
DATE DUE 03 02-89 11-07-91
This instrument has been calibrated in terms of the standards maintained at this laboratory, and was returned:
( ) within manufacturer's specified accuracy
Calibration date: 02-14-39% Rel. Humidity: 137.
Temperature: 73 pTest Report *: 860. 43300
Recall Date : OS-14-89
TESTAC VOLTAGE CAPACITANCE DC VOLTAGE INDUCTANCE MAGNETICS RESISTANCEEMPERATURE TIME & FREQ
REPORT NUMBERS 2369S4 23S27S 2406S8 241075 721/221693 24O735 231405 NBS XMISSION
11-12-3701-07-8702-02-88 02-10-88 10-04-79 12-30-87 10-02-83,
J132