Embed Size (px)
Citation preview
Contents
Approved by USDA’s World Agricultural
Outlook Board
Introduction . . . . . . . . . . . . . . . . . . 2
Determinants of World Sugar Prices . . . . . . . . . . . . . . . . . . . . . . . 3
Brazil, Sugar Production Costs, and the World Sugar Market . . . 4
Supply-Demand Imbalance in the World Sugar Market . . . . . 9
Uncertainty in Forecasting the World Sugar Market . . . . . . . . . 11
Regression Analysis . . . . . . . . . . . 13
Regression Results . . . . . . . . . . . . 15
Conclusions . . . . . . . . . . . . . . . . . . 19
References . . . . . . . . . . . . . . . . . . . 20
Appendix tables . . . . . . . . . . . . . . 21
United StatesDepartmentof Agriculture
www.ers.usda.gov
A Report from the Economic Research Service
Abstract
From the perspective of U .S . sugar policy, there is increased interest in world sugar prices because world prices have been above domestic price support levels since 2009 and are forecast by the Organisation for Economic Co-operation and Development to remain above current support levels through 2021 . Understanding the dynamics that affect the world price of sugar is the new imperative for U .S . sugar policy . There are three basic determinants of medium- to long-term world raw sugar pricing . The first is the long-term equilibrium relationship between world raw sugar prices and costs of producing sugar in Brazil, the world’s largest sugar producer and exporter . An important effect on costs operates through the Brazilian currency exchange rate with the U .S . dollar . The second is the effect of medium-term world sugar supply-demand imbalances on pricing . Two important measures from the U .S . Department of Agriculture’s world sugar Production, Supply, and Distribution (PSD) database are derived to show that relative stockholding has an important effect on the sensitivity of the world sugar prices to changes in overall world sugar availability . The third determinant is a risk-related component: how current prices are affected by errors in forecasting supply and demand balances of previous years due to unanticipated events . The world sugar price includes a premium when there is a recent history of sugar deficits larger than what was initially predicted and conversely, a discount when there were surpluses larger than predicted .
Keywords: World sugar prices, raw sugar, Production, Supply, and Distribution (PSD), Organisation for Economic Co-operation and Development, OECD, Food and Agricultural Organization, FAO
Acknowledgments
The author appreciates the many helpful comments and suggestions made by the following individuals: Carlos Arnade, Lynn Kennedy, Barbara Fecso, Ronald Lord, Rip Landes, Mark Jekanowski, and Donna Roberts . The author also appreciates the excellent editing provided by Priscilla Smith and excellent design by Wynnice Pointer-Napper .
SSS-M-297-01
May 2013
Stephen Haley, [email protected]
World Raw Sugar Prices The Influence of Brazilian Costs of Production and World Surplus/ Deficit Measures
2 World Raw Sugar Prices, SSS-M-297-01
Economic Research Service/USDA
Introduction
There is increased interest in world sugar prices and their effect on the U .S . sugar market . In the past, interest has been limited, especially among policymakers, because world sugar prices have been below levels at which the U .S . sugar program supports domestic prices . However, from August 2009 through July 2012, world prices for raw sugar averaged 24 .28 cents per pound, or more than 5 cents per pound above the U .S . raw sugar loan rate .1 During this same time period, U .S . raw sugar prices averaged 35 .26 cents per pound, far above the 21-cents-per-pound average from January 2000 through July 2009 . The Organisation for Economic Co-operation and Development (OECD) and the United Nations’ Food and Agricultural Organization (FAO) now jointly project world raw sugar prices to average 21 .58 cents per pound from 2012/13 through 2021/22, compared with an average of only 9 .3 cents per pound from 2000-2008 (OECD/FAO, 2012) . There is, therefore, increased likelihood that U .S . sugar prices will be more supported by world prices than by domestic, legislatively set loan rates . Consistent with pricing relationships of the last 3 years, the margin between U .S . and world raw sugar prices is likely to be the policy-relevant indicator of internal U .S . supply-demand balance . Also, an important implication is that U .S . Federal budget expenditures on the sugar program are likely to be small, if not zero, for the foreseeable future .
The goal here is to better understand the dynamics affecting the world price of raw sugar . Although there are a myriad of factors behind raw sugar pricing, this analysis focuses on a small set important for explaining developments over the medium term to long term . Although world prices are much higher now than they were in the past, this is not necessarily a sign that a structural change has taken place, or that there is some new dynamic not present in prior periods . The goal is to analyti-cally determine the various relationships underlying sugar pricing . A better understanding of the dynamics of world sugar pricing will, in turn, help make better predictions of future price support to U .S . sugar producers .
1The world raw sugar price is the average of daily quotes of the nearby No . 11 raw sugar futures contract on the Inter-continental Exchange (ICE) in New York . The U .S . raw sugar price is the average of quotes of the nearby ICE No . 16 raw sugar futures contract .
3 World Raw Sugar Prices, SSS-M-297-01
Economic Research Service/USDA
Determinants of World Sugar Prices
There are three basic determinants of medium- to long-term world raw sugar pricing, according to this hypothesis . The first is the long-term relationship of raw sugar pricing to the costs of producing sugar in the Center/South region of Brazil . Because Brazil is the world’s largest sugar producer and exporter, events occurring within Brazil have direct effects on the world market . The cost of producing sugar in Center/South Brazil turns out to be the key variable . This analysis will establish that there is a long-term equilibrium relationship between the world sugar price and costs of production in Brazil, and that the Brazilian currency exchange rate with the U .S . dollar also plays a large role .
The second hypothesized determinant is the effect of medium-term, or year-long, world sugar supply-demand imbalances on pricing . Using world sugar supply and use data from the U .S . Department of Agriculture (USDA), Foreign Agricultural Service’s Production, Supply and Distribution (PSD) database, two variables are constructed for analysis . The first is a direct measure of total world sugar production minus total consumption . Year-to-year changes in this surplus/deficit measure would be expected to have an inverse relationship with changes in price . Another closely related variable is the ratio of world sugar stocks to total world consumption . Stockholding behavior influences the magnitude of the effect that world sugar surpluses/deficits have on actual exports and imports . This analysis estimates the effect that relative stockholding has on the sensi-tivity of the world sugar price to changes in overall world sugar availability .2
The third determinant is a risk-related component: how current prices are affected by errors in forecasting supply-and-demand balances in previous years . The proxy variable measuring this component is the difference between initial forecasts of world sugar surplus/deficits and the final estimate made well after the end of the crop year, both from the USDA PSD database . This report will present evidence that the world sugar price includes a premium when there is a recent history of sugar deficits larger than what was initially predicted and conversely, a discount when there were surpluses larger than predicted .
2It is noted that USDA’s PSD database does not provide an aggregate sugar surplus/deficit balance or ending stocks level estimate as of a certain date, but rather the sum of the balances and ending stocks from whatever is the last date of the crop year for each country in the dataset . Further research could use as an alternative a dataset that reports sugar balances and stocks as of a fixed date, such as that available from commercially based consultants like LMC International or F .O . Licht .
4 World Raw Sugar Prices, SSS-M-297-01
Economic Research Service/USDA
Brazil, Sugar Production Costs, and the World Sugar Market
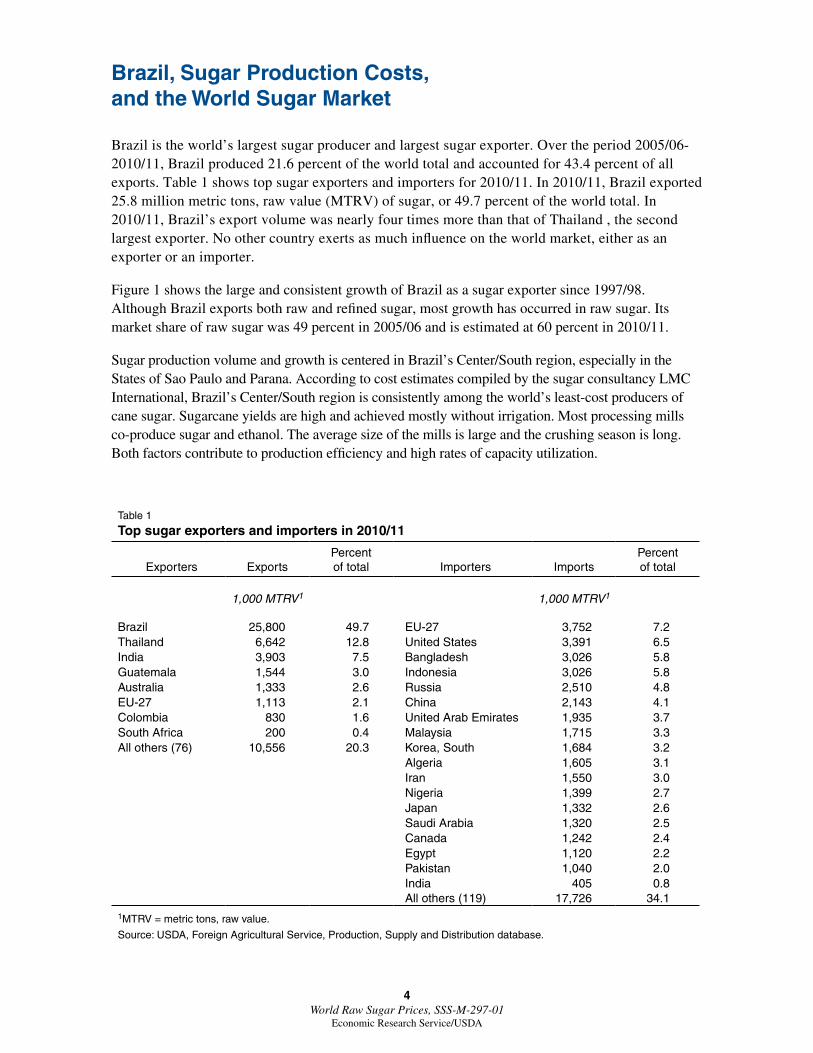
Brazil is the world’s largest sugar producer and largest sugar exporter . Over the period 2005/06-2010/11, Brazil produced 21 .6 percent of the world total and accounted for 43 .4 percent of all exports . Table 1 shows top sugar exporters and importers for 2010/11 . In 2010/11, Brazil exported 25 .8 million metric tons, raw value (MTRV) of sugar, or 49 .7 percent of the world total . In 2010/11, Brazil’s export volume was nearly four times more than that of Thailand , the second largest exporter . No other country exerts as much influence on the world market, either as an exporter or an importer .
Figure 1 shows the large and consistent growth of Brazil as a sugar exporter since 1997/98 . Although Brazil exports both raw and refined sugar, most growth has occurred in raw sugar . Its market share of raw sugar was 49 percent in 2005/06 and is estimated at 60 percent in 2010/11 .
Sugar production volume and growth is centered in Brazil’s Center/South region, especially in the States of Sao Paulo and Parana . According to cost estimates compiled by the sugar consultancy LMC International, Brazil’s Center/South region is consistently among the world’s least-cost producers of cane sugar . Sugarcane yields are high and achieved mostly without irrigation . Most processing mills co-produce sugar and ethanol . The average size of the mills is large and the crushing season is long . Both factors contribute to production efficiency and high rates of capacity utilization .
Table 1
Top sugar exporters and importers in 2010/11
Exporters ExportsPercent of total Importers Imports
Percent of total
1,000 MTRV1 1,000 MTRV1
Brazil 25,800 49.7 EU-27 3,752 7.2Thailand 6,642 12.8 United States 3,391 6.5India 3,903 7.5 Bangladesh 3,026 5.8Guatemala 1,544 3.0 Indonesia 3,026 5.8Australia 1,333 2.6 Russia 2,510 4.8EU-27 1,113 2.1 China 2,143 4.1Colombia 830 1.6 United Arab Emirates 1,935 3.7South Africa 200 0.4 Malaysia 1,715 3.3All others (76) 10,556 20.3 Korea, South 1,684 3.2
Algeria 1,605 3.1Iran 1,550 3.0Nigeria 1,399 2.7Japan 1,332 2.6Saudi Arabia 1,320 2.5Canada 1,242 2.4Egypt 1,120 2.2Pakistan 1,040 2.0India 405 0.8All others (119) 17,726 34.1
1MTRV = metric tons, raw value.
Source: USDA, Foreign Agricultural Service, Production, Supply and Distribution database.

5 World Raw Sugar Prices, SSS-M-297-01
Economic Research Service/USDA
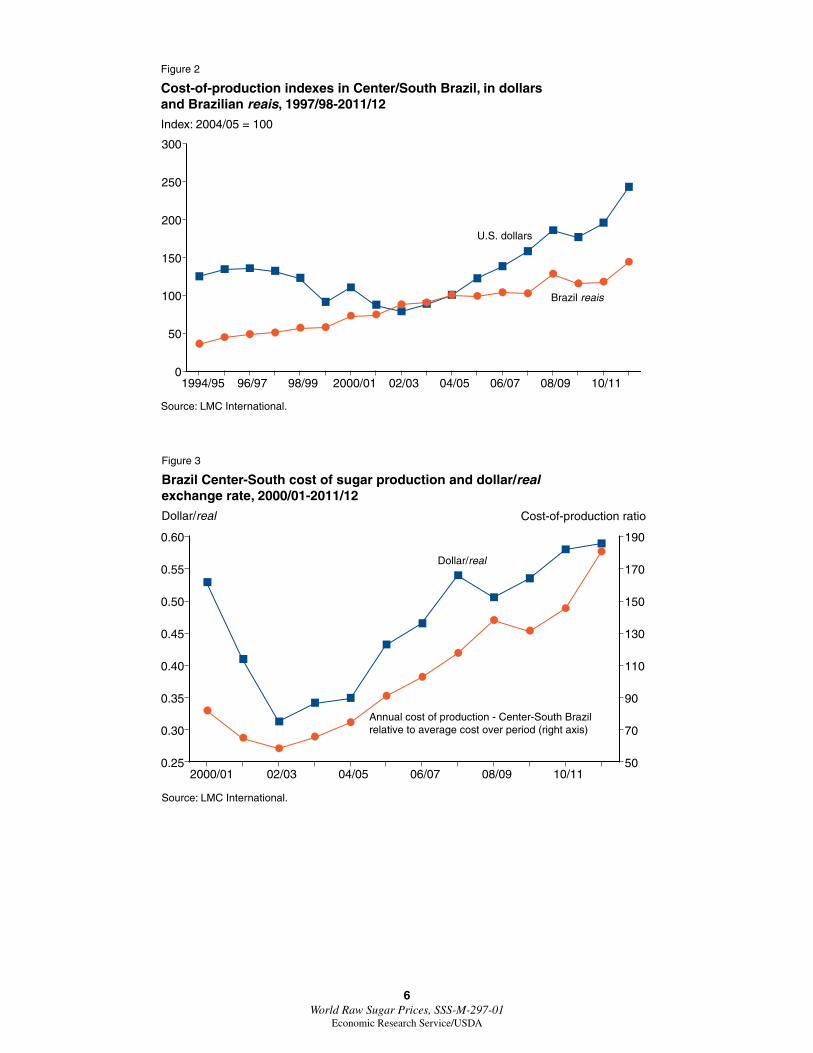
Although Center/South sugar production is very efficient and low cost, costs in dollar terms have increased substantially since 2003/04 (fig . 2) . According to LMC International, the main reason has been the appreciation in the Brazilian currency, the real, in inflation-adjusted terms . Figure 2 shows that costs measured in domestic currency have trended up gradually and consistently since the mid-1990s . Cost reductions in dollar terms were present until 2002/03 when the real was depreciating . Since 2002/03, however, dollar costs have increased about 210 percent while real costs increased only 64 percent . As shown in figure 3, the exchange rate has appreciated roughly in line with the dollar costs, about 88 percent since 2002/03 .
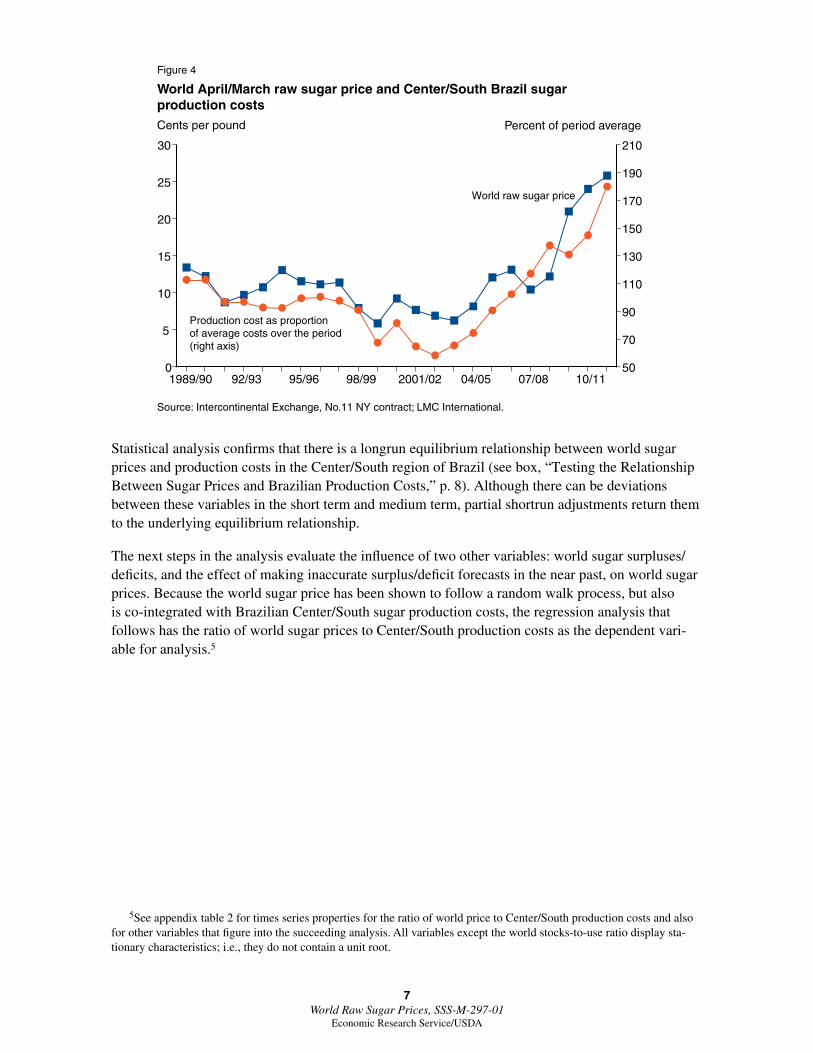
A key hypothesis of this analysis is that changes in Center/South production costs, measured in U .S . currency, are transmitted to the world market through their direct effect on world sugar prices, which are measured in U .S . currency . This occurs because Brazil’s large share of the market implies that its costs typically will be covered if import demand is to be met .3 The relationship between Center/South production costs and the world price is illustrated in figure 4 . The world price is the April/March average of the daily nearby No . 11 futures price, and the Center/South production cost index is made up of the annual cost estimates divided by the 23-year average cost . The two series track closely (correlation coefficient = 0 .88) . Although not immediately discernible from the figure, Center/South production costs are below the world price series in 17 out of 23 years . The only other export competitor that comes close to Brazil for low costs is Guatemala, where costs are below world prices 15 out of 23 years . During the 7-year period 1998/99 through 2004/05, when world sugar prices were in single digits, Center/South costs were below the world price 4 times . Guatemala costs were below only once and no other major exporter had costs below prices at any time during this period .4
3It is implicitly assumed that Brazil has constant returns to scale technology in sugar production . Its longrun sugar excess supply curve is flat (that is, perfectly elastic) . This would mean that over the long term, changes in demand do not determine the longrun world sugar price .
4From 1989/90 through 2011/12, sugar production costs were below world prices this many times for the following sugar exporters: Australia: 11 times; Colombia: 10 times; Thailand: 6 times; South Africa: 4 times .
Figure 1
Brazil share of world sugar exports, 1997/98-2012/13Percent
Source: USDA, Foreign Agricultural Service, Production, Supply and Distribution database.
Brazil share of world sugar exports
Brazil share of world raw sugar exports
1990/9192/93 94/95 96/97 98/99 2000/0102/03 04/05 06/07 08/09 10/11 12/130
10
20
30
40
50
60
70
Brazil share of world refined sugar exports
6 World Raw Sugar Prices, SSS-M-297-01
Economic Research Service/USDA
Figure 2
Cost-of-production indexes in Center/South Brazil, in dollars and Brazilian reais, 1997/98-2011/12Index: 2004/05 = 100
Source: LMC International.
U.S. dollars
Brazil reais
1994/95 96/97 98/99 2000/01 02/03 04/05 06/07 08/09 10/110
50
100
150
200
250
300
Figure 3
Brazil Center-South cost of sugar production and dollar/real exchange rate, 2000/01-2011/12Dollar/real
Source: LMC International.
Annual cost of production - Center-South Brazil relative to average cost over period (right axis)
Dollar/real
Cost-of-production ratio
2000/01 02/03 04/05 06/07 08/09 10/110.25
0.30
0.35
0.40
0.45
0.50
0.55
0.60
50
70
90
110
130
150
170
190
7 World Raw Sugar Prices, SSS-M-297-01
Economic Research Service/USDA
Statistical analysis confirms that there is a longrun equilibrium relationship between world sugar prices and production costs in the Center/South region of Brazil (see box, “Testing the Relationship Between Sugar Prices and Brazilian Production Costs,” p . 8) . Although there can be deviations between these variables in the short term and medium term, partial shortrun adjustments return them to the underlying equilibrium relationship .
The next steps in the analysis evaluate the influence of two other variables: world sugar surpluses/deficits, and the effect of making inaccurate surplus/deficit forecasts in the near past, on world sugar prices . Because the world sugar price has been shown to follow a random walk process, but also is co-integrated with Brazilian Center/South sugar production costs, the regression analysis that follows has the ratio of world sugar prices to Center/South production costs as the dependent vari-able for analysis .5
5See appendix table 2 for times series properties for the ratio of world price to Center/South production costs and also for other variables that figure into the succeeding analysis . All variables except the world stocks-to-use ratio display sta-tionary characteristics; i .e ., they do not contain a unit root .
Figure 4
World April/March raw sugar price and Center/South Brazil sugar production costsCents per pound
Source: Intercontinental Exchange, No.11 NY contract; LMC International.
Production cost as proportion of average costs over the period (right axis)
World raw sugar price
Percent of period average
1989/90 92/93 95/96 98/99 2001/02 04/05 07/08 10/110
5
10
15
20
25
30
50
70
90
110
130
150
170
190
210
8 World Raw Sugar Prices, SSS-M-297-01
Economic Research Service/USDA
A strong correlation between world prices and the Center/South production costs is not sufficient to support an equilibrium relationship between the two variables . Statistical analyses of both variables indicate that they are nonstationary; that is, their means and variances are not independent of time, a necessary condition for use of variables in econometric regression equations and other statistical analysis .
Nonstationary variables display characteristics of a random walk process—in formal terms, they are said to contain a unit root, implying that their variances grow to infinity over time . In the random walk process, a variable fails to revert to a population mean . That said, however, a linear combination of two or more nonstationary variables may be stationary (Engle and Granger, 1987) . Such variables are cointegrated . The interpretation given to the relationship between cointegrated variables is that there exists a longrun equilibrium relationship between them—they tend to move together over time . Pindyck and Rubinfeld provide this illustration: consider that two variables xt and yt are random walks but the variable zt = xt - λyt is stationary . The random walk variables xt and yt are termed as cointegrated and λ is the cointegrating parameter (Pindyck and Rubinfeld, 1998) .
The cointegrated relationship just described is shown to apply to world sugar prices and Center/South production costs . Formal testing results are shown in appendix table 1 . The results confirming the cointegration of the two variable series lead directly to the conclusion that there is a longrun equilibrium relationship between them . Although there can be deviations between these variables in the short term and medium term, there exist partial shortrun adjustments that return them to the underlying equilibrium relationship .
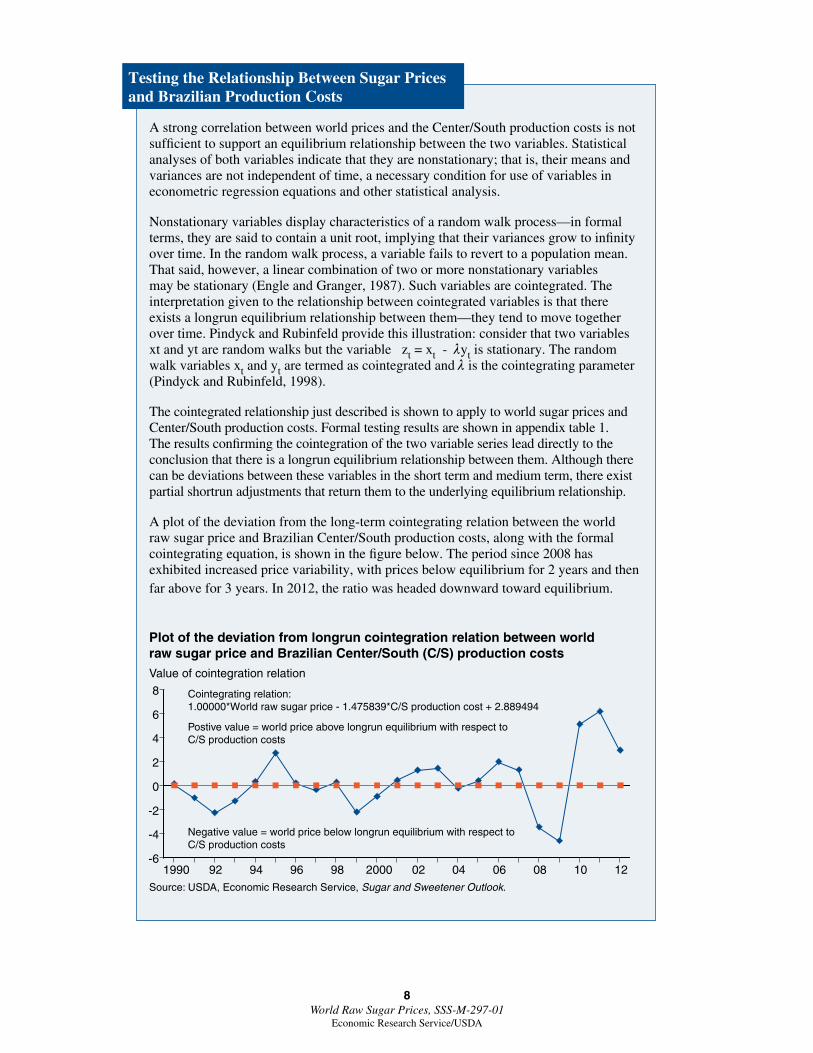
A plot of the deviation from the long-term cointegrating relation between the world raw sugar price and Brazilian Center/South production costs, along with the formal cointegrating equation, is shown in the figure below . The period since 2008 has exhibited increased price variability, with prices below equilibrium for 2 years and then far above for 3 years . In 2012, the ratio was headed downward toward equilibrium .
Testing the Relationship Between Sugar Prices and Brazilian Production Costs
Plot of the deviation from longrun cointegration relation between world raw sugar price and Brazilian Center/South (C/S) production costsValue of cointegration relation
Source: USDA, Economic Research Service, Sugar and Sweetener Outlook.
Negative value = world price below longrun equilibrium with respect toC/S production costs
Cointegrating relation:1.00000*World raw sugar price - 1.475839*C/S production cost + 2.889494
Postive value = world price above longrun equilibrium with respect toC/S production costs
1990 92 94 96 98 2000 02 04 06 08 10 12-6
-4
-2
0
2
4
6
8
9 World Raw Sugar Prices, SSS-M-297-01
Economic Research Service/USDA
Supply-Demand Imbalance in the World Sugar Market
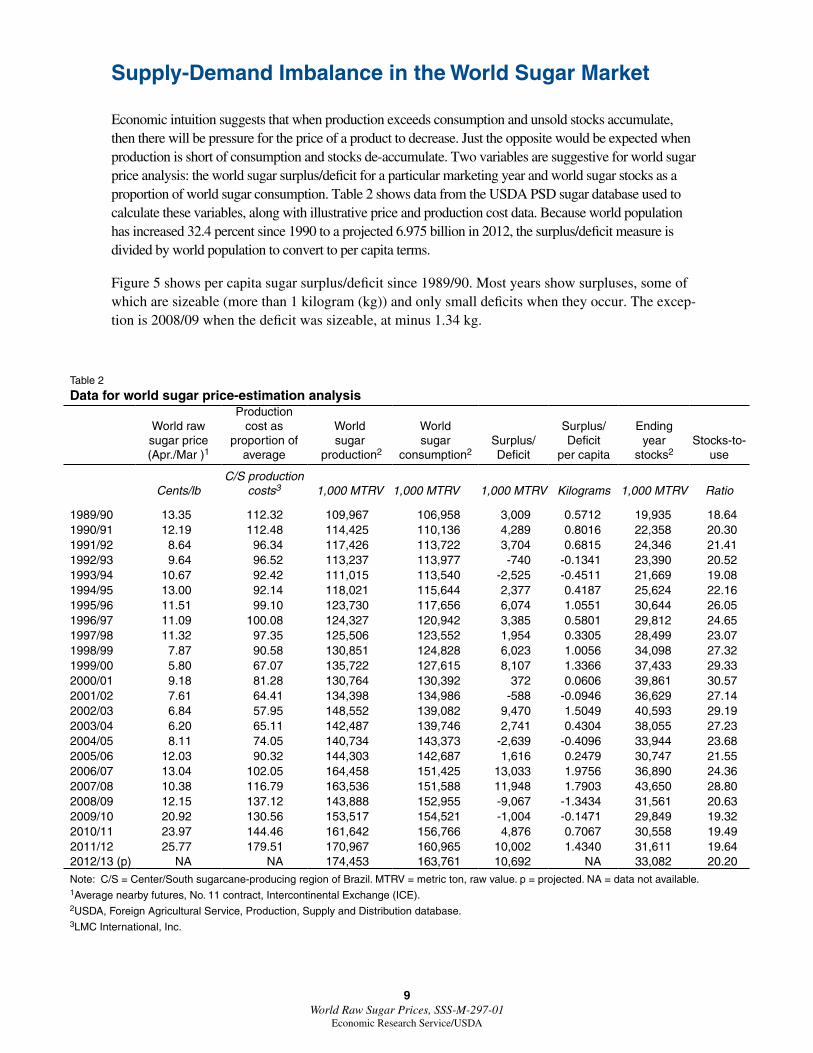
Economic intuition suggests that when production exceeds consumption and unsold stocks accumulate, then there will be pressure for the price of a product to decrease . Just the opposite would be expected when production is short of consumption and stocks de-accumulate . Two variables are suggestive for world sugar price analysis: the world sugar surplus/deficit for a particular marketing year and world sugar stocks as a proportion of world sugar consumption . Table 2 shows data from the USDA PSD sugar database used to calculate these variables, along with illustrative price and production cost data . Because world population has increased 32 .4 percent since 1990 to a projected 6 .975 billion in 2012, the surplus/deficit measure is divided by world population to convert to per capita terms .
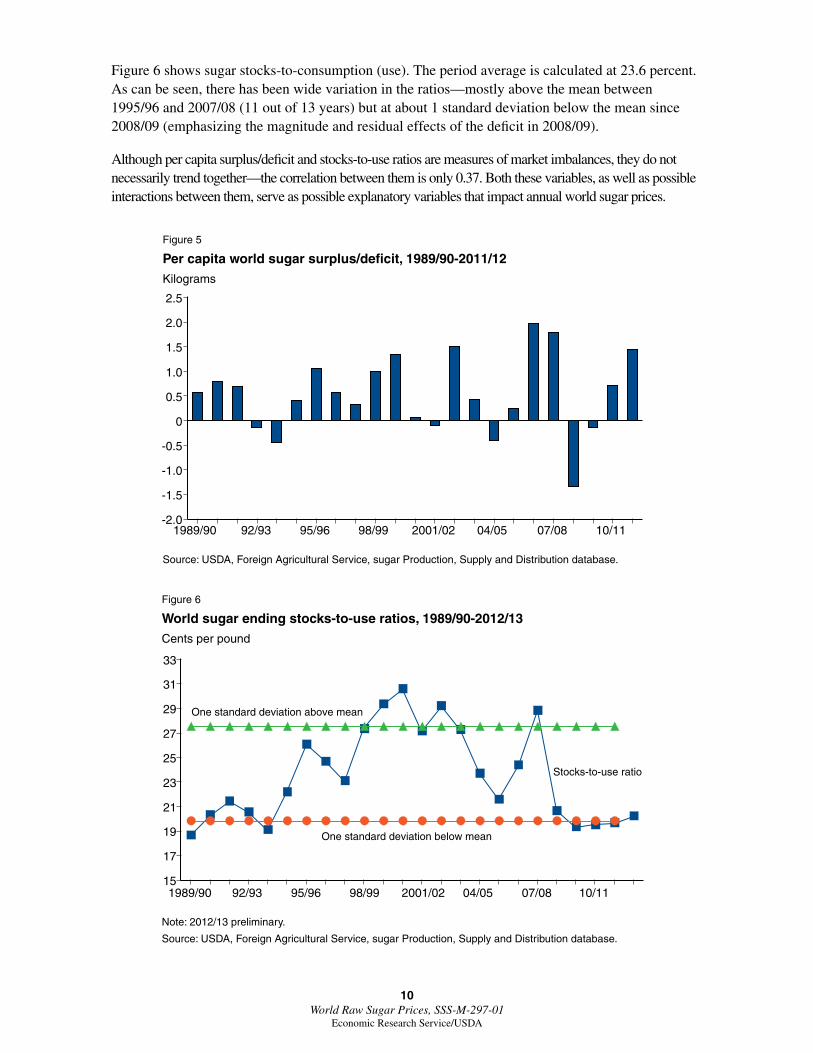
Figure 5 shows per capita sugar surplus/deficit since 1989/90 . Most years show surpluses, some of which are sizeable (more than 1 kilogram (kg)) and only small deficits when they occur . The excep-tion is 2008/09 when the deficit was sizeable, at minus 1 .34 kg .
Table 2
Data for world sugar price-estimation analysis
World raw sugar price (Apr./Mar )1
Production cost as
proportion of average
World sugar
production2
World sugar
consumption2Surplus/ Deficit
Surplus/ Deficit
per capita
Ending year
stocks2Stocks-to-
use
Cents/lbC/S production
costs3 1,000 MTRV 1,000 MTRV 1,000 MTRV Kilograms 1,000 MTRV Ratio
1989/90 13.35 112.32 109,967 106,958 3,009 0.5712 19,935 18.641990/91 12.19 112.48 114,425 110,136 4,289 0.8016 22,358 20.301991/92 8.64 96.34 117,426 113,722 3,704 0.6815 24,346 21.411992/93 9.64 96.52 113,237 113,977 -740 -0.1341 23,390 20.521993/94 10.67 92.42 111,015 113,540 -2,525 -0.4511 21,669 19.081994/95 13.00 92.14 118,021 115,644 2,377 0.4187 25,624 22.161995/96 11.51 99.10 123,730 117,656 6,074 1.0551 30,644 26.051996/97 11.09 100.08 124,327 120,942 3,385 0.5801 29,812 24.651997/98 11.32 97.35 125,506 123,552 1,954 0.3305 28,499 23.071998/99 7.87 90.58 130,851 124,828 6,023 1.0056 34,098 27.321999/00 5.80 67.07 135,722 127,615 8,107 1.3366 37,433 29.332000/01 9.18 81.28 130,764 130,392 372 0.0606 39,861 30.572001/02 7.61 64.41 134,398 134,986 -588 -0.0946 36,629 27.142002/03 6.84 57.95 148,552 139,082 9,470 1.5049 40,593 29.192003/04 6.20 65.11 142,487 139,746 2,741 0.4304 38,055 27.232004/05 8.11 74.05 140,734 143,373 -2,639 -0.4096 33,944 23.682005/06 12.03 90.32 144,303 142,687 1,616 0.2479 30,747 21.552006/07 13.04 102.05 164,458 151,425 13,033 1.9756 36,890 24.362007/08 10.38 116.79 163,536 151,588 11,948 1.7903 43,650 28.802008/09 12.15 137.12 143,888 152,955 -9,067 -1.3434 31,561 20.632009/10 20.92 130.56 153,517 154,521 -1,004 -0.1471 29,849 19.322010/11 23.97 144.46 161,642 156,766 4,876 0.7067 30,558 19.492011/12 25.77 179.51 170,967 160,965 10,002 1.4340 31,611 19.642012/13 (p) NA NA 174,453 163,761 10,692 NA 33,082 20.20
Note: C/S = Center/South sugarcane-producing region of Brazil. MTRV = metric ton, raw value. p = projected. NA = data not available.1Average nearby futures, No. 11 contract, Intercontinental Exchange (ICE).2USDA, Foreign Agricultural Service, Production, Supply and Distribution database.3LMC International, Inc.
10 World Raw Sugar Prices, SSS-M-297-01
Economic Research Service/USDA
Figure 5
Per capita world sugar surplus/deficit, 1989/90-2011/12 Kilograms
Source: USDA, Foreign Agricultural Service, sugar Production, Supply and Distribution database.
-2.0
-1.5
-1.0
-0.5
0
0.5
1.0
1.5
2.0
2.5
1989/90 92/93 95/96 98/99 2001/02 04/05 07/08 10/11
Figure 6 shows sugar stocks-to-consumption (use) . The period average is calculated at 23 .6 percent . As can be seen, there has been wide variation in the ratios—mostly above the mean between 1995/96 and 2007/08 (11 out of 13 years) but at about 1 standard deviation below the mean since 2008/09 (emphasizing the magnitude and residual effects of the deficit in 2008/09) .
Although per capita surplus/deficit and stocks-to-use ratios are measures of market imbalances, they do not necessarily trend together—the correlation between them is only 0 .37 . Both these variables, as well as possible interactions between them, serve as possible explanatory variables that impact annual world sugar prices .
Figure 6
World sugar ending stocks-to-use ratios, 1989/90-2012/13Cents per pound
Note: 2012/13 preliminary.
Source: USDA, Foreign Agricultural Service, sugar Production, Supply and Distribution database.
One standard deviation above mean
15
17
19
21
23
25
27
29
31
33
One standard deviation below mean
1989/90 92/93 95/96 98/99 2001/02 04/05 07/08 10/11
Stocks-to-use ratio
11 World Raw Sugar Prices, SSS-M-297-01
Economic Research Service/USDA
Uncertainty in Forecasting the World Sugar Market
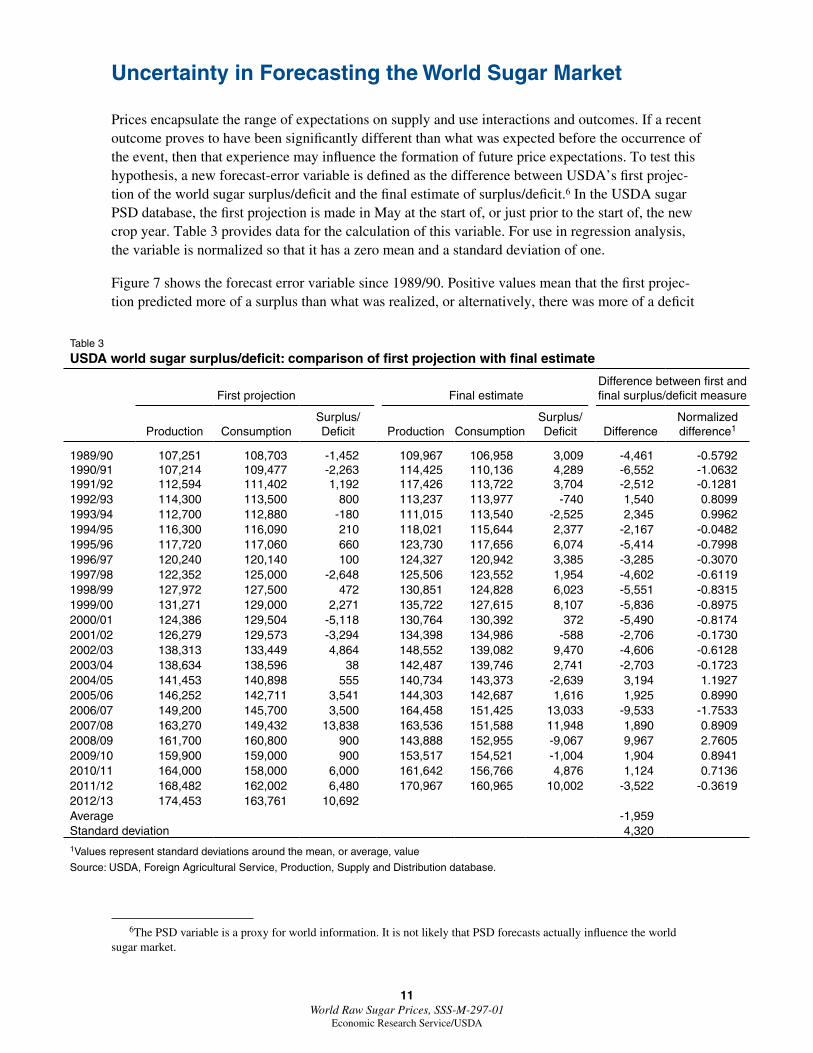
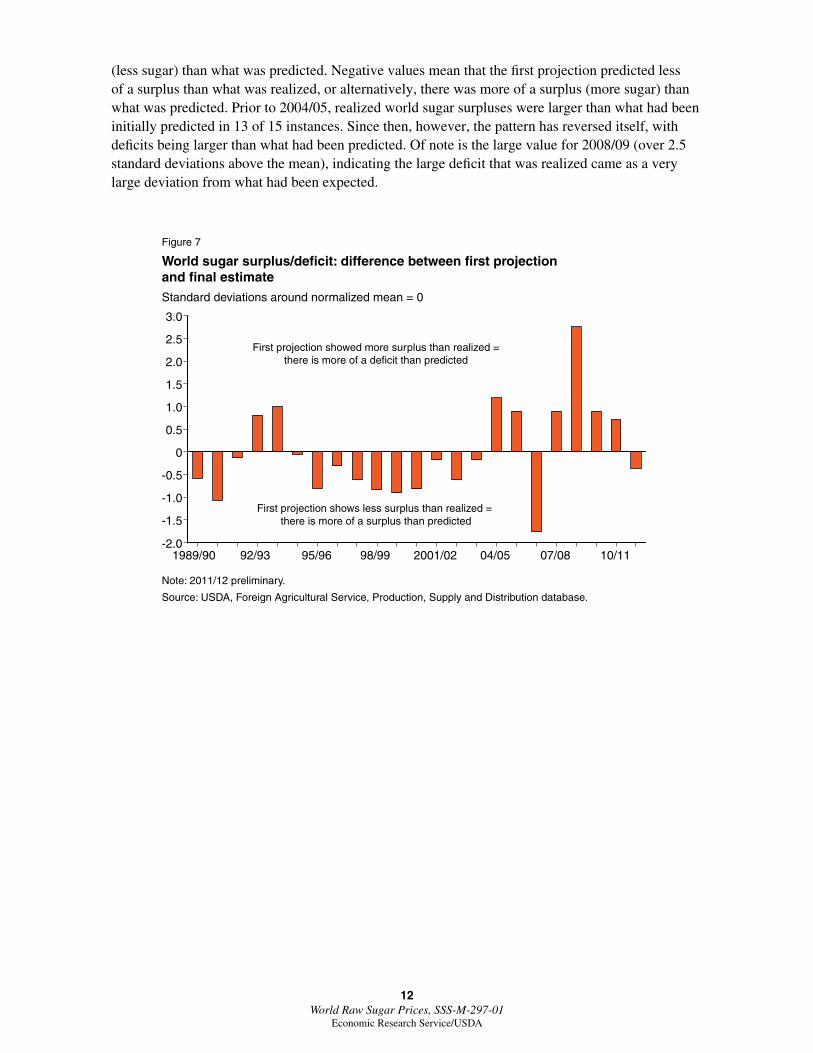
Prices encapsulate the range of expectations on supply and use interactions and outcomes . If a recent outcome proves to have been significantly different than what was expected before the occurrence of the event, then that experience may influence the formation of future price expectations . To test this hypothesis, a new forecast-error variable is defined as the difference between USDA’s first projec-tion of the world sugar surplus/deficit and the final estimate of surplus/deficit .6 In the USDA sugar PSD database, the first projection is made in May at the start of, or just prior to the start of, the new crop year . Table 3 provides data for the calculation of this variable . For use in regression analysis, the variable is normalized so that it has a zero mean and a standard deviation of one .
Figure 7 shows the forecast error variable since 1989/90 . Positive values mean that the first projec-tion predicted more of a surplus than what was realized, or alternatively, there was more of a deficit
6The PSD variable is a proxy for world information . It is not likely that PSD forecasts actually influence the world sugar market .
Table 3
USDA world sugar surplus/deficit: comparison of first projection with final estimate
First projection Final estimateDifference between first and final surplus/deficit measure
Production ConsumptionSurplus/ Deficit Production Consumption
Surplus/ Deficit Difference
Normalized difference1
1989/90 107,251 108,703 -1,452 109,967 106,958 3,009 -4,461 -0.57921990/91 107,214 109,477 -2,263 114,425 110,136 4,289 -6,552 -1.06321991/92 112,594 111,402 1,192 117,426 113,722 3,704 -2,512 -0.12811992/93 114,300 113,500 800 113,237 113,977 -740 1,540 0.80991993/94 112,700 112,880 -180 111,015 113,540 -2,525 2,345 0.99621994/95 116,300 116,090 210 118,021 115,644 2,377 -2,167 -0.04821995/96 117,720 117,060 660 123,730 117,656 6,074 -5,414 -0.79981996/97 120,240 120,140 100 124,327 120,942 3,385 -3,285 -0.30701997/98 122,352 125,000 -2,648 125,506 123,552 1,954 -4,602 -0.61191998/99 127,972 127,500 472 130,851 124,828 6,023 -5,551 -0.83151999/00 131,271 129,000 2,271 135,722 127,615 8,107 -5,836 -0.89752000/01 124,386 129,504 -5,118 130,764 130,392 372 -5,490 -0.81742001/02 126,279 129,573 -3,294 134,398 134,986 -588 -2,706 -0.17302002/03 138,313 133,449 4,864 148,552 139,082 9,470 -4,606 -0.61282003/04 138,634 138,596 38 142,487 139,746 2,741 -2,703 -0.17232004/05 141,453 140,898 555 140,734 143,373 -2,639 3,194 1.19272005/06 146,252 142,711 3,541 144,303 142,687 1,616 1,925 0.89902006/07 149,200 145,700 3,500 164,458 151,425 13,033 -9,533 -1.75332007/08 163,270 149,432 13,838 163,536 151,588 11,948 1,890 0.89092008/09 161,700 160,800 900 143,888 152,955 -9,067 9,967 2.76052009/10 159,900 159,000 900 153,517 154,521 -1,004 1,904 0.89412010/11 164,000 158,000 6,000 161,642 156,766 4,876 1,124 0.71362011/12 168,482 162,002 6,480 170,967 160,965 10,002 -3,522 -0.36192012/13 174,453 163,761 10,692Average -1,959Standard deviation 4,3201Values represent standard deviations around the mean, or average, value
Source: USDA, Foreign Agricultural Service, Production, Supply and Distribution database.
12 World Raw Sugar Prices, SSS-M-297-01
Economic Research Service/USDA
(less sugar) than what was predicted . Negative values mean that the first projection predicted less of a surplus than what was realized, or alternatively, there was more of a surplus (more sugar) than what was predicted . Prior to 2004/05, realized world sugar surpluses were larger than what had been initially predicted in 13 of 15 instances . Since then, however, the pattern has reversed itself, with deficits being larger than what had been predicted . Of note is the large value for 2008/09 (over 2 .5 standard deviations above the mean), indicating the large deficit that was realized came as a very large deviation from what had been expected .
Figure 7
World sugar surplus/deficit: difference between first projection and final estimate Standard deviations around normalized mean = 0
Note: 2011/12 preliminary.
Source: USDA, Foreign Agricultural Service, Production, Supply and Distribution database.
1989/90 92/93 95/96 98/99 2001/02 04/05 07/08 10/11-2.0
-1.5
-1.0
-0.5
0
0.5
1.0
1.5
2.0
2.5
3.0
First projection showed more surplus than realized =there is more of a deficit than predicted
First projection shows less surplus than realized = there is more of a surplus than predicted
13 World Raw Sugar Prices, SSS-M-297-01
Economic Research Service/USDA
Regression Analysis
Summarizing, the analysis shows that Brazil’s dominant market share means that its sugar produc-tion costs determine the long-run price of raw sugar in the world raw sugar market . However, there are short- to medium-term deviations from this long-term relationship caused by other factors . Variables that may explain these deviations include two indicators of excess or deficit global sugar supplies—the world sugar surplus/deficit for a particular marketing year and world sugar stocks as a proportion of world sugar consumption—and a measure of errors made in forecasting annual sugar deficits or surpluses . The next step is to analyze these relationships through econometric regression analysis .
The analysis consists of the estimation and interpretation of the following regression equation using annual data:
[(world sugar price)/(Center/South production cost)] = β0 + β1*[stocks-to-use ratio] + β2*[surplus/deficit per capita] + β3*[(stocks-to-use ratio)*(surplus/deficit per capita)] + β4*[surplus/deficit
projection less final estimate, normalized]
The world price and production cost variables correspond to the April/March marketing year . World supply and use variables aggregate across all producing and consuming countries where respective values for each country correspond to the marketing year defined for each of the countries . Because most countries, especially in the Northern Hemisphere, have October/September marketing years, it is expected that the surplus/deficit variables and the forecast error variable in the equations will have a lag structure . The surplus/deficit measures are lagged by 1 year and the forecast risk variable is lagged by both 2 and 3 years to assess the best statistical fit .
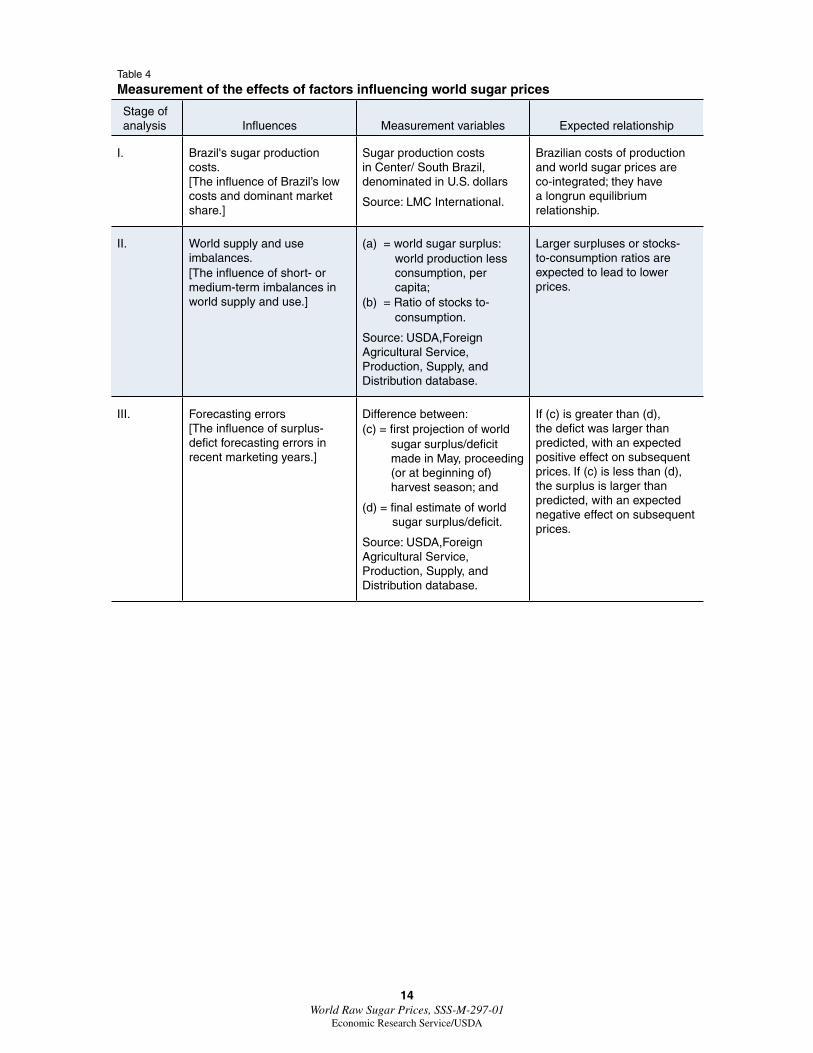
Table 4 summarizes the market influences addressed in the regression model, the measurement variables used, and the expected relationships between the variables and world sugar prices . The analytical approach is to test multiple combinations of the variables, as well as possible interactions between the surplus/deficit and forecast-error variables, to determine the most appropriate model for forecasting sugar prices . The analysis examined 9 model specifications in all:
• Equations 1-4 all use the stocks-to-use ratio as the measure of world surplus/deficit, with and without the forecast error variable, and with and without interaction terms between the stocks-to-use and forecast-error variables .
• Equations 6-9 all use the surplus per capita measure of the world sugar surplus/deficit, with and without the forecast-error variable, and with and without interaction terms between the surplus per capita and forecast-error variables . These equations also include the effects of both 2- and 3-year lags for the forecast error variable on sugar prices .
• Equation 5 includes both of the surplus/deficit measures in the same equation, without the fore-cast-error variable .
14 World Raw Sugar Prices, SSS-M-297-01
Economic Research Service/USDA
Table 4
Measurement of the effects of factors influencing world sugar prices
Stage of analysis Influences Measurement variables Expected relationship
I. Brazil's sugar production costs. [The influence of Brazil’s low costs and dominant market share.]
Sugar production costs in Center/ South Brazil, denominated in U.S. dollars
Source: LMC International.
Brazilian costs of production and world sugar prices are co-integrated; they have a longrun equilibrium relationship.
II. World supply and use imbalances.[The influence of short- or medium-term imbalances in world supply and use.]
(a) = world sugar surplus: world production less consumption, per capita;
(b) = Ratio of stocks to-consumption.
Source: USDA,Foreign Agricultural Service, Production, Supply, and Distribution database.
Larger surpluses or stocks-to-consumption ratios are expected to lead to lower prices.
III. Forecasting errors [The influence of surplus-defict forecasting errors in recent marketing years.]
Difference between: (c) = first projection of world
sugar surplus/deficit made in May, proceeding (or at beginning of) harvest season; and
(d) = final estimate of world sugar surplus/deficit.
Source: USDA,Foreign Agricultural Service, Production, Supply, and Distribution database.
If (c) is greater than (d), the defict was larger than predicted, with an expected positive effect on subsequent prices. If (c) is less than (d), the surplus is larger than predicted, with an expected negative effect on subsequent prices.
15 World Raw Sugar Prices, SSS-M-297-01
Economic Research Service/USDA
Regression Results
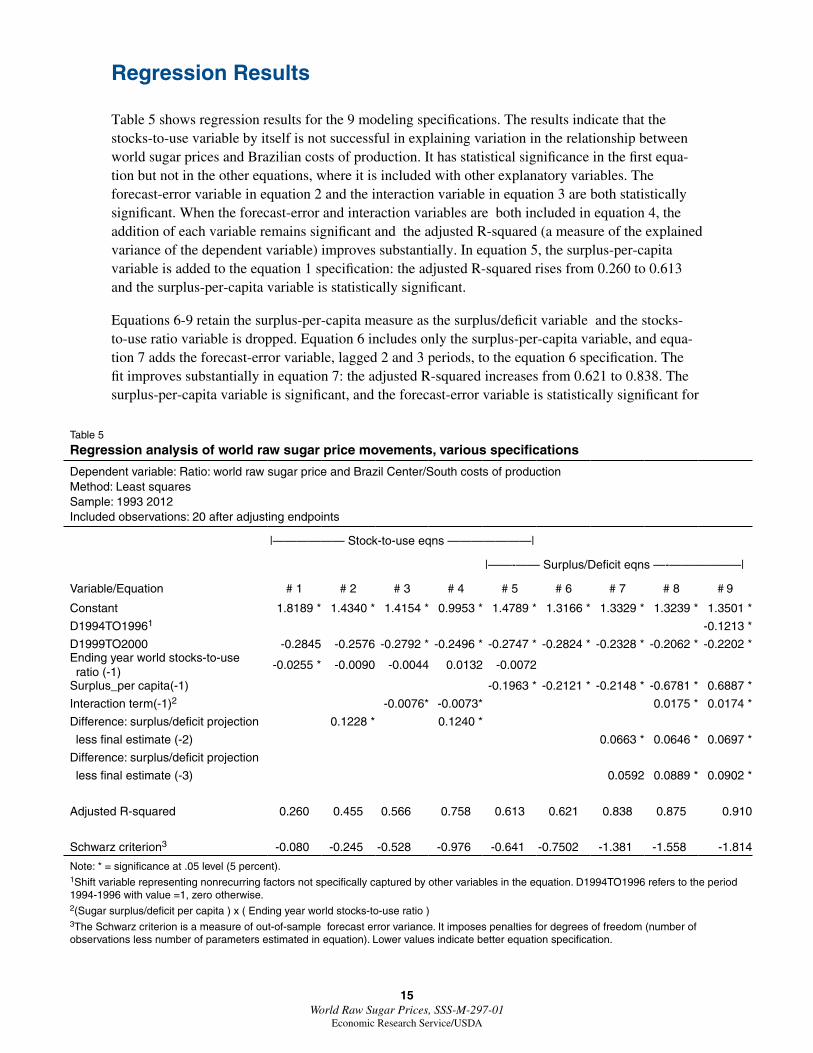
Table 5 shows regression results for the 9 modeling specifications . The results indicate that the stocks-to-use variable by itself is not successful in explaining variation in the relationship between world sugar prices and Brazilian costs of production . It has statistical significance in the first equa-tion but not in the other equations, where it is included with other explanatory variables . The forecast-error variable in equation 2 and the interaction variable in equation 3 are both statistically significant . When the forecast-error and interaction variables are both included in equation 4, the addition of each variable remains significant and the adjusted R-squared (a measure of the explained variance of the dependent variable) improves substantially . In equation 5, the surplus-per-capita variable is added to the equation 1 specification: the adjusted R-squared rises from 0 .260 to 0 .613 and the surplus-per-capita variable is statistically significant .
Equations 6-9 retain the surplus-per-capita measure as the surplus/deficit variable and the stocks-to-use ratio variable is dropped . Equation 6 includes only the surplus-per-capita variable, and equa-tion 7 adds the forecast-error variable, lagged 2 and 3 periods, to the equation 6 specification . The fit improves substantially in equation 7: the adjusted R-squared increases from 0 .621 to 0 .838 . The surplus-per-capita variable is significant, and the forecast-error variable is statistically significant for
Table 5
Regression analysis of world raw sugar price movements, various specifications
Dependent variable: Ratio: world raw sugar price and Brazil Center/South costs of productionMethod: Least squaresSample: 1993 2012Included observations: 20 after adjusting endpoints
|—————— Stock-to-use eqns ———————|
|——-—— Surplus/Deficit eqns —-——————|
Variable/Equation # 1 # 2 # 3 # 4 # 5 # 6 # 7 # 8 # 9
Constant 1.8189 * 1.4340 * 1.4154 * 0.9953 * 1.4789 * 1.3166 * 1.3329 * 1.3239 * 1.3501 *
D1994TO19961 -0.1213 *
D1999TO2000 -0.2845 -0.2576 -0.2792 * -0.2496 * -0.2747 * -0.2824 * -0.2328 * -0.2062 * -0.2202 *Ending year world stocks-to-use ratio (-1)
-0.0255 * -0.0090 -0.0044 0.0132 -0.0072
Surplus_per capita(-1) -0.1963 * -0.2121 * -0.2148 * -0.6781 * 0.6887 *
Interaction term(-1)2 -0.0076* -0.0073* 0.0175 * 0.0174 *
Difference: surplus/deficit projection 0.1228 * 0.1240 *
less final estimate (-2) 0.0663 * 0.0646 * 0.0697 *
Difference: surplus/deficit projection
less final estimate (-3) 0.0592 0.0889 * 0.0902 *
Adjusted R-squared 0.260 0.455 0.566 0.758 0.613 0.621 0.838 0.875 0.910
Schwarz criterion3 -0.080 -0.245 -0.528 -0.976 -0.641 -0.7502 -1.381 -1.558 -1.814
Note: * = significance at .05 level (5 percent).1Shift variable representing nonrecurring factors not specifically captured by other variables in the equation. D1994TO1996 refers to the period 1994-1996 with value =1, zero otherwise.2(Sugar surplus/deficit per capita ) x ( Ending year world stocks-to-use ratio )3The Schwarz criterion is a measure of out-of-sample forecast error variance. It imposes penalties for degrees of freedom (number of observations less number of parameters estimated in equation). Lower values indicate better equation specification.
16 World Raw Sugar Prices, SSS-M-297-01
Economic Research Service/USDA
two lags but not three . The sign on the forecast-error variable is positive, indicating that not having as much sugar as predicted two periods back contributes to a higher current price . The relationship here is symmetric, meaning that having more sugar than predicted in the earlier marketing year is associated with a lower price in a subsequent year .
Equation 8 adds the interaction term between the two surplus/deficit measures to the equation 7 specification and again the regression fit improves: adjusted R-squared rises to 0 .875 . The risk vari-able with the three-period lag becomes statistically significant . The addition of the interaction term adds nuance to the effect of the surplus/deficit variable on the price/cost ratio . The coefficient is positive, implying that at higher (lower) stocks-to-use levels, the surplus/deficit measure has less (more) of an effect on the price/cost ratio than when the stocks-to-use ratio is lower (higher) . In other words, sugar price movements associated with changes in sugar availability are predicted to be smaller when world sugar stocks are high relative to consumption needs . In turn, price movements are predicted to be larger in response to changes in sugar availability when stock levels are lower .
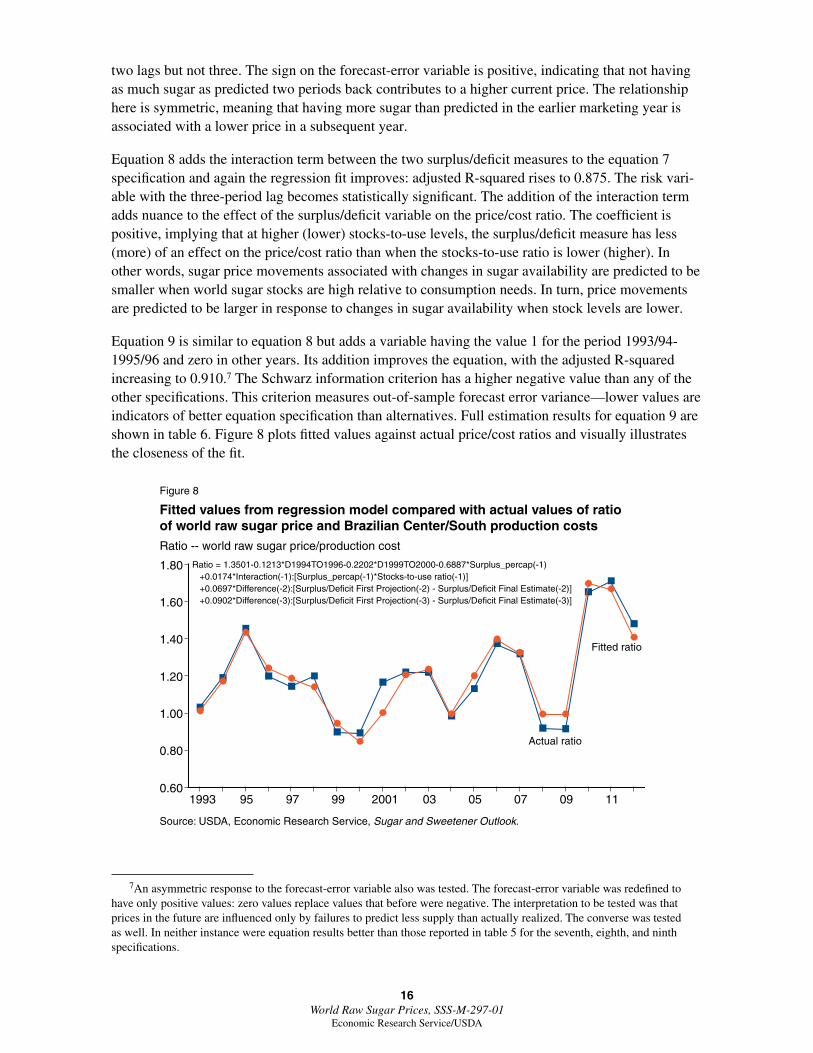
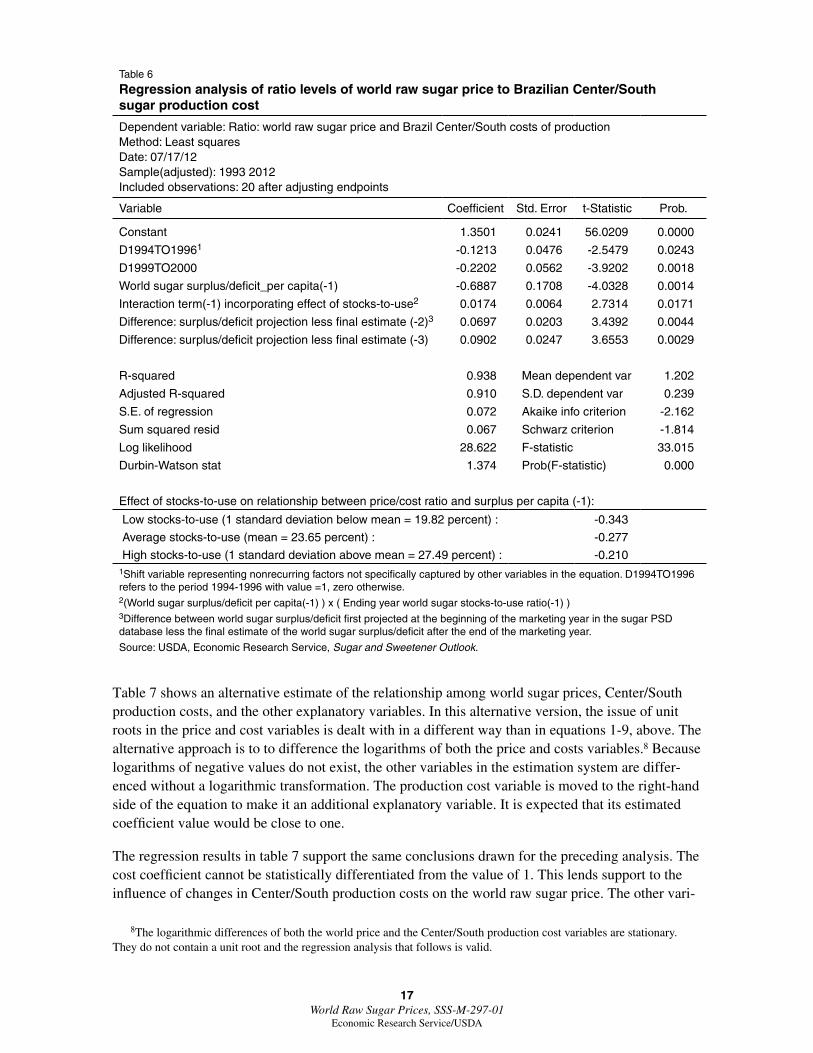
Equation 9 is similar to equation 8 but adds a variable having the value 1 for the period 1993/94-1995/96 and zero in other years . Its addition improves the equation, with the adjusted R-squared increasing to 0 .910 .7 The Schwarz information criterion has a higher negative value than any of the other specifications . This criterion measures out-of-sample forecast error variance—lower values are indicators of better equation specification than alternatives . Full estimation results for equation 9 are shown in table 6 . Figure 8 plots fitted values against actual price/cost ratios and visually illustrates the closeness of the fit .
7An asymmetric response to the forecast-error variable also was tested . The forecast-error variable was redefined to have only positive values: zero values replace values that before were negative . The interpretation to be tested was that prices in the future are influenced only by failures to predict less supply than actually realized . The converse was tested as well . In neither instance were equation results better than those reported in table 5 for the seventh, eighth, and ninth specifications .
Figure 8
Fitted values from regression model compared with actual values of ratio of world raw sugar price and Brazilian Center/South production costsRatio -- world raw sugar price/production cost
Source: USDA, Economic Research Service, Sugar and Sweetener Outlook.
Ratio = 1.3501-0.1213*D1994TO1996-0.2202*D1999TO2000-0.6887*Surplus_percap(-1) +0.0174*Interaction(-1):[Surplus_percap(-1)*Stocks-to-use ratio(-1)] +0.0697*Difference(-2):[Surplus/Deficit First Projection(-2) - Surplus/Deficit Final Estimate(-2)] +0.0902*Difference(-3):[Surplus/Deficit First Projection(-3) - Surplus/Deficit Final Estimate(-3)]
1993 95 97 99 2001 03 05 07 09 110.60
0.80
1.00
1.20
1.40
1.60
1.80
Actual ratio
Fitted ratio
17 World Raw Sugar Prices, SSS-M-297-01
Economic Research Service/USDA
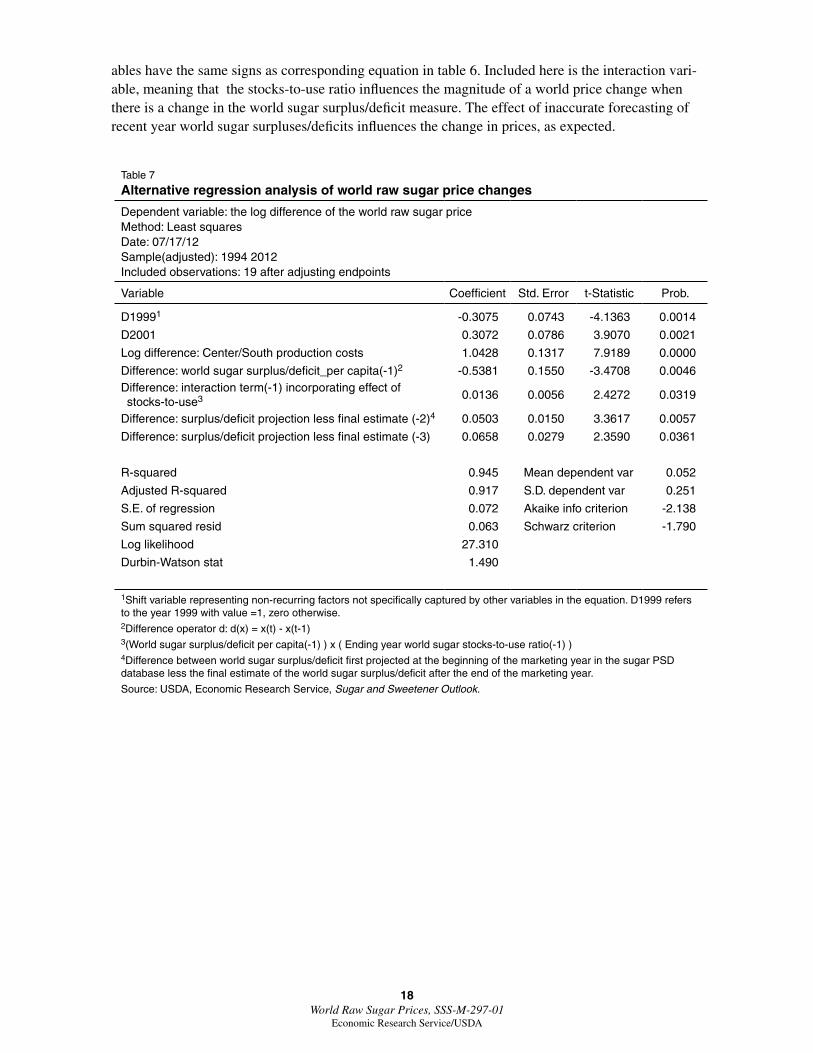
Table 7 shows an alternative estimate of the relationship among world sugar prices, Center/South production costs, and the other explanatory variables . In this alternative version, the issue of unit roots in the price and cost variables is dealt with in a different way than in equations 1-9, above . The alternative approach is to to difference the logarithms of both the price and costs variables .8 Because logarithms of negative values do not exist, the other variables in the estimation system are differ-enced without a logarithmic transformation . The production cost variable is moved to the right-hand side of the equation to make it an additional explanatory variable . It is expected that its estimated coefficient value would be close to one .
The regression results in table 7 support the same conclusions drawn for the preceding analysis . The cost coefficient cannot be statistically differentiated from the value of 1 . This lends support to the influence of changes in Center/South production costs on the world raw sugar price . The other vari-
8The logarithmic differences of both the world price and the Center/South production cost variables are stationary . They do not contain a unit root and the regression analysis that follows is valid .
Table 6
Regression analysis of ratio levels of world raw sugar price to Brazilian Center/South sugar production cost
Dependent variable: Ratio: world raw sugar price and Brazil Center/South costs of productionMethod: Least squaresDate: 07/17/12 Sample(adjusted): 1993 2012Included observations: 20 after adjusting endpoints
Variable Coefficient Std. Error t-Statistic Prob.
Constant 1.3501 0.0241 56.0209 0.0000
D1994TO19961 -0.1213 0.0476 -2.5479 0.0243
D1999TO2000 -0.2202 0.0562 -3.9202 0.0018
World sugar surplus/deficit_per capita(-1) -0.6887 0.1708 -4.0328 0.0014
Interaction term(-1) incorporating effect of stocks-to-use2 0.0174 0.0064 2.7314 0.0171
Difference: surplus/deficit projection less final estimate (-2)3 0.0697 0.0203 3.4392 0.0044
Difference: surplus/deficit projection less final estimate (-3) 0.0902 0.0247 3.6553 0.0029
R-squared 0.938 Mean dependent var 1.202
Adjusted R-squared 0.910 S.D. dependent var 0.239
S.E. of regression 0.072 Akaike info criterion -2.162
Sum squared resid 0.067 Schwarz criterion -1.814
Log likelihood 28.622 F-statistic 33.015
Durbin-Watson stat 1.374 Prob(F-statistic) 0.000
Effect of stocks-to-use on relationship between price/cost ratio and surplus per capita (-1):
Low stocks-to-use (1 standard deviation below mean = 19.82 percent) : -0.343
Average stocks-to-use (mean = 23.65 percent) : -0.277
High stocks-to-use (1 standard deviation above mean = 27.49 percent) : -0.2101Shift variable representing nonrecurring factors not specifically captured by other variables in the equation. D1994TO1996 refers to the period 1994-1996 with value =1, zero otherwise.2(World sugar surplus/deficit per capita(-1) ) x ( Ending year world sugar stocks-to-use ratio(-1) )3Difference between world sugar surplus/deficit first projected at the beginning of the marketing year in the sugar PSD database less the final estimate of the world sugar surplus/deficit after the end of the marketing year.
Source: USDA, Economic Research Service, Sugar and Sweetener Outlook.
18 World Raw Sugar Prices, SSS-M-297-01
Economic Research Service/USDA
ables have the same signs as corresponding equation in table 6 . Included here is the interaction vari-able, meaning that the stocks-to-use ratio influences the magnitude of a world price change when there is a change in the world sugar surplus/deficit measure . The effect of inaccurate forecasting of recent year world sugar surpluses/deficits influences the change in prices, as expected .
Table 7
Alternative regression analysis of world raw sugar price changes
Dependent variable: the log difference of the world raw sugar price Method: Least squaresDate: 07/17/12 Sample(adjusted): 1994 2012Included observations: 19 after adjusting endpoints
Variable Coefficient Std. Error t-Statistic Prob.
D19991 -0.3075 0.0743 -4.1363 0.0014
D2001 0.3072 0.0786 3.9070 0.0021
Log difference: Center/South production costs 1.0428 0.1317 7.9189 0.0000
Difference: world sugar surplus/deficit_per capita(-1)2 -0.5381 0.1550 -3.4708 0.0046Difference: interaction term(-1) incorporating effect of stocks-to-use3 0.0136 0.0056 2.4272 0.0319
Difference: surplus/deficit projection less final estimate (-2)4 0.0503 0.0150 3.3617 0.0057
Difference: surplus/deficit projection less final estimate (-3) 0.0658 0.0279 2.3590 0.0361
R-squared 0.945 Mean dependent var 0.052
Adjusted R-squared 0.917 S.D. dependent var 0.251
S.E. of regression 0.072 Akaike info criterion -2.138
Sum squared resid 0.063 Schwarz criterion -1.790
Log likelihood 27.310
Durbin-Watson stat 1.490
1Shift variable representing non-recurring factors not specifically captured by other variables in the equation. D1999 refers to the year 1999 with value =1, zero otherwise.2Difference operator d: d(x) = x(t) - x(t-1)3(World sugar surplus/deficit per capita(-1) ) x ( Ending year world sugar stocks-to-use ratio(-1) ) 4Difference between world sugar surplus/deficit first projected at the beginning of the marketing year in the sugar PSD database less the final estimate of the world sugar surplus/deficit after the end of the marketing year.
Source: USDA, Economic Research Service, Sugar and Sweetener Outlook.
19 World Raw Sugar Prices, SSS-M-297-01
Economic Research Service/USDA
Conclusions
This report has presented quantitative assessment of factors affecting the world price of raw sugar . The main emphasis has been on Brazil because Brazil is world’s leading producer and exporter of sugar . Historically, Brazil’s importance in world sugar has resulted from domestic policies tied to the promotion and development of ethanol . Sugarcane area has grown to high levels (8 .89 million hectares in 2011/12), leading to the largely realized potential to exert substantial influence on both world ethanol and sugar markets .9 This analysis has concluded that, over the long term, world sugar prices are determined by sugar production costs in Center/South Brazil . It has also concluded that these costs are strongly affected by the exchange rate between the U .S . dollar and the Brazilian currency, the real, mainly because sugar is traded in dollars in international markets .
As one would expect, deviations around long-term sugar-pricing trends result from world sugar surpluses and deficits (total world sugar production minus consumption) . However, the magnitude of changes is qualified by the amount of world sugar being held in stocks . Higher stockholding leads to smaller effects on world sugar prices than when stockholding is low . Higher sugar prices can be expected in environments where there were unanticipated sugar deficits that led to higher prices in preceding marketing years . The opposite is true when there are unanticipated sugar surpluses . The market seemingly factors in a penalty for having made mistakes in forecasting sugar production for earlier years .
In 2007 and 2008, when many commodities around the world experienced markedly higher prices, world sugar prices remained at relatively fixed and stable levels . With relatively lower returns, much area was shifted out of sugar crops and into higher priced alternative crops . The 2008/09 marketing year also saw widespread weather-related yield reductions . An earlier study from USDA’s Economic Research Service (ERS) noted that higher production costs and growing ethanol use in Brazil had set the stage for higher world sugar prices but concluded that policy-induced production swings among Asian countries (mainly India) were, and will likely continue to be, the main source of price volatility in world sugar markets (McConnell et al ., 2010) . Although the 2012/13 world sugar situation is seen to be stabilizing, the uncertainty from recently experienced production shortfalls has probably kept prices at historically high levels . In its sugar projection out to 2021/22, the OECD and FAO jointly forecast sugar prices above historical levels, noting the strong probability of continued market volatility, mainly stemming from policies in India amplifying inherent cyclical production patterns .
In the United States, higher world sugar prices could weaken the case for policies that support domestic producers . However, echoing the conclusion of McConnell et al . (2010), volatility in the world sugar market leaves U .S . sugar producers vulnerable to low prices if there are no domestic price-support programs in place . Although much of the volatility may be self-correcting over time, the volatility of exchange rates, especially in reference to the Brazilian real and the U .S . dollar, may make longer term sugar pricing developments more uncertain .
9In the short term to medium term, there is flexibility to switch between ethanol and sugar production, depending on market returns and costs for both products . Nonetheless, over the longer time horizon, the simultaneous growth of both product sectors strongly illustrates the complementary relationship between them .
20 World Raw Sugar Prices, SSS-M-297-01
Economic Research Service/USDA
References
Engle, Robert F ., and C .W .J . Granger . 1987 . “Co-Integration and Error Correction: Representation, Estimation, and Testing,” Econometrica 55, pp . 251-76 .
McConnell, Michael, Erik Dohlman, and Stephen Haley . 2010 . “World Sugar Price Volatility Intensified by Market and Policy Factors,” Amber Waves, September 2010 . Available at: http://webarchives .cdlib .org/sw1tx36512/http://www .ers .usda .gov/AmberWaves/September10
Organisation for Economic Co-operation and Development/Food and Agricultural Organization . 2012 . OECD-FAO Agricultural Outlook 2012-2021, OECD Publishing and FAO .
Pindyck, Robert, and Daniel Rubinfeld . 1998 . Econometric Models and Economic Forecasts . New York, NY: McGraw-Hill .
21 World Raw Sugar Prices, SSS-M-297-01
Economic Research Service/USDA
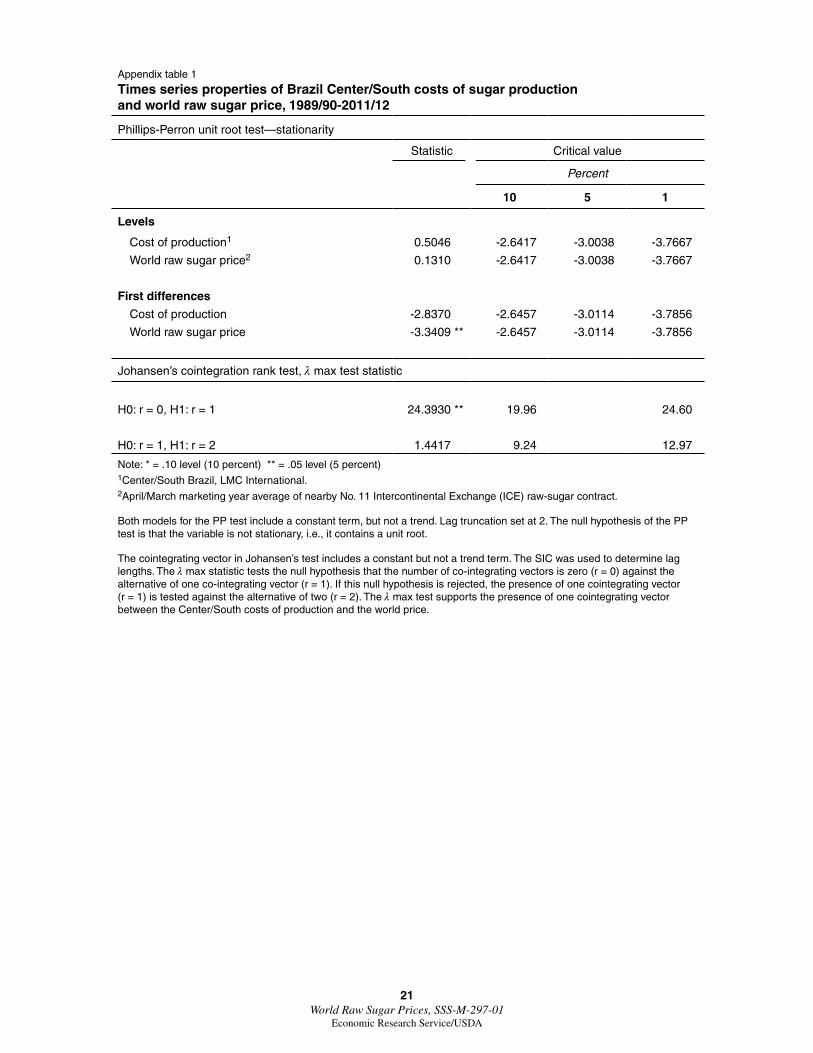
Appendix table 1
Times series properties of Brazil Center/South costs of sugar production and world raw sugar price, 1989/90-2011/12
Phillips-Perron unit root test—stationarity
Statistic Critical value
Percent
10 5 1
Levels
Cost of production1 0.5046 -2.6417 -3.0038 -3.7667
World raw sugar price2 0.1310 -2.6417 -3.0038 -3.7667
First differences
Cost of production -2.8370 -2.6457 -3.0114 -3.7856
World raw sugar price -3.3409 ** -2.6457 -3.0114 -3.7856
Johansen’s cointegration rank test, λ max test statistic
H0: r = 0, H1: r = 1 24.3930 ** 19.96 24.60
H0: r = 1, H1: r = 2 1.4417 9.24 12.97
Note: * = .10 level (10 percent) ** = .05 level (5 percent) 1Center/South Brazil, LMC International.2April/March marketing year average of nearby No. 11 Intercontinental Exchange (ICE) raw-sugar contract.
Both models for the PP test include a constant term, but not a trend. Lag truncation set at 2. The null hypothesis of the PP test is that the variable is not stationary, i.e., it contains a unit root.
The cointegrating vector in Johansen’s test includes a constant but not a trend term. The SIC was used to determine lag lengths. The λ max statistic tests the null hypothesis that the number of co-integrating vectors is zero (r = 0) against the alternative of one co-integrating vector (r = 1). If this null hypothesis is rejected, the presence of one cointegrating vector (r = 1) is tested against the alternative of two (r = 2). The λ max test supports the presence of one cointegrating vector between the Center/South costs of production and the world price.
22 World Raw Sugar Prices, SSS-M-297-01
Economic Research Service/USDA
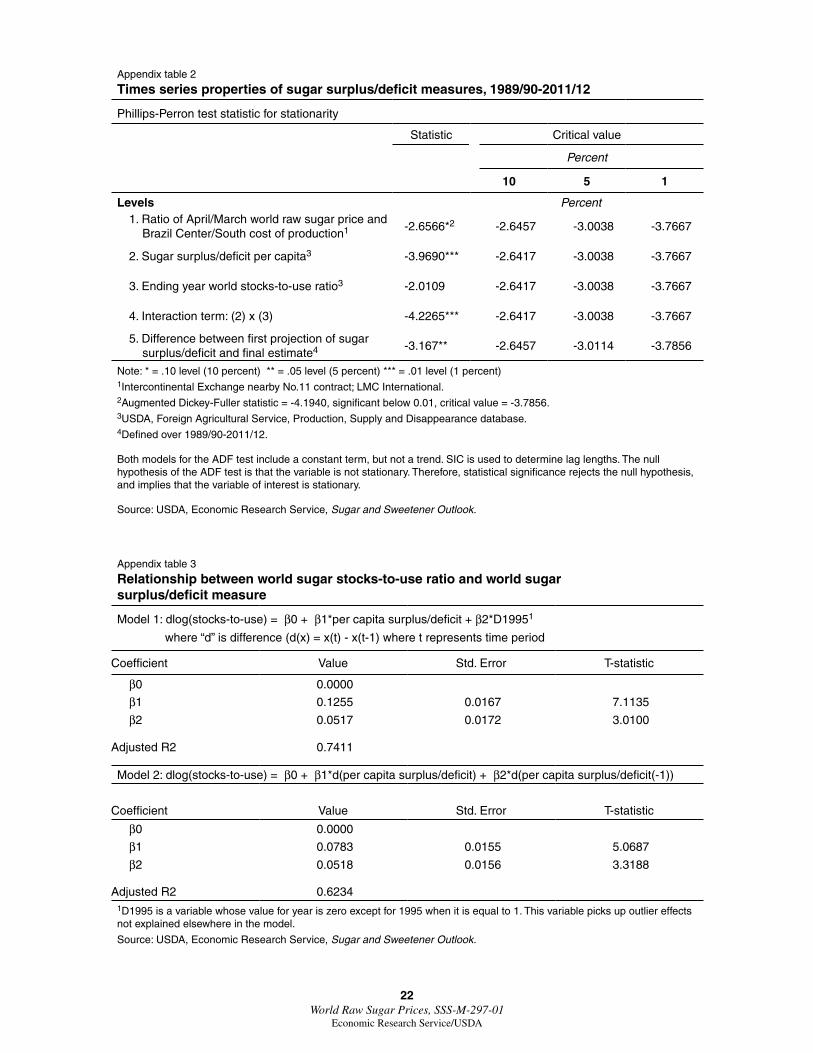
Appendix table 2
Times series properties of sugar surplus/deficit measures, 1989/90-2011/12
Phillips-Perron test statistic for stationarity
Statistic Critical value
Percent
10 5 1
Levels Percent1. Ratio of April/March world raw sugar price and Brazil Center/South cost of production1 -2.6566*2 -2.6457 -3.0038 -3.7667
2. Sugar surplus/deficit per capita3 -3.9690*** -2.6417 -3.0038 -3.7667
3. Ending year world stocks-to-use ratio3 -2.0109 -2.6417 -3.0038 -3.7667
4. Interaction term: (2) x (3) -4.2265*** -2.6417 -3.0038 -3.7667
5. Difference between first projection of sugar surplus/deficit and final estimate4 -3.167** -2.6457 -3.0114 -3.7856
Note: * = .10 level (10 percent) ** = .05 level (5 percent) *** = .01 level (1 percent)1Intercontinental Exchange nearby No.11 contract; LMC International.2Augmented Dickey-Fuller statistic = -4.1940, significant below 0.01, critical value = -3.7856.3USDA, Foreign Agricultural Service, Production, Supply and Disappearance database.4Defined over 1989/90-2011/12.
Both models for the ADF test include a constant term, but not a trend. SIC is used to determine lag lengths. The null hypothesis of the ADF test is that the variable is not stationary. Therefore, statistical significance rejects the null hypothesis, and implies that the variable of interest is stationary.
Source: USDA, Economic Research Service, Sugar and Sweetener Outlook.
Appendix table 3
Relationship between world sugar stocks-to-use ratio and world sugar surplus/deficit measure
Model 1: dlog(stocks-to-use) = β0 + β1*per capita surplus/deficit + β2*D19951
where “d” is difference (d(x) = x(t) - x(t-1) where t represents time period
Coefficient Value Std. Error T-statistic
β0 0.0000
β1 0.1255 0.0167 7.1135
β2 0.0517 0.0172 3.0100
Adjusted R2 0.7411
Model 2: dlog(stocks-to-use) = β0 + β1*d(per capita surplus/deficit) + β2*d(per capita surplus/deficit(-1))
Coefficient Value Std. Error T-statistic
β0 0.0000
β1 0.0783 0.0155 5.0687
β2 0.0518 0.0156 3.3188
Adjusted R2 0.62341D1995 is a variable whose value for year is zero except for 1995 when it is equal to 1. This variable picks up outlier effects not explained elsewhere in the model.
Source: USDA, Economic Research Service, Sugar and Sweetener Outlook.