Embed Size (px)
Citation preview

ARTICLE IN PRESS
Energy Policy 37 (2009) 1195–1203
Contents lists available at ScienceDirect
Energy Policy
0301-42
doi:10.1
� Corr
E-m
journal homepage: www.elsevier.com/locate/enpol
Depletion of forest resources in Sudan: Intervention optionsfor optimal control
Rashid Hassan a,�, Greg Hertzler b, James K.A. Benhin c
a Centre for Environmental Economics and Policy in Africa (CEEPA), Faculty of Natural and Agricultural Sciences, University of Pretoria, 0002 Pretoria, South Africab Agricultural and Resource Economics, Faculty of Agriculture, Food and Natural Resources, The University of Sydney, Sydney, NSW 2006, Australiac Marine & Coastal Environmental Economics, Business School, University of Plymouth, Drake Circus, Plymouth, Devon PL4 8AA, UK
a r t i c l e i n f o
Article history:
Received 23 May 2008
Accepted 24 October 2008Available online 29 January 2009
Keywords:
Biomass energy
Deforestation
Sudan
15/$ - see front matter & 2008 Elsevier Ltd. A
016/j.enpol.2008.10.049
esponding author. Tel.: +27 012 420 3317; fax
ail address: [email protected] (R. Hassan
a b s t r a c t
Agricultural expansion and over-cutting of trees for fuelwood are important causes of deforestation in
arid and semi-arid countries such as Sudan. The consequence is increased desertification and high
erosion and loss of soil nutrients leading to declining agricultural productivity. However, the social costs
of the deforestation externality are not taken into account in present forest management and land use
planning in Sudan leading to under-pricing and over-exploitation of the country’s forest resources. This
study evaluated the suitability of approaches commonly used by most forest resource management
agencies for prediction of the state and control of harvesting of forest resources against alternative
empirical simulation models using relevant information about economic behaviour of trading agents in
the fuelwood market. Results showed the clear superiority of models integrating market behaviour over
current approaches in the ability to better simulate real trends of wood consumption and hence
depletion rates. The study also adopted an optimal control model to derive socially optimal forest
harvesting regimes. The results showed that current rates of forest resource rent recovery and
reforestation efforts are very far from optimal. Results also suggest that, in addition to optimal pricing
and higher reforestation efforts, promotion and availability of fuel substitutes and investment in wood
energy conversion efficiencies have a strong potential for curbing the problem of deforestation in Sudan.
& 2008 Elsevier Ltd. All rights reserved.
1. Introduction
Conversion of natural forests and woodlands is still the mainstrategy and source of land for agricultural expansion in mostdeveloping countries. Sudan provides a typical example whereabout 2,00,000 ha of natural woodlands and forests are annuallyreplaced by dryland mechanised agriculture (FNC (Forestry NationalCorporation), 2000). In addition, fuelwood and charcoal are themajor sources of energy for the vast majority of the people of Sudan,especially in rural areas. More than 80% of the total energyconsumed in Sudan comes from biomass, e.g. fuelwood, charcoaland crop residues. Currently, about 9.5 million tons of oil equivalent(TOE) of biomass energy are consumed annually from more than 3million ha of forestland in Sudan (FNC (Forestry National Corpora-tion), 2000). The consequence of agricultural extensification andexcessive tree felling for energy purposes is a serious deforestationproblem (Hassan and Hertzler, 1988). In the late 1970s, Sudan’sforests and woodland covered about 38.5% of the land area. Recentestimates indicate that forests and woodland cover only about
ll rights reserved.
: +27 012 420 4958.
).
25.9% of total land area with an estimated annual loss of 1.4% in thelast decade (FAO (Food and Agriculture Organization), 2001).
Property rights governing the use of land and forest resourcesin Sudan exacerbate the deforestation problem, with conse-quences for land use and agricultural productivity on-site anddownstream. About 40% of the harvested timber comes fromclearing of forests and woodlands for large-scale mechanisedfarming, which is practiced under lease arrangements that giveprivate operators the right to clear and cultivate the leased landfor a fixed period. A lack of secure property rights (e.g. privateownership) under this system provides little incentive to lesseesfor conserving the long-term productivity of the cultivated land. Aresult is very exploitative land use systems and severe degrada-tion of soils and farm productivity.
The remaining timber harvesting and tree cutting is caused bytwo main activities. The first represents exploiting forestresources under open access and communal tenure systems,where shifting cultivation is practiced by smallholders who clearforestland for subsistence farming and where villagers freelyharvest timber for own use, mainly for energy purposes. Thesecond is a system of licensing timber harvesting to privatesuppliers of charcoal to urban consumers in the towns. Bothregimes provide little incentive for conservation of forest and land
ARTICLE IN PRESS
1 For lack of data, the costs and benefits associated with the production of
other tangible and intangible goods and services and other amenities of forests and
agriculture were not included in the present analysis.
R. Hassan et al. / Energy Policy 37 (2009) 1195–12031196
resources (Hassan and Hertzler, 1988; Barton et al., 1991;Elnagheeb and Bromley, 1994).
In addition to the rapid depletion of natural woodlands andforest resources, deforestation leads to increased desertification anddestruction of the ecosystem. As a consequence, soil resources aredegraded through high erosion and loss of nutrients leading todeclining agricultural productivity on-site as well as downstream(Elnagheeb and Bromley, 1994; Ehui and Hertel, 1989; Hassan andHertzler, 1988). The social costs of such external effects ofdeforestation are not taken into account under the present forestand land use tenure and policy regimes in Sudan. The result isunder-pricing and over-exploitation of forest resources as timber isfreely collected by rural households and commercial wood andcharcoal suppliers, including mechanised farms’ operators, who payvery little royalty on removal of fuelwood stocks. While fuelwoodprices have risen by about 40 times over the past two decades, as aresult of increased transport costs as forests receded further andfurther south, this does not fully capture the scarcity value of theresource to future generations. Neither does it reflect the socialcosts of the externality imposed by deforestation on agriculture.
Furthermore, about 90% of the total biomass energy is burntfor domestic cooking by the household sector in Sudan. Wood isconverted with a very low thermal efficiency in this process(Hassan, 1984). Investment in improved thermal efficiency anddissemination of wood energy conversion technologies providesanother option for intervention in addition to afforestation andoptimal pricing for sustainable management and exploitation ofthe country’s forest resources.
While petroleum fuels such as the liquefied petroleum gas(LPG) and kerosene provide cleaner sources of energy and anoption for conservation of forest resources, these were relativelyscarce and expensive, and their use was rationed when the oilimports’ bill was a heavy burden on the national economy.However, petroleum fuels have now become relatively moreavailable, after the discovery and production of oil in Sudan overthe past few years, and represent viable substitutes for traditionalbiomass fuels, especially in urban centres.
A number of suggestions have been advanced as solutions to thedeforestation problem, including more individual property rights,supply-side regulation and price controls (Barton et al., 1991;Hassan and Hertzler, 1988). Although granting of property rightsmay overcome inter-temporal inefficiencies, it does not take care ofthe external costs imposed by deforestation on agriculture. Supply-side regulation, on the other hand, can halt the rapid depletion offorests but the forest resource rents will still dissipate to privateindividual producers. Optimal pricing provides a better option forcontrolling over-harvesting and for capturing of the scarcity rents.
Several approaches to modelling deforestation processes andtheir causes have been developed and used in the literature(Angelsen and Kaimowitz, 1999; Kaimowitz and Angelsen, 1998).The present study adopts a normative dynamic optimisationmodel and market equilibrium simulation of current productionand consumption patterns in the fuelwood and affected agricul-tural produce markets. The developed model represents amodified version of earlier generalised analytical models devel-oped by Hassan and Hertzler (1988) and Babu and Hassan (1995).The dynamic optimisation model used for controlling deforesta-tion in Sudan is empirically specified and solved for the bio-economic optima as the socially desirable steady state of forestresource stocks. A subset of the model without the scarcity rent isused to simulate equilibrium in the fuelwood and agriculturalproduce markets under market clearance. A simulation scenariorepresenting current practice commonly used by forest planningand policy authorities in Sudan and elsewhere, simply on the basisof average consumption of wood energy and biological growthwithout allowing for market clearance, is also implemented for
comparison. Several solutions under alternative scenarios areused to test the sensitivity of model results to the values of keypolicy parameters.
2. The optimal control model
As argued earlier, natural forests and woodlands in Sudan areexploited under common property and government licensingregimes and deforestation is a source of externality on agriculturalproductivity and the ecosystem. To correct for the consequences ofthese regimes and policies for socially optimum extraction of forestresources, the optimal control model considers the external effectsof deforestation on wood extraction costs and agricultural produc-tivity in maximising social welfare from the production of tradedtimber and agricultural products.1 Accordingly, Eq. (1) modelsaggregate fuelwood and composite agricultural commodity marketsto maximise aggregate economic benefits at a national level:
JðSð0Þ;Kð0ÞÞ ¼ maxQw ;F;Ir
Z 10
e�dt½PwðQw; PiÞQw � CwðQw; SðtÞÞ
þ PaðQaðSðtÞÞÞQaðSðtÞÞ � CaðQaÞ
� Cf F � Ir�dt (1)
On the left-hand side, J measures the socially optimal value of theinitial stock of forest, S in ha and wood burning technology, K
measured as efficiency. The right-hand side maximises the sum ofdiscounted social net benefits from converting forests into agricul-tural land, converting wood resources into energy and augmentingcurrent forest stocks. The social discount rate is d. The three control(choice) variables measure levels of final wood energy consumption,Qw in TOE, rates of afforestation, F in ha and levels of investment inwood burning technology research, Ir in Sudanese Pounds (Ls). Theprice of wood energy, Pw, and the price of agricultural produce, Pa,are specified as inverse demands functions. The price of woodenergy also depends upon the prices of alternative fuels, Pi.
This study attempted to parameterise the analytical model ofHassan and Hertzler (1988), which derived analytical results foroptimal levels of use of fuelwood as well as its main substitutes.LPG, kerosene and electricity are the main alternative energysources to fuelwood in Sudan and are all currently domesticallysupplied. The present study, however, focused on solving foroptimal forest extraction regimes to supply wood energy underthe external costs of deforestation. This is because data are notavailable yet to empirically implement the full Hassan andHertzler (1988) model with all its components. However, theinfluence of pricing alternative energy sources on the fuelwoodmarket is modelled as a potential instrument of policy interven-tion through parameter Pi.
The cost of harvesting and transporting fuelwood, Cw, and thecost of producing agricultural goods, Ca, vary with quantityproduced. The cost of harvesting and transporting fuelwood isalso influenced by levels of forest stocks, S. With continueddeforestation in Sudan, forestland tends to recede further southfrom main consumption centres. This in turn leads to steadyescalation of transport costs. Afforestation, on the other hand, isassumed to proceed at a constant marginal cost per ha, Cf.
Qa measures agricultural output in tons as the product ofhectares of farmed land and agricultural yield (YA) in ton per ha. Inaddition to its effect on the cost of supplying wood energy,reduced forest stocks are a source of environmental externality onagriculture. As the vegetative cover is removed with tree cutting, a
ARTICLE IN PRESS
R. Hassan et al. / Energy Policy 37 (2009) 1195–1203 1197
number of its ecological services are degraded leading to increasedsoil erosion and loss of soil nutrients. This in consequence reducesagricultural productivity in the dryland mechanised farmingschemes, which are located downstream in the lower heavy clayedvalleys of the central parts of the country.2 Accordingly, theenvironmental externality is modelled here by specifying agricul-tural yields (YA), as a function of forest stocks, S (see Eq. (17)).
Forest stocks are governed by the following equation of motion:
S�
ðtÞ ¼ �WðKðtÞÞQw þ GðSðtÞÞ þ F (2)
On the left-hand side is the change over time in forest stocks. Onthe right-hand side, forest stocks are reduced by cutting of trees forfuelwood. The function W converts fuelwood in TOE into ha of forestand depends upon the stock of technology for wood energyconversion, K.3 Forest stocks increase with natural growth, G as afunction of the stock itself, and with afforestation, F. The stock oftechnology for wood energy conversion is also governed by anequation of motion:
K�
ðtÞ ¼ RðIrÞ (3)
This stock increases over time with research and dissemination ofimproved conversion technologies, R, as a function of investment, Ir.
4
2.1. Maximum principle solutions
The maximum principle solutions are obtained by maximisingthe Hamiltonian, H, which measures dynamic benefits at time t.
HðtÞ ¼ e�dt½PwðQw; PiÞQw � CwðQw; SðtÞÞ
þ PaðQaÞQaðSðtÞÞ � CaðQaÞ � Cf F � Ir�
þ lðtÞ½�WðKðtÞÞQw þ GðSðtÞÞ þ F� þ cðtÞRðIrÞ (4)
The co-state variables l and c are the implicit dynamic pricesfor stocks of forest and energy conversion technology, respec-tively. Dynamic costs to future generations of reduced stocks offorest (as measured by l) need to be subtracted from total benefitsto derive dynamic social benefits. Similarly the benefits to futuregenerations of increased stocks of energy conversion technology(as measured by c) need to be added. The system of first orderconditions (FOC) derived from the Hamiltonian is given below.5
qHðtÞ
qQw¼ 0 ¼ e�dt Pw �
qCw
qQw
� �� lðtÞWðKðtÞÞ (5)
�qHðtÞ
qSðtÞ¼ l�
ðtÞ ¼ � e�dt �qCw
qSðtÞþ Pa
qQa
qSðtÞ
� �þ l tð Þ
qG
qSðtÞ
� �(6)
qHðtÞ
qF¼ 0 ¼ �e�dtCf þ lðtÞ (7)
2 Other formulations considered a dual effect of deforestation on agricultural
productivity. Ehui and Hertel (1989), for instance modelled agricultural yields to
be increasing with tropical deforestation (due to the nutrients released from ash
left after burning the forest), but decreasing with cumulative deforestation (e.g.
reduced stocks). This, however, does not seem to be the case in semi-arid Sudan.3 W(K) represents a composite measure of the efficiency of wood burning
technology that can improve over the range 0–100%. However, gains in efficiency are
assumed to become more difficult to achieve at higher technology stock levels. In
other words, W increases with K at a decreasing rate (Hassan and Hertzler, 1988).4 It would be possible to model investment in research and dissemination of
efficient wood energy conversion (Ir) as a function of the stock S as some government
programs to improve the efficiency of wood burning technologies have been initiated in
response to the increased scarcity and growing pressure on timber resources (Hassan,
1984; Dufournaud et al., 1995). For lack of necessary data on levels of investments such
an induced innovation type of hypothesis could not be empirically implemented.5 Note that inverse demand functions (P) are not differentiated with their
respective quantities (Q) for finding a dynamic social equilibrium, as that would
imply market power. The assumption of market power is incompatible with social
optimality in imperfect markets.
qHðtÞ
qlðtÞ¼ S�
ðtÞ ¼ �WðKðtÞÞQw þ GðSðtÞÞ þ F (8)
qHðtÞ
qIr¼ 0 ¼ �e�dt þ cðtÞ
qR
qIr(9)
�qHðtÞ
qKðtÞ¼ c�
ðtÞ ¼ lðtÞQwqWðKðtÞÞ
qKðtÞ(10)
qHðtÞ
qcðtÞ¼ K�
ðtÞ ¼ RðIrÞ (11)
In Eq. (5), optimal harvesting for energy should equate the priceof fuelwood to the marginal costs of cutting, transporting andconverting fuelwood into heat energy plus the marginal costs tofuture generations from reducing timber stocks. Eq. (6) showshow the implicit price of timber resources changes over time withthe dynamic costs of reducing timber stocks, external costs toagriculture and lost growth of forest stocks. Eq. (7) equates themarginal costs of afforestation with the marginal benefits of foreststocks. This condition assumes that mature and immature treeshave the same value. A more appropriate pricing shoulddifferentiate between the two values.6 Eq. (8) is just the equationof motion for stocks of forests. Eq. (9) requires the opportunitycost of one monetary unit invested in wood burning technology toequal the marginal benefits from increasing efficiency in woodenergy conversion. Eq. (10) relates the change in the implicit priceof wood burning technology to the value of conserving forests.Finally, Eq. (11) is just the equation of motion for stocks of woodburning technology.
Based on the above system of FOC equations, the sociallyoptimal programme for cutting forests and woodlands for energypurposes over time can be better described by an extension of theHotelling Rule (Clark, 2000; Hotelling, 1931). Derivation is inAppendix A.
Pw
�
Pw � ðqCw=qQwÞ¼ d�
qG
qSðtÞ
þqCw=qSðtÞ � Pa qQa=qSðtÞ
Pw � ðqCw=qQwÞWðKðtÞÞ
þqW=qKðtÞ
WðKðtÞÞKðtÞ�
(12)
In the standard Hotelling Rule (Hotelling, 1931) the net marketprice of forest resources grows at the social discount rate. Forrenewable resources without technology, a larger stock contributesto higher growth, which decreases timber scarcity in the future,causing net prices to grow at a rate smaller than the discount rate.The external effect of higher stocks works in the opposite directionas it increases the value of forest resources, causing net prices togrow relatively faster than the social discount rate. For renewableforest stocks with stocks of wood burning technology in Eq. (12),better technology also increases the value of forest resources,causing net prices to grow relatively faster.
A socially optimal programme for management of naturalforests and woodlands can be obtained from a desirable steady-state (SS) solution. The SS solution maintains standing timberstocks at a fixed optimum level indefinitely with a well-implemented policy of a constant but positive royalty (implicitprice) on woodcutting. To derive the SS solution for the abovemodel, the change in both S and l are set equal to zero (constantstock and price over time) in Eqs. (6) and (8). The systemof equations consisting of Eq. (5) and its differential with t plusEqs. (6) and (8) is then solved for equilibrium levels of Q*(t)W,
6 See Vincent (1999) for a generalised treatment of this aspect of net
accumulation in timber resources.

ARTICLE IN PRESS
R. Hassan et al. / Energy Policy 37 (2009) 1195–12031198
S*(t), F*(t) and l*(t). In terms of the current value Hamiltonian,this requires the satisfaction of the following SS optimalitycondition for the above model:
d ¼qG
qSðtÞ�
qCw=qSðtÞ � Pa qQa=qSðtÞ
Pw � ðqCw=qQwÞWðKðtÞÞ (13)
Eq. (13) can be solved analytically for optimal SS stock levelsS*(t) as a function of all relevant policy intervention parameters,such as afforestation, demand, supply, prices and wood energyconversion technology parameters. The solution can then be usedto perform comparative static’s analysis to determine thedirection of impacts of changes in policy instruments on optimalSS stock levels. This study, however, will attempt to evaluate suchimpacts empirically by numerically specifying and solving therelationship between S*(t) (as well as other choice variables) andthe policy instruments implicit in Eq. (13) above.
The model will be parameterised and used in the followingsections to solve for optimal timber extraction and afforestationprograms as well as for determining implicit timber prices. Modelsolutions will also be used to evaluate the optimality of currentforest management (harvesting and pricing policies) as simulatedusing the same model and its measured parameters.
3. Empirical specification of model parameters
The above model is empirically specified to represent anaggregate fuelwood market and agricultural production fromdryland farming, which typically replaces forest and woodlands inSudan. Data used for model specifications were obtained fromvarious sources of the most recent relevant secondary data (TheForestry National Corporation—FNC, Ministry of Energy andMining—ME&M, Ministry of Economic Planning—MEP, andMinistry of Agriculture and Natural Resources—MA&NR). Due tounavailability of data for empirically specifying parameters ofsome components of the model certain features were suppressedin the empirical simulation such as those dealing with theinfluences of alternative energy sources and investment inefficient wood conversion technologies. However, the impact ofchanges in these factors is analysed in the sensitivity analysessection to evaluate their important policy implications.
3.1. The fuelwood market
Data from national surveys conducted by the National EnergyAdministration of the ME&M were used to empirically specify themodel parameters. While no complete time series were available,the best available statistics of relevance have been compiled fortwo time periods: 1984 and 2000. As seen from the compiled datain Appendix B, Sudan consumed 0.19 and 0.16 TOE per capita in1984 and 2000, respectively (MEM (Ministry of Energy andMining), 2001 and FNC (Forestry National Corporation), 2000).This translates to 4.55 and 5.127 million TOE of total biomassenergy consumed in the respective years, equivalent to 2.47 and2.67 million ha of forestland, respectively.7 Prices fetched bycharcoal and fuelwood translate into weighted average prices ofUS$120 and $260/TOE ($83 and $180/mt dry wood) in year 1984and 2000, respectively. Following Barton et al. (1991) andDufournaud et al. (1995) a constant elasticity function wasspecified for wood energy demand. Due to lack of appropriatedata to econometrically measure elasticity of wood demand forSudan, a two-parameter function was calibrated to the observed
7 These calculations were based on the conversion factors presented in
Appendix C.
aggregate statistics for the two time periods (1984 and 2000) togenerate the following empirical per capita fuelwood demandfunction (see Appendix B for details on how empirical modelparameters were calibrated):
qW ðtÞ ¼ 0:551PW ðtÞ�0:222 (14)
where qW is per capita wood energy consumption in TOE and PW isthe fuelwood price $/TOE. Although the elasticity estimate fallswithin the range found in relevant literature on fuelwood demandof �0.17 to �2.82 (Bohi, 1981), it is low compared with the �1.1and �1.25 figures used by the above-mentioned studies in Sudan.The estimated parameter indicates high inelasticity of fuelwooddemand in Sudan to price changes during the covered period(1984–2000). This is not surprising as alternatives for switching toother fuels have been minimal during that period. A sensitivityanalysis will be performed to evaluate the effect of differentdemand structures (including substitution effects of alternativeenergy sources) on models solutions. Total demand for fuelwoodsQW is then specified as a function of changing population N(t) andper capita consumption qW(t):
QW ðtÞ ¼ NðtÞqW ðtÞ (15)
An aggregate fuelwood industry supply function was similarlyspecified by calibrating a two-parameter model to the two datapoints observed statistics on relevant variables. The calibratedempirical model was specified to capture the effects of depletingforest stocks S on the cost of harvesting and transport of fuelwoodand charcoal for longer distances to consumption centres reflectingscarcity of supply sources as forests recede further away withdepletion. The following relationship between the marginal cost(MCW) of harvesting and hauling wood energy, quantity of productdelivered QW and standing forest stocks S was accordingly specified:
MCW ðtÞ ¼qCW
qQW¼ 99:306QW ðtÞ � SðtÞ1:476 (16)
The above relationship shows that the cost of extraction andtransport of fuelwoods decreases with higher standing timber stocklevels (reflecting shorter distances and less effort) at a decreasingrate. In calibrating the model to the observed data it was assumedthat the fuelwood industry is competitive with its many privatesuppliers, employing the same technology to maximise profits suchthat the aggregate market is clearing at the point where marginalcost (MCW) is equated to price PW.
3.2. The dryland agricultural produce market
An aggregate supply function of a composite agriculturalproduct from the rainfed sector in Sudan is estimated usingavailable data. The aggregate supply curve is the product of totalarea under dryland agriculture (A) and a yield function. Asmentioned earlier, currently 40% of the deforestation in Sudan isattributed to clearing of land for mechanised agriculture andhence 40% of the reduced forest area is converted to agriculturalland while the remaining 60% is lost as unproductive land. Thecomposite yield relationship (YA) is specified to reflect theexternal impacts of deforestation on agricultural productivity.The specified yield function was then calibrated to availablestatistics on sorghum yields and standing forest stocks for theyears 1958 and 2000 (MA&NR, FNC, FAO).8
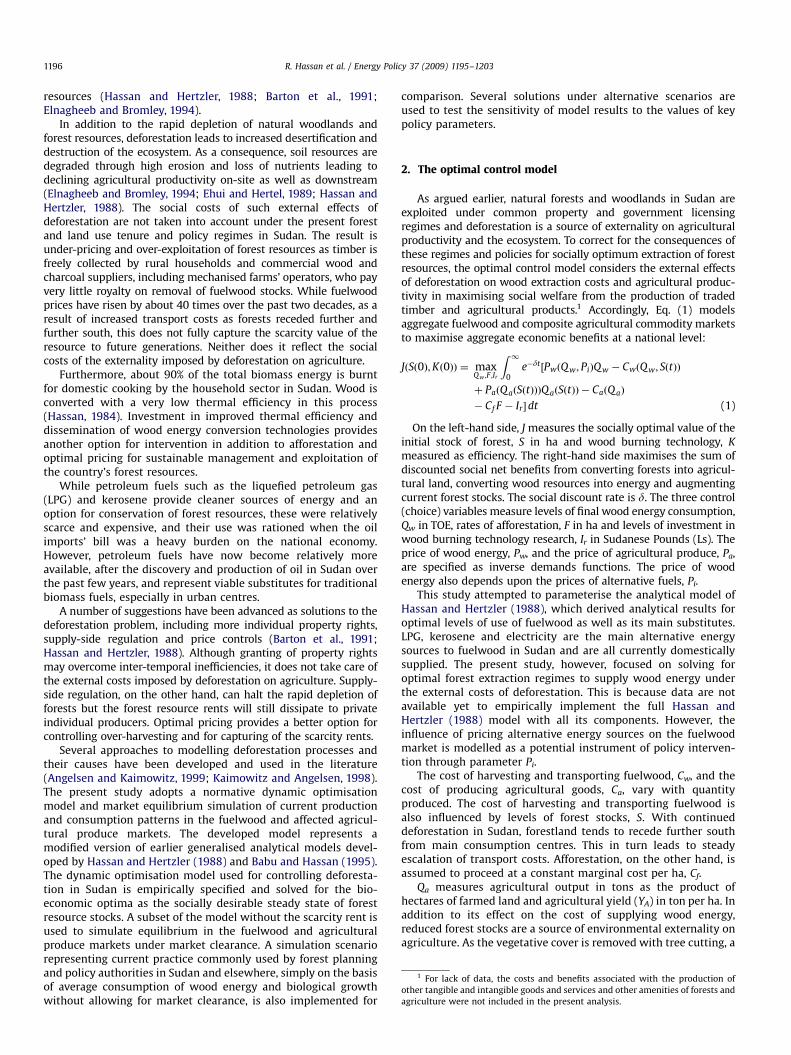
YA ¼ 1:388ð1� e�0:01�SÞ (17)
8 This was based on available data on yield of the major crop (sorghum)
produced in the rainfed sector and area under forest for years 1958 and 2000 (FNC
(Forestry National Corporation), 2000; MA&NR (Ministry of Agriculture and
Natural Resources), undated; ME&M (Ministry of Energy and Mining), 1984, 2001).
ARTICLE IN PRESS
00.20.40.60.8
11.21.41.6
20 60 100
140
180
220
260
300
340
380
420
460
500
700
900
Million ha under forest
Yiel
d in
ton/
ha
Fig. 1. Agricultural yield and standing forest stocks in Sudan.
R. Hassan et al. / Energy Policy 37 (2009) 1195–1203 1199
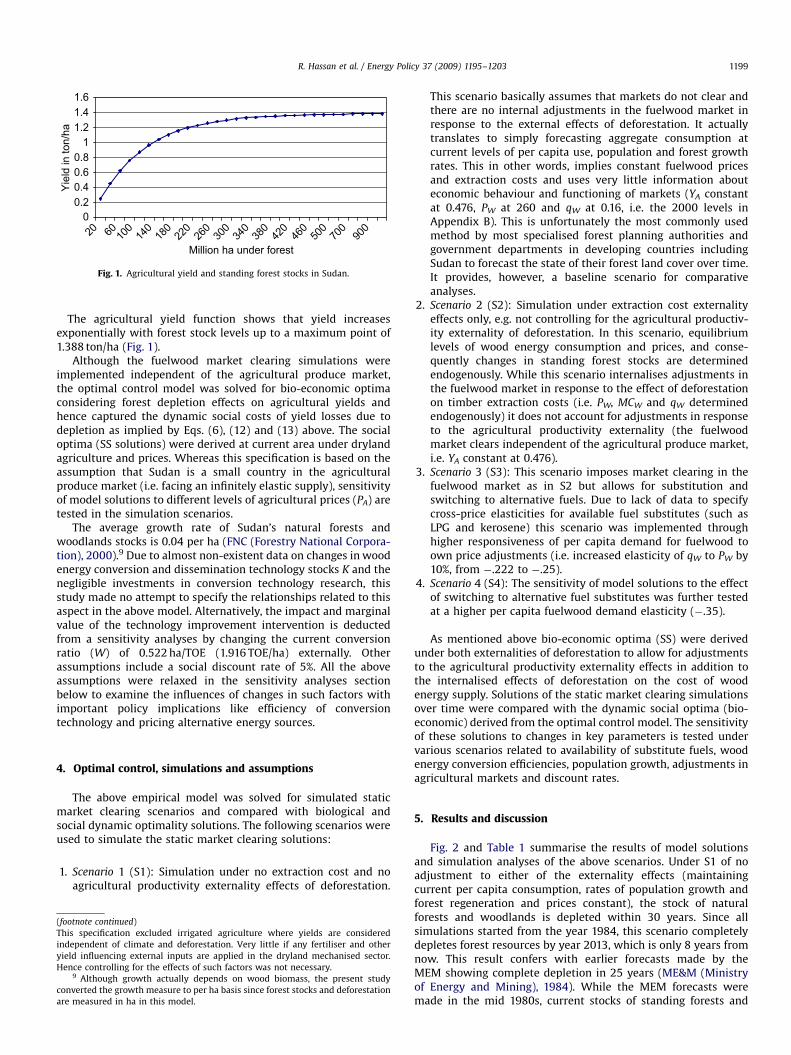
The agricultural yield function shows that yield increasesexponentially with forest stock levels up to a maximum point of1.388 ton/ha (Fig. 1).
Although the fuelwood market clearing simulations wereimplemented independent of the agricultural produce market,the optimal control model was solved for bio-economic optimaconsidering forest depletion effects on agricultural yields andhence captured the dynamic social costs of yield losses due todepletion as implied by Eqs. (6), (12) and (13) above. The socialoptima (SS solutions) were derived at current area under drylandagriculture and prices. Whereas this specification is based on theassumption that Sudan is a small country in the agriculturalproduce market (i.e. facing an infinitely elastic supply), sensitivityof model solutions to different levels of agricultural prices (PA) aretested in the simulation scenarios.
The average growth rate of Sudan’s natural forests andwoodlands stocks is 0.04 per ha (FNC (Forestry National Corpora-tion), 2000).9 Due to almost non-existent data on changes in woodenergy conversion and dissemination technology stocks K and thenegligible investments in conversion technology research, thisstudy made no attempt to specify the relationships related to thisaspect in the above model. Alternatively, the impact and marginalvalue of the technology improvement intervention is deductedfrom a sensitivity analyses by changing the current conversionratio (W) of 0.522 ha/TOE (1.916 TOE/ha) externally. Otherassumptions include a social discount rate of 5%. All the aboveassumptions were relaxed in the sensitivity analyses sectionbelow to examine the influences of changes in such factors withimportant policy implications like efficiency of conversiontechnology and pricing alternative energy sources.
4. Optimal control, simulations and assumptions
The above empirical model was solved for simulated staticmarket clearing scenarios and compared with biological andsocial dynamic optimality solutions. The following scenarios wereused to simulate the static market clearing solutions:
1.
(foo
Thi
ind
yiel
Hen
con
are
Scenario 1 (S1): Simulation under no extraction cost and noagricultural productivity externality effects of deforestation.
tnote continued)
s specification excluded irrigated agriculture where yields are considered
ependent of climate and deforestation. Very little if any fertiliser and other
d influencing external inputs are applied in the dryland mechanised sector.
ce controlling for the effects of such factors was not necessary.9 Although growth actually depends on wood biomass, the present study
verted the growth measure to per ha basis since forest stocks and deforestation
measured in ha in this model.
This scenario basically assumes that markets do not clear andthere are no internal adjustments in the fuelwood market inresponse to the external effects of deforestation. It actuallytranslates to simply forecasting aggregate consumption atcurrent levels of per capita use, population and forest growthrates. This in other words, implies constant fuelwood pricesand extraction costs and uses very little information abouteconomic behaviour and functioning of markets (YA constantat 0.476, PW at 260 and qW at 0.16, i.e. the 2000 levels inAppendix B). This is unfortunately the most commonly usedmethod by most specialised forest planning authorities andgovernment departments in developing countries includingSudan to forecast the state of their forest land cover over time.It provides, however, a baseline scenario for comparativeanalyses.
2.
Scenario 2 (S2): Simulation under extraction cost externalityeffects only, e.g. not controlling for the agricultural productiv-ity externality of deforestation. In this scenario, equilibriumlevels of wood energy consumption and prices, and conse-quently changes in standing forest stocks are determinedendogenously. While this scenario internalises adjustments inthe fuelwood market in response to the effect of deforestationon timber extraction costs (i.e. PW, MCW and qW determinedendogenously) it does not account for adjustments in responseto the agricultural productivity externality (the fuelwoodmarket clears independent of the agricultural produce market,i.e. YA constant at 0.476).3.
Scenario 3 (S3): This scenario imposes market clearing in thefuelwood market as in S2 but allows for substitution andswitching to alternative fuels. Due to lack of data to specifycross-price elasticities for available fuel substitutes (such asLPG and kerosene) this scenario was implemented throughhigher responsiveness of per capita demand for fuelwood toown price adjustments (i.e. increased elasticity of qW to PW by10%, from �.222 to �.25).4.
Scenario 4 (S4): The sensitivity of model solutions to the effectof switching to alternative fuel substitutes was further testedat a higher per capita fuelwood demand elasticity (�.35).As mentioned above bio-economic optima (SS) were derivedunder both externalities of deforestation to allow for adjustmentsto the agricultural productivity externality effects in addition tothe internalised effects of deforestation on the cost of woodenergy supply. Solutions of the static market clearing simulationsover time were compared with the dynamic social optima (bio-economic) derived from the optimal control model. The sensitivityof these solutions to changes in key parameters is tested undervarious scenarios related to availability of substitute fuels, woodenergy conversion efficiencies, population growth, adjustments inagricultural markets and discount rates.
5. Results and discussion
Fig. 2 and Table 1 summarise the results of model solutionsand simulation analyses of the above scenarios. Under S1 of noadjustment to either of the externality effects (maintainingcurrent per capita consumption, rates of population growth andforest regeneration and prices constant), the stock of naturalforests and woodlands is depleted within 30 years. Since allsimulations started from the year 1984, this scenario completelydepletes forest resources by year 2013, which is only 8 years fromnow. This result confers with earlier forecasts made by theMEM showing complete depletion in 25 years (ME&M (Ministryof Energy and Mining), 1984). While the MEM forecasts weremade in the mid 1980s, current stocks of standing forests and

ARTICLE IN PRESS
42
0
10
20
30
40
50
60
1984
1987
1990
1993
1996
1999
2002
2005
2008
2011
2014
2017
2020
2023
2026
2029
2032
2035
2038
2041
2044
2047
2050
2053
2056
YEAR
Mill
ion
ha
S1 S2 S3 S4 SS1
Fig. 2. Depletion of Sudan’s forest resources scenarios.
Table 1Socially optimal forest depletion in Sudan under alternative specifications of critical model parameters.
Bio-economic optima Stock levels
(million ha)
Annual timber consumption User
cost–dynamic
price ($/ha)
Price of fuel-
wood ($/TOE)
Agriculture yield
(ton/ha)TOE/capita Million TOE
1. Base Run (N ¼ 32, r ¼ 5%, wk ¼ 0.52) 38.61 0.096 3.07 4846 2615 0.445
2. Higher elasticity of demand for fuelwood
2.1. 10% higher (�0.25) 31.50 0.079 2.53 4359 2364 0.375
% Change from base-run (�18) (�18) (�18) (�10) (�10) (-16)2.2. 30% higher (�0.30) 21.76 0.056 1.78 3820 2078 0.271
% Change from base-run (�42) (�42) (�42) (�21) (�21) (�3)
3. Higher wood energy conversion
efficiency (10%)
35.30 0.098 3.13 4862 2403 0.413
% Change from base-run (�8) (+2) (+2) (+0.3) (�8) (�7)
4. Higher (10%) population (N ¼ 35) 41.91 0.095 3.33 5096 2743 0.475
% Change from base-run (+8.5) (�1) (+8.5) (+5) (+5) (+7)
5. Higher elasticity of agricultural yield
(�0.02)
37.35 0.093 2.98 5619 3019 0.433
% Change from base-run (�3) (�3) (�3) (+16) (+16) (�3)
6. Higher social discount rate (r ¼ 7.5%) 49.07 0.121 3.88 1625 920 0.538
% Change from base-run (+27) (+27) (+27) (�66) (�66) (+21)
7. Higher agricultural prices (10%) 38.26 0.095 3.05 5047 2720 0.441
% Change from base-run (�1) (�1) (�1) (�4) (�4) (�1)
Biological optima 42.00 0.104 3.34 5107 2748 0.476
% Deviation from base run steady state (+8.5) (+8.5) (+8.5) (+5) (+5) (+7)
R. Hassan et al. / Energy Policy 37 (2009) 1195–12031200
woodlands are estimated at 42 million ha in year 2000 (FNC(Forestry National Corporation), 2000). This clearly shows thedeficiencies of such an approach to predicting the state of forestand woodland resources, which unfortunately remains the typicaland most common method used in many countries.
To address the deficiencies of the above approach the modelwas solved under S2, which uses available information on theeconomics of supply and demand in the fuelwood marketimposing market clearance and hence internalising the forestdepletion effects on fuelwood supply costs, prices and per capitaconsumption. This scenario is implemented by imposing theequilibrium condition MCW(t) ¼ PW(t) using Eqs. (14)–(16) When
the fuelwood market was allowed to adjust to the extraction costexternality of deforestation (S2), higher wood energy prices andlower per capita consumption rates were achieved and the foreststocks lasted for 8 more years, i.e. 38 years in total (Fig. 2 andTable 1). The growth in aggregate consumption of wood energy inthis case was basically driven by population growth and relativescarcity of alternative energy sources. This scenario is consistentwith available information on wood energy prices that more thandoubled between 1984 and 2000, indicating that the fuelwoodmarket does actually adjust to movements in extraction costsdue to recession of the forest cover. Charcoal and wood arecurrently transported for more than 600 km from production

ARTICLE IN PRESS
R. Hassan et al. / Energy Policy 37 (2009) 1195–1203 1201
areas (where forests are still there) to major consumption centres,compared with an average distance of about only 300 km inthe 1980s.
Forest stocks lasted even longer when switching to fuelsubstitutes was allowed through higher sensitivity of per capitademand for fuelwoods to movements in relative prices under S3and S4. A moderate increase in the responsiveness of per capitademand for fuelwoods to relative prices from �.222 to �.35 underS4 extended the life of forest stocks into the late 2050s, which ismore than double the life predicted under S1. This shows thesensitivity of the simulation results to specifications of marketdemand structures in presence of substitutes. While the lowerelasticity parameter of �.222 reflects the actual situation of lessflexibility and limited choices prior to year 2000, when alternativeenergy sources (LPG and kerosene) were relatively scarce andrationed with the consequent high opportunity cost of time spentqueuing at distribution centres. The situation in Sudan haschanged since then as the discovery and production of oil madefuel substitutes such as LPG and kerosene more availableespecially for urban users, which suggests less restrictivestructures and more elastic demand for fuelwood.
Fig. 2 also plots the bio-economic optimum giving a SS solutionvalue of 38.6 million ha of forest stocks. This is not very far fromthe most recent estimate of standing forest stocks of 42 million hain year 2000 (also shown on Fig. 2 as the horizontal line)suggesting the need for urgent and more effective measures andinterventions to curb deforestation in Sudan. The baseline SSsolution was derived at a 5% social discount rate and the aboveestimates of demand and supply parameters and wood energyconversion efficiencies. The SS solution was also based on the2000 population. The sensitivity of the dynamic social optimumto variations in the parameters has been tested under differentscenarios as compared in Table 1.
10 Following the suggestion of one of the unanimous reviewers the model was
solved at even higher social discount rates (up to 15%) reflecting the greater
importance of immediate survival needs in the planning horizons of the poor. As
expected this supports even higher levels of consumption at much lower timber
conservation (future) values (i.e. user costs).
6. Sensitivity analysis and policy scenarios
The optimal control model determined a social optimum at aSS level of forest stocks of 38.61 million ha for the year 2000population, base run parameter values and a 5% social discountrate (Row 1 of Table 1). While the bio-economic optimum stocklevel determined under the base run scenario is close to recentstock estimates (2000), it could only support 40% of per capita use(0.096 TOE) and 33% of total wood energy consumption (3.07million TOE) of corresponding current consumption levels.
The above results largely depend on a few key parametersmeasuring the structure of demand and supply of wood energyand rainfed agricultural products as well as population. Thesensitivity and robustness of the optimal control model solutionsto variations in critical parameter values are accordingly exam-ined in this section. The values of four key parameters are variedto perform the sensitivity analyses, namely the price elasticityof demand for wood energy, wood energy conversionefficiency, population and the agricultural yield externality effectparameters.
Lower optimal wood stock and consumption levels are neededunder the more flexible (elastic) structures of wood energydemand that allow for higher substitution possibilities (Row 2of Table 1). These also are realised at lower user costs and pricesbut support lower agricultural yields. On the other hand, higherconsumption of wood energy could be supported by lower SSstock levels and lower prices with much less reduction inagricultural yields if the efficiency of converting wood energy isimproved by 10% (Row 3). Higher stocks are required to supporthigher consumption levels with population growth, certainly athigher costs but some gains in agricultural productivity (Row 4).
The opportunity cost of the agricultural productivity externalityeffects of forest depletion on prices of wood energy is relativelyhigher than their physical impacts. Slight changes in stock andconsumption levels of wood energy result from doubling yieldelasticity value (Row 5). Movements in agricultural prices lead toimpacts similar to the yield scenario (Row 7).
Results of the slightly higher social discount rate (Row 6) leadto higher stock levels to support higher consumption of woodenergy and higher agricultural yields (+27%) but significantlyreduce (�66%) user costs (future value of an extra unit of stock).10
Improving substitution possibilities seems to show the highestpotential for reduced wood energy consumption (�18%) but that,however, is achieved at high long-term social costs if oneconsiders the consequent reduction in agricultural yields (�16%)compared with the second best option of improved energyconversion efficiencies.
The other policy instrument for managing over-harvesting ofwood resources is finding ways to recover the resource rent (usercost). This does seem to be the hard option since on the optimalcontrol SS path the current value (un-discounted) user cost(implicit price) of timber is $4846/ha (base run), while thegovernment of Sudan was charging only about $20/ha on clearingforestland for charcoal and much less for fuelwood (ME&M(Ministry of Energy and Mining), 2001). This shows that thecurrent royalty on timber cutting is negligible compared with theoptimal value of the resource (resource rent) leading to over-harvesting of timber (5.127 TOE, which is 67% higher than theoptimal SS consumption rate of 3.07 TOE per annum). At the sametime, the socially optimal wood energy consumption level of 3.07implied a wood energy price of $2615/TOE, which is 10 times theobserved 2000 price. While the recent flexibility in substitutionslowed growth in demand for wood energy and eased the pressureon prices, the gap between current royalties on clearing of forestsand woodlands in Sudan remains huge. More over, the fact thatabout two thirds of total biomass energy consumption comesfrom firewood (Appendix C), mostly harvested under open accessconditions, complicates the feasibility of using the royaltycollection option.
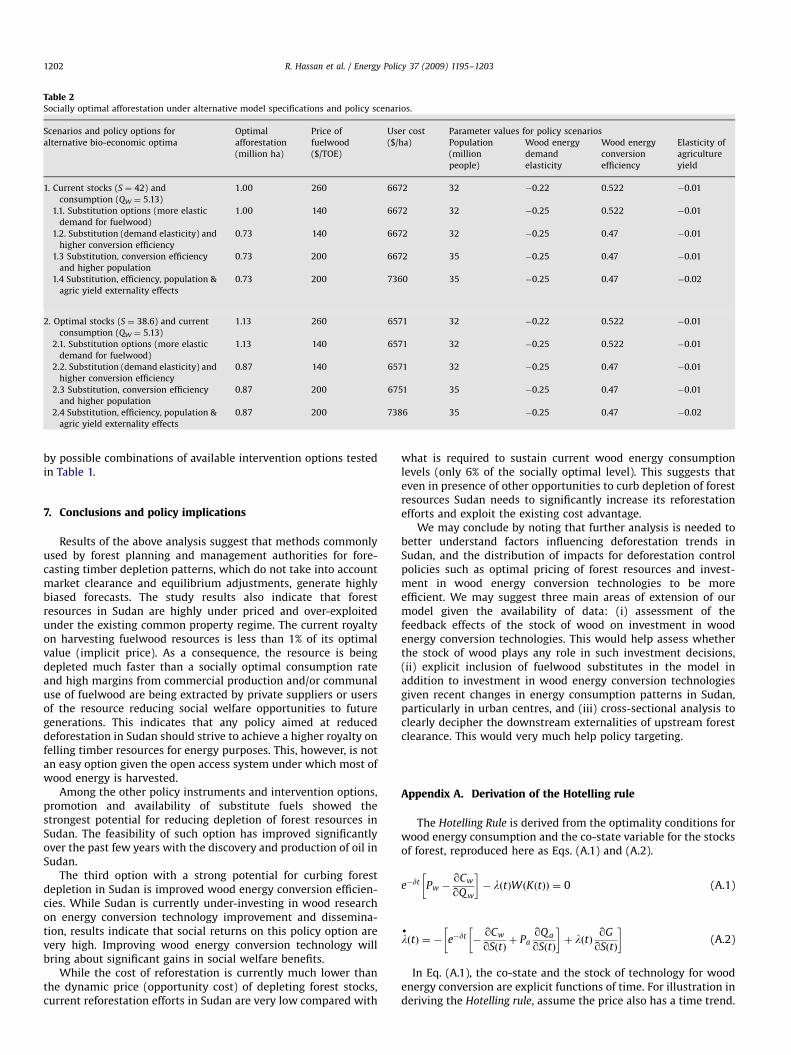
Afforestation is an alternative or complementary interventionoption for sustainable management of Sudan’s forest and wood-land resources given the current low cost of reforestation(estimated at US$12/ha in 2000) compared with fuelwood pricesand user costs. Socially optimal reforestation efforts have there-fore been determined to sustain standing forest stocks underalternative policy scenarios (Table 2). To sustain current (2000)wood stock (42 million ha) and consumption levels (5.127 millionTOE) reforestation of about 1 million ha is required, which is morethan 16 times the current effort of only 60,000 ha/year. Under therealistic more elastic fuelwood demand, this effort would clear thewood energy market at lower prices for consumers. However,lower reforestation efforts (0.73 million ha) are needed underimproved conversion efficiencies. With higher population fuel-wood prices would have to adjust upwards to force per capitaconsumption match the growth in population and current levelsof consumption. User costs increase with higher external effects ofdepletion on agricultural productivity. Similar trends are obtainedwith relatively higher reforestation efforts if current consumptionlevels are to be sustained at the socially optimal (SS) forest stocksof 38.61 million ha or any other lower SS stock levels determined
ARTICLE IN PRESS
Table 2Socially optimal afforestation under alternative model specifications and policy scenarios.
Scenarios and policy options for
alternative bio-economic optima
Optimal
afforestation
(million ha)
Price of
fuelwood
($/TOE)
User cost
($/ha)
Parameter values for policy scenarios
Population
(million
people)
Wood energy
demand
elasticity
Wood energy
conversion
efficiency
Elasticity of
agriculture
yield
1. Current stocks (S ¼ 42) and
consumption (QW ¼ 5.13)
1.00 260 6672 32 �0.22 0.522 �0.01
1.1. Substitution options (more elastic
demand for fuelwood)
1.00 140 6672 32 �0.25 0.522 �0.01
1.2. Substitution (demand elasticity) and
higher conversion efficiency
0.73 140 6672 32 �0.25 0.47 �0.01
1.3 Substitution, conversion efficiency
and higher population
0.73 200 6672 35 �0.25 0.47 �0.01
1.4 Substitution, efficiency, population &
agric yield externality effects
0.73 200 7360 35 �0.25 0.47 �0.02
2. Optimal stocks (S ¼ 38.6) and current
consumption (QW ¼ 5.13)
1.13 260 6571 32 �0.22 0.522 �0.01
2.1. Substitution options (more elastic
demand for fuelwood)
1.13 140 6571 32 �0.25 0.522 �0.01
2.2. Substitution (demand elasticity) and
higher conversion efficiency
0.87 140 6571 32 �0.25 0.47 �0.01
2.3 Substitution, conversion efficiency
and higher population
0.87 200 6751 35 �0.25 0.47 �0.01
2.4 Substitution, efficiency, population &
agric yield externality effects
0.87 200 7386 35 �0.25 0.47 �0.02
R. Hassan et al. / Energy Policy 37 (2009) 1195–12031202
by possible combinations of available intervention options testedin Table 1.
7. Conclusions and policy implications
Results of the above analysis suggest that methods commonlyused by forest planning and management authorities for fore-casting timber depletion patterns, which do not take into accountmarket clearance and equilibrium adjustments, generate highlybiased forecasts. The study results also indicate that forestresources in Sudan are highly under priced and over-exploitedunder the existing common property regime. The current royaltyon harvesting fuelwood resources is less than 1% of its optimalvalue (implicit price). As a consequence, the resource is beingdepleted much faster than a socially optimal consumption rateand high margins from commercial production and/or communaluse of fuelwood are being extracted by private suppliers or usersof the resource reducing social welfare opportunities to futuregenerations. This indicates that any policy aimed at reduceddeforestation in Sudan should strive to achieve a higher royalty onfelling timber resources for energy purposes. This, however, is notan easy option given the open access system under which most ofwood energy is harvested.
Among the other policy instruments and intervention options,promotion and availability of substitute fuels showed thestrongest potential for reducing depletion of forest resources inSudan. The feasibility of such option has improved significantlyover the past few years with the discovery and production of oil inSudan.
The third option with a strong potential for curbing forestdepletion in Sudan is improved wood energy conversion efficien-cies. While Sudan is currently under-investing in wood researchon energy conversion technology improvement and dissemina-tion, results indicate that social returns on this policy option arevery high. Improving wood energy conversion technology willbring about significant gains in social welfare benefits.
While the cost of reforestation is currently much lower thanthe dynamic price (opportunity cost) of depleting forest stocks,current reforestation efforts in Sudan are very low compared with
what is required to sustain current wood energy consumptionlevels (only 6% of the socially optimal level). This suggests thateven in presence of other opportunities to curb depletion of forestresources Sudan needs to significantly increase its reforestationefforts and exploit the existing cost advantage.
We may conclude by noting that further analysis is needed tobetter understand factors influencing deforestation trends inSudan, and the distribution of impacts for deforestation controlpolicies such as optimal pricing of forest resources and invest-ment in wood energy conversion technologies to be moreefficient. We may suggest three main areas of extension of ourmodel given the availability of data: (i) assessment of thefeedback effects of the stock of wood on investment in woodenergy conversion technologies. This would help assess whetherthe stock of wood plays any role in such investment decisions,(ii) explicit inclusion of fuelwood substitutes in the model inaddition to investment in wood energy conversion technologiesgiven recent changes in energy consumption patterns in Sudan,particularly in urban centres, and (iii) cross-sectional analysis toclearly decipher the downstream externalities of upstream forestclearance. This would very much help policy targeting.
Appendix A. Derivation of the Hotelling rule
The Hotelling Rule is derived from the optimality conditions forwood energy consumption and the co-state variable for the stocksof forest, reproduced here as Eqs. (A.1) and (A.2).
e�dt Pw �qCw
qQw
� �� lðtÞWðKðtÞÞ ¼ 0 (A.1)
l�
ðtÞ ¼ � e�dt �qCw
qSðtÞþ Pa
qQa
qSðtÞ
� �þ lðtÞ
qG
qSðtÞ
� �(A.2)
In Eq. (A.1), the co-state and the stock of technology for woodenergy conversion are explicit functions of time. For illustration inderiving the Hotelling rule, assume the price also has a time trend.
ARTICLE IN PRESS
R. Hassan et al. / Energy Policy 37 (2009) 1195–1203 1203
Differentiate with respect to time.
�de�dt Pw �qCw
qQw
� �þ e�dt Pw
�
� l�
ðtÞWðKðtÞÞ � lðtÞqW
qKðtÞKðtÞ�
¼ 0
(A.3)
Rearrange Eq. (A.1) to solve for the co-state multiplied by theconversion factor.
lðtÞWðKðtÞÞ ¼ e�dt Pw �qCw
qQw
� �(A.4)
Divide both sides of Eq. (A.3) by Eq. (A.4).
�d þPw
�
Pw � ðqCw=qQwÞ�
l�
ðtÞ
lðtÞ�
qW=qKðtÞ
WðKðtÞÞKðtÞ�
¼ 0 (A.5)
From Eqs. (A.2) and (A.4), the rate of change in the co-state is
l�
ðtÞ
lðtÞ¼qCw=qSðtÞ � Pa qQa=qSðtÞ
Pw � ðqCw=qQwÞWðKðtÞÞ �
qG
qSðtÞ(A.6)
Finally, substitute Eq. (A.6) into Eq. (A.5) and rearrange to getthe Hotelling rule:
Pw
�
Pw � ðqCw=qQwÞ¼ d�
qG
qSðtÞ
þqCw=qSðtÞ � Pa qQa=qSðtÞ
Pw � ðqCw=qQwÞWðKðtÞÞ
þqW=qKðtÞ
WðKðtÞÞKðtÞ�
(A.7)
Appendix B
See Table B1.
Appendix C
See Table C1.
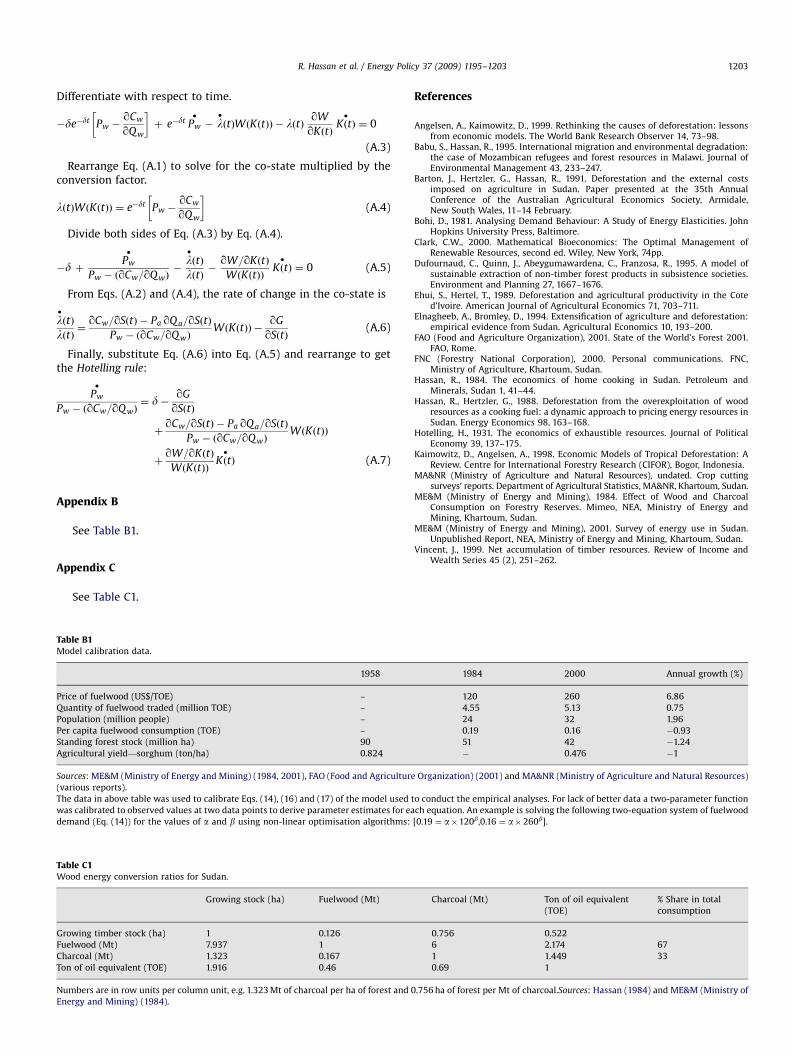
Table B1Model calibration data.
1958
Price of fuelwood (US$/TOE) –
Quantity of fuelwood traded (million TOE) –
Population (million people) –
Per capita fuelwood consumption (TOE) –
Standing forest stock (million ha) 90
Agricultural yield—sorghum (ton/ha) 0.824
Sources: ME&M (Ministry of Energy and Mining) (1984, 2001), FAO (Food and Agriculture
(various reports).
The data in above table was used to calibrate Eqs. (14), (16) and (17) of the model used
was calibrated to observed values at two data points to derive parameter estimates for ea
demand (Eq. (14)) for the values of a and b using non-linear optimisation algorithms:
Table C1Wood energy conversion ratios for Sudan.
Growing stock (ha) Fuelwood (Mt)
Growing timber stock (ha) 1 0.126
Fuelwood (Mt) 7.937 1
Charcoal (Mt) 1.323 0.167
Ton of oil equivalent (TOE) 1.916 0.46
Numbers are in row units per column unit, e.g. 1.323 Mt of charcoal per ha of forest and 0
Energy and Mining) (1984).
References
Angelsen, A., Kaimowitz, D., 1999. Rethinking the causes of deforestation: lessonsfrom economic models. The World Bank Research Observer 14, 73–98.
Babu, S., Hassan, R., 1995. International migration and environmental degradation:the case of Mozambican refugees and forest resources in Malawi. Journal ofEnvironmental Management 43, 233–247.
Barton, J., Hertzler, G., Hassan, R., 1991. Deforestation and the external costsimposed on agriculture in Sudan. Paper presented at the 35th AnnualConference of the Australian Agricultural Economics Society, Armidale,New South Wales, 11–14 February.
Bohi, D., 1981. Analysing Demand Behaviour: A Study of Energy Elasticities. JohnHopkins University Press, Baltimore.
Clark, C.W., 2000. Mathematical Bioeconomics: The Optimal Management ofRenewable Resources, second ed. Wiley, New York, 74pp.
Dufournaud, C., Quinn, J., Abeygumawardena, C., Franzosa, R., 1995. A model ofsustainable extraction of non-timber forest products in subsistence societies.Environment and Planning 27, 1667–1676.
Ehui, S., Hertel, T., 1989. Deforestation and agricultural productivity in the Coted’Ivoire. American Journal of Agricultural Economics 71, 703–711.
Elnagheeb, A., Bromley, D., 1994. Extensification of agriculture and deforestation:empirical evidence from Sudan. Agricultural Economics 10, 193–200.
FAO (Food and Agriculture Organization), 2001. State of the World’s Forest 2001.FAO, Rome.
FNC (Forestry National Corporation), 2000. Personal communications. FNC,Ministry of Agriculture, Khartoum, Sudan.
Hassan, R., 1984. The economics of home cooking in Sudan. Petroleum andMinerals, Sudan 1, 41–44.
Hassan, R., Hertzler, G., 1988. Deforestation from the overexploitation of woodresources as a cooking fuel: a dynamic approach to pricing energy resources inSudan. Energy Economics 98, 163–168.
Hotelling, H., 1931. The economics of exhaustible resources. Journal of PoliticalEconomy 39, 137–175.
Kaimowitz, D., Angelsen, A., 1998. Economic Models of Tropical Deforestation: AReview. Centre for International Forestry Research (CIFOR), Bogor, Indonesia.
MA&NR (Ministry of Agriculture and Natural Resources), undated. Crop cuttingsurveys’ reports. Department of Agricultural Statistics, MA&NR, Khartoum, Sudan.
ME&M (Ministry of Energy and Mining), 1984. Effect of Wood and CharcoalConsumption on Forestry Reserves. Mimeo, NEA, Ministry of Energy andMining, Khartoum, Sudan.
ME&M (Ministry of Energy and Mining), 2001. Survey of energy use in Sudan.Unpublished Report, NEA, Ministry of Energy and Mining, Khartoum, Sudan.
Vincent, J., 1999. Net accumulation of timber resources. Review of Income andWealth Series 45 (2), 251–262.
1984 2000 Annual growth (%)
120 260 6.86
4.55 5.13 0.75
24 32 1.96
0.19 0.16 �0.93
51 42 �1.24
� 0.476 �1
Organization) (2001) and MA&NR (Ministry of Agriculture and Natural Resources)
to conduct the empirical analyses. For lack of better data a two-parameter function
ch equation. An example is solving the following two-equation system of fuelwood
[0.19 ¼ a�120b,0.16 ¼ a�260b].
Charcoal (Mt) Ton of oil equivalent
(TOE)
% Share in total
consumption
0.756 0.522
6 2.174 67
1 1.449 33
0.69 1
.756 ha of forest per Mt of charcoal.Sources: Hassan (1984) and ME&M (Ministry of