Embed Size (px)
Citation preview
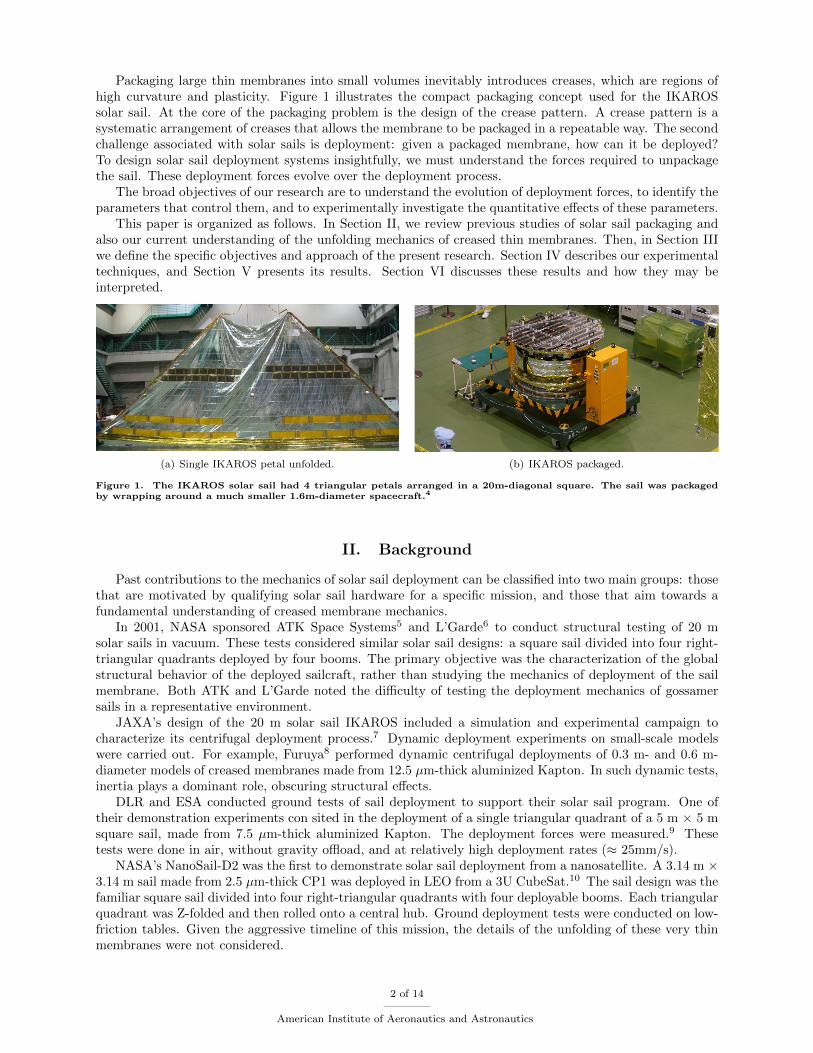
Deployment Mechanics of Highly Compacted Thin
Membrane Structures
Manan Arya∗ and Sergio Pellegrino†
California Institute of Technology, Pasadena, CA 91125
We studied the effects of membrane thickness and crease density on the forces requiredto unfold creased membrane structures. 26 cm-diameter models were made using twodifferent thicknesses (7.5 µm and 25 µm) of polyimide film, and wrapped around a 4 cm-diameter hub using two different crease densities. They were deployed quasi-statically,and the deployment forces were measured. Two regimes were observed: an initial phase(up to about 85% deployed) of low and variable stiffness, and a second phase (above 85%deployed) of high stiffness. The thinner membrane models required higher deploymentforces than the thicker membrane models during the initial phase.
Nomenclature
n Polygonal degree of the central hubr Center-to-vertex radius of the central hubj Number of radial tabs in the crease patterns Layer spacing in the packaged membraneq Linear positioner displacementN Total number of creases in the crease patternh Membrane thicknessfx, fy Force componentsf Force magnitudeε1, ε2 Measured force sensor strainsdx, dy Force sensor deflectionsS Force sensor compliance matrixS1x, S2x, S1y, S2y Force sensor compliance matrix componentsC Force sensor stiffness matrixCx1, Cx2, Cy1, Cy2 Force sensor stiffness matrix componentsD Partially deployed membrane diameterDf Fully deployed membrane diameter
I. Introduction and Motivation
Solar sails and small spacecraft exhibit great synergy. Solar sails provide propellant-free propulsion forsmall spacecraft, freeing up valuable mass and volume, and small spacecraft offer low payload mass and
therefore relatively high acceleration, even with the low thrust produced by solar sails. Recent advances inthe miniaturization of spacecraft (e.g. CubeSats) have led to many new mission concepts that leverage thissynergy.1,2, 3 The motivation for our work is to enable highly capable solar sails for small spacecraft.
To minimize mass, solar sails are made from ultra-thin membranes. To maximize thrust, they needto have large area. This combination of large-area and low-thickness leads to challenges in packaging anddeployment.
∗Graduate Student, Graduate Aerospace Laboratories, 1200 E. California Blvd. MC 205-45. AIAA Student Member.†Joyce and Kent Kresa Professor of Aeronautics and Professor of Civil Engineering, Graduate Aerospace Laboratories, 1200
E. California Blvd. MC 301-46. AIAA Fellow.
1 of 14
American Institute of Aeronautics and Astronautics
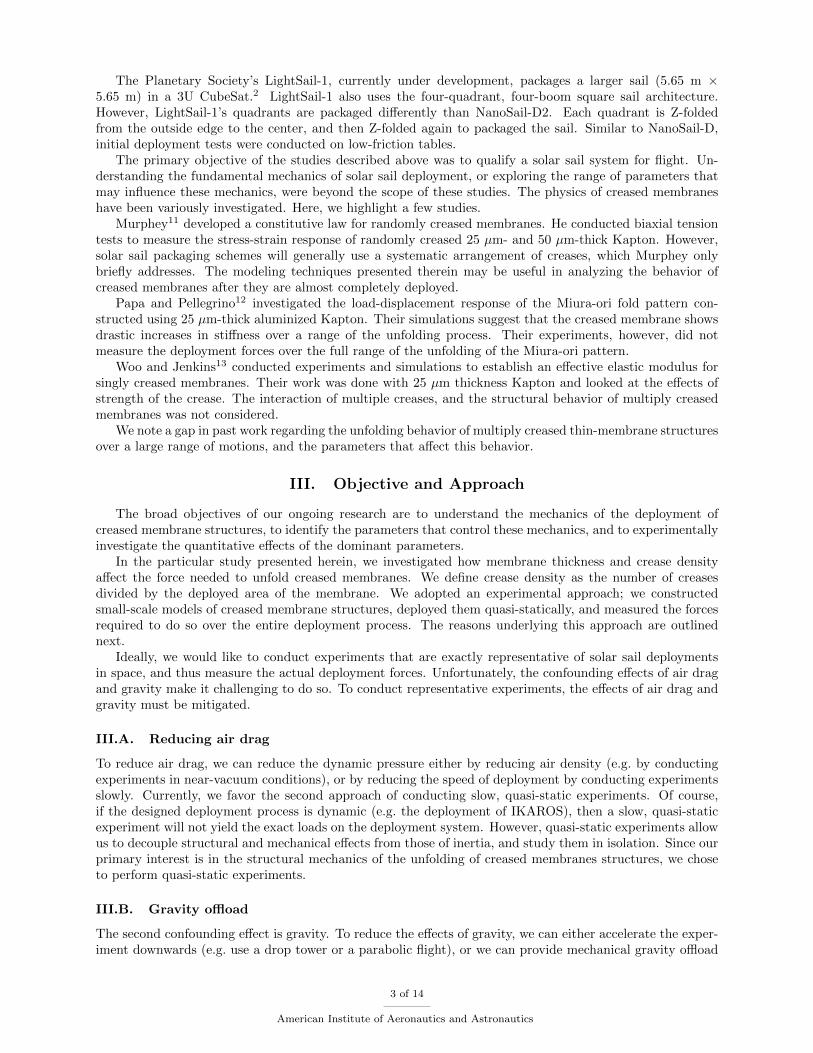
Packaging large thin membranes into small volumes inevitably introduces creases, which are regions ofhigh curvature and plasticity. Figure 1 illustrates the compact packaging concept used for the IKAROSsolar sail. At the core of the packaging problem is the design of the crease pattern. A crease pattern is asystematic arrangement of creases that allows the membrane to be packaged in a repeatable way. The secondchallenge associated with solar sails is deployment: given a packaged membrane, how can it be deployed?To design solar sail deployment systems insightfully, we must understand the forces required to unpackagethe sail. These deployment forces evolve over the deployment process.
The broad objectives of our research are to understand the evolution of deployment forces, to identify theparameters that control them, and to experimentally investigate the quantitative effects of these parameters.
This paper is organized as follows. In Section II, we review previous studies of solar sail packaging andalso our current understanding of the unfolding mechanics of creased thin membranes. Then, in Section IIIwe define the specific objectives and approach of the present research. Section IV describes our experimentaltechniques, and Section V presents its results. Section VI discusses these results and how they may beinterpreted.
(a) Single IKAROS petal unfolded. (b) IKAROS packaged.
Figure 1. The IKAROS solar sail had 4 triangular petals arranged in a 20m-diagonal square. The sail was packagedby wrapping around a much smaller 1.6m-diameter spacecraft.4
II. Background
Past contributions to the mechanics of solar sail deployment can be classified into two main groups: thosethat are motivated by qualifying solar sail hardware for a specific mission, and those that aim towards afundamental understanding of creased membrane mechanics.
In 2001, NASA sponsored ATK Space Systems5 and L’Garde6 to conduct structural testing of 20 msolar sails in vacuum. These tests considered similar solar sail designs: a square sail divided into four right-triangular quadrants deployed by four booms. The primary objective was the characterization of the globalstructural behavior of the deployed sailcraft, rather than studying the mechanics of deployment of the sailmembrane. Both ATK and L’Garde noted the difficulty of testing the deployment mechanics of gossamersails in a representative environment.
JAXA’s design of the 20 m solar sail IKAROS included a simulation and experimental campaign tocharacterize its centrifugal deployment process.7 Dynamic deployment experiments on small-scale modelswere carried out. For example, Furuya8 performed dynamic centrifugal deployments of 0.3 m- and 0.6 m-diameter models of creased membranes made from 12.5 µm-thick aluminized Kapton. In such dynamic tests,inertia plays a dominant role, obscuring structural effects.
DLR and ESA conducted ground tests of sail deployment to support their solar sail program. One oftheir demonstration experiments con sited in the deployment of a single triangular quadrant of a 5 m × 5 msquare sail, made from 7.5 µm-thick aluminized Kapton. The deployment forces were measured.9 Thesetests were done in air, without gravity offload, and at relatively high deployment rates (≈ 25mm/s).
NASA’s NanoSail-D2 was the first to demonstrate solar sail deployment from a nanosatellite. A 3.14 m ×3.14 m sail made from 2.5 µm-thick CP1 was deployed in LEO from a 3U CubeSat.10 The sail design was thefamiliar square sail divided into four right-triangular quadrants with four deployable booms. Each triangularquadrant was Z-folded and then rolled onto a central hub. Ground deployment tests were conducted on low-friction tables. Given the aggressive timeline of this mission, the details of the unfolding of these very thinmembranes were not considered.
2 of 14
American Institute of Aeronautics and Astronautics
The Planetary Society’s LightSail-1, currently under development, packages a larger sail (5.65 m ×5.65 m) in a 3U CubeSat.2 LightSail-1 also uses the four-quadrant, four-boom square sail architecture.However, LightSail-1’s quadrants are packaged differently than NanoSail-D2. Each quadrant is Z-foldedfrom the outside edge to the center, and then Z-folded again to packaged the sail. Similar to NanoSail-D,initial deployment tests were conducted on low-friction tables.
The primary objective of the studies described above was to qualify a solar sail system for flight. Un-derstanding the fundamental mechanics of solar sail deployment, or exploring the range of parameters thatmay influence these mechanics, were beyond the scope of these studies. The physics of creased membraneshave been variously investigated. Here, we highlight a few studies.
Murphey11 developed a constitutive law for randomly creased membranes. He conducted biaxial tensiontests to measure the stress-strain response of randomly creased 25 µm- and 50 µm-thick Kapton. However,solar sail packaging schemes will generally use a systematic arrangement of creases, which Murphey onlybriefly addresses. The modeling techniques presented therein may be useful in analyzing the behavior ofcreased membranes after they are almost completely deployed.
Papa and Pellegrino12 investigated the load-displacement response of the Miura-ori fold pattern con-structed using 25 µm-thick aluminized Kapton. Their simulations suggest that the creased membrane showsdrastic increases in stiffness over a range of the unfolding process. Their experiments, however, did notmeasure the deployment forces over the full range of the unfolding of the Miura-ori pattern.
Woo and Jenkins13 conducted experiments and simulations to establish an effective elastic modulus forsingly creased membranes. Their work was done with 25 µm thickness Kapton and looked at the effects ofstrength of the crease. The interaction of multiple creases, and the structural behavior of multiply creasedmembranes was not considered.
We note a gap in past work regarding the unfolding behavior of multiply creased thin-membrane structuresover a large range of motions, and the parameters that affect this behavior.
III. Objective and Approach
The broad objectives of our ongoing research are to understand the mechanics of the deployment ofcreased membrane structures, to identify the parameters that control these mechanics, and to experimentallyinvestigate the quantitative effects of the dominant parameters.
In the particular study presented herein, we investigated how membrane thickness and crease densityaffect the force needed to unfold creased membranes. We define crease density as the number of creasesdivided by the deployed area of the membrane. We adopted an experimental approach; we constructedsmall-scale models of creased membrane structures, deployed them quasi-statically, and measured the forcesrequired to do so over the entire deployment process. The reasons underlying this approach are outlinednext.
Ideally, we would like to conduct experiments that are exactly representative of solar sail deploymentsin space, and thus measure the actual deployment forces. Unfortunately, the confounding effects of air dragand gravity make it challenging to do so. To conduct representative experiments, the effects of air drag andgravity must be mitigated.
III.A. Reducing air drag
To reduce air drag, we can reduce the dynamic pressure either by reducing air density (e.g. by conductingexperiments in near-vacuum conditions), or by reducing the speed of deployment by conducting experimentsslowly. Currently, we favor the second approach of conducting slow, quasi-static experiments. Of course,if the designed deployment process is dynamic (e.g. the deployment of IKAROS), then a slow, quasi-staticexperiment will not yield the exact loads on the deployment system. However, quasi-static experiments allowus to decouple structural and mechanical effects from those of inertia, and study them in isolation. Since ourprimary interest is in the structural mechanics of the unfolding of creased membranes structures, we choseto perform quasi-static experiments.
III.B. Gravity offload
The second confounding effect is gravity. To reduce the effects of gravity, we can either accelerate the exper-iment downwards (e.g. use a drop tower or a parabolic flight), or we can provide mechanical gravity offload
3 of 14
American Institute of Aeronautics and Astronautics
forces. The first approach allows only experiments of short duration, which conflicts with our preference forslow, quasi-static deployment tests. The second approach is more suited to quasi-static experiments. Therehave been two traditional gravity offload approaches for solar sail deployment experiments: one, offload-ing only the weight of the deployable booms (e.g. the ATK5 and L’Garde6 experiments), and two, usinglow-friction tables to support the sail membrane during deployment (e.g. the LightSail2 and NanoSail-D210
ground deployment experiments). Neither of these two approaches is suitable for studying the structuralresponse of creased membranes. In the first case, the membrane is mechanically coupled to the booms,which dominate the structural response. In the second case, the frictional contact with the table introducesspurious loads in the membrane.
Our approach to mitigating the effects of gravity on the membrane is two-pronged: first, we provideindirect gravity offload forces by attaching the membrane to a central support structure, and offloading theweight of the support structure (we also offload the weight of the membrane at the locations where we applythe deployment forces); second, we perform experiments at such small scales that the membrane weight ison the order of one-tenth or smaller than the deployment forces.
III.C. Packaging scheme
In Section II, we outlined a variety of packaging schemes that have been used for solar sails. A commonarchitecture is a square sail, divided into four triangular quadrants. These quadrants can be Z-folded onceand then rolled, or Z-folded twice along orthogonal axes. Such an architecture generally relies on deployablebooms, but we wanted to explore options for solar sail deployment without booms.
IKAROS demonstrated sail deployment activated by centrifugal forces. The IKAROS sail was wrappedaround the central spacecraft, which drove us to consider wrappings. We found two published algorithms thatparametrically generate crease patterns to wrap finite-thickness membranes around polygonal hubs.14,15 Wechose Guest and Pellegrino’s algorithm for the sake of simplicity: for constant packaged radius and constantdeployed area, there is a single parameter that controls the number of creases in the crease pattern, and thusjust a single parameter that controls crease density.
IV. Methods
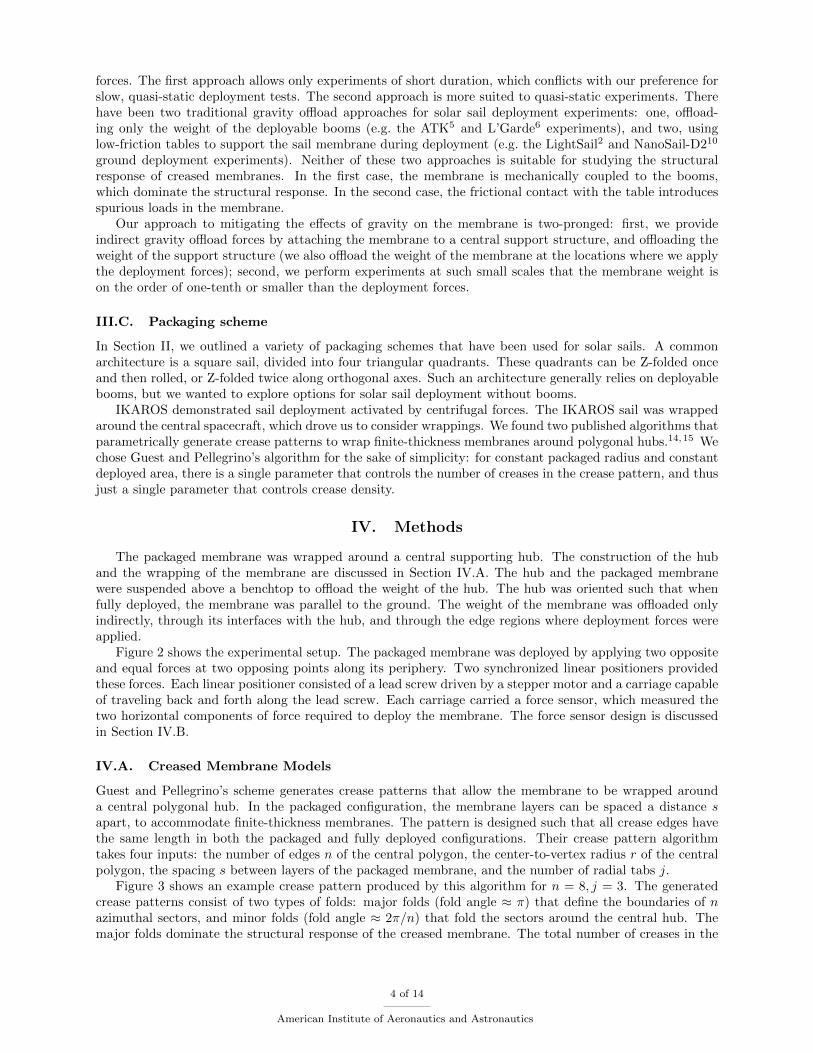
The packaged membrane was wrapped around a central supporting hub. The construction of the huband the wrapping of the membrane are discussed in Section IV.A. The hub and the packaged membranewere suspended above a benchtop to offload the weight of the hub. The hub was oriented such that whenfully deployed, the membrane was parallel to the ground. The weight of the membrane was offloaded onlyindirectly, through its interfaces with the hub, and through the edge regions where deployment forces wereapplied.
Figure 2 shows the experimental setup. The packaged membrane was deployed by applying two oppositeand equal forces at two opposing points along its periphery. Two synchronized linear positioners providedthese forces. Each linear positioner consisted of a lead screw driven by a stepper motor and a carriage capableof traveling back and forth along the lead screw. Each carriage carried a force sensor, which measured thetwo horizontal components of force required to deploy the membrane. The force sensor design is discussedin Section IV.B.
IV.A. Creased Membrane Models
Guest and Pellegrino’s scheme generates crease patterns that allow the membrane to be wrapped arounda central polygonal hub. In the packaged configuration, the membrane layers can be spaced a distance sapart, to accommodate finite-thickness membranes. The pattern is designed such that all crease edges havethe same length in both the packaged and fully deployed configurations. Their crease pattern algorithmtakes four inputs: the number of edges n of the central polygon, the center-to-vertex radius r of the centralpolygon, the spacing s between layers of the packaged membrane, and the number of radial tabs j.
Figure 3 shows an example crease pattern produced by this algorithm for n = 8, j = 3. The generatedcrease patterns consist of two types of folds: major folds (fold angle ≈ π) that define the boundaries of nazimuthal sectors, and minor folds (fold angle ≈ 2π/n) that fold the sectors around the central hub. Themajor folds dominate the structural response of the creased membrane. The total number of creases in the
4 of 14
American Institute of Aeronautics and Astronautics
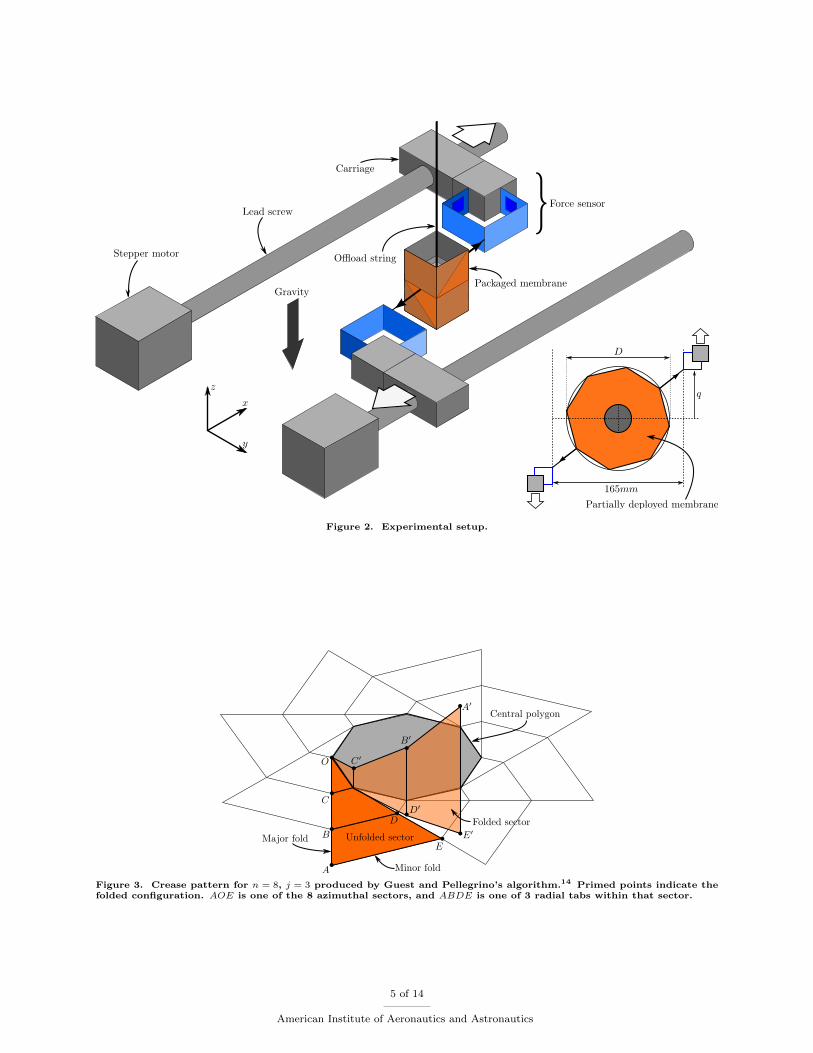
Figure 2. Experimental setup.
Figure 3. Crease pattern for n = 8, j = 3 produced by Guest and Pellegrino’s algorithm.14 Primed points indicate thefolded configuration. AOE is one of the 8 azimuthal sectors, and ABDE is one of 3 radial tabs within that sector.
5 of 14
American Institute of Aeronautics and Astronautics
generated pattern is N = n(2j − 1). The crease density is therefore N/Af , where Af = πD2f/4 is the final
deployed area.
Model h (µm) N n j Df (mm)
1 7.5 120 8 8 266
2 7.5 276 12 12 258
3 25 120 8 8 268
4 25 276 12 12 261Table 1. Creased membrane models. h is the membrane thickness, N is the total number of creases, and Df is the fullydeployed diameter.
For this study, we investigated four different creased membrane models. Since we are interested in theeffects of membrane thickness and the crease density, we varied the membrane thickness h, and the numberof edges n of the central hub (which controls the crease density N/Af ). We chose two values of h (h = 7.5 µmand h = 25 µm) and two values of n (n = 8 and n = 12). Table 1 shows the relevant parameters for thefour models. All models had r = 20 mm. The number of radial tabs j was chosen so that the diameter Df
of the fully deployed membrane was around 265 mm for each model. The layer spacing s was taken to betwice the membrane thickness h.
IV.A.1. Membrane scoring
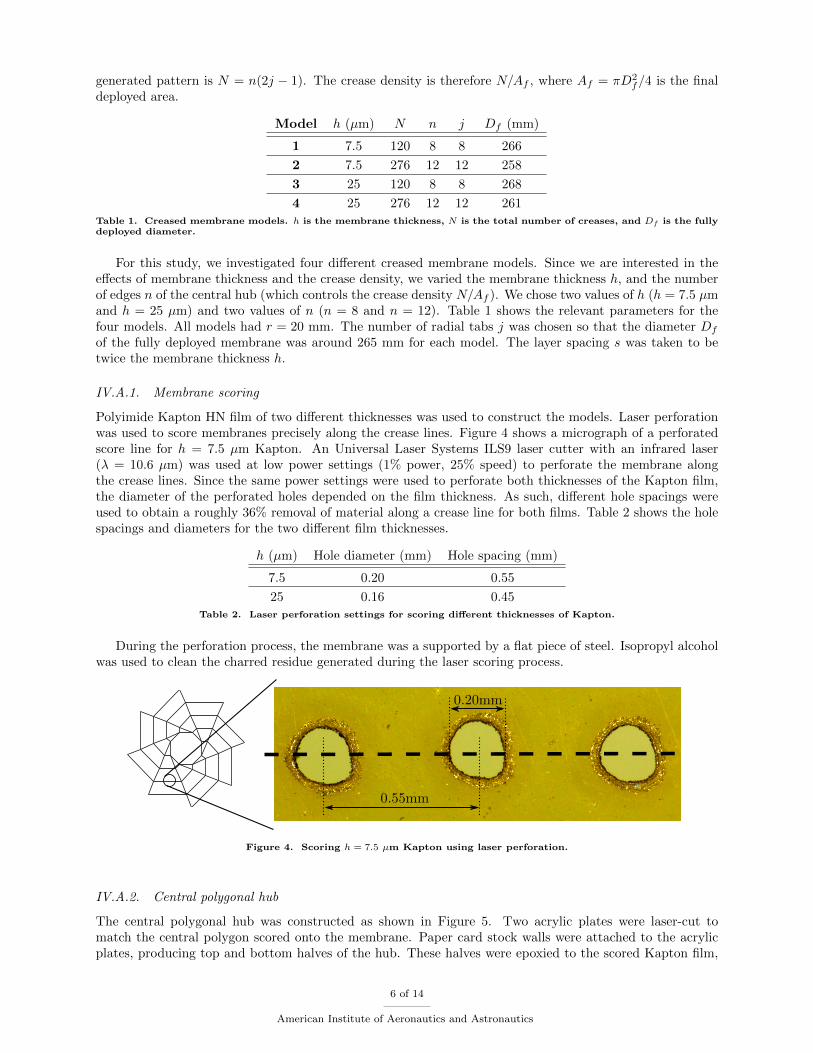
Polyimide Kapton HN film of two different thicknesses was used to construct the models. Laser perforationwas used to score membranes precisely along the crease lines. Figure 4 shows a micrograph of a perforatedscore line for h = 7.5 µm Kapton. An Universal Laser Systems ILS9 laser cutter with an infrared laser(λ = 10.6 µm) was used at low power settings (1% power, 25% speed) to perforate the membrane alongthe crease lines. Since the same power settings were used to perforate both thicknesses of the Kapton film,the diameter of the perforated holes depended on the film thickness. As such, different hole spacings wereused to obtain a roughly 36% removal of material along a crease line for both films. Table 2 shows the holespacings and diameters for the two different film thicknesses.
h (µm) Hole diameter (mm) Hole spacing (mm)
7.5 0.20 0.55
25 0.16 0.45Table 2. Laser perforation settings for scoring different thicknesses of Kapton.
During the perforation process, the membrane was a supported by a flat piece of steel. Isopropyl alcoholwas used to clean the charred residue generated during the laser scoring process.
Figure 4. Scoring h = 7.5 µm Kapton using laser perforation.
IV.A.2. Central polygonal hub
The central polygonal hub was constructed as shown in Figure 5. Two acrylic plates were laser-cut tomatch the central polygon scored onto the membrane. Paper card stock walls were attached to the acrylicplates, producing top and bottom halves of the hub. These halves were epoxied to the scored Kapton film,
6 of 14
American Institute of Aeronautics and Astronautics
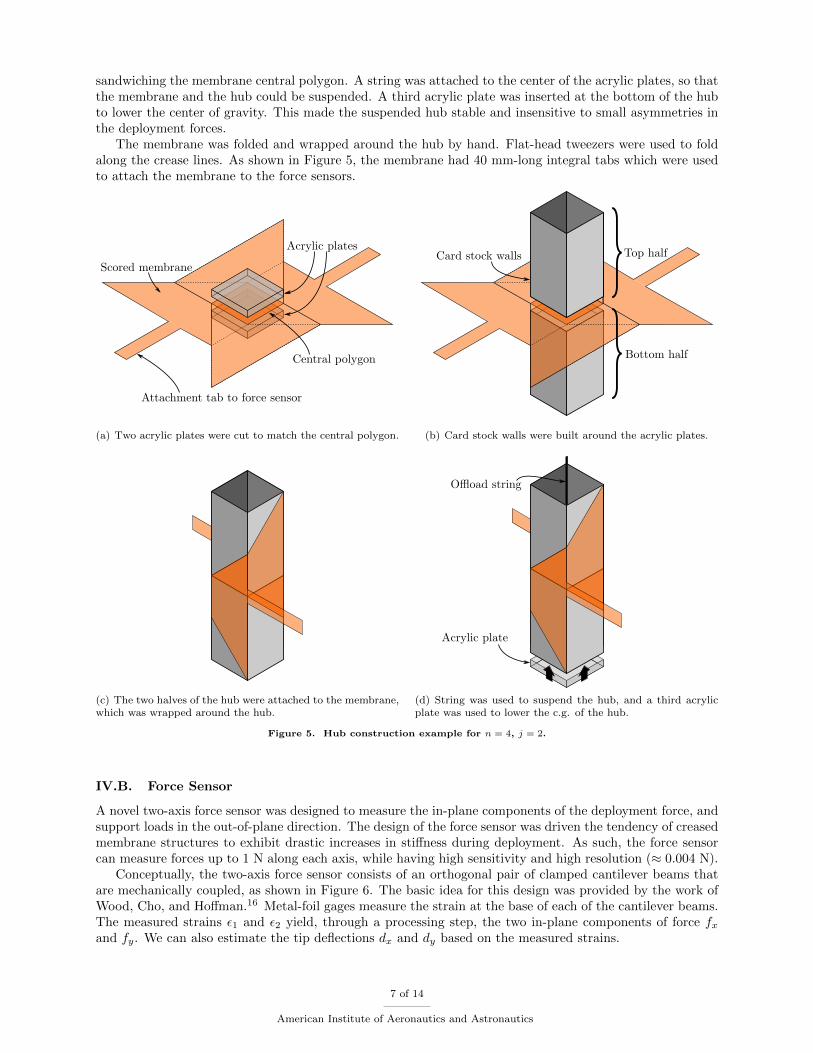
sandwiching the membrane central polygon. A string was attached to the center of the acrylic plates, so thatthe membrane and the hub could be suspended. A third acrylic plate was inserted at the bottom of the hubto lower the center of gravity. This made the suspended hub stable and insensitive to small asymmetries inthe deployment forces.
The membrane was folded and wrapped around the hub by hand. Flat-head tweezers were used to foldalong the crease lines. As shown in Figure 5, the membrane had 40 mm-long integral tabs which were usedto attach the membrane to the force sensors.
(a) Two acrylic plates were cut to match the central polygon. (b) Card stock walls were built around the acrylic plates.
(c) The two halves of the hub were attached to the membrane,which was wrapped around the hub.
(d) String was used to suspend the hub, and a third acrylicplate was used to lower the c.g. of the hub.
Figure 5. Hub construction example for n = 4, j = 2.
IV.B. Force Sensor
A novel two-axis force sensor was designed to measure the in-plane components of the deployment force, andsupport loads in the out-of-plane direction. The design of the force sensor was driven the tendency of creasedmembrane structures to exhibit drastic increases in stiffness during deployment. As such, the force sensorcan measure forces up to 1 N along each axis, while having high sensitivity and high resolution (≈ 0.004 N).
Conceptually, the two-axis force sensor consists of an orthogonal pair of clamped cantilever beams thatare mechanically coupled, as shown in Figure 6. The basic idea for this design was provided by the work ofWood, Cho, and Hoffman.16 Metal-foil gages measure the strain at the base of each of the cantilever beams.The measured strains ε1 and ε2 yield, through a processing step, the two in-plane components of force fxand fy. We can also estimate the tip deflections dx and dy based on the measured strains.
7 of 14
American Institute of Aeronautics and Astronautics
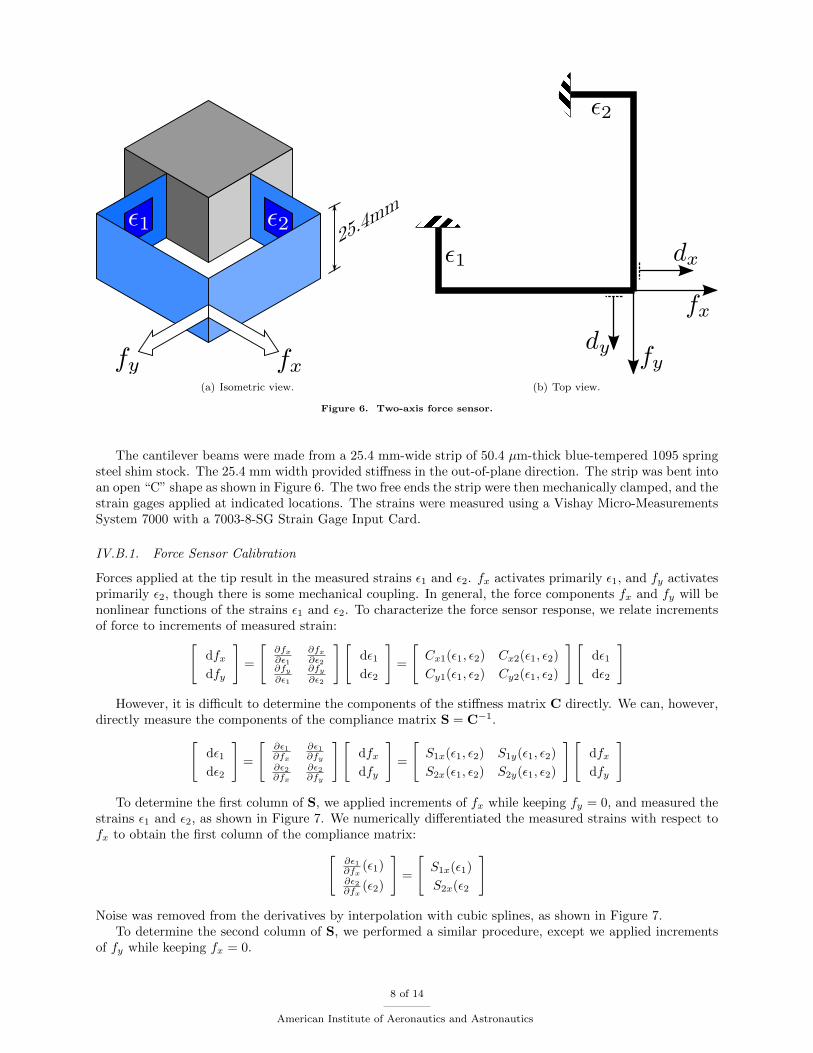
(a) Isometric view. (b) Top view.
Figure 6. Two-axis force sensor.
The cantilever beams were made from a 25.4 mm-wide strip of 50.4 µm-thick blue-tempered 1095 springsteel shim stock. The 25.4 mm width provided stiffness in the out-of-plane direction. The strip was bent intoan open “C” shape as shown in Figure 6. The two free ends the strip were then mechanically clamped, and thestrain gages applied at indicated locations. The strains were measured using a Vishay Micro-MeasurementsSystem 7000 with a 7003-8-SG Strain Gage Input Card.
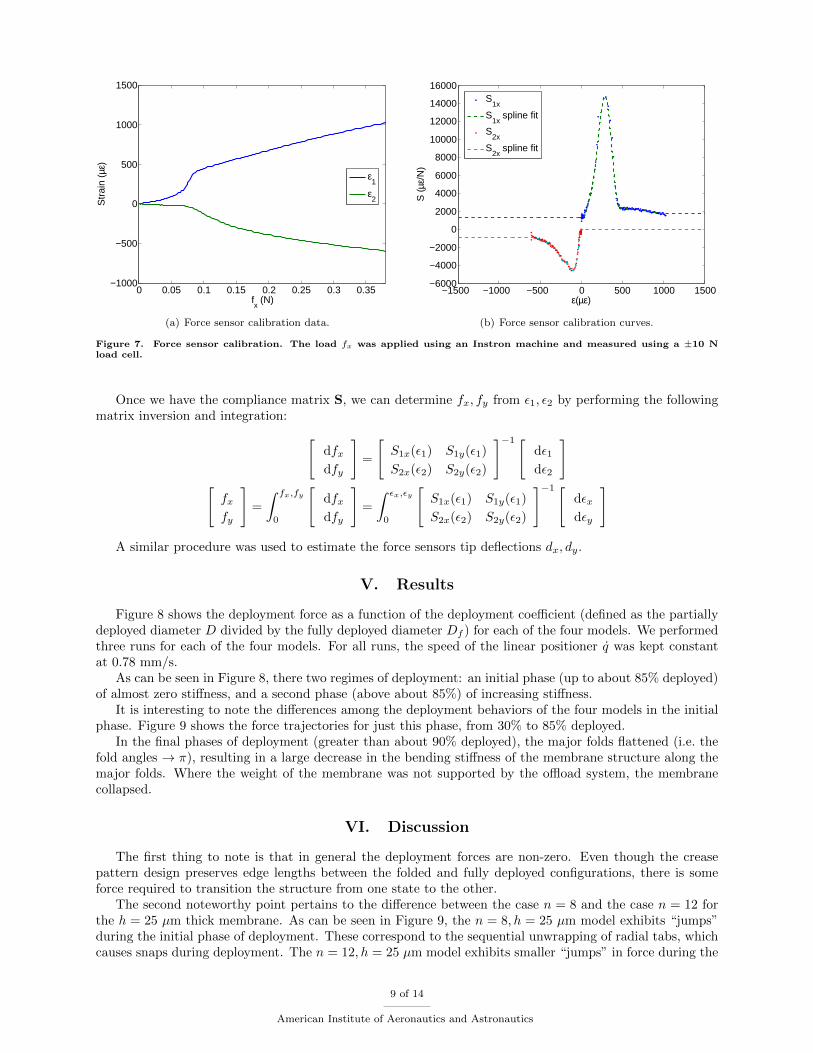
IV.B.1. Force Sensor Calibration
Forces applied at the tip result in the measured strains ε1 and ε2. fx activates primarily ε1, and fy activatesprimarily ε2, though there is some mechanical coupling. In general, the force components fx and fy will benonlinear functions of the strains ε1 and ε2. To characterize the force sensor response, we relate incrementsof force to increments of measured strain:[
dfx
dfy
]=
[∂fx∂ε1
∂fx∂ε2
∂fy∂ε1
∂fy∂ε2
][dε1
dε2
]=
[Cx1(ε1, ε2) Cx2(ε1, ε2)
Cy1(ε1, ε2) Cy2(ε1, ε2)
][dε1
dε2
]
However, it is difficult to determine the components of the stiffness matrix C directly. We can, however,directly measure the components of the compliance matrix S = C−1.[
dε1
dε2
]=
[∂ε1∂fx
∂ε1∂fy
∂ε2∂fx
∂ε2∂fy
][dfx
dfy
]=
[S1x(ε1, ε2) S1y(ε1, ε2)
S2x(ε1, ε2) S2y(ε1, ε2)
][dfx
dfy
]
To determine the first column of S, we applied increments of fx while keeping fy = 0, and measured thestrains ε1 and ε2, as shown in Figure 7. We numerically differentiated the measured strains with respect tofx to obtain the first column of the compliance matrix:[
∂ε1∂fx
(ε1)∂ε2∂fx
(ε2)
]=
[S1x(ε1)
S2x(ε2
]
Noise was removed from the derivatives by interpolation with cubic splines, as shown in Figure 7.To determine the second column of S, we performed a similar procedure, except we applied increments
of fy while keeping fx = 0.
8 of 14
American Institute of Aeronautics and Astronautics
0 0.05 0.1 0.15 0.2 0.25 0.3 0.35−1000
−500
0
500
1000
1500
fx (N)
Str
ain
(µε)
ε1
ε2
(a) Force sensor calibration data.
−1500 −1000 −500 0 500 1000 1500−6000
−4000
−2000
0
2000
4000
6000
8000
10000
12000
14000
16000
ε(µε)
S (
µε/N
)
S1x
S1x
spline fit
S2x
S2x
spline fit
(b) Force sensor calibration curves.
Figure 7. Force sensor calibration. The load fx was applied using an Instron machine and measured using a ±10 Nload cell.
Once we have the compliance matrix S, we can determine fx, fy from ε1, ε2 by performing the followingmatrix inversion and integration: [
dfx
dfy
]=
[S1x(ε1) S1y(ε1)
S2x(ε2) S2y(ε2)
]−1 [dε1
dε2
][fx
fy
]=
∫ fx,fy
0
[dfx
dfy
]=
∫ εx,εy
0
[S1x(ε1) S1y(ε1)
S2x(ε2) S2y(ε2)
]−1 [dεx
dεy
]
A similar procedure was used to estimate the force sensors tip deflections dx, dy.
V. Results
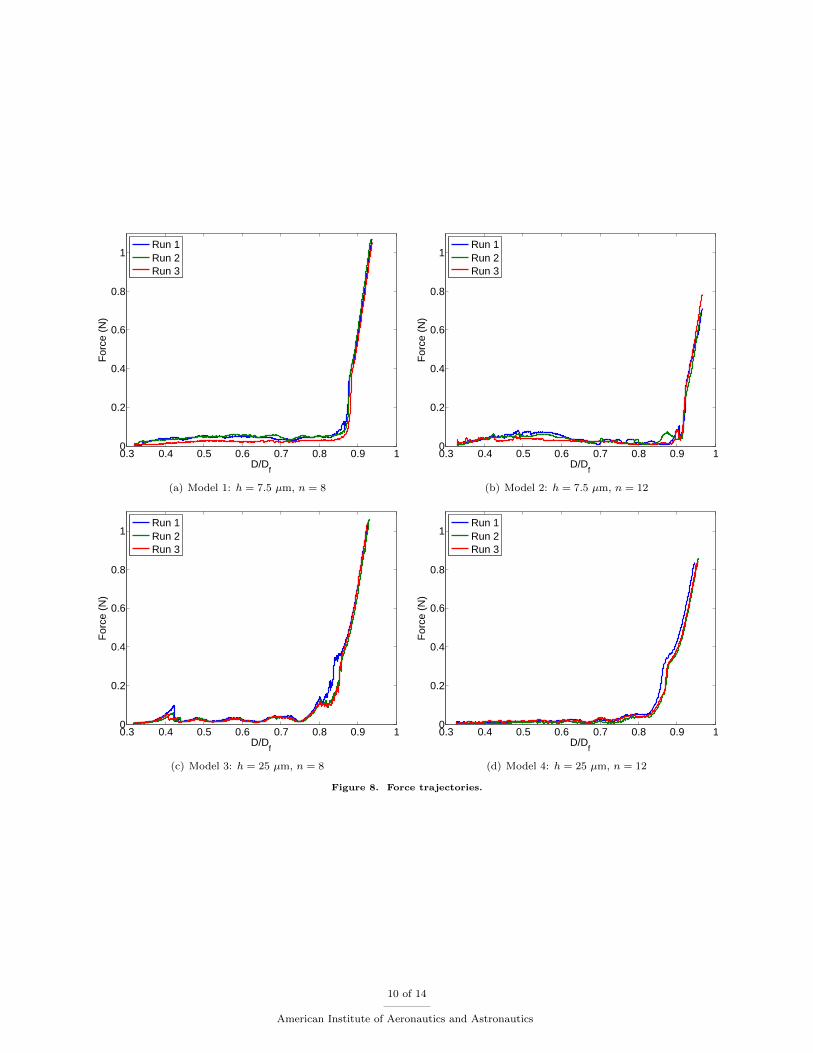
Figure 8 shows the deployment force as a function of the deployment coefficient (defined as the partiallydeployed diameter D divided by the fully deployed diameter Df ) for each of the four models. We performedthree runs for each of the four models. For all runs, the speed of the linear positioner q̇ was kept constantat 0.78 mm/s.
As can be seen in Figure 8, there two regimes of deployment: an initial phase (up to about 85% deployed)of almost zero stiffness, and a second phase (above about 85%) of increasing stiffness.
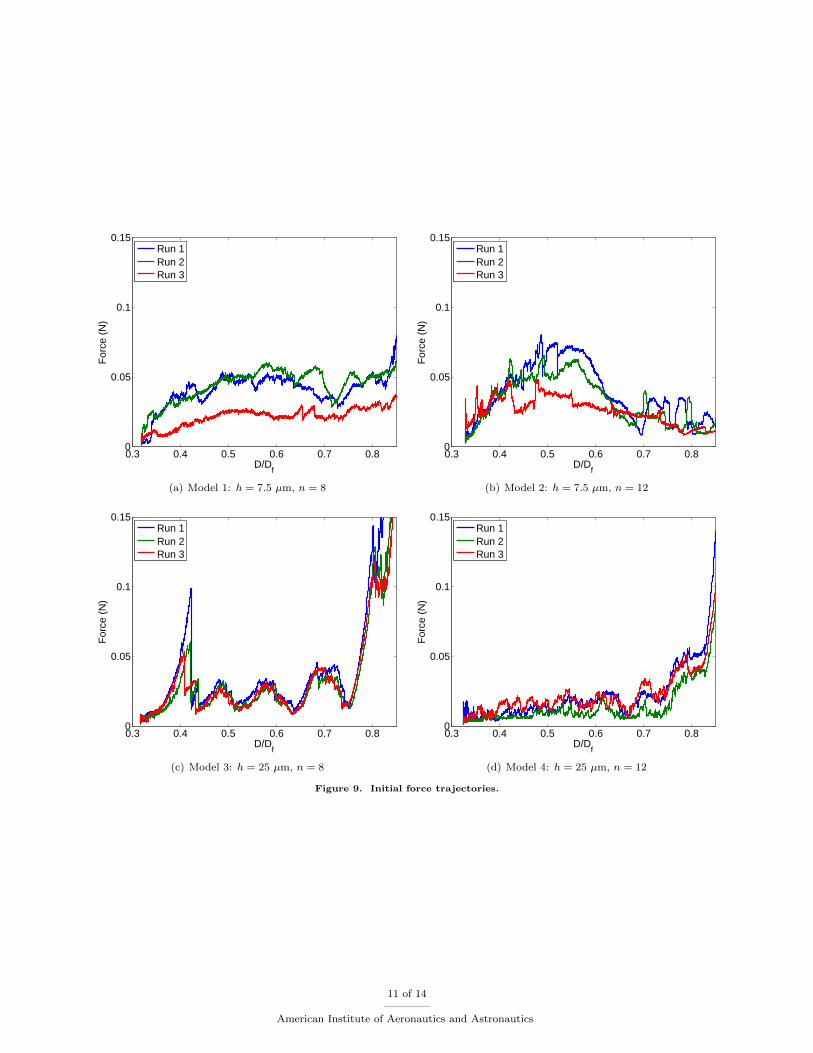
It is interesting to note the differences among the deployment behaviors of the four models in the initialphase. Figure 9 shows the force trajectories for just this phase, from 30% to 85% deployed.
In the final phases of deployment (greater than about 90% deployed), the major folds flattened (i.e. thefold angles → π), resulting in a large decrease in the bending stiffness of the membrane structure along themajor folds. Where the weight of the membrane was not supported by the offload system, the membranecollapsed.
VI. Discussion
The first thing to note is that in general the deployment forces are non-zero. Even though the creasepattern design preserves edge lengths between the folded and fully deployed configurations, there is someforce required to transition the structure from one state to the other.
The second noteworthy point pertains to the difference between the case n = 8 and the case n = 12 forthe h = 25 µm thick membrane. As can be seen in Figure 9, the n = 8, h = 25 µm model exhibits “jumps”during the initial phase of deployment. These correspond to the sequential unwrapping of radial tabs, whichcauses snaps during deployment. The n = 12, h = 25 µm model exhibits smaller “jumps” in force during the
9 of 14
American Institute of Aeronautics and Astronautics
0.3 0.4 0.5 0.6 0.7 0.8 0.9 10
0.2
0.4
0.6
0.8
1
D/Df
For
ce (
N)
Run 1Run 2Run 3
(a) Model 1: h = 7.5 µm, n = 8
0.3 0.4 0.5 0.6 0.7 0.8 0.9 10
0.2
0.4
0.6
0.8
1
D/Df
For
ce (
N)
Run 1Run 2Run 3
(b) Model 2: h = 7.5 µm, n = 12
0.3 0.4 0.5 0.6 0.7 0.8 0.9 10
0.2
0.4
0.6
0.8
1
D/Df
For
ce (
N)
Run 1Run 2Run 3
(c) Model 3: h = 25 µm, n = 8
0.3 0.4 0.5 0.6 0.7 0.8 0.9 10
0.2
0.4
0.6
0.8
1
D/Df
For
ce (
N)
Run 1Run 2Run 3
(d) Model 4: h = 25 µm, n = 12
Figure 8. Force trajectories.
10 of 14
American Institute of Aeronautics and Astronautics
0.3 0.4 0.5 0.6 0.7 0.80
0.05
0.1
0.15
D/Df
For
ce (
N)
Run 1Run 2Run 3
(a) Model 1: h = 7.5 µm, n = 8
0.3 0.4 0.5 0.6 0.7 0.80
0.05
0.1
0.15
D/Df
For
ce (
N)
Run 1Run 2Run 3
(b) Model 2: h = 7.5 µm, n = 12
0.3 0.4 0.5 0.6 0.7 0.80
0.05
0.1
0.15
D/Df
For
ce (
N)
Run 1Run 2Run 3
(c) Model 3: h = 25 µm, n = 8
0.3 0.4 0.5 0.6 0.7 0.80
0.05
0.1
0.15
D/Df
For
ce (
N)
Run 1Run 2Run 3
(d) Model 4: h = 25 µm, n = 12
Figure 9. Initial force trajectories.
11 of 14
American Institute of Aeronautics and Astronautics
initial phase of deployment, see Figure 9. This may be explained by the fact that smaller forces are requiredto unwrap smaller radial tabs, and the size of the tabs decreases with increasing n. One can imagine thatas n→∞, tab sizes → 0 and the sectors become lines that require no force to unwrap. The force traces ofthe thinner h = 7.5 µm membrane in Figure 9 show no sign of the regular “jumps” that are so clear in thedeployment of the h = 25 µm membranes. This is indicative of a transition from a plate-like behavior in thecase of h = 25 µm to a membrane-like behavior in the case of h = 7.5 µm.
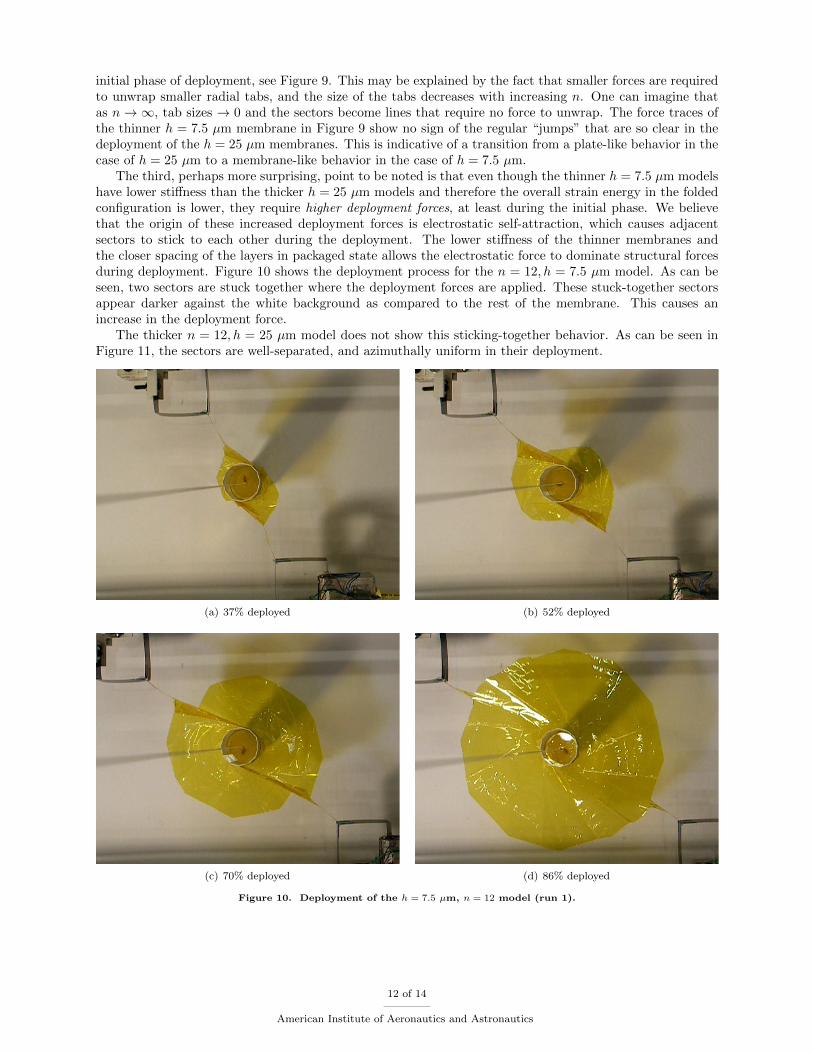
The third, perhaps more surprising, point to be noted is that even though the thinner h = 7.5 µm modelshave lower stiffness than the thicker h = 25 µm models and therefore the overall strain energy in the foldedconfiguration is lower, they require higher deployment forces, at least during the initial phase. We believethat the origin of these increased deployment forces is electrostatic self-attraction, which causes adjacentsectors to stick to each other during the deployment. The lower stiffness of the thinner membranes andthe closer spacing of the layers in packaged state allows the electrostatic force to dominate structural forcesduring deployment. Figure 10 shows the deployment process for the n = 12, h = 7.5 µm model. As can beseen, two sectors are stuck together where the deployment forces are applied. These stuck-together sectorsappear darker against the white background as compared to the rest of the membrane. This causes anincrease in the deployment force.
The thicker n = 12, h = 25 µm model does not show this sticking-together behavior. As can be seen inFigure 11, the sectors are well-separated, and azimuthally uniform in their deployment.
(a) 37% deployed (b) 52% deployed
(c) 70% deployed (d) 86% deployed
Figure 10. Deployment of the h = 7.5 µm, n = 12 model (run 1).
12 of 14
American Institute of Aeronautics and Astronautics
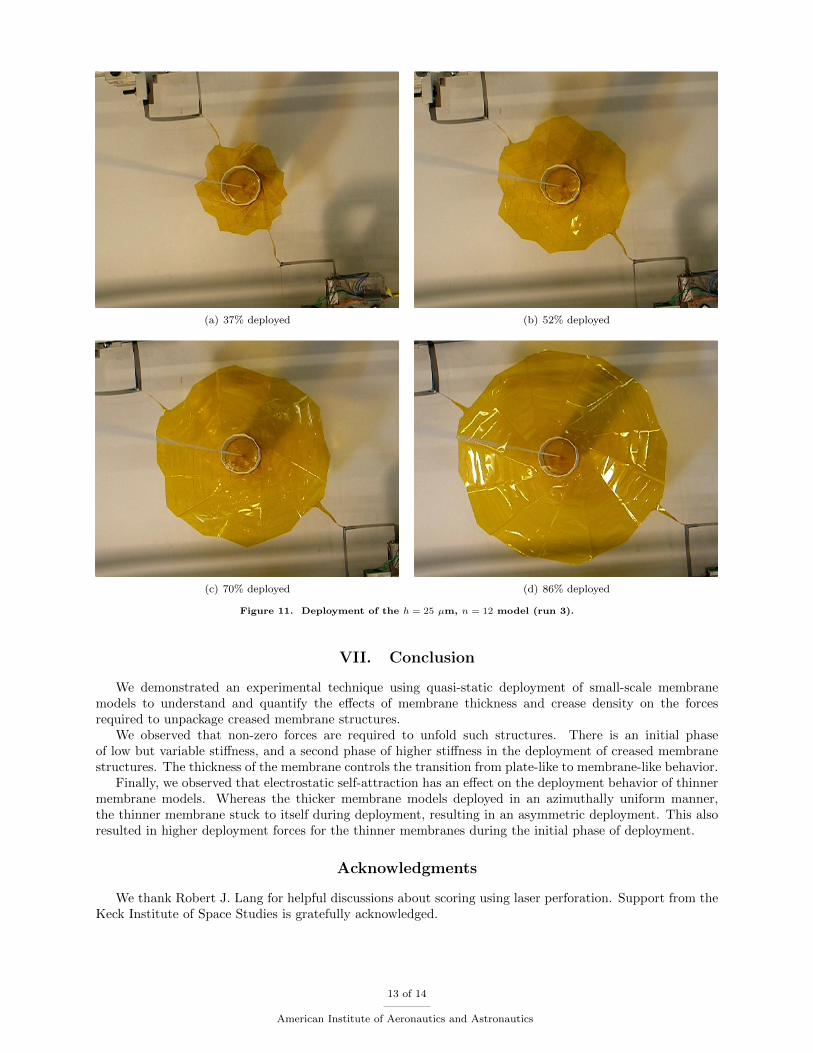
(a) 37% deployed (b) 52% deployed
(c) 70% deployed (d) 86% deployed
Figure 11. Deployment of the h = 25 µm, n = 12 model (run 3).
VII. Conclusion
We demonstrated an experimental technique using quasi-static deployment of small-scale membranemodels to understand and quantify the effects of membrane thickness and crease density on the forcesrequired to unpackage creased membrane structures.
We observed that non-zero forces are required to unfold such structures. There is an initial phaseof low but variable stiffness, and a second phase of higher stiffness in the deployment of creased membranestructures. The thickness of the membrane controls the transition from plate-like to membrane-like behavior.
Finally, we observed that electrostatic self-attraction has an effect on the deployment behavior of thinnermembrane models. Whereas the thicker membrane models deployed in an azimuthally uniform manner,the thinner membrane stuck to itself during deployment, resulting in an asymmetric deployment. This alsoresulted in higher deployment forces for the thinner membranes during the initial phase of deployment.
Acknowledgments
We thank Robert J. Lang for helpful discussions about scoring using laser perforation. Support from theKeck Institute of Space Studies is gratefully acknowledged.
13 of 14
American Institute of Aeronautics and Astronautics
References
1Klesh, A., Angelopoulos, V., Betts, B., Biddy, C., Caron, R., Cutler, J., and Desai, M., “SolWise: sailing on light withinterplanetary science and exploration,” 26th Annual AIAA/USU Conference on Small Satellites, 2012.
2Biddy, C., “LightSail-1 solar sail design and qualification,” 41st Aerospace Mechanism Symposium, 2012.3Lappas, V., Adeli, N., Visagie, L., Fernandez, J., Theodorou, T., Steyn, W., and Perren, M., “CubeSail: A low cost
CubeSat based solar sail demonstration mission,” Advances in Space Research, Vol. 48, No. 11, Dec. 2011, pp. 1890–1901.4Furuya, H., Mori, O., Okuizumi, N., Shirasawa, Y., Natori, M. C., Miyazaki, Y., and Matunaga, S., “Manufacturing
and folding of solar sail IKAROS,” 52nd AIAA/ASME/ASCE/AHS/ASC Structures, Structural Dynamics, and MaterialsConference, April 2011.
5Murphy, D. M., McEachen, M. E., Macy, B. D., and Gaspar, J. L., “Demonstration of a 20m solar sail system,” 46thAIAA/ASME/ASCE/AHS/ASC Structures, Structural Dynamics, and Materials Conference, April 2005.
6Mann, T. O., Behun, V., and Lichodziejewski, D., “Ground Testing A 20-Meter Inflation Deployed Solar Sail,” 47thAIAA/ASME/ASCE/AHS/ASC Structures, Structural Dynamics, and Materials Conference, 2006.
7Okuizumi, N., Mura, A., Matunaga, S., Sakamoto, H., Shirasawa, Y., and Mori, O., “Small-scale experiments and simu-lations of centrifugal membrane deployment of solar sail craft “IKAROS”,” 52nd AIAA/ASME/ASCE/AHS/ASC Structures,Structural Dynamics, and Materials Conference, April 2011.
8Furuya, H., Inoue, Y., and Masuoka, T., “Deployment characteristics of rotationally skew fold membrane for spinningsolar sail,” 46th AIAA/ASME/ASCE/AHS/ASC Structures, Structural Dynamics, and Materials Conference, April 2005.
9Geppert, U., Biering, B., Lura, F., Block, J., Straubel, M., and Reinhard, R., “The 3-step DLR-ESA Gossamer road tosolar sailing,” Advances in Space Research, Vol. 48, No. 11, Dec. 2011, pp. 1695–1701.
10Montgomery, E. E. and Adams, C. L., “NanoSail-D,” CubeSat Developer’s Workshop, 2008.11Murphey, T. W., “A nonlinear elastic constitutive model for wrinkled thin films”, Ph.D. thesis, 2000.12Papa, A. and Pellegrino, S., “Systematically Creased Thin-Film Membrane Structures,” Journal of Spacecraft and Rock-
ets, Vol. 45, No. 1, Jan. 2008, pp. 10–18.13Woo, K., Nandurkar, K., and Jenkins, C. H., “Effective Modulus of Creased Thin Membranes,” Journal of Spacecraft
and Rockets, Vol. 45, No. 1, Jan. 2008, pp. 19–26.14Guest, S. D. and Pellegrino, S., “Inextensional wrapping of flat membranes,” First International Seminar on Structural
Morphology, Sept. 1992, pp. 203–215.15Zirbel, S. A., Lang, R. J., Thomson, M. W., Sigel, D. A., Walkemeyer, P. E., Trease, B. P., Magleby, S. P., and
Howell, L. L., “Accomodating thickness in origami-based deployable arrays,” ASME 2013 International Design Engineeringand Technical Conferences and Computers and Information in Engineering Conference, 2013.
16Wood, R. J., Cho, K.-J., and Hoffman, K., “A novel multi-axis force sensor for microrobotics applications,” SmartMaterials and Structures, Vol. 18, No. 12, Dec. 2009, pp. 125002–125009.
14 of 14
American Institute of Aeronautics and Astronautics


![Women and Newspapers Compacted[1]](https://img.pdfslide.net/doc/110x75/577d35d91a28ab3a6b919491/women-and-newspapers-compacted1.jpg)